Embed Size (px)
Citation preview

A World Bank Group Flagship Report
Global Economic Prospects
JANUARY 2018
Broad-Based Upturn, but for How Long?

Broad-Based Upturn, but for How Long?
JANUARY 2018

EMBARGOED: NOT FOR PUBLICATION, BROADCAST, OR TRANSMISSION UNTIL TUESDAY, JANUARY 9, 2018 AT 4:00 PM EDT (9:00 PM GMT/UTC)
© 2018 International Bank for Reconstruction and Development / �e World Bank
1818 H Street NW, Washington, DC 20433
Telephone: 202-473-1000; Internet: www.worldbank.org
Some rights reserved
1 2 3 4 21 20 19 18
�is work is a product of the staff of �e World Bank with external contributions. �e findings, interpretations, and
conclusions expressed in this work do not necessarily reflect the views of �e World Bank, its Board of Executive Directors, or
the governments they represent. �e World Bank does not guarantee the accuracy of the data included in this work. �e
boundaries, colors, denominations, and other information shown on any map in this work do not imply any judgment on the
part of �e World Bank concerning the legal status of any territory or the endorsement or acceptance of such boundaries.
Nothing herein shall constitute or be considered to be a limitation upon or waiver of the privileges and immunities of �e
World Bank, all of which are specifically reserved.
Rights and Permissions
�is work is available under the Creative Commons Attribution 3.0 IGO license (CC BY 3.0 IGO) http://
creativecommons.org/licenses/by/3.0/igo. Under the Creative Commons Attribution license, you are free to copy, distribute,
transmit, and adapt this work, including for commercial purposes, under the following conditions:
Attribution—Please cite the work as follows: Global Economic Prospects, January 2018: Broad-Based Upturn, but for How Long? Advance edition. Washington, DC: World Bank. License: Creative Commons Attribution CC BY 3.0 IGO
Translations—If you create a translation of this work, please add the following disclaimer along with the attribution: %is translation was not created by %e World Bank and should not be considered an official World Bank translation. %e World Bank shall not be liable for any content or error in this translation.
Adaptations—If you create an adaptation of this work, please add the following disclaimer along with the attribution: %is is an adaptation of an original work by %e World Bank. Views and opinions expressed in the adaptation are the sole responsibility of the author or authors of the adaptation and are not endorsed by %e World Bank.
�ird-party content—�e World Bank does not necessarily own each component of the content contained within the work.
�e World Bank therefore does not warrant that the use of any third-party-owned individual component or part contained in
the work will not infringe on the rights of those third parties. �e risk of claims resulting from such infringement rests solely
with you. If you wish to re-use a component of the work, it is your responsibility to determine whether permission is needed for
that re-use and to obtain permission from the copyright owner. Examples of components can include, but are not limited to,
tables, figures, or images.
All queries on rights and licenses should be addressed to World Bank Publications, �e World Bank Group, 1818 H Street
NW, Washington, DC 20433, USA; e-mail: [email protected].
ISSN: 1014-8906
ISBN (paper): 978-1-4648-1163-0
ISBN (electronic): 978-1-4648-1245-3
DOI: 10.1596/978-1-4648-1163-0
Cover design: Bill Pragluski (Critical Stages).
�e cutoff date for the data used in this report was December 19, 2017.

REGIONAL OUTLOOKS
CHAPTER 2

Recent developments
Growth in Sub-Saharan Africa (SSA) is estimated to have rebounded to 2.4 percent in 2017, after slowing sharply to 1.3 percent in 2016, as commodity prices recovered, global financing conditions remained favorable, and slowing inflation lifted household demand (Figure 2.6.1). However, the recovery was slightly weaker than forecast in June, and was marked by still-negative per capita income growth, low investment, and a decline in productivity growth (Box 2.6.1).
In particular, the rebound in the region’s largest economies—Angola, Nigeria, and South Africa—was modest. A recovery in the oil sector, partly due to a decline in militants’ attacks on oil pipelines, helped bring Nigeria back to positive GDP growth. 4e performance of the agricultural sector was relatively solid. However, activity remained weak in the non-oil industrial sector, as inadequate power generation hurt the manufacturing and construction industries. Strong
growth in the agricultural sector, due to improved rainfalls, helped South Africa exit recession. 4e mining sector expanded at a solid pace and manufacturing activity rebounded. However, growth in the rest of the economy was subdued amid elevated policy uncertainty, which continued to weigh on business confidence. In Angola, a challenging operational environment limited investment in the oil sector. Prolonged low growth and high unemployment has weighed on social progress in all three countries, with per capita GDP falling and the poverty headcount rising in Nigeria and South Africa. In South Africa, the proportion of poor individuals in the total population rose across all poverty lines between 2011 and 2015. Using the upper bound poverty line (R1,138 per person per month), the proportion of poor individuals increased from 53.1 percent of the population in 2011 to 55.5 percent in 2015 (Statistics South Africa 2017).
Elsewhere in the region, activity was weak among oil producers in the Central African Economic and Monetary Community (CEMAC), as they continued to deal with the effects of the earlier oil price collapse (Special Focus 1). By contrast, growth rebounded in the metals-exporting
Note: The author of this section is Gerard Kambou. Research assistance was provided by Xinghao Gong.
A modest recovery is underway in Sub-Saharan Africa, supported by an improvement in commodity prices.
Although growth rebounded in Angola, Nigeria, and South Africa—the region’s largest economies—it
remained low. Metals exporters in the region experienced a moderate rebound, partly reflecting an uptick in
mining output amid rising metals prices. Growth was stable in non-resource-intensive countries, supported by
infrastructure investment. The region is projected to see a pickup in activity over the forecast horizon, on the
back of firming commodity prices and gradually strengthening domestic demand. However, given demographic
and investment trends, structural reforms would be needed to boost potential growth over the next decade.
Downside risks continue to predominate, including the possibilities that commodity prices will remain weak,
global financing conditions will tighten disorderly, and regional political uncertainty and security tensions will
intensify. On the upside, a stronger-than-expected pickup in global activity could further boost exports,
investment, and growth in the region.

CHAPTER 2 .6 GLOBAL ECONOMIC PROSPECTS | JANUARY 2018 138
countries—which consist mostly of agricultural exporters—was broadly stable, supported by infrastructure investment and crop production. Economies in the West African Economic and Monetary Union (WAEMU) and in East Africa expanded at a robust pace. However, activity slowed in some countries, due to lower cocoa prices (e.g., Côte d’Ivoire), drought (e.g., Kenya, Uganda), and weak execution of the capital expenditure budget (e.g., Tanzania).
Current account deficits and financing
Current account deficits narrowed, but remained elevated, with the median current account deficit estimated at 7 percent of GDP. Oil exporters saw a significant decline in their deficits, as imports remained subdued due to sluggish growth and their terms of trade improved. Deficits narrowed moderately among metal exporters but were still high in the non-resource-intensive countries, due to strong import growth.
Generally accommodative international capital market conditions helped finance these deficits. Sovereign bond issuance rebounded in 2017, and improved global sentiment toward emerging and frontier markets helped narrow sovereign bond spreads. Nigeria experienced a pickup in equity and portfolio flows after the central bank implemented measures to improve access to foreign exchange. However, although firmer commodity prices encouraged foreign investments in the hydrocarbon and mining sectors, foreign direct investment inflows to the region are expected to increase only moderately in 2017 (UNCTAD 2017). As a consequence, the level of foreign exchange reserves in the region continued to be low. 4e median level of reserves was equivalent to 3 months of imports in 2017, the same as in 2016, but below its peak of 3.9 months of imports in 2014, pointing to the need for countries across the region to rebuild external buffers.
Exchange rates and inflation
Currencies in the region stabilized in real effective terms. For oil exporters, exchange rate pressures eased due to higher oil prices, increased oil
FIGURE 2.6.1 SSA: Recent developments
Regional growth rebounded in 2017, reflecting a modest recovery in Ango-
la, Nigeria, and South Africa—the region’s largest economies. Regional
activity was also supported by an increase in commodity prices, a rebound
in oil production in Nigeria, and strong agricultural growth in South Africa.
The current account deficits narrowed in oil and metals exporters, but re-
mained elevated in the non-resource-intensive countries due to strong
import growth. Fiscal deficits narrowed slightly in 2017, reflecting large
expenditure cuts in some oil exporters. Government debt continued to rise
across the region.
B. Oil production A. Growth
D. Current account balance C. South Africa: Agriculture growth
Sources: Haver Analytics, International Energy Agency, Statistics South Africa, World Bank, World
Economic Outlook.
A. GDP-weighted averages.
B. Last observation is November 2017. “mb/d” stands for million barrels per day.
C. Last observation is 2017Q3.
D. -F. Median of country groups. Data for 2017 are estimates, data for 2018 are forecasts.
Non-resource-intensive countries include agricultural exporters and commodity importers.
F. Public debt E. Fiscal balance
economies, as mining output and investment responded to a rise in metals prices and agricultural sectors recovered. Nonetheless, their rebound was weaker than expected, owing to the effects of a poor business environment in the non-metals sector. Growth in non-resource-intensive
SUB-SAHARAN AFRICA GLOBAL ECONOMIC PROSPECTS | JANUARY 2018 139
production, and a weaker dollar. 4e spread between the parallel and official rates narrowed in Nigeria, but import restrictions and multiple exchange rates remained. In May 2017, the Central Bank of Nigeria introduced a new investor and exporter window in an attempt to improve access to foreign exchange.
Headline inflation declined across the region, reflecting the confluence of stable exchange rates and slowing food price inflation. Notably, in South Africa, headline and core inflation moved closer to the middle of the central bank’s target range. Easing price pressures created space for several central banks in the region to cut interest rates. However, inflation remained elevated in some countries (e.g., Angola, Nigeria). In the case of Nigeria, this reflected the effects of poor harvests in some parts of the country on food prices. A continued moderation of food price inflation and exchange rate stability are expected to push headline inflation down further, which could provide room for further easing of monetary policy in the region.
Fiscal balance and government debt
Fiscal deficits narrowed slightly. Large spending cuts reduced the overall deficit in CEMAC countries. However, in some oil exporters (e.g., Angola, Nigeria), fiscal policy was loosened in response to higher oil revenues. Fiscal deficits declined in non-resource-intensive countries, but remained at high levels, partly reflecting infrastructure investment. Deficits also narrowed moderately in metals exporters as they continued to struggle to mobilize domestic revenue. In South Africa, national government revenue increased at a slower-than-expected pace, as real economic activity remained weak, making it difficult to attain the budget’s deficit target.
Government debt indicators continued to deteriorate in the region in 2017, with the median debt-to-GDP ratio rising to 53 percent from 48 percent in 2016. Government debt rose further in South Africa, owing to fiscal slippages. Concerns about the debt outlook prompted Standard & Poor’s to downgrade South Africa’s local currency debt to sub-investment grade, bringing it in line
with its foreign currency rating. Elsewhere, Mozambique defaulted on portions of its debt. 4e government debt ratio edged up in non-resource-intensive countries as they continued to borrow (e.g., Burundi, Ethiopia), including on international capital markets (e.g., Côte d’Ivoire, Senegal), to finance public investment. Measures to curtail public spending helped slow the increase in the debt-to-GDP ratio in oil exporters in CEMAC, but government debt in Equatorial Guinea is expected to rise sharply in 2017, due to a build-up in domestic arrears. In the Republic of Congo, the discovery of previously undisclosed debt could push total government debt to 117 percent of GDP, from 115 percent in 2016.
Fiscal sustainability gaps in the region remain sizable, which are contributing to growing debt- to-GDP ratios (World Bank 2017e). On average, fiscal sustainability gaps widened between 2007 and 2016 by 4 percentage points, reflecting both rising debt levels and widening fiscal deficits. 4e erosion of fiscal sustainability was widespread. 4e share of countries with sizable deterioration in sustainability gaps (i.e., worsened by 1 percentage of GDP or more) over 2007-16 was 80 percent. Weakening government debt dynamics in the region was also accompanied by a rapid increase in private sector debt. In 2016, private credit by domestic banks averaged 29 percent of GDP. 4e rapid increase in private sector debt across the region suggests the possibility of growing contingent liabilities for the public sector.
Outlook
Regional growth is projected to rise to 3.2 percent in 2018, and to an average of 3.6 percent in 2019-20 (Figure 2.6.2). 4ese forecasts are broadly unchanged from June, and assume that commodity prices will firm and domestic demand will gradually strengthen, helped by slowing inflation. However, despite the pickup, growth will remain below the rates seen prior to the global financial crisis, partly reflecting the struggle faced by the region’s larger economies to boost private investment. Moreover, while per capita growth is expected to turn positive after falling in 2016 and 2017, this would be at a rate that would remain insufficient to reduce poverty.

CHAPTER 2 .6 GLOBAL ECONOMIC PROSPECTS | JANUARY 2018 140
Growth in Nigeria is projected to pick up from 1 percent in 2017 to 2.5 percent in 2018 and 2.8 percent in 2019-20. 4e forecasts for 2018 and 2019 were revised up, reflecting the expectations that oil production will continue to recover and reforms in the foreign exchange market, along with improved supply of electricity, will help lift growth in the non-oil sector. In South Africa, growth in 2017 was upgraded from 0.6 percent to 0.8 percent, as activity strengthened more than expected in the second half of the year. Growth is projected to pick up to 1.1 percent in 2018 and 1.7 percent in 2019-20. However, policy uncertainty is likely to remain and could weigh on investment. Growth in Angola is projected to rise from 1.2 percent in 2017 to 1.6 percent in 2018,
as a successful political transition signals the possibility of reforms that can ameliorate the investment climate.
Outside the three largest economies, among oil exporters, growth is forecast to strengthen in Ghana, as increased oil and gas production lifts exports. Growth in CEMAC is expected to remain subdued but improve gradually, as countries continue to adjust to low oil prices. 4e ongoing recovery in metals exporters is projected to continue. Steadily rising metals prices are expected to encourage further investment in the mining sector. In some metals exporters, a combination of slowing inflation and monetary policy easing is expected to support a pickup in household demand. In others, improved weather conditions will also enhance power generation, supporting greater private sector activity.
Non-resource-intensive countries are projected to expand at a solid pace, helped by robust public investment growth. Economic activity is expected to remain solid in WAEMU, with Côte d’Ivoire and Senegal expanding at a rapid pace. Among East African countries, Ethiopia is likely to remain the fastest growing economy, but growth is expected to soften as it takes measures to stabilize government debt. Growth is expected to recover in Kenya, as inflation eases, and to firm in Tanzania on strengthening investment growth.
Potential growth increased in SSA following the global financial crisis, above its long-term and pre-crisis average rates. By contrast, potential growth in other emerging market and developing economies (EMDE) regions slowed sharply (Chapter 3). 4e increase in SSA’s potential growth reflected the effects of significantly higher public investment and rising labor inputs (Cho and Tien 2014), which offset the headwinds from the commodity price collapse, a slow recovery in the Euro Area following the euro crisis, and a slowdown in economic activity in China as it began rebalancing its economy toward domestic consumption. However, in the absence of reforms, potential growth could slow in the coming decade, owing to a slowdown in the growth of capital stock and labor supply.
FIGURE 2.6.2 SSA: Outlook and risks
The region is projected to see a pickup in growth as commodity prices
firm, but growth—including in per capita terms—would remain well below
its long-term average. Angola, Nigeria, and South Africa will continue to
struggle to boost growth, while the performance of the rest of the region
will be more favorable. Downside risks to the outlook include the possibility
that borrowing costs will begin to rise on the back of a deterioration in
global sentiment amid weak commodity prices, and adverse weather
conditions.
B. Per capita GDP growth A. Growth
D. Number of SSA countries affected
by drought
C. Fiscal balance and government
debt
Sources: Emergency Events Database (www.emdat.be, Brussels, Belgium), Université catholique de
Louvain, IMF Regional Economic Outlook for Sub-Saharan Africa, World Bank.
A. B. Shaded areas represent forecasts.
C. Blue data points represent 2015 values; red data points represent 2018 World Bank forecasts.
D. Chart shows number of SSA countries experiencing at least one drought in any given year.

SUB-SAHARAN AFRICA GLOBAL ECONOMIC PROSPECTS | JANUARY 2018 141
Risks
Risks to the regional outlook are, on balance, tilted to the downside. On the upside, stronger-than-expected activity in the United States and Euro Area could push regional growth above the baseline through higher exports, and increased investment flows in mining and infrastructure. On the downside, an abrupt slowdown in China could generate adverse spillovers to the region through lower-than-projected commodity prices, which would exacerbate economic imbalances and complicate adjustment needs in many commodity exporters. Oil producers in CEMAC and metals exporters are particularly vulnerable to this risk.
On the domestic front, excessive external borrowing, in the absence of sound forward-looking budget management, could worsen debt dynamics and cause economic instability. Reforms to contain fiscal deficits and rebuild buffers are particularly needed in CEMAC as well as in the non-resource-intensive countries where government debt is high and rising. A quicker and sharper-than-expected tightening of global financing conditions—triggered, for example, by a reassessment in financial markets of the pace of monetary policy normalization in the United States or other major economies—could lead to a reversal in capital flows to the region. South Africa would be particularly vulnerable to adverse swings in investor sentiment because of its great
dependence on portfolio inflows. Moreover, with the increase in sovereign bond issuance in recent years, a sharp increase in global interest rates could also complicate debt dynamics in the region. In the long run, a sharper-than-expected slowdown in potential growth could damage prospects for gains in per capita incomes and poverty reduction.
Other downside risks include a protracted period of heightened political and policy uncertainty, which could further hurt confidence and deter investment. 4is risk is elevated in South Africa, where the ruling African National Congress’s leadership election could lead to deep divisions within the party, and in Zimbabwe, where a political transition is unfolding. Droughts, conflicts, and worsening security conditions would weigh heavily on economic activity in the region, especially in fragile countries. 4is risk is particularly elevated in West and Central Africa, where militant insurgencies remain a threat.
4e risks to the regional outlook underscore the need for policy actions to achieve inclusive growth (Chapter 1). 4e rising government debt levels highlight the importance of fiscal adjustment to contain fiscal deficits and maintain financial stability. Structural policies—such as improvements in education and health systems, as well as labor market, governance, and business climate reforms—could help bolster potential growth across the region.

CHAPTER 2 .6 GLOBAL ECONOMIC PROSPECTS | JANUARY 2018 142
2015 2016 2017e 2018f 2019f 2020f 2017e 2018f 2019f
EMDE SSA, GDP1 3.1 1.3 2.4 3.2 3.5 3.6 -0.2 0.0 0.0
(Average including countries with full national accounts and balance of payments data only)2
EMDE SSA, GDP2 3.1 1.3 2.4 3.2 3.5 3.5 -0.2 0.0 0.0
GDP per capita (U.S. dollars) 0.4 -1.4 -0.3 0.5 0.8 0.9 -0.2 -0.1 -0.1
PPP GDP 3.3 1.6 2.7 3.5 3.7 3.8 -0.1 0.0 0.0
Private consumption 5.5 1.4 2.1 2.6 2.7 2.8 -0.1 0.0 -0.1
Public consumption -3.1 2.8 2.3 2.5 2.7 2.7 -0.2 -0.2 -0.1
Fixed investment 1.3 1.6 5.2 6.8 7.1 7.2 0.1 -0.2 -0.1
Exports, GNFS3 2.3 0.4 2.5 3.2 3.4 3.5 -0.2 0.2 0.1
Imports, GNFS3 0.7 0.0 2.3 2.9 3.1 3.2 -0.6 -0.6 -0.6
Net exports, contribution
to growth
0.5 0.1 0.1 0.1 0.1 0.1 0.2 0.3 0.2
Memo items: GDP
SSA excluding Angola, Nigeria,
and South Africa
4.6 4.1 4.5 5.0 5.1 5.2 -0.3 -0.2 -0.1
Oil exporters4 2.8 -0.4 1.5 2.8 2.8 3.0 -0.2 0.2 0.1
CFA countries5 3.8 2.8 3.2 4.3 4.6 4.9 -0.4 0.2 0.3
CEMAC 1.5 -1.0 -0.4 1.9 2.4 3.0 -1.2 0.2 0.3
WAEMU 6.2 6.6 6.5 6.4 6.4 6.5 0.3 0.2 0.3
SSA3 2.1 -0.6 0.9 1.8 2.2 2.2 0.0 0.1 0.0
Angola 3.0 0.0 1.2 1.6 1.5 1.5 0.0 0.7 0.0
Nigeria 2.7 -1.6 1.0 2.5 2.8 2.8 -0.2 0.1 0.3
South Africa 1.3 0.3 0.8 1.1 1.7 1.7 0.2 0.0 -0.3
TABLE 2.6.1 Sub-Saharan Africa forecast summary
(Real GDP growth at market prices in percent, unless indicated otherwise)
Source: World Bank.
Notes: e = estimate; f = forecast. EMDE = emerging market and developing economy. World Bank forecasts are frequently updated based on new information and changing (global)
circumstances. Consequently, projections presented here may differ from those contained in other Bank documents, even if basic assessments of countries’ prospects do not differ at any
given moment in time.
1. GDP at market prices and expenditure components are measured in constant 2010 U.S. dollars. Excludes Central African Republic, São Tomé and Príncipe, Somalia, and South Sudan.
2. Sub-region aggregate excludes Central African Republic, São Tomé and Príncipe, Somalia, and South Sudan, for which data limitations prevent the forecasting of GDP components.
3. Exports and imports of goods and non-factor services (GNFS).
4. Includes Angola; Cameroon; Chad; Congo, Democratic Republic; Congo, Republic; Gabon; Ghana; Nigeria; and South Sudan.
5. Includes Benin; Burkina Faso; Cameroon; Central African Republic; Chad; Congo, Republic; Côte d’Ivoire; Equatorial Guinea; Gabon; Mali; Niger; Senegal; and Togo.
For additional information, please see www.worldbank.org/gep.
Percentage point differences
from June 2017 projections
SUB-SAHARAN AFRICA GLOBAL ECONOMIC PROSPECTS | JANUARY 2018 143
2015 2016 2017e 2018f 2019f 2020f 2017e 2018f 2019f
Angola 3.0 0.0 1.2 1.6 1.5 1.5 0.0 0.7 0.0
Benin 2.1 4.0 5.4 6.0 6.3 6.7 -0.1 0.0 0.0
Botswana2
-1.7 4.3 4.5 4.7 4.8 4.8 0.5 0.5 0.5
Burkina Faso 4.0 5.9 6.4 6.0 6.0 6.0 0.3 -0.3 -0.3
Burundi -3.9 -0.6 0.5 1.5 2.5 2.5 -1.0 -0.5 -0.1
Cabo Verde 0.9 3.8 3.5 3.6 3.8 3.8 0.2 -0.1 0.1
Cameroon 5.8 4.5 3.7 4.1 4.3 4.3 -0.2 -0.3 -0.3
Chad 1.8 -6.4 -2.7 3.7 2.9 6.8 -2.9 0.5 -0.2
Comoros 1.0 2.2 2.5 2.7 2.9 2.9 -0.8 -1.3 -1.1
Congo, Dem. Rep. 6.9 2.4 2.6 3.0 3.3 3.3 -2.1 -1.9 -1.6
Congo, Rep. 2.6 -2.8 -1.1 2.3 1.5 1.5 -2.1 0.8 0.0
Côte d’Ivoire 8.9 8.3 7.6 7.2 7.2 7.2 0.8 0.7 0.9
Equatorial Guinea -9.1 -9.0 -8.5 -6.0 -4.2 -4.2 -2.6 1.0 1.8
Ethiopia2 9.6 7.5 8.5 8.2 7.8 7.8 0.2 0.2 -0.1
Gabon 4.0 2.1 1.1 2.4 3.7 3.7 -0.2 0.0 0.8
Gambia, The 4.1 2.2 3.0 3.5 4.2 4.2 0.5 -0.3 0.2
Ghana 3.8 3.7 6.1 8.3 5.5 5.5 0.0 0.5 -0.7
Guinea 3.5 6.6 6.7 5.8 5.9 5.9 2.3 1.2 1.3
Guinea-Bissau 6.1 5.8 5.5 5.2 5.4 5.4 0.4 0.1 0.3
Kenya 5.7 5.8 4.9 5.5 5.9 5.9 -0.6 -0.3 -0.2
Lesotho 5.6 2.3 4.0 4.0 4.2 4.2 1.0 0.6 0.6
Liberia 0.0 -1.6 2.5 3.9 5.0 6.0 -0.5 -1.4 -0.7
Madagascar 3.1 4.2 4.1 5.1 5.6 5.4 0.6 -1.3 0.9
Malawi 2.8 2.5 4.5 5.0 5.4 5.4 0.1 0.1 0.1
Mali 5.7 5.8 5.3 5.0 4.7 4.7 0.0 -0.2 -0.4
Mauritania 1.4 2.0 3.5 3.0 4.6 4.6 0.0 0.3 0.0
Mauritius 3.5 3.7 3.9 3.8 3.7 3.7 0.5 0.3 0.4
Mozambique 6.6 3.8 3.1 3.2 3.4 3.4 -1.7 -2.9 -3.3
Namibia 6.0 1.1 1.7 3.0 3.5 3.5 -1.3 -1.0 -0.7
Niger 4.0 5.0 5.2 5.2 5.4 5.6 0.0 -0.3 -0.1
Nigeria 2.7 -1.6 1.0 2.5 2.8 2.8 -0.2 0.1 0.3
Rwanda 8.9 5.9 5.2 5.9 6.8 6.8 -0.8 -0.9 -0.2
Senegal 6.5 6.7 6.8 6.9 7.0 7.0 0.1 0.0 0.0
Seychelles 3.5 4.4 4.2 3.8 3.5 3.5 0.0 0.0 0.0
Sierra Leone -20.6 6.3 5.6 6.3 6.7 6.7 0.2 0.7 0.8
South Africa 1.3 0.3 0.8 1.1 1.7 1.7 0.2 0.0 -0.3
Sudan 4.9 4.7 4.1 3.7 3.7 3.7 0.0 -0.2 -0.2
Swaziland 1.5 1.3 0.9 1.9 1.8 1.8 -0.8 -1.2 -1.4
Tanzania 7.0 7.0 6.6 6.8 6.9 6.9 -0.6 -0.4 -0.5
Togo 5.3 5.0 5.0 5.3 5.4 5.4 0.4 -0.2 -0.1
Uganda2 5.2 4.7 4.0 5.1 5.7 6.0 -0.6 -0.1 0.1
Zambia 2.9 3.0 4.2 4.5 5.0 5.0 0.1 0.0 0.3
Zimbabwe 1.4 0.7 2.8 0.9 0.2 0.2 0.5 -0.9 -1.5
Source: World Bank.
Notes: e = estimate; f = forecast. World Bank forecasts are frequently updated based on new information and changing (global) circumstances. Consequently, projections presented here
may differ from those contained in other Bank documents, even if basic assessments of countries’ prospects do not differ at any given moment in time.
1. GDP at market prices and expenditure components are measured in constant 2010 U.S. dollars. Excludes Central African Republic, São Tomé and Príncipe, Somalia, and South Sudan.
2. Fiscal-year-based numbers.
For additional information, please see www.worldbank.org/gep.
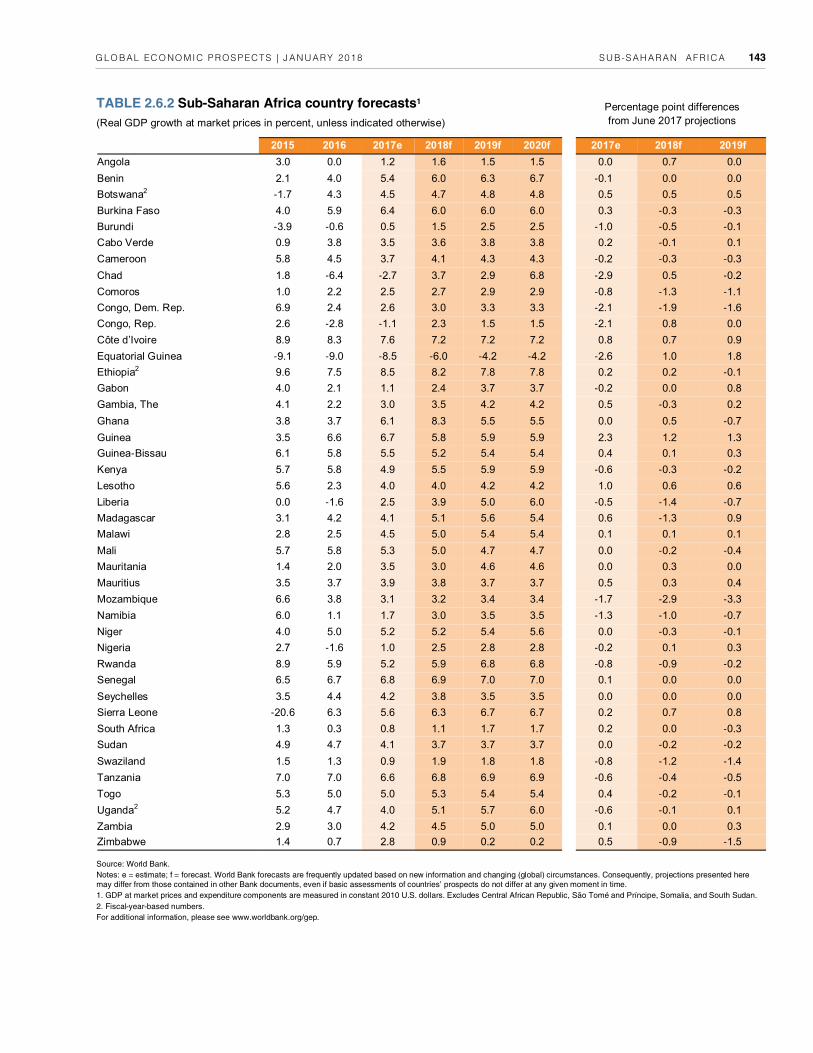
TABLE 2.6.2 Sub-Saharan Africa country forecasts1
(Real GDP growth at market prices in percent, unless indicated otherwise)
Percentage point differences
from June 2017 projections

CHAPTER 2 .6 GLOBAL ECONOMIC PROSPECTS | JANUARY 2018 144
BOX 2.6.1 Potential growth in Sub-Saharan Africa
Sub-Saharan Africa’s potential growth rose following the global financial crisis, above its long-term and pre-crisis averages, due to
increases in the working-age population and capital stock accumulation. Notwithstanding these recent gains, potential growth
could slow in the next decade, as labor force growth stagnates and capital accumulation moderates, which would weigh on per
capita incomes and diminish the prospects for poverty reduction. However, structural reforms, including additional investment,
stronger health and education improvements, and increased female labor participation, could help ensure that the region’s poten-
tial growth remains robust.
Introduction
Sub-Saharan Africa (SSA)’s potential growth rose in the post-crisis (2013-17) period, above its long-term (1998-2017) and pre-crisis (2003-07) averages, and also above the regional population growth rate, signaling the prospect of gains in per capita incomes in the medium-term. The acceleration in potential growth was mainly due to increases in labor supply, capital stock, and total factor productivity (TFP) growth. Excluding South Africa, potential growth rose at a faster pace, above the emerging market and developing economies (EMDE) average, reflecting a stronger increase in capital accumulation.
Sustained per capita potential growth is critical for continued income convergence and poverty reduction, which is particularly relevant to countries in SSA where an increasing share of the world’s poor reside (World Bank 2015e). SSA’s prospects for continued and solid potential growth are favorable when South Africa is excluded, suggesting that the positive demographic trends that have recently boosted labor supply growth are likely to continue in the rest of the region, along with steady growth in capital accumulation and TFP.
Against this backdrop, this box will discuss the following questions:
• How has potential growth evolved in the region and what were its main drivers?
• What are the prospects for potential growth in SSA?
• What are the policy options for boosting the region’s potential growth?
The box’s main conclusions are that—in the absence of reforms—SSA’s potential growth is likely to slow from the 3.3 percent rate achieved in the past five years to 3.2 percent in the next decade (2018-27), as growth in labor force stagnates and the rate of capital accumulation
moderates, mainly reflecting a slowdown in employment and capital stock growth in South Africa. Such a decline in potential growth would limit the prospects for further gains in per capita incomes and poverty reduction. Excluding South Africa, potential growth in the rest of the region would remain steady at 5 percent a year. This underscores the importance of structural reforms to boost potential growth, including those that spur private investment, skills development, and female labor force participation.
How has potential growth evolved in
Sub-Saharan Africa and what were its
main drivers?
Potential growth increased in SSA following the global financial crisis to 3.3 percent a year during 2013-17, above its long-term (1998-17) average of 2.9 percent and pre-crisis (2003-07) average of 3 percent (Figure 2.6.1.1). By contrast, potential growth in other EMDE regions slowed sharply. Excluding South Africa, potential growth in the region rose from 3.6 percent a year in the pre-crisis period to 5 percent during 2013-17, above the EMDE average of 4.8 percent. This acceleration reflected the effects of significantly higher public investment and rising labor inputs, which offset the headwinds from a commodity price collapse (2014-15), and a slowdown in major trading partners, including in the Euro Area following the euro crisis (2010-13), and in China as it began rebalancing its economy toward domestic consumption.
The pickup in potential growth can be decomposed into its principal components:
Rapid capital stock growth. Excluding South Africa, capital stock growth rose from 1.8 percent a year in 2003-07 to 2.6 percent in 2008-12. This increase partly reflected the stimulus measures countries in the region adopted to cushion the impact of the global financial crisis and support long-term growth. The impact of the stimulus on investment was amplified by efforts to improve the business environment and support investor confidence (Devarajan and Kasekende 2011). The growth of capital stock picked up to 2.9 percent during 2013-17, reflecting
Note: This box was prepared by Gerard Kambou, Sinem Kilic Celik, and Yirbehogre Modeste Some. Xinghao Gong provided research assistance.

SUB-SAHARAN AFRICA GLOBAL ECONOMIC PROSPECTS | JANUARY 2018 145
a strong public infrastructure investment drive in the fast-growing non-resource-intensive countries as well as an increase in foreign direct investment flows in metals exporters (World Bank 2017p). The contribution of capital stock growth to potential growth was 1.1 percentage points higher than the rates seen prior to the global financial crisis. If South Africa is included, the capital stock growth is more modest, with a 0.3 percentage points contribution to potential growth in 2013-17.
Solid labor supply growth. Labor supply growth picked up to 1.4 percent in the post-crisis period, above its longer-term average of 1.2 percent. This acceleration mainly reflected the effects on the labor supply of a bulge in the working-age population along with an increase in labor force participation rates. As a result, the contribution of labor inputs to potential growth increased by 0.2 percentage points in the post-crisis period, contrasting with other EMDE regions, where population aging has dampened the growth of the workforce. If South Africa is
BOX 2.6.1 Potential growth in Sub-Saharan Africa (continued)
FIGURE 2.6.1.1 Regional growth and drivers of potential growth
Although growth slowed in Sub-Saharan Africa during 2013-17, its underlying potential accelerated owing to increases in the
share of working-age population and capital stock growth. Excluding South Africa, potential growth rose at a faster pace.
Sources: World Bank staff estimates, World Development Indicators,Penn World Tables.
Note: SSA stands for Sub-Saharan Africa.
A. C. -F. Median represents median of the six EMDE regional aggregates. Vertical lines indicate the range of the regional aggregates.
B. Potential growth decomposition A. Actual GDP growth
D. Potential TFP growth
C. Investment growth
F. Working-age population growth E. Educational attainment, secondary
completion
included, the contribution of labor supply growth to potential growth rises to 0.4 percentage points, reflecting stronger growth in the working-age population.
Modest TFP growth. Potential TFP growth rose slightly in 2013-17 from the rates seen prior to the global financial crisis. During 2003-07, TFP growth rose above its long-term average, supported by improvements in health and education outcomes, as well as by a decline in the share of the labor force engaged in agriculture and the associated reallocation of workers to higher productivity sectors (McMillan and Harttgen 2014). However, TFP growth remained subdued in the post-crisis period. TFP growth slows markedly if South Africa is included, reflecting the sharp decline in TFP growth South Africa experienced following the global financial crisis. Overall, the contribution of TFP growth to potential growth during 2013-17 was minimal. The low post-crisis increase in TFP growth in SSA and other EMDE regions has been attributed to a slowdown in convergence to the

CHAPTER 2 .6 GLOBAL ECONOMIC PROSPECTS | JANUARY 2018 146
technological frontier after a rapid catch-up in the decade preceding the crisis (Kemp and Smit 2015).
In summary, potential growth in SSA picked up in the post-crisis period, due to increases in the working-age share of the population, which boosted labor supply growth, and to increases in the capital stock from higher investment. TFP growth increased marginally, reflecting an apparent slowdown in the rate of absorption of new technology.
What are the prospects for potential growth in the region?
To examine this question, a baseline projection is constructed that assumes: population and its composition grow in line with a median fertility scenario (as projected in the UN Population Projections); recent trend improvements in education and health outcomes continue; and the investment-to-output ratios remain at their latest five-year average.
Under this scenario, the key determinants of potential growth would evolve as follows:
The underlying growth of the capital stock would remain steady, at around 3 percent a year. If South Africa is included, the capital stock trend growth moderates to 1.8 percent, consistent with a slowdown in investment.
Compared with other EMDE regions, SSA is experiencing a slow decline in fertility rates (Canning et al. 2015). As a result, the youth dependency rate would remain high and the share of working-age population would rise only slowly. Labor supply growth would remain broadly stable, at around 1.4 percent a year. However, if South Africa is included, labor supply growth could slow to 1.1 percent, reflecting declining employment growth in South Africa.
TFP growth would remain steady at 0.6 percent a year. If South Africa is included, TFP growth could rise, owing to South Africa’s innovation strengths (World Bank 2017ae).
On balance, these factors suggest that, in the absence of reforms, potential growth would remain steady at 5 percent on average in the next decade, if South Africa is excluded, as the growth of capital stock and labor supply remains stable. The inclusion of South Africa changes the results. Potential growth would remain low at around 3.2 percent by 2027, as a slowdown in the growth of capital stock and labor supply is only partially offset by a modest increase in TFP growth. Potential growth at this rate would mean that GDP per capita in SSA would rise only
BOX 2.6.1 Potential growth in Sub-Saharan Africa (continued)
very modestly, with unfavorable prospects of reducing the region’s poverty headcount.
What are the policy options to bolster medium-term potential growth in the region?
This section assesses the benefits from the implementation of key structural reforms using scenario analysis. These include filling the region’s investment needs, boosting human capital improvements, and increasing labor supply.
Filling investment needs. Although public investment picked up in the mid-2000s and reached a peak of 5.8 percent of GDP in 2014, this rate was well below the average for other EMDEs (World Bank 2017af).
SSA’s infrastructure investment needs are particularly sizable. Increasing public investment would provide a short-run boost to output, but could also have favorable supply-side effects, including by spurring private investment (World Bank 2017af). Although many countries in the region have little fiscal space to raise public spending through deficit financing, there is scope to reallocate resources from less productive spending programs and to mobilize domestic revenues. Tax revenues as a share of GDP are low for most countries in SSA, and could be increased through reforms including broad-based consumption taxes, simplified tax design, and improved tax administration (Mabugu and Simbanegavi 2015).
Simulations based on the analysis presented in Chapter 3 suggests that if, over the next decade, the investment-to-GDP ratio for the region were increased by around 2.7 percentage points by 2027—an increase that is within historical precedent—the region’s potential growth would be boosted by around 0.6 percentage points by 2027, and by 0.4 percentage points if South Africa is included.
Increasing human capital accumulation. Further improvements in education and health outcomes could bolster potential growth by raising labor force participation rates and TFP growth. Although the region has achieved significant improvements in these areas, much more remains to be done.
• Education: SSA lags in education outcomes. In half of the countries in SSA, less than 50 percent of the youth complete lower secondary education and under 10 percent go on to higher education (World Bank 2017ag). Learning outcomes have been generally poor and gender disparities remain significant at the secondary and tertiary levels (Oyelere 2015). Priorities vary depending on country-specific circumstances, but

SUB-SAHARAN AFRICA GLOBAL ECONOMIC PROSPECTS | JANUARY 2018 147
they center on investing in effective teaching, ensuring access to quality education for the poor, and closing gender gaps (World Bank 2017ag).
• Health: SSA’s average life expectancy of 59 years in 2015 (World Bank 2017ah) also lags other EMDE regions, and falls well short of 80 years in advanced economies. SSA is disproportionally affected by the impact of infectious diseases. Building strong health systems, as well as setting up regional coordination mechanisms, is critical for providing adequate health services to the populations (World Bank 2016l).
To illustrate the benefits of tackling these issues, simulations were conducted that assumed that secondary school and tertiary enrollment rates, and life expectancy will rise over 2018-27 by as much as the largest historical improvement in any ten-year period for SSA. This would imply a rise in secondary school completion rates of 3.7 percentage points, tertiary completion rates of 0.4 percentage points, and life expectancy of 3 years. The effect of these assumptions would be to raise potential growth by around 0.1 percentage points by 2027, compared with 2013-17, the same if South Africa is included.
Increasing labor supply. The labor force participation rate for women in SSA was around 65 percent in 2015 (UNDP 2016), well below the 76 percent rate for men, indicating significant scope for increasing the number of women in the workforce. Studies have shown that gender equality in labor force participation rates in the region is severely affected by the burden of unpaid labor, which is predominantly born by women, as well as by gaps in educational attainment and restrictions in access to credit markets (Seguino and Were 2015). This points to the policy and institutional frameworks that are needed to increase female labor force participation.
To illustrate the possible benefits of such measures, simulations were performed that assumed that the female labor force participation rate rises by 1 percentage points, equivalent to the largest historical ten-year improvement achieved by the region in the past 20 years. The simulations suggest that this would raise potential growth by around 0.1 percentage points by 2027, compared to 2013-17, the same if South Africa is included.
Overall impact on potential growth. Raising the investment-to-GDP ratio, and increasing secondary school and tertiary education completion rates as well as life expectancy closer to advanced-economy levels, as assumed in the scenarios described above, could boost SSA’s
BOX 2.6.1 Potential growth in Sub-Saharan Africa (continued)
potential growth by 0.7 percentage points by 2027. Additional gains (0.1 percentage points) could also be expected from labor market policies that encourage female labor force participation. Overall, a combination of additional investment, increased education and health improvements, and higher female labor force participation could raise SSA’s potential growth by 0.8 percentage points to 5.8 percent by 2027, excluding South Africa. If South Africa is included, similar reforms would boost potential growth by 0.7 percentage points to 3.8 percent on average by 2027 (Figure 2.6.1.2).
Other productivity-enhancing reforms. In addition to the types of reforms that can be captured in the models described in Chapter 3, there are other productivity-enhancing reforms that could also pay significant dividends (AfDB et al. 2013). These include diversification to reduce reliance on the resource sector; stronger property rights to encourage productivity-enhancing investment; and greater transport connectivity to spur competition. Across the region, there is scope for raising productivity in the formal sector, the agricultural sector, and nonfarm informal sector, which could further boost the region’s potential growth (World Bank 2016l).
• Economic diversification: Economies in the region are striving to diversify away from natural resource exports, especially by taking steps to make their manufacturing sectors more competitive. Competitiveness within SSA suffers as a result of poor business environments, lack of infrastructure, and high unit labor costs (Bhorat and Tarp 2016). Along with increased human capital and the removal of trade barriers, improvements in transport and energy infrastructure could increase the productivity and competitiveness of the region, and facilitate its integration into global value chains (Allard et al. 2016). While the business environment has improved, there remains considerable scope for simplifying regulations and administrative procedures for starting a business, increasing the efficiency of the legal system, and reducing regulatory uncertainty.
• Boosting agricultural productivity: Across the region, the share of employment in low-productivity agriculture remains high. Many countries have substantial scope for raising agricultural productivity, including by taking steps to improve land titles, increasing access to credit for investment in new farming techniques, improving the awareness of modern farming techniques, and improving the infrastructure needed to connect farms to markets. In

CHAPTER 2 .6 GLOBAL ECONOMIC PROSPECTS | JANUARY 2018 148
BOX 2.6.1 Potential growth in Sub-Saharan Africa (concluded)
FIGURE 2.6.1.2 Policies to stem declining
potential growth
The expected gradual decline in the region’s high
fertility rates could slow the growth of the working-age
population, and a weakening of the investment rate will
moderate capital stock growth. In the absence of
reforms, a slowing expansion of the labor supply and
capital stock could reduce regional potential growth
from 3.3 percent in 2017 to 3.2 percent by 2027, below
the EMDE average. However, the region’s potential
growth could be boosted to 3.8 percent by 2027
through policies to spur investment, improve education
and health, and boost female participation rates.
Excluding South Africa, potential growth could reach 5.8
percent by 2027.
Source: World Bank staff estimates.
Notes: GDP-weighted averages. Derived using the methodology
described in Annexes 3.1 and 3.3. Policy scenarios are
described in Annex 3.3.
A. SSA potential growth
B. SSA potential growth under reform scenarios
Ethiopia, public investments in irrigation, transportation and power have produced a significant increase in agricultural productivity and incomes, which resulted in growth-enhancing structural change (Rodrik 2017).
• Raising productivity in the nonfarm informal sector: Recent studies found that in many countries the decline in the share of the labor force engaged in agriculture has been matched by a sizable increase in the share of the labor force employed in the informal sector (Diao et al. 2017). Raising the productivity of the informal sector has become an important policy objective. Fostering a supportive regulatory environment, and promoting investment in basic infrastructure such as electricity, road networks, and information technology, are important areas of reforms that could make the informal sector more dynamic and formal, and increase its contribution to the region’s long-run economic growth (Bhorat and Tarp 2016).
Conclusion
Potential growth rose to 3.3 percent in Sub-Saharan Africa in the past five years, above the pre-crisis and longer-term averages, owing to the growth of the working-age population and capital stock. However, in the absence of reforms, SSA’s potential growth would remain low at around 3.2 percent by 2027, given likely trends in labor supply and investment, which suggests that per capita income growth would stagnate. The low potential growth rate is mainly due to a moderation in trend growth in South Africa. Excluding South Africa, potential growth rose by 5 percent on average following the global financial crisis, above the EMDE average, reflecting a stronger increase in the rate of capital accumulation.
There is considerable scope for boosting potential growth with structural reforms, including policies to increase investment, improve health and education outcomes, and raise female labor force participation. Bold steps in these areas could boost SSA’s potential growth by around 0.8 percentage points to 5.8 percent on average over the next decade. Other productivity-enhancing reforms, including diversification to reduce reliance on commodities, stronger property rights to encourage productivity-enhancing investment, and greater transport connectivity to spur competition, could safeguard and bolster these gains. A robust implementation of such policies would be critical if the region is to take full advantage of its demographic dividend.

CHAPTER 2 GLOBAL ECONOMIC PROSPECTS | JANUARY 2018 149
References
Acevedo, S. 2016. “Gone with the Wind: Estimating Hurricane and Climate Change Costs in the Caribbean.” IMF Working Paper 16/199, International Monetary Fund, Washington, DC.
ADB (Asian Development Bank). 2015. Women in the Workforce: An Unmet Potential in Asia and the Pacific. Manila: Asian Development Bank.
———. 2016. Asian Development Outlook 2016: Asia's Potential Growth. Manila: Asian Development Bank.
AfDB (African Development Bank), Organization for Economic Co-operation and Development, United Nations Development Programme, and the European Commission for Africa. 2013. “Structural Transformation and Natural Resources.” African Economic Outlook. Paris: OECD Publishing.
Agolli, M., and A. Gugu. 2010. “Developing Brain Gain Policies in the Western Balkans: Albania.” European Movement Albania, Tirana.
Alkhareif, R., and N. Alsadoun. 2016. “Estimating the Output Gap for Saudi Arabia.” Issue Paper 16/1, Saudi Arabian Monetary Authority, Riyadh.
Allard, C., J. I. Canales-Kriljenko, W. Chen, J. Gonzales-Garcia, E. Kitsios, and J. Trevino. 2016. “Trade Integration and Value Chains in Sub-Saharan Africa: In Pursuit of the Missing Link.” International Monetary Fund, Washington, DC.
Anand, R., and P. Khera. 2016. “Macroeconomic Impact of Product and Labor Market Reforms on Informality and Unemployment in India.” IMF Working Paper 16/47, International Monetary Fund, Washington, DC.
Anand, R., K. Cheng, S. Rehman, and L. Zhang. 2014. “Potential Growth in Emerging Asia.” IMF Working Paper 14/2, International Monetary Fund, Washington, DC.
APO (Asian Productivity Organization). 2016. APO Productivity Databook. Tokyo: Asian Productivity Organization.
Aslam, A., S. Beidas-Strom, R. Bems, O. Celasun, S. Kılıç Çelik, and Z. Kóczán. 2016. “Trading on Their Terms? Commodity Exporters in the Aftermath of the Commodity Boom.” IMF Working Paper 16/127, International Monetary Fund, Washington, DC.
Atoyan, R., and J. Rahman. 2017. “Western Balkans: Increasing Women’s Role in the Economy.” IMF
Working Paper 17/194, International Monetary Fund, Washington, DC.
Aturupane, H., H. Dundar, B. Millot, T. Piyasiri, and Y. Savchenko. 2014. “Building the Skills for Economic Growth and Competitiveness in Sri Lanka.” Directions in Development Series. Washington, DC: World Bank.
Bai, C., and Q. Zhang. 2017. A Research on China’s Economic Growth Potential. China Perspectives book series. Abingdon, U.K.: Taylor and Francis Group.
Baker, S., N. Bloom, and S. Davis. 2015. “Measuring Economic Policy Uncertainty.” NBER Working Paper 21633, National Bureau of Economic Research, Cambridge, MA.
Baldwin, R., and J. Lopez-Gonzalez. 2015. “Supply-chain Trade: A Portrait of Global Patterns and Several Testable Hypotheses.” World Economy 38 (11): 1682–1721.
Benhassine, N., A. Stone, P. Keefer, Y. Hassani, S. Youssef, and S. N. Wahba. 2009. “From Privilege to Competition: Unlocking Private-led Growth in the Middle East and North Africa.” MENA Development Report. Washington, DC: World Bank.
Beverelli, C., M. Fiorini, and B. Hoekman. 2017. “Services Trade Policy and Manufacturing Productivity: The Role of Institutions.” Journal of International Economics 104: 166–182.
Bhoi, B., and H. Behera. 2016. “India’s Potential Output Revisited.” RBI Working Paper 05/2016, Reserve Bank of India, Mumbai.
Bhorat, H., and F. Tarp. 2016. “The Pursuit of Lon-Run Economic Growth in Africa: An Overview of Key Challenges.” In Africa’s Lions: Growth Traps and Opportunities for Six African Economies, edited by H. Bhorat and F. Tarp. Washington, DC: Brookings Institution.
Bijsterbosch, M., and M. Kolasa. 2010. “FDI and Productivity Convergence in Central and Eastern Europe: An Industry-level Investigation.” Review of World Economics 145 (4): 689–712.
BIS (Bank for International Settlements). 2017. “BIS Statistical Bulletin.” September. Bank for International Settlements, Basel.
Blagrave, P., R. Garcia-Saltos, D. Laxton, and F. Zhang. 2015. “A Simple Multivariate Filter for Esti-mating Potential Output.” IMF Working Paper 15/79, International Monetary Fund, Washington, DC.

CHAPTER 2 GLOBAL ECONOMIC PROSPECTS | JANUARY 2018 150
BNM (Bank Negara Malaysia). 2012. “Potential Output and the Output Gap in Malaysia.” Quarterly Bulletin (Second Quarter). Bank Negara Malaysia, Kuala Lumpur.
———. 2015. “Estimating Malaysia’s Potential Output.” Outlook and Policy in 2015. Annual Report 2014. Bank Negara Malaysia, Kuala Lumpur.
Böwer, U. 2017. “State-Owned Enterprises in Emerging Europe: The Good, the Bad, and the Ugly.” IMF Working Paper 17/221, International Monetary Fund, Washington, DC.
Bown, C., D. Lederman, S. Pienknagura, and R. Robertson. 2017. Better Neighbors: Toward a Renewal of Integration in Latin America. Washington, DC: World Bank.
Breu, M., R. Dobbs, J. Remes, D. Skilling, J. Kim. 2012. “Sustaining Vietnam's Growth: The Productivity Challenge.” McKinsey Global Institute, Washington, DC.
Canning, D., S. Raja, and A. Yazbeck, eds. 2015. Africa’s Demographic Transition: Dividend or Disaster? Washington, DC: World Bank.
Capannelli, E. 2017. “Romania Should Continue to Reform its State-owned Enterprises to Enhance Growth.” Eurasian Perspectives—Voices from Europe and Central Asia (blog), March 3. http://blogs. worldbank.org/europeandcentralasia/romania-should-continue-reform-its-state-owned-enterprises-enhance-growth.
Castillo Bardález, P., and Y. Rojas Zea. 2014. “Terms of Trade and Total Factor Productivity: Empirical Evidence from Latin American Emerging Markets.” Working Paper 2014-012, Central Reserve Bank of Peru, Lima.
Cho, Y., and B. N. Tien. 2014. “Sub-Saharan Africa’s Recent Growth Spurt: An Analysis of the Sources of Growth.” Policy Research Working Paper 6862, World Bank, Washington, DC.
Cirera, X., and W. F. Maloney. 2017. The Innovation Paradox: Developing-Country Capabilities and the Unrealized Promise of Technological Catch-Up. Washington, DC: World Bank.
Constant, S. M. 2016. “Paving the Way for Women’s Economic Inclusion in the Gulf Cooperation Council (GCC): Main Report.” GCC Country Engagement Note, World Bank, Washington, DC.
Constantinescu, C., A. Mattoo, and M. Ruta. 2017. “Trade Developments in 2016: Policy Uncertainty Weighs on World Trade.” Global Trade Watch. World Bank, Washington, DC.
Crespi, G., and P. Zuñiga. 2012. “Innovation and Productivity: Evidence from Six Latin American Countries.” World Development 40 (2): 273–90.
Crespi, G., E. Tacsir, and F. Vargas. 2016. “Innovation Dynamics and Productivity: Evidence for Latin America.” In Firm Innovation and Productivity in Latin America and the Caribbean: The Engine of Economic Development, edited by M. Grazzi and C. Pietrobelli. Washington, DC: Inter-American Development Bank.
Daude, C., and E. Fernández-Arias. 2010. “On the Role of Productivity and Factor Accumulation in Economic Development in Latin America and the Caribbean.” IDB Working Paper 155, Inter-American Development Bank, Washington, DC.
de la Torre, A., T. Dider, A. Ize, D. Lederman, and S. L. Schmukler. 2015. Latin America and the Rising South: Changing World, Changing Priorities. Washington, DC: World Bank.
Devarajan, S., and L. A. Kasekende. 2011. “Africa and the Global Economic Crisis: Impacts, Policy Responses and Political Economy.” African Development Review 23 (4).
Diao, X., K. Harttgen, and M. McMillan. 2017. “The Changing Structure of Africa’s Economy.” Working Paper 23021, National Bureau of Economic Research, Cambridge, Massachusetts.
Ding, D., J. Nelmes, R. Perera, and V. Tulin. 2014. “Estimating Sri Lanka’s Potential Output.” IMF Working Paper 14/40, International Monetary Fund, Washington, DC.
Docquier, F., Ç. Ozden, and G. Peri. 2014. “The Labour Market Effects of Immigration and Emigration in OECD Countries.” The Economic Journal 124 (579): 1106–1145.
EBRD (European Bank for Reconstruction and Development). 2014. Transition Report 2013: Stuck in Transition? London: European Bank for Reconstruction and Development.
———. 2015. Transition Report 2015-16: Rebalancing Finance. London: European Bank for Reconstruction and Development.
Eris, M. N., and B. Ulasan. 2013. “Trade Openness and Economic Growth: Bayesian Model Averaging

CHAPTER 2 GLOBAL ECONOMIC PROSPECTS | JANUARY 2018 151
Estimate of Cross-country Growth Regressions.” Economic Modelling 33 (July): 867-883.
Estevadeordal, A. 2012. “Economic Integration in the Americas: An Unfinished Agenda.” In The Road to Hemispheric Cooperation: Beyond the Cartagena Summit of the Americas. Washington, DC: Brookings Institution.
Estrin, S., J. Hanousek, E. Kočenda, and J. Svejnar. 2009. “The Effects of Privatization and Ownership in Transition Economies.” Journal of Economic Literature 47 (3): 699–728.
Faal, E. 2005. “GDP Growth, Potential Output, and Output Gaps in Mexico.” IMF Working Paper 05/93, International Monetary Fund, Washington, DC.
Farole, T., and V. Pathikonda. 2016. “The Capabilities Driving Participation in Global Value Chains.” World Bank Policy Research Paper 7804. World Bank, Washington, DC.
Felipe, J., N. R. Sotocinal, and C. Bayudan-Dacuycuy. 2015. “The Impact of Financial Factors on the Output Gap and Estimates of Potential Output Growth.” ADB Economics Working Paper 457, Asian Development Bank, Manila.
Ferreyra, M. M., C. Avitabile, J. B. Álvarez, F. H. Paz, and S. Urzúa. 2017. At a Crossroads: Higher Education in Latin America and the Caribbean. Washington, DC: World Bank.
Fu, X. 2008. “Foreign Direct Investment, Absorptive Capacity and Regional Innovation Capabilities: Evidence from China.” Oxford Development Studies 36 (1): 89–110.
Gabrielczak, P., and T. Serwach. 2014. “The Link between Firm-Level Productivity and Decisions to Export – the Case of Lodz Voivodeship.” Theory Methodology Practice 10 (1): 3–8.
Garcia-Saltos, R., J. Teodoru, and F. Zhang. 2016. “Potential Output Growth Estimates for Central America and the Dominican Republic.” IMF Working Paper 16/250, International Monetary Fund, Washington, DC.
Gatti, R., M. Morgandi, R. Grun, S. Brodmann, D. Angel-Urdinola, J. Moreno, D. Marotta, et al. 2013. Jobs for Shared Prosperity: Time for Action in the Middle East and North Africa. Washington, DC: World Bank.
Goldberg, I., J. G. Goddard, and S. Kuriakose. 2011. Igniting Innovation: Rethinking the Role of Government
in Emerging Europe and Central Asia. Washington, DC: World Bank,
Hanusch, M. 2012. “The Doing Business Indicators, Economic Growth and Regulatory Reform.” Policy Research Working Paper 6176, World Bank, Washington, DC.
Hausmann, R., and L. Nedelkoska. 2017. “Welcome Home in a Crisis: Effects of Return Migration on the Non-migrants' Wages and Employment.” HKS Working Paper RWP17-015, Harvard University, John F. Kennedy School of Government, Cambridge.
Havrylyshyn, O. 1990. “Trade Policy and Productivity Gains in Developing Countries: A Survey of the Literature.” The World Bank Research Observer 5 (1): 1-24.
Huidrom, R., M. A. Kose, and F. Ohnsorge. 2017. “How Important are Spillovers from Major Emerging Markets?” Discussion Paper 12022, Center for Economic and Policy Research, Washington, DC.
IDB (Inter-American Development Bank). 2013. “Rethinking Reforms: How Latin America Can Escape Suppressed World Growth.” Latin American and Caribbean Macroeconomic Report, IDB, Washington, DC.
IMF (International Monetary Fund). 2013. “German-Central European Supply Chain-Cluster Report: Staff Report, First Background Note, Second Background Note, Third Background Note.” International Monetary Fund, Washington, DC.
———. 2015. “Recent Investment Weakness in Latin America: Is There a Puzzle?” in Western Hemisphere Regional Economic Outlook: Northern Spring, Southern Chills. Washington, DC: International Monetary Fund.
———. 2016a. “Malaysia: 2017 Article IV Consultation.” International Monetary Fund, Washington, DC.
———. 2016b. “Thailand: 2016 Article IV Consultation.” International Monetary Fund, Washington, DC.
———. 2016c. “Central, Eastern, and Southern Europe: How to Get Back on the Fast Track.” Regional Economic Issues. Washington, DC: International Monetary Fund.
———. 2016d. The Commodity Cycle in Latin America: Mirages and Dilemmas. Washington, DC: World Bank.

CHAPTER 2 GLOBAL ECONOMIC PROSPECTS | JANUARY 2018 152
———. 2016e. “Saudi Arabia: Selected Issues.” IMF Country Report 17/317. October. International Monetary Fund, Washington, DC.
———. 2017a. “Mongolia: 2017 Article IV Consultation—Staff Report.” International Monetary Fund, Washington, DC.
———. 2017b. “China: 2017 Article IV Consultation.” International Monetary Fund, Washington, DC.
———. 2017c. “Indonesia: 2016 Article IV Consultation.” International Monetary Fund, Washington, DC.
———. 2017d. “Preparing for Choppy Seas.” Regional Economic Outlook: Asia and Pacific. May. Washington, DC: International Monetary Fund.
———. 2017e. “Europe Hitting Its Stride.” Regional Economic Outlook: Europe. November. Washington, DC: International Monetary Fund.
———. 2017f. “Latin America: Stuck in Low Gear.” Regional Economic Outlook Update: Western Hemisphere. Washington, DC: International Monetary Fund.
———. 2017g. “Egypt, Arab Rep.: 2017 Article IV Consultation Staff Report.” International Monetary Fund, Washington, DC.
———. 2017h. “India: Selected Issues”. IMF Country Report 17/55, International Monetary Fund, Washington, DC.
ILO (International Labor Organization). 2017. ILO Decent Work Technical Support Team and Country Office for Eastern Europe and Central Asia. Moscow: International Labor Organization.
Jin, H., and I. Rial. 2016. “Regulating Local Govern-ment Financing Vehicles and Public-Private Partner-ships in China.” IMF Working Paper No. 13/204, International Monetary Fund, Washington, DC.
Kemp, J., and B. Smit. 2015. “Estimating and Explaining Changes in Potential Growth in South Africa.” Stellenbosch Economic Working Papers 14/15, University of Stellenbosch, Matieland, South Africa.
Kinoshita, Y. and F. Guo. 2015. “What Can Boost Female Labor Force Participation in Asia?” IMF Working Paper 15/56, International Monetary Fund, Washington, DC.
Kose, M. A., S. Kurlat, F. Ohnsorge, and N. Sugawara. 2017. “A Cross-Country Database of Fiscal Space.”
Policy Research Working Paper 8157, World Bank, Washington, DC.
Krasnopeeva, N., E. Nazrullaeva, A. Peresetsky, and E. Shchetinin. 2016. “To Export or Not to Export? The Link between the Exporter Status of a Firm and its Technical Efficiency in Russia’s Manufacturing Sector.” Voprosy Economiki 7.
Kummritz V., D. Taglioni, and D. Winkler. 2017. “Economic Upgrading through Global Value Chain Participation: Which Policies Increase the Value Added Gains?” Policy Research Working Paper 8007, World Bank, Washington, DC.
La Porta, R., and A. Shleifer. 2014. “Informality and Development.” Journal of Economic Perspectives 28(3): 109–26.
Lian, C. L., and N. A. Shahrier. 2014. “Estimating Malaysia’s Output Gap: Have We Closed.” Working Paper 4/2014. Bank Negara Malaysia, Kuala Lumpur, Malaysia.
Loayza, N., P. Fajnzylber, and C. Calderón. 2005. Economic Growth in Latin America and the Caribbean: Sylized Facts, Explanations, and Forecasts. Washington, DC: World Bank.
Lopez-Acevedo, G., and R. Robertson. 2016. Stitches to Riches? Apparel Employment, Trade, and Economic Development in South Asia. Directions in Development Series. Washington DC: World Bank.
Lorente, J., S. Ismail, and S. Schmukler. 2016. “Firm Financing and Growth in the Arab Region.” Policy Research Working Paper 7756, World Bank, Washington, DC.
Mabugu, R. E., and W. Simbanegavi. 2015. “Tax and Expenditure Reforms in Africa: An Overview.” Journal of African Economies 24 (AERC Supplement 2).
Maliszewski, W., and L. Zhang. 2015. “China’s Growth: Can Goldilocks Outgrow.” IMF Working Paper 15/113. International Monetary Fund, Washington, DC.
Mansoor, A., and B. Quillin, editors. 2006. Migration and Remittances. Eastern Europe and the Former Soviet Union. Washington, DC: World Bank.
McMillan, M. S., and K. Harttgen. 2014. “What is Driving the African Growth Miracle?” Working Paper 20077, National Bureau of Economic Research. Cambridge, Massachusetts.

CHAPTER 2 GLOBAL ECONOMIC PROSPECTS | JANUARY 2018 153
Meyer, D., and A. Shera. 2017. “The Impact of Remittances on Economic Growth: An Econometric Model.” EconomiA (18) 2: 147-155.
Mishra, P. 2013. “Has India’s Growth Story Withered?” Economic and Political Weekly 48 (15).
Mitra, P., A. Hosny, G. Abajyan, and M. Fischer. 2015. “Estimating Potential Growth in the Middle East and Central Asia.” IMF Working Paper 15/62, International Monetary Fund, Washington, DC.
Mitra, P., A. Hosny, G. Minasyan, M. Fischer, and G. Abajyan. 2016. “Avoiding the New Mediocre: Raising Long-Term Growth in the Middle East and Central Asia.” International Monetary Fund, Washington, DC.
Montalbano, P., S. Nenci, and C. Pietrobelli. 2016. “International Linkages, Value-Added Trade, and Firm Productivity in Latin America and the Caribbean.” In Firm Innovation and Productivity in Latin America and the Caribbean: The Engine of Economic Development, 285–316, edited by M. Grazzi and C. Pietrobelli. Washington, DC: Inter-American Development Bank.
Moura, R., and R. Forte. 2010. “The Effects of Foreign Direct Investment on the Host Country Economic Growth - Theory and Empirical Evidence.” Singapore Economic Review 58 (3): 1-28.
Munoz, M. R. V. Perotti, J. Revilla, N. V. Loayza, T. Sharifuddin, S. Binti, J. Kunicova, et al. 2016. “The Quest for Productivity Growth.” Malaysia Economic Monitor. Washington, DC: World Bank.
Nabar, M. S., and P. M’B. P. N’Diaye. 2013. “Enhancing China’s Medium-Term Growth Prospects: The Path to a High-Income Economy.” IMF Working Paper No. 13/204, International Monetary Fund, Washington, DC.
Nabli, M. 2007. Breaking the Barriers to Higher Economic Growth: Better Governance and Deeper Reforms in the Middle East and North Africa. Washington, DC: World Bank.
Narodowy Bank Polski. 2017. “Inflation Report.” November. Narodowy Bank Polski, Warszawa, Poland.
Novta, N., and J. C. Wong. “Women at Work in Latin America and the Caribbean.” IMF Working Paper 17/34, International Monetary Fund, Washington, DC.
Oberman, R., R. Dobbs, A. Budiman, F. Thompson and M. Rossé. 2012. The Archipelago Economy: Unleashing Indonesia's Potential. Washington, DC: McKinsey Global Institute.
OECD (Organisation for Economic Co-operation and Development). 2012. “Medium and Long-Term Scenarios for Global Growth and Imbalances.” OECD Economic Outlook, Volume 2012/1. Paris: Organisation for Economic Co-operation and Development.
———. 2015. Education at a Glance 2015: OECD Indicators. Paris: Organisation for Economic Co-Operation and Development.
———. 2016a. “Economic Survey of Indonesia 2016.” Organisation for Economic Co-operation and Development, Paris.
———. 2016b. “Boosting Productivity and Inclusive Growth in Latin America.” Organisation for Economic Co-Operation and Development, Paris.
———. 2017. OECD Economic Surveys: Mexico 2017. Paris: Organisation for Economic Co-Operation and Development.
OECD (Organisation for Economic Co-operation and Development)/ECLAC (Economic Commission for Latin America and the Caribbean)/CAF (Corporación Andina de Fomento). 2017. Latin American Economic Outlook 2017: Youth Skills and Entrepreneurship. Paris: OECD.
Oleyere, R.U. 2015. “School Enrollment, Attainment, and Returns to Education.” In The Oxford Handbook of Africa and Economics, Volume II: Policies and Practices, edited by C. Monga and J. Y. Lin. Oxford: Oxford University Press.
Ollivaud, P., Y. Guillemette, and D. Turner. 2016. “Links between Weak Investment and the Slowdown in Productivity and Potential Output Growth across the OECD.” Economics Department Working Paper 1304, Organisation for Economic Co-Operation and Development, Paris.
Perkins, D. H., and T. G. Rawski. 2008. “Forecasting China's Economic Growth to 2025.” In China's Great Economic Transformation, edited by Loren Brandt and Thomas G. Rawski. Cambridge: Cambridge University Press.
Poddar, T., and E. Yi. 2007. “India’s Rising Growth Potential.” Global Economics Papers 152, Goldman Sachs, New York.
Ranjan, R., R. Jain, and S. C. Dhal. 2007. “India’s Potential Economic Growth: Measurement Issues and Policy Implications.” Economic and Political Weekly 42 (17).

CHAPTER 2 GLOBAL ECONOMIC PROSPECTS | JANUARY 2018 154
RBI (Reserve Bank of India). 2017. “Financial Stability Report.” Issue 15, Reserve Bank of India, Mumbai.
Rodrik, D. 2017. “Growth without Industrialization?” Project Syndicate. https://www.project-syndicate.org/commentary/poor-economies-growing-without-industrializing-by-dani-rodrik-2017-10
Rodrik, D., and A. Subramanian. 2004. “Why India Can Grow at 7 Percent a Year or More: Projections and Reflections.” IMF Working Paper 04/118, International Monetary Fund, Washington, DC.
Royal Government of Bhutan (RGOB). 2016. “Economic Development Policy.” Thimphu, Bhutan.
Rustomjee, C. 2017. “Pathways through the Silent Crisis: Innovations to Resolve Unsustainable Caribbean Public Debt.” Paper No. 25, Centre for International Governance Innovation, Waterloo, Ontario, Canada.
Ruta, M., I. C. Constantinescu, and A. Mattoo. 2017. “Does Vertical Specialization Increase Productivity?” Policy Research Working Paper 7978, World Bank, Washington DC.
Schiffbauer, M., A. Sy, S. Hussain, H. Sahnoun, and P. Keefer. 2015. “Jobs or Privileges: Unleashing the Employment Potential of the Middle East and North Africa.” MENA Development Report. Washington, DC: World Bank.
Seguino, S., and M. Were. 2015. “Gender, Economic Growth, and Development in Sub-Saharan Africa.” In The Oxford Handbook of Africa and Economics, Volume II: Policies and Practices, edited by C. Monga and J. Y. Lin. Oxford: Oxford University Press.
Sosa, S., E. Tsounta, and H. S. Kim. 2013. “Is the Growth Momentum in Latin America Sustainable?” IMF Working Paper 13/109, International Monetary Fund, Washington, DC.
Statistics South Africa. 2017. Poverty Trends in South Africa: An Examination of Absolute Poverty Between 2006 and 2015. Pretoria: Statistics South Africa.
Stefanescu, R., and R. Dumitriu. 2014. “Investigation on the Relationship Between Romanian Foreign Trade and Industrial Production.” MPRA Paper 62547. University Library of Munich, Munich.
Strokova, V., and M. I. Ajwad. 2017. “Tajikistan Jobs Diagnostic: Strategic Framework for Jobs.” World Bank, Washington, DC.
Tabor, S. R. 2015. “Constraints to Indonesia’s Economic Growth.” ADB Papers on Indonesia. Asian
Development Bank, Manila.
Teixeira, A. A. C., and N. Fortuna. 2010. “Human Capital, R&D, Trade, and Long-run Productivity. Testing the Technological Absorption Hypothesis for the Portuguese Economy, 1960-2001.” Research Policy 39 (3): 335–350.
Trejos, S., and G. Barboza. 2015. “Dynamic Estimation of the Relationship Between Trade Openness and Output Growth in Asia.” Journal of Asian Economics 36 (February): 110-125.
United Nations Development Programme. 2016. Human Development Report 2016: Human Development for Everyone. New York: UNDP.
Ustyuzhanina, E. 2016. “The Eurasian Union and Global Value Chains.” European Politics and Society 17 (sup1): 35–45.
Van Eeghen, M. W., I. S. Gill, I. V. Izvorski, and D. De Rosa. 2014. Diversified Development: Making the Most of Natural Resources in Eurasia. Washington, DC: World Bank.
Vashakmadze, E., et al. 2017. “Regional Dimensions of Recent Weakness in Investment: Drivers, Investment Needs and Policy Responses.” Policy Research Working Paper 7991, World Bank, Washington, DC.
Végh, C., L. Morano, D. Friedheim, and D. Rojas. 2017. “Between a Rock and a Hard Place: The Monetary Policy Dilemma in Latin America and then Caribbean.” LAC Semiannual Report. October. Washington, DC: World Bank.
Végh, C., L., D. Lederman, and F. R. Bennett. 2017. “Leaning Against the Wind: Fiscal Policy in Latin America and the Caribbean in a Historical Perspective.” LAC Semiannual Report. April. Washington, DC: World Bank.
Vostroknutova, E., A. Rodriguez, P. Saavedra, and J. Panzer. 2015. “Peru - Building on Success: Boosting Productivity for Faster Growth.” World Bank, Washington, DC.
World Bank and the Development Research Center of the State Council of the People's Republic of China. 2012. China 2030: Building a Modern, Harmonious, and Creative Society. Washington, DC: World Bank.
World Bank and the Ministry of Planning and Investment of Vietnam. 2016. Vietnam 2035: Toward Prosperity, Creativity, Equity, and Democracy. Washington, DC: World Bank.
CHAPTER 2 GLOBAL ECONOMIC PROSPECTS | JANUARY 2018 155
World Bank. 2011a. “Enhancing Preparedness, Ensuring Resilience.” Indonesia Economic Quarterly. December. Washington, DC: World Bank.
———. 2011b. “Turkey - Sustaining High Growth: The Role of Domestic Savings - Synthesis Report.” World Bank, Washington, DC.
———. 2012. “FYR Macedonia: Deepening the Reform Agenda.” World Bank, Washington, DC.
———. 2013a. “Rebuilding Policy Buffers, Reinvig-orating Growth.” East Asia and Pacific Economic Update. Washington, DC: World Bank.
———. 2013b. “In Kosovo: Helping Young People Join Society.” World Bank, Washington, DC. http://www.worldbank.org/en/results/2013/08/16/in-kosovo-helping-young-people-join-society
———. 2013c. “Central Asia - Migrant Life-Skills Development Technical Assistance Project.” World Bank, Washington DC.
———. 2013d. “Serbia - Consolidated Collection & Pension Administration Reform Project.” World Bank, Washington, DC.
———. 2014a. “Preserving Stability and Promoting Growth.” East Asia and Pacific Economic Update. Washington, DC: World Bank.
———. 2014b. “Enhancing Competitiveness in an Uncertain World.” East Asia and Pacific Economic Update. Washington, DC: World Bank.
———. 2014c. Urban China: Toward Efficient, Inclusive, and Sustainable Urbanization. Washington, DC: World Bank.
———. 2014d. “Commodity Markets Outlook.” July. World Bank, Washington, DC.
———. 2015a. “Commodity Markets Outlook.” July. World Bank, Washington, DC.
———. 2015b. “High Expectations.” World Bank Indonesia Economic Quarterly. March. Washington, DC: World Bank.
———. 2015c. Live Long and Prosper: Aging in East Asia and Pacific. Washington, DC: World Bank.
———. 2015d. East Asia's Changing Urban Landscape: Measuring a Decade of Spatial Growth. Urban Development. Washington, DC: World Bank.
———. 2015e. Global Monitoring Report 2015/16. Washington, DC: World Bank.
———. 2016a. Global Economic Prospects: Divergences and Risks. June. Washington, DC: World Bank.
———. 2016b. Global Economic Prospects: Spillovers amid Weak Growth. January. Washington, DC: World Bank.
———. 2016c. “Commodity Markets Outlook: Weak Growth in Emerging Economies and Commodity Markets.” January. World Bank, Washington, DC.
———. 2016d. “Reducing Vulnerabilities.” East Asia and Pacific Economic Update. Washington, DC: World Bank.
———. 2016e. “Aging Society and Economy.” Thailand Economic Monitor. Washington, DC: World Bank.
———. 2016f. “Leveraging Trade Agreements.” Malaysia Economic Monitor. Washington, DC: World Bank.
———. 2016g. World Development Report 2016: Digital Dividends. Washington, DC: World Bank.
———. 2016h. “Azerbaijan - Public Investment Capacity Building Project.” World Bank, Washington, DC.
———. 2016i. “Ten Messages About Youth Employment in South East Europe.” South East Europe Regular Economic Report No. 9S. World Bank, Washington, DC.
———. 2016j. “Western Balkans Labor Market Trends 2017. World Bank, Washington, DC.
———. 2016k. What's Holding Back the Private Sector in MENA? Lessons from the Enterprise Survey. Washington, DC: World Bank.
———. 2016l. “Africa Region: Sustaining Growth and Fighting Poverty amid Rising Global Risks.” Regional Update 2016. Washington, DC: World Bank .
———. 2017a. “Balancing Act.” East Asia and Pacific Economic Update. October. Washington, DC: World Bank.
———. 2017b. “Closing the Gap.” Indonesia Economic Quarterly. October. World Bank, Washington, DC.
———. 2017c. “Preserving Consistency and Policy Commitments.” Philippines Economic Update. October. Washington, DC: World Bank.
———. 2017d. “Sustaining Resilience.” East Asia and Pacific Economic Update. Washington, DC: World Bank.

CHAPTER 2 GLOBAL ECONOMIC PROSPECTS | JANUARY 2018 156
———. 2017e. Global Economic Prospects: A Fragile Recovery. June. Washington, DC: World Bank.
———. 2017f. “Digital Transformation.” Thailand Economic Monitor. August. Washington, DC: World Bank.
———. 2017g. Pacific Possible: Long-term Economic Opportunities and Challenges for Pacific Island Countries. Washington, DC: World Bank.
———. 2017h. “Sustaining Resilience.” East Asia and Pacific Economic Update. Washington, DC: World Bank.
———. 2017i. “Balancing Act.” East Asia and Pacific Economic Update. Washington, DC: World Bank.
———. 2017j. World Development Report 2017: Learning to Realize Education’s Promise. Washington, DC: World Bank.
———. 2017k. Global Investment Competitiveness Report 2017/2018: Foreign Investor Perspectives and Policy Implications. Washington, DC: World Bank.
———. 2017l. Doing Business 2018: Reforming to Create Jobs. Washington, DC: World Bank.
———. 2017m. Kazakhstan — The Economy is Rising: It is Still All About Oil. Fall. Washington, DC: World Bank.
———. 2017n. Russia Economic Review. Fall. Washington, DC: World Bank.
———. 2017o. Western Balkans Regular Economic Report. Fall. Washington, DC: World Bank.
———. 2017p. Global Economic Prospects: Weak Investment in Uncertain Times. January. Washington, DC: World Bank.
———. 2017q. “Commodity Markets Outlook.” October. World Bank, Washington, DC.
———. 2017r. “The Western Balkans: Revving up the Engines of Growth and Prosperity.” World Bank, Washington, DC.
———. 2017s. “Migration and Mobility.” Europe and Central Asia Economic Update. Washington, DC: World Bank.
———. 2017t. “Migration and Remittances: Recent Developments and Outlook.” Migration and Development Brief 28, World Bank, Washington, DC.
———. 2017u. “Refugee Crisis in MENA. Meeting the Development Challenge.” MENA Economic Monitor. Washington, DC: World Bank.
———. 2017v. “Sustaining Fiscal Reforms in the Long-Run.” Gulf Economic Monitor. June. Washington, DC: World Bank.
———. 2017w. “The Economics of Post-Conflict Reconstruction in MENA.” MENA Economic Monitor. Washington, DC: World Bank.
———. 2017x. “Jobs for North Lebanon: Value Chains, Labor Markets, Skills and Investment Climate in Tripoli and the North of Lebanon (Vol. 2).” World Bank, Washington, DC.
———. 2017y. India Development Update. Washington, DC: World Bank.
———. 2017z. “Growth out of the Blue.” South Asia Development Focus. Washington, DC: World Bank.
———. 2017aa. “Economic Impact of Floods.” India Monthly Economic Update. Washington, DC: World Bank.
———. 2017ab. “Creating Opportunities and Managing Risks for Sustained Growth.” Sri Lanka Development Update. Washington, DC: World Bank.
———. 2017ac. “Towards More, Better and Inclusive Jobs.” Bangladesh Development Update. Washington, DC: World Bank.
———. 2017ad. “Creating Opportunities and Managing Risks for Sustained Growth.” Sri Lanka Development Update. Washington, DC: World Bank.
———. 2017ae. “Innovation for Productivity and Inclusiveness.” South Africa Economic Update. Washington, DC: World Bank.
———. 2017af. “Africa’s Pulse.” Volume 15. World Bank, Washington, DC.
———. 2017ag. “Africa’s Pulse.” Volume 16, October. World Bank, Washington, DC.
———. 2017ah. World Development Indicators 2017. Washington, DC: World Bank.
World Economic Forum. 2017. Global Economic Competitiveness Report 2017–2018. Geneva: World Economic Forum.