Embed Size (px)
Citation preview

Harold E. Addy, Jr.Glenn Research Center, Cleveland, Ohio
Andy P. BroerenUniversity of Illinois at Urbana-Champaign, Urbana, Illinois
Joseph G. ZoecklerGlenn Research Center, Cleveland, Ohio
Sam LeeQSS Group, Inc., Cleveland, Ohio
A Wind Tunnel Study of Icing Effectson a Business Jet Airfoil
NASA/TM—2003-212124
February 2003
AIAA–2003–0727
https://ntrs.nasa.gov/search.jsp?R=20030032495 2020-05-26T03:16:51+00:00Z

The NASA STI Program Office . . . in Profile
Since its founding, NASA has been dedicated tothe advancement of aeronautics and spacescience. The NASA Scientific and TechnicalInformation (STI) Program Office plays a key partin helping NASA maintain this important role.
The NASA STI Program Office is operated byLangley Research Center, the Lead Center forNASA’s scientific and technical information. TheNASA STI Program Office provides access to theNASA STI Database, the largest collection ofaeronautical and space science STI in the world.The Program Office is also NASA’s institutionalmechanism for disseminating the results of itsresearch and development activities. These resultsare published by NASA in the NASA STI ReportSeries, which includes the following report types:
• TECHNICAL PUBLICATION. Reports ofcompleted research or a major significantphase of research that present the results ofNASA programs and include extensive dataor theoretical analysis. Includes compilationsof significant scientific and technical data andinformation deemed to be of continuingreference value. NASA’s counterpart of peer-reviewed formal professional papers buthas less stringent limitations on manuscriptlength and extent of graphic presentations.
• TECHNICAL MEMORANDUM. Scientificand technical findings that are preliminary orof specialized interest, e.g., quick releasereports, working papers, and bibliographiesthat contain minimal annotation. Does notcontain extensive analysis.
• CONTRACTOR REPORT. Scientific andtechnical findings by NASA-sponsoredcontractors and grantees.
• CONFERENCE PUBLICATION. Collectedpapers from scientific and technicalconferences, symposia, seminars, or othermeetings sponsored or cosponsored byNASA.
• SPECIAL PUBLICATION. Scientific,technical, or historical information fromNASA programs, projects, and missions,often concerned with subjects havingsubstantial public interest.
• TECHNICAL TRANSLATION. English-language translations of foreign scientificand technical material pertinent to NASA’smission.
Specialized services that complement the STIProgram Office’s diverse offerings includecreating custom thesauri, building customizeddatabases, organizing and publishing researchresults . . . even providing videos.
For more information about the NASA STIProgram Office, see the following:
• Access the NASA STI Program Home Pageat http://www.sti.nasa.gov
• E-mail your question via the Internet [email protected]
• Fax your question to the NASA AccessHelp Desk at 301–621–0134
• Telephone the NASA Access Help Desk at301–621–0390
• Write to: NASA Access Help Desk NASA Center for AeroSpace Information 7121 Standard Drive Hanover, MD 21076

Harold E. Addy, Jr.Glenn Research Center, Cleveland, Ohio
Andy P. BroerenUniversity of Illinois at Urbana-Champaign, Urbana, Illinois
Joseph G. ZoecklerGlenn Research Center, Cleveland, Ohio
Sam LeeQSS Group, Inc., Cleveland, Ohio
A Wind Tunnel Study of Icing Effectson a Business Jet Airfoil
NASA/TM—2003-212124
February 2003
National Aeronautics andSpace Administration
Glenn Research Center
Prepared for the41st Aerospace Sciences Meeting and Exhibitsponsored by the American Institute of Aeronautics and AstronauticsReno, Nevada, January 6–9, 2003
AIAA–2003–0727

Available from
NASA Center for Aerospace Information7121 Standard DriveHanover, MD 21076
National Technical Information Service5285 Port Royal RoadSpringfield, VA 22100
Available electronically at http://gltrs.grc.nasa.gov
The Propulsion and Power Program atNASA Glenn Research Center sponsored this work.
Acknowledgments
The authors wish to express their sincere gratitude to Mr. David Justavick and the technicians at theNASA Glenn Icing Research Tunnel, model craftsmen Mr. Daniel Gura and Mr. Robert Reminder,
Ms. Pamela Phillips, Mr. William Sewall and the technicians at the NASA Langley Low TurbulencePressure Tunnel without whose outstanding support, expertise, and dedication this work
could not have been completed.

NASA/TM�2003-212124 1
A WIND TUNNEL STUDY OF ICING EFFECTS ON A BUSINESS JET AIRFOIL
Harold E. Addy, Jr.,∗ Andy P. Broeren,� Joseph G. Zoeckler,� and Sam Lee§
∗�National Aeronautics and Space Administration, Glenn Research Center, Cleveland, Ohio �University of Illinois at Urbana-Champaign, Urbana, Illinois
§QSS Group, Inc., Cleveland, Ohio
ABSTRACT
Aerodynamic wind tunnel tests were conducted to study the effects of various ice accretions on the aerodynamic performance of a 36-inch chord, two-dimensional business jet airfoil. Eight different ice shape configurations were tested. Four were castings made from molds of ice shapes accreted in an icing wind tunnel. Two were made using computationally smoothed tracings of two of the ice shapes accreted in the icing tunnel. These smoothed profiles were then extended in the spanwise direction to form a two-dimensional ice shape. The final two configurations were formed by applying grit to the smoothed ice shapes. The ice shapes resulted in as much as 48% reduction in maximum lift coefficient from that of the clean airfoil. Large increases in drag and changes in pitching moment were also observed. The castings and their corresponding smoothed counterparts yielded similar results. Little change in performance was observed with the addition of grit to the smoothed ice shapes. Changes in the Reynolds number (from 3×10⁶ to 10.5×10⁶) and Mach number (from 0.12 to 0.28) did not significantly affect the iced-airfoil performance coefficients.
NOMENCLATURE α Airfoil angle-of-attack c Airfoil chord length Cd Drag coefficient Cl Lift coefficient Cl,ma Maximum lift coefficient, coincident with αstall
Cm Quarter-chord pitching-moment coefficient Ma Freestream Mach number Re Reynolds number based on chord x Chordwise position along airfoil LWC Liquid water content MVD Median volumetric diameter IRT Icing Research Tunnel LTPT Low Turbulence Pressure Tunnel
INTRODUCTION In the 1990’s, the Icing Branch at NASA’s Glenn Research Center, in conjunction with the FAA’s Technical Center, embarked on an effort to investigate the range of shapes and sizes of inflight ice that might accrete on various newer airfoils. At that time, the existing ice shape information was limited primarily to older airfoil sections or simpler airfoils such as the symmetric NACA-0012. Although many of these airfoils are still in use, there was a need to find whether or not the newer airfoil designs accreted ice and affected their performance differently. Among the goals of the effort were to collect ice shape data for computer ice accretion code validation and to study the effects of the ice on aerodynamic performance. Industry was surveyed to find airfoils suitable for the study. Three airfoils were selected: one representative of a commercial transport horizontal tailplane, one representative of a business jet main wing, and one representative of a general aviation aircraft main wing. A 36-inch chord, two-dimensional model of each airfoil was built and tested under various, FAR Part 25, Appendix C, icing conditions in NASA Glenn’s Icing Research Tunnel (IRT). The ice shapes were recorded using photographs, ice tracings, and, for selected shapes, molds. Aerodynamic performance measurements were also made for a portion of the test runs. Results of these tests were documented by Addy.1 Wright and Rutkowski2 conducted an extensive study of how these ice shapes, along with others, compared with those predicted by LEWICE 2.0,3 a computer ice accretion code. In general, agreement between the ice tracings and the corresponding computationally predicted shapes was quite good. As mentioned earlier, some aerodynamic performance measurements were made in the IRT. However, the icing cloud in the IRT did not always fill the entire test section, resulting in ice shapes that tapered off near the walls. These non-representative ice shapes near the walls might have significantly altered the performance measurements. Therefore, molds were
∗ Research Engineer, Icing Branch, Member AIAA. � Post-Doctoral Research Scientist, Department of Aeronautical and Astronautical Engineering, Member AIAA. � Operations Engineer, Space Mechanical Engineering Branch. § Research Engineer, Icing Branch, Member AIAA.

NASA/TM�2003-212124 2
made of the ice at the center of the airfoil for several selected ice shapes. Castings were made from these molds and placed on a similar model in an aerodynamic wind tunnel better suited to make the aerodynamic performance measurements. Aerodynamic performance measurements were made with various ice shapes on both the general aviation model and the business jet model. Results from the tests with the general aviation model were documented by Addy1 and by Addy and Chung.4 This paper presents results from the aerodynamic performance measurements made with the business jet model. Aerodynamic performance measurements have not been conducted in an aerodynamic tunnel with the commercial transport model. The performance measurements made in the aerodynamic wind tunnel are more comprehensive and are more accurate than those made in the IRT. Therefore, the results presented here are from the aerodynamic wind tunnel only.
TEST DESCRIPTION FACILITY The wind tunnel used for these tests was NASA Langley Research Center’s Low Turbulence Pressure Tunnel (LTPT). Shown schematically in Fig. 1, the LTPT is a closed return wind tunnel that is principally used for two-dimensional airfoil testing.5,6 It can be operated at stagnation pressures from near vacuum to 147 psia and over a Mach number range of 0.05 to 0.40. The maximum Reynolds number is dependent upon Mach number. For example, the maximum Reynolds number per foot is 15×106 at a Mach number of 0.22. A heat exchanger and nine turbulence reduction screens are located in the settling chamber. The contraction ratio is 17.6:1 and the test section dimensions are 36-inches wide by 90-inches high by 90-inches long. The tunnel was designed for two-dimensional airfoil testing with model chord lengths up to 36-inches.5 The free stream turbulence levels have been measured at less than 0.1% for all operating conditions.6
The airfoil model was supported horizontally across the width of the test section between two 40-inch diameter circular endplates. The endplates were flush with the sidewalls and rotated for angle-of-attack adjustment. They also contained a section of porous plate for sidewall boundary layer control. This sidewall venting system was originally developed for testing high lift airfoil configurations. A detailed description of the system is given by Paschal, et al.7 During this study, some runs were performed with and without sidewall venting. There was very little difference in the results. The LTPT was equipped with a three-component force balance. However, it was designed for operation with high lift systems and for higher
dynamic pressures than were run in this experiment. Therefore, the data from the force balance were deemed unreliable except at the higher dynamic pressures, and the lift and pitching moment data were obtained from the integration of surface static pressures. These data were compared to the force balance data for large values of dynamic pressure and excellent agreement was observed for both clean and iced configurations. Therefore, no force balance data are presented here. The pitching moment coefficient reported here was determined for the quarter chord location. Drag coefficients were calculated from wake pressures measured with a wake probe using the standard momentum deficit method. Due to the rather long length of time required to complete a wake traverse, the number of angles-of-attack where wake surveys were conducted was limited. Corrections to the integrated performance coefficients accounting for solid and wake blockage and streamline curvature were applied to the data during post processing using the methods of Allen and Vincenti.8 AIRFOIL The business jet main wing airfoil used in these tests was based upon a GLC-3059 airfoil. This airfoil was designed for low transonic drag and had a maximum thickness to chord ratio of 8.7%. Its cross section is shown in Fig. 2. The two-dimensional model used in these tests had a 36-inch chord and 36-inch span. It was machined from solid aluminum. Channels were made for pressure taps and tubing. The pressure taps were installed in both the chordwise and spanwise directions. The model was also designed with removable leading edges. There were two leading edge designs: a baseline leading edge for the clean model testing and an alternate leading edge that allowed installation of the castings that replicated the ice accreted in the IRT. The removable leading edge design resulted in a spanwise-running seam on the upper surface at x/c = 0.028 and on the lower surface at x/c = 0.215. Another removable section was required to facilitate model installation and this resulted in an additional upper surface seam at x/c = 0.111. Alignment of these edges was very good and no obvious detrimental effects in the performance data were observed. ICE SHAPES Ice shapes were accreted on the GLC-305 airfoil in the IRT over a range of icing conditions selected from the FAA’s FAR Part 25-Appendix C Atmospheric Icing Conditions. Even though the 36-inch chord of the model was not typical of a business jet main wing, the icing conditions were not scaled. At the time of the ice accretion tests, methods of icing scaling for model size

NASA/TM�2003-212124 3
had not been validated. Airspeeds and model attitudes typical of a business jet aircraft were used. Molds10 were made of selected ice shapes formed during these tests. Castings were made from four of these molds for the aerodynamic tests in the LTPT. Figure 3 shows tracings made at the model centerline of the four ice shapes. The molds were made at center-span of the model and covered from ten to twelve inches of span of the ice shape. This mold covered enough of the span of the ice to sufficiently reproduce the variation in ice along the span of the model. The spanwise variation in ice shape was small such that when three to four castings were made from the same mold and placed side by side across the span of the LTPT model, no significant discontinuities were present. The icing conditions under which these ice shapes were accreted are given in Table 1.
Table 1. Icing Conditions
Exposure
Ice Vel AOA Tt MVD LWC Time
Shape kts. deg deg F m-6 g/m3 min.
202 175 6 30 20 0.54 2.0
212 175 6 12 20 0.40 16.7
944 175 4 30 20 0.54 22.5
904 175 6 30 20 0.54 22.5
In addition to the castings, two smooth ice shapes of constant cross section were manufactured and tested. These smoothed shapes were made from tracings of ice that was also used to make the castings. Separate test runs were made using the same icing conditions. One was used to make the ice tracing and the other was used to make the ice mold. The tracings were first digitized using a digitizing tablet, and then smoothed using a computational routine known as SmaggIce.11 The resulting smoothed tracings are shown in Fig. 4. These smoothed tracings were then projected in the spanwise direction with a computer aided design program and then manufactured using a laser sintering rapid prototyping technique. The effects of the smoothing process are not apparent in the cross sections shown in Fig. 4 for several reasons. First, the tracings, made with a pencil, did not pick up the finer features (those less than the diameter of the pencil lead in dimension) of the ice. Secondly, the amount of smoothing applied by SmaggIce was very slight, only removing the sharpest corners. Finally, the smoothing in the spanwise direction, accomplished by extending the smoothed cross section laterally, was significant and constituted a major difference between the a casting and corresponding smoothed ice shape. This feature does not appear in the cross section views of the ice shapes.
The smooth ice shapes (212 and 944) were tested in both the as-manufactured condition and with No. 30 grit applied to their surfaces. This exercise was conducted as a cursory look at whether aerodynamic performance could be significantly altered by the presence of a smaller, ice-like feature on the smooth ice shape. No. 30 grit was chosen because its size is similar to that of typical real ice roughness. An adhesive was brushed onto the smooth ice shapes and grit was applied in a sparse pattern similar to real ice. The ice shape castings were mounted on the alternate leading edges. Since the castings were made from molds of the ice at the center of the model in the IRT, the castings were repeated such that the ice shapes spanned the entire width of the model. In addition, an “instrumentation slice” was installed near the model mid-span. The instrumentation slice was cut out of stainless steel to match the smoothed ice shape cross-section and had pressure taps distributed around the ice shape contour. This allowed for a good approximate measurement of the pressure distribution around the ice shape and provided pressures for determination of the lift and pitching moment coefficients. The baseline model had 93 static pressure orifices along the main chordwise row and 20 orifices in a spanwise row located at x/c = 0.70 on the upper surface. The photograph in Fig. 5 shows the model mounted in the test section, with ice shape and pressure instrumentation slice attached to the airfoil leading edge. AERODYNAMIC CONDITIONS The test matrix for the LTPT tests was selected to yield a broad range of Reynolds and Mach numbers with the high end being applicable to those experienced by a modern business jet flying in typical icing conditions as constrained by the limitations of the facility. Reynolds numbers ranged from 3×10⁶ to 10.5×10⁶, while Mach numbers ranged from 0.12 to 0.28. The test matrix was designed to isolate the effects of Reynolds and Mach number. Therefore, there is a Reynolds number variation from 3.0×10⁶ to 10.5×10⁶ at a fixed Mach number of 0.12. Similarly, there is a Mach number variation from 0.12 to 0.28 at constant Reynolds numbers of 6.0x10⁶ and 10.5×10⁶. The combinations of Mach and Reynolds numbers are given in Table 2. Note that not all combinations of Mach and Reynolds numbers were run for all ice shape configurations due to tunnel and test time limitations. The below atmospheric pressure capability of the LTPT was not utilized for this test. Sidewall venting was typically employed when testing at above atmospheric pressures in the tunnel.

NASA/TM�2003-212124 4
Table 2. LTPT Airflow Conditions
Mach No.
Re No. 0.12 0.21 0.28
3x106 X
3.5 X
4.5 X
6 X X X
7.5 X X
10.5 X X X
RESULTS AND DISCUSSION CLEAN AIRFOIL RESULTS
The clean performance of the GLC-305 airfoil generally exhibited classic Reynolds and Mach number behavior. Establishing the clean baseline performance of this airfoil was important since no experimental data of this kind were available in the public domain to the authors’ knowledge. The effect of Reynolds number on the performance at a constant Mach number of 0.12 is summarized in Fig. 6. There was a significant increase in lift curve slope, maximum lift and stalling angle-of-attack between Re = 3.0×10⁶ and 6.0×10⁶. The Cl,max increased from 1.09 to 1.35 over this Re range. As the Reynolds number was increased to 10.5×10⁶, the stall type changed from a leading edge type to a trailing edge stall. Using the stall type definitions established by McCullough and Gault,12 the sharp drop off in Cl for Re = 3.0×10⁶ and 6.0×10⁶ post maximum lift was indicative of a leading edge stall caused by the bursting of small laminar separation bubble that formed near the airfoil leading edge. For Re = 10.5×10⁶ the stall characteristics were consistent with the trailing edge type caused by the gradual forward movement of boundary layer separation from the trailing edge with increasing angle-of-attack. The lift and pitching moment data indicated that the GLC-305 airfoil was a front loaded section that was not highly cambered. The zero lift angle-of-attack was only about –1 deg. and the pitching moment coefficients were small and nearly constant over the linear range of the lift curve.
The variation in the section drag coefficients over this Reynolds number range is also summarized in Fig. 6. An apparent anomaly exists in these data since the drag values for α = 0 and 2 deg. were lowest at Re = 3.0×10⁶. For angles-of-attack greater than two deg., the Cd at this Reynolds number was higher than the Cd for Re = 6.0×10⁶ and 10.5×10⁶, as expected. The apparent anomaly in the Re = 3.0×10⁶ case is not unprecedented. For example, Abbot and von Doenhoff13 show drag data for the NACA 0006 and 0009 airfoils that exhibited analogous behavior between
Re = 3.0×10⁶ and 6.0×10⁶. The NACA airfoils had thickness ratios of 6% and 9%, respectively, while the GLC-305 airfoil had a thickness to chord ratio of 8.7%. This behavior in the drag was also investigated using XFOIL14 and similar results were observed. Longer runs of laminar flow along the airfoil surface are expected at the lower free stream Reynolds number, provided the flow does not separate and form a bubble. Usually, the reduced drag benefit of an extended laminar boundary layer is offset by separation of the turbulent boundary layer near the trailing edge. However, for the low angles-of-attack on these thin airfoils, the boundary layer separation was minimal such that the drag was lower for Re = 3.0×10⁶.
Compressibility effects on the performance of the clean GLC-305 airfoil were investigated over a Mach number range of 0.12 to 0.28 at a constant Re = 10.5×10⁶ and these data are shown in Fig. 7. As with the Reynolds number behavior, classic Mach number trends were also observed. Most noticeably, there was a significant reduction in maximum lift coefficient and stalling angle-of-attack between Ma = 0.21 and 0.28. Unfortunately, data at Ma = 0.28 could not be acquired for angles-of-attack larger than 12 deg. This was a limitation imposed by the facility due to the unsteady flow associated with the stall and the large dynamic pressure associated with this Mach number. The classic increase in lift curve slope with increasing Mach number was not as apparent as was the analogous effect on the pitching moment. The effect of increasing Mach number on the drag was most apparent for angles-of-attack larger than six deg., but still followed classic trends.
These independent effects of Reynolds and Mach number on the clean airfoil performance were consistent with previous LTPT experiments. For example, Ladson15 analyzed data from the testing of a NACA 0012 airfoil having a 24-inch chord, acquired with solid sidewalls (no sidewall boundary layer control) over a large range of Reynolds and Mach numbers. The similarity in the variation in maximum lift with Reynolds number at constant Mach number is shown in Fig. 8. These similarities exist despite the differences in the airfoil section and model geometries. The variation with Mach number was nearly identical, with each airfoil’s Cl,max decreasing by about 0.30 over the range indicated in Fig. 9. The large decrease in maximum lift between Ma = 0.21 and 0.28 corresponded to an increase in the minimum pressure (Cp,min) measured on the airfoil. The “critical Cp” shown in Fig. 10 is the Cp corresponding to a local Mach number equal to 1.0 for a given free stream Mach number.16 The minimum Cp for the Ma = 0.28 case in Fig. 10, was at the stalling angle-of-attack for this case. The magnitude reduction of the minimum pressure peak for local sonic Mach numbers is consistent with previous studies as the airfoil is unable to support the transonic flow.17,18,19

NASA/TM�2003-212124 5
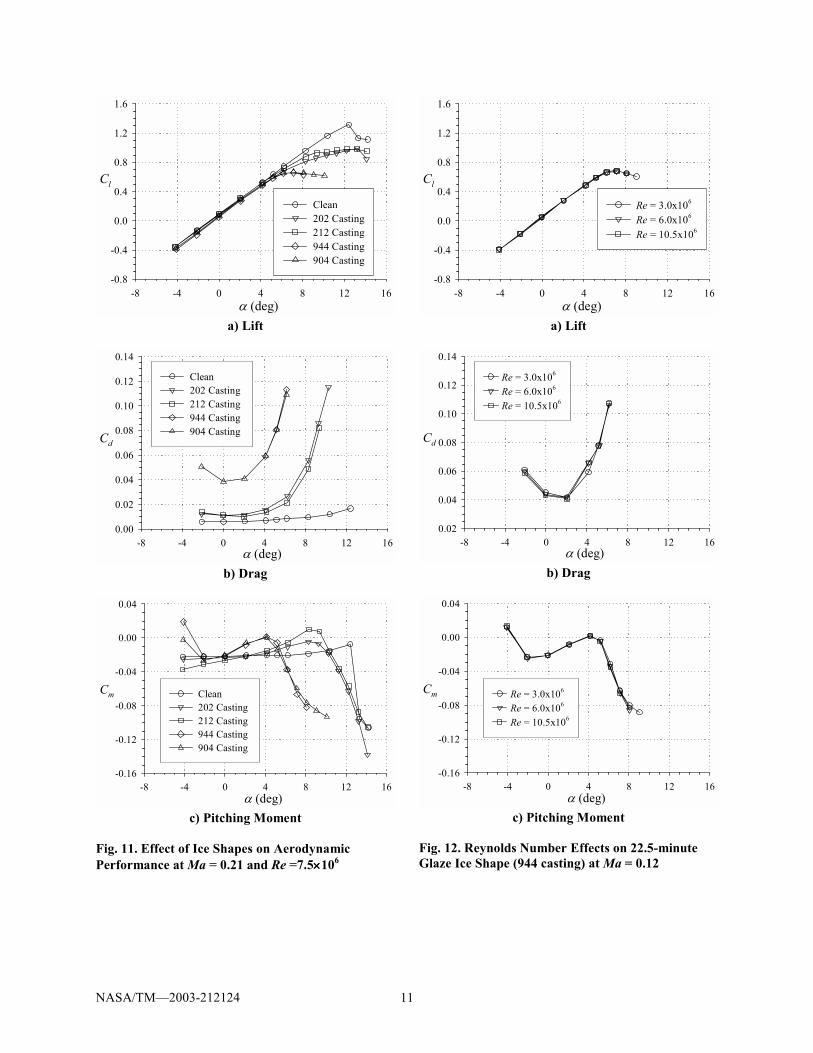
ICED AIRFOIL RESULTS The effects of the different cast ice shapes on lift coefficient are shown in Fig. 11a. It is interesting to note that the two-minute glaze ice shape (202 casting) has nearly the same effect on lift coefficient as the 16.7-minute rime shape (212 casting). In both cases, the maximum lift coefficient is reduced by approximately 20%. The two 22.5-minute glaze ice shapes (904 and 944 castings) also have very similar effects on lift coefficient even though the two shapes were formed at different angles-of-attack, but under the same icing conditions. Here the reduction in maximum lift coefficient is much greater, approximately 48%. The effects of the cast ice shapes on drag and pitching moment are shown in Figs. 11b and 11c. Here again, the similarities between the two-minute glaze shape and the 16.7-minute rime shape and the two 22.5-minute glaze shapes are apparent, although the difference in pitching moment between the two-minute glaze shape and 16.7-minute rime shape is more evident. Because it acts as a leading edge extension, the rime shape generates more lift before stall than the two-minute glaze shape. This effect can be seen in the pitching moment coefficient as the rime ice shape produces a more nose up moment condition. The effects of varying Reynolds number on three of the cast ice shapes are shown in Figs. 12, 13, and 14. In contrast to the clean ice shape where a strong dependence of performance on Reynolds number was observed, little or no dependence of performance on Reynolds number was observed for these ice shapes. Only on the smallest ice shape, the two-minute glaze shape, was a very small difference in maximum lift coefficient observed. For a clean airfoil, maximum lift and stall characteristics are largely determined by boundary layer transition and separation that are in turn governed by Reynolds number. For an iced airfoil, boundary layer separation is generally fixed by the size and location of the ice shape. Therefore, it follows that iced airfoil performance characteristics are less sensitive to changes in Reynolds number. Mach number effects on the same three cast ice shapes are shown in Figs. 15, 16, and 17. Similar to the clean airfoil, small but noticeable Mach number effects are observed for the ice shapes. This behavior has also been observed in previous tests. While this type of compressibility effect has been widely observed at Mach numbers greater than 0.30, the effect is generally negligible at Mach numbers below this level. The present data show that small, but noticeable compressibility effects can be measured at lower Mach numbers as well. The more significant point here is that Mach number, a measure of airspeed relative to the speed of sound, tends to have a similar effect on the airfoil performance coefficients regardless of whether or not it is ice contaminated. This is in contrast to the
Reynolds number, a measure of viscous effects, that has a large effect on the clean airfoil, but virtually no effect when it is ice contaminated.
The independent effects of Reynolds and Mach numbers on the maximum lift performance of the iced GLC-305 airfoil are summarized in Figs. 18 and 19. The Reynolds number trends given in Figs. 12 through 14 were indicative of the other configurations tested as well. In particular, Fig. 18 shows that Reynolds number changes did not affect the difference in maximum lift between the airfoil with the 944 casting and the airfoil with the 944 smoothed shape. On the other hand, the minor increase in Cl,max from Re = 3.0×10⁶ to 10.5×10⁶ for the airfoil with the 212 casting, did not occur for the smoothed ice shape. Figure 19 shows that the maximum lift for all of the iced configurations tended to decrease as the Mach number increased and this trend is consistent with the clean case. The opposite is true of the Reynolds number effect where the iced configurations tended to have maximum lift values that were, for the most part, insensitive to Reynolds number changes. The Reynolds and Mach number trends observed for the iced airfoil cases are consistent with previous research. For example, Morgan, et al.20 carried out iced airfoil performance measurements on a multi-element super-critical airfoil. A large glaze ice simulation made of wood was tested as well as simulated frost that consisted of 70-grit roughness. Performance measurements were carried out with all airfoil elements nested (cruise configuration) at a constant Mach number of 0.20 with Re = 3.0×10⁶ to 12.0×10⁶. The results showed minor changes in maximum lift over the entire Reynolds number range for the iced airfoil cases. In another study, Addy and Chung4 tested glaze ice simulations on an NLF-0414 airfoil in the LTPT. The simulations consisted of castings produced from ice accretions and corresponding smoothed shapes (similar to the present study). The ice accretions resulted from a 6-minute and 22.5 minute exposure to the same cloud conditions. For three of the four iced airfoil configurations tested, there was virtually no variation in Cl,max for Re = 4.6×10⁶ to 10.5×10⁶, at a constant Mach number of 0.21. The authors also reported similar Mach number trends in maximum lift behavior in the iced airfoil configurations at Re = 6.4×10⁶. More recently, Broeren, et al.21 carried out performance measurements on a NACA 23012 airfoil with intercycle ice castings. In this case there was a slight increase in Cl,max (less than 0.05) between Re = 2.0×10⁶ and 3.5×10⁶, but no further increase in Cl,max up to Re = 10.5×10⁶ was observed for all four iced airfoil configurations. Also similar to the present data, the iced airfoil maximum lift coefficient tended to decrease with increasing Mach number at a constant Re = 10.5×10⁶.

NASA/TM�2003-212124 6
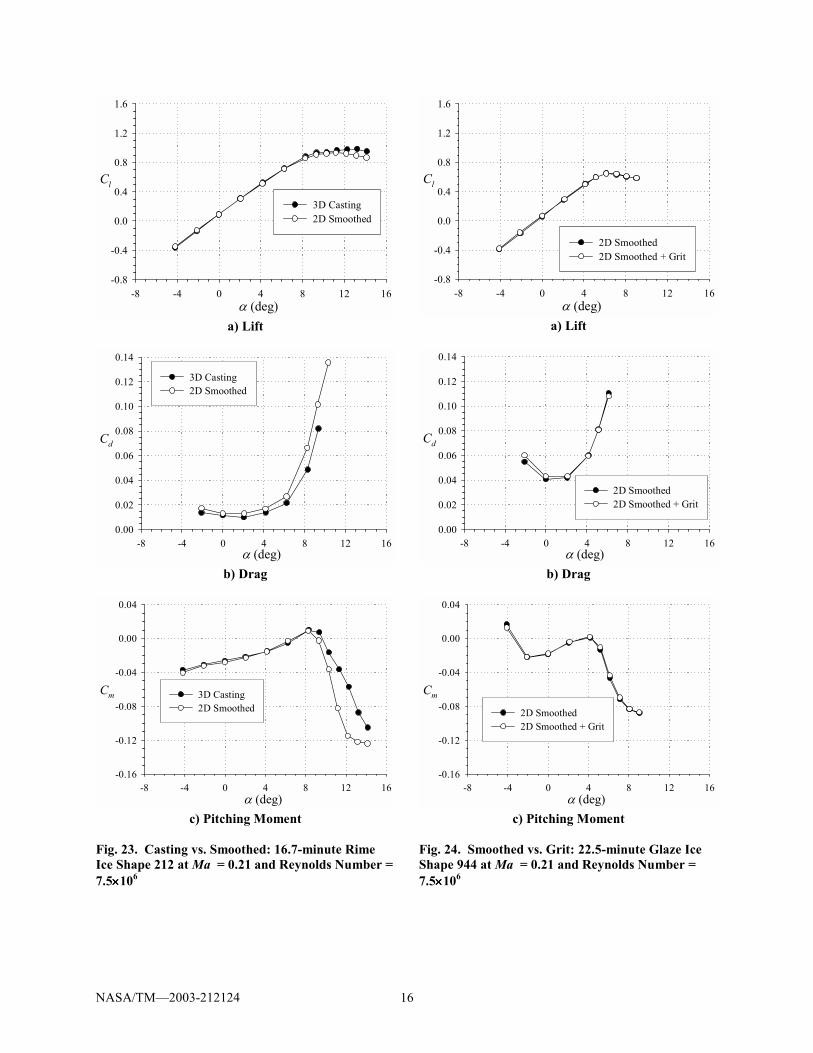
Some insight into the iced airfoil Reynolds and Mach number effects can be gleaned from the surface pressure distributions. Figure 20 compares the Cp distributions on the airfoil with the 944 smoothed shape at 4 deg. angle-of-attack for two different Reynolds numbers. Both curves are indicative of a separation bubble flowfield aft of the large glaze ice shape (e.g., see Bragg, et al.22). The constant pressure region on the upper surface between x/c = -0.02 and 0.16 indicates flow separation from the ice shape. As the Cp increases, transition occurs in the separated shear layer and the bubble reattaches further downstream. The pressure recovery region for Re = 3.5×10⁶ is slightly upstream of the recovery region for Re = 10.5×10⁶. This may imply that the separation bubble reattachment location was also slightly upstream at the lower Reynolds number. Figure 21 shows the effect of increasing the Mach number at constant Reynolds number. In this case, the increase in Mach number also has a small effect on the Cp values in the constant pressure region. Comparison of the recovery region also implies that the bubble reattachment location may be further downstream for the higher Mach number case. As was mentioned previously, for two of the ice shapes, the 22.5-minute glaze shape 944 and the 16.7-minute rime shape 212, smoothed, two-dimensional ice shapes were made. Performance results for the castings and their smoothed counterparts are given in Figs. 22 and 23. The differences between the lift, drag, and pitching moment coefficients for the cast and smoothed, 22.5-minute glaze ice 944 shapes are very small, as shown in Fig. 22. There is more of a difference in the performance curves between the cast and smoothed, 16.7-minute rime ice shapes 212 at the higher angles-of-attack. For instance, the maximum lift coefficient for the smoothed shape is 5% lower than that for the cast ice shape. Here, the three-dimensional features of the cast ice shape may have enhanced mixing of the shear layer, promoting reattachment that resulted in slightly higher lift. This difference is small, however, particularly in comparison to the difference between these ice shapes and the clean airfoil, where there was a 22% reduction in maximum lift coefficient. Whether this difference is small enough for modeling purposes is dependent upon the application. These results for the cast versus smoothed ice shapes are, however, in contrast to results found with the general aviation airfoil as described in Reference 3. In that study, the maximum lift coefficients differed by 9% between the cast and smoothed shapes for both a six-minute and a 22.5-minute glaze ice shape. Perhaps more significantly, the cast ice shapes generated greater performance degradation than the smoothed ice shapes, which was unexpected. Apparently, the shear layer mixing that promotes reattachment either did not occur or was overridden by another unexplained phenomenon. The two airfoils used in these two studies
do have different designs and performance characteristics that could contribute to the different results. However, different degrees of smoothing were also employed. Using the smoothing technique of SmaggIce,10 50% control points were used for the six-minute ice shape in the general aviation airfoil study and 30% control points were used for the 22.5-minute glaze ice shape. For the smoothed ice shapes in this business jet airfoil study, 100% control points were used. (In SmaggIce, the higher the percentage of control points assigned to the digitized ice shape, the closer the smoothed shape is to the original, digitized ice tracing.) While further investigation is warranted, these results suggest that an overly smoothed ice shape can lead to less precise results. To further investigate the effects of smaller ice features on aerodynamic performance, a sparse distribution of No. 30 grit was applied to each of the smoothed ice shapes while installed on the model in the tunnel and the set of aerodynamic conditions were rerun. Results of these tests are shown in Figs. 24 and 25. In neither the 16.7-minute rime ice shape case nor the 22.5-minute glaze ice shape 944 case, did the addition of the grit have much of an effect, if any, on the performance results. There was a slight increase in drag at angles-of-attack of zero and below for the smoothed glaze ice shape 944. For the smoothed rime ice shape, the presence of the grit generated a difference in the pitching moment curves in the post stall region. Otherwise, the performance curves for the grit and no-grit cases lay on top of each other. It should be noted that the process of selecting and applying material in order to reproduce the effects of ice roughness is more an art than a science. It is possible that a different grit size and/or distribution could produce slightly different results in performance degradation. CONCLUDING REMARKS Wind tunnel tests were conducted with a two-dimensional business jet airfoil. Four different cast ice shapes were attached to the leading edge of the airfoil to determine the degradation in lift, drag, and pitching moment coefficients due to various types of ice accretions on this model. In addition, two-dimensional, smoothed versions of two of the cast ice shapes (212 and 944) were also tested to help understand differences that might be caused by the three dimensional characteristics of natural ice accretions. Grit was also applied to the smoothed ice shapes and the tests repeated to investigate the effects of smaller ice features on aerodynamic performance. Results of the tests showed that the presence of the ice caused significant performance degradation. A two-minute glaze ice accretion reduced the maximum lift coefficient some 22% from the clean wing performance at Ma = 0.21 and Re = 7.5x10⁶.

NASA/TM�2003-212124 7
Interestingly, a 16.7-minute rime accretion resulted in similar lift coefficient degradation and lift coefficient versus angle-of-attack curve. Two 22.5-minute glaze ice shapes, accreted at the same icing conditions, but at two different model attitudes, 4 and 6 degrees, resulted in a 48% reduction in maximum lift coefficient and nearly identical lift coefficient versus angle-of-attack curves, also at Ma = 0.21 and Re = 7.5x10⁶. The tests were conducted in the Low Turbulence Pressure Tunnel at NASA Langley, which allowed the independent variation of Mach and Reynolds numbers. As expected, the clean airfoil exhibited varying performance with varying Re = 3.0 to 10.5x10⁶ at constant Ma = 0.12. However, with the ice shapes attached to the leading edge of the model, there was no variation in performance as a result of changing Reynolds number over the same range. This result supports the notion that ice accretions dominate the boundary layer behavior on iced airfoils. Mach number effects (from 0.12 to 0.28 at constant Re = 10.5x10⁶), although rather small, were observed for both the clean airfoil and with all the ice shapes used in the tests. The smoothed ice shapes 212 and 944 produced performance results very similar to their cast ice shape counterparts in this study. This result was in contrast to previous test results with smoothed ice shapes on the general aviation model. In addition to the different airfoils used, a different amount of smoothing was applied to the ice shapes in the two studies. Less smoothing was applied to the ice shapes in this study with the business jet airfoil, resulting in smoothed ice shapes much closer in profile to their cast ice shape counterparts. Finally, No. 30 grit applied to the smoothed ice shapes had very little effect on performance results. The process of selecting and applying artificial material in order to reproduce the effects of ice roughness is more an art than a science. It is possible that a different grit size and/or distribution could produce slightly different results in performance degradation.
REFERENCES
1. Addy, Jr., H. E., “Ice Accretions and Icing Effects for Modern Airfoils”, NASA TP 2000-210031, DOT/FAA/AR-99/89, April, 2000.
2. Wright, W. B. and Rutkowski, A., “Validation Results for LEWICE 2.0”, NASA CR 1999-208690, Jan. 1999.
3. Wright, W.B., “User Manual for the NASA Glenn Ice Accretion Code LEWICE Version 2.0”, NASA CR-1999-209409, Sept. 1999.
4. Addy, Jr., H. E. and Chung, J. J., “A Wind Tunnel Study of Icing Effects on a Natural Laminar Flow Airfoil”, AIAA Report No. 2000-0095, Jan., 2000.
5. Von Doenhoff, A.E., and Abbot, F.T., Jr., “The Langley Two-Dimensional Low-Turbulence Pressure Tunnel,” NACA TN 1283, May 1947.
6. McGhee, R.J., Beasley, W.D., and Foster, J.M., “Recent Modifications and Calibration of the Langley Low-Turbulence Pressure Tunnel,” NASA TP 2328, July 1984.
7. Paschal, K., Goodman, W., McGhee, R., Walker, B., and Wilcox, P.A., “Evaluation of Tunnel Sidewall Boundary-Layer-Control Systems for High-Lift Airfoil Testing,” AIAA Paper 91-3243, Sept. 1991.
8. Allen, H.J., and Vincenti, W.G., “Wall Interference in a Two-Dimensional-Flow Wind Tunnel, with Consideration of the Effect of Compressibility,” NACA Report No. 782, 1944.
9. Nixon, D., Editor, Transonic Aerodynamics, Progress in Astronautics and Aeronautics, Vol. 81, pp. 489-543, 1982.
10. Reehorst, A.L. and Richter, G.P., “New Methods and Materials for Molding and Casting Ice Formations”, NASA TM No. 100126, September, 1987.
11. Vickerman, M., Choo, Y., Braun, D., Baez, M., and Gnepp, S. “SmaggIce: Surface Modeling and Grid Generation for Iced Airfoils-Phase 1 Results”, AIAA Report No. 2000-0235, January 2000.
12. McCullough, G.B., and Gault, D.E., “Examples of Three Representative Types of Airfoil-Section Stall at Low Speed,” NACA TN-2502, Sept. 1951.
13. Abbott, I.H., and von Doenhoff, A.E., Theory of Wing Sections, Dover Publications, 1959, pp. 453-455.
14. Drela, M., “XFOIL 6.6 Users Primer,” MIT Aero and Astro Engineering, Mar. 14, 1996.
15. Ladson, C.L., “Effects of Independent Variation of Mach and Reynolds Numbers on the Low-Speed Aerodynamic Characteristics of the NACA 0012 Airfoil Section,” NASA TM-4071, Oct. 1988.
16. Anderson, J.D., Jr., Modern Compressible Flow with Historical Perspective, 2nd Ed., McGraw-Hill, New York, 1990, p. 279.
17. Wootton, L.R., “The Effect of Compressibility on the Maximum Lift Coefficient of Aerofoils at Subsonic Airspeeds,” Journal of the Royal Aeronautical Society, Vol. 71, July 1967, pp. 476-486.
18. Furlong, G.C., and Fitzpatrick, J.E., “Effects of Mach Number and Reynolds Number on the Maximum Lift Coefficient of a Wing of NACA 230-Series Airfoil Sections,” NACA TN-1299, May 1947.
19. Furlong, G.C., and Fitzpatrick, J.E., “Effects of Mach Number up to 0.34 and Reynolds Number up to 8×10⁶ on the Maximum Lift Coefficient of a Wing of NACA 66-Series Airfoil Sections,” NACA TN-2251, Dec. 1950.
20. Morgan, H.L., Jr., Ferris, J.C., and McGhee, R.J., “A Study High-Lift Airfoils in the Langley Low-Turbulence Pressure Tunnel,” NASA TM 89125, July 1987.
21. Broeren, A.P., Addy, H.E., Jr., and Bragg, M.B., “Effect of Intercycle Ice Accretions on Airfoil Performance,” AIAA Paper 2002-0240, Jan. 2002.
22. Bragg, M.B., Khodadoust, A., and Spring, S.A., “Measurements in a Leading-Edge Separation Bubble due to a Simulated Airfoil Ice Accretion,” AIAA Journal, Vol. 30, No. 6, June, 1992, pp. 1462-1467.

NASA/TM�2003-212124 8
Fig. 1. NASA Langley Low Turbulence Pressure Tunnel20
Fig. 2. Business Jet Airfoil
Fig. 3. Cast Ice Shapes
Fig. 4. Smoothed Ice Shapes
Fig. 5. Photograph of model in LTPT

NASA/TM�2003-212124 9
α (deg.)-8.0 -4.0 0.0 4.0 8.0 12.0 16.0 20.0
0.000
0.002
0.004
0.006
0.008
0.010
0.012
0.014
0.016
0.018
0.020
Cd
α (deg.)-8.0 -4.0 0.0 4.0 8.0 12.0 16.0 20.0
-0.8
-0.4
0.0
0.4
0.8
1.2
1.6
-0.10
-0.06
-0.02
0.02
0.06
0.10
0.14= 3.0×106
= 6.0×106
= 10.5×10⁶
ReReRe
Ma = 0.12
Cl Cm
Fig. 6 Effect of Reynolds number at constant Mach number on performance for the clean GLC-305 airfoil.
α (deg.)-8.0 -4.0 0.0 4.0 8.0 12.0 16.0 20.0
-0.8
-0.4
0.0
0.4
0.8
1.2
1.6
-0.10
-0.06
-0.02
0.02
0.06
0.10
0.14= 0.12= 0.21= 0.28
MaMaMa
Re = 10.5×10⁶
Cl Cm
α (deg.)-8.0 -4.0 0.0 4.0 8.0 12.0 16.0 20.0
0.000
0.002
0.004
0.006
0.008
0.010
0.012
0.014
0.016
0.018
0.020
Cd
Fig. 7 Effect of Mach number at constant Reynolds number on performance for the clean GLC-305 airfoil.

NASA/TM�2003-212124 10
(×106)0.0 2.0 4.0 6.0 8.0 10.0 12.0
1.0
1.1
1.2
1.3
1.4
1.5
1.6
1.7
1.8
1.9
2.0
Present Data (GLC-305), = 0.12Ladson Data (NACA 0012), = 0.15Ladson Data (NACA 0012), = 0.20Ladson Data (NACA 0012), = 0.25
MaMaMaMa
Cl,max
Re Fig. 8 Comparison of maximum lift Reynolds number dependence for the present study with the data of Ladson.15
Ma0.05 0.10 0.15 0.20 0.25 0.30 0.35
1.0
1.1
1.2
1.3
1.4
1.5
1.6
1.7
1.8
1.9
2.0
Present Data (GLC-305), = 10.5×10⁶
Ladson Data (NACA 0012), = 6.0×10⁶
Ladson Data (NACA 0012), = 9.0×10⁶
ReReRe
Cl,max
Fig. 9 Comparison of maximum lift Mach number dependence for the present study with the data of Ladson. 15
Ma0.05 0.10 0.15 0.20 0.25 0.30 0.35
-15.0
-14.0
-13.0
-12.0
-11.0
-10.0
-9.0
-8.0
-7.0
-6.0
Critcal CpGLC-305, = 10.5×10⁶
Cp,min
Re
Fig. 10 Comparison of measured minimum pressure variation with the Critical Cp curve.
NASA/TM�2003-212124 11
α (deg)-8 -4 0 4 8 12 16
Cl
-0.8
-0.4
0.0
0.4
0.8
1.2
1.6
Clean202 Casting212 Casting944 Casting904 Casting
a) Lift
α (deg)-8 -4 0 4 8 12 16
Cd
0.00
0.02
0.04
0.06
0.08
0.10
0.12
0.14
Clean 202 Casting212 Casting944 Casting 904 Casting
b) Drag
α (deg)-8 -4 0 4 8 12 16
Cm
-0.16
-0.12
-0.08
-0.04
0.00
0.04
Clean 202 Casting212 Casting944 Casting 904 Casting
c) Pitching Moment
Fig. 11. Effect of Ice Shapes on Aerodynamic Performance at Ma = 0.21 and Re =7.5××××106
α (deg)-8 -4 0 4 8 12 16
Cl
-0.8
-0.4
0.0
0.4
0.8
1.2
1.6
Re = 3.0x10⁶
Re = 6.0x10⁶
Re = 10.5x10⁶
a) Lift
α (deg)-8 -4 0 4 8 12 16
Cd
0.02
0.04
0.06
0.08
0.10
0.12
0.14
Re = 3.0x10⁶
Re = 6.0x10⁶
Re = 10.5x10⁶
b) Drag
α (deg)-8 -4 0 4 8 12 16
Cm
-0.16
-0.12
-0.08
-0.04
0.00
0.04
Re = 3.0x10⁶
Re = 6.0x10⁶
Re = 10.5x10⁶
c) Pitching Moment
Fig. 12. Reynolds Number Effects on 22.5-minute Glaze Ice Shape (944 casting) at Ma = 0.12

NASA/TM�2003-212124 12
α (deg)-8 -4 0 4 8 12 16
Cl
-0.8
-0.4
0.0
0.4
0.8
1.2
1.6
Re = 3.5x10⁶
Re = 6.0x10⁶
Re = 10.5x10⁶
a) Lift
α (deg)-8 -4 0 4 8 12 16
Cd
0.00
0.02
0.04
0.06
0.08
0.10
0.12
0.14
Re = 3.5x10⁶
Re = 6.0x10⁶
Re = 10.5x10⁶
b) Drag
α (deg)-8 -4 0 4 8 12 16
Cm
-0.16
-0.12
-0.08
-0.04
0.00
0.04
Re = 3.5x10⁶
Re = 6.0x10⁶
Re = 10.5x10⁶
c) Pitching Moment
Fig. 13. Reynolds Number Effects on Two-minute Glaze Ice Shape (202 casting) at Ma = 0.12
α (deg)-8 -4 0 4 8 12 16
Cl
-0.8
-0.4
0.0
0.4
0.8
1.2
1.6
Re = 3.5x10⁶
Re = 6.0x10⁶
Re = 10.5x10⁶
a) Lift
α (deg)-8 -4 0 4 8 12 16
Cd
0.00
0.02
0.04
0.06
0.08
0.10
0.12
0.14
Re = 3.5x10⁶
Re = 6.0x10⁶
Re = 10.5x10⁶
b) Drag
α (deg)-8 -4 0 4 8 12 16
Cm
-0.16
-0.12
-0.08
-0.04
0.00
0.04
Re = 3.5x10⁶
Re = 6.0x10⁶
Re = 10.5x10⁶
c) Pitching Moment
Fig. 14. Reynolds Number Effects on 16.7-minute rime ice shape (212 casting) at Mach Number = 0.12

NASA/TM�2003-212124 13
α (deg)-8 -4 0 4 8 12 16
Cl
-0.8
-0.4
0.0
0.4
0.8
1.2
1.6
Ma = 0.12Ma = 0.21Ma = 0.28
a) Lift
α (deg)-8 -4 0 4 8 12 16
Cd
0.00
0.02
0.04
0.06
0.08
0.10
0.12
0.14
Ma = 0.12Ma = 0.21Ma = 0.28
b) Drag
α (deg)-8 -4 0 4 8 12 16
Cm
-0.16
-0.12
-0.08
-0.04
0.00
0.04
Ma = 0.12Ma = 0.21Ma = 0.28
c) Pitching Moment
Fig. 15. Mach Number Effect on 22.5-minute Glaze Ice Shape (944 casting) at Reynolds Number = 10.5××××106
α (deg)-8 -4 0 4 8 12 16
Cl
-0.8
-0.4
0.0
0.4
0.8
1.2
1.6
Ma = 0.12Ma = 0.21Ma = 0.28
a) Lift
α (deg)-8 -4 0 4 8 12 16
Cd
0.00
0.02
0.04
0.06
0.08
0.10
0.12
0.14
Ma = 0.12Ma = 0.21Ma = 0.28
b) Drag
α (deg)-8 -4 0 4 8 12 16
Cm
-0.16
-0.12
-0.08
-0.04
0.00
0.04
Ma = 0.12Ma = 0.21Ma = 0.28
c) Pitching Moment
Fig. 16. Mach Number Effect on Two-minute Glaze Ice Shape (202 casting) at Reynolds Number = 10.5××××106

NASA/TM�2003-212124 14
α (deg)-8 -4 0 4 8 12 16
Cl
-0.8
-0.4
0.0
0.4
0.8
1.2
1.6
Ma = 0.12Ma = 0.21Ma = 0.28
a) Lift
α (deg)-8 -4 0 4 8 12 16
Cd
0.00
0.02
0.04
0.06
0.08
0.10
0.12
0.14
Ma = 0.12Ma = 0.21Ma = 0.28
b) Drag
α (deg)-8 -4 0 4 8 12 16
Cm
-0.16
-0.12
-0.08
-0.04
0.00
0.04
Ma = 0.12Ma = 0.21Ma = 0.28
c) Pitching Moment
Fig. 17. Mach Number Effect on 16.7-minute Rime Ice Shape(212 casting) at Reynolds Number = 10.5××××106
Fig. 18. Effect of Reynolds number on maximum lift for various GLC-305 airfoil configurations.
Fig. 19. Effect of Mach number on maximum lift for various GLC-305 airfoil configurations.
Ma0.05 0.10 0.15 0.20 0.25 0.30 0.35
0.0
0.2
0.4
0.6
0.8
1.0
1.2
1.4
1.6
CleanIce shape 202 castingIce shape 212 castingIce shape 212 smoothedIce shape 944 castingIce shape 944 smoothed
Re
Cl,max
= 10.5×10⁶
(×106)0.0 2.0 4.0 6.0 8.0 10.0 12.0
0.0
0.2
0.4
0.6
0.8
1.0
1.2
1.4
1.6
CleanIce shape 202 castingIce shape 212 castingIce shape 212 smoothedIce shape 944 castingIce shape 944 smoothed
Ma
Cl,max
= 0.12
Re

NASA/TM�2003-212124 15
Fig. 20. Reynolds number effect on pressure distributions for the GLC-305 airfoil with smoothed ice shape 944 at αααα = 4 deg.
Fig. 21. Mach number effect on pressure distributions for the GLC-305 airfoil with smoothed ice shape 944 at αααα = 4 deg.
α (deg)-8 -4 0 4 8 12 16
Cl
-0.8
-0.4
0.0
0.4
0.8
1.2
1.6
3D Casting2D Smoothed
a) Lift
α (deg)-8 -4 0 4 8 12 16
Cd
0.00
0.02
0.04
0.06
0.08
0.10
0.12
0.14
3D Casting2D Smoothed
b) Drag
α (deg)-8 -4 0 4 8 12 16
Cm
-0.16
-0.12
-0.08
-0.04
0.00
0.04
3D Casting2D Smoothed
c) Pitching Moment
Fig. 22. Casting vs. Smoothed: 22.5-minute Glaze Ice Shape 944 at Ma = 0.21 and Reynolds Number = 7.5××××106
x/c0.0 0.1 0.2 0.3 0.4 0.5 0.6 0.7 0.8 0.9 1.0
-2.0
-1.5
-1.0
-0.5
0.0
0.5
1.0
= 3.5×10⁶, = 0.12= 10.5×10⁶, = 0.12
Cp
Re MaRe Ma
x/c0.0 0.1 0.2 0.3 0.4 0.5 0.6 0.7 0.8 0.9 1.0
-2.0
-1.5
-1.0
-0.5
0.0
0.5
1.0
= 10.5×10⁶, = 0.12= 10.5×10⁶, = 0.28
Cp
Re MaRe Ma
NASA/TM�2003-212124 16
α (deg)-8 -4 0 4 8 12 16
Cl
-0.8
-0.4
0.0
0.4
0.8
1.2
1.6
3D Casting2D Smoothed
a) Lift
α (deg)-8 -4 0 4 8 12 16
Cd
0.00
0.02
0.04
0.06
0.08
0.10
0.12
0.14
3D Casting2D Smoothed
b) Drag
α (deg)-8 -4 0 4 8 12 16
Cm
-0.16
-0.12
-0.08
-0.04
0.00
0.04
3D Casting2D Smoothed
c) Pitching Moment
Fig. 23. Casting vs. Smoothed: 16.7-minute Rime Ice Shape 212 at Ma = 0.21 and Reynolds Number = 7.5××××106
α (deg)-8 -4 0 4 8 12 16
Cl
-0.8
-0.4
0.0
0.4
0.8
1.2
1.6
2D Smoothed2D Smoothed + Grit
a) Lift
α (deg)-8 -4 0 4 8 12 16
Cd
0.00
0.02
0.04
0.06
0.08
0.10
0.12
0.14
2D Smoothed2D Smoothed + Grit
b) Drag
α (deg)-8 -4 0 4 8 12 16
Cm
-0.16
-0.12
-0.08
-0.04
0.00
0.04
2D Smoothed2D Smoothed + Grit
c) Pitching Moment
Fig. 24. Smoothed vs. Grit: 22.5-minute Glaze Ice Shape 944 at Ma = 0.21 and Reynolds Number = 7.5××××106

NASA/TM�2003-212124 17
α (deg)-8 -4 0 4 8 12 16
Cl
-0.8
-0.4
0.0
0.4
0.8
1.2
1.6
2D Smoothed2D Smoothed + Grit
a) Lift
α (deg)-8 -4 0 4 8 12 16
Cd
0.00
0.02
0.04
0.06
0.08
0.10
0.12
0.14
2D Smoothed2D Smoothed + Grit
b) Drag
α (deg)-8 -4 0 4 8 12 16
Cm
-0.16
-0.12
-0.08
-0.04
0.00
0.04
2D Smoothed2D Smoothed + Grit
c) Pitching Moment
Fig. 25. Smoothed vs. Grit: 16.7-minute Rime Ice Shape 212 at Ma = 0.21 and Reynolds Number = 7.5××××106

This publication is available from the NASA Center for AeroSpace Information, 301–621–0390.
REPORT DOCUMENTATION PAGE
2. REPORT DATE
19. SECURITY CLASSIFICATION OF ABSTRACT
18. SECURITY CLASSIFICATION OF THIS PAGE
Public reporting burden for this collection of information is estimated to average 1 hour per response, including the time for reviewing instructions, searching existing data sources,gathering and maintaining the data needed, and completing and reviewing the collection of information. Send comments regarding this burden estimate or any other aspect of thiscollection of information, including suggestions for reducing this burden, to Washington Headquarters Services, Directorate for Information Operations and Reports, 1215 JeffersonDavis Highway, Suite 1204, Arlington, VA 22202-4302, and to the Office of Management and Budget, Paperwork Reduction Project (0704-0188), Washington, DC 20503.
NSN 7540-01-280-5500 Standard Form 298 (Rev. 2-89)Prescribed by ANSI Std. Z39-18298-102
Form Approved
OMB No. 0704-0188
12b. DISTRIBUTION CODE
8. PERFORMING ORGANIZATION REPORT NUMBER
5. FUNDING NUMBERS
3. REPORT TYPE AND DATES COVERED
4. TITLE AND SUBTITLE
6. AUTHOR(S)
7. PERFORMING ORGANIZATION NAME(S) AND ADDRESS(ES)
11. SUPPLEMENTARY NOTES
12a. DISTRIBUTION/AVAILABILITY STATEMENT
13. ABSTRACT (Maximum 200 words)
14. SUBJECT TERMS
17. SECURITY CLASSIFICATION OF REPORT
16. PRICE CODE
15. NUMBER OF PAGES
20. LIMITATION OF ABSTRACT
Unclassified Unclassified
Technical Memorandum
Unclassified
National Aeronautics and Space AdministrationJohn H. Glenn Research Center at Lewis FieldCleveland, Ohio 44135–3191
1. AGENCY USE ONLY (Leave blank)
10. SPONSORING/MONITORING AGENCY REPORT NUMBER
9. SPONSORING/MONITORING AGENCY NAME(S) AND ADDRESS(ES)
National Aeronautics and Space AdministrationWashington, DC 20546–0001
Available electronically at http://gltrs.grc.nasa.gov
February 2003
NASA TM—2003-212124AIAA–2003–0727
E–13776
WBS–22–708–20–02
23
A Wind Tunnel Study of Icing Effects on a Business Jet Airfoil
Harold E. Addy, Jr., Andy P. Broeren, Joseph G. Zoeckler, and Sam Lee
Aircraft icing; Airfoil; Aerodynamic performance
Unclassified -UnlimitedSubject Category: 02 Distribution: Nonstandard
Prepared for the 41st Aerospace Sciences Meeting and Exhibit sponsored by the American Institute of Aeronautics andAstronautics, Reno, Nevada, January 6–9, 2003. Harold E. Addy, Jr. and Joseph G. Zoeckler, NASA Glenn ResearchCenter; Andy P. Broeren, University of Illinois at Urbana-Champaign, Urbana, Illinois 61801; and Sam Lee, QSS Group,Inc., Cleveland, Ohio 44135. Responsible person, Harold E. Addy, Jr., organization code 5840, 216–977–7467.
Aerodynamic wind tunnel tests were conducted to study the effects of various ice accretions on the aerodynamicperformance of a 36-inch chord, two-dimensional business jet airfoil. Eight different ice shape configurations weretested. Four were castings made from molds of ice shapes accreted in an icing wind tunnel. Two were made usingcomputationally smoothed tracings of two of the ice shapes accreted in the icing tunnel. These smoothed profiles werethen extended in the spanwise direction to form a two-dimensional ice shape. The final two configurations were formedby applying grit to the smoothed ice shapes. The ice shapes resulted in as much as 48 percent reduction in maximum liftcoefficient from that of the clean airfoil. Large increases in drag and changes in pitching moment were also observed.The castings and their corresponding smoothed counterparts yielded similar results. Little change in performance wasobserved with the addition of grit to the smoothed ice shapes. Changes in the Reynolds number (from 3×10⁶ to10.5×106) and Mach number (from 0.12 to 0.28) did not significantly affect the iced-airfoil performance coefficients.


