Embed Size (px)
Citation preview
A Volatility-Implied Factor Structure onEquity Option Prices
Ohad Kadan, Fang Liu, Xiaoxiao Tang
July 2016

Background
• The factor structure of equity returns is standard (e.g.,CAPM, APT).
• But - there is no standard factor structure for equityoptions.
• This is a hole in the literature that needs to be filled.• This paper will try to fill this gap.

Main Idea
• We will show how a factor structure for stock returnstranslates naturally into a volatility-implied factorstructure for option prices.
• The key - any factor structure for stock returns implies alinear relation between stock return volatility and thevariances and covariances of the factors and idiosyncraticrisk.
• Since option prices increase with return volatility, weobtain a natural factor structure for options:• Option factors are implied variances/covariances of return
factors.• Option factor loadings are combinations of return factor
loadings.
Literature
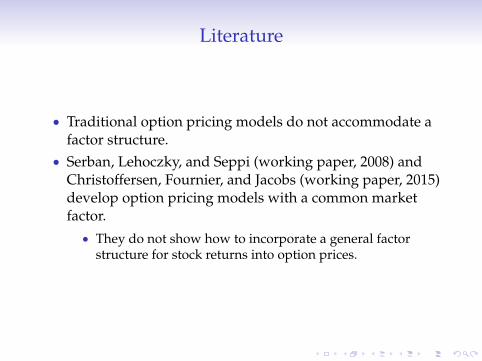
• Traditional option pricing models do not accommodate afactor structure.
• Serban, Lehoczky, and Seppi (working paper, 2008) andChristoffersen, Fournier, and Jacobs (working paper, 2015)develop option pricing models with a common marketfactor.• They do not show how to incorporate a general factor
structure for stock returns into option prices.

Contributions
• First paper to link general factor structures for equity witha factor structure for options.
• Present empirical evidence that the volatility-impliedfactor structure indeed provides a good explanation ofoption prices in the cross section and time series.
• Methodological contribution: Develop a modifiedFama-MacBeth approach to estimate the implied variancesand covariances of return factors.

Setup
• Assume a factor structure for equity returns:
r = α+K
∑k=1
βkfk + ε,
where E (ε) = E (fkε) = 0.• Taking variance on both sides yields:
σ2 =K
∑k,l=1
βkβlσkl + σ2ε
• Equity return variances are linearly related to variancesand covariances of the return factors and the idiosyncraticvariance.
A Factor Structure with Option Prices
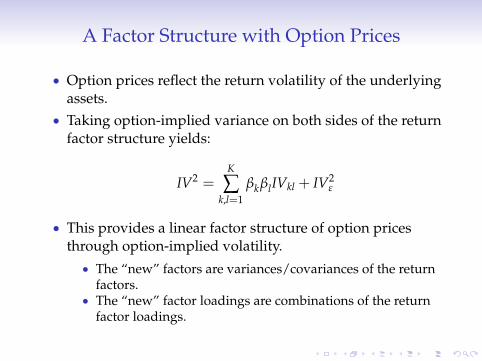
• Option prices reflect the return volatility of the underlyingassets.
• Taking option-implied variance on both sides of the returnfactor structure yields:
IV2 =K
∑k,l=1
βkβlIVkl + IV2ε
• This provides a linear factor structure of option pricesthrough option-implied volatility.• The “new” factors are variances/covariances of the return
factors.• The “new” factor loadings are combinations of the return
factor loadings.
CAPM 1-Factor Model
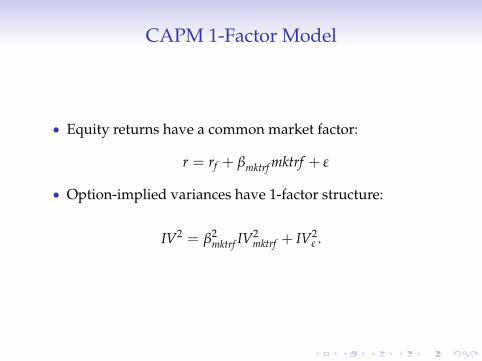
• Equity returns have a common market factor:
r = rf + βmktrf mktrf + ε
• Option-implied variances have 1-factor structure:
IV2 = β2mktrf IV
2mktrf + IV2
ε .

Fama-French-Carhart 4-Factor Model
• Equity returns have four commons factors (market, size,value, momentum):
r = α+ βmktrf mktrf + βsmbsmb+ βhmlhml+ βumdumd+ ε,
• Option-implied variances have 1-factor structure (fourvariances and six covariances):
IV2 = β2mktrf IV
2mktrf + β2
smbIV2smb + β2
hmlIV2hml + β2
umdIV2umd
+2βmktrf βsmbIVmktrf ,smb + 2βmktrf βhmlIVmktrf ,hml
+2βmktrf βumdIVmktrf ,umd + 2βsmbβhmlIVsmb,hml
+2βsmbβumdIVsmb,umd + 2βhmlβumdIVhml,umd + IV2ε .

A Technical Challenge
• We need to estimate
IV2 =K
∑k,l=1
βkβlIVkl + IV2ε ,
• But, typical factors such as SMB, HML and UMD do nothave traded options.
• How can we estimate them?
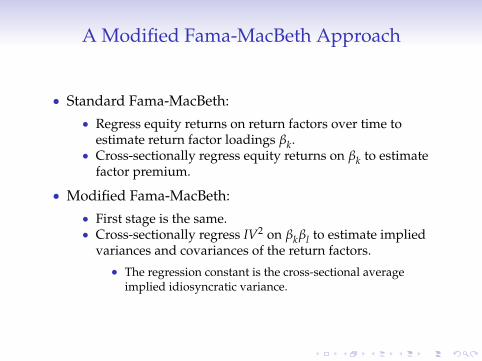
A Modified Fama-MacBeth Approach
• Standard Fama-MacBeth:• Regress equity returns on return factors over time to
estimate return factor loadings βk.• Cross-sectionally regress equity returns on βk to estimate
factor premium.
• Modified Fama-MacBeth:• First stage is the same.• Cross-sectionally regress IV2 on βkβl to estimate implied
variances and covariances of the return factors.
• The regression constant is the cross-sectional averageimplied idiosyncratic variance.
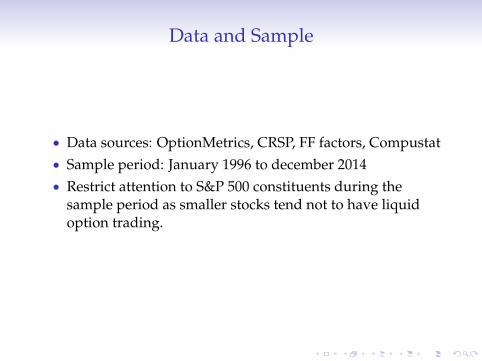
Data and Sample
• Data sources: OptionMetrics, CRSP, FF factors, Compustat• Sample period: January 1996 to december 2014• Restrict attention to S&P 500 constituents during the
sample period as smaller stocks tend not to have liquidoption trading.
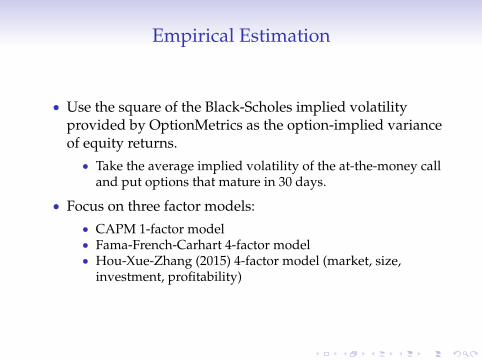
Empirical Estimation
• Use the square of the Black-Scholes implied volatilityprovided by OptionMetrics as the option-implied varianceof equity returns.• Take the average implied volatility of the at-the-money call
and put options that mature in 30 days.
• Focus on three factor models:• CAPM 1-factor model• Fama-French-Carhart 4-factor model• Hou-Xue-Zhang (2015) 4-factor model (market, size,
investment, profitability)
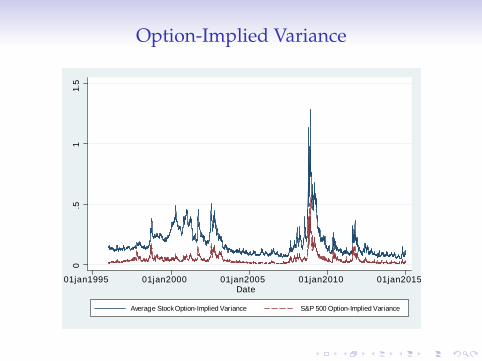
Option-Implied Variance
0.5
11.
5
01jan1995 01jan2000 01jan2005 01jan2010 01jan2015Date
Average Stock OptionImplied Variance S&P 500 OptionImplied Variance

Option-Implied Variance
Year Number of Stocks Mean Median S.D. Min Max1996 685 0.1320 0.0871 0.1181 0.0237 0.78411997 722 0.1503 0.0989 0.1858 0.0236 3.02201998 745 0.2034 0.1445 0.2817 0.0285 6.18961999 737 0.2343 0.1777 0.1836 0.0361 1.95252000 708 0.3386 0.2441 0.2568 0.0202 1.55792001 675 0.2951 0.1922 0.2721 0.0418 1.77912002 694 0.2778 0.1791 0.2663 0.0380 1.60422003 692 0.1559 0.1085 0.1432 0.0245 1.46832004 698 0.1064 0.0740 0.1056 0.0144 1.19182005 695 0.0932 0.0674 0.0926 0.0120 1.12722006 695 0.0925 0.0709 0.0724 0.0111 0.67822007 685 0.1059 0.0885 0.0698 0.0019 0.60042008 658 0.3619 0.2930 0.2761 0.0318 2.47142009 644 0.3364 0.2465 0.2997 0.0008 2.22442010 640 0.1347 0.1062 0.1229 0.0072 1.50282011 629 0.1472 0.1206 0.1336 0.0049 1.48202012 623 0.1148 0.0805 0.1530 0.0044 2.65412013 618 0.0809 0.0579 0.0834 0.0118 1.26122014 610 0.0755 0.0535 0.0831 0.0040 1.3157
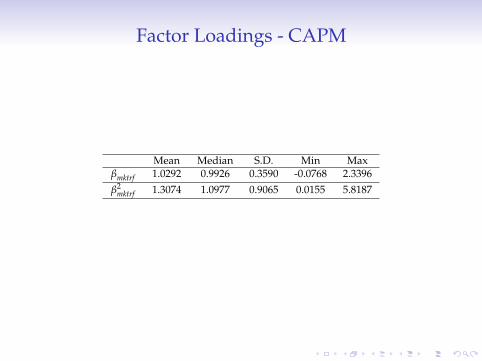
Factor Loadings - CAPM
Mean Median S.D. Min Maxβmktrf 1.0292 0.9926 0.3590 -0.0768 2.3396β2
mktrf 1.3074 1.0977 0.9065 0.0155 5.8187
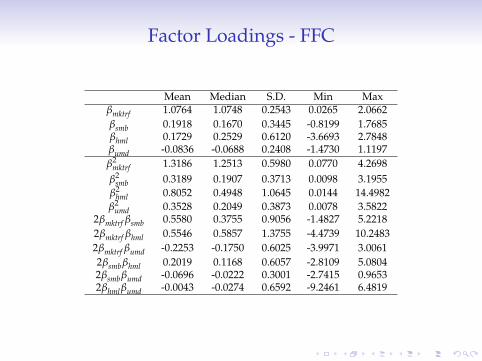
Factor Loadings - FFC
Mean Median S.D. Min Maxβmktrf 1.0764 1.0748 0.2543 0.0265 2.0662βsmb 0.1918 0.1670 0.3445 -0.8199 1.7685βhml 0.1729 0.2529 0.6120 -3.6693 2.7848βumd -0.0836 -0.0688 0.2408 -1.4730 1.1197β2
mktrf 1.3186 1.2513 0.5980 0.0770 4.2698β2
smb 0.3189 0.1907 0.3713 0.0098 3.1955β2
hml 0.8052 0.4948 1.0645 0.0144 14.4982β2
umd 0.3528 0.2049 0.3873 0.0078 3.58222βmktrf βsmb 0.5580 0.3755 0.9056 -1.4827 5.22182βmktrf βhml 0.5546 0.5857 1.3755 -4.4739 10.24832βmktrf βumd -0.2253 -0.1750 0.6025 -3.9971 3.00612βsmbβhml 0.2019 0.1168 0.6057 -2.8109 5.08042βsmbβumd -0.0696 -0.0222 0.3001 -2.7415 0.96532βhmlβumd -0.0043 -0.0274 0.6592 -9.2461 6.4819
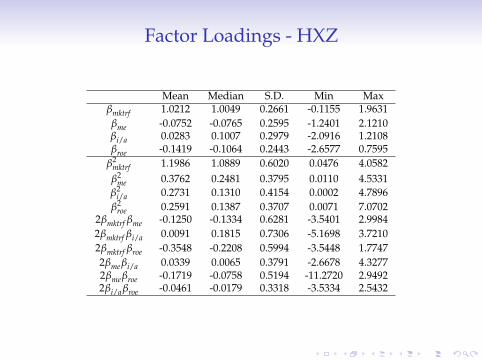
Factor Loadings - HXZ
Mean Median S.D. Min Maxβmktrf 1.0212 1.0049 0.2661 -0.1155 1.9631βme -0.0752 -0.0765 0.2595 -1.2401 2.1210βi/a 0.0283 0.1007 0.2979 -2.0916 1.2108βroe -0.1419 -0.1064 0.2443 -2.6577 0.7595
β2mktrf 1.1986 1.0889 0.6020 0.0476 4.0582β2
me 0.3762 0.2481 0.3795 0.0110 4.5331β2
i/a 0.2731 0.1310 0.4154 0.0002 4.7896β2
roe 0.2591 0.1387 0.3707 0.0071 7.07022βmktrf βme -0.1250 -0.1334 0.6281 -3.5401 2.99842βmktrf βi/a 0.0091 0.1815 0.7306 -5.1698 3.72102βmktrf βroe -0.3548 -0.2208 0.5994 -3.5448 1.77472βmeβi/a 0.0339 0.0065 0.3791 -2.6678 4.32772βmeβroe -0.1719 -0.0758 0.5194 -11.2720 2.94922βi/aβroe -0.0461 -0.0179 0.3318 -3.5334 2.5432
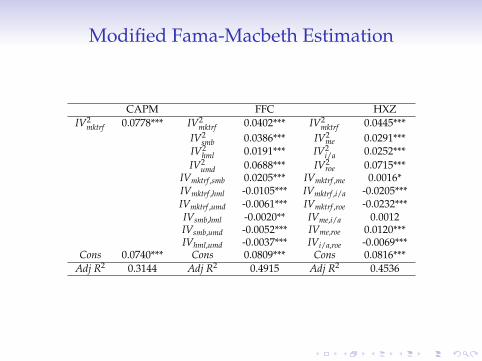
Modified Fama-Macbeth Estimation
CAPM FFC HXZIV2
mktrf 0.0778*** IV2mktrf 0.0402*** IV2
mktrf 0.0445***IV2
smb 0.0386*** IV2me 0.0291***
IV2hml 0.0191*** IV2
i/a 0.0252***IV2
umd 0.0688*** IV2roe 0.0715***
IVmktrf ,smb 0.0205*** IVmktrf ,me 0.0016*IVmktrf ,hml -0.0105*** IVmktrf ,i/a -0.0205***IVmktrf ,umd -0.0061*** IVmktrf ,roe -0.0232***IVsmb,hml -0.0020** IVme,i/a 0.0012IVsmb,umd -0.0052*** IVme,roe 0.0120***IVhml,umd -0.0037*** IVi/a,roe -0.0069***
Cons 0.0740*** Cons 0.0809*** Cons 0.0816***Adj R2 0.3144 Adj R2 0.4915 Adj R2 0.4536
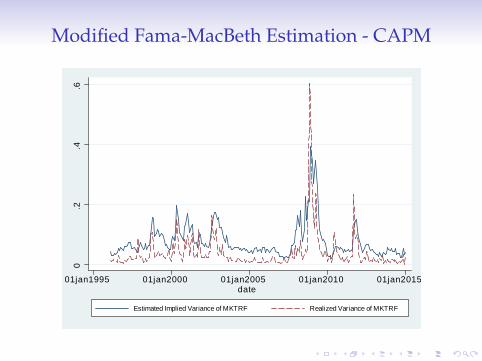
Modified Fama-MacBeth Estimation - CAPM
0.2
.4.6
01jan1995 01jan2000 01jan2005 01jan2010 01jan2015date
Estimated Implied Variance of MKTRF Realized Variance of MKTRF
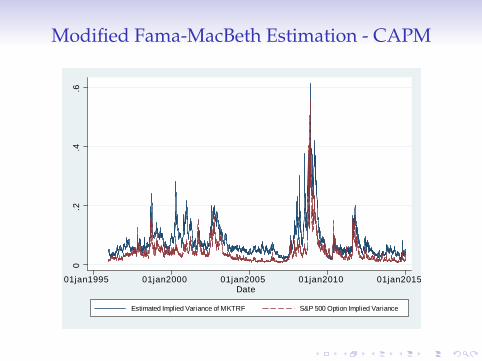
Modified Fama-MacBeth Estimation - CAPM
0.2
.4.6
01jan1995 01jan2000 01jan2005 01jan2010 01jan2015Date
Estimated Implied Variance of MKTRF S&P 500 Option Implied Variance
Modified Fama-MacBeth Estimation - FFC0
.2.4
.6
01jan1995 01jan2000 01jan2005 01jan2010 01jan2015Date
Es timated Implied Var ianc e Realiz ed Var ianc e
MKT RF Variance
0.1
.2.3
01jan1995 01jan2000 01jan2005 01jan2010 01jan2015Date
Es timated Implied Var ianc e Realiz ed Var ianc e
SMB Variance.1
.05
0.0
5.1
01jan1995 01jan2000 01jan2005 01jan2010 01jan2015Date
Es timated Implied Var ianc e Realiz ed Var ianc e
HML Variance
0.1
.2.3
01jan1995 01jan2000 01jan2005 01jan2010 01jan2015Date
Es timated Implied Var ianc e Realiz ed Var ianc e
UMD Variance
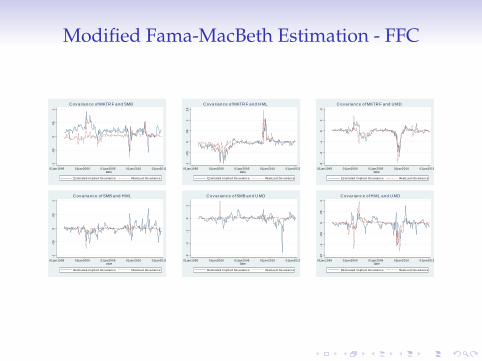
Modified Fama-MacBeth Estimation - FFC.1
.05
0.0
5.1
01jan1995 01jan2000 01jan2005 01jan2010 01jan2015Date
Es timated Implied Covarianc e Real iz ed Covariance
C ov ar ianc e of MKTR F and SMB
.1.0
50
.05
.1.1
5
01jan1995 01jan2000 01jan2005 01jan2010 01jan2015Date
Es timated Implied Covarianc e Real iz ed Covariance
C ov ar ianc e of MKTR F and H ML
.3.2
.10
.1.2
01jan1995 01jan2000 01jan2005 01jan2010 01jan2015Date
Es timated Implied Covarianc e Real iz ed Covariance
C ov ar ianc e of MKTR F and U MD
.1.0
50
.05
.1
01jan1995 01jan2000 01jan2005 01jan2010 01jan2015date
Es timated Implied Covarianc e Real iz ed Covariance
C ov ar ianc e of SMB and H ML
.3.2
.10
.1
01jan1995 01jan2000 01jan2005 01jan2010 01jan2015Date
Es timated Implied Covarianc e Real iz ed Covariance
C ov ar ianc e of SMB and U MD
.15
.1.0
50
.05
.1
01jan1995 01jan2000 01jan2005 01jan2010 01jan2015Date
Es timated Implied Covarianc e Real iz ed Covariance
C ov ar ianc e of H ML and U MD
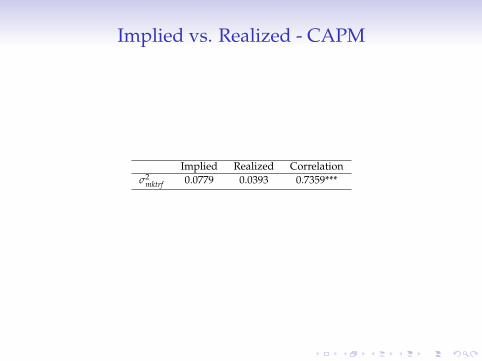
Implied vs. Realized - CAPM
Implied Realized Correlationσ2
mktrf 0.0779 0.0393 0.7359***
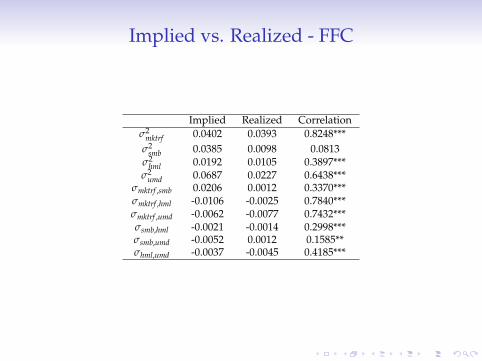
Implied vs. Realized - FFC
Implied Realized Correlationσ2
mktrf 0.0402 0.0393 0.8248***σ2
smb 0.0385 0.0098 0.0813σ2
hml 0.0192 0.0105 0.3897***σ2
umd 0.0687 0.0227 0.6438***σmktrf ,smb 0.0206 0.0012 0.3370***σmktrf ,hml -0.0106 -0.0025 0.7840***σmktrf ,umd -0.0062 -0.0077 0.7432***σsmb,hml -0.0021 -0.0014 0.2998***σsmb,umd -0.0052 0.0012 0.1585**σhml,umd -0.0037 -0.0045 0.4185***
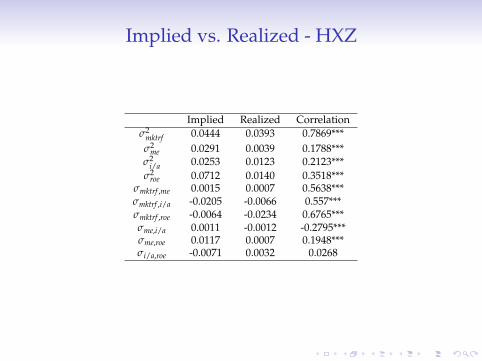
Implied vs. Realized - HXZ
Implied Realized Correlationσ2
mktrf 0.0444 0.0393 0.7869***σ2
me 0.0291 0.0039 0.1788***σ2
i/a 0.0253 0.0123 0.2123***σ2
roe 0.0712 0.0140 0.3518***σmktrf ,me 0.0015 0.0007 0.5638***σmktrf ,i/a -0.0205 -0.0066 0.557***σmktrf ,roe -0.0064 -0.0234 0.6765***σme,i/a 0.0011 -0.0012 -0.2795***σme,roe 0.0117 0.0007 0.1948***σi/a,roe -0.0071 0.0032 0.0268

Modified Fama-Macbeth Estimation
Are the covariance terms important?
FFC HXZIV2
mktrf 0.0402*** 0.0313*** IV2mktrf 0.0445*** 0.0590***
IV2smb 0.0386*** 0.0742*** IV2
me 0.0291*** 0.0258***IV2
hml 0.0191*** 0.0203*** IV2i/a 0.0252*** 0.0466***
IV2umd 0.0688*** 0.0829*** IV2
roe 0.0715*** 0.0899***IVmktrf ,smb 0.0205*** IVmktrf ,me 0.0016*IVmktrf ,hml -0.0105*** IVmktrf ,i/a -0.0205***IVmktrf ,umd -0.0061*** IVmktrf ,roe -0.0232***IVsmb,hml -0.0020** IVme,i/a 0.0012IVsmb,umd -0.0052*** IVme,roe 0.0120***IVhml,umd -0.0037*** IVi/a,roe -0.0069***
Cons 0.0809*** 0.0757*** Cons 0.0816*** 0.0615***Adj R2 0.4915 0.3870 Adj R2 0.4536 0.3932
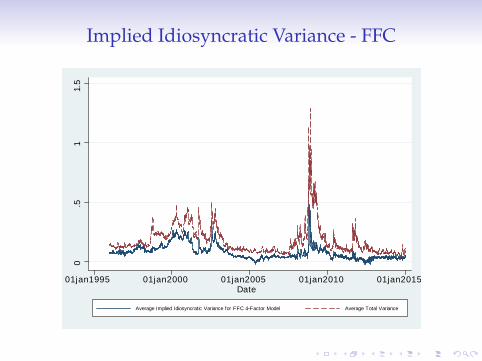
Implied Idiosyncratic Variance - FFC
0.5
11.
5
01jan1995 01jan2000 01jan2005 01jan2010 01jan2015Date
Average Implied Idiosyncratic Variance for FFC 4Factor Model Average Total Variance

Time Series Tests
Can the option factors explain time series variations in optionprices?
• SPDR sector ETFs• Dow Jones Industrial Average (DJIA) stocks

Time Series Return Factor Regression AdjustedR-Squared - SPDR Sector ETFs
CAPM FFC HXZXLB 0.5816 0.6192 0.6068XLV 0.6157 0.6366 0.6185XLP 0.4264 0.4809 0.5507XLY 0.7212 0.7310 0.7350XLE 0.4650 0.5364 0.5014XLF 0.6972 0.8261 0.7158XLI 0.7924 0.8016 0.8023XLK 0.7488 0.8319 0.8047XLU 0.3863 0.4620 0.4177
Average 0.6038 0.6584 0.6392
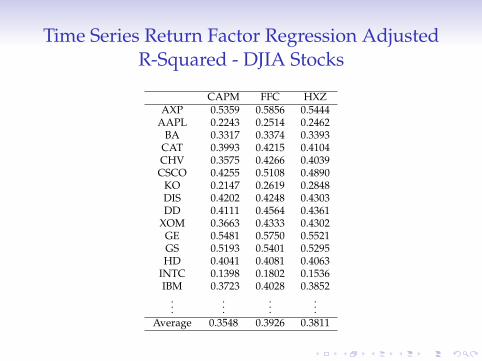
Time Series Return Factor Regression AdjustedR-Squared - DJIA Stocks
CAPM FFC HXZAXP 0.5359 0.5856 0.5444
AAPL 0.2243 0.2514 0.2462BA 0.3317 0.3374 0.3393
CAT 0.3993 0.4215 0.4104CHV 0.3575 0.4266 0.4039CSCO 0.4255 0.5108 0.4890
KO 0.2147 0.2619 0.2848DIS 0.4202 0.4248 0.4303DD 0.4111 0.4564 0.4361
XOM 0.3663 0.4333 0.4302GE 0.5481 0.5750 0.5521GS 0.5193 0.5401 0.5295HD 0.4041 0.4081 0.4063
INTC 0.1398 0.1802 0.1536IBM 0.3723 0.4028 0.3852
......
......
Average 0.3548 0.3926 0.3811
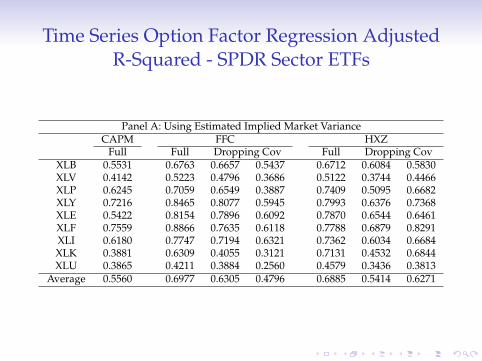
Time Series Option Factor Regression AdjustedR-Squared - SPDR Sector ETFs
Panel A: Using Estimated Implied Market VarianceCAPM FFC HXZ
Full Full Dropping Cov Full Dropping CovXLB 0.5531 0.6763 0.6657 0.5437 0.6712 0.6084 0.5830XLV 0.4142 0.5223 0.4796 0.3686 0.5122 0.3744 0.4466XLP 0.6245 0.7059 0.6549 0.3887 0.7409 0.5095 0.6682XLY 0.7216 0.8465 0.8077 0.5945 0.7993 0.6376 0.7368XLE 0.5422 0.8154 0.7896 0.6092 0.7870 0.6544 0.6461XLF 0.7559 0.8866 0.7635 0.6118 0.7788 0.6879 0.8291XLI 0.6180 0.7747 0.7194 0.6321 0.7362 0.6034 0.6684XLK 0.3881 0.6309 0.4055 0.3121 0.7131 0.4532 0.6844XLU 0.3865 0.4211 0.3884 0.2560 0.4579 0.3436 0.3813
Average 0.5560 0.6977 0.6305 0.4796 0.6885 0.5414 0.6271
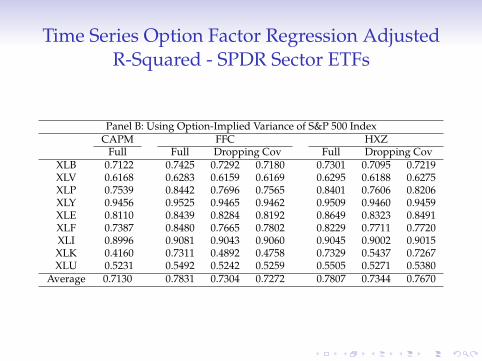
Time Series Option Factor Regression AdjustedR-Squared - SPDR Sector ETFs
Panel B: Using Option-Implied Variance of S&P 500 IndexCAPM FFC HXZ
Full Full Dropping Cov Full Dropping CovXLB 0.7122 0.7425 0.7292 0.7180 0.7301 0.7095 0.7219XLV 0.6168 0.6283 0.6159 0.6169 0.6295 0.6188 0.6275XLP 0.7539 0.8442 0.7696 0.7565 0.8401 0.7606 0.8206XLY 0.9456 0.9525 0.9465 0.9462 0.9509 0.9460 0.9459XLE 0.8110 0.8439 0.8284 0.8192 0.8649 0.8323 0.8491XLF 0.7387 0.8480 0.7665 0.7802 0.8229 0.7711 0.7720XLI 0.8996 0.9081 0.9043 0.9060 0.9045 0.9002 0.9015XLK 0.4160 0.7311 0.4892 0.4758 0.7329 0.5437 0.7267XLU 0.5231 0.5492 0.5242 0.5259 0.5505 0.5271 0.5380
Average 0.7130 0.7831 0.7304 0.7272 0.7807 0.7344 0.7670
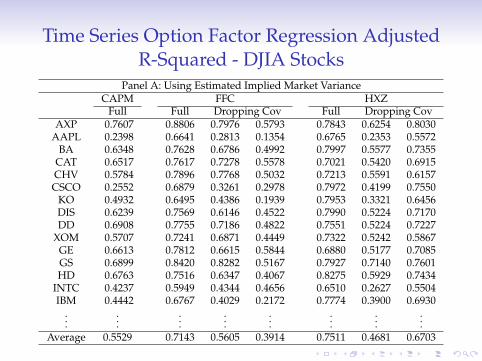
Time Series Option Factor Regression AdjustedR-Squared - DJIA Stocks
Panel A: Using Estimated Implied Market VarianceCAPM FFC HXZ
Full Full Dropping Cov Full Dropping CovAXP 0.7607 0.8806 0.7976 0.5793 0.7843 0.6254 0.8030
AAPL 0.2398 0.6641 0.2813 0.1354 0.6765 0.2353 0.5572BA 0.6348 0.7628 0.6786 0.4992 0.7997 0.5577 0.7355
CAT 0.6517 0.7617 0.7278 0.5578 0.7021 0.5420 0.6915CHV 0.5784 0.7896 0.7768 0.5032 0.7213 0.5591 0.6157CSCO 0.2552 0.6879 0.3261 0.2978 0.7972 0.4199 0.7550
KO 0.4932 0.6495 0.4386 0.1939 0.7953 0.3321 0.6456DIS 0.6239 0.7569 0.6146 0.4522 0.7990 0.5224 0.7170DD 0.6908 0.7755 0.7186 0.4822 0.7551 0.5224 0.7227
XOM 0.5707 0.7241 0.6871 0.4449 0.7322 0.5242 0.5867GE 0.6613 0.7812 0.6615 0.5844 0.6880 0.5177 0.7085GS 0.6899 0.8420 0.8282 0.5167 0.7927 0.7140 0.7601HD 0.6763 0.7516 0.6347 0.4067 0.8275 0.5929 0.7434
INTC 0.4237 0.5949 0.4344 0.4656 0.6510 0.2627 0.5504IBM 0.4442 0.6767 0.4029 0.2172 0.7774 0.3900 0.6930
......
......
......
......
Average 0.5529 0.7143 0.5605 0.3914 0.7511 0.4681 0.6703
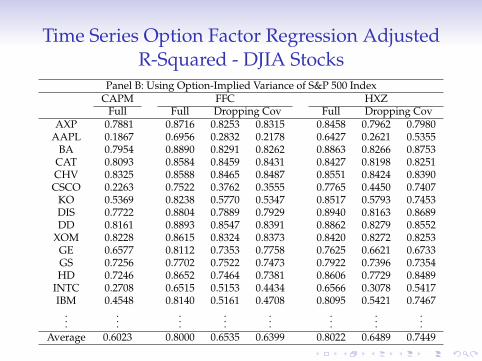
Time Series Option Factor Regression AdjustedR-Squared - DJIA Stocks
Panel B: Using Option-Implied Variance of S&P 500 IndexCAPM FFC HXZ
Full Full Dropping Cov Full Dropping CovAXP 0.7881 0.8716 0.8253 0.8315 0.8458 0.7962 0.7980
AAPL 0.1867 0.6956 0.2832 0.2178 0.6427 0.2621 0.5355BA 0.7954 0.8890 0.8291 0.8262 0.8863 0.8266 0.8753
CAT 0.8093 0.8584 0.8459 0.8431 0.8427 0.8198 0.8251CHV 0.8325 0.8588 0.8465 0.8487 0.8551 0.8424 0.8390CSCO 0.2263 0.7522 0.3762 0.3555 0.7765 0.4450 0.7407
KO 0.5369 0.8238 0.5770 0.5347 0.8517 0.5793 0.7453DIS 0.7722 0.8804 0.7889 0.7929 0.8940 0.8163 0.8689DD 0.8161 0.8893 0.8547 0.8391 0.8862 0.8279 0.8552
XOM 0.8228 0.8615 0.8324 0.8373 0.8420 0.8272 0.8253GE 0.6577 0.8112 0.7353 0.7758 0.7625 0.6621 0.6733GS 0.7256 0.7702 0.7522 0.7473 0.7922 0.7396 0.7354HD 0.7246 0.8652 0.7464 0.7381 0.8606 0.7729 0.8489
INTC 0.2708 0.6515 0.5153 0.4434 0.6566 0.3078 0.5417IBM 0.4548 0.8140 0.5161 0.4708 0.8095 0.5421 0.7467
......
......
......
......
Average 0.6023 0.8000 0.6535 0.6399 0.8022 0.6489 0.7449
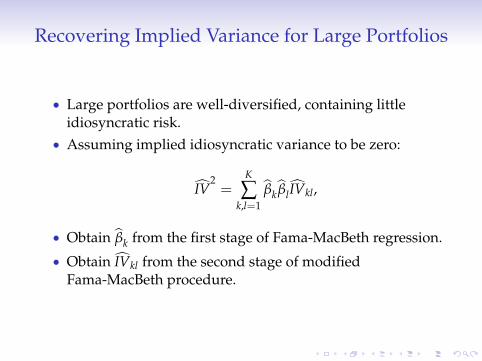
Recovering Implied Variance for Large Portfolios
• Large portfolios are well-diversified, containing littleidiosyncratic risk.
• Assuming implied idiosyncratic variance to be zero:
IV2=
K
∑k,l=1
βk βlIVkl,
• Obtain βk from the first stage of Fama-MacBeth regression.
• Obtain IVkl from the second stage of modifiedFama-MacBeth procedure.

Implied Variance of SPDR Sector ETFs - FFC0
.51
1.5
01jan2000 01jan2005 01jan2010 01jan2015Date
Fitted Varianc e OptionImplied Variance
XLB
0.5
1
01jan2000 01jan2005 01jan2010 01jan2015Date
Fitted Varianc e OptionImplied Variance
XLV
0.1
.2.3
.4.5
01jan2000 01jan2005 01jan2010 01jan2015Date
Fitted Varianc e OptionImplied Variance
XLP
0.2
.4.6
.8
01jan2000 01jan2005 01jan2010 01jan2015Date
Fitted Varianc e OptionImplied Variance
XLY
0.2
.4.6
.81
01jan2000 01jan2005 01jan2010 01jan2015Date
Fitted Varianc e OptionImplied Variance
XLE
0.5
11.
52
01jan2000 01jan2005 01jan2010 01jan2015Date
Fitted Varianc e OptionImplied Variance
XLF
0.2
.4.6
01jan2000 01jan2005 01jan2010 01jan2015Date
Fitted Varianc e OptionImplied Variance
XLI
0.2
.4.6
.81
01jan2000 01jan2005 01jan2010 01jan2015Date
Fitted Varianc e OptionImplied Variance
XLK
0.2
.4.6
.801jan2000 01jan2005 01jan2010 01jan2015
Date
Fitted Varianc e OptionImplied Variance
XLU
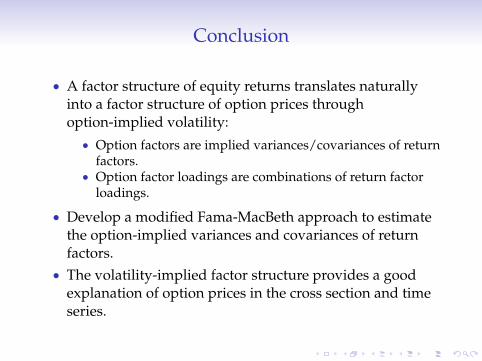
Conclusion
• A factor structure of equity returns translates naturallyinto a factor structure of option prices throughoption-implied volatility:• Option factors are implied variances/covariances of return
factors.• Option factor loadings are combinations of return factor
loadings.
• Develop a modified Fama-MacBeth approach to estimatethe option-implied variances and covariances of returnfactors.
• The volatility-implied factor structure provides a goodexplanation of option prices in the cross section and timeseries.