Embed Size (px)
Citation preview

JOURNAL OF SEISMIC EXPLORATION 29, 587-601 (2020) 587
A VISCOELASTIC REPRESENTATION OF SEISMIC WAVE ATTENUATION AND DISPERSION CAUSED BY WAVE-INDUCED FLUID FLOW IN FRACTURED POROUS MEDIA
HUITIAN LAN1, SHUMIN CHEN1, HUANZHAO CHI2*, JIANGYUN PEI1, WEN LIN1 and JIAGANG SHEN1 1 Exploration and Development Research Institute of Daqing Oil Company, Daqing 163712, P.R. China. 2 School of Prospecting and Surveying Engineering, Changchun Institute of Technology, Changchun 130021, P.R. China. * [email protected] (Received May 8, 2019; revised version accepted May 16, 2020) ABSTRACT Lan, H.T., Chen, S.M., Chi, H.Z., Pei, J.Y., Lin, W. and Shen, J.G., 2020. A viscoelastic representation of seismic wave attenuation and dispersion caused by wave-induced fluid flow in fractured porous media. Journal of Seismic Exploration, 29: 587-601. Analyzing and understanding the seismic response from fractured reservoirs is vital to reservoirs characterization and the production optimization of hydrocarbons. Fractured reservoirs can be modeled as fractured porous media. When seismic waves propagate in fractured porous media, fluid exchange occurs between the fractures and the pore space. As a consequence, the seismic waves are subject to attenuation and dispersion, the media behave viscoelasticity, and the components of the effective stiffness tensor involved in the stress-strain relation become complex-valued and frequency dependent. In order to compute synthetic seismograms in the time domain with the purpose of studying seismic response of the media, an efficient approach is to approximate the stiffnesses by suitable viscoelastic models and then solve viscoelastic differential equations. In this paper, based on the Chapman's model of fractured porous media, we use the Zener model to approximate each component of the effective stiffness tensor, and use the Christoffel equation to obtain the seismic attenuation and velocity dispersion curves and their corresponding Zener model best fits. We focused on three models, each with two different fracture sizes and filled with different fluids. Our results indicate that the Zener model provides a good representation for Chapman's model of fractured porous media. KEY WORDS: velocity dispersion, wave attenuation, fractured porous media, Zener model. 0963-0651/20/$5.00 © 2020 Geophysical Press Ltd.

588
INTRODUCTION Many previous works have reported that hydrocarbon-saturated reservoir zones often exhibit anomalously high seismic attenuation (Klimentos, 1995; Dasgupta and Clark, 1998; Dasios et al., 2001; Rapoport et al., 2004). Associated with attenuation is velocity dispersion, which has been observed in the exploration seismic frequency band in laboratory experiments and field data (Batzle et al., 2001; Sun et al., 2009). Although the mechanisms that cause attenuation and dispersion have not been defined clearly, resent studies show the most important cause is the wave-induced fluid flow (WIFF) between mesoscopic-scale (much larger than the typical pore size but much smaller than the seismic wavelength) heterogeneities (e.g., White, 1975; White et al.,1975; Müller and Gurevich, 2004; Pride et al., 2004; Carcione and Picotti, 2006; Müller et al., 2008, 2010). High attenuation, velocity dispersion, and frequency-dependent anisotropy of seismic waves have been observed in real field seismic data from fractured reservoirs (e.g., Parra, 2000; Chesnokov, 2001; Liu et al., 2003). It is commonly accepted that the most significant et al cause of inducing these characteristics of seismic waves in such media is WIFF between the aligned mesoscale (i.e., in the order of centimeters to meters) fractures and the background porous media at seismic frequencies (e.g. Chapman, 2003, 2009; Maultzsch et al., 2003; Baird et al., 2013; Carcione, 2014; Ba et al., 2015). These characteristics of seismic waves contain information about the fractures and fluids present in the reservoir and can provide some new insights for seismic characterization of fractured reservoirs, thus, they have attracted great attention (e.g., Chapman, 2003, 2009; Galvin and Gurevich, 2007; Gurevich et al., 2009). Chapman (2003) proposed a poroelastic equivalent medium model in which grain scale and fracture scale fluid flow are considered, and derived the complex-valued, frequency-dependent effective elastic stiffness tensor of the fractured porous media. To overcome the low porosity restriction in Chapman's model, Chapman et al. (2003) developed a modified version of this model that successfully simulated both the frequency-dependent shear wave anisotropy observations from multicomponent VSP and the microseismic data sets acquired from fractured gas reservoirs. Maultzsch et al. (2003) and Al-Harrasi et al. (2011) inverted fracture density and fracture size of fractured reservoirs based on this model, the inverted fracture length matched geological observations very well. These studies show that the modeling of frequency-dependent anisotropy based on the Chapman's model can improve the seismic characterization of fracture sets in fractured reservoirs. Fractured reservoirs can be represented as fractured porous media. Understanding the seismic response of such media is important for reservoir characterization and the production optimization of hydrocarbons. The components of effective elastic stiffness tensor of such media are complex-valued and frequency-dependent induced by the WIFF mechanism, which means that energy dissipation, and the convolution integrals need to

589
be solved in the wave equations for seismic wavefield simulation in such media in the time domain. To circumvent the difficulty, a good approach is to approximate the stiffnesses by suitable viscoelastic models and solve viscoelastic differential equations using the memory-variable approach. One of the most popular viscoelastic models is the Zener model, which has been used to model wave attenuation and velocity dispersion caused by mesoscopic loss mechanisms in double-porosity media or patchy saturated rocks (Liu et al., 2009; Quintal et al., 2009; Picotti et al., 2010, 2012). Liu et al. (2009) modeled attenuation caused by mesoscopic-scale WIFF in double-porosity media using a combination of Zener elements. Quintal et al. (2009) used the Zener model to approximate White 1D interlayer-flow model (White et al.,1975; Carcione and Picotti, 2006) and performed numerical simulations of wave propagation in the equivalent viscoelastic media. Picotti et al. (2010) used the Zener model to approximate the wave attenuation and dispersion from different models of poroelastic media such as White’s (1975) model and Johnson’s (2001) model. Picotti et al. (2012) approximated the complex dilatational moduli of patchy saturated rocks with a fractal patch distribution and computed synthetic seismograms to analyze the sensitivity of the seismic response when injecting carbon dioxide into a depleted gas reservoir. In this study, based on the Chapman's model, we approximate the complex-valued and frequency-dependent effective stiffness tensor components using the Zener models and solve the dispersion equation defined by the Christoffel equation to calculate the best-fitting wave attenuation and velocity dispersion curves. This work is expected to lay the foundation for seismic wavefield simulation in fractured porous media represented by the Chapman's model. THEORY AND METHODS Theoretical model In this work, we use Chapman's model to describe fractured porous media. The expression for the effective stiffness tensor effC takes the form
(0) (1) (2) (3)effp c fε εΦ= − − −C C C C C , (1)
where (0)C is the isotropic elastic tensor of the matrix and can be constructed using the Lamé parameters of matrix grain λ and µ ; (1)C , (2)C , and (3)C are the additional contributions from pores, microcracks, and
fractures, respectively, and which are functions of λ and µ , the fluid properties, the relaxation time mτ (which is related to the squirt flow), the fracture radius fa , and the frequency ω ; pΦ is the porosity; cε is the crack density; and fε is the fracture density. The precise expression for each component of the stiffness tensor is described in Chapman (2003). However, the application of Chapman's model is restricted to low-porosity
590
media because the derivation of this model follows the interaction energy approach to find the elastic constants, and this means that in practice, λ and µ will have to be fitted to achieve agreement with the background velocities . Therefore, for the cases of high porosity, the use of λ and µ to calculate the effect of fractures can result in substantial errors. To circumvent this problem, Chapman et al. (2003) proposed a slightly modified version of the original model that provides an alternative parameterization for the Lamé parameters. These parameters, 0λ and 0µ , can be derived from the seismic velocities Vp
0 and Vs0 of the unfractured
porous rock. 0λ and 0µ are defined as 0 0 2 0 0 2 0( ) ; ( ) 2s pV Vµ ρ λ ρ µ= = − , (2) where ρ is the density of the saturated rock. Additionally, the isotropic tensor 0 ( , )C Λ ϒ needs to be defined in such a way that the measured isotropic velocities are obtained by applying the pore and crack corrections at a certain frequency f0. Λ and ϒ are the new Lamé parameters, which are defined as
Λ = λ0 +Φc,p (λ
0 ,µ0 , f0 ); ϒ=µ0 +Φc,p (λ0 ,µ0 , f0 ) , (3)
where the function ,c pΦ is the perturbation due to the presence of microcracks and pores. Although the Λ and ϒ have no physical meaning, they can be calculated using observed seismic velocities 0
pV and 0sV . We
rewrite eq. (1) as
(0) (1) 0 0( ) ( , ) ( , , )effpω λ µ ω= Λ ϒ −ΦC C C
(2) 0 0 (3) 0 0( , , ) ( , , )c fε λ µ ω ε λ µ ω− −C C , (4)
where ω is the angular frequency. In our model, we consider two different scales of fluid flow: the grain scale fluid flow associated with the relaxation time mτ and the mesoscopic fracture scale fluid flow associated with the larger timescale constant fτ . The two timescale constants are related to one another by
ff m
aτ τ
ζ=
, (5)
where fa is the average fracture radius and ζ is the average grain size. Because the fractures have a greater ratio of volume to surface area than that of the microcracks, it takes a longer period of time for the required amount of fluid to move through an element of the surface area in order to equalize the induced pressure.

591
Chapman et al. (2003) suggested that the original model can be further simplified by setting the crack density cε to zero for rocks in which the spherical porosity pΦ is larger than the crack porosity. This will be the case for most practical applications (Maultzsch et al., 2003); following this logic, we focus our efforts on the fracture effects and ignore the microcrack effects. Eqs. (4) and (5) show that fracture length (twice the fracture radius) and fracture density are two important parameters that affect the properties of fractured porous media. The relaxation time of fluid flow between the fracture and pore is proportional to the fracture length, so the fracture length will affect the frequency band where the dispersion and attenuation occur. The higher the fracture density is, the larger the total space of the fracture connected with the pore is, and the greater the fluid exchange between the fracture and the pore is, resulting in stronger wave dispersion and attenuation. In Chapman's model, the fluid mass exchange between fractures and pores is governed by the finite fluid-pressure difference in fracture and equant pore space. A consequence of the fluid-pressure relaxation process is that the attenuation of P- and S-waves will scale with 1ω− and ω at low and high frequency limits, respectively. Zener model representations The Zener model, or the standard linear solid model discussed by Mavko et al.(2009), defines a complex modulus:
!M (ω) =M
∞(M 0 + i
ωωc
M∞M 0 )
M∞+ i ωωc
M∞M 0
, (6)
with unrelaxed and relaxed moduli M∞ and 0M , and the characteristic frequency cω associates to the maximum possible attenuation in a given scenario. The quality factor is
Q −1 =Im( !M )Re( !M )
=M
∞−M 0
M∞M 0
1ωωc
+ωcω
.
(7)
It can be seen that the asymptotic behavior of attenuation at high frequencies is 1 1Q ω− −∝ and at low frequencies is 1Q ω− ∝ . This is the same as the asymptotic behavior of attenuation of Chapman's model. Thus, it is logical to represent the wave attenuation and dispersion effects described by Chapman's model using the Zener viscoelastic model.
592
Every component of the effective stiffness tensor need to be approximated with the Zener model (Carcione, 2014). A Zener element can be expressed as
C(ω) =CR
1+ iωτε1+ iωτσ
⎛
⎝⎜⎜
⎞
⎠⎟⎟ , (8)
where RC is the relaxed modulus, and ετ and στ are relaxation times:
τε =
τ 0
Q0
Q02 +1+1( ); τσ = τε − 2τ 0
Q0
, (9)
where 0τ is a relaxation time such that 01 τ is the center frequency of the relaxation peak and 0Q is the minimum quality factor. We use the seismic quality factor matrix Q , as introduced by Carcione (2000), to obtain 0τ and 0Q for each element of the effective stiffness tensor for the media described in Chapman's model. The elements ijQ of the matrix Q are expressed in terms of the components of the complex stiffness matrix C! where Cij! =Cij
R + iCijI and
Qij =CijR
C ijI
, (10)
where RijC and I
ijC denote the real and imaginary components of each matrix element. In this study, Cij! is replaced by the component ijklC of the effective stiffness tensor effC of the Chapman's model, as defined in eq. (4). In this method, we can approximate each component of the effective stiffness tensor of Chapman's model using the Zener mechanical model. Then we can obtain the wave attenuation and velocity dispersion curves and the corresponding Zener model best fits by solving the dispersion equation defined by the Christoffel equation (Carcione, 1995, 2014). Velocity and attenuation With the purpose of obtaining the wave attenuation and velocity dispersion curves and their corresponding best-fitting Zener models, we insert the effective stiffness tensor effC and its corresponding Zener viscoelastic approximation stiffness tensor into the Christoffel equation and rewrite the dispersion equation as (Carcione, 2014): ( )T 2det 0Vρ⋅ ⋅ − =L C L I , (11) where

593
0 0 00 0 00 0 0
x z y
y z x
z y x
l l ll l l
l l l
⎡ ⎤⎢ ⎥
= ⎢ ⎥⎢ ⎥⎣ ⎦
L , (12)
where L is the direction cosine matrix, and the direction cosines xl , yl , and zl define the propagation directions (Carcione, 2014):
1 1 2 2 3 3ˆ ˆ ˆ ˆ ,l l l+ +k = e e e (13)
V is the complex velocity, and C is the complex stiffness tensor and here it represents effC or Zener viscoelastic approximation stiffness tensor. Solving the dispersion relation [eq. (9)], three roots of the complex velocity V can be obtained which correspond to three propagating modes: the quasi-compressional (qp) wave, the quasi-shear (qsv) wave, and the pure shear (sh) wave. The phase velocity can be expressed in terms of the complex velocity; in its vector form, it is expressed as (Carcione, 1995, 2014):
11 ˆReph V
−⎛ ⎞⎡ ⎤= ⎜ ⎟⎢ ⎥⎣ ⎦⎝ ⎠
V k
. (14)
The quality factor is defined as
Q = Re(V
2 )Im(V 2 ) , (15)
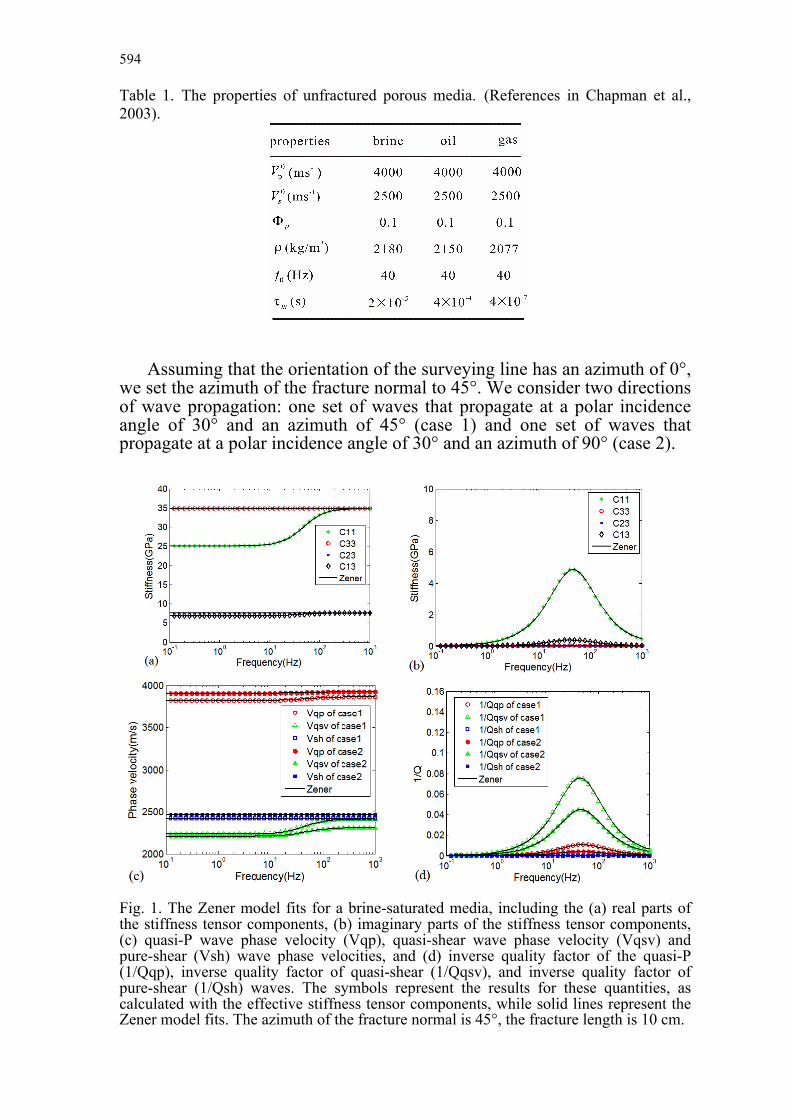
where Re and Im denote the real and imaginary parts. EXAMPLES To demonstrate the effectiveness of our method, we present the results from three fractured porous media models, which are saturated by brine, oil and gas, respectively. Moreover, in each model, a set of vertical aligned fractures embeds in a porous background media, and two fracture scales (fracture lengths of 10 cm and 3 m) are considered respectively, corresponding to centimeter-scale and meter-scale, and the fracture density of the two-scale fractures is 0.1. The properties of the unfractured porous media used in these models are given in Table 1. In these examples, we have investigated the effects of the fracture lengths and the pore fluid type on the wave attenuation, the velocity dispersion, and the Zener model fits. The Chapman’s model is largely insensitive to the fracture density, which only affects the amplitude of dispersion and attenuation and the strength of the anisotropy.
594
Table 1. The properties of unfractured porous media. (References in Chapman et al., 2003).
Assuming that the orientation of the surveying line has an azimuth of 0°, we set the azimuth of the fracture normal to 45°. We consider two directions of wave propagation: one set of waves that propagate at a polar incidence angle of 30° and an azimuth of 45° (case 1) and one set of waves that propagate at a polar incidence angle of 30° and an azimuth of 90° (case 2). Fig. 1. The Zener model fits for a brine-saturated media, including the (a) real parts of the stiffness tensor components, (b) imaginary parts of the stiffness tensor components, (c) quasi-P wave phase velocity (Vqp), quasi-shear wave phase velocity (Vqsv) and pure-shear (Vsh) wave phase velocities, and (d) inverse quality factor of the quasi-P (1/Qqp), inverse quality factor of quasi-shear (1/Qqsv), and inverse quality factor of pure-shear (1/Qsh) waves. The symbols represent the results for these quantities, as calculated with the effective stiffness tensor components, while solid lines represent the Zener model fits. The azimuth of the fracture normal is 45°, the fracture length is 10 cm.
595
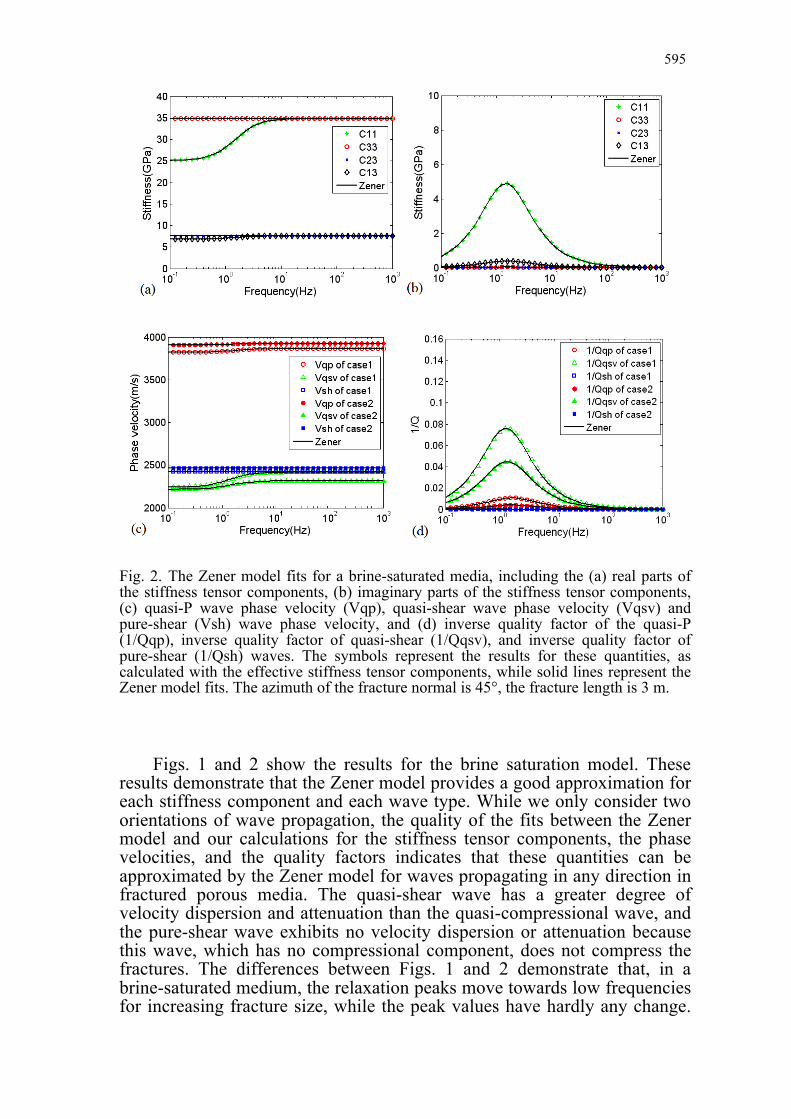
Fig. 2. The Zener model fits for a brine-saturated media, including the (a) real parts of the stiffness tensor components, (b) imaginary parts of the stiffness tensor components, (c) quasi-P wave phase velocity (Vqp), quasi-shear wave phase velocity (Vqsv) and pure-shear (Vsh) wave phase velocity, and (d) inverse quality factor of the quasi-P (1/Qqp), inverse quality factor of quasi-shear (1/Qqsv), and inverse quality factor of pure-shear (1/Qsh) waves. The symbols represent the results for these quantities, as calculated with the effective stiffness tensor components, while solid lines represent the Zener model fits. The azimuth of the fracture normal is 45°, the fracture length is 3 m. Figs. 1 and 2 show the results for the brine saturation model. These results demonstrate that the Zener model provides a good approximation for each stiffness component and each wave type. While we only consider two orientations of wave propagation, the quality of the fits between the Zener model and our calculations for the stiffness tensor components, the phase velocities, and the quality factors indicates that these quantities can be approximated by the Zener model for waves propagating in any direction in fractured porous media. The quasi-shear wave has a greater degree of velocity dispersion and attenuation than the quasi-compressional wave, and the pure-shear wave exhibits no velocity dispersion or attenuation because this wave, which has no compressional component, does not compress the fractures. The differences between Figs. 1 and 2 demonstrate that, in a brine-saturated medium, the relaxation peaks move towards low frequencies for increasing fracture size, while the peak values have hardly any change.

596
Figs. 3 and 4 represent the model results for the oil-saturated medium. In this case, because of the higher viscosity of oil, the relaxation peaks occur at lower frequencies and have greater values compared with those of the brine-saturated medium. For instance, when the fracture size is 10 cm, the relaxation peaks occur at about 40 Hz for brine-saturated medium (Fig. 1b) and at about 2 Hz for oil-saturated medium (Fig. 3b); the maximum inverse quality factor of the quasi-shear wave is nearly 0.08 (Fig. 1d) and 0.1 (Fig. 3d), respectively. When the fracture length in the oil-saturation model is 3 m (Fig. 4), the fractured porous media become unrelaxed, and the fluid has no time to move between pores and fractures during a wave cycle, as a result, all the seismic waves have little velocity dispersion and attenuation.
Fig. 3. The Zener model fits for an oil-saturated media, including the (a) real parts of the stiffness tensor components, (b) imaginary parts of the stiffness tensor components, (c) quasi-P wave phase velocity (Vqp), quasi-shear wave phase velocity (Vqsv) and pure-shear (Vsh) wave phase velocity, and (d) inverse quality factor of the quasi-P (1/Qqp), inverse quality factor of quasi-shear (1/Qqsv), and inverse quality factor of pure-shear (1/Qsh) waves. The symbols represent the results for these quantities, as calculated with the effective stiffness tensor components, while solid lines represent the Zener model fits. The azimuth of the fracture normal is 45°, and the fracture length is 10 cm.

597
Fig. 4. The Zener model fits for an oil-saturated media, including the (a) real parts of the stiffness tensor components, (b) imaginary parts of the stiffness tensor components, (c) quasi-P wave phase velocity (Vqp), quasi-shear wave phase velocity (Vqsv) and pure-shear (Vsh) wave phase velocity, and (d) inverse quality factor of the quasi-P (1/Qqp), inverse quality factor of quasi-shear (1/Qqsv), and inverse quality factor of pure-shear (1/Qsh) waves. The symbols represent the results for these quantities, as calculated with the effective stiffness tensor components, while solid lines represent the Zener model fits. The azimuth of the fracture normal is 45°, and the fracture length is 3 m. Figs. 5 and 6 represent the model results for the gas-saturated medium. Again, the Zener model provides a good approximation for each stiffness tensor component and each wave type. In the gas-saturated medium, the relaxation peaks occur at a relatively high frequency ( f >1000 Hz) when the fracture length is 10 cm and at lower frequencies (between 40 and 50 Hz) when the fracture length is 3 m. The attenuation of the quasi-compressional wave and the quasi-shear wave is at its highest in the gas-saturated medium. These results demonstrate that wave attenuation and velocity dispersion are sensitive to pore fluid and fracture length and can be fitted very well by using the Zener model in each example.
598
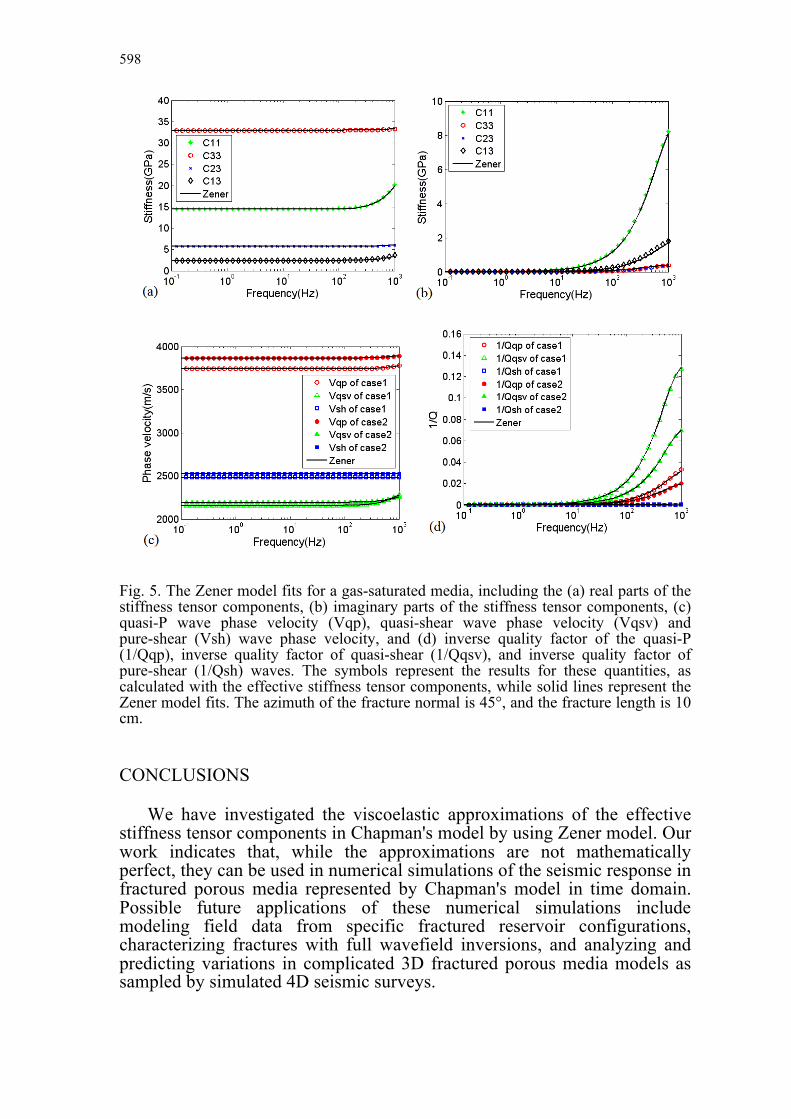
Fig. 5. The Zener model fits for a gas-saturated media, including the (a) real parts of the stiffness tensor components, (b) imaginary parts of the stiffness tensor components, (c) quasi-P wave phase velocity (Vqp), quasi-shear wave phase velocity (Vqsv) and pure-shear (Vsh) wave phase velocity, and (d) inverse quality factor of the quasi-P (1/Qqp), inverse quality factor of quasi-shear (1/Qqsv), and inverse quality factor of pure-shear (1/Qsh) waves. The symbols represent the results for these quantities, as calculated with the effective stiffness tensor components, while solid lines represent the Zener model fits. The azimuth of the fracture normal is 45°, and the fracture length is 10 cm. CONCLUSIONS We have investigated the viscoelastic approximations of the effective stiffness tensor components in Chapman's model by using Zener model. Our work indicates that, while the approximations are not mathematically perfect, they can be used in numerical simulations of the seismic response in fractured porous media represented by Chapman's model in time domain. Possible future applications of these numerical simulations include modeling field data from specific fractured reservoir configurations, characterizing fractures with full wavefield inversions, and analyzing and predicting variations in complicated 3D fractured porous media models as sampled by simulated 4D seismic surveys.

599
Fig. 6. The Zener model fits for a gas-saturated media, including the (a) real parts of the stiffness tensor components, (b) imaginary parts of the stiffness tensor components, (c) quasi-P wave phase velocity (Vqp), quasi-shear wave phase velocity (Vqsv) and pure-shear (Vsh) wave phase velocity, and (d) inverse quality factor of the quasi-P (1/Qqp), inverse quality factor of quasi-shear (1/Qqsv), and inverse quality factor of pure-shear (1/Qsh) waves. The symbols represent the results for these quantities, as calculated with the effective stiffness tensor components, while solid lines represent the Zener model fits. The azimuth of the fracture normal is 45°, and the fracture length is 3 m. ACKNOWLEDGEMENTS This work was supported by the Key Program of National Natural Science Foundation of China (Grant No. 40974054).

600
REFERENCES Al-Harrasi, O.H., Kendall, J.M. and Chapman, M., 2011. Fracture characterization using
frequency-dependent shear wave anisotropy analysis of microseismic data. Geophys. J. Internat., 185: 1059-1070.
Ba, J., Carcione, J.M., Du, O., Zhao, H. and Müller, T.M., 2015. Seismic Exploration of Hydrocarbons in Heterogeneous Reservoirs, New Theories, Methods and Applications. Elsevier Science Publishers, Amsterdam.
Baird, A.F., Kendall, J.M. and Angus, D.A., 2013. Frequency-dependent seismic anisotropy due to fractures: Fluid flow versus scattering. Geophysics., 78: WA111-WA122.
Batzle, M., Hofmann, R., Han, D. and Castagna, J., 2001. Fluids and frequency dependent seismic velocity of rocks. The Leading Edge., 20: 168-171.
Carcione, J.M., 1995. Constitutive model and wave equations for linear, viscoelastic, anisotropic media. Geophysics., 60: 537-548.
Carcione, J.M., 2000. A model for seismic velocity and attenuation in petroleum source rocks. Geophysics., 65: 1080-1092.
Carcione, J.M. and Picotti, S., 2006. P-wave seismic attenuation by slow-wave diffusion: Effects of inhomogeneous rock properties. Geophysics., 71: O1-O8.
Carcione, J.M., 2014. Wave Fields in Real Media. Theory and Numerical Simulation of Wave Propagation in Anisotropic, Anelastic, Porous and Electromagnetic Media, 3rd ed., extended and revised. Elsevier Science Publishers, Amsterdam.
Chapman, M., 2003. Frequency dependent anisotropy due to mesoscale fractures in the presence of equant porosity. Geophys. Prosp., 51: 369-379.
Chapman, M., Maultzsch, S., Liu, E. and Li, X.Y., 2003. The effect of fluid saturation in an anisotropic multi-scale equant porosity model. J. Appl. Geophys., 54: 191-202.
Chapman, M., Liu, E. and Li, X.Y., 2006. The influence of fluid-sensitive dispersion and attenuation on AVO analysis. Geophys. J. Internat., 167: 89-105.
Chapman, M., 2009. Modeling the effect of multiple fracture sets of mesoscale fractures in porous rock on frequency-dependent anisotropy. Geophysics., 74: D97-D103.
Chesnokov, E.M., Queen, J.H., Vichorev, A., Lynn, H.B., Hooper. J., Bayuk, I., Castagna, J. and Roy, B., 2001. Frequency dependent anisotropy. Expanded Abstr., 71st Ann. Internat. SEG Mtg., San Antonio: 2120-3.
Dasgupta. R. and Clark, R.A., 1998. Estimation of Q from surface seismic reflection data. Geophysics., 63: 2120-2128.
Dasios, A., Astin, T. and McCann, C., 2001. Compressional-wave Q estimation from full-waveform sonic data. Geophys. Prosp., 49: 353-373.
Galvin, R.J. and Gurevich, B., 2007. Effective properties of a poroelastic medium containing a distribution of aligned cracks. J. Geophys. Res., 114: B07305.
Gurevich, B., Brajanovski, M., Galvin, R., Müller, T.M. and Toms-Stewart, J., 2009. P-wave dispersion and attenuation in fractured and porous reservoirs-Poroelasticity approach. Geophys. Prospect., 57: 225-237.
Johnson, D. L., 2001. Theory of frequency dependent acoustics in patchy saturated porous media. J. Acoust. Soc. Am., 110: 682-694.
Klimentos, T., 1995. Attenuation of P- and S-waves as a method of distinguishing gas and condensate from oil and water. Geophysics., 60: 447-458.
Liu, E., Queen, J.H., Li, X.Y., Maultzsch, M.S., Lynn, H.B. and Chesnokov, E.M., 2003. Observation and analysis of frequency-dependent anisotropy from a multicomponent VSP at Bluebell-Altamont field, Utah. J. Appl. Geophys., 54: 319-333.
Liu, X., Greenhalgh, S. and Zhou, B., 2009. Transient solution for poro-viscoacoustic wave propagation in double porosity media and its limitations. Geophys. J. Internat., 178: 375-393.
601
Maultzsch, S., Chapman, M., Liu, E. and Li, X.Y., 2003. Modelling
frequency-dependent seismic anisotropy in fluid-saturated rock with aligned fractures: Implication of fracture size estimation from anisotropic measurements. Geophys. Prosp., 51: 381-392.
Mavko, G., Mukerji, T. and Dvorkin, J., 2009. The Rock Physics Handbook, 2nd ed. Cambridge University Press, Cambridge.
Müller, T.M. and Gurevich, B., 2004. One-dimensional random patchy saturation model for velocity and attenuation in porous rocks. Geophysics., 69: 1166-1172.
Müller, T.M., Toms-Stewart, J. and Wenzlau, F., 2008. Velocity-saturation relation for partially saturated rocks with fractal pore fluid distribution. Geophys. Res. Lett., 26: L09306.
Müller, T.M., Gurevich, B. and Lebedev, M., 2010. Seismic wave attenuation and dispersion resulting from wave-induced flow in porous rocks - a review. Geophysics., 75: 147-164.
Parra, J.O., 2000. Poroelastic model to relate seismic wave attenuation and dispersion to permeability anisotropy. Geophysics., 65: 202-210.
Picotti, S., Carcione, J.M., Rubino, J.G., Santos, J.E. and Cavallini, F., 2010. A visoelastic representation of wave attenuation in porous media. Comput. Geosci-UK., 36: 44-53.
Picotti, S., Carcione, J.M., Gei, D., Rossi, G. and Santos, J.E., 2012. Seismic modeling to monitor CO2 geological storage: The Atzbach-Schwanenstadt gas field. J. Geophys. Res., 117: B06103.
Pride, S.R., Berryman, J.G. and Harris, J.M., 2004. Seismic attenuation due to wave-induced flow. J. Geophys. Res., 109: B01201.
Quintal, B., Schmalholz, S.M. and Podladchikov, Y.Y., 2009. Low-frequency reflections from a thin layer with high attenuation caused by interlayer flow. Geophysics., 74: N14-22.
Rapoport, M.B., Rapoport, L.I. and Ryjkov, V.I., 2004. Direct detection of oil and gas fields based on seismic inelasticity effect. The Leading Edge., 23: 276-278.
Sun, L.F., Milkereit, B. and Schmitt, D.R., 2009. Measuring velocity dispersion and attenuation in the exploration seismic frequency band. Geophysics., 74: WA113-122.
White, J.E., 1975. Computed seismic speed sand attenuation in rocks with partial gas saturation. Geophysics., 40: 224-232.
White, J.E., Mikhaylova, G. and Lyakhovitskiy, F.M., 1975. Low-frequency seismic waves in fluid-saturated layered rocks. Izvestija Academy of Sciences USSR Physics of the Solid Earth, 11: 654-659.