Embed Size (px)
Citation preview

A view on the sustainability of U.S. beef production
Sara E. Place, Ph.D.
Senior Director, Sustainable Beef Production Research
National Cattlemen’s Beef Association, a contractor with the Beef Checkoff

Environment
SocialEconomic
• Environmental footprints
• Ecosystem
services/biodiversity
• Multi-functionality of land use
• Considering animal feed use
from a human edible
standpoint
• Producer economic
viability
• Contributions to
rural economies
• Affordability of food
to consumers
• Nutritional quality
• Human health
• Animal welfare
• Antibiotic/technology use
• Culture/traditions of
producers and eaters
The sustainability of our food
systems requires balancing
multiple important criteria
Overarching needs:
• Whole systems approaches
• Focus on the nexus of
different aspects of
sustainability
• Characterize and
quantify interrelatedness
of food, fiber, and fuel
industries and
integration of plant and
animal agriculture
• Recognize the role of value
judgments and uncertainty

Cow-calf segment
(grazing or high forage diet [e.g., hay in winter months])
• Beef cows – 31,213,200
• Beef replacement heifers –6,368,200
• Bulls – 2,243,600
• Calves <500lbs. – 14,386,300
• Total in segment on Jan. 1, 2017: 54,211,300
Stockers/backgrounding
(grazing or high forage diet)
• Steers and heifers bound for a feedlot, but consuming high forage diet (cheap body weight gain): 12,326,300
• This segment is in flux continuously – length of time in the stocker phase is determined by market conditions and the availability of cheap forage/grass
Cattle on feed
(in feedlots, consuming grain-based diet)
• Steers and heifers eating grain-based diet for 4-6 months: 13,067,000
• Cattle on feed inventory will fluctuate throughout the year (peaks in the fall), but is typically in the 13 to 15 million head range all year. These are the only cattle in the US eating a grain-based diet.
• Avg. diet for US feedlot cattle: 55% grain, 30% plant leftovers (e.g., distillers grains) 10% forage, 5% minerals and vitamins (NASEM, 2016)
Source: USDA NASS January Cattle report
Cattle inventory on January 1st, 2017(excluding the 4.7 mil. dairy replacement heifers and 9.3 mil. dairy cows)

4
Southwest
Southern Plains
Northern Plains
Northwest
Northeast
Southeast
Midwest
Rotz et al., 2019. Ag Syst. 169 (Feb.):1-13.

Distribution of environmental footprint across sources (regional ranges)
5
Rotz et al., 2019. Ag Syst. 169 (Feb.):1-13.
17 - 27 kg
CO2e / kg
carcass
weight
121 – 257 g N /
kg carcass
weight
40-60 MJ /
kg carcass
weight
200 – 5,800 L/kg
carcass weight

Distribution among Phases
0% 10% 20% 30% 40% 50% 60% 70% 80% 90% 100%
Total
Upstream sources
Combustion NOx
Nitrification & denitrif.
Leaching and runoff
Ammonia N
Total
Purchased feed
Drinking
Dust control
Feed production
Total
Upstream sources
Transport energy
Manure handling
Animal housing
Animal feeding
Feed production
Total
Upstream sources
Anthropogenic CO2
Nitrous oxide
MethaneR
eact
ive
N l
oss
Blu
e w
ater
use
Foss
il e
ner
gy
use
GH
G
emis
sio
n
Cow-calf Stocker/Background FinishRotz et al., 2019. Ag Syst. 169 (Feb.):1-13.

Greenhouse Gas Emission
4%
21%
17%
12%
29%
8%9%
242,618 Gg CO2e
Northeast
Southeast
Midwest
Northern Plains
Southern Plains
Northwest
Southwest
3.3% of US GHG emissions Rotz et al., 2019. Ag Syst. 169 (Feb.):1-13.

Reactive Nitrogen Loss
5%
22%
19%
12%
26%
7%9%
1760 Gg
Northeast
Southeast
Midwest
Northern Plains
Southern Plains
Northwest
Southwest
~15% of national atmospheric Nr emissions (N2O, NH3, NOx)
estimated by Reis et al., 2009 Rotz et al., 2019. Ag Syst. 169 (Feb.):1-13.

Fossil Energy Use
4%
16%
16%
12%34%
6%12%
569,096 TJ
Northeast
Southeast
Midwest
Northern Plains
Southern Plains
Northwest
Southwest
0.7% of US fossil fuel combustionRotz et al., 2019. Ag Syst. 169 (Feb.):1-13.

Blue Water Consumption
0.5% 2% 3%
11%
34%28%
22%
23,157 GL
Northeast
Southeast
Midwest
Northern Plains
Southern Plains
Northwest
Southwest
~5% of US water withdrawalsRotz et al., 2019. Ag Syst. 169 (Feb.):1-13.
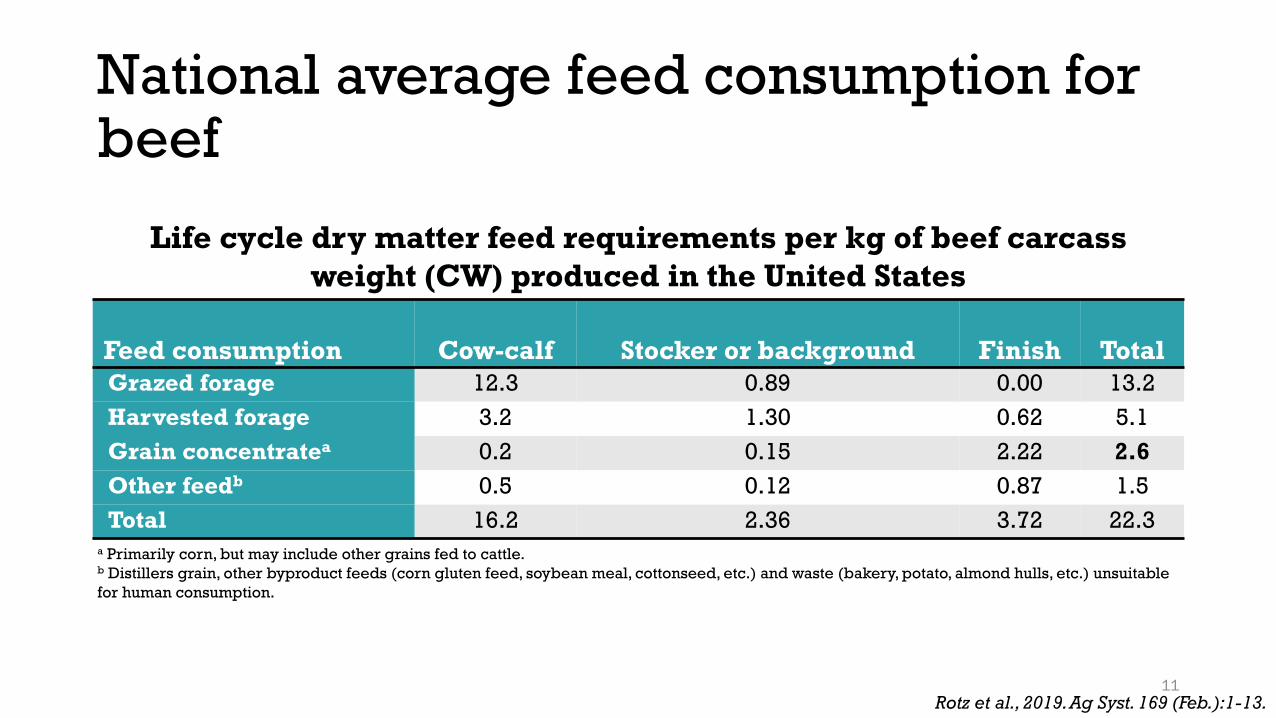
National average feed consumption for beef
11
Feed consumption Cow-calf Stocker or background Finish Total
Grazed forage 12.3 0.89 0.00 13.2
Harvested forage 3.2 1.30 0.62 5.1
Grain concentratea 0.2 0.15 2.22 2.6
Other feedb 0.5 0.12 0.87 1.5
Total 16.2 2.36 3.72 22.3
Life cycle dry matter feed requirements per kg of beef carcass
weight (CW) produced in the United States
a Primarily corn, but may include other grains fed to cattle.b Distillers grain, other byproduct feeds (corn gluten feed, soybean meal, cottonseed, etc.) and waste (bakery, potato, almond hulls, etc.) unsuitable
for human consumption.
Rotz et al., 2019. Ag Syst. 169 (Feb.):1-13.

Pounds of feed per
pound of product,
live weight
Pounds of human-
edible feed (e.g.,
corn, soy) per
pound of product,
live weight
13.8
1.6
2.5
U.S. average
grain-finished
beef (full life
cycle)*
Broiler chicken
(Avigen ROSS 308
@ 40 days)
Pork (Wilkinson,
2011)
1.6
1.4
2.0
*From Rotz et al., 2019. Ag Syst. 169 (Feb.):1-13. **Using DIAAS from Ertl et al., 2016
2.53
0.85
0.70
Net protein
contribution** (values
> 1 mean more high
quality protein
generated than used)

13
Source: https://www.farmland.org/initiatives/farms-under-threat

“Our results suggest that each individual beef sector
and the entire value chain produce more high-quality
HeP (human-edible protein) than is consumed in
production. Accordingly, beef is a net contributor
to meeting human protein requirements.”

Ecosystem services Ecosystems are communities of living organisms interacting with their physical
environment and one another.
Ecosystem services are the benefits which people obtain from the ecosystem. In most cases,
ecosystems provide these services at little or no financial cost & the benefits can accrue to an
individual or to society as a whole.
Source: Goodman and Reuter, 2017.

Ecosystem services
16
“…an estimated total economic
value of ecosystem services for
beef cattle ranching of $57.67
per acre of pasture and
rangeland. Applying this per-
acre value to the 257 million
acres of pasture and rangeland
used for beef production by
ranching and farming
operations in the United States,
results in an estimated $14.8
billion in total ecosystem
services provided annually.”

THANK YOU
For more information, please visit:http://beefresearch.org/beefsustainability.aspx