Embed Size (px)
Citation preview

A Vibrotactile Floor for Enabling Interactionthrough Walking in Virtual Spaces
Alvin Wing-Hong Law
Department of Electrical & Computer EngineeringMcGill UniversityMontreal, Canada
September 2010
A thesis submitted to McGill University in partial fulfillment of the requirements for thedegree of Masters in Engineering.
c© 2010 Alvin W. Law
2010/09/26

2

i
Abstract
In existing virtual environments, conventional ground surfaces often impair a user’s
sense of immersion due to their static nature. This thesis presents a novel approach to
enhance one’s sense of presence through a floor interface platform that mimics a variety
of ground terrains. The ambient system records the force profile of footsteps, synthesizes
appropriate responses, and delivers these signals through vibrating floor tiles to imitate the
feel and sound of walking on various surfaces. High-quality interactive graphics provided
by overhead projectors complete the multimodal experience. Virtual snow and ice envi-
ronments were developed that allow users to create footprints and crack a frozen ice sheet.
Moreover, a perceptual experiment involving the recognition of eight vibration patterns, or
haptic icons, delivered to the feet was performed to gauge its discrimination ability. It was
found that the interaction afforded to users by the augmented floor was both engaging and
perceptually convincing.

ii
Sommaire
A present, dans les milieux virtuels, les surfaces de planchers conventionnelles nuisent a
la sensation d’immersion a cause de leur nature statique. Cette these de recherche propose
une approche nouvelle pour ameliorer l’experience de l’utilisateur en utilisant un plancher
interactif capable de reproduire plusieurs sortes de terrains. Le systeme ambiant capte le
profile de force applique au plancher par les pas de l’utilisateur, synthese une reponse ap-
propriee et transmet ces signaux a l’aide de tuiles vibrantes ce qui reproduit la sensation
tactile et sonore de marcher sur divers types de surfaces. De plus, la surface du plancher est
illuminee par des projecteurs suspendus au plafond, permettant la projection de graphiques
interactifs et de hautes qualites pour completer l’experience multimodale. Par exemple, des
environnements virtuels hivernaux permettant aux utilisateurs de laisser leurs traces dans
la neige ou de craquer la glace d’un etang gele ont ete developpes pour demontrer les capa-
cites du systeme. De plus, une etude de perception sur la reconnaissance de huit modeles
de vibration, ou d’icones tactiles, transmis par notre plancher pour elucider la capacite
de discrimination du pied a permit de decouvrir que notre systeme est perceptivement
convaincant et prenant.

iii
Acknowledgments
First of all, I would like to sincerely extend my appreciation to my supervisor, Jeremy
R. Cooperstock, for his guidance and discussions over the past two years, and, particularly,
for always stressing the big picture. This thesis would not have been possible without the
work of Yon Visell, who started the project shortly before I joined the Shared Reality and
Environments (SRE) Laboratory and continues to guide its development.
I would like to thank Paul Kry and Benjamin Peck, who created the graphics for the
snow environment. Much appreciation also goes to Jessica Ip, who helped with the pro-
gramming for both virtual simulations. Courses taken during my degree with Vincent
Hayward, Frank Ferrie, Philipe Depalle, Marcelo Wanderley, and Irene Leszkowicz were all
extremely insightful.
The floor platform could not have been constructed within such a short time frame
without the help of Michael Mark and Gil Rind. Special thanks to Dalia, Gaurav and all
the other SRE lab members for creating an enjoyable work atmosphere.
Finally, I would like to dedicate this thesis to my family - Tammy, Jeannette, Peter
and Amy - and to all the friends I have met here in Montreal and back in Vancouver. My
sincerest gratitude goes out to all of you.
Funding for this project was provided by the Natural Sciences and Engineering Research
Council (NSERC), les Fonds Quebecois de Recherche sur la Nature et les Technologies
(FQRNT), and the Canada Foundation for Innovation (CFI).

iv
Contents
1 Introduction 1
1.1 Virtual Environments . . . . . . . . . . . . . . . . . . . . . . . . . . . . . . 2
1.2 Foot-centered Interaction . . . . . . . . . . . . . . . . . . . . . . . . . . . . 3
1.2.1 Locomotion . . . . . . . . . . . . . . . . . . . . . . . . . . . . . . . 3
1.3 Literature Review . . . . . . . . . . . . . . . . . . . . . . . . . . . . . . . . 4
1.3.1 Augmented Floors . . . . . . . . . . . . . . . . . . . . . . . . . . . 4
1.3.2 Augmented Shoes . . . . . . . . . . . . . . . . . . . . . . . . . . . . 8
1.4 Overview . . . . . . . . . . . . . . . . . . . . . . . . . . . . . . . . . . . . . 8
2 Hardware 11
2.1 Design Guidelines . . . . . . . . . . . . . . . . . . . . . . . . . . . . . . . . 11
2.2 First Generation . . . . . . . . . . . . . . . . . . . . . . . . . . . . . . . . 13
2.3 Actuation . . . . . . . . . . . . . . . . . . . . . . . . . . . . . . . . . . . . 14
2.3.1 Proprioceptive versus tactile sensing . . . . . . . . . . . . . . . . . 15
2.3.2 Characteristics of vibrotactile motors . . . . . . . . . . . . . . . . . 15
2.4 Sensing . . . . . . . . . . . . . . . . . . . . . . . . . . . . . . . . . . . . . . 17
2.4.1 Force Sensors . . . . . . . . . . . . . . . . . . . . . . . . . . . . . . 17
2.4.2 Data Acquisition Units . . . . . . . . . . . . . . . . . . . . . . . . . 19
2.4.3 Calibration . . . . . . . . . . . . . . . . . . . . . . . . . . . . . . . 20
2.5 Physical Construction . . . . . . . . . . . . . . . . . . . . . . . . . . . . . 20
2.5.1 Base structure . . . . . . . . . . . . . . . . . . . . . . . . . . . . . . 21
2.5.2 Tile material . . . . . . . . . . . . . . . . . . . . . . . . . . . . . . 25
2.5.3 Suspension . . . . . . . . . . . . . . . . . . . . . . . . . . . . . . . . 26
2.5.4 Graphical Display . . . . . . . . . . . . . . . . . . . . . . . . . . . . 27
Contents v
2.6 System Architecture . . . . . . . . . . . . . . . . . . . . . . . . . . . . . . 30
2.7 Overall Environment . . . . . . . . . . . . . . . . . . . . . . . . . . . . . . 32
3 Applications 35
3.1 Haptic-Audio Synthesis . . . . . . . . . . . . . . . . . . . . . . . . . . . . . 35
3.1.1 Sound Design Tools . . . . . . . . . . . . . . . . . . . . . . . . . . . 36
3.1.2 Available Parameter Adjustments . . . . . . . . . . . . . . . . . . . 37
3.2 Snow Simulation . . . . . . . . . . . . . . . . . . . . . . . . . . . . . . . . 41
3.2.1 Haptic-Audio Rendering of Snow . . . . . . . . . . . . . . . . . . . 41
3.2.2 Deformable Terrain Rendering . . . . . . . . . . . . . . . . . . . . . 42
3.2.3 Motion Capture . . . . . . . . . . . . . . . . . . . . . . . . . . . . . 47
3.2.4 Results . . . . . . . . . . . . . . . . . . . . . . . . . . . . . . . . . . 48
3.3 Ice Simulation . . . . . . . . . . . . . . . . . . . . . . . . . . . . . . . . . . 48
3.3.1 Haptic-Audio Rendering of Ice . . . . . . . . . . . . . . . . . . . . . 50
3.3.2 Visual Crack Rendering . . . . . . . . . . . . . . . . . . . . . . . . 51
3.3.3 Position Sensing . . . . . . . . . . . . . . . . . . . . . . . . . . . . . 56
3.3.4 Results . . . . . . . . . . . . . . . . . . . . . . . . . . . . . . . . . . 57
3.4 Haptic Icons Underfoot . . . . . . . . . . . . . . . . . . . . . . . . . . . . . 58
3.4.1 Motivation . . . . . . . . . . . . . . . . . . . . . . . . . . . . . . . . 59
3.4.2 Background . . . . . . . . . . . . . . . . . . . . . . . . . . . . . . . 60
3.4.3 Design of Stimulus Set . . . . . . . . . . . . . . . . . . . . . . . . . 61
3.4.4 Methodology . . . . . . . . . . . . . . . . . . . . . . . . . . . . . . 61
3.4.5 Results . . . . . . . . . . . . . . . . . . . . . . . . . . . . . . . . . . 62
4 Conclusions and Future Work 67
4.1 Conclusions . . . . . . . . . . . . . . . . . . . . . . . . . . . . . . . . . . . 67
4.2 Future Work . . . . . . . . . . . . . . . . . . . . . . . . . . . . . . . . . . . 70
A User Testing Documents 73
Bibliography 77

vi
List of Figures
2.1 Clark Synthesis Tactile Sound Transducer Silver. . . . . . . . . . . . . . . 16
2.2 A Voltage to Current circuit was used to help linearize the force readings.
For stepping forces, we use a value of 150 Ohms for RG. . . . . . . . . . . 18
2.3 Top-down view of sensor placement relative to the actuator and the rigid
floor tile. . . . . . . . . . . . . . . . . . . . . . . . . . . . . . . . . . . . . . 18
2.4 One of the 36 actuated regions. . . . . . . . . . . . . . . . . . . . . . . . . 21
2.5 Base structure provides stability to sensing and actuation components. . . 22
2.6 Dimensions of one row. . . . . . . . . . . . . . . . . . . . . . . . . . . . . . 23
2.7 Dimensions of the cross-beam pieces. . . . . . . . . . . . . . . . . . . . . . 24
2.8 Left : Signal cables from the six sets of FSRs are plugged into the Gluion
device. Right : Banana plugs provide an easily accessible interface to the
actuator units. . . . . . . . . . . . . . . . . . . . . . . . . . . . . . . . . . 24
2.9 Base structure with tiles and border covers. . . . . . . . . . . . . . . . . . 26
2.10 Three views of the tile with attached rubber supports and tactile sound
transducer. . . . . . . . . . . . . . . . . . . . . . . . . . . . . . . . . . . . 27
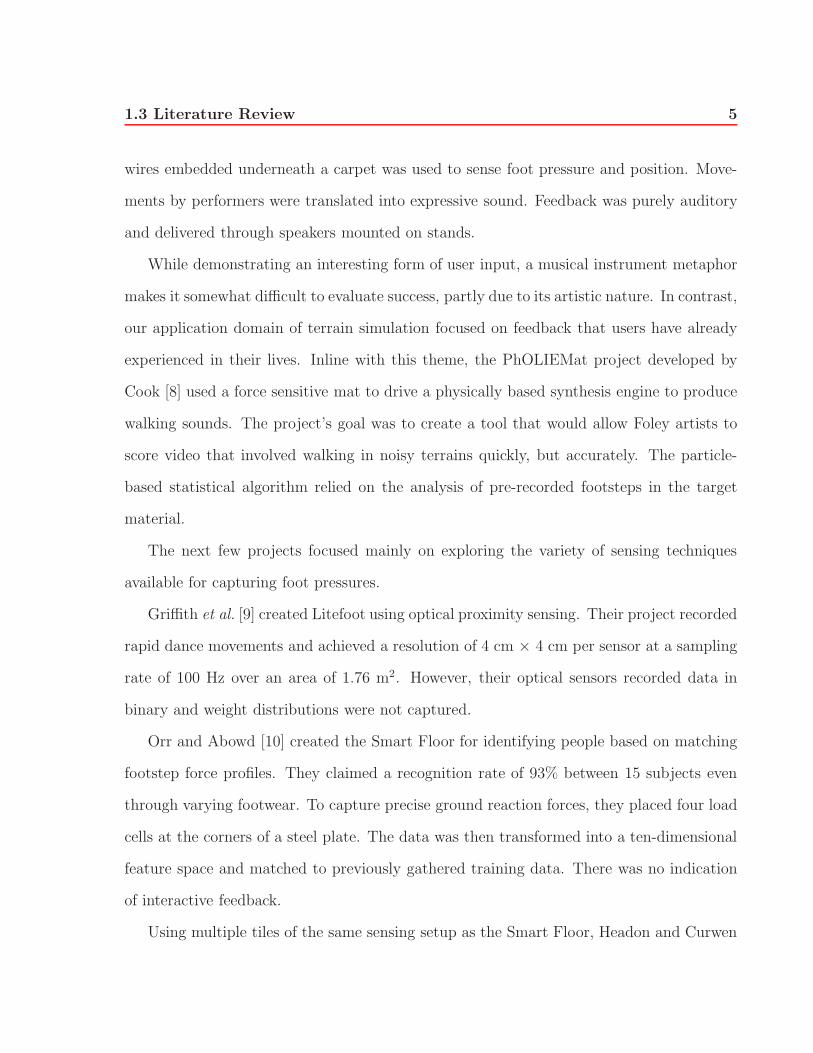
2.11 The retainer socket is used to limit the tile’s lateral movement. . . . . . . . 28
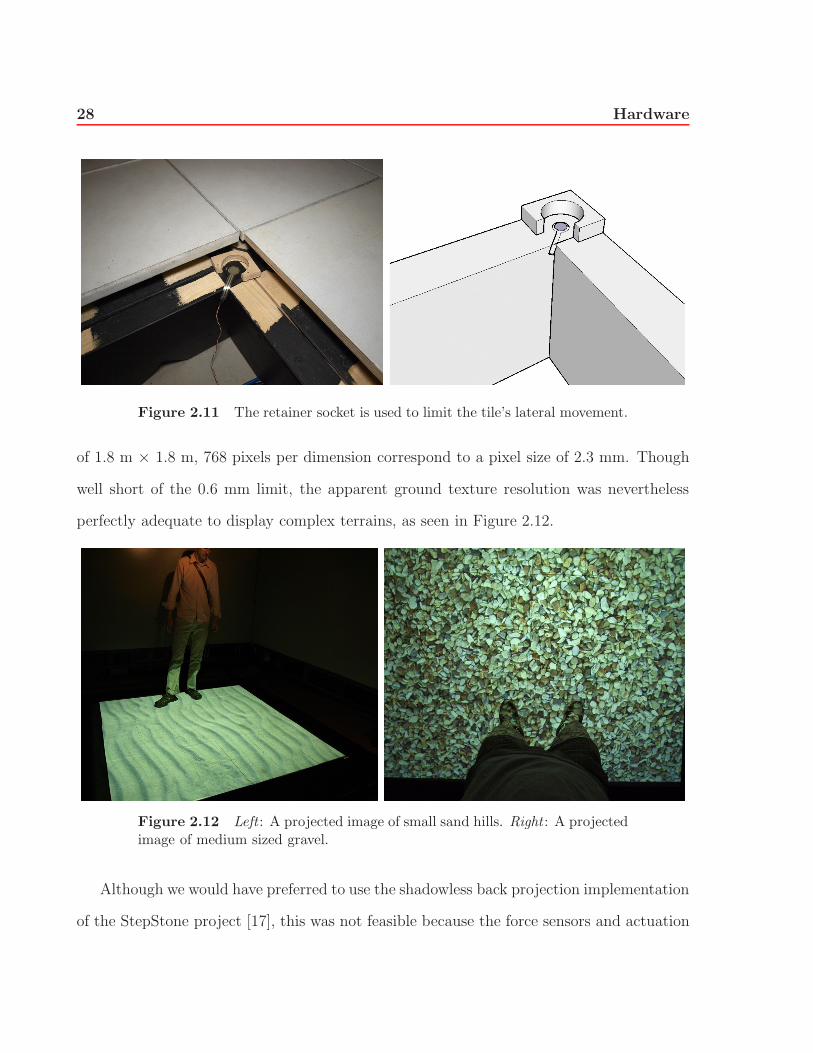
2.12 Left : A projected image of small sand hills. Right : A projected image of
medium sized gravel. . . . . . . . . . . . . . . . . . . . . . . . . . . . . . . 28
2.13 Visuals are provided by dual overhead projectors. . . . . . . . . . . . . . . 29
2.14 Resulting shadow effect from two overlapping projectors. . . . . . . . . . . 30
2.15 A top-down view of the overall placement of components and the logical
connections between them. . . . . . . . . . . . . . . . . . . . . . . . . . . . 31
2.16 The rack of haptic-audio synthesis computers and multi-channel audio hard-
ware. . . . . . . . . . . . . . . . . . . . . . . . . . . . . . . . . . . . . . . . 32

List of Figures vii
2.17 Sketch of the completed construction in the lab’s existing VE. It includes
three back-projected screens and a set of motion capture cameras. . . . . . 33
2.18 The completed floor inside the lab’s CAVE. . . . . . . . . . . . . . . . . . 34
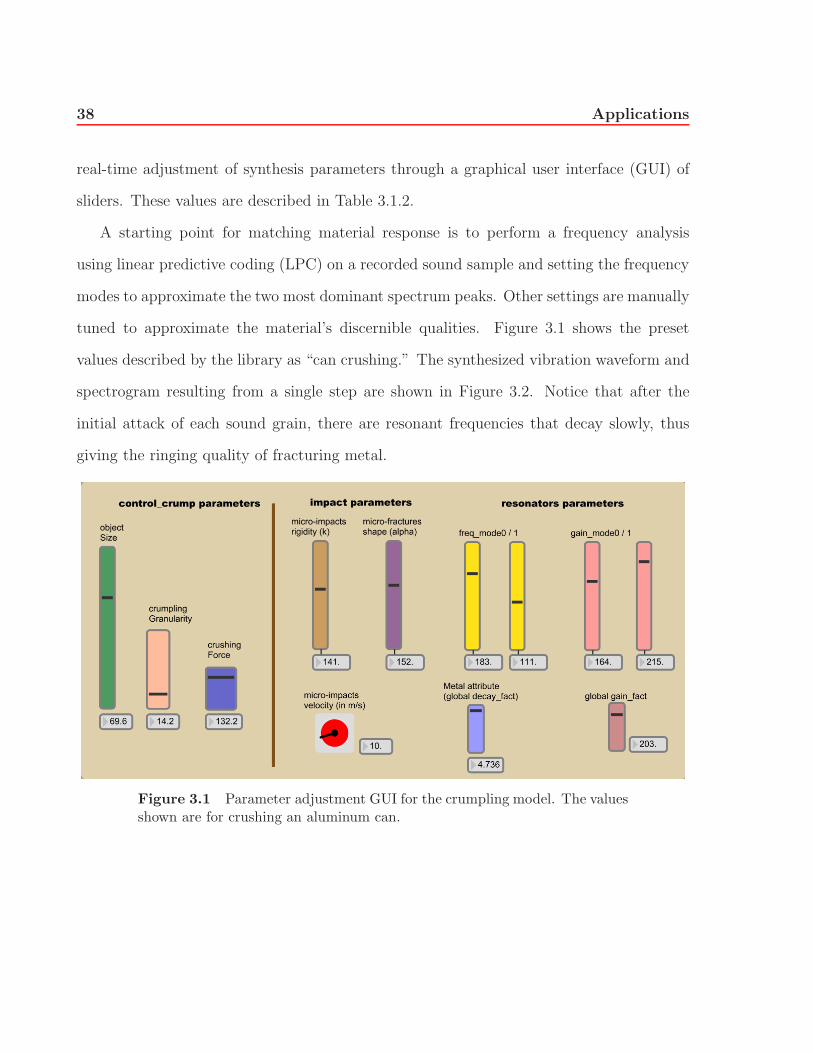
3.1 Parameter adjustment GUI for the crumpling model. The values shown are
for crushing an aluminum can. . . . . . . . . . . . . . . . . . . . . . . . . . 38
3.2 Signal analysis of synthesized feedback with can-crushing parameter settings
resulting from one step. Above: Vibration waveform. Below : Associated
spectrogram. . . . . . . . . . . . . . . . . . . . . . . . . . . . . . . . . . . 40
3.3 Chosen parameter values for the snow simulation. . . . . . . . . . . . . . . 43
3.4 Signal analysis of synthesized feedback with snow parameter settings re-
sulting from one step. Above: Vibration waveform. Below: Associated
spectrogram. . . . . . . . . . . . . . . . . . . . . . . . . . . . . . . . . . . 44
3.5 The interactive snow field. . . . . . . . . . . . . . . . . . . . . . . . . . . . 45
3.6 Left : Simple footsteps. Middle: A foot drag. Right : A foot swipe. . . . . . 46
3.7 Vicon markers are attached to the user’s feet using an elastic Velcro strap. 47
3.8 A trail of footsteps is left behind by the walker. . . . . . . . . . . . . . . . 49
3.9 Chosen parameter values for the ice simulation. . . . . . . . . . . . . . . . 51
3.10 Signal analysis of synthesized feedback with ice parameter settings resulting
from one step. Above: Vibration waveform. Below: Associated spectrogram. 52
3.11 The interactive frozen pond surface. . . . . . . . . . . . . . . . . . . . . . . 53
3.12 Left : Nodes of one crack arm and its direction vector. Right : Multiple arms
of a crack object. . . . . . . . . . . . . . . . . . . . . . . . . . . . . . . . . 54
3.13 The crack arms propagate outwards from the foot. The lines have been
enhanced in the photographs to show the effect. . . . . . . . . . . . . . . . 55
3.14 Branching occurring on the right crack arm. . . . . . . . . . . . . . . . . . 56
3.15 The cracking pattern is rendered over top of the ice texture. Circles indicate
a few instances of fish. . . . . . . . . . . . . . . . . . . . . . . . . . . . . . 57
3.16 A shatter occurs at one of the crack seed points. . . . . . . . . . . . . . . . 58
3.17 Average correct identification rates across all sessions for each subject. . . 63
3.18 Average correct identification rates across all subjects for each stimulus. . . 64
3.19 Confusion matrix for all subjects indicating number of responses by the
darkness of the cell. . . . . . . . . . . . . . . . . . . . . . . . . . . . . . . 64

viii List of Figures
3.20 Mean recognition rates averaged across all subjects for each session. . . . . 65

ix
List of Tables
2.1 Available large vibrotactile transducers. All prices are in USD. . . . . . . . 16
3.1 Descriptions of available haptic-audio synthesis parameters. . . . . . . . . . 39

x
List of Acronyms
ADC Analog-to-Digital Converter
AWG American Wire Gauge
BIP Breaks in Presence
CAVE Cave Automatic Virtual Environment
EVA Ethylene Vinyl Acetate
FSR Force Sensing Resistor
GUI Graphical User Interface
IR Infrared
LPC Linear Predictive Coding
MIDI Musical Instrument Digital Interface
OSC Open Sound Control
SDT Sound Design Tools
STP Shielded Twisted Pair
UDP User Datagram Protocol
USB Universal Serial Bus
VE Virtual Environment
VR Virtual Reality

1
Chapter 1
Introduction
Imagine a scenario in which people are shown a virtual reality (VR) simulation of a
beach. They look around and see the sun shining in the sky. They can hear the ocean
waves crashing onto the shore and seagulls squawking while circling above. They navigate
themselves to the shoreline and walk into the water. Ripples appear as their feet make
contact with the water and splashing sounds are heard with their every step.
State of the art VR systems are already capable of delivering a convincing level of
realism. However, certain cues remain that disrupt the illusion and remind the users that
they are, in fact, in a research centre’s lab. These cues are called “breaks in presence”
(BIPs) [1]. Users may mention that the ambient temperature did not feel correct or that
they felt no breeze. There could be comments that the simulation lacked the ocean’s smell
or that computers and electronics could be seen. Users may also point out that whether
they were walking in sand or water, the ground forces resembled the same standard hard
flooring material common to most buildings. They did not sink into the sand nor sense the
physical “splash” of stepping into a water puddle.
When placed within a particular scene, users have certain expectations from their sen-
2010/09/26

2 Introduction
sory system that, when broken, impair their sense of immersion. The main goal of this
thesis is to remedy one BIP mentioned above, the static flooring issue, by developing a
device that can be controlled to emulate different terrains.
We have prototyped a floor platform that is enhanced with embedded sensing capabil-
ities and feedback in three modalities: haptic, auditory and visual. Although the ground
interface is applicable to a variety of fields, we focus on its role in improving existing virtual
environments (VE). Our augmented floor can operate as an additional interaction surface
or act as a normal rigid platform when not in use.
1.1 Virtual Environments
A VE is a combination of specialized devices and techniques that attempt to transport
users completely into a virtual world by recreating the stimuli that they perceive in real-life
settings. Detailed 3D graphics recreate objects and surroundings, sounds can emerge from
all directions, and sometimes, users can even feel what they are looking at.
The improvement of visuals are a major focus of VEs. Through a computer screen, the
user is presented with a very limited field of view. This has been addressed in two main
ways: using a head-mounted display (HMD) or increasing the screen size.
HMDs are devices with two small embedded screens that are worn over the eyes. The
position and orientation of the user’s head is tracked and the resulting view for each eye
is rendered producing a 3D image. This is an example of pure virtual reality in which
everything seen is generated.
In the case of a Cave Automatic Virtual Environment(CAVE) [2], screens several meters
wide are arranged in the shape of a cube to completely encompass the user. This is usually
achieved by rear-projection to avoid occlusion from the users themselves. The display

1.2 Foot-centered Interaction 3
that appears on the floor can also be back-projected, but space constraints often require
installations to project from above. Advantages and disadvantages to both approaches are
described by Buxton and Fitzmaurice [3].
Directional audio can be rendered through either headphones – the usual choice for
HMDs – or an array of speakers positioned around the room. Sounds can provide additional
cues to support graphics or exist as the focus of interaction [4].
Recreating the reactive forces of virtual objects remains a challenge for a variety of
reasons. Unlike visual and auditory feedback, the sense of touch cannot be perceived at a
distance. The user must make a conscious effort to be in contact with a physical device in
order to receive feedback in this modality.
1.2 Foot-centered Interaction
Since haptic devices must be touching the body part it wishes to affect, it is difficult to
guarantee that the user will perceive the feedback at all assuming the contact is voluntary.
Moreover, few regions of the body are accustomed to being used for interaction purposes.
The hands are one such body part and the majority of haptics research revolves around
taking advantage of their sensitivity. However, one could argue that the feet are in regular
contact with the environment more often than the hands. It is surprising that foot-centered
haptics constitutes a small percentage of investigation in this field.
1.2.1 Locomotion
Walking is an integral part of familiarizing oneself with a new environment. In addition
to providing new vantage points such as navigating around a corner, information is gathered
through the act of walking itself. For example, in a field of large stones, it may be difficult

4 Introduction
to assess its stability purely through vision. A few steps could inform the walker whether
it would be wise to retreat. The firmness of stepping on a snow-covered ground could
provide information about the temperature of when the snow fell or if it had been previously
compacted. People have acquired a lifetime’s worth of experience in discriminating different
textures through foot contact.
1.3 Literature Review
The idea of augmented foot-based interaction is not entirely new. This section describes
previous related projects and explains why their implementations, which inspire compo-
nents of our design, do not completely satisfy our objectives. There have been two main
approaches to such previous research efforts: augmented floors and augmented shoes.
1.3.1 Augmented Floors
Early publications of sensor-augmented floors emerged from music technology and per-
formance research [5]. Their goals were to create unique instruments and controllers that
could facilitate gestural interactions with audio feedback. It is important to note that all of
the following floor-based interfaces supported and encouraged multiple simultaneous users.
Pinkston et al. [6] created a touch-sensitive dance floor that provided auditory feedback.
It functioned similarly to a large keyboard on the ground where performers could affect the
music by stepping onto designated regions. They used large force sensing resistor (FSR)
sheets to detect foot pressure and relayed the data through Musical Instrument Digital
Interface (MIDI) messages.
The Magic Carpet by Paradio et al. [7] extended the musical controller concept to full
body motion. Doppler radars sensed upper body movements and a grid of piezoelectric
1.3 Literature Review 5
wires embedded underneath a carpet was used to sense foot pressure and position. Move-
ments by performers were translated into expressive sound. Feedback was purely auditory
and delivered through speakers mounted on stands.
While demonstrating an interesting form of user input, a musical instrument metaphor
makes it somewhat difficult to evaluate success, partly due to its artistic nature. In contrast,
our application domain of terrain simulation focused on feedback that users have already
experienced in their lives. Inline with this theme, the PhOLIEMat project developed by
Cook [8] used a force sensitive mat to drive a physically based synthesis engine to produce
walking sounds. The project’s goal was to create a tool that would allow Foley artists to
score video that involved walking in noisy terrains quickly, but accurately. The particle-
based statistical algorithm relied on the analysis of pre-recorded footsteps in the target
material.
The next few projects focused mainly on exploring the variety of sensing techniques
available for capturing foot pressures.
Griffith et al. [9] created Litefoot using optical proximity sensing. Their project recorded
rapid dance movements and achieved a resolution of 4 cm × 4 cm per sensor at a sampling
rate of 100 Hz over an area of 1.76 m2. However, their optical sensors recorded data in
binary and weight distributions were not captured.
Orr and Abowd [10] created the Smart Floor for identifying people based on matching
footstep force profiles. They claimed a recognition rate of 93% between 15 subjects even
through varying footwear. To capture precise ground reaction forces, they placed four load
cells at the corners of a steel plate. The data was then transformed into a ten-dimensional
feature space and matched to previously gathered training data. There was no indication
of interactive feedback.
Using multiple tiles of the same sensing setup as the Smart Floor, Headon and Curwen

6 Introduction
[11] explored the recognition of human movements for ubiquitous gaming. Their sample
applications included a game in which a player moves to a specific tile after seeing a visual
location cue on a screen. Another application was navigating a first-person shooter by
mapping specific tiles to directional keys.
A project known as Z-tiles [12] was developed to allow for interactive floor spaces of
reconfigurable shapes and sizes. Each Z-tile consisted of twenty hexagonal force sensing
resistors with a resolution of 4 cm × 4 cm per sensor at 100 Hz. The shape of the Z-tile was
unique in that it allowed the tiles to interlock with one another. Through spring-loaded
connections, the micro-controllers in each tile communicated with their adjacent neigh-
bours. Setup did not require stringing connection wires and each tile was interchangeable
with the next. Their example applications were floor-based music control and movement
through VEs by leaning.
A significant increase in resolution and sampling rate was achieved by Srinivasan et
al. [13]. Their project captured extremely accurate pressure and position information of
human locomotion. The floor was assembled out of individual mats, which could operate
collectively with a host computer through network switches. Each mat (62 cm × 53 cm)
contained 2016 FSRs that resulted in a resolution of 6 mm × 6 mm per sensor. Force read-
ings were captured by an Ethernet-enabled micro-controller at 30 Hz. The floor mats were
part of a system that included auditory sensing and motion capture. Simple visualization
of the force values was available as feedback.
Up to this point, the projects were developed using a controller metaphor. Gestures
performed on the floor would trigger events in another location. Instead, we were looking
for systems that took advantage of co-located input and response, much like table-top
interfaces such as the Reactable [14].
A large-scale luminous floor, named Ada [15], which offered embedded sensing and

1.3 Literature Review 7
output, was publicly exhibited. A total of 360 translucent tiles covered an area of 136 m2.
Each tile consisted of three FSRs and dimmable red, green and blue lights. Their software
tracked multiple simultaneous users and created dynamic, though low resolution, visual
effects around them.
The iFloor [16] introduced a collaborative floor space by mounting a downward-facing
projector and webcam on the ceiling. The floor facilitated a debate through SMS phone
messages between users who were confined to the borders of the display. This was done so
that shadows from their bodies would not occlude the visuals.
Similar systems to the iFloor have been used for advertisement purposes and exhibited at
various malls although we are not aware of any directly related publications. 1 Examples of
applications included leaves blowing away from underneath where people walk and kicking
a virtual soccer ball by pointing feet over the ball graphic. Shadows were persistent but
did not interfere with the goal of attracting attention from the general public.
The Wisdom Well [17] avoided the shadow problem through back-projection. The
system consisted of a 3 m × 4 m × 3 m sub-floor chamber that housed four projectors and
four webcams pointed upwards. The flooring was constructed out of 9 mm glass and a 3
mm Fresnel diffusion layer. The diffusion layer created a surface for the projectors to focus
onto yet allowed ambient light from above to pass through. Limbs of users in contact with
the floor occluded the light and were captured as dark spots by the webcam. Auditory
feedback was provided through ceiling-mounted speakers. The applications focused on
multi-player and co-located collaborative games. One scenario required players to traverse
a water surface by stepping only on designated safe virtual stones. There was no mention
of haptic feedback or force sensing.
1. www.displax.com, www.vertigo-systems.com, www.intouchmediagrp.ca

8 Introduction
1.3.2 Augmented Shoes
Shoe-based sensing and actuation offer another approach to mediate interaction through
walking. They are portable and the user is not constrained by the size of the active sensing
area. The first such device was the CyberShoe [18]. Three FSRs were placed in the toe
area of the shoe and one was placed in the heel. A state-transition model of toe and heel
pressures was used to recognize walking gestures that translated the rendered VR setting
around the user.
Paradiso et al. [19] created a sneaker instrumented with a variety of sensors that broad-
cast signals via radio frequency to a base-station. On-shoe sensors included three piezoelec-
tric pressure sensors, a resistive bend sensor, two multi-axis accelerometers, an electrome-
chanical compass, a gyroscope, a sonar transducer, and an electric-field-sensing electrode.
Altogether, the shoe measured 14 different parameters and was used for sonic control
through dance movements.
Vibrotactile actuators embedded inside shoes have been explored by several projects
[20] [21] [22]. The type of vibrations sensed would correspond to a pre-defined meaning.
Although promising as a means of delivering arbitrary stimuli to the foot, we felt that the
small actuators in shoes limited the range of forces that would be required to mimic the
sensations our feet experience on a daily basis.
1.4 Overview
Overall, many types of sensing have been developed and shown to work robustly. System
response in the form of simple graphics, musical sounds and in-shoe vibrations have also
been explored. However, none of the projects thus far have combined detailed force and
location sensing with high-quality feedback in all three modalities. Our implementation of

1.4 Overview 9
an intelligent foot-centered device aims to address this shortcoming.
The remainder of this thesis is organized as follows. Details of the design principles
and physical construction of the floor, including sensing and actuation considerations, are
presented in Chapter 2. In Chapter 3, descriptions of two interactive VE implementations,
snow and ice, are presented. Also, Chapter 3 describes a pattern recognition experiment
in which eight unique vibrations are delivered to the participant’s feet through our floor
device. Finally, conclusions and possible future work are presented in Chapter 4.

10

11
Chapter 2
Hardware
2.1 Design Guidelines
This chapter will present the specifications of the augmented floor’s final design and
construction. The choice to pursue a floor-based approach, as opposed to augmented
shoes, was made for the following reasons. Floor interfaces have been prototyped many
times already and shown to be reliable. Augmented floors offer a more ambient type of
interaction because they form part of the environment. We also had concerns about the
durability of wearable computing equipment when used by an untrained audience.
The following is a set of design goals that guided that development of this project and
addressed some elements absent from previous work done in this domain.
– Display haptic feedback. As discussed in Section 1.3.1, all previous floor installa-
tions for VEs have neglected the role of active haptic feedback. We consider support
for such feedback as the top priority guiding the remainder of the design decisions.
– Display auditory feedback. The floor interface should display auditory feedback
as well. Almost all VR systems already include this in the form of speakers or head-
2010/09/26

12 Hardware
phones. Although conventional approaches are sufficient to convey certain sounds
such as background noises and generic feedback beeps, localization remains challeng-
ing. An engaging simulation would not recreate the sounds of walking through a
speaker that is mounted on a stand; rather, the feedback should come from directly
underneath the area of the foot. An informal observation from Visell et al. [23] in-
dicated that a separation distance of 30 cm between haptic and auditory signals was
enough to disrupt the illusion of co-located feedback.
– Display visual feedback. Immersion would not be complete without somehow
incorporating graphics to supplement the haptic and auditory feedback. In keeping
with the theme of localized feedback, the interactive visuals must be displayed directly
on the ground, instead of on a screen in front of the user. Graphics are necessary to
convey the current state of the entire interaction surface, since haptic and auditory
feedback are mainly confined to the immediate area surrounding the users’ feet.
– Have sensing capabilities. Any interactive system must be able to sense changes
in the environment caused by the user. That change can range from a simple button
click to a complicated series of steps. Ideally, the sensors should be contained within
the floor itself, such that they capture natural footstep force profiles without users
tuning their walking habits to the visible sensor devices.
– Low-latency control loop between sensing and feedback. High-latency be-
tween sensing a change from the user and delivering feedback would result in a low
quality experience. As this interaction includes active haptics, latencies in the order
of milliseconds are desirable [24]. Visual and auditory feedback need to feel instan-
taneous and be perceived simultaneously with the haptics.
– Scale to large areas. When dealing with locomotion, larger areas are usually
preferred. It would be uninteresting for a user to reach the physical boundary of

2.2 First Generation 13
the device in one step. There has been research into omnidirectional treadmills, but
none have perfected the illusion of exploring an indefinitely large area. We decided
to pursue expandability through the use of readily available materials, to keep costs
low without sacrificing quality.
– Be stable and durable. Due to the nature of the interaction (people walking on
the device), the design must be stable. A shaky platform would quickly become the
focus of the user when the interaction should be taking precedence. We want our
device to be enjoyable to use. Durability is also critical because the system must
withstand the potential forces of human bodies jumping up and down repeatedly.
– Accommodate multiple people simultaneously. Although designing for one
user is easier, many possibilities exist for the floor to act as a mediator between
multiple users. Sensor and feedback designs should be localized to multiple regions
that can operate independently and concurrently.
– No additional equipment worn by the user. We want our device to be interactive
without requiring the user to wear or hold any additional equipment. Walking on the
device should be as natural and unconstrained as possible.
2.2 First Generation
Visell et al. [23] prototyped a small floor component named the EcoTile. Their goal was
to explore the possibilities of using a linear actuator connected to a rigid surface in order
to simulate walking on various materials. When a user stepped onto the tile, the actuator
excited the surface such that the forces delivered back to the user’s foot were similar to the
forces delivered by stepping onto the real material.

14 Hardware
A D-Box motion control actuator 1 was used to physically displace two 34 cm × 34
cm plywood tiles in the vertical direction. Sandwiched in between the two tiles were four
force sensing resistors (FSRs) encased in foam and connected to a micro-controller (Wiring
board) that relayed the force readings through a Universal Serial Bus (USB) connection
to a computer. The computer used the force readings to generate haptic signals that were
sent to the motion controller and audio signals that were sent to a speaker placed next to
the D-Box unit.
The informal results from this first prototype indicated that the feedback delivered was
sufficient to give the impression of a drastically different material, e.g., snow, from the one
onto which the user actually stepped, a piece of plywood. The success of this prototype
motivated the continuation and expansion of the project. Improvements were made in
almost all areas of the design; these will be described in detail throughout the remainder
of this chapter.
2.3 Actuation
Although haptic and auditory feedback were realized in the first prototype, there were
disadvantages to this approach. The control interface induced a latency of over 100 ms. This
delay time would inhibit certain terrains, especially hard surfaces, from being simulated
properly. These linear motor units required considerable physical space and were quite
expensive, limiting opportunities for expansion. The decision was made to move to a
vibrotactile actuator that, despite sacrificing the ability to displace the tile vertically, offered
many advantages in resolution, latency and cost.
1. www.d-box.com

2.3 Actuation 15
2.3.1 Proprioceptive versus tactile sensing
Proprioception is a person’s sense of their current physical position. This sense informs
a person of joint angles or of whole body accelerations, such as sinking into sand. In
contrast, tactile sensing allows for the awareness of vibrations on the skin. Both sensations
are important in the field of haptics; however, they are each simulated differently. An
example of a device providing proprioceptive feedback is the Sensable Phantom. 2 The
D-Box actuator also falls into this category, delivering the low frequency, including steady-
state, types of feedback such as physical displacement, whereas tactile feedback operates at
higher frequencies. A common example of tactile feedback is the eccentric motor contained
in most cellphones. Vibrotactile devices are low cost and simple to operate.
A well-designed proprioceptive feedback device with a wide bandwidth of operation
would be superior to its vibrotactile counterpart; however, proprioception may not always
be necessary. Studies have shown that, for certain tasks such as material identification or
impact haptics, information encoded into the higher frequency transients factors more into
the users’ perception [25] [26].
2.3.2 Characteristics of vibrotactile motors
The two main types of tactile transducers are eccentric motors and vibrotactile iner-
tial motors. The main difference between the two is that eccentric motors do not have
independent control over frequency and amplitude. Inertial voice coil motors operate in a
similar manner to loudspeakers and thus support a much wider range of haptic signals. The
type of vibration felt when placing one’s hand against a pulsing sub-woofer diaphragm is
a rough approximation to how these devices deliver haptic feedback. Their simple driving
2. www.sensable.com

16 Hardware
mechanism means that they are robust, low-cost, low-latency, and easily interfaced with
other components.
Table 2.1 Available large vibrotactile transducers. All prices are in USD.Name Size(H×W in cm) Freq. Range Power (Max.) MSRPAura Pro Bass Shaker 5×15 20-100 Hz 75 W $120Buttkicker BK-LFE 13.5×14 5-200 Hz 1500 W $230SIT IBEAM VT300 7×16.5 20-800 Hz 250 W $350Buttkicker BK-Mini-LFE 7.62×12 5-200 Hz 250 W $80Clark Synthesis Silver 6×20.5 15 Hz-17 kHz 350 W $150Clark Synthesis Gold 6×20.5 10 Hz-17 kHz 400 W $350Clark Synthesis Platinum 6×20.5 5 Hz-17 kHz 400 W $450
Figure 2.1 Clark Synthesis Tactile Sound Transducer Silver.
The tactile transducer chosen for this project was the Clark Synthesis TST239 Silver,
seen in Figure 2.1. It originally was designed as an enhancement to home-theatre systems
for users to attach to the undersides of their couches. Its frequency response is rated from
15 Hz to 17 kHz and requires an audio amplifier capable of delivering at least 75 W at 4
ohms. The frequency range is especially important as it includes most of the human audible
range (20 Hz to 20 kHz). This means that in addition to displaying the haptic feedback, the
same device can be used simultaneously for auditory feedback. To transmit the vibrations

2.4 Sensing 17
to the user’s feet, the actuator would need to be attached under a rigid platform that could
support a person standing on top.
2.4 Sensing
In many VEs, whole-body tracking can be achieved using motion capture systems that
match on-body markers with a predefined human model. However, these systems are
unable to capture detailed foot-ground forces, which will constitute the majority of the
interactions in this project. In a given body pose, a user can adjust the foot, and even the
part of the foot, that will be the weight bearing area without shifting the rest of the body.
Thus, we explore sensing options that provide a real-time force map of the interaction area.
Although we would like to sense as many foot-ground force orientations as possible, we
began by tracking forces applied directly downwards.
2.4.1 Force Sensors
Similar to the augmented floors described in Section 1.3.1, our options for force sensors
are between load cells and force-sensing resistors. Load cells can provide precise and re-
peatable measurements. However, they can cost about ten times as much as FSRs, which
hinder considerations for sensing resolution and expandability. Since we do not need exact
force measurements for recognizing specific walker profiles, we opt for FSRs. The increased
resolution that can be gained affordably by the addition of more sensors in a given area
outweigh technical accuracy.
The floor is outfitted with Interlink model 402 FSRs. Due to the large variation in
characteristics between each sensor (manufacturer quoted 25% variance in readings), each
FSR needs to be calibrated individually. The circuit seen in Figure 2.2 also helps to linearize

18 Hardware
the force response.
Figure 2.2 A Voltage to Current circuit was used to help linearize the forcereadings. For stepping forces, we use a value of 150 Ohms for RG.
Placement
To sense ground reaction forces, the force sensors need to be underneath the rigid
flooring. We choose to place the sensors at the four corners of each tile as seen in Figure 2.3.
Figure 2.3 Top-down view of sensor placement relative to the actuator andthe rigid floor tile.

2.4 Sensing 19
This configuration allows for interpolation of the center of pressure on each tile and
also provides the greatest physical stability. Moving the sensors inwards causes undesirable
lifting of the tile when weight is applied to the edges.
2.4.2 Data Acquisition Units
The analog sensor signals from the FSRs are digitized and sent to the computer. A
micro-controller samples FSR voltages and converts them to integer values. The resolution
of conversion depends on the bit-rate of the micro-controller’s analog-to-digital converter
(ADC).
Arduino and Wiring boards
The initial prototype floors capture force data using these basic micro-controller de-
vices. Arduino Diecimila and Wiring boards 3 both have 10-bit ADCs and communicate
input/output signals with the host through serial protocol over USB. Analog inputs are
limited to eight for the Wiring board and six for the Arduino; adding multiplexers to
increase the number of inputs would slow down the sampling rate considerably.
Gluion units
A major upgrade to the previous data acquisition units is a custom-built 32-channel
board based on the Altera FPGA. These Gluion 4 units contain 16-bit ADCs, sampling at
a rate of 1 kHz. The board also incorporates a 10 Mbps Ethernet interface and broadcasts
data via User Datagram Protocol (UDP) using the Open Sound Control (OSC) protocol. 5
3. www.arduino.cc, www.wiring.org.co4. www.glui.de5. www.opensoundcontrol.org

20 Hardware
Ethernet connectivity provides a clean and simple mechanism to connect an array of Gluions
to an array of computers.
The force sensors are connected to the Gluions through XLR connectors. This makes for
easy and secure re-connections during setup and troubleshooting. Each XLR plug contains
five channels: one ground and four signals, enough for a single tile. Custom-length cables
are built using shielded twisted pair (STP) cable containing four pairs of 24 American Wire
Gauge (AWG) insulated wiring. At one end, each twisted pair of wires is connected to the
leads of the FSR. At the other end, all the white wires are soldered onto the ground lead
while the colored wires are connected to the signal leads.
2.4.3 Calibration
Each FSR should be individually calibrated. This can be performed using a small set
of known weights and linear regression fitting. For more precise calibration, many more
sample points can be taken using a load-cell in series with the FSR while the force applied is
constantly increased. Using this method, a response accurate to within 5% can be achieved.
2.5 Physical Construction
Our design is largely constrained by the 20.3 cm diameter of the actuator. For conve-
nience, we choose a standard tile size of 30 cm × 30 cm to match the existing tiles in the
building. At this dimension, a user’s two feet are unlikely to be on the same tile during
locomotion. If one foot overlaps on a the tile already in use by the other foot, both feet will
perceive the same vibrations. However, the active stepping foot would experience stronger
vibrations due to the pressure distribution between the feet during a step. This could be
perceived as increased actuation resolution.

2.5 Physical Construction 21
The CAVE dimensions, in which the hardware is deployed, allow for a maximum floor
area of 2.4 m × 2.4 m. Users often confine themselves to the center of this space and rarely
approach the sides, which helps to minimize the risk of slipping and damage to the screens.
We therefore restrict the effective interaction area of the floor to the inner 1.8 m × 1.8
m square with 36 independent regions. Figure 2.4 illustrates a one-tile abstraction, which
includes the rubber suspension that will be explained in Section 2.5.3.
Figure 2.4 One of the 36 actuated regions.
2.5.1 Base structure
A stable support structure is required to hold the actuators and sensors in place. It
serves as a simple raised flooring support similar to those found in computer server rooms.
The base, seen in Figure 2.5, is built with affordable housing construction wooden beams.
Triangular notches are cut into the beams to allow wiring to run between the chambers
and the structure is secured to the lab floor for extra stability.

22 Hardware
Figure 2.5 Base structure provides stability to sensing and actuation com-ponents.
The structure consists of eight individual rows that are bolted together. Each row
contains eight chambers of volume 23 cm × 23 cm × 14 cm to accommodate the transducers
and is constructed with two beams 2.4 m long and a series of small cross-beam pieces.
Detailed dimensions are seen in Figure 2.6 and Figure 2.7.
The two end chambers of each row are used to house sensitive electronics and con-
nections. This provides some protection from repeated usage and helps to abstract the
underlying technology from the user. Keeping the end chambers open also allows easy
access to the embedded sensors and actuator wiring without having to open the tiles from
the middle of the floor, which would then require recalibration of the sensors. Actuator
leads are terminated at one end through standard audio banana plugs and FSR cables are
connected at the other end into the Gluion box as seen in Figure 2.8.

2.5 Physical Construction 23
Figure 2.6 Dimensions of one row.

24 Hardware
Figure 2.7 Dimensions of the cross-beam pieces.
Figure 2.8 Left : Signal cables from the six sets of FSRs are plugged intothe Gluion device. Right : Banana plugs provide an easily accessible interfaceto the actuator units.

2.5 Physical Construction 25
2.5.2 Tile material
The top layer of the floor is constructed with a stiff material. The actuators are con-
nected to the tile with a supplied aluminum plate. For the vibrations to be transmitted
most efficiently to the foot, the connection must be as rigid as possible. On the 2 × 2
prototype, 1.25 cm thick transparent polycarbonate was used mainly for aesthetic reasons.
Users could see through the tiles to the components hidden beneath. Perceptually, however,
the differences between delivering the haptic and auditory feedback through polycarbonate
versus plywood are difficult to notice and can be compensated by the signal synthesis.
Moreover, the aesthetic appeal of the transparent tiles was lost when an opaque covering
was used to support graphical projection.
Our floor uses 36 Russian Birch plywood tiles of dimension 30 cm × 30 cm × 1.25
cm. This leaves a gap of 3 mm between adjacent tiles to help isolate vibrations. Strips
of foam are taped to the sides of the tiles to fill these gaps and create a seamless screen
on which to project graphics. The tiles were covered with a specially formulated paint for
high reflectivity. 6 We used Goo Systems’ Digital Grey for the undercoat and their Rear
Projection paint for the topcoat. Though the latter was reputed for durability, we found
that it was easily scuffed by regular usage. Two layers of matte varnish were added on
top, which reduced the reflectivity of the surface, but made the floor less susceptible to
marking. The grey colour of the paint is intended to enhance the contrast of the resulting
picture in situations where ambient light is present. A white floor would only perform well
in a much darker room.
The outer border surrounding the active tiles is fitted with long planks of the same
plywood used for the tiles. The planks are secured in place by Velcro strips and can be
6. www.goosystems.com

26 Hardware
easily removed to access the connection ports. Black paint covers both the base structure
and the side planks to distinguish the inactive from the active areas, as seen in Figure 2.9.
Figure 2.9 Base structure with tiles and border covers.
2.5.3 Suspension
To ensure a smooth response from the force sensors, the manufacturer recommends
encasing them between a soft material such as rubber or foam. The majority of implemen-
tations we came across used a closed cell ethylene vinyl acetate (EVA) foam. Applying this
suspension technique in the first generation prototype under the load of a human weight,
we found that there was too much compliance when the foam was only located at the sensor
points. In the second generation prototype, we use a ring of foam around the edge of the
tile. The ring also acts as a retainer to keep the tile from shifting horizontally and skewing
the force readings. This is accomplished by gluing alternating sections of foam to the tile
and to the supports. Although it is more rigid, this design spreads the forces from the tile

2.5 Physical Construction 27
around the ring and we lose precision in interpolating force contact positions.
Reverting to the original design of only supporting the tile at the corners, we replaced
the EVA foam with a stiffer material. Each tile is supported by four cylindrical SBR rubber
stoppers, attached to the tile’s underside with 3M silicon glue as seen in Figure 2.10. Each
FSR is lightly glued into place on top of a thin rubber sheet that is attached to the platform.
The sensor rests between the rubber sheet below, and rubber stopper above. In order to
prevent the tile from shifting, wooden retainer sockets are manufactured and nailed to the
platform surrounding the FSR, as seen in Figure 2.11. Two sockets placed at opposing
corners sufficiently constrain each tile.
Figure 2.10 Three views of the tile with attached rubber supports andtactile sound transducer.
2.5.4 Graphical Display
Rendering graphical feedback directly on the floor was a challenge. The maximum
visual acuity achievable by the human eye is about 50 cycles per degree [27], equivalent
to the ability to distinguish black and white bars, an extreme case of contrasting stimuli,
that subtend an angle of 1.2 arc-minutes. At a standing height of 170 cm, a person with
perfect vision under ideal conditions can resolve features as small as 0.6 mm. For many
natural ground surfaces, visual characteristics tend to vary gradually and thus, even the
modest resolution of an affordable XGA projector may be sufficient. At a projected area
28 Hardware
Figure 2.11 The retainer socket is used to limit the tile’s lateral movement.
of 1.8 m × 1.8 m, 768 pixels per dimension correspond to a pixel size of 2.3 mm. Though
well short of the 0.6 mm limit, the apparent ground texture resolution was nevertheless
perfectly adequate to display complex terrains, as seen in Figure 2.12.
Figure 2.12 Left : A projected image of small sand hills. Right : A projectedimage of medium sized gravel.
Although we would have preferred to use the shadowless back projection implementation
of the StepStone project [17], this was not feasible because the force sensors and actuation

2.5 Physical Construction 29
units would have occluded most of the light. We resorted to using top-down projection,
which made our setup more adaptable to existing infrastructure as the floor would not
require a large clearance underneath. However, we must consider the need to preserve
visibility of graphical deformation in the vicinity of the user, which may be occluded by
shadow. Our solution was to employ two overlapping projectors (Hitachi CPX-5), seen in
Figure 2.13. Although this form of passive shadow reduction does not entirely eliminate the
problem, shadows appear as dimmer regions of the terrain rather than as entirely occluded
regions. To a certain extent, this setup is perceptually acceptable as it preserves some of the
characteristics of natural illumination. Figure 2.14 shows the resulting effect of occlusion
from a user’s point of view.
Figure 2.13 Visuals are provided by dual overhead projectors.

30 Hardware
Figure 2.14 Resulting shadow effect from two overlapping projectors.
2.6 System Architecture
An overview of the signal connections between the various components can be seen
in Figure 2.15. The system transfers data on a Gigabit Ethernet network, via two 8-
port switches. Connected to the first switch are six Gluion sensor boxes, the FPGA-based
devices responsible for capturing force readings from the tiles. The sound synthesis software,
described in Section 3.1, runs on an array of six Mac Mini computers networked together
on the second switch. Each PC is responsible for generating feedback for one row of six
tiles. We limited the maximum number of associated tiles with each PC in the case that
we implement new, more computationally costly physical models. The drawback of this
architecture is the added complexity of creating a central control interface. Additional
sub-systems of the complete VR environment setup are the motion capture system and the
real-time graphics system. These components will be described in Section 3.2.
Each PC delivers six audio signals through an Edirol FA-101 Firewire external sound
card. The signals are then amplified by a Russound 1250MC 12-channel amplifier, which

2.6 System Architecture 31
Figure 2.15 A top-down view of the overall placement of components andthe logical connections between them.

32 Hardware
provides 75 W at 4 Ω per channel. Three such amplifiers power the signals delivered by
the six Edirol sound cards allowing for simultaneous and independent feedback of 36 tiles.
The components are secured in a server rack as seen in Figure 2.16. Each row of actuators
is connected to an amplifier with a custom built twelve-wire snake cable. The rack sits
behind the CAVE, unseen from the interaction area.
Figure 2.16 The rack of haptic-audio synthesis computers and multi-channel audio hardware.
2.7 Overall Environment
The completed floor is housed within the lab’s existing CAVE as shown in Figure 2.18.
Our augmented platform adds a fourth display surface that also acts as an interaction
device allowing for some interesting applications, which are described in the next chapter.
It can supplement existing VR environments by adding realistic multimodal feedback or it
can act as the main interface device with graphics from the screens enhancing the overall
immersion. The abstraction of its components and the rigidity of construction allow the
floor to behave as a regular raised platform when not activated.

2.7 Overall Environment 33
Figure 2.17 Sketch of the completed construction in the lab’s existing VE.It includes three back-projected screens and a set of motion capture cameras.

34 Hardware
Figure 2.18 The completed floor inside the lab’s CAVE.

35
Chapter 3
Applications 1
The vibrotactile floor space enables content creation new to the domain of VR. It
moves both user input and feedback away from conventional hand-held controllers and
computer screens to completely floor-based interaction. Two virtual environments were
created using this platform to demonstrate its novel aspects. 2 The development involved
adapting the haptic-audio synthesis engine, creating interactive graphics, and managing
the communication between those two systems. Also, in contrast to real-world terrains, we
describe a preliminary evaluation of abstract vibrotactile icons and how our haptic floor
can be used to facilitate testing of such signals under varying conditions.
3.1 Haptic-Audio Synthesis
This section describes the vibration synthesis software used for haptic-audio feedback.
Haptic vibrations and audible sounds form two of the three feedback modalities provided
1. Contributions from the author include setup of the system architecture, tuning the synthesis param-eters for each material, adapting the deformable snow terrain graphics to interact with the sensing floor,creation of the virtual ice environment, conducting user experiments, and preliminary analysis of test data.
2. Videos can be viewed at http://www.cim.mcgill.ca/sre/projects/niw
2010/09/26

36 Applications
by the floor interface used in this project. For many unique terrains, any one of the three
modalities would be sufficient for identification. For simulation, however, the system should
provide as many modalities as possible to reinforce the illusion.
A simple solution to provide feedback is to play recorded sound files when a sensor reads
a value above a set threshold. Although quick to implement, the resulting responses may
be perceived as repetitive and unnatural. Our system uses physically based algorithms for
the synthesis that offer a more realistic experience than the previously mentioned approach
by adapting the feedback to match nuances within each footstep. This method also allows
for adjustable semantic parameters that can simulate a wide range of materials. The
customizable control of the mapping from stepping forces to feedback stimuli is based on
the Sound Design Tools (SDT) library [28] [29].
3.1.1 Sound Design Tools
Crushing granular media provides an ecologically salient form of ground interaction.
Granular media includes naturally occurring aggregate materials such as gravel, sand, and
snow as well as materials that undergo fracture phenomena such as an aluminum can or a
thin sheet of ice. Its range of possible reaction forces span a much richer area compared to
a rigid surface such as marble or concrete.
The perceived action of crushing or crumpling a medium can be seen as the superposition
of many individual microscopic events. By synthesizing a characteristic vibration for each
event, the overall crumpling event is realized. This approach is known as granular synthesis.
For this implementation, each grain of sound is described using an impact model [30].
The physical modelling procedure used follows a statistical approximation to physical
interactions. A deterministic sequence of events would require much more computing over-
head and cause unwanted latency. As shown by Cook [8], statistical approaches offer a

3.1 Haptic-Audio Synthesis 37
perceptually valid form of feedback that can be generated almost instantaneously.
The system requires an energy input in order to create an output in the form of a
vibration. In this case, input energies are the net forces f(t) provided by the user through
stepping actions. A control parameter vf is introduced and represents the change in force
over the sampling period and, thus, indicates whether the user is stepping gradually or
quickly. It is defined as:
vf =
⎧⎪⎪⎨⎪⎪⎩df/dt, if df/dt > 0
0, otherwise,
(3.1)
where df/dt is the change in force over time. We discard negative values of vf as they
correspond to the upward motion of a step sequence [29].
The statistical approach governing the temporal relations between generated events is
a Poisson process:
P (τ) = vfe−vf τ (3.2)
The probability that the time interval between events takes the value τ is dependent
on vf , which controls the density of occurrences. For quick steps, vf is large and produces
many events. Likewise, slow changes in sensed forces, such as standing still, result in a low
probability of generating events.
3.1.2 Available Parameter Adjustments
The impact and crumpling models were implemented by Bresin, Fontana and Visell as
a Max/MSP 3 package and released as the SDT library. Their implementation allows for
3. www.cycling74.com
38 Applications
real-time adjustment of synthesis parameters through a graphical user interface (GUI) of
sliders. These values are described in Table 3.1.2.
A starting point for matching material response is to perform a frequency analysis
using linear predictive coding (LPC) on a recorded sound sample and setting the frequency
modes to approximate the two most dominant spectrum peaks. Other settings are manually
tuned to approximate the material’s discernible qualities. Figure 3.1 shows the preset
values described by the library as “can crushing.” The synthesized vibration waveform and
spectrogram resulting from a single step are shown in Figure 3.2. Notice that after the
initial attack of each sound grain, there are resonant frequencies that decay slowly, thus
giving the ringing quality of fracturing metal.
Figure 3.1 Parameter adjustment GUI for the crumpling model. The valuesshown are for crushing an aluminum can.

3.1 Haptic-Audio Synthesis 39
Table 3.1 Descriptions of available haptic-audio synthesis parameters.Name Range DescriptionImpact ParametersMicro-impact rigidity 0-255 The resistance of impacting bodies to de-
formation. Low values denote soft bodieswhereas high values denote rigid bodies thatresonate longer.
Micro-fractures shape 0-255 Degree of non-linearity in the impact simu-lation. It can be described as the amountof smoothing, i.e., low values result in harshsounds.
Micro-impact velocity 0-99 The initial energies of impacting objects.Higher values denote a greater attack ampli-tude.
Control Crumpling ParametersObject size 1-100 Size of object under compression. A small
object will be fully crushed with a small num-ber of crumpling events. Large objects canproduce many sound events before reachingthe limit of being fully compressed.
Crumpling granularity 5-70 How quickly the process evolves. Given thesame number of sound grains, the tempo-ral separation between each is controlled bychanging this parameter. Small values createfewer events per time period. Bounds wereoutlined in the SDT library.
Crushing Force 115-150 Scales the amount of force an agent needs tosupply in order to cause crumpling events asa percentage. Bounds were outlined in theSDT library.
Resonator ParametersFrequency Mode 0/1 0-255 Controls the two center frequencies of the re-
sulting stimuli.Gain Mode 0/1 0-255 Controls the amplitude of their respective
frequencies.Global Decay 0-8 Regulates signal decay time. Higher values
correspond to a metallic ringing signature.Global Gain 0-255 Amplification of generated signal.

40 Applications
Figure 3.2 Signal analysis of synthesized feedback with can-crushing pa-rameter settings resulting from one step. Above: Vibration waveform. Below :Associated spectrogram.

3.2 Snow Simulation 41
3.2 Snow Simulation
A field of freshly fallen snow provides a compelling scenario to illustrate a multitude
of sensory cues. Take for example, the senses involved during a step. Before the first foot
step, the snow is a bright white colour, evenly covering the ground. As a step is taken and
weight applied, the snow begins to compress and a crunching sound is heard. The first
few centimeters do not offer much resistance, but as the snow compacts, its structure and
trapped air spaces begin to withstand the added pressure. The subject perceives his foot
continuing to sink until the compacted layers provide an equal reaction force preventing
further compression. An impression from the boot is left in the snow. The next stride feels
and sounds slightly different given the variations in the surface and the pressure profile of
each footstep. If the foot is dragged along, a smooth channel is left behind.
As described above, the real-life scenario of walking in snow offers a variety of de-
tailed feedback that we aim to recreate within our VE. The following sections describe the
implementation.
3.2.1 Haptic-Audio Rendering of Snow
The physics of snow crystal deformation are reviewed by Mellor [31] and more recently
by Wu et al. [32]. We can draw parallels between the mechanics of real snow deformation
and the algorithm that governs the haptic-audio synthesis of virtual snow.
The crunchy description of walking in real snow is the result of material failure ac-
companied by a loss of load-bearing capacity. Resistance to deformation arises from two
sources: crystalline strength from formation of ice crystal bonds, and the incompressible
air trapped in between them. Wu et al. showed that in the event of a uniform plate be-
ing dropped onto snow, the combined resistance decelerate the crushing agent unevenly.

42 Applications
This leads to irregularities in the fracturing of ice bonds and discharge of the trapped air
that create the characteristic auditory and tactile feedback. This series of discontinuous
collapses is referred to as “collapse mechanics” [31].
Further irregularities are introduced from the action of walking, each step producing
a unique profile. Collectively, the lumped stochastic crumpling model that generates ran-
domized events following a Poisson process can be taken as an approximation to the real-life
series of collapses. The lower frequencies of each synthesized vibration will be perceived
by the user’s foot as short bursts of force. These are similar to the reaction force felt at
the end of each collapse in real snow. Combined with the audible portion of the signal, the
synthesized virtual snow illusion is rather convincing. Informal reports suggest that the
generated reaction forces distort a user’s estimation of material compliance. Some users
have admitted to believing that they were sinking into the rigid platform even though no
such cues were provided through proprioception.
The most perceptually convincing parameter values for virtual snow are documented in
Figure 3.3. They are by no means the only valid values. Minor variations in the settings
would produce a slightly different snow. Figure 3.4 shows the synthesized waveform and
spectrogram for a single step. Compared to the can-crushing settings, the number of events
generated are fewer and the transient vibrations decay faster. The feedback also has fewer
high frequency components to match the muffling effect that real mounded snow has on
propagating sound waves.
3.2.2 Deformable Terrain Rendering
The accompanying graphics projected around the user were based on a height-field
implementation of deformable material by Zeng et al. [33]. This approach was chosen
over a particle system because the latter technique sacrifices interactive update rates for

3.2 Snow Simulation 43
Figure 3.3 Chosen parameter values for the snow simulation.
visual quality. Optimizations that improved upon Zeng’s implementation included storing
the terrain data in video memory and using the programmable GPU’s stream processing
architecture to perform dynamic lighting. 4
Height-field approaches do not compute the collisions between particles of the entire
volume of material. The only particles of interest are the ones visible to the user, which
exist at the top of the volume. A height-field based surface is defined by a grid of vertices
that are displaced vertically according to values stored in a texture, H . Because the vertices
and the texture are both stored in video memory, real-time computation of lighting can be
performed. Our initial height texture was simply a grey-scale image of clouds. The varying
lightness values created a natural wavy snow field as seen in Figure 3.5.
Deformation of the height-field occurs by comparing the volume between a virtual foot
4. Because the pipeline shader programs were written specifically for nVidia graphics cards, the currentimplementation is limited to work only with GeForce 8000 and above models. Previous generation GeForcecards did not have programmable shaders.

44 Applications
Figure 3.4 Signal analysis of synthesized feedback with snow parameter set-tings resulting from one step. Above: Vibration waveform. Below: Associatedspectrogram.

3.2 Snow Simulation 45
Figure 3.5 The interactive snow field.

46 Applications
and the current height-field texture, H0. A 3D model of a boot with a hiking tread was
created for this purpose. The height of the virtual foot compared to the height-field is
determined by the FSR readings. If the force exceeds a predefined threshold, the depth
values of the foot are rendered to a texture, F . A subsection of the height-field around the
contacting foot,Hlocal, is created to keep the computation time independent of the size ofH .
F is then compared to Hlocal and a collision map, C, is generated. The difference between
C and the original height-field texture, H0, creates the next frame, H1, for rendering. The
result is the indentation of a foot shaped volume, including details of the tread, in the snow
field.
During interaction, the user is unable to see the indentation develop during a step as the
visuals occur underneath the shoe. We wanted the graphics to provide mid-step feedback
and thus added two Gaussian blurs that were applied to the difference map. A radially
symmetric Gaussian blur simulated the mounding of snow at the sides of the footprint and
a tangential velocity proportional Gaussian blur simulated the mounding of snow due to
horizontal sliding. The mounding effects are seen in Figure 3.6. The rendering procedure
is described in full detail by Law et al. [34].
Figure 3.6 Left : Simple footsteps. Middle: A foot drag. Right : A footswipe.

3.2 Snow Simulation 47
3.2.3 Motion Capture
Exact foot position and orientation were necessary due to the detailed intersection
volumes between the foot model and the snow terrain. We would have preferred to keep
the interaction free from on-body equipment, but interpolating foot orientation data from
the grid of FSRs was insufficiently reliable. An infrared (IR) motion capture system (Vicon
or Natural Point Optitrack) supplemented the sensed pressure with the exact position and
orientation of each foot. The only equipment worn was an elastic Velcro strap incorporating
four IR reflective markers arranged uniquely for each foot. The markers for one foot are
seen in Figure 3.7. The user remained uninhibited by cumbersome attachments and was
not tethered to any electronics.
Figure 3.7 Vicon markers are attached to the user’s feet using an elasticVelcro strap.
Localized deformation for two feet
At each iteration, the values for all 144 FSRs are sent via OSC from the MacMini array
to the graphics computer for deformation depth calculations. To relate each FSR value
to the correct foot, a set of distance calculations are performed. The task is simple if the

48 Applications
feet are spread far apart, but in many cases, parts of each foot can overlap the same tile.
This led to problems when the user moves one foot in the air, such as in mid-stride, and
deformations would occur under the moving foot. To reduce this, we introduced a toe and
heel position for each foot. FSR values that passed a set threshold are associated with the
closest of the four toe and heel positions.
3.2.4 Results
The graphics were rendered on an nVidia Geforce 8800GT card and obtained interactive
frame rates of over 75 Hz. The graphical simulation was programmed in Java using the
JOGL OpenGL package. 5 Real-time multimodal interaction was achieved allowing users
to create a trail of footprints, seen in Figure 3.8, and shoe swipes using both feet. Most
participants expressed surprise at the level of realism produced by the simulation. There
were some instances of subjects being caught off-guard and in a state of suspended belief,
checking to see if their shoe tread matched that of the virtual footprint.
3.3 Ice Simulation
Another scenario that involves numerous characteristic sensory cues is walking on a sheet
of ice that is fragile and sensitive to weight changes. The following paragraph describes a
possible experience one might have while walking on a real frozen pond.
Imagine approaching a body of water that has frozen over. You are unsure whether the
ice is thick enough to support a person’s weight, but disregarding all safety concerns, you
walk onto the ice in an effort to get to the other side. Your first step is taken cautiously and
you find that ice can indeed bear your weight. Looking down, you can see a school of fish
5. jogl.dev.java.net

3.3 Ice Simulation 49
Figure 3.8 A trail of footsteps is left behind by the walker.
swimming underneath the translucent ice. With confidence, you take the next few steps
more quickly and all of sudden, you feel a shock against your stepping foot and hear an
abrupt snapping sound. You can also see thin white cracks extending from your stepping
foot as the ice fractures under the weight of your body. In an attempt to return to the
edge, you step back, but cause a second crack. Frightened again and panicking, you leap
towards the edge, but fall just short. The landing shatters the immediate area of ice and
the surface shakes violently causing the fish to dart away. Fortunately, you make it back
to land alive and well.
The virtual ice environment attempts to capture all of the above-mentioned phenomena.
This interaction can be quite enjoyable when there is no danger of falling through the ice.

50 Applications
3.3.1 Haptic-Audio Rendering of Ice
An overview of the mechanics of ice fracture under stress is presented by Schulson [35].
Ice fractures propagate in seemingly random directions due to point defects in its crystal
structure during the forming process. Under uni-axial pressure, such as a footstep, the
stresses incurred cause inelastic crack events. Separation along a series of grain boundaries
occurs at the closest point defect. Ice can undergo both ductile and brittle behaviour. At
low rates of increasing pressure application, ductile behaviour occurs allowing the ice to
increase its load bearing capacity through strain-rate hardening and thermal softening to
relax its internal stresses. Ductile behaviour is the reason that an ice sheet, which would
normally fail under the weight of a human, can remain intact if the changes in pressure
are gradual. However, high speed changes in pressure can cause ice to become brittle and
suffer shear failure.
The auditory and tactile feedback can be modelled using the same crumpling stochastic
process as the snow simulation. Large-sized cracks are a superposition of many smaller
brittle fractures, each with its own grain of vibration. The synthesis parameters chosen for
ice fracture are shown in Figure 3.9. The main differences from the can crushing settings
are the object size, global decay and resonant frequencies. Fracturing materials have a short
snapping sound associated with each failure, thus, the decay parameter was increased to
muffle each sound grain almost immediately. The object size parameter was increased
to allow for many crack events per step since an ice sheet is not limited to a maximum
number of failures unlike can crushing. Lastly, the resonant frequencies were adjusted to
match each other to create a thin, hollow sound. The spectrogram of the synthesized
feedback in Figure 3.10 shows the short bursts of sound associated with each crumpling
event.

3.3 Ice Simulation 51
Figure 3.9 Chosen parameter values for the ice simulation.
3.3.2 Visual Crack Rendering
Visual representation of crack propagation due to brittle fracture was developed. The
animation must render in real-time and correspond to the audio and haptic feedback.
Fracturing of crystalline objects has been studied for computer graphics and has achieved
near-photorealistic results [36] [37]. However, the algorithms that exist required consid-
erable computation time and the resulting quality exceeded the amount of realism that
seemed necessary for our prototype. Therefore, we developed our own simplified version
inspired from those methods.
The cracks should propagate at the same rate as the haptic and audio vibrations being
generated to be perceived as simultaneous. Therefore, the animation is triggered every
time the program receives a crumpling event – the same event that activates each vibration
grain. This approach ensures correlation between all three modalities.
We start by displaying a translucent texture of an ice sheet as shown in Figure 3.11.

52 Applications
Figure 3.10 Signal analysis of synthesized feedback with ice parameter set-tings resulting from one step. Above: Vibration waveform. Below: Associatedspectrogram.

3.3 Ice Simulation 53
Thin white lines represent the crack boundaries and are rendered over top of the ice texture
using the following algorithm.
Figure 3.11 The interactive frozen pond surface.
Algorithm
We begin by analyzing the behaviour of a single crack arm or crack front originating
from a point c0. When initiated, the crack arm a has a zero energy value, E = 0, associated
with it. Each time the arm receives a crumpling event, it increases E by one and creates a
new node point cE such that a mature crack arm is a collection of nodes,
a = (c0, c1, c2, . . . , cE). (3.3)
The arm is visualized by rendering white lines that connect the nodes. The equation
governing the position of newly generated nodes is:
ci = c0 + iD(n+ r) (3.4)

54 Applications
where D is the growth distance, or how large to graphically represent each crumpling
event. This material constant is defined perceptually. n is the arm’s propagation direction
and r is a random direction vector with a Gaussian Normal distribution N(0, σ). Adjusting
σ controls the amount of jaggedness that occurs. The cracks seen in the figures use σ = 1
degree.
A crack, C, is initialized at a seed point c0 with many crack arms such that they share
the same origin,
C = (a0, . . . , aj), (3.5)
where j is uniformly sampled from two to six. Each crack arm’s direction vector nj is
distributed around a unit circle.
Figure 3.12 Left : Nodes of one crack arm and its direction vector. Right :Multiple arms of a crack object.
The full rendering of the graphics is the display of all existing cracks over top of the ice
texture.

3.3 Ice Simulation 55
When a crumpling event is received, an FSR identifier value, mapped previously to a
location in the projected area, is associated with it. From the knowledge of this location,
the program first checks if there are any existing crack seeds within a specified distance
�d. If there are none, a new crack Ck will be generated. Otherwise, the events will add
energy to the nearest Ck, propagating its crack arms akj outwards.
Animation is perceived because all the nodes are preserved. At the instance of a crum-
pling event, a new furthest point, and thus a new connection line, is generated and the user
sees the result as crack propagation. Figure 3.13 shows three successive frames to illustrate
the applied algorithm.
Figure 3.13 The crack arms propagate outwards from the foot. The lineshave been enhanced in the photographs to show the effect.
Branching
The phenomena of branching occurs when a crack front encounters a defect. This
is modelled by using a branching percentage variable, B ∈ (0.0 − 1.0). We set B =
0.1 to achieve perceptually acceptable results. For any crack Ck, on average, every 1/B
propagation events it receives creates a new branch arm aB, as follows.
First, a random arm akj is selected. Its halfway node cjE/2 and direction vector nkj forms
the basis for the branch arm. Branch arm aB has the initial starting point of cjE/2, a zero
energy EB and a direction vector of nkjB where

56 Applications
nkjB = nk
j ± π/4. (3.6)
The addition of a 45 ◦ angle offset ensures that the new branches propagate in the
same general direction as the parent branch, but not directly over top of it. Subsequent
branchings can occur from both the original arms or existing branch arms.
Figure 3.14 Branching occurring on the right crack arm.
3.3.3 Position Sensing
Because footprints are not captured by ice in general, foot orientation is not needed
and the interaction could proceed without the aid of a motion capture system. Unlike the
snow simulation, which required attaching reflective markers, users could interact with the
virtual ice immediately – a feature that could prove important if the simulation were to
become an unsupervised installation.

3.3 Ice Simulation 57
3.3.4 Results
In our initial testing with the snow simulation, we found that users were quickly bored,
even though the multimodal experience was highly accurate and conveyed detailed visual,
auditory and haptic feedback. We speculated that this was due in large part to the lack of
any surprising events. To make the ice simulation more engaging, a few extra features were
added. A model of a fish was created and instantiated many times to swim in randomized,
straight paths adding a sense of life and movement to the simulation. Some fish can be
seen in Figure 3.15, though they are quite difficult to notice in still photographs. They
were intentionally made to look faint so as not to distract users from their main activity of
cracking ice.
Figure 3.15 The cracking pattern is rendered over top of the ice texture.Circles indicate a few instances of fish.
The ice surface itself holds a surprise for users who extend a crack past a set threshold.
First, the tile closest to the crack will be actuated by a sound file that imitates an ice

58 Applications
shatter. The user feels the floor beneath shake violently and hears a sound similar to an
explosion. Graphically, as seen in Figure 3.16, a shatter pattern appears at the crack seed
point and the fish vacate the area. All fish instances are triggered to triple their speeds and
reverse their initial directions. This animation adds to the participants’ sense that they are
affecting the entire VE. We have seen some startled reactions from participants who were
not warned what to expect. After the initial shock, some users wanted to shatter every
available crack and enjoyed scaring the fish away.
Figure 3.16 A shatter occurs at one of the crack seed points.
3.4 Haptic Icons Underfoot
Brief tangible stimuli, also known as haptic icons, are vibration patterns that have as-
sociated meanings. Receiving information through the haptic modality is practical because
it is complementary to our senses of sight and sound, which can often be overloaded. On a
3.4 Haptic Icons Underfoot 59
busy street, an important message delivered via beeps or a flashing light could become lost
within car noises and crowds of pedestrians. The “vibrate” alert feature on cellular phones
is a common example of haptic icons, though its vocabulary is quite limited – a short
vibration for text messages, repeated long vibrations for a phone call. Visual or hearing
impairment adds to the necessity of supplemental feedback modalities. Haptic messages
can also be delivered in a discrete manner. Localized on-body vibrations ensure that the
information is delivered solely to a single user.
Ground-based haptic feedback can be found in everyday environments. Passive indica-
tors already exist in the form of raised reflective lane markers that cause cars to vibrate
violently and textured tiles that demarcate the border of subway platforms. Although
passive markers are effective for a singular purpose, “active” haptic markers could modify
their feedback to match the current situation and deliver even more information. The type
of vibration perceived could, for example, indicate the distance to the next rest stop or the
waiting time for an upcoming train.
3.4.1 Motivation
In addition to VEs, the floor interface can serve as a platform for testing systematic
information delivery in the form of haptic icons. Unlike ecological surface terrain, these
artificial meanings must be specified by the designer and learned by the users. They
hold potential in information delivery due to their customization and artificial feel versus
terrain. These signals could be embedded in existing ground surfaces and when delivered,
the pedestrian would instantly know a vibration is being sent and would interpret it.
A common problem with haptic messages in general is that designers are unsure of
how their icons will be perceived under various contexts and end-user scenarios. Users
could be under stress or distracted by events around them making it difficult to quickly

60 Applications
recall semantic information. The difference between sitting, standing, and walking could
be influential in the interpretation of a message. It would be beneficial for the designers to
test their tactile feedback in a controlled virtual simulation.
Our system provides a testing platform well-suited for haptic icons underfoot. The
CAVE screens can display images pertaining to a given situation while the floor device
mimics a relevent terrain. Haptic icons can be situated anywhere on the floor by specifying
those tiles. For example, a simple subway platform scenario could be simulated. Videos of
an underground station are projected onto the CAVE screens and a virtual train arrives at
predefined intervals. The front two rows of the floor act as the subway tracks and appear
black. The back two rows act as the platform and appear grey. The middle rows act as
the border and appear yellow. When the border is stepped on, the haptic icons delivered
inform the subject to be cautious and that a train is arriving in n minutes. The whole
floor rumbles as the train draws close and we can determine the degree that it affects the
vibrotactile message. A range of varying conditions can be quickly tested in this manner.
Before attempting such a particular scenario, however, we proposed a simpler experi-
ment that uses the constructed platform to determine whether or not it is indeed possible
to recognize a set of ground-based vibrotactile icons. This was motivated in large part to
verify that the feet are able to perceive hand-based haptic icon characteristics considering
their similar sensory physiologies [38].
3.4.2 Background
The size of the stimuli set recognizable by humans depends on many variables. Location
on the body, amount of attention diverted to other tasks, experience and numerous other
factors all affect the recognition rate. Studies by MacLean et al. [39] and van Erp et
al. [40] have shown useable sets of 36 and 59 icons respectively through use of musical

3.4 Haptic Icons Underfoot 61
metaphors. In these experiments, the vibrations were delivered to the fingers and hands.
Recognition rates for arbitrary stimuli delivered to the feet have been less studied, although
are predicted to be reduced due to the lower sensitivity of the feet.
3.4.3 Design of Stimulus Set
The multitude of parameters involved in stimulus design is the subject of many studies.
Details of the icon design process and icon creation software used for this experiment are
described by Visell et al. [41]. A total of eight unique stimuli were constructed using a
musical paradigm. A single note was created using adjustable parameters and repeated
following a distinct rhythmic pattern. The icon design software allowed specification of
rhythm, individual note amplitude, repetition of rhythmic pattern, phrase duration, rough-
ness, fundamental frequency, and an overall amplitude envelope. Duration of icons ranged
between 1.4 and 2.4 seconds.
3.4.4 Methodology
Setup
Users were asked to wear men’s hard-soled shoes provided in various sizes by the ex-
perimenters. This was done to reduce the effect of varying footwear between subjects. The
platform on which users stood consisted of four tiles that vibrated uniformly. A podium
elevated a computer screen and a mouse to a height comfortable for use by a standing
person. Closed-form headphones playing pink noise were worn to mask potential auditory
cues. The user would initiate stimulus delivery by clicking on selected buttons seen on the
experiment program GUI. Although not used in this experiment, the force sensors could
be implemented to trigger such signals.

62 Applications
Procedure
The procedure for every participant consisted of six test sessions, each with sixteen
identification trials. All eight signals, identified by a number, were presented twice per
session in randomized order. Participants were given only five minutes to learn the as-
sociations through self-guided selection and feedback. Each identification trial involved a
single stimulus presented up to four times depending on the participant. They would select
the assumed correct stimulus number and then be shown the answer. This was done to
facilitate learning of the associations. An optional one minute break was given to sub-
jects between sessions in case of fatigue during the 20 to 25 minute experiment. Pre-test,
post-test questionnaires and the consent form are found in Appendix A.
Subjects
Twelve subjects between the ages of 20 and 39 took part in the experiment. Of those,
seven were male and five were female. Nine subjects reported prior musical training. All
participants used the same stimulus set, but as noted before, received them in a random
order. They were paid $5 each for their participation with a motivational bonus of $50 to
the one who achieved the highest recognition rate.
3.4.5 Results
The average identification rate across all testing sessions is summarized in Figure 3.17.
The highest identification rate was 68% and the lowest was 28%. The average over all ses-
sions and all participants was 49% with a standard deviation of 12%. Chance performance
would correspond to 12.5%. Participant 2 achieved a 94 % recognition rate during the last
test session.

3.4 Haptic Icons Underfoot 63
Figure 3.17 Average correct identification rates across all sessions for eachsubject.
Figure 3.18 presents the overall recognition rate for each stimulus. Stimulus 6 was most
easily identified but not by a large margin. Stimulus number 3 and 8 performed the worst,
although still higher than chance. From Figure 3.19, we can see the potential for error
between pairs of stimuli. Icon number 2 was often confused with number 8. Examining
these stimuli, it seems that participants prioritized rhythm as a key identifier. There was
also a high number of errors between icons 3 and 4. We suspect that duration was also
a major factor. These two stimuli were the longest signals of the set at over two seconds
each – other signals were between 1.4 and 2 seconds each.
The rate of learning with standard deviations is shown in Figure 3.20. We see that
the peak performance occurred during session four with a recognition rate of 58%. From
subject comments, the plateau effect in sessions five and six seemed to be caused by fatigue.
Almost all subjects attempted to complete the entire experiment without a break, fearing
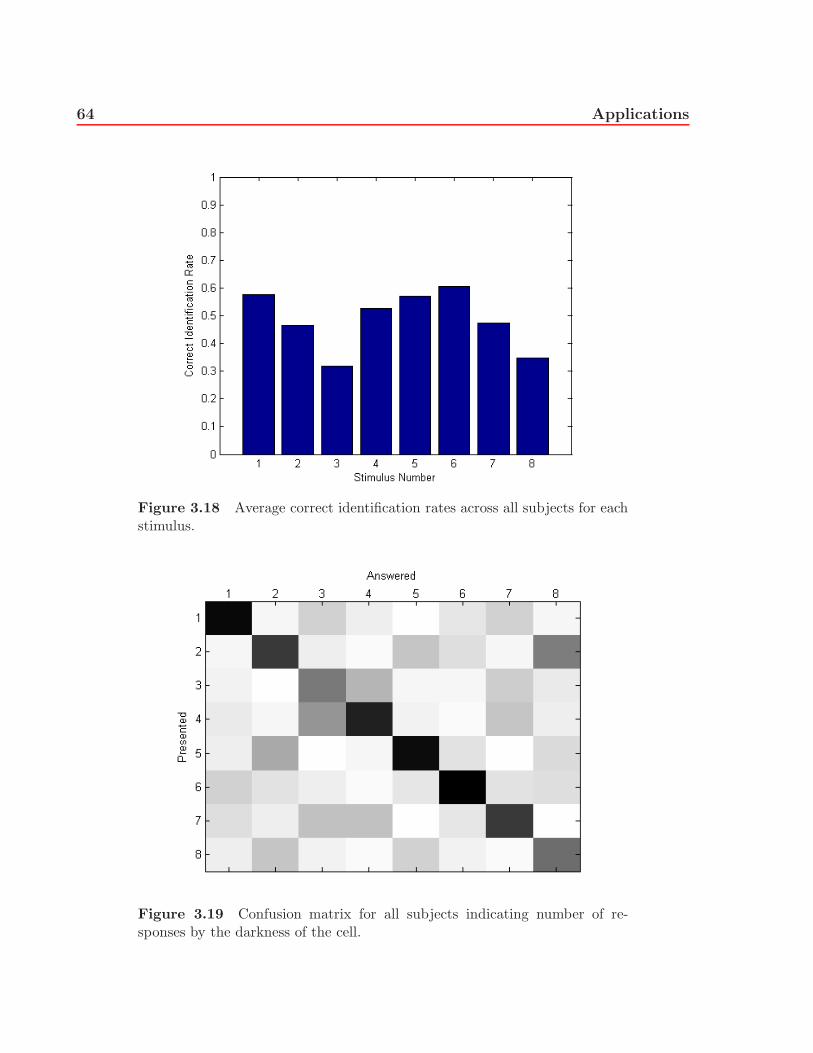
64 Applications
Figure 3.18 Average correct identification rates across all subjects for eachstimulus.
Figure 3.19 Confusion matrix for all subjects indicating number of re-sponses by the darkness of the cell.

3.4 Haptic Icons Underfoot 65
loss of learned associations.
Figure 3.20 Mean recognition rates averaged across all subjects for eachsession.
This preliminary set of experiments showed that recognizing haptic vibrational icons
through the feet was possible given a small stimulus set and a minimal amount of learning.
The increasing learning curve indicated that our mental and physical capabilities can adapt
to such an interface. All participants were unfamiliar with this type of information transfer
but expressed that it did not feel unnatural. On a scale of one (uncomfortable) to five
(comfortable), participants rated the interaction at 3.4 with a standard deviation of 1.22.

66

67
Chapter 4
Conclusions and Future Work
4.1 Conclusions
An important step in the realization of a multimodal floor interface for virtual envi-
ronments has been achieved with this project. We began with the aim of improving on
available floor-interface designs by adding localized haptic, auditory, and visual feedback
presented directly from the ground. Tactile feedback was the key novelty in this project
and we wanted to show that it makes a considerable difference in the way a user experiences
a VE. We feel that a majority of simulation systems, including ones that use HMDs, can
benefit from incorporating a vibrotactile floor. Our design choices in keeping all sensing
and actuation embedded into a raised flooring promotes unobtrusive integration into ex-
isting systems. When not in use, it blends into the surroundings behaving no differently
from common floor tiles.
Each aspect of the hardware for this project went through careful consideration and
decisions were made based on a combination of ease of integration, durability, performance
and cost. The physical platform, constructed out of affordable housing lumber, provided
2010/09/26
68 Conclusions and Future Work
a reasonably stable foundation for the sensors and actuators. For future iterations, higher
quality lumber should be used as the housing beams exhibited some curvature that compli-
cated the construction phase. Because constant removal of the tiles during the prototyping
stage would repeatedly shift the sensors, we temporarily used an average calibration curve
for all FSRs. Even so, the sensing proved adequate for providing accurate force readings –
at least for our existing applications.
The choice of Clark Synthesis TST vibrotactile actuators, and thus, 30 cm × 30 cm
tiles, created an acceptable vibration resolution while keeping the interactive area a usable
size. We noticed, however, that the haptic signal was received differently dependent on
the location of the user’s foot on the tile. There seemed to be a decline in amplitude
as the foot moves towards the edges. This is problematic in that it creates an uneven
tactile response over the haptic floor. A stiffer tile material, better actuator coupling, and
stronger tile constraints could help minimize this effect. With respect to evaluating the
role of haptics compared to graphics and sound, this actuator has difficulty in completely
decoupling vibrations that pertain to haptics from vibrations that are audible. Even for
low frequency levels below the hearing threshold for most people, 20 Hz, resonances from
the tiles and surrounding support can be heard. For experiments that need to isolate single
modalities, alternative solutions can be employed. Playing pink noise through headphones
can reduce the amount of sound heard and attaching a compliant material, e.g., soft foam,
on the underside of shoes can absorb vibrotactile feedback.
Two immersive virtual terrains, snow and ice, were created to provide ecological inter-
actions previously unachievable through conventional systems. These environments were
showcased at the largest computer graphics and interactive techniques exhibition, Emerg-
ing Technologies of ACM SIGGRAPH 2009 [42]. This event lasted five days with hundreds
of people walking on our virtual surfaces and experiencing the potential value of adding an

4.1 Conclusions 69
augmented floor into existing VEs.
Comments from the general public indicated that the level of attainable realism sur-
passed their expectations. Prior to stepping on the platform, several spectators commented
on being intrigued, though puzzled, by the level of amusement expressed by the active par-
ticipants. There were no buttons to press and no objects to grasp, yet the behaviour of the
system was strictly reliant on interaction. We like to stress the simplicity of achieving a
successful human-machine feedback loop i.e., perceiving the correct response from an input
action, with our simulations. There exist many “haptic” devices that claim to be realistic
when they, in fact, require users to concentrate and repeat the action several times in order
to interpret what the system is trying to convey. Any extra cognitive load that the user
devotes to interpretation detracts from the realism of the system. While using our system,
very few participants commented that they had difficulty associating the feedback with the
given terrain, although they could be biased from prior descriptions of the VEs. The ice
surface emerged as the more popular of the two scenarios; in particular, users were greatly
entertained by the shattering event. The ice simulation was also enjoyed by a group of
children from a local day-care centre.
Our system also serves as a VR testing platform for ground-based haptic icons. A pre-
liminary perceptual haptic icon experiment was performed to gauge the ability of partici-
pants to learn and identify vibration patterns delivered to their feet. Recognition rates were
clearly above chance, but our empirical analysis failed to clarify adequately which aspect
of the signal needed improvement. However, we were able to show that every participant
had the ability to distinguish between the vibrations irrespective of musical training, and
observed that they were all comfortable with the interaction. Ground vibrations, provided
within context, rather than with arbitrary numerical associations, could prove useful as
an alternative channel for information delivery. We have confidence that a scenario merg-
70 Conclusions and Future Work
ing both haptic icons and terrain simulation will provide further insight into locomotive
interaction.
4.2 Future Work
Many improvements can be made to further enhance the capabilities of our floor plat-
form. More surfaces, such as sand, grass, and gravel, should be implemented in addition
to scenarios where the type of terrain and thus, the feedback, vary over time or are mod-
ified by the user. A seashore, where the underlying material could change between sand
and water due to periodic waves, would demonstrate the adaptability of our VR system.
Abstract scenarios such as a floor covered with virtual bubble wrap would be interesting as
well. The simulation system, thus far, lacks an integrated development environment and
VR features must be programmed from scratch. We have yet to define a standard approach
for the graphics software to interface with the haptic-audio synthesis software.
Another improvement would be to discard motion tracking in favour of purely ground-
based sensing. We encountered many situations in which the motion capture cameras would
lose sight of the markers for a few frames because it was occluded by the user’s legs during
locomotion. With additional participants, the frequency of dropped tracking is likely to
increase. The need for detailed footprints in environments such as snow and mud would
require algorithms to predict the exact position and orientation of the feet from force data.
Preliminary work from the lab indicates that there are several constraints from the human
body and the FSR configuration that can be exploited for accurate prediction.
Shadows remain a slight distraction in our VR setting. Since the projectors overlap, it
is possible to generate two separate video signals. One could modify the graphics so that
the projectors compensate for shadows by reducing the brightness in overlapping areas.

4.2 Future Work 71
One approach to predicting the shape and location of shadows uses cameras to capture
the position and size of the occlusion. In our setup, the approximate position of the user
is already tracked with the embedded force sensors. Using a generic set of dimensions for
a human body, shadows can be predicted and compensated. Audet and Cooperstock [43]
have already shown success in this regard with a moving occluding object in front of a
video projection.
The floor interface can be extended to domains beyond environment simulation to take
advantage of its ability to display tactile icons. Floor-based interaction techniques such
as StepWIM [44] and WisdomWell [17] can benefit from additional auditory and haptic
feedback. Beyond games, the device can be used in the study of virtualized floor controls.
Many operations in dentistry, surgery, and automotive guidance require blind foot control
because both the hands and the eyes are occupied. In these cases, active haptic and
auditory feedback could be prototyped through virtualization to improve functionality,
operation speed, and reliability.

72

73
Appendix A
User Testing Documents
2010/09/26

74 User Testing Documents
CONSENT FORM
You are being invited to participate in an experiment run by Yon Visell and Alvin Law, and supervised by Dr. Jeremy Cooperstock of the Centre for Intelligent Machines. The study evaluates the identifiability, of different sensations you will feel as you step onto a vibrating, but otherwise stationary, tile. You will be asked to wear headphones playing noise to mask any sound cues and wear dress shoes that we provide.
The safety concerns of this study are minimal. The device will not feel much stronger than the sensation of stepping onto everyday ground surfaces in your shoes. The researcher that designed this study has used this device extensively and has encountered nothing of concern. Every effort has been made to prepare safe and comfortable experimental conditions for you.
The experiment will last between 30 minutes and an hour, depending on the pace you set. You will have adequate breaks to rest while the bumping device is adjusted twice. You will be paid for your participation. For analysis purposes, we will ask you for information including your age, sex, level of musical training, and dominant foot. This information and your identity will remain completely confidential in any report(s) pertaining to the results of this study. Please note that you are free to withdraw from this study at any time, and that you are entitled to have the researcher explain to you the purpose of the study after you have completed it.
Finally, should you have any comments or concerns about this study, you may contact Yon Visell at 555-555-5555 ([email protected]), Alvin Law at 555-555-5555 ([email protected]) or Professor Cooperstock at ([email protected]).
I have read and understood this consent form. I have agreed to participate voluntarily in this study.
Participant’s name and signature: _________________________________
Today’s date: _________________

75
Pre-Test Questionnaire
Participant #: ______________ Occupation:_________________________
Age: ________ Gender: M / F
Dominant Foot: L / R Shoe-size: ________
Do you have any musical experience? Please describe (which instrument, including dancing, and for how many years):
_____________________________________________________________________________
_____________________________________________________________________________
______________
How sensitive would you rate your feet?
Very sensitive
Average
Insensitive (e.g. from calluses due to barefoot activities)
How much time would you expect you would require to learn a set of 8 arbitrary pair-associations (e.g. number to letter)?
Under a minute A few minutes Ten minutes Longer
Thank You!

76 User Testing Documents
Post-Test Questionnaire
Subject #: ______________
How hard did you find the first run?
Very easy 1 2 3 4 5 Very Hard
How hard did you find the last run?
Very easy 1 2 3 4 5 Very Hard
How did you find the vibrations?
Uncomfortable 1 2 3 4 5 Comfortable
How unusual did the vibrations feel?
Very Unusual 1 2 3 4 5 Not Unusual At All
Did you close your eyes when feeling the vibrations? Yes No
Was there a strategy you used to remember the vibrations?
____________________________________________________________________________
____________________________________________________________________________
Were there any vibrations that you thought were especially easy or hard to distinguish?
____________________________________________________________________________
____________________________________________________________________________
Do you have any final comments or suggestions for improvement?
____________________________________________________________________________
____________________________________________________________________________
We appreciate your participation!

77
Bibliography
[1] M. Slater and A. Steed, “A virtual presence counter,” Presence: Teleoperators &Virtual Environments, vol. 9, no. 5, pp. 413–434, 2000.
[2] C. Cruz-Neira, D. Sandin, and T. DeFanti, “Surround-screen projection-based virtualreality: the design and implementation of the CAVE,” in Proceedings of the 20th annualconference on Computer graphics and interactive techniques, p. 142, ACM, 1993.
[3] B. Buxton and G. Fitzmaurice, “HMDs, caves & chameleon: a human-centric analysisof interaction in virtual space,” ACM SIGGRAPH Computer Graphics, vol. 32, no. 4,pp. 69–74, 1998.
[4] M. Wozniewski, Z. Settel, J. Cooperstock, S. Technologiques, and Q. Montreal, “Aparadigm for physical interaction with sound in 3-D audio space,” in Proceedings ofInternational Computer Music Conference (ICMC), 2006.
[5] E. Miranda, R. Kirk, and M. Wanderley, New digital musical instruments: control andinteraction beyond the keyboard. AR Editions, Inc., 2006.
[6] R. Pinkston and K. McQuilken, “A Touch-Sensitive MIDI Dance Floor,” in Proceedingsof the International Computer Music Conference (ICMC’95), pp. 224–225, 1995.
[7] J. Paradiso, C. Abler, K.-y. Hsiao, and M. Reynolds, “The magic carpet: physical sens-ing for immersive environments,” in CHI ’97: CHI ’97 extended abstracts on Humanfactors in computing systems, (New York, NY, USA), pp. 277–278, ACM, 1997.
[8] P. Cook, “Modeling bills gait: Analysis and parametric synthesis of walking sounds,”in Proceedings of the AES 22nd International Conference on Virtual, Synthetic, andEntertainment Audio, pp. 73–78, Citeseer, 2002.
[9] N. Griffith and M. Fernstrom, “LiteFoot: A floor space for recording dance and con-trolling media,” in Proceedings of the 1998 International Computer Music Conference,pp. 475–481, 1998.
[10] R. J. Orr and G. D. Abowd, “The smart floor: a mechanism for natural user identi-fication and tracking,” in CHI ’00: CHI ’00 extended abstracts on Human factors incomputing systems, (New York, NY, USA), pp. 275–276, ACM, 2000.
[11] R. Headon and R. Curwen, “Movement awareness for ubiquitous game control,” Per-sonal Ubiquitous Comput., vol. 6, no. 5-6, pp. 407–415, 2002.

78 Bibliography
[12] B. Richardson, K. Leydon, M. Fernstrom, and J. A. Paradiso, “Z-tiles: building blocksfor modular, pressure-sensing floorspaces,” in CHI ’04: CHI ’04 extended abstracts onHuman factors in computing systems, (New York, NY, USA), pp. 1529–1532, ACM,2004.
[13] P. Srinivasan, D. Birchfield, G. Qian, and A. Kidane, “A pressure sensing floor forinteractive media applications,” in Proceedings of the 2005 ACM SIGCHI InternationalConference on Advances in computer entertainment technology, pp. 278–281, Citeseer,2005.
[14] S. Jorda, M. Kaltenbrunner, G. Geiger, and R. Bencina, “The reactable*,” in Pro-ceedings of the International Computer Music Conference (ICMC 2005), Barcelona,Spain, pp. 579–582, Citeseer, 2005.
[15] T. Delbruck, A. M. Whatley, R. Douglas, K. Eng, K. Hepp, and P. F. M. J. Verschure,“A tactile luminous floor for an interactive autonomous space,” Robot. Auton. Syst.,vol. 55, no. 6, pp. 433–443, 2007.
[16] P. Krogh, M. Ludvigsen, and A. Lykke-Olesen, “Help Me Pull That Cursor-A Collab-orative Interactive Floor Enhancing Community Interaction,” AJIS, vol. 75, 2004.
[17] K. Grønbæk, O. Iversen, K. Kortbek, K. Nielsen, and L. Aagaard, “IGameFloor:a platform for co-located collaborative games,” in Proceedings of the internationalconference on Advances in computer entertainment technology, pp. 64–71, ACM NewYork, NY, USA, 2007.
[18] I. Choi and C. Ricci, “Foot-mounted gesture detection and its application in virtualenvironments,” in Systems, Man, and Cybernetics, 1997. ’Computational Cyberneticsand Simulation’., 1997 IEEE International Conference on, vol. 5, pp. 4248–4253 vol.5,Oct 1997.
[19] J. Paradiso, E. Hu, and K.-y. Hsiao, “Instrumented footwear for interactive dance,” inProc. of the XII Colloquium on Musical Informatics, pp. 89–92, Sept 1998.
[20] X. Fu and D. Li, “Haptic shoes: representing information by vibration,” in ACMInternational Conference Proceeding Series; Vol. 109, pp. 47–50, Australian ComputerSociety, Inc. Darlinghurst, Australia, Australia, 2005.
[21] M. Frey, “CabBoots: shoes with integrated guidance system,” in Proceedings of the 1stinternational conference on Tangible and embedded interaction, p. 246, ACM, 2007.
[22] M. Magana and R. Velazquez, “On-shoe tactile display,” in IEEE International Work-shop on Haptic Audio visual Environments and Games, 2008. HAVE 2008, pp. 114–119, 2008.
[23] Y. Visell, J. Cooperstock, and K. Franinovic, “The EcoTile: An Architectural Platformfor Audio-Haptic Simulation in Walking,” in Proc. of the 4th Intl. Conf. on EnactiveInterfaces (ENACTIVE07), Grenoble, France, 2007.

Bibliography 79
[24] J. Castet and J. Florens, “A Virtual Reality Simulator Based on Haptic Hard Con-straints,” Lecture Notes in Computer Science, vol. 5024, p. 918, 2008.
[25] B. Giordano, S. Mcadams, Y. Visell, J. Cooperstock, H. Yao, and V. Hayward, “Non-visual identification of walking grounds,” Journal of the Acoustical Society of America,vol. 123, no. 5, p. 3412, 2008.
[26] K. Kuchenbecker, J. Fiene, and G. Niemeyer, “Improving contact realism throughevent-based haptic feedback,” IEEE Transactions on Visualization and ComputerGraphics, vol. 12, no. 2, pp. 219–230, 2006.
[27] J. Russ, The image processing handbook. CRC press, 2006.
[28] F. Fontana and R. Bresin, “Physics-based sound synthesis and control: crushing,walking and running by crumpling sounds,” in Proc. Colloquium on Musical Informat-ics,(Florence, Italy), pp. 109–114, 2003.
[29] R. Bresin, S. Delle Monache, F. Fontana, S. Papetti, P. Polotti, and Y. Visell, “Au-ditory feedback through continuous control of crumpling sound synthesis,” in Proc.Human Factors in Computing Systems Conference, Florence, Italy, 2008.
[30] F. Avanzini and D. Rocchesso, “Controlling material properties in physical models ofsounding objects,” in Proc. Int. Computer Music Conf.(ICMC01), Citeseer, 2001.
[31] M. Mellor, “A review of basic snow mechanics,” in Proc. Int. Symp. Snow Mechanics,Grindelwald, IAHS Publ, vol. 114, pp. 251–291, 1975.
[32] Q. Wu, Y. Andreopoulos, S. Xanthos, and S. Weinbaum, “Dynamic compression ofhighly compressible porous media with application to snow compaction,” Journal ofFluid Mechanics, vol. 542, pp. 281–304, 2005.
[33] Y. Zeng, C. Tan, W. Tai, M. Yang, C. Chiang, and C. Chang, “A momentum-baseddeformation system for granular material,” Computer Animation and Virtual Worlds,vol. 18, 2007.
[34] A. Law, B. Peck, Y. Visell, P. Kry, and J. Cooperstock, “A multi-modal floor-spacefor experiencing material deformation underfoot in virtual reality,” in Haptic Audiovisual Environments and Games, 2008. HAVE 2008. IEEE International Workshopon, pp. 126–131, Oct. 2008.
[35] E. Schulson, “The structure and mechanical behavior of ice,” JOM Journal of theMinerals, Metals and Materials Society, vol. 51, no. 2, pp. 21–27, 1999.
[36] H. N. Iben and J. F. O’Brien, “Generating surface crack patterns,” in SCA ’06: Pro-ceedings of the 2006 ACM SIGGRAPH/Eurographics symposium on Computer anima-tion, (Aire-la-Ville, Switzerland, Switzerland), pp. 177–185, Eurographics Association,2006.
[37] M. Pauly, R. Keiser, B. Adams, P. Dutre, M. Gross, and L. J. Guibas, “Meshlessanimation of fracturing solids,” in SIGGRAPH ’05: ACM SIGGRAPH 2005 Papers,(New York, NY, USA), pp. 957–964, ACM, 2005.

80 Bibliography
[38] M. Trulsson, “Mechanoreceptive afferents in the human sural nerve,” ExperimentalBrain Research, vol. 137, no. 1, pp. 111–116, 2001.
[39] K. MacLean and M. Enriquez, “Perceptual design of haptic icons,” in Proceedings ofEurohaptics, pp. 351–363, Citeseer, 2003.
[40] J. van Erp and M. Spape, “Distilling the underlying dimensions of tactile melodies,”in Proceedings of Eurohaptics, vol. 2003, pp. 111–120, 2003.
[41] Y. Visell, A. Law, and J. R. Cooperstock, “Toward iconic vibrotactile informationdisplay using floor surfaces,” in WHC ’09: Proceedings of the World Haptics 2009 -Third Joint EuroHaptics conference and Symposium on Haptic Interfaces for VirtualEnvironment and Teleoperator Systems, (Washington, DC, USA), pp. 267–272, IEEEComputer Society, 2009.
[42] A. W. Law, J. W. Ip, B. V. Peck, Y. Visell, P. G. Kry, and J. R. Cooperstock, “Mul-timodal floor for immersive environments,” in SIGGRAPH ’09: ACM SIGGRAPH2009 Emerging Technologies, (New York, NY, USA), pp. 1–1, ACM, 2009.
[43] S. Audet and J. Cooperstock, “Shadow removal in front projection environments usingobject tracking,” in Proceedings of the IEEE Workshop on Projector Camera Systems(PROCAMS 2007), Citeseer, 2007.
[44] J. LaViola Jr, D. Feliz, D. Keefe, and R. Zeleznik, “Hands-free multi-scale navigationin virtual environments,” in Proceedings of the 2001 symposium on Interactive 3Dgraphics, pp. 9–15, Citeseer, 2001.


![Vibrotactile sense in median 071218 - lup.lub.lu.selup.lub.lu.se/search/ws/files/5318626/1057210.pdf · "Vibrotactile sense in median and ulnar nerve ... [large fibre neuropathy]](https://img.dokumen.tips/doc/110x75/5b1693297f8b9a4a6d8cc088/vibrotactile-sense-in-median-071218-luplubluseluplublusesearchwsfiles5318626.jpg)