Embed Size (px)
Citation preview
econstorMake Your Publications Visible.
A Service of
zbwLeibniz-InformationszentrumWirtschaftLeibniz Information Centrefor Economics
Wignaraja, Ganeshan; Lazaro, Dorothea; DeGuzman, Genevieve
Working Paper
FTAs and Philippine business: Evidence fromtransport, food, and electronics firms
ADBI Working Paper, No. 185
Provided in Cooperation with:Asian Development Bank Institute (ADBI), Tokyo
Suggested Citation: Wignaraja, Ganeshan; Lazaro, Dorothea; DeGuzman, Genevieve (2010) :FTAs and Philippine business: Evidence from transport, food, and electronics firms, ADBIWorking Paper, No. 185, Asian Development Bank Institute (ADBI), Tokyo
This Version is available at:http://hdl.handle.net/10419/53566
Standard-Nutzungsbedingungen:
Die Dokumente auf EconStor dürfen zu eigenen wissenschaftlichenZwecken und zum Privatgebrauch gespeichert und kopiert werden.
Sie dürfen die Dokumente nicht für öffentliche oder kommerzielleZwecke vervielfältigen, öffentlich ausstellen, öffentlich zugänglichmachen, vertreiben oder anderweitig nutzen.
Sofern die Verfasser die Dokumente unter Open-Content-Lizenzen(insbesondere CC-Lizenzen) zur Verfügung gestellt haben sollten,gelten abweichend von diesen Nutzungsbedingungen die in der dortgenannten Lizenz gewährten Nutzungsrechte.
Terms of use:
Documents in EconStor may be saved and copied for yourpersonal and scholarly purposes.
You are not to copy documents for public or commercialpurposes, to exhibit the documents publicly, to make thempublicly available on the internet, or to distribute or otherwiseuse the documents in public.
If the documents have been made available under an OpenContent Licence (especially Creative Commons Licences), youmay exercise further usage rights as specified in the indicatedlicence.
www.econstor.eu
ADBI Working Paper Series
FTAs and Philippine Business:
Evidence from Transport, Food, and Electronics Firms
Ganeshan Wignaraja,
Dorothea Lazaro, and
Genevieve DeGuzman
No. 185 January 2010
Asian Development Bank Institute
The views expressed in this paper are the views of the authors and do not necessarily reflect the views or policies of ADBI, the Asian Development Bank (ADB), its Board of Directors, or the governments they represent. ADBI does not guarantee the accuracy of the data included in this paper and accepts no responsibility for any consequences of their use. Terminology used may not necessarily be consistent with ADB official terms.
Ganeshan Wignaraja is a principal economist at the Office of Regional Economic Integration, Asian Development Bank (ADB). Dorothea Lazaro and Genevieve DeGuzman are ADB consultants. The paper benefited from comments made during the Latin America/Caribbean and Asia/Pacific Economics and Business Association (LAEBA) Conference: FTA Impacts Studies in Tokyo in January 2009; a PIDS Roundtable Discussion in Manila in December 2008; and the ADB/ADBI/Economic Research Institute for ASEAN and East Asia (ERIA) Asian Noodle Bowl Conference in Tokyo in July 2008. The authors are grateful for the comments made by Masahiro Kawai; Thomas Aquino; Sergio R. Ortiz-Luis, Jr.; Cielito Habito; Mario Lamberte; Josef Yap; George Manzano; Erlinda Medalla; Rafaelita Aldaba; John Avila; and other conference participants.
The Working Paper series is a continuation of the formerly named Discussion Paper series; the numbering of the papers continued without interruption or change. ADBI’s working papers reflect initial ideas on a topic and are posted online for discussion. ADBI encourages readers to post their comments on the main page for each working paper (given in the citation below). Some working papers may develop into other forms of publication.
Suggested citation:
Wignaraja, G., D. Lazaro, and G. DeGuzman. 2010. FTAs and Philippine Business: Evidence from Transport, Food, and Electronics Firms. ADBI Working Paper 185. Tokyo: Asian Development Bank Institute. Available: http://www.adbi.org/working-paper/2010/01/13/3431.fta.philippine.business/
Asian Development Bank Institute Kasumigaseki Building 8F 3-2-5 Kasumigaseki, Chiyoda-ku Tokyo 100-6008, Japan Tel: +81-3-3593-5500 Fax: +81-3-3593-5571 URL: www.adbi.org E-mail: [email protected] © 2010 Asian Development Bank Institute
ADBI Working Paper 185 Wignaraja, Lazaro, and DeGuzman
Abstract
Within East Asia, the outward-oriented Philippine economy is a latecomer to using free trade agreements (FTAs) as a trade policy instrument and has relied heavily on the Association of Southeast Asian Nations (ASEAN) for regional liberalization. While negotiating FTAs has consumed scarce time and other resources, limited attention has been hitherto given to evaluating the impact of FTAs—particularly the 15-year-old ASEAN Free Trade Area (AFTA) agreement—on business activity in the Philippines. Using a survey of 155 manufactured goods exporters from three sectors (transport equipment, processed foods, and electronics), this study deals with three questions: (i) Do firms use AFTA and why?; (ii) What impedes firms from using AFTA and other FTAs?; and (iii) What can be done to improve FTA use at firm level in the future? The study finds that utilization of AFTA is higher than expected from existing studies and is set to double in the future. Econometric analysis suggests that firm age, domestic ownership, awareness of FTAs, and membership in the transport sector increase the probability of using AFTA. Surprisingly, among nonusers, a lack of information is the biggest barrier to FTA use. Other impediments to use include the availability of export processing zone incentive schemes, low most-favored-nation rates (particularly in electronics), delays in origin administration, rent-seeking behavior, and nontariff measures in partner country markets. Interestingly, the majority of firms do not think that multiple rules of origin in overlapping Asian FTAs add significantly to business costs. However, there is room for improvement in the system of AFTA rules of origin (e.g., lower value content and introduction of self-certification mechanisms). The examination of institutional support reveals an excess demand for a range of support services (e.g., information, technology-based, and small or medium enterprise extension services) that will enable firms to use FTAs more effectively in the future. The paper concludes by making the case for better mainstreaming of FTAs into Philippine national trade policy and for improving support services to firms.
JEL Classification: F1, F15, O24
ADBI Working Paper 185 Wignaraja, Lazaro, and DeGuzman
Contents 1. Introduction.................................................................................................................. 1
2. Policy Background and Export Trends ........................................................................ 2
2.1 Evolution of the Philippines’ Trade and Investment Strategy ............................. 2 2.2 Tariff, Trade, and Investment Profile .................................................................. 4
3. Use and Perceptions of AFTA..................................................................................... 6
3.1 Patterns of Use................................................................................................... 7 3.2 Firm-Specific Factors Predicting AFTA Use..................................................... 10 3.3 Business Response to AFTA and Other FTAs................................................. 13
4. Impediments to FTA Use........................................................................................... 16
4.1 Lack of Information........................................................................................... 17 4.2 Delays and Administrative Costs...................................................................... 18 4.3 Other Trade and Investment Schemes—Use of EPZs and ITA ....................... 18 4.4 Arbitrary Classification of Product Origin.......................................................... 19 4.5 Market Access—Too Many Exclusions and Small Margins of Preference....... 19 4.6 Confidentiality of Information............................................................................ 20 4.7 Nontariff Measures Employed by FTA Partners............................................... 20 4.8 Other Barriers to FTA Use and Exporting ........................................................ 20
5. Understanding Origin Issues ..................................................................................... 21
5.1 Issues in Origin Administration......................................................................... 21 5.2 Potential AFTA Usage with an Improved ROO System ................................... 22 5.3 Perception of Impact of Multiple ROO.............................................................. 24
6. FTA Support Services ............................................................................................... 26
6.1 Public and Private Sources .............................................................................. 26 6.2 Services Demanded and Supply Gaps ............................................................ 27
7. Conclusion................................................................................................................. 29
Appendix 1: Philippine FTAs, by Status................................................................................ 31
Appendix 2: Sampling Methodology ..................................................................................... 32
Appendix 3: Philippine Exports with Current and Potential FTA Partners............................. 33
Appendix 4: Share of Exports and Tariff Rates in the Philippines' Major Export Products to ASEAN, 2006 .............................................................................................. 34
Appendix 5: Firm Characteristic Predictors of AFTA Use (Model 2) ..................................... 35
Appendix 6: Procedures for the Issuance of a Preferential Certificate of Origin ................... 36
Appendix 7: Public and Private Sources of Support for FTA Use......................................... 37
References............................................................................................................................ 39
ADBI Working Paper 185 Wignaraja, Lazaro, and DeGuzman
1. INTRODUCTION The Philippines offers an interesting case study on the impact of the Association of Southeast Asian Nations (ASEAN) Free Trade Area (AFTA) agreement on business behavior, and one that offers lessons for similar newcomers to free trade agreements (FTAs) in the developing world. Compared to other countries in East Asia, the Philippines has placed more emphasis on outward orientation and ASEAN regional FTAs and less emphasis on bilateral agreements. Outward-oriented trade and investment policies have been a cornerstone of the country's industrialization strategy since the 1980s. Since the early 1990s, the Philippines has leaned toward a more regional approach to liberalization through membership in AFTA, and has subsequently relied heavily on ASEAN in negotiating FTAs. Between 2005 and 2009, the country implemented three ASEAN FTAs with major regional powers (the People’s Republic of China [PRC], Japan, and the Republic of Korea [hereafter Korea]), and recently signed the ASEAN-Australia-New Zealand FTA and the ASEAN-India FTA (See Appendix 1 for a list of Philippine FTAs and their status). The country’s only bilateral FTA—the Japan-Philippines Economic Partnership Agreement (JPEPA)—took four years to negotiate and two more years to take effect after it was signed in 2006.
While negotiating these FTAs consumed scarce time and resources, limited attention has been hitherto given to evaluating the impact of FTAs on business activity in the Philippines, particularly the impact of AFTA. Existing studies of the Philippines are mostly ex ante assessments of the macroeconomic effects of FTAs using computable general equilibrium models (Cororaton 2004; Kawasaki 2003; Urata and Kiyota 2003; Yasutake 2004) and some sectoral strength-weakness-opportunity-threat analyses (Tan 2004; Austria 2006; Costales 2008; Pineda and Tongco 2007). Ex post facto evaluation of FTAs has been difficult due to the lack of official published data (e.g., on the utilization of certificates of origin) and effective monitoring of the implementation of FTAs, particularly AFTA. Information on AFTA utilization rates from alternative data sources like firm surveys are also nonexistent.
To the best of the authors’ knowledge, this is the first comprehensive firm-level study of the business impact of FTAs in the Philippines. Focusing on AFTA, which has a 15-year implementation history, and looking at other FTAs that were not yet in effect at the time of the survey but are beginning to draw the interest of firms, this study combines descriptive analysis of firm-level data with econometric analysis, where appropriate. It attempts to address three important questions: (i) Do firms use AFTA and why?; (ii) What impedes firms from using either AFTA or other FTAs?; and (iii) What can be done to improve FTA use at the firm level in the future? The study addresses the first question by examining patterns of AFTA use at the industry level and conducting a probit analysis of the determinants of AFTA use. It deals with the second question by ranking what nonusers of FTAs regard as major impediments to use. Issues covered include information, margins of preference, and rules of origin (ROO). This is complemented by a more detailed analysis of ROO issues, which are some of the most contested issues relating to FTAs in East Asia. Accordingly, the analysis of ROO examines the efficiency of origin administration, the possible effect of improvements to the AFTA ROO system in particular, and the perceived impact of multiple ROO in overlapping FTAs. Finally, these findings, along with an examination of the demands for institutional support, provide insights on the third question regarding improving FTA use in the Philippines.
An enterprise survey was conducted in the Philippines between May and November 2008 on 155 randomly selected firms from the transport equipment (36 firms), processed foods (43 firms), and electronics (76 firms) sectors exporting manufactured goods (see Appendix 2 for the sampling methodology). The sample covers firms of different geographical locations, sizes, types of ownership, and sectors. The three sectors were selected for the study in view of their importance in the Philippine economy and the fact that they are priority integration sectors for ASEAN. Together, the three sectors account for around 73% of total Philippine
ADBI Working Paper 185 Wignaraja, Lazaro, and DeGuzman
exports, with electronics accounting for a staggering 63% of total exports, machinery and transport equipment for 5%, and processed foods for 4% (see Appendix 3 for the Philippines’ export profile with current FTA partners).
By way of background, Section 2 provides a brief overview of Philippine trade and investment policies. Sections 3–6 present an analysis of the firm survey findings on AFTA usage and future use of other FTAs, impediments to the use of FTAs in general, specific ROO issues, and the adequacy of FTA support. Section 7 concludes with a summary of the findings and policy suggestions.
2. POLICY BACKGROUND AND EXPORT TRENDS This section reviews the Philippines’ trade and investment policy history and examines trends in Philippine export performance, with a particular focus on the shift in trade patterns from traditional markets to ASEAN and other regional markets.
2.1 Evolution of the Philippines’ Trade and Investment Strategy
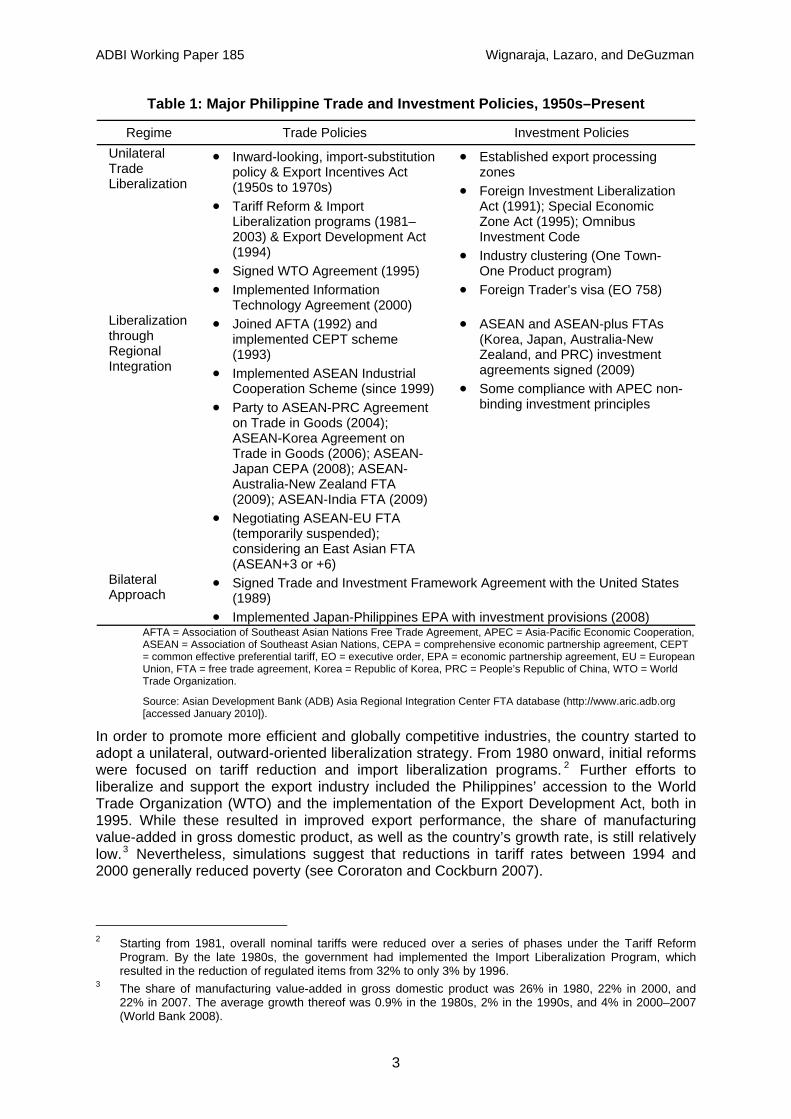
A variety of trade and investment episodes have influenced the country’s industrialization process (National Economic Development Authority [NEDA] 2004) (see Table 1 for a summary). From the 1950s to the 1970s, the Philippines pursued restrictive and protectionist policies as part of its then inward-looking, import-substituting industrialization strategy. This period was characterized by protective tariffs, foreign exchange control measures, and capital market interventions, which shielded domestic industries from foreign competition.1 After an initial spurt, the inward-looking strategy soon reached its limits due to a relatively small domestic market. The protectionist regime resulted in inefficient domestic industries, competitiveness issues, and shallow growth, prompting the government to rethink and restructure its industrial policy.
1 See World Trade Organization (WTO) (2005), Balisacan and Hill (2003), and Austria (2001) for a detailed
account of the Philippines’ trade and investment regime.
2
ADBI Working Paper 185 Wignaraja, Lazaro, and DeGuzman
Table 1: Major Philippine Trade and Investment Policies, 1950s–Present
Regime Trade Policies Investment Policies Unilateral Trade Liberalization
• Inward-looking, import-substitution policy & Export Incentives Act (1950s to 1970s)
• Tariff Reform & Import Liberalization programs (1981–2003) & Export Development Act (1994)
• Signed WTO Agreement (1995) • Implemented Information
Technology Agreement (2000)
• Established export processing zones
• Foreign Investment Liberalization Act (1991); Special Economic Zone Act (1995); Omnibus Investment Code
• Industry clustering (One Town-One Product program)
• Foreign Trader’s visa (EO 758)
Liberalization through Regional Integration
• Joined AFTA (1992) and implemented CEPT scheme (1993)
• Implemented ASEAN Industrial Cooperation Scheme (since 1999)
• Party to ASEAN-PRC Agreement on Trade in Goods (2004); ASEAN-Korea Agreement on Trade in Goods (2006); ASEAN-Japan CEPA (2008); ASEAN-Australia-New Zealand FTA (2009); ASEAN-India FTA (2009)
• Negotiating ASEAN-EU FTA (temporarily suspended); considering an East Asian FTA (ASEAN+3 or +6)
• ASEAN and ASEAN-plus FTAs (Korea, Japan, Australia-New Zealand, and PRC) investment agreements signed (2009)
• Some compliance with APEC non-binding investment principles
Bilateral Approach
• Signed Trade and Investment Framework Agreement with the United States (1989)
• Implemented Japan-Philippines EPA with investment provisions (2008) AFTA = Association of Southeast Asian Nations Free Trade Agreement, APEC = Asia-Pacific Economic Cooperation, ASEAN = Association of Southeast Asian Nations, CEPA = comprehensive economic partnership agreement, CEPT = common effective preferential tariff, EO = executive order, EPA = economic partnership agreement, EU = European Union, FTA = free trade agreement, Korea = Republic of Korea, PRC = People’s Republic of China, WTO = World Trade Organization.
Source: Asian Development Bank (ADB) Asia Regional Integration Center FTA database (http://www.aric.adb.org [accessed January 2010]).
In order to promote more efficient and globally competitive industries, the country started to adopt a unilateral, outward-oriented liberalization strategy. From 1980 onward, initial reforms were focused on tariff reduction and import liberalization programs. 2 Further efforts to liberalize and support the export industry included the Philippines’ accession to the World Trade Organization (WTO) and the implementation of the Export Development Act, both in 1995. While these resulted in improved export performance, the share of manufacturing value-added in gross domestic product, as well as the country’s growth rate, is still relatively low.3 Nevertheless, simulations suggest that reductions in tariff rates between 1994 and 2000 generally reduced poverty (see Cororaton and Cockburn 2007).
2 Starting from 1981, overall nominal tariffs were reduced over a series of phases under the Tariff Reform
Program. By the late 1980s, the government had implemented the Import Liberalization Program, which resulted in the reduction of regulated items from 32% to only 3% by 1996.
3 The share of manufacturing value-added in gross domestic product was 26% in 1980, 22% in 2000, and 22% in 2007. The average growth thereof was 0.9% in the 1980s, 2% in the 1990s, and 4% in 2000–2007 (World Bank 2008).
3

ADBI Working Paper 185 Wignaraja, Lazaro, and DeGuzman
Following the signing of its first regional FTA, AFTA, in 1992, the Philippines’ increasing outward orientation was complemented by a regional focus. Along with FTAs with the PRC, Korea, and Japan, implemented through the ASEAN channel, the Philippines has signed FTAs with Australia, New Zealand, and India. The country also recently became party to a bilateral FTA with Japan (Philippine Exporters Confederation [Philexport] 2007b; Senate of the Philippines, Senate Economic Planning Office 2007). In addition, the Philippines signed a trade and investment framework agreement4 with the United States (US) in 1989 and has agreed to various types of bilateral trade, investment treaties, and memoranda of understanding with more than 35 countries. Today, the country has a multi-track approach to liberalization—unilateral, regional, and bilateral.5
Alongside trade reforms, major investment reforms were also undertaken in the early 1990s, including, of particular importance, the enactment of the Foreign Investment Liberalization Act and the Special Economic Zone Act. These reforms attracted substantial foreign direct investment (FDI) in manufacturing and underscored the contribution of foreign-owned firms (particularly multinational corporations [MNCs]) in increasing output as well as in linking the Philippines to global and regional production networks. With the objective of establishing the Philippines as a production base (particularly in the auto and electronics sectors), the country has participated in both the ASEAN Industrial Cooperation (AICO) scheme (discussed in Section 3) and the Information Technology Agreement (ITA) through the WTO.6
2.2 Tariff, Trade, and Investment Profile
Tariff structure. Although tariff reforms have undergone some recalibrations and reversals over the years (WTO 2005), overall tariffs were gradually liberalized to a simple average applied most-favored-nation (MFN) tariff rate of 6.3% by 2008 (see Table 2 for selected rates). This rate is already low by developing country standards. Electronic inputs are mostly duty free, with an average MFN tariff rate of 3.8% for electrical machinery (WTO 2009. Dispersion has also fallen, with most items within the 0–10% tariff range and only four items at the 60–65% tariff level (down from 53 items in 2000) (Philippine Tariff Commission 2009).
Table 2: Average Tariffs, Selected Sectors (%)
Sector 1990 2000 2005 2008 Manufacturing 31.0 18.7 15.2 3.1 Food Processing 40.4 35.1 31.6 9.6 Machinery and Transport Equipment 24.2 7.9 4.7 2.0
Note: Weighted average data for 2007.
Sources: Philippine Institute of Development Studies (2009); Philippine Tariff Commission (2009).
MFN and AFTA Liberalization. Following the signing of AFTA in 1992, the Common Effective Preferential Tariff (CEPT) scheme with ASEAN member countries was implemented a year later (Philexport 2007a; Balboa, Medalla, and Yap 2007). AFTA's objective was to increase ASEAN's competitive edge as an integrated production base in overseas markets and the CEPT scheme’s aim was to reduce intraregional tariffs to 0–5% on 99% of tariff lines by 2010 for ASEAN-6 countries, including the Philippines. Barriers to international and intra-
4 A trade and investment framework agreement is a prerequisite to negotiating a bilateral FTA with the US. 5 The government’s medium-term development plan states that the Philippines will continue to participate in and
conclude various international trading arrangements and aim to maximize exports and investment opportunities offered through these trade agreements (NEDA 2004).
6 The goal of the ITA is the global reduction or elimination of tariffs by some WTO members on selected electronics and information and communication technology (ICT) products. Under the ITA, the Philippines committed itself to reducing the tariff rates of some 188 ICT product lines to zero by 2000 and of 47 ICT product lines by 2005.
4
ADBI Working Paper 185 Wignaraja, Lazaro, and DeGuzman
ASEAN trade gradually fell over time. Average applied MFN tariffs for the Philippines fell from 12.1% to 6.3% between 1997 and 2008. Furthermore, as part of the CEPT arrangement, the Philippines liberalized its economy to its ASEAN trading partners more rapidly than to the rest of the world. The average CEPT rate for exports from the rest of ASEAN to the Philippines fell from 9.1% to 3.7% between 1997 and 2003 and is expected to further reduce to negligible rates by 2010. Likewise, Philippine exports to ASEAN economies have enjoyed lower preferential tariffs over time. For instance, average tariffs for ASEAN-6 economies fell from around 6% to 0.8% between 1997 and 2008.
Aside from the CEPT scheme, the Philippines is also party to ASEAN agreements on its 11 priority integration sectors (which include agro-based products, automotives, and electronics); investment area; mutual recognition; industrial cooperation scheme; and trade facilitation. The firm-level results in Section 3 will shed light on the impact of AFTA on Philippine business.
Export profile. Trade liberalization efforts have changed the food sector's output structure, largely benefiting labor-intensive and competitive industries (Dueñas-Caparas 2007). Since 1980, exports of commodity goods have shifted from traditional products (such as coconut, sugar, forest products, mineral products, fruits and vegetables, abaca, and tobacco) to nontraditional exports (specifically industrial manufactures), which accounted for 73% of total merchandise exports in 2006. The share of electronics—primarily semiconductors and data processing machines—was almost three quarters of total exports, while machinery and transport equipment, consumer manufactures, and food processing products contributed almost 10% of total exports.
The country’s heavy reliance on electronics has raised serious concerns in light of the global recession, weakening demand for imported electronic products abroad, rising power costs and crude oil prices, and the sector’s need for innovation (Philippine products in the electronics sector generally have low value-added and high import content). Primarily due to the slowdown in the US market, two of the country’s biggest information technology companies—Texas Instruments Philippines and Intel Corp.7—announced either the closure of their manufacturing plants or thousands of layoffs in the Philippines in early 2009.
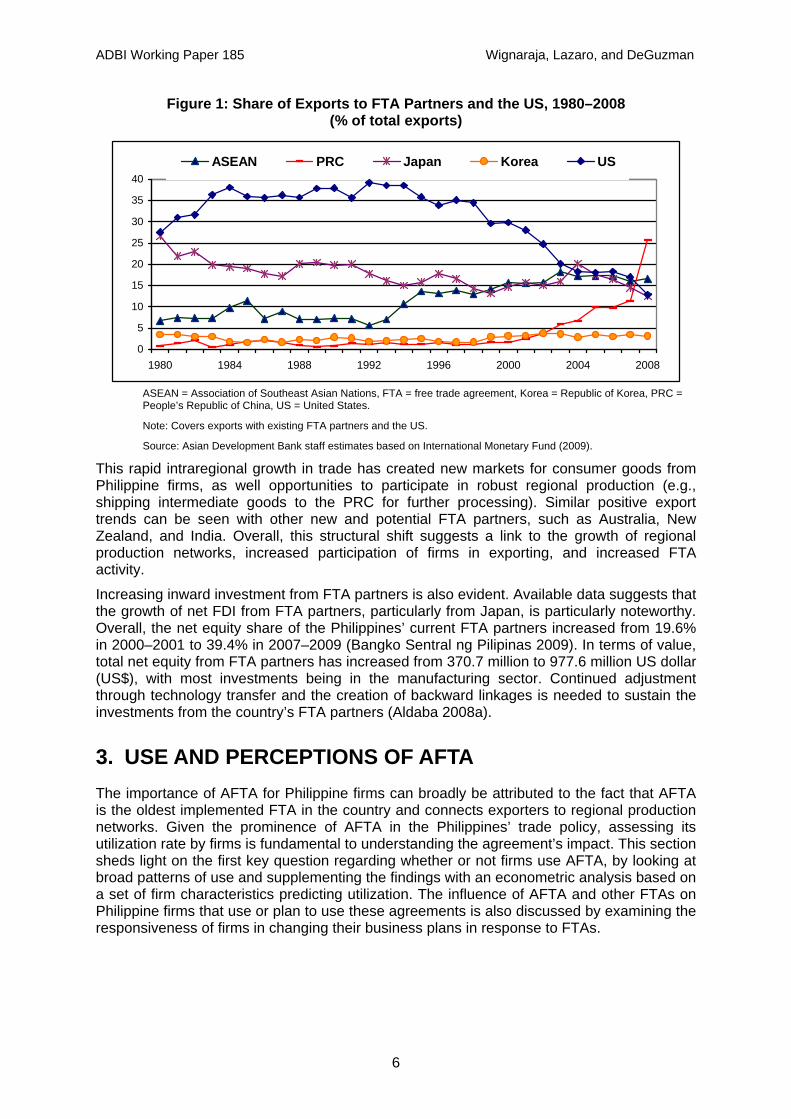
Trade and investment trends with FTA partners. Increased regional liberalization in ASEAN has coincided with a shift in the Philippines’ exports toward its existing FTA partners (particularly in ASEAN and its Northeast Asian neighbors) and away from traditional markets like the US and the European Union (EU). Figure 1 and Appendix 3 provide data on Philippine exports, broken down by current and future FTA markets. Highlighting the importance of AFTA, the Philippines’ exports to ASEAN countries grew at an impressive rate of 20.4% per year in 1992–2008 and the share of ASEAN in its total exports reached 16.6% in 2008. The effect on Philippine exports of ASEAN+1 FTAs with its Northeast Asian neighbors is also becoming evident. Particularly impressive have been Philippine exports to the PRC, which have grown by 36.6% per year and now account for a quarter of the country’s exports, despite worries of competitive threats from cheap imports (Palanca 2004). While exports to Korea still remain small (3% of exports), they have nearly doubled since 1992. Meanwhile, exports to the US—the Philippines’ largest trading partner in the 1980s and early 1990s—have contracted by more than two-thirds over the same period to 12.8% of total exports. By comparison, exports to Japan have remained relatively unchanged due to preferential market access via the bilateral FTA with Japan and the ASEAN-Japan FTA.
7 In 2007, the Philippines won (over the PRC) a 1 billion US dollar (US$) semiconductor test and assembly
plant planned by Texas Instruments. Meanwhile, Intel Corp. used to be one of the biggest exporters in the Philippines and one of the first to set up semiconductor manufacturing facilities (35 years ago).
5
ADBI Working Paper 185 Wignaraja, Lazaro, and DeGuzman
Figure 1: Share of Exports to FTA Partners and the US, 1980–2008 (% of total exports)
0
5
10
15
20
25
30
35
40
1980 1984 1988 1992 1996 2000 2004 2008
ASEAN PRC Japan Korea US
ASEAN = Association of Southeast Asian Nations, FTA = free trade agreement, Korea = Republic of Korea, PRC = People’s Republic of China, US = United States.
Note: Covers exports with existing FTA partners and the US.
Source: Asian Development Bank staff estimates based on International Monetary Fund (2009).
This rapid intraregional growth in trade has created new markets for consumer goods from Philippine firms, as well opportunities to participate in robust regional production (e.g., shipping intermediate goods to the PRC for further processing). Similar positive export trends can be seen with other new and potential FTA partners, such as Australia, New Zealand, and India. Overall, this structural shift suggests a link to the growth of regional production networks, increased participation of firms in exporting, and increased FTA activity.
Increasing inward investment from FTA partners is also evident. Available data suggests that the growth of net FDI from FTA partners, particularly from Japan, is particularly noteworthy. Overall, the net equity share of the Philippines’ current FTA partners increased from 19.6% in 2000–2001 to 39.4% in 2007–2009 (Bangko Sentral ng Pilipinas 2009). In terms of value, total net equity from FTA partners has increased from 370.7 million to 977.6 million US dollar (US$), with most investments being in the manufacturing sector. Continued adjustment through technology transfer and the creation of backward linkages is needed to sustain the investments from the country’s FTA partners (Aldaba 2008a).
3. USE AND PERCEPTIONS OF AFTA The importance of AFTA for Philippine firms can broadly be attributed to the fact that AFTA is the oldest implemented FTA in the country and connects exporters to regional production networks. Given the prominence of AFTA in the Philippines’ trade policy, assessing its utilization rate by firms is fundamental to understanding the agreement’s impact. This section sheds light on the first key question regarding whether or not firms use AFTA, by looking at broad patterns of use and supplementing the findings with an econometric analysis based on a set of firm characteristics predicting utilization. The influence of AFTA and other FTAs on Philippine firms that use or plan to use these agreements is also discussed by examining the responsiveness of firms in changing their business plans in response to FTAs.
6
ADBI Working Paper 185 Wignaraja, Lazaro, and DeGuzman
3.1 Patterns of Use
20% of Philippine firms use AFTA. With 31 firms reporting using or having used AFTA, the results revealed higher than expected utilization rates (earlier studies reported much lower rates of use).8
41% of Philippine firms plan to use FTAs. Looking ahead, the overall FTA utilization rate is expected to increase dramatically. At least 63 firms (40.7% of all firms) stated that they plan to use AFTA or recently implemented and/or soon to be signed FTAs. Reflecting the growing interest in the Chinese market, the ASEAN-PRC FTA is becoming a priority agreement for Philippine firms and reflects a perception that the PRC is more of a market opportunity than a threat. While, at the time of the survey, only one firm reported using the ASEAN-PRC FTA and three firms that they plan to use it in the future, firm interviews showed that the ASEAN-PRC FTA ranks among the most important FTAs. Later, Section 3.3 will illustrate how firms in the food sector are eyeing strategic and emerging markets covered by FTAs, particularly the ASEAN-PRC FTA. Other FTAs that are regarded as important to business are JPEPA—which had not yet taken effect at the time of the survey but was generally viewed as a way to increase access to the Japanese market—the ASEAN-Korea FTA, and the ASEAN-EU FTA.
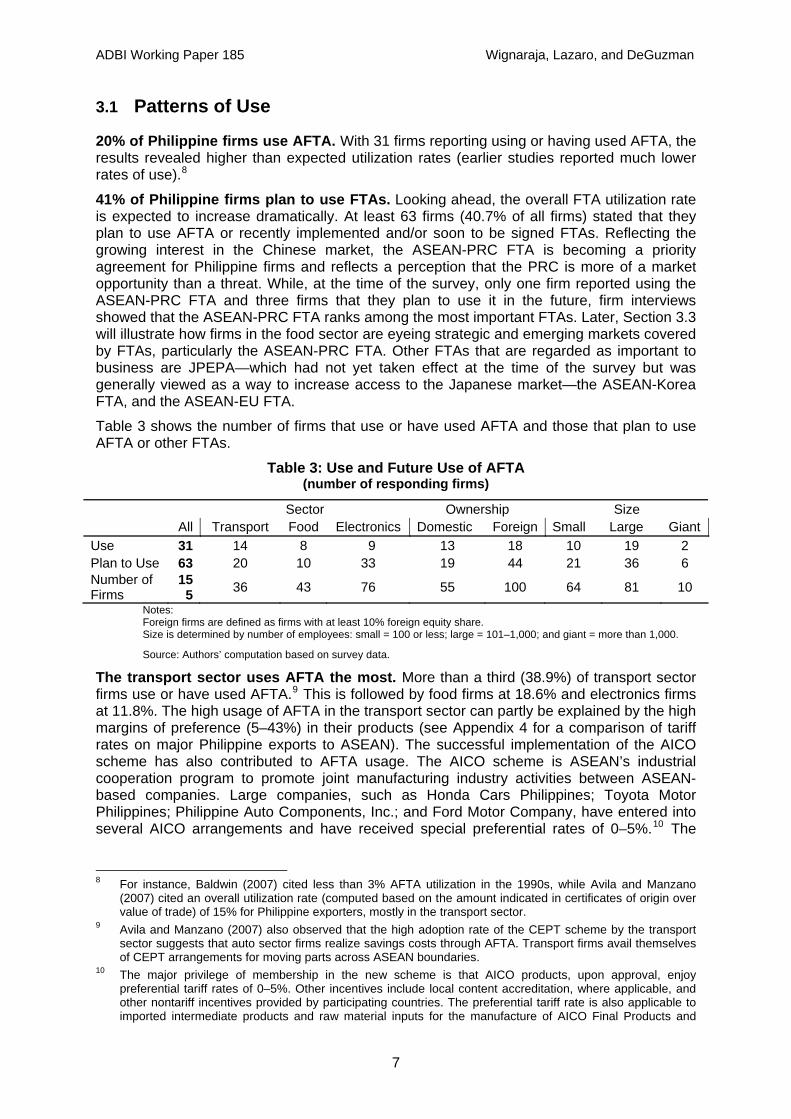
Table 3 shows the number of firms that use or have used AFTA and those that plan to use AFTA or other FTAs.
Table 3: Use and Future Use of AFTA (number of responding firms)
Sector Ownership Size All Transport Food Electronics Domestic Foreign Small Large Giant Use 31 14 8 9 13 18 10 19 2 Plan to Use 63 20 10 33 19 44 21 36 6 Number of Firms
155 36 43 76 55 100 64 81 10
Notes: Foreign firms are defined as firms with at least 10% foreign equity share. Size is determined by number of employees: small = 100 or less; large = 101–1,000; and giant = more than 1,000.
Source: Authors’ computation based on survey data.
The transport sector uses AFTA the most. More than a third (38.9%) of transport sector firms use or have used AFTA.9 This is followed by food firms at 18.6% and electronics firms at 11.8%. The high usage of AFTA in the transport sector can partly be explained by the high margins of preference (5–43%) in their products (see Appendix 4 for a comparison of tariff rates on major Philippine exports to ASEAN). The successful implementation of the AICO scheme has also contributed to AFTA usage. The AICO scheme is ASEAN’s industrial cooperation program to promote joint manufacturing industry activities between ASEAN-based companies. Large companies, such as Honda Cars Philippines; Toyota Motor Philippines; Philippine Auto Components, Inc.; and Ford Motor Company, have entered into several AICO arrangements and have received special preferential rates of 0–5%.10 The
8 For instance, Baldwin (2007) cited less than 3% AFTA utilization in the 1990s, while Avila and Manzano
(2007) cited an overall utilization rate (computed based on the amount indicated in certificates of origin over value of trade) of 15% for Philippine exporters, mostly in the transport sector.
9 Avila and Manzano (2007) also observed that the high adoption rate of the CEPT scheme by the transport sector suggests that auto sector firms realize savings costs through AFTA. Transport firms avail themselves of CEPT arrangements for moving parts across ASEAN boundaries.
10 The major privilege of membership in the new scheme is that AICO products, upon approval, enjoy preferential tariff rates of 0–5%. Other incentives include local content accreditation, where applicable, and other nontariff incentives provided by participating countries. The preferential tariff rate is also applicable to imported intermediate products and raw material inputs for the manufacture of AICO Final Products and
7
ADBI Working Paper 185 Wignaraja, Lazaro, and DeGuzman
appeal of AFTA’s high margins of preference for firms in the transport sector is also clear from an analysis of the benefits of using AFTA (see Box 1). Transport firms identified lower tariffs as the most important benefit of using AFTA, stating that AFTA’s preferential rates enable them to source cheaper raw materials and components from abroad, thereby reducing their production costs.
The lower AFTA utilization rate among food sector firms (18.6%) can be explained by the smaller margins of preference (0–5% for most major Philippine export products to Malaysia and Viet Nam). One food firm claimed that they use AFTA solely for sourcing packaging materials like high bars and plastic bags from other ASEAN countries. The similarity of food products produced by ASEAN countries also limits intra-ASEAN trade and, consequently, the use of AFTA by food firms.
In the electronics sector, only nine firms (11.8%) use or have used AFTA. AFTA usage among electronics firms is broadly in compliance with the requirements of the firms’ mother companies or clients abroad. This low usage rate is generally attributed to: (i) low or zero MFN tariff rates and (ii) firms’ use of export processing zones (EPZs) (or economic zones) and other investment schemes. Most of the electronics firms located in designated economic zones11 are satisfied with duty-free importation and exportation and the tax and nontax incentives granted by the Philippine Economic Zone Authority (PEZA) and, as a result, have no incentive to avail themselves of FTA preferences. Firms that are not located in economic zones also enjoy the benefits of a customs manufacturing bonded warehouse, such as the suspension of payment of duties and local taxes.
AICO Intermediate Products. In 2006, Philippine firms entered into at least 20 AICO arrangements with Indonesia, Malaysia, and Thailand (ASEAN Secretariat 2009; Philippine Tariff Commission 2009).
11 Designated areas in countries that possess special economic regulations (e.g., tax exemptions).
8

ADBI Working Paper 185 Wignaraja, Lazaro, and DeGuzman
Box 1: AFTA Brings Net Benefits to Firms AFTA users identified more positive than negative impacts of the agreement (see Figure 2). The most significant benefits to firms are lower tariffs (71% of FTA users) and increased export sales (58% of FTA users). At least 22 firms stated that AFTA’s preferential rates enable them to source cheaper raw materials and components from abroad, thereby reducing their production costs. 18 firms reported that they have realized increased export sales due to wider market access. Additional benefits of AFTA include the concentration of production (11 firms) and new business opportunities (10 firms).12 Among the sectors covered by the study, transport firms identified lower tariffs and increased export sales as the first and second most important benefits of AFTA, respectively. Most food firms, however, see more benefit in new business opportunities and the concentration of production than in improved market access. Furthermore, firms in the food sector are hoping that FTAs will open channels to nontraditional markets such as the Middle East. For electronics firms, the most important benefit of AFTA use is access to cheaper intermediate goods due to lower tariffs.
In terms of negative impacts, firms using AFTA reported increased competition as their greatest worry. According to 11 firms, domestic suppliers of components and raw materials have been negatively affected by the influx of cheaper imported products. At least eight firms specified that AFTA has been a factor (although not the sole reason) in the relocation of their production to other ASEAN countries. Other disadvantages of AFTA are high documentation costs and lower preferential tariffs than are available to firms through other FTAs (Pasadilla and Liao 2005). Transport firms worry about increased competition the most, followed by the relocation of production. Electronics firms share the same concerns regarding competition, reflecting the industrial vulnerability of these two sectors as they deal with not only waning demand due to the global economic slowdown, but also internal constraints in moving up the value chain to compete with other global players operating in the Philippines.
Figure 2: Benefits and Costs of AFTA (number of responding firms by sector, AFTA users only)
Electronics FoodTransport
1
3
2
3
5
5
5
8
2
1
1
1
1
1
3
3
3
3
5
7
4
5
10
11Benefits
Cheaper intermediate goods due to lower tariffs
Increased export sales
Concentration of production
New business opportunities
Costs Increased competition
Relocation of production
Documentation costs
Competitive disadvantage with precedent FTAs
Note: Multiple answers allowed. Source: Authors’ computation based on the survey data.
Domestic firms favor using AFTA. Domestic firms show a higher AFTA utilization rate (23.6%) than foreign-owned firms (18.0%). Moderate AFTA usage by foreign firms could be explained by their traditional major export markets (like the US and the EU), with which the Philippines has no outstanding FTAs. As a result, foreign firms often avail themselves of the Generalized System of Preferences, rather than AFTA, when available.
12 This supports the conclusion arrived at by Austria (2004) that two of AFTA’s great achievements are the
development of an international production base and the acceleration of extra-regional trade. AFTA has created an environment in which MNCs are freer to choose their cross-border bases and conduct their economic activities.
9
ADBI Working Paper 185 Wignaraja, Lazaro, and DeGuzman
Large and giant firms tend to use AFTA more. Large and giant firms have higher AFTA utilization rates (23.5% and 20%, respectively) than small firms (only 10 of 64 firms or 15.6%). The high usage rate among large and giant firms can be attributed to three factors: (i) they realize larger gains from tariff preferences because they export more; (ii) they have export departments—where the ease of complying with FTA documentation requirements encourages them to use FTAs; and (iii) they are either subsidiaries of or suppliers to MNCs, where origin cumulation in FTAs is implemented or required in their production networks.
Users are largely located outside EPZs. Of the 31 AFTA users, at least 61.3% are located outside the EPZs. Because non-EPZ firms do not enjoy tax and nontax incentives available to firms located in EPZs, they are more inclined to make use of FTA preferences.
3.2 Firm-Specific Factors Predicting AFTA Use
While the general patterns that emerge from the data suggest interesting distinctions between users and nonusers of AFTA on factors such as industrial profile, ownership, and size, a more rigorous analysis is needed to control for variations in fixed firm characteristics and to shed light on the precise relationship between firm attributes and their propensity to use AFTA (see Table 4 for a list of variables used in the model).
3.2.1 Model Specification and Hypotheses Using the general patterns of AFTA use discussed above and other observations, a firm-level AFTA use function (FTA_USE) can be specified as:
FTA_USE = F(α0 + α1EMP + α2AGE + α3FOR + α4FTAMKT + α5NCR + α6EPZ + α7CONSULT + α8AWARE + α10AUTO + α11FOOD).
Table 4: Firm-Level AFTA Use Function Variables
Variable Description
FTA_USE Dependent variable, binary outcome (1 = firm uses AFTA, 0 = firm does not use AFTA)
EMP Number of permanent employees in 2006
AGE Number of years a firm has been in operation
FOR Dummy variable (1 = 10% or more foreign equity, 0 = otherwise)
FTAMKT Dummy variable (1 = exports to FTA markets only, 0 = otherwise)
NCR Dummy variable (1 = firm is located in the national capital region, 0 = otherwise)
EPZ Dummy variable (1 = firm is located in a special economic zone, 0 = otherwise)
CONSULT Dummy variable (1 = firm has participated in consultations, 0 = otherwise)
AWARE Dummy variable (1 = firm has some or thorough and detailed knowledge of FTA provisions, 0 = otherwise)
AUTO Dummy variable (1 = firm belongs to the transport sector, 0 = otherwise)
FOOD Dummy variable (1 = firm belongs to the food sector, 0 = otherwise) AFTA = Association of Southeast Asian Nations Free Trade Agreement, FTA = free trade agreement.
Hypotheses:
Firm size. The number of people a firm employs was generally expected to be positively correlated with AFTA use. Larger firms were regarded as being more capable of bearing the big investments and risks associated with exporting under FTAs. On the other hand, large domestic firms could prioritize local markets, where they could have de facto monopolies, and so would be less likely to prioritize export markets and FTAs.
10
ADBI Working Paper 185 Wignaraja, Lazaro, and DeGuzman
Firm age. As a firm matures and gains more experience in the international market, it may perceive more benefits from using FTAs, recognizing market opportunities and having the means to take advantage of them. However, older firms may also have established a market orientation toward traditional non-FTA markets, which could reduce their propensity to use AFTA. In contrast, younger firms could be more dynamic and aggressive in responding to new and changing markets and economic shocks and so be more likely to use AFTA.
Foreign ownership. Foreign ownership and FTA use were generally expected to have a positive relationship. Access to sophisticated international networks and the knowledge of parent companies, along with international caliber production, technology, and management know-how, could make foreign firms more likely to tap into FTAs. Foreign firms are also generally larger, which could enable them to leverage their size in absorbing risks associated with exploring new FTA markets. On the other hand, foreign firms may be more oriented toward their larger, traditional markets (e.g., the US and EU), resulting in a weaker propensity to use AFTA.
Market orientation. Market orientation can determine a firm’s likelihood to use AFTA. Philippine firms that export only to FTA markets were expected to use FTAs, while those that focus on traditional markets were expected to be less inclined to do so. One reason is that FTA markets tend to be smaller and more regional in focus and coverage. Also, ASEAN and the PRC have dense and well-developed production networks and manufacturing hubs, which have been instrumental in enhancing intraregional trade and sparking growth. To the extent that firms reap benefits from FTA use, using AFTA in these newer and increasingly integrated markets may give firms a competitive edge through cheaper intermediate goods (from lower tariff rates), streamlined production networks, and new business opportunities.
Firm location. Firms located in the national capital region (NCR) were expected to be more likely to use AFTA (because of their proximity to the resources and developed infrastructure of large metropolitan areas) than firms situated in remote or rural areas. Firms located in EPZs receive special incentives and tax breaks, which may make them less inclined to use FTAs if the marginal benefits are small.
Consultations. Participation in consultations with government or the private sector was expected to be highly correlated with AFTA use. Firms that had responded to this type of outreach or had engaged with officials involved in the negotiation of FTAs were expected to be more vested in the success of trade agreements. Consultations also ultimately enhance the learning and capability building of firms and enable them to navigate the details of FTA provisions by stimulating dialogue and cooperation.
Awareness of FTA provisions. Firms with some or thorough and detailed knowledge of FTA provisions that affect their businesses were regarded as being more aware than firms with little or no knowledge of FTAs. Awareness is generally associated with AFTA use as firms that are informed have most likely invested time and resources to acquire information and are better equipped to take advantage of provisions.
Sectoral dummies. These were used in the model to control for variation in AFTA use based on the industrial profile of firms. In the earlier discussion of patterns of use, transport firms tended to have higher AFTA utilization rates than firms in the food or electronics sectors. This sectoral variation will be tested in the econometric model in the next section.
3.2.2 Probit Model of AFTA Use A causal relationship between firm characteristics and the use of AFTA was estimated by means of a two-stage multivariate modeling strategy (binary outcomes for the probit model were 1 = firm is an AFTA user and 0 = firm is not an AFTA user) using the firm characteristics described above. After a general form of the model was tested, a reduced form was also tried in order to retest the significant variables from the general form. The
11

ADBI Working Paper 185 Wignaraja, Lazaro, and DeGuzman
findings of the analysis (below) reinforce and validate the patterns found in the data. Probit coefficients and results for both models are presented in Table 5.
Age is a significant predictor of AFTA use, with older firms more likely to be users. This highlights the critical link between experience (i.e., years in operation) and the likelihood of a firm using AFTA. On average, the probability of firms in the sample that are less than 10 years old using AFTA is about 10% or less, while the probability for firms in operation for more than 25 years increases to over 25%. Experienced firms are generally more confident, having developed core capabilities over their many years in operation and having gained leverage over time to better compete in the world market and take advantage of FTAs.
Domestic ownership and market orientation matter in predicting AFTA use. Local firms have a 29% probability of using AFTA, compared to only 8% for foreign firms. This may reflect the influence of market orientation in the Philippines. With their orientation toward the larger, traditional markets (e.g., the US and EU), foreign firms could be expected to have a weaker propensity to use AFTA. In contrast, domestic firms may aim for regional FTA markets because they are easier to access than international markets. In fact, market orientation is likely to be linked to AFTA use and to be a significant factor in predicting the likelihood of use. Firms that export exclusively to FTA markets have a predicted AFTA usage rate of 18%, compared to only 6% for firms that export to more traditional markets.
AFTA users are firms that have participated in FTA consultations with government or the private sector and have at least some knowledge of FTA provisions. AFTA use appears to depend on a firm’s FTA awareness and technical capacity, which is highly predicated on whether or not firms have taken an active role in the FTA process. The average firm that has been involved in consultations has a 30% likelihood of using AFTA, compared to only 9% among firms that have never participated in such consultations. More tellingly, firms that are regarded as aware of FTA provisions have a predicted AFTA use rate of 40%, compared to a mere 11% for those that are less aware.
Industry plays a significant role in the likelihood of AFTA use. Underlying the strong sectoral patterns of use found in the data and described in the previous section is the fact that firms in the transport sector are significantly more likely to use AFTA (34%) that firms in other sectors (9%). The sectoral bias can be accounted for by the large margins of preference enjoyed by transport firms.
In addition to the first model, which employs sectoral dummies (see above), another model was created to examine the link between industrial profile and potential benefits from margins of preference (see Appendix 5). The second model’s specification is identical to the first except that an indicator for margin of preference replaces sectoral dummies to account for the variation in industrial profile attributed to margins of preference. Reflecting firms’ responsiveness to marginal differences in MFN and AFTA tariff rates, firms with higher margins (i.e., transport and food firms) have a 22% predicted likelihood of adopting AFTA. In contrast, firms for which the agreement provides no advantages in terms of tariff rates are just 8% likely to use AFTA. That the likelihood of using AFTA is predicated on margins of preference also validates firm perceptions of AFTA benefits. AFTA users reported access to cheaper materials and component parts, attributable to AFTA’s preferential rates, as the most significant benefit of using AFTA.
Surprisingly, controlling for other firm characteristics, firm size (based on the number of full time employees) and geographical location (whether in EPZs or the NCR) were not significant predictors of AFTA use.13 Further research using larger samples may be required to verify these preliminary findings on AFTA use in the Philippines.
13 Models with the same specification were also estimated separately for small and medium enterprises
(SMEs) and large or giant firms. Results revealed that size matters for SMEs but not for large or giant firms, suggesting that because larger firms are already at a sufficient operating capacity, variation in firm size does not affect their propensity to use AFTA. In contrast, SMEs are more sensitive to variation in operational
12

ADBI Working Paper 185 Wignaraja, Lazaro, and DeGuzman
Table 5: Firm Characteristic Predictors of AFTA Use (probit estimates, dependent variable: 1 = firm uses AFTA, 0 = otherwise)
Explanatory Variables:
General Form (1)
Reduced Form (2)
EMP 0.0004
(1.13) —
AGE 0.0366 (1.76)*
0.03974 (2.10)**
FOR -0.8474 (-1.85)*
-0.7277 (-2.18)**
FTAMKT (a) 0.6220 (1.58)* (d)
0.5761 (1.44)
NCR 0.0842 (0.19)
—
EPZ 0.1684 (0.45)
—
CONSULT 0.8197 (2.97)***
0.8564 (3.17)***
AWARE (b) 0.9678 (2.20)**
1.0016 (2.46)**
AUTO (c) 0.9240 (2.61)***
0.8031 (2.47)**
FOOD (c) 0.1127 (0.26)
—
Constant -2.3369 (-3.62)***
-2.1372 (-4.24)***
N 155 155 Wald χ2 36.18*** 33.79*** Pseudo R2 0.29 0.28
— = not applicable, AFTA = Association of Southeast Asian Nations Free Trade Agreement, FTA = free trade agreement.
Notes: Dependent binary variable: 1 = firm uses FTAs. Coefficients are estimated using robust standard errors; z-values are in parentheses: significant at 1% level (***), 5% level (**), or 10% level (*). (a) Indicator that firm exports only to FTA markets. (b) Refers to an awareness level that involves thorough and detailed knowledge or some knowledge of FTA provisions that affect business. (c) All zeros for sector dummies refer to firms that are located in the food sector. (d) Indicator for market orientation is significant at the 11% level in the general form.
Source: Authors’ calculation based on survey data.
3.3 Business Response to AFTA and Other FTAs
Not only does firm-level evidence show higher than expected AFTA use rates, it also confirms that AFTA users factor in AFTA when they consider their business strategies. 45% of AFTA users and 51% of firms that plan to use AFTA or other FTAs reported that FTAs have influenced their business plans or may prompt them to change their business strategies (see Table 6). This responsiveness can provide additional benefits to FTA users (e.g., increased market access), particularly if firms respond by adjusting their business plans to the specific FTA market.
capacity (affected by the number of workers they employ).
13

ADBI Working Paper 185 Wignaraja, Lazaro, and DeGuzman
Table 6: Business Responses to AFTA and Other FTAs (% of responding firms by category)
Sector Ownership Size All Transport Food Electronics Domestic Foreign Small Large Giant Firms that use FTAs
45.2 50.0 37.5 44.4 23.1 61.1 40.0 47.4 50.0
Firms that use/plan to use FTAs
50.8 60.0 40.0 48.5 31.6 59.1 52.4 52.8 33.3
AFTA = Association of Southeast Asian Nations Free Trade Agreement, FTA = free trade agreement.
Note: Foreign firms are defined as firms with at least 10% foreign equity share. Size is by number of employees: small = 100 or fewer; large=101–1,000; and giant = more than 1,000.
Source: Authors’ computation based on survey data.
Strong sectoral patterns are apparent in business response.14 Transport, which has the highest FTA utilization rate among the selected sectors, also has the highest rate of business response to FTAs (50% among AFTA users and 60% among those who use or plan to use AFTA). The electronics sector is second with 44.4% among AFTA users and 49% among those who plan to use AFTA. While a smaller share of food sector firms use AFTA (18.6%), a relatively large proportion of processed food manufacturers that use AFTA (38%) or that plan to use AFTA (40%) have adapted or may adapt their business plans to FTAs.
This discrepancy between FTA use and business response may be explained by the market orientation of food firms in the Philippines. Food firms generally consider market access to be one of the greatest benefits of using AFTA (see Box 1). Better access to markets brings opportunities for new business ventures and can trigger entry into new markets. A number of large and giant food firms in the Philippines have complained that the country’s current FTA partners are limited to countries with which there are existing revenue streams and do not include other potential strategic markets such as the Middle East (Box 2 presents a case study of a how a food firm responded to FTAs). Furthermore, there is no food supply chain equivalent to existing production networks in the electronics and transport sectors in the region, which could deter a food firm from considering FTA use.
There is a similar pattern among small and medium enterprises (SMEs). About 40% of SMEs that are AFTA users and 54% of those who plan to use AFTA have changed or plan to change their business plans in response to FTAs. Interestingly, despite their lower utilization rates, this business response pattern among small firms is comparable to the response rate of large and giant firms. A possible explanation is that small firms may be responding to FTAs in a defensive manner for survival (e.g., new product development or intensified marketing).
While AFTA utilization rates are much lower for both food firms and SMEs in general, business response rates are higher than expected, suggesting that these firms, regardless of whether or not they use AFTA, may be changing their business plans in response to AFTA as a means of experimenting, engaging new markets, and testing business strategies. The econometric analysis discussed in the previous section supports this observation, with market orientation being revealed as a significant predictor of AFTA use. Firms that export exclusively to FTA markets tend to be AFTA users, while those seeking new markets not covered by FTAs tend not to be. Nevertheless, nonusers adapt and make adjustments—recognizing that a forward-looking stance, calibrated to potential growth markets, is especially critical in an increasingly FTA-oriented trading environment.
14 Firms were asked if they have in any way responded to FTAs by changing their business plans or strategies.
14
ADBI Working Paper 185 Wignaraja, Lazaro, and DeGuzman
Box 2: Responding to AFTA and Future FTAs: The Case of RFM Foods Corporation
From its start as a simple flour milling operation in 1957, RFM Foods Corporation (hereafter RFM Foods) quickly grew from a small firm making sacks of flour into a diversified company producing a large range of popular branded products—many of which are household names for Filipino families. RFM Foods’ products include cake mixes and flour products, pasta and pasta sauces, meat products, fruit juices and drinks, and ice cream and other dairy desserts. While RFM Foods’ history in the domestic market is long, it only began exporting in 2000 and is the only domestic food conglomerate that exports Philippine food products, supplying multiple markets in Asia, the Middle East, and the US. In recent years, RFM Foods has entered into joint ventures with firms in Indonesia and Taipei,China and has acquired several well-known pizza and snack franchises.
RFM Foods’ overall experience with FTAs has been a positive one. The company began using AFTA and became CEPT-accredited when importers from Thailand and Viet Nam suggested that they could make their products more competitive by lowering import costs under AFTA provisions. RFM Foods perceives the greatest benefits of AFTA use to be lower tariffs and increased market access. Greater market access brings with it new business opportunities and, as FTAs are viewed as catalysts for opening up new markets, they are crucial to RFM Foods’ business outlook.
In a forward-looking stance, the company has responded to Philippine FTAs by seeking “strategic or emerging markets” for its products rather than focusing on conventional “revenue stream based” business strategies. While using AFTA exclusively for its exports, it has expressed interest in other FTAs, particularly the ASEAN-PRC FTA and the proposed ASEAN-Gulf Cooperation Council FTA, because the company perceives them as being helpful in providing conduits to nontraditional markets. In fact, RFM Foods recently devoted significant resources to strategizing how to penetrate the 100+ halal markets around the world for its meat products. It hopes to make inroads using FTAs with markets in East Asia and the Middle East for its top two exports: beverages and pasta. Demand for Philippine pasta products has grown as the demand for alternatives to high-end pasta products has increased, particularly in Japan, Korea, and Dubai.
In addition to adjusting its market orientation in response to FTAs, RFM Foods has also changed the way it deals with FTA procedural matters—in particular, ROO issues. Typical ROO issues, such as documentation costs, time delays, and administrative costs, are concerns for RFM Foods, which claims that they add to business costs. However, the actual costs are more nuanced and mostly lie in the great difficulty the firm has in complying with sanitary and phytosanitary (SPS) requirements—rather than in completing AFTA’s origin certificate application (Form D). Food firms like RFM Foods experience a “noodle bowl” 15 with a different flavor (relating to food safety and animal and plant health measures, as well as tariff and customs administration).
As an example, halal certification was especially challenging for RFM Foods. The company complained that regulations were not harmonized and that inconsistent requirements across countries made it extremely difficult to export products. Other problems arise when shelf life requirements for products vary across markets. In Bahrain, for instance, the requirements for a given product may allow for 18 months, while Dubai might permit only 12 months.
In December 2008, RFM Foods won a breakthrough, securing accreditation as the owner of the first and only halal-certified meat processing plant in the country. The Islamic Da’wah Council of the Philippines, the only Philippine body recognized by the World Halal Council, granted accreditation to RFM Foods’ plant in Cabuyao, Laguna, an area south of Manila. The company’s halal certification is bolstered by the hazard analysis critical control point system and carries a triple A (AAA) accreditation from the National Meat Inspection Service, which enables the sale of meat products locally and abroad. With over 70% of the Muslim world strictly following halal food
15 See Kawai and Wignaraja (2009) for a summary of the FTA “noodle bowl” phenomenon.
15

ADBI Working Paper 185 Wignaraja, Lazaro, and DeGuzman
standards, and a global halal food market of over US$500 billion, the increased export opportunities for RFM Foods may now change the way it views compliance with SPS requirements. However, obtaining halal certification may only be half the battle if accreditations are not recognized globally.
In another challenge for RFM Foods, Philippine ice cream is banned in Saudi Arabia because the Philippines is on the World Health Organization’s list of cholera-infected countries (ice cream is a top product for RFM Foods and is poised to be a big seller abroad). Philippine businesses lobbied to get the Philippines removed from the list, but meetings only resulted in marine products being delisted; Philippine ice cream and other products are still banned. A more assertive trade contingent, knowledgeable not only about FTA provisions but also about the general trade environment in which firms operate, could overturn exclusions and win other types of concessions.
Source: Based on detailed firm interviews and survey data.
4. IMPEDIMENTS TO FTA USE In the previous section, it was shown that the majority of firms (80%) are not using AFTA. This section addresses the second key question in this paper—what factors do Philippine exporters perceive as impediments to their use of AFTA or other FTAs. Properly addressing these factors could lead to a higher probability of FTA use in the future, especially if the 41% of firms that indicated they were considering using FTAs are taken into consideration. As the majority of the respondents were nonusers, the focus of this section is on impediments faced by this group, although a comparative perspective of issues facing users and nonusers is discussed where appropriate.
Table 7 sets out the impediments to FTA use reported by all respondents. Among the 109 respondents that were nonusers of FTAs, a lack of information emerged as the top impediment. Delays and administrative costs and the use of export incentives other than FTA preferences were the second and third major impediments identified by firms, respectively. Other barriers to use include rent-seeking behavior due to the arbitrary classification of product origin, product exclusions, and the confidentiality of information required in origin applications. Some firms also complained of the small margins of preference and nontariff barriers employed by FTA partners. FTA users, on the other hand, had a different opinion. The impediments identified by these firms were more residual, such as rent-seeking behavior.
Table 7: Impediments to FTA Use (number of responding firms (% respondents))
Impediments to Use A. Nonusers of FTAs B. FTA Users Total (A+B)
Lack of information 86 (78.9) 8 (32.0) 94 (70.1) Delays and administrative costs 34 (31.2) 7 (28.0) 41 (30.6) Use of EPZ schemes and/or ITA 31 (28.4) 5 (20.0) 36 (26.9) Arbitrary classification of origin 20 (18.3) 11 (44.0) 31 (23.1) Too many exclusions 14 (12.8) 6 (24.0) 20 (14.9) Confidentiality of information required 11 (10.1) 6 (24.0) 17 (12.7) Small margin of preference 9 (8.3) 9 (36.0) 18 (13.4) Nontariff measures used by FTA partners 6 (5.5) 6 (24.0) 12 (9.0) Number of Respondents 109 25 134
EPZ = export processing zone, FTA = free trade agreement, ITA = World Trade Organization Information Technology Agreement.
Note: Multiple answers allowed.
Source: Authors’ computation based on survey data.
16
ADBI Working Paper 185 Wignaraja, Lazaro, and DeGuzman
4.1 Lack of Information
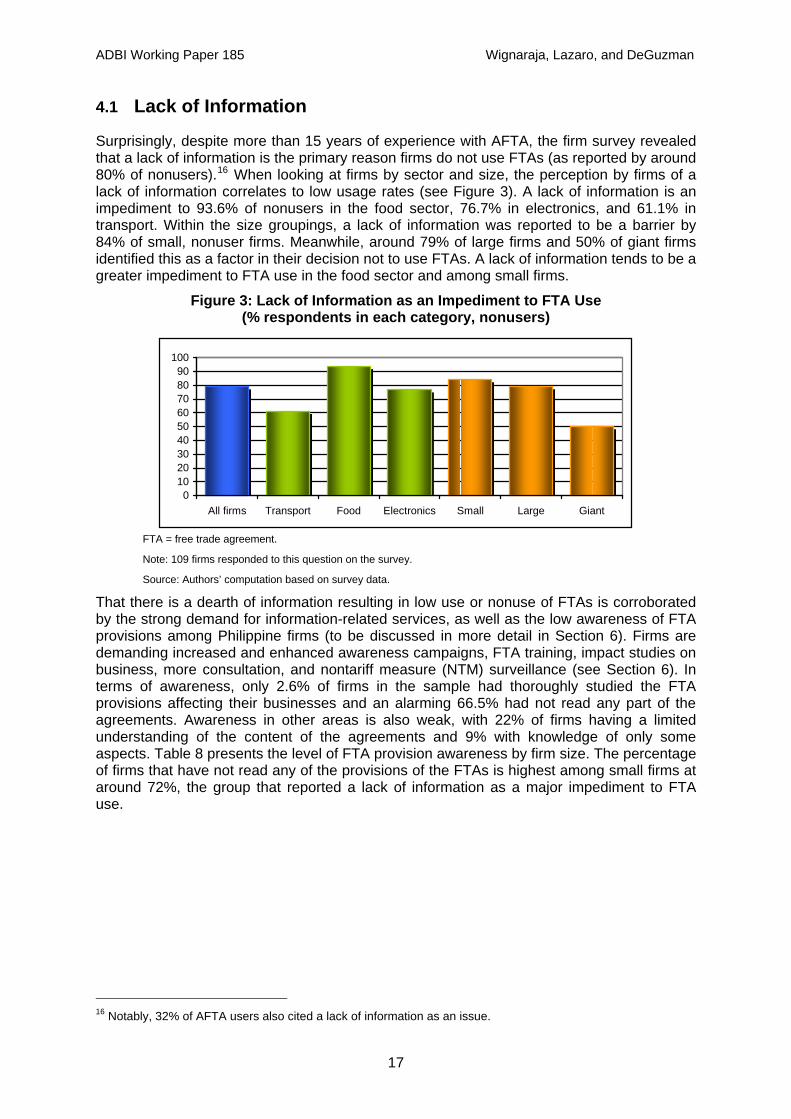
Surprisingly, despite more than 15 years of experience with AFTA, the firm survey revealed that a lack of information is the primary reason firms do not use FTAs (as reported by around 80% of nonusers).16 When looking at firms by sector and size, the perception by firms of a lack of information correlates to low usage rates (see Figure 3). A lack of information is an impediment to 93.6% of nonusers in the food sector, 76.7% in electronics, and 61.1% in transport. Within the size groupings, a lack of information was reported to be a barrier by 84% of small, nonuser firms. Meanwhile, around 79% of large firms and 50% of giant firms identified this as a factor in their decision not to use FTAs. A lack of information tends to be a greater impediment to FTA use in the food sector and among small firms.
Figure 3: Lack of Information as an Impediment to FTA Use (% respondents in each category, nonusers)
0102030405060708090
100
All firms Transport Food Electronics Small Large Giant
FTA = free trade agreement.
Note: 109 firms responded to this question on the survey.
Source: Authors’ computation based on survey data.
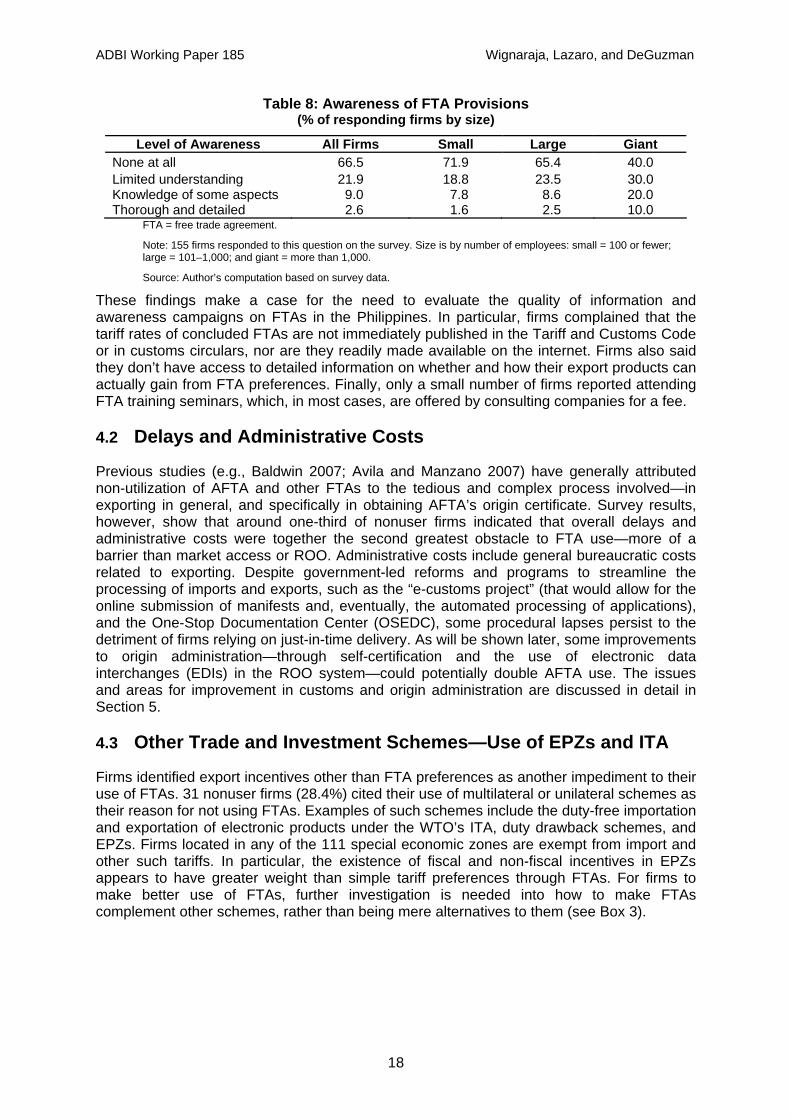
That there is a dearth of information resulting in low use or nonuse of FTAs is corroborated by the strong demand for information-related services, as well as the low awareness of FTA provisions among Philippine firms (to be discussed in more detail in Section 6). Firms are demanding increased and enhanced awareness campaigns, FTA training, impact studies on business, more consultation, and nontariff measure (NTM) surveillance (see Section 6). In terms of awareness, only 2.6% of firms in the sample had thoroughly studied the FTA provisions affecting their businesses and an alarming 66.5% had not read any part of the agreements. Awareness in other areas is also weak, with 22% of firms having a limited understanding of the content of the agreements and 9% with knowledge of only some aspects. Table 8 presents the level of FTA provision awareness by firm size. The percentage of firms that have not read any of the provisions of the FTAs is highest among small firms at around 72%, the group that reported a lack of information as a major impediment to FTA use.
16 Notably, 32% of AFTA users also cited a lack of information as an issue.
17
ADBI Working Paper 185 Wignaraja, Lazaro, and DeGuzman
Table 8: Awareness of FTA Provisions (% of responding firms by size)
Level of Awareness All Firms Small Large Giant None at all 66.5 71.9 65.4 40.0 Limited understanding 21.9 18.8 23.5 30.0 Knowledge of some aspects 9.0 7.8 8.6 20.0 Thorough and detailed 2.6 1.6 2.5 10.0
FTA = free trade agreement.
Note: 155 firms responded to this question on the survey. Size is by number of employees: small = 100 or fewer; large = 101–1,000; and giant = more than 1,000.
Source: Author’s computation based on survey data.
These findings make a case for the need to evaluate the quality of information and awareness campaigns on FTAs in the Philippines. In particular, firms complained that the tariff rates of concluded FTAs are not immediately published in the Tariff and Customs Code or in customs circulars, nor are they readily made available on the internet. Firms also said they don’t have access to detailed information on whether and how their export products can actually gain from FTA preferences. Finally, only a small number of firms reported attending FTA training seminars, which, in most cases, are offered by consulting companies for a fee.
4.2 Delays and Administrative Costs
Previous studies (e.g., Baldwin 2007; Avila and Manzano 2007) have generally attributed non-utilization of AFTA and other FTAs to the tedious and complex process involved—in exporting in general, and specifically in obtaining AFTA’s origin certificate. Survey results, however, show that around one-third of nonuser firms indicated that overall delays and administrative costs were together the second greatest obstacle to FTA use—more of a barrier than market access or ROO. Administrative costs include general bureaucratic costs related to exporting. Despite government-led reforms and programs to streamline the processing of imports and exports, such as the “e-customs project” (that would allow for the online submission of manifests and, eventually, the automated processing of applications), and the One-Stop Documentation Center (OSEDC), some procedural lapses persist to the detriment of firms relying on just-in-time delivery. As will be shown later, some improvements to origin administration—through self-certification and the use of electronic data interchanges (EDIs) in the ROO system—could potentially double AFTA use. The issues and areas for improvement in customs and origin administration are discussed in detail in Section 5.
4.3 Other Trade and Investment Schemes—Use of EPZs and ITA
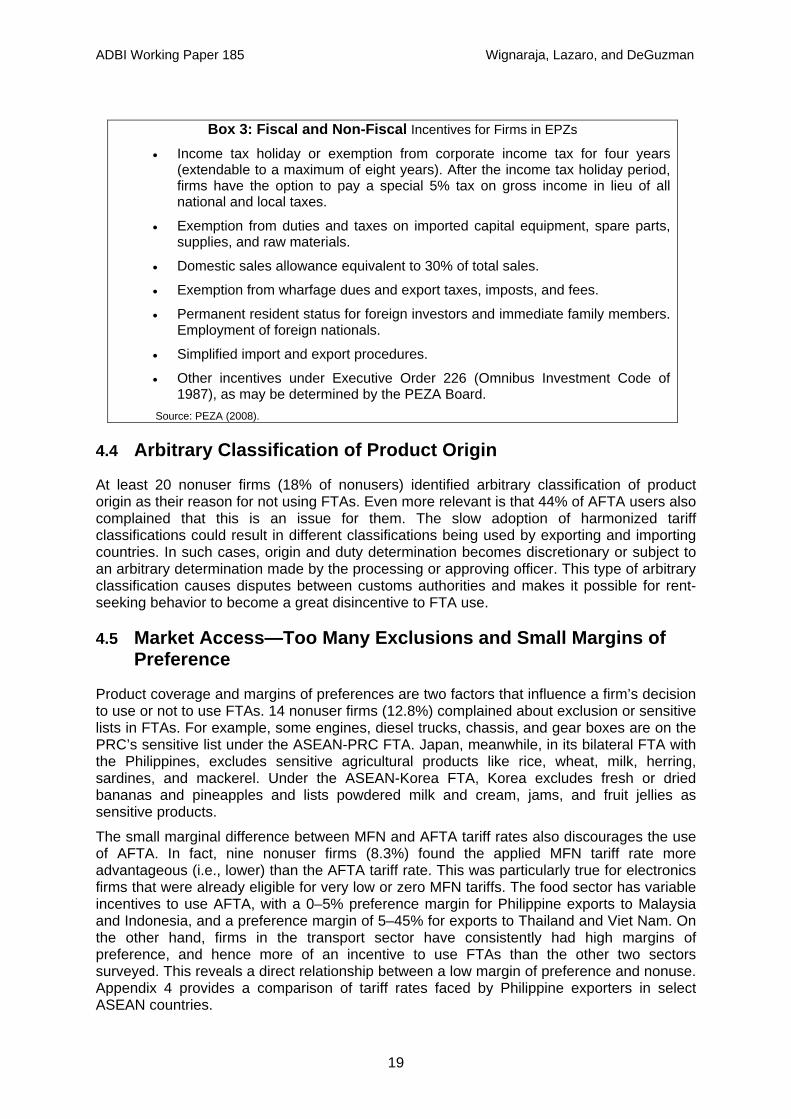
Firms identified export incentives other than FTA preferences as another impediment to their use of FTAs. 31 nonuser firms (28.4%) cited their use of multilateral or unilateral schemes as their reason for not using FTAs. Examples of such schemes include the duty-free importation and exportation of electronic products under the WTO’s ITA, duty drawback schemes, and EPZs. Firms located in any of the 111 special economic zones are exempt from import and other such tariffs. In particular, the existence of fiscal and non-fiscal incentives in EPZs appears to have greater weight than simple tariff preferences through FTAs. For firms to make better use of FTAs, further investigation is needed into how to make FTAs complement other schemes, rather than being mere alternatives to them (see Box 3).
18
ADBI Working Paper 185 Wignaraja, Lazaro, and DeGuzman
Box 3: Fiscal and Non-Fiscal Incentives for Firms in EPZs • Income tax holiday or exemption from corporate income tax for four years
(extendable to a maximum of eight years). After the income tax holiday period, firms have the option to pay a special 5% tax on gross income in lieu of all national and local taxes.
• Exemption from duties and taxes on imported capital equipment, spare parts, supplies, and raw materials.
• Domestic sales allowance equivalent to 30% of total sales.
• Exemption from wharfage dues and export taxes, imposts, and fees.
• Permanent resident status for foreign investors and immediate family members. Employment of foreign nationals.
• Simplified import and export procedures.
• Other incentives under Executive Order 226 (Omnibus Investment Code of 1987), as may be determined by the PEZA Board.
Source: PEZA (2008).
4.4 Arbitrary Classification of Product Origin
At least 20 nonuser firms (18% of nonusers) identified arbitrary classification of product origin as their reason for not using FTAs. Even more relevant is that 44% of AFTA users also complained that this is an issue for them. The slow adoption of harmonized tariff classifications could result in different classifications being used by exporting and importing countries. In such cases, origin and duty determination becomes discretionary or subject to an arbitrary determination made by the processing or approving officer. This type of arbitrary classification causes disputes between customs authorities and makes it possible for rent-seeking behavior to become a great disincentive to FTA use.
4.5 Market Access—Too Many Exclusions and Small Margins of Preference
Product coverage and margins of preferences are two factors that influence a firm’s decision to use or not to use FTAs. 14 nonuser firms (12.8%) complained about exclusion or sensitive lists in FTAs. For example, some engines, diesel trucks, chassis, and gear boxes are on the PRC’s sensitive list under the ASEAN-PRC FTA. Japan, meanwhile, in its bilateral FTA with the Philippines, excludes sensitive agricultural products like rice, wheat, milk, herring, sardines, and mackerel. Under the ASEAN-Korea FTA, Korea excludes fresh or dried bananas and pineapples and lists powdered milk and cream, jams, and fruit jellies as sensitive products.
The small marginal difference between MFN and AFTA tariff rates also discourages the use of AFTA. In fact, nine nonuser firms (8.3%) found the applied MFN tariff rate more advantageous (i.e., lower) than the AFTA tariff rate. This was particularly true for electronics firms that were already eligible for very low or zero MFN tariffs. The food sector has variable incentives to use AFTA, with a 0–5% preference margin for Philippine exports to Malaysia and Indonesia, and a preference margin of 5–45% for exports to Thailand and Viet Nam. On the other hand, firms in the transport sector have consistently had high margins of preference, and hence more of an incentive to use FTAs than the other two sectors surveyed. This reveals a direct relationship between a low margin of preference and nonuse. Appendix 4 provides a comparison of tariff rates faced by Philippine exporters in select ASEAN countries.
19

ADBI Working Paper 185 Wignaraja, Lazaro, and DeGuzman
4.6 Confidentiality of Information
When applying for a certificate of origin, firms have to submit documents with specific information on source, components, and raw materials to prove origin. Some firms perceive this process as requiring the disclosure of confidential information. Eleven nonuser firms cited this as a reason for not availing themselves of FTA preferences. However, this requirement of disclosure holds true only when complying with AFTA’s regional value content rule. With the introduction of the coequal or option rule, whereby firms can choose between value content or a change in tariff classification, the risk is mitigated as such confidential information is not required (see Section 5 for a discussion of rule type preferences among surveyed firms).
4.7 Nontariff Measures Employed by FTA Partners
Nontariff barriers, such as SPS measures and technical requirements, also contribute to FTA nonuse. Philippine firms in the processed food sector are particularly affected by these types of barriers (Pasadilla 2007) because they are required to comply with SPS measures in FTA markets (e.g., ASEAN and the PRC). 48.8% of the processed food firms surveyed reported that they have to produce additional export documents and comply with a number of standards, such as quality and chemical free certification, SPS certification, and certification from authorized agencies or certifying bodies (e.g., WHO’s Codex Alimentarius Commission and the World Halal Council). At least 38.5% of all SMEs and more than half of large firms (56.3%) in the food sector found it difficult to comply with these measures. Firms also highlighted the lack of effective surveillance on the requirements of importing countries and insufficient lobbying for the acceptance of Philippines-issued certifications (either by authorized entities or self-certification). As the ASEAN-EU FTA goes into effect, it is expected that NTMs will become more of an issue among exporters, particularly as the EU is viewed as a major export destination for food products and because EU regulations are especially stringent.
4.8 Other Barriers to FTA Use and Exporting
Preferential trade agreements are viewed as the drivers of trade liberalization, opening up new markets to firms and providing incentives for industrial reform across all sectors. However, optimal export behavior and the use of FTA preferences may depend on other domestic and environmental factors (see Box 4).
20
ADBI Working Paper 185 Wignaraja, Lazaro, and DeGuzman
Box 4: Impediments to Exporting: Beyond FTA Provisions Trade reforms alone may be inadequate catalysts for growth without the complementary policies that strengthen links between the domestic economy and trade (Austria 2003). A major hindrance to expanding growth and export potential is that the bulk of exports in the Philippines are still produced by the low-skill, labor-intensive segment of the production chain. A shift to high-value manufactures will require a well-devised investment policy on technology upgrading to enhance domestic capacity. Cross-country research that included the Philippines has demonstrated that technological capabilities increase the propensity to export among firms and that the Philippines lags behind the PRC and Thailand in terms of technological competence in electronics (Wignaraja 2008). In addition, recent empirical evidence has shown that trade liberalization promotes innovation and productivity growth in individual firms (Teteryatnikova 2009). Thus, trade arrangements, such as the WTO’s General Agreement on Tariffs and Trade and FTAs, should be explored to increase opportunities to address the need for product innovation.
Macroeconomic weaknesses, such as chronic fiscal debt problems, also hamper investment and productivity growth. Inadequate infrastructure in transportation and logistics (e.g., congested ports in Manila) causes inefficiencies in the movement of goods. The poor state of public finance and a low domestic savings rate stand in the way of stable and sustainable growth (Bautista and Lamberte 2005). Finally, business regulatory procedures are cumbersome and plagued by bureaucratic red tape. Exporters and foreign firms also contend with more corruption than their domestic, non-exporting counterparts (ADB 2005a).
5. UNDERSTANDING ORIGIN ISSUES As noted in the previous section, some impediments to using FTAs are directly or indirectly related to ROO.17 The issues range from delays and administrative costs associated with ROO administration, ROO per se, arbitrary classification of origin, and the confidentiality of information required. This section aims to provide further insights into ROO issues in the Philippines. First, a descriptive assessment of origin administration issues from the practitioners’ perspectives (i.e., customs officers, traders, and brokers) is presented. Second, an experiment on how businesses would react to an overall improvement in AFTA’s ROO system is discussed. Third, firms’ perceptions of the probable noodle bowl effect of multiple FTAs and ROO is touched upon.
By itself, ROO exist for authentication and statistical purposes. However, with the emergence of FTAs and other trade regimes, ROO have been a subject of trade debates—criticized for being discriminatory, restricting trade, or validating the noodle bowl hypothesis.
5.1 Issues in Origin Administration
More than the ROO per se, origin administration appears to be a pressing concern for Philippine firms. As discussed in Section 4, about 31% of the firms surveyed complained of delays and administrative costs in exporting and in obtaining certificates of origin, and indicated that these were obstacles to FTA use. Origin administration refers to the procedures associated with the application for and issuance of a certificate of origin when exporting and the approval and verification of the certificate of origin when importing. A certificate of origin is a declaration by the exporter (certified by the Philippine Bureau of Customs [BOC]) that his export products comply with the origin requirements specified under bilateral, regional, or multilateral trading arrangements to which the Philippines is a party.
17 ROO refers to the set of criteria used to determine the country or customs territory of a good’s origin. See
Lazaro and Medalla (2006).
21

ADBI Working Paper 185 Wignaraja, Lazaro, and DeGuzman
When applying for a certificate of origin, exporters undergo a pre-exportation verification and examination process. Verification involves the submission of required documents and company visits. The documents must include a description of the export goods and the country of destination; a list of raw materials, parts, and components, as well as locally-sourced materials; details of the manufacturing process; and computations for the purpose of determining origin. Company visits are not mandatory except for first time certificate of origin applicants and newly established companies. Afterward, the exporter is subject to a pre-exportation examination, where he must submit the completed certificate of origin application form and the documents verified earlier. The customs examiner will then issue the certificate of origin, which is valid for four months (see Appendix 6 for the detailed procedure for the issuance of a preferential certificate of origin).
Currently, only the BOC (specifically the export coordination division [ECD] at the Port Area, Manila and export divisions of various ports) has the authority to approve and issue preferential certificates of origin in the Philippines. This is rather unusual as most ASEAN countries have designated chambers of commerce and other accredited bodies to issue preferential certificates of origin.
Examples of recurring issues in origin administration are: (i) a lack of information or unclear rules, (ii) inefficiencies arising from the manual processing of origin applications, and (iii) a lack of support and connections with the private sector.
Information on the current step-by-step procedure for origin applications is not readily available to firms or, ironically, even to some customs officers. Most manufacturers and exporters have outsourced the certification process to forwarders and customs brokers. Such heavy reliance on intermediaries, however, results in additional costs to firms and has made them less aware of potential savings through FTA preferences.18
While reforms have been introduced and electronic data interchange systems have been adopted 19 to automate and computerize the customs processes, the origin procedure remains a paper-based and people-driven system. Although exporters are more or less satisfied with the processing time for certificates of origin (one to two hours, if no plant visit is required), they are concerned about the accuracy of the documents processed by customs officers. Some deletions of information have caused delays and created additional costs for exporters as customs agencies elsewhere refuse to accept the incomplete certificates of origin. Traders have suggested the adoption of a system similar to that implemented in Singapore, which allows for electronic applications for certificates of origin.20
Another impediment related to ROO is the arbitrary determination of origin (according to 20 firms that use FTAs and 11 nonuser firms). This is due to the lack of a harmonized tariff classification system. Although ASEAN has adopted the ASEAN Harmonized Tariff Nomenclature, there are still some products that are difficult to classify.
5.2 Potential AFTA Usage with an Improved ROO System
The general types of ROO include “wholly-obtained or produced” requirements, value-added rules, change of tariff classification (CTC) rules, and specific process rules. Because the 18 The extent to which information is available varies by sector. While certain automotive parts suppliers
seemed to be very conscious of ROO and/or origin certification procedures and just request their customs brokers to submit their completed origin applications for them, some electronics companies (particularly those working in EPZs) seemed unaware of origin requirements.
19 The BOC conceptualized the Selectivity, Post-Audit, Advance Processing, Client Self-Assessment, and Electronic data interchange (SPACE) program as early as 1998 to implement a cargo clearance procedure. SPACE covers the five general principles underlying the progressive clearance procedure.
20 Singapore’s TradeNet System (now expanded and renamed the TradeExchange) links multiple parties involved in external trade transactions to a single point of transaction that includes the processing of certificates of origin and import and export permits. The system enables the applicant to obtain the necessary papers within minutes rather than days or weeks. See ADB (2005b) for more information.
22
ADBI Working Paper 185 Wignaraja, Lazaro, and DeGuzman
FTA experience of the Philippines is primarily with AFTA,21 firms are most familiar with the agreement’s Form D and its value content rule. Surveyed firms were asked to evaluate the current AFTA ROO system and how they would react to some improvement to the system—specifically, to the use of a lower value content requirement and the introduction of a self-certification mechanism.
Value content refers to the percentage of a product originating from an FTA member country (or multiple countries if cumulation is allowed) required for the product to qualify as originating in that country (or countries). The most popular rule with AFTA users is still AFTA’s 40% value content rule (although ASEAN has already adopted alternative ROO). Nevertheless, some firms say that the 40% rule is restrictive and difficult to comply with (on the other hand, one electronics firm said that the 40% value content rule is reasonable and that it benefits domestic industries that supply components).
A self-certification mechanism would essentially allow an exporter or producer within the territory of an FTA member country to declare or affirm that the items covered by the export invoice qualify as originating in that country for the purposes of claiming a tariff preference. Exporters and producers would therefore not need to apply for a formal certificate of origin from authorized government entities. This would reduce the cost of applying for a certificate of origin and, at the same time, reduce the risk of unnecessary disclosures of confidential information. Currently, AFTA’s Form D requires that exporters list product components and raw materials at the 6-digit harmonized system heading level and include values thereof. Some subsidiaries of foreign firms contend that mishandling of the information required in the form can be potentially damaging to firms. Furthermore, SMEs find including the additional documents required in applying for an AFTA certificate of origin difficult, if not impossible. For example, small farmers cannot be expected to attach receipts for the raw materials they supply to manufacturers.
Improved ROO could potentially double the AFTA utilization rate. Exporters were asked if certain improvements to AFTA’s ROO system—a reduction of the value content requirement and the introduction of self-certification to the origin application process—would increase their likelihood of using AFTA. The results show that these improvements could encourage AFTA use among 43% of nonusers (53 firms), potentially increasing the overall utilization rate from 20% to 54.2% (31 current users plus 53 new firms). Some firms added that the enhancement of business processes or the adoption of a business model for ROO would encourage them to use AFTA. More reforms have been demanded by firms, including the use of EDIs in ROO systems and technical upgrades (see Section 7 for a discussion on the services demanded by surveyed firms).
An improved ROO system is likely to increase AFTA usage to about 75% in the transport sector (14 current users and 13 new firms) and to 59.2% in the electronics sector (9 current users and 36 new firms). Similarly, large and giant firms revealed a proportionately strong positive reaction to potential improvements in AFTA’s ROO system: from 23.5% and 20% usage among large and giant firms, respectively, to about 62% (21 current users and 35 new firms) for large and giant firms as a group (Figure 4). There would also be a rise in AFTA utilization in the food sector (8 current users and 4 new firms) and among SMEs (10 current users and 18 new firms). The relatively smaller increase among SMEs and food firms brought about by an improved ROO system could be explained by other factors: as discussed earlier, the food sector is more concerned with NTM surveillance and standards harmonization than ROO per se, while SMEs require technical and financial support to improve their level of competitiveness (Aldaba 2008b).
21 An unpublished internal BOC report, however, reveals that exporters have begun to explore FTA
preferences available through other “ASEAN plus” FTAs, such as the ASEAN-PRC and ASEAN-Korea agreements.
23
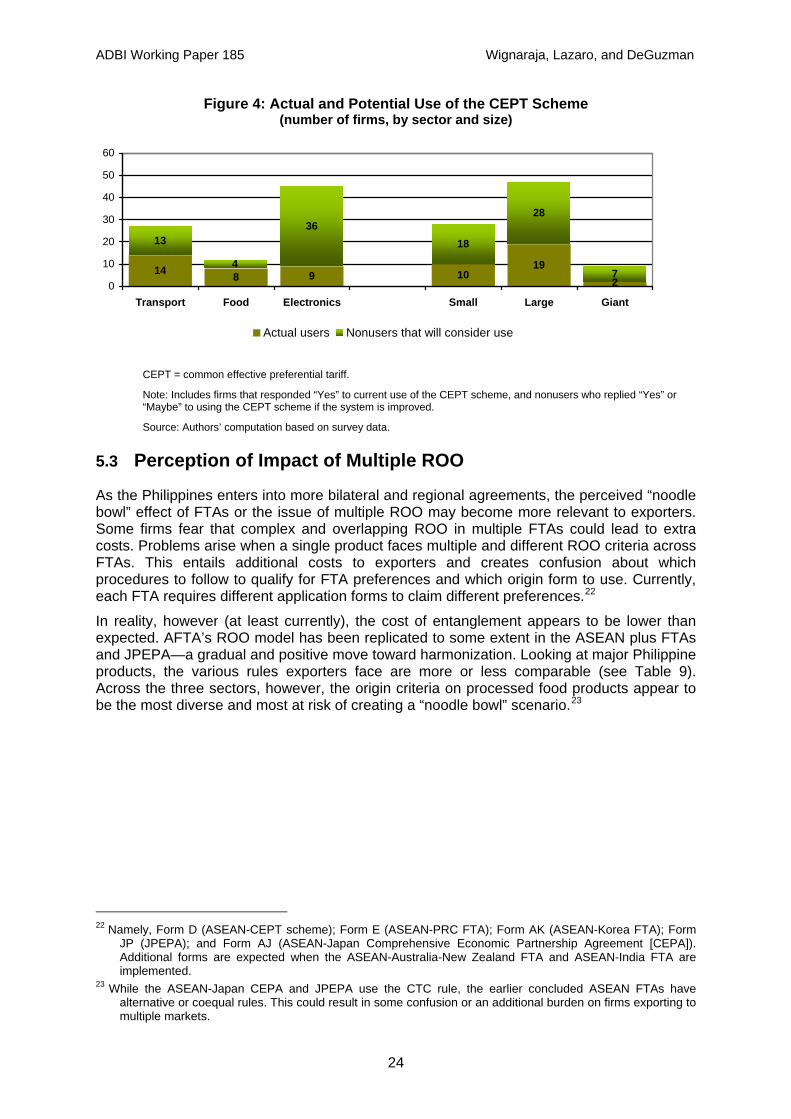
ADBI Working Paper 185 Wignaraja, Lazaro, and DeGuzman
Figure 4: Actual and Potential Use of the CEPT Scheme (number of firms, by sector and size)
14 8 9 1019
1336
18
28
72
4
0
10
20
30
40
50
60
Transport Food Electronics Small Large Giant
Actual users Nonusers that will consider use
CEPT = common effective preferential tariff.
Note: Includes firms that responded “Yes” to current use of the CEPT scheme, and nonusers who replied “Yes” or “Maybe” to using the CEPT scheme if the system is improved.
Source: Authors’ computation based on survey data.
5.3 Perception of Impact of Multiple ROO
As the Philippines enters into more bilateral and regional agreements, the perceived “noodle bowl” effect of FTAs or the issue of multiple ROO may become more relevant to exporters. Some firms fear that complex and overlapping ROO in multiple FTAs could lead to extra costs. Problems arise when a single product faces multiple and different ROO criteria across FTAs. This entails additional costs to exporters and creates confusion about which procedures to follow to qualify for FTA preferences and which origin form to use. Currently, each FTA requires different application forms to claim different preferences.22
In reality, however (at least currently), the cost of entanglement appears to be lower than expected. AFTA’s ROO model has been replicated to some extent in the ASEAN plus FTAs and JPEPA—a gradual and positive move toward harmonization. Looking at major Philippine products, the various rules exporters face are more or less comparable (see Table 9). Across the three sectors, however, the origin criteria on processed food products appear to be the most diverse and most at risk of creating a “noodle bowl” scenario.23
22 Namely, Form D (ASEAN-CEPT scheme); Form E (ASEAN-PRC FTA); Form AK (ASEAN-Korea FTA); Form
JP (JPEPA); and Form AJ (ASEAN-Japan Comprehensive Economic Partnership Agreement [CEPA]). Additional forms are expected when the ASEAN-Australia-New Zealand FTA and ASEAN-India FTA are implemented.
23 While the ASEAN-Japan CEPA and JPEPA use the CTC rule, the earlier concluded ASEAN FTAs have alternative or coequal rules. This could result in some confusion or an additional burden on firms exporting to multiple markets.
24

ADBI Working Paper 185 Wignaraja, Lazaro, and DeGuzman
Table 9: Rules of Origin on Major Philippine Products
HS codes Product ASEAN FTA
(1993) ASEAN-PRC FTA (2005)
ASEAN-Korea FTA
(2006)
ASEAN-Japan CEPA
(2008)
Japan-Philippines EPA (2006)
Transport Equipment 87.03 Motor vehicles for
transport of persons RVC of 40%* RVC of 40%* RVC of 45% RVC of 40% RVC of 40%
87.04 Motor vehicles for transport of goods
RVC of 40%* RVC of 40%* RVC of 45% RVC of 40% RVC of 40%
87.08 Parts and accessories for motor vehicles
RVC of 40%* RVC of 40%* RVC of 45% RVC of 40% CTH or RVC of 40%*
Processed Foods 04.02 Milk and cream RVC of 40%
or CTC RVC of 40%* RVC of 45%;
or WOP CTC CTH
23.06 Coconut or copra oil cake
RVC of 40%* RVC of 40%* RVC of 40% plus WOP; or CTC plus WOP
CTH CTH
08.03 Bananas, dried WOP RVC of 40%* WOP CTC CTH Electronics and Parts 84.71 Automatic data
processing machines RVC of 40% or CTC
RVC of 40%* CTH or RVC of 40%*
CTH or RVC of 40%*
CTH or RVC of 40%*
84.73 Parts and accessories RVC of 40%* RVC of 40%* CTH or RVC of 40%*
CTH (except from heading 85.42) or RVC of 40%
CTH or RVC of 40%*
85.42 Electronic integrated circuits
RVC of 40% or CTC
RVC of 40%* CTH or RVC of 40%*
CTH (except from heading 85.42) or RVC of 40%
CTH (6 digit) for non-originating materials
ASEAN = Association of Southeast Asian Nations, CEPA = comprehensive economic partnership agreement, CTC = change in tariff classification, CTH = change of tariff headings, EPA = economic partnership agreement, FTA = free trade agreement, HS = harmonized system, Korea = Republic of Korea, ROO = rules of origin, RVC = regional value content, WOP = wholly obtained or produced in territory of exporting country.
Note: *The general ROO of the FTA are adopted when there is no specific product rule provided.
Sources: Authors’ compilation from ROO annexes of the agreements (as of January 2009).
Aside from attempts to adopt a common rule, ASEAN FTAs also recently began to implement alternative rules. In particular, the CTC criterion was added as an option for firms in case they are unable to fulfill the value content requirement or refuse to divulge confidential information. These alternative or option rules (e.g., the CTC rule) are preferred by more than half of all responding firms (53.2%) over a single or exclusive rule.
A special cumulation rule on ITA products was likewise introduced in the ASEAN-Japan FTA, which tends to be more lenient and supportive of MNC activities. The agreement states that information technology products covered by the WTO agreement, assembled by any party, and used in production by any party, are considered to be originating materials from the originating party regardless of the existence of an applicable product-specific rule.
While multiple ROO are not costly, harmonization is preferred. Contrary to claims made by earlier studies, less than one third of firms in the Philippine sample (28%) regard dealing with multiple ROO as a significant business cost. Indeed, the process of acquiring information and technological capabilities for export markets is likely to pose more serious challenges to firms. Nonetheless, firms would prefer a simpler ROO regime and see the benefit of harmonized ROO (44% of firms). There is a notable difference in perceptions by firm size. Giant firms, which perceive the largest burden from multiple ROO (60%), are also the most in favor of harmonized ROO (70%) (see Table 10).
25

ADBI Working Paper 185 Wignaraja, Lazaro, and DeGuzman
Table 10: Firm Perceptions on ROO (% respondents, by firm size)
All SME Large Giant Multiple ROO significantly add to business cost 27.7 26.6 24.7 60.0
ROO harmonization brings benefits 43.9 34.4 48.2 70.0
SME = small or medium enterprise, ROO = rules of origin.
Source: Authors’ computation based on survey data.
In a cross-country study of five East Asian countries including the Philippines, Kawai and Wignaraja (2009) suggested a possible explanation for why larger firms have more negative perceptions of multiple ROO than do SMEs. Their econometric analysis showed that larger, older firms tend to export to multiple markets, change their business plans in response to FTAs, and, therefore, are more likely to complain about issues of multiple ROO. In contrast, smaller firms tend to export only to a single market and, hence, have less of a basis for complaint.
6. FTA SUPPORT SERVICES This section addresses the third question of this paper regarding what can be done to improve FTA use at the firm level. In it we undertake an overview of the FTA support available and the types of services demanded by firms. First, the agencies or institutions in the Philippines that provide FTA support are examined, and it is determined whether or not exporters avail themselves of such services or support. Second, the types of services demanded by firms are identified, and some areas in which there are supply gaps in FTA support services are explored.
6.1 Public and Private Sources
FTA support in the Philippines stems from both public and private entities (see Appendix 7 for details). Public sources include the Department of Trade and Industry (DTI), which is responsible for the implementation and coordination of trade and investment policies, as well as for promoting and facilitating trade and investment through its two bureaus on international trade relations and export trade promotion. Attached to NEDA is the Tariff Commission, which handles all tariff related matters and disputes. The BOC, under the Finance Department, is the sole issuing authority of preferential certificates of origin for use in trade with FTA partners. Private sources include Philexport, which is an umbrella organization for Philippine exporters. It has a trade policy center to inform the private sector of trade policy issues and FTAs, among other information. There is also the Philippine Chamber of Commerce and Industry (PCCI) and various industry associations that advocate for FTAs, offer trade negotiation support, and conduct activities to raise FTA awareness. External consultants (e.g., law and accounting firms) and intermediaries, such as freight forwarders and customs brokers, also provide services for FTA-related needs.
At least 63% of firms identified a government agency as a source of FTA support. Overall, the DTI has been identified as the primary source of assistance. On the other hand, Philexport has been tapped as the lead source of support in the private sector. While the reliance on existing sources of support is strong, exporters are demanding a wide range of services, from information and technology support to financial assistance. Firms have also sought assistance from lawyers, consulting firms, and brokers for their specific FTA requirements.
26
ADBI Working Paper 185 Wignaraja, Lazaro, and DeGuzman
27
6.2 Services Demanded and Supply Gaps
Almost 90% of the sample (139 firms) demanded information-based services. Considering that a lack of information is the main impediment to the use of FTAs, it is unsurprising that firms called for more information on FTAs. Specifically, the firms demanded more FTA awareness training (83% of responses), more studies on the impact of FTAs on business (65%), consultation during FTA negotiations (43%), and monitoring and surveillance of NTMs (38%) (see Table 11).
A lot has been done, both by the government and by private sector entities, to disseminate information and increase industry participation in FTAs involving the Philippines. However, feedback from firms seems to suggest that existing information-related services on FTAs may be inadequate or need improvement in terms of the quality and depth of FTA support made available. Interagency coordination and public-private cooperation is required to identify which information is needed by whom. This will also avoid the duplication of effort and result in a more strategic and fruitful information campaign.
It will also open up some opportunities for lawyers, private consultants, and brokers to extend their services beyond facilitating the processing of export documents, to also conducting feasibility studies for firms to maximize their benefits from FTA preferences.
Supply gaps in much-needed technology-based services. While the demand for information can be met by bolstering the existing services provided, there are explicit shortfalls in meeting the demand for technology upgrades, such as the use of EDIs in ROO systems and the upgrading of technical standards and skills. Technology-based services are sought by about 65% of the total sample (101 firms). What is worrying is that, as shown in Table 11, with the exception of customs, there appears to be no tangible source in either the public or private sectors of any FTA-related technology support available to firms. Furthermore, customs alone may be hard-pressed to fully implement the use of EDIs in export and ROO systems—the implementation of EDIs may require further facilities and services from the private sector. In terms of technical and skills upgrading, SMEs are particularly at risk because they have very little in-house capacity and must rely on outside pools of technical expertise and facilities for information. Providing quality testing laboratory facilities for small firms could address these technology constraints.
SME support and financial and other incentives are also important. 56% of exporters (87 firms) claimed that SME extension services, financial support, and other incentives are needed, with 47% wanting extension services for SMEs and 42% wanting other incentives. SME extension services could improve the export competitiveness of these firms and allow them to realize gains from FTAs. Trade finance and other credit programs for collateral-constrained SMEs are particularly needed for firms to adjust to the effects of the global economic crisis.
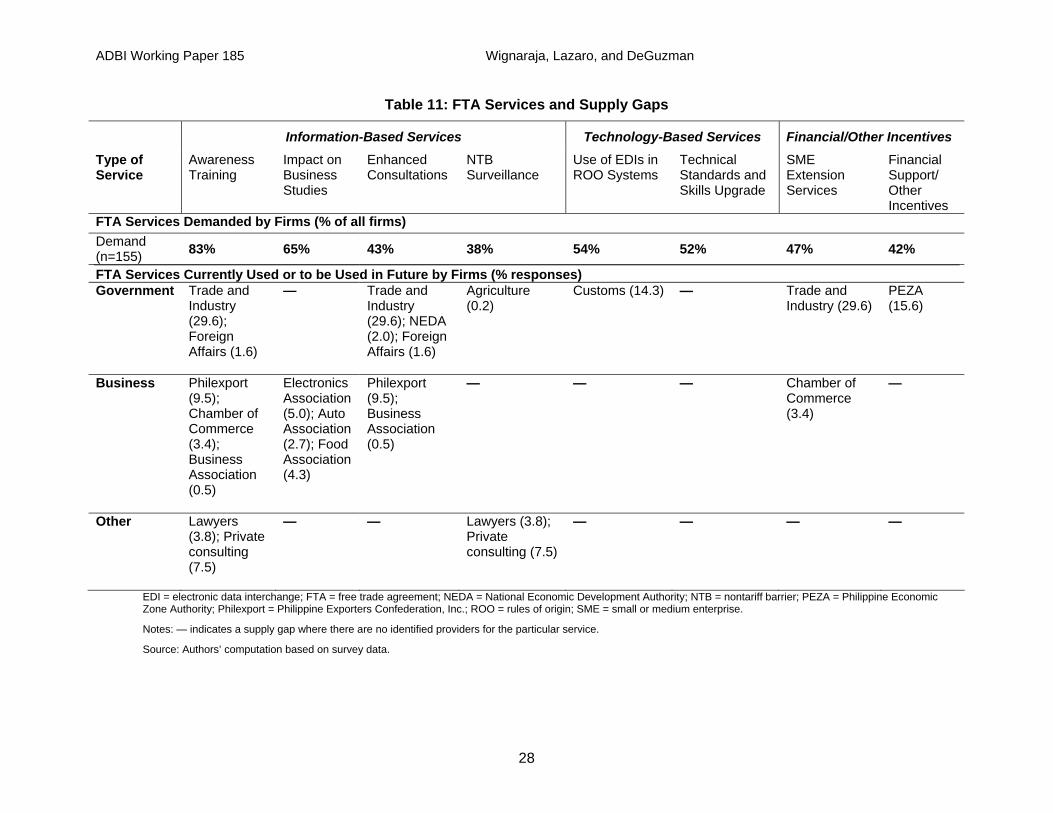
g Paper 185 Wignaraja, Lazaro, and DeGuzman
28
Information-Based Services Technology-Based Services Financial/Other Incentives
Type of Service
Awareness Training
Impact on Business Studies
Enhanced Consultations
NTB Surveillance
Use of EDIs in ROO Systems
Technical Standards and Skills Upgrade
SME Extension Services
Financial Support/ Other Incentives
FTA Services Demanded by Firms (% of all firms) Demand (n=155) 83% 65% 43% 38% 54% 52% 47% 42%
FTA Services Currently Used or to be Used in Future by Firms (% responses) Government Trade and
Industry (29.6); Foreign Affairs (1.6)
— Trade and Industry (29.6); NEDA (2.0); Foreign Affairs (1.6)
Agriculture (0.2)
Customs (14.3) — Trade and Industry (29.6)
PEZA (15.6)
Business Philexport (9.5); Chamber of Commerce (3.4); Business Association (0.5)
Electronics Association (5.0); Auto Association (2.7); Food Association (4.3)
Philexport (9.5); Business Association (0.5)
— — — Chamber of Commerce (3.4)
—
Other Lawyers (3.8); Private consulting (7.5)
— — Lawyers (3.8); Private consulting (7.5)
— — — —
EDI = electronic data interchange; FTA = free trade agreement; NEDA = National Economic Development Authority; NTB = nontariff barrier; PEZA = Philippine Economic Zone Authority; Philexport = Philippine Exporters Confederation, Inc.; ROO = rules of origin; SME = small or medium enterprise.
Table 11: FTA Services and Supply Gaps
Notes: — indicates a supply gap where there are no identified providers for the particular service.
Source: Authors’ computation based on survey data.
ADBI Workin
ADBI Working Paper 185 Wignaraja, Lazaro, and DeGuzman
7. CONCLUSION The Philippines is an outward-oriented Asian developing economy that is experimenting with FTAs as a trade policy instrument. The country has had 15 years of experience with AFTA and is participating in a burst of FTA activity, led by ASEAN and a bilateral FTA with Japan. Underlining a greater regional orientation in its trade pattern, the share of Philippine exports destined for ASEAN economies has increased significantly since the early 1990s. While this trend may be indicative of an "AFTA effect," little is known about patterns, determinants, and impediments to AFTA use in the Philippines and this study attempts to remedy this gap in the literature.
Firms in the Philippines use AFTA more than was expected based on previous studies and may start considering other FTAs as they explore new export markets. About 20% of the firms surveyed reported using or having used AFTA, with firms in the transport sector using AFTA the most. The high margins of preference accorded to transport products and the successful implementation of the AICO scheme are possible reasons for the higher utilization rate in transport relative to other sectors. As firms eye new export markets and business opportunities, other FTAs (e.g., the ASEAN-PRC FTA and JPEPA) are beginning to draw the interest of firms. Accordingly, the overall FTA utilization rate among sample firms seems set to double to 41% in the future. Firms in the food sector are boldly considering new and emerging markets and may increasingly turn to FTAs for support. AFTA users perceive net benefits from the regional agreement, in particular cheaper intermediate inputs due to preferential tariffs and increased export sales to regional markets. Econometric testing suggests that the probability of using AFTA at the firm level increases with firm age, domestic ownership, awareness of FTAs, and membership in the automotive industry.
While the use of FTAs is set to double in the future, 80% of firms still do not use such agreements, citing several noteworthy obstacles. Dealing with these impediments to nonusers could lead to even higher potential use of FTAs in the future. Nonusers of FTAs—including AFTA—indicated that a lack of information was the most significant impediment to FTA use in the Philippines. Other impediments to use include the availability of EPZ incentive schemes, delays in origin administration, rent-seeking behavior, and nontariff barriers in partner country markets. Strikingly, the majority of the sample firms (73%) did not think that multiple ROO in overlapping Asian FTAs significantly added to business costs (at present). As the number of Asian FTAs multiplies in the future, however, steps will need to be taken at the regional and national levels to minimize the potential noodle bowl problem. In the Philippines, residual procedural issues with respect to exporting and applying for origin certificates need addressing. Firms further suggested that there is room for improvement in the AFTA ROO system (e.g., lower regional value added content and the introduction of self-certification mechanisms). Harmonization, adoption of a coequal rule, and cumulation are also important factors across Asian FTAs.
The evidence suggests that there is a case for better mainstreaming of FTAs into Philippine national trade policy and for improving support services to firms. More generally, the examination of enterprise perceptions of the institutional support system in the Philippines revealed an excess demand for a range of support services (e.g., information-based, technology-based, and SME extension services) to enable firms to use FTAs more effectively in the future.
29
ADBI Working Paper 185 Wignaraja, Lazaro, and DeGuzman
From these findings, the study offers the following key lessons and suggestions for the Philippines and other developing countries that are beginning to adopt FTAs as part of their trade and development strategies:
• Information is the key to effective FTA implementation. The important role of complete and up-to-date information on FTAs cannot be overemphasized. Trade officials rely on information in making policy decisions and in negotiating FTAs. Businesses also require equivalent information—throughout the FTA life cycle from the proposal and negotiation stages to implementation—to fully benefit from FTAs. Improving data collection, particularly on the use of FTAs, would be useful in assessing the overall effectiveness of FTAs.
• Awareness, consultation, and training are crucial. Broad-based consultations (before and during FTA negotiations) help address the concerns of all stakeholders. Consultations also help firms to foresee and assess the potential gains from FTAs and to change their business plans, if need be. While reaching out to all firms could prove to be difficult, innovative and cost-effective methods of disseminating information on FTAs could be explored as a means of increasing awareness (e.g., use of FTA portals, creation of an FTA experts pool, and highlighting success stories from other firms). Seminars and other forms of training could also be expanded (from providing basic information to laying down step-by-step procedures) and tailored to each type of industry or sector in order to be more relevant to firms. SMEs, in particular, may require further interaction and resources beyond consultations to increase their likelihood of using FTAs.
• Simplicity is a powerful incentive to firms to adopt FTAs. The probable savings from using FTAs are sometimes disregarded by firms because the process of availing themselves of FTA preferences tends to be complicated. A simpler ROO regime—e.g., with harmonized tariff classification and origin rules, alternative rules, standardized and streamlined procedures, self-certification features, a one-stop-shop export documentation facility—would promote the use of FTAs among firms.
• SME-focused FTA outreach is needed. SMEs require assistance in enhancing their export performance and product diversification and in analyzing trends in international demand. Enabling small firms to restructure, set marketing priorities, and, eventually, increase their foothold in the newer, more dynamic markets with which the Philippines has negotiated FTAs, will encourage use.
• Supporting mechanisms are essential. Learning to export under FTAs involves acquiring the requisite technological capabilities to meet world-class price, quality, and delivery standards. Within or outside the FTA framework, government support for technology and skills upgrading is essential in improving overall firm-level competitiveness. Support for NTM surveillance, trade finance, and the use of EDIs have proven to be essential. Also, in view of the high AFTA usage rates in the transport sector, other sectors could explore the possibility of adopting similar AICO-type arrangements for AFTA and other FTAs.
• Broader systemic adjustments are important complements to FTA-specific improvements. Beyond tariffs and ROO, recurring problems such as rent-seeking behavior, inefficiencies, and inadequate transport and logistical infrastructure should also be taken into consideration. To be effective tools for business, FTAs must achieve their objectives of promoting growth when they are embedded in wider programs of economic reforms.
30
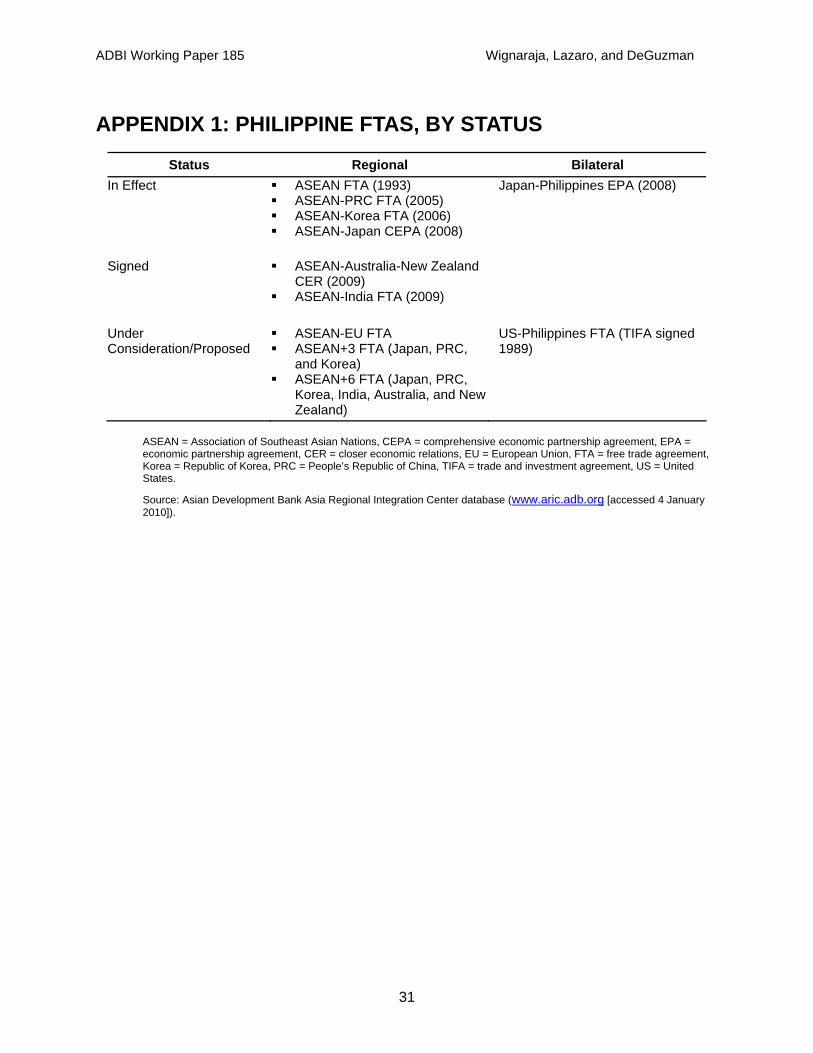
ADBI Working Paper 185 Wignaraja, Lazaro, and DeGuzman
APPENDIX 1: PHILIPPINE FTAS, BY STATUS
Status Regional Bilateral In Effect
ASEAN FTA (1993) ASEAN-PRC FTA (2005) ASEAN-Korea FTA (2006) ASEAN-Japan CEPA (2008)
Japan-Philippines EPA (2008)
Signed
ASEAN-Australia-New Zealand CER (2009)
ASEAN-India FTA (2009)
Under Consideration/Proposed
ASEAN-EU FTA ASEAN+3 FTA (Japan, PRC,
and Korea) ASEAN+6 FTA (Japan, PRC,
Korea, India, Australia, and New Zealand)
US-Philippines FTA (TIFA signed 1989)
ASEAN = Association of Southeast Asian Nations, CEPA = comprehensive economic partnership agreement, EPA = economic partnership agreement, CER = closer economic relations, EU = European Union, FTA = free trade agreement, Korea = Republic of Korea, PRC = People’s Republic of China, TIFA = trade and investment agreement, US = United States.
Source: Asian Development Bank Asia Regional Integration Center database (www.aric.adb.org [accessed 4 January 2010]).
31

ADBI Workin
32
Sector Ownership Location Size All Transport Food Electronics Domestic Foreign PEZA non-
PEZA NCR non-
NCRSmall 64 13 26 25 31 33 27 37 24 40 Large 81 22 16 43 24 57 50 31 21 60 Giant 10 1 1 8 0 10 5 5 3 7 All 155 36 43 76 55 100 82 73 48 107
The questionnaire consisted of sections covering general firm exporting background characteristics; perceptions of the impact of FTAs, including ROO; utilization of preferences, including AFTA’s CEPT scheme and/or ASEAN-PRC FTA preferences; FTA policy issues and institutional support; and NTMs, particularly SPS measures, for food firms. Additionally, in-depth interviews were undertaken and were conducted by an ADB team to garner more insights on ROO and NTM issues.
From the full sample of 190 firms interviewed, 35 firms that exhibited severe outliers on age and firm size were dropped (14 electronic, four transport, and 16 food) to ensure a more representative subsample of 155 firms for analysis. Outliers here were defined as firms whose age and number of employees had values either three interquartile ranges below the first quartile or three interquartile ranges above the third quartile. The 155 firm sample is what was considered in the study presented.
Firms were selected using a simple random sampling methodology, stratified by sector from a pool of exporting firms obtained from various sources. The sources include: the Philippine Exporters Confederation Inc. Members Directory; Top 7000 Corporations, released by Philippine Business Profiles and Perspectives Inc.; the Philippine Economic Zone Members Directory; the Taylor Nelson Sofres Internal SME Database; the Philippine Food Processors and Exporters Organization Members Directory; the Center for International Trade Expositions and Missions’ Directory of Philippine Export Companies, Products, and Services; and the Department of Trade and Industry Directory.
Under ADB supervision, a local survey firm implemented the survey and conducted face-to-face and phone interviews with firms across the Luzon, Visayas, and Mindanao areas during a period from May to November 2008. Within the firms, the majority of the respondents interviewed handled import-export functions or were in general management, including owner-managers.
APPENDIX 2: SAMPLING METHODOLOGY
Source: Authors’ computation based on survey data.
Notes: Foreign firms are defined as firms with at least 10% foreign equity share. Size is by number of employees: small = 100 or fewer; large = 101–1,000; and giant = more than 1,000. Location is by economic zone membership (PEZA, non-PEZA) and geographic location (NCR, non-NCR).
NCR = national capital region, PEZA = Philippine Economic Zone Authority.
g Paper 185 Wignaraja, Lazaro, and DeGuzman
Philippine Sample (number of firms)
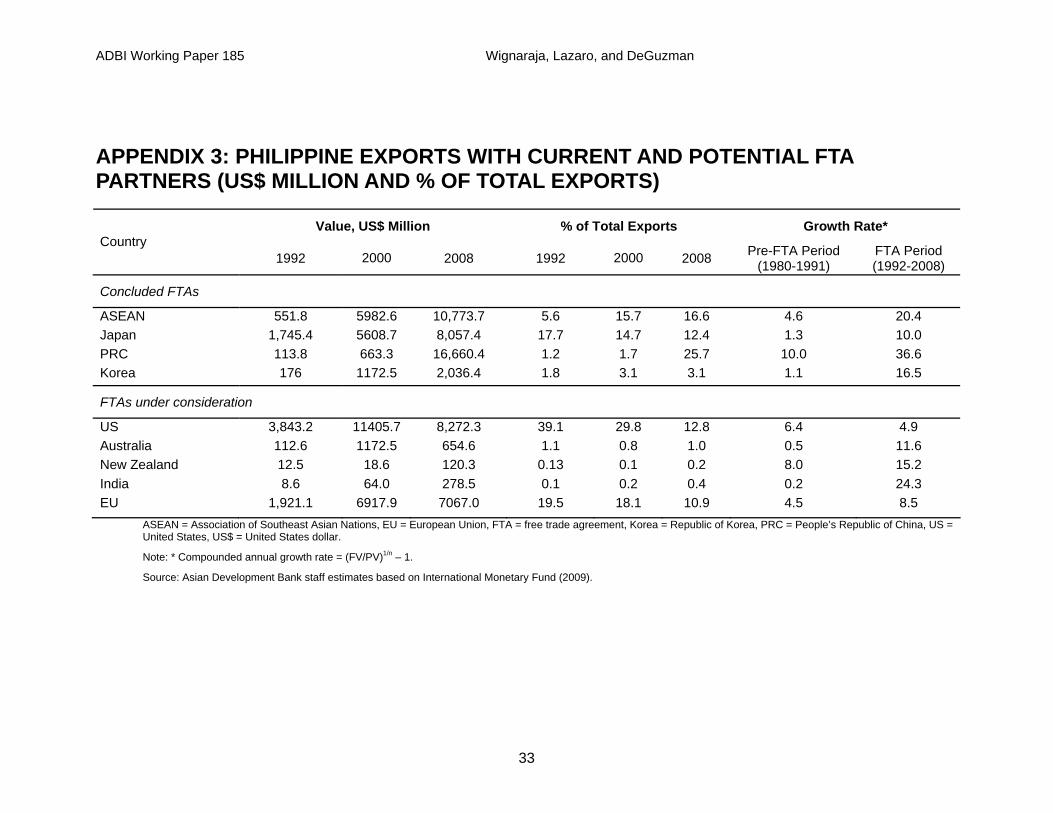
ADBI Working Paper 185 Wignaraja, Lazaro, and DeGuzman
APPENDIX 3: PHILIPPINE EXPORTS WITH CURRENT AND POTENTIAL FTA PARTNERS (US$ MILLION AND % OF TOTAL EXPORTS)
Value, US$ Million % of Total Exports Growth Rate* Country
1992 2000 2008 1992 2000 2008 Pre-FTA Period (1980-1991)
FTA Period (1992-2008)
Concluded FTAs
ASEAN 551.8 5982.6 10,773.7 5.6 15.7 16.6 4.6 20.4 Japan 1,745.4 5608.7 8,057.4 17.7 14.7 12.4 1.3 10.0 PRC 113.8 663.3 16,660.4 1.2 1.7 25.7 10.0 36.6 Korea 176 1172.5 2,036.4 1.8 3.1 3.1 1.1 16.5
FTAs under consideration
US 3,843.2 11405.7 8,272.3 39.1 29.8 12.8 6.4 4.9 Australia 112.6 1172.5 654.6 1.1 0.8 1.0 0.5 11.6 New Zealand 12.5 18.6 120.3 0.13 0.1 0.2 8.0 15.2 India 8.6 64.0 278.5 0.1 0.2 0.4 0.2 24.3 EU 1,921.1 6917.9 7067.0 19.5 18.1 10.9 4.5 8.5
ASEAN = Association of Southeast Asian Nations, EU = European Union, FTA = free trade agreement, Korea = Republic of Korea, PRC = People’s Republic of China, US = United States, US$ = United States dollar.
Note: * Compounded annual growth rate = (FV/PV)1/n – 1.
Source: Asian Development Bank staff estimates based on International Monetary Fund (2009).
33

g Paper 185 Wignaraja, Lazaro, and DeGuzman
34
APPENDIX 4: SHARE OF EXPORTS AND TARIFF RATES IN THE PHILIPPINES' MAJOR EXPORT PRODUCTS TO ASEAN, 2006
ASEAN's tariffs on Philippine exports (%) Products Malaysia Thailand Indonesia Viet Nam
Share of Exports to
ASEAN (%) MFN AFTA MOP MFN AFTA MOP MFN AFTA MOP MFN AFTA MOP HS code Electronics (76 firms) 853120 Indicator panels incorporating electronic displays 9.1 0.0 0.0 0.0 0.0 0.0 0.0 0.0 0.0 0.0 0.0 0.0 0.0 853224 Electric capacitors, fixed, ceramic, multilayer 17.1 0.0 0.0 0.0 0.0 0.0 0.0 0.0 0.0 0.0 5.0 0.0 5.0 847160 Computer input or output units 23.1 0.0 0.0 0.0 0.0 0.0 0.0 5.0 0.0 5.0 5.0 5.0 0.0 854121 Transistors, except photosensitive, < 1 watt 3.4 0.0 0.0 0.0 0.0 0.0 0.0 0.0 0.0 0.0 5.0 0.0 5.0 847330 Parts and accessories of data processing equipment 2.4 0.0 0.0 0.0 0.0 0.0 0.0 0.0 0.0 0.0 5.0 2.5 5.0 854129 Transistors, except photosensitive, > 1 watt … 0.0 0.0 0.0 0.0 0.0 0.0 0.0 0.0 0.0 5.0 5.0 0.0 854280 Electronic integrated circuits/microassemblies 66.0 0.0 0.0 0.0 0.0 0.0 0.0 0.0 0.0 0.0 0.0 0.0 0.0 854290 Parts of electronic integrated circuits etc. 50.0 0.0 0.0 0.0 0.0 0.0 0.0 0.0 0.0 0.0 0.0 0.0 0.0 847170 Computer data storage units 1.2 0.0 0.0 0.0 0.0 0.0 0.0 0.0 0.0 0.0 5.0 0.0 5.0 854210 Monolithic integrated circuits, digital 0.0 0.0 0.0 0.0 0.0 0.0 0.0 0.0 0.0 0.0 0.0 0.0 0.0
Transport or Auto and Auto Parts (36 firms) 902910 Revolution counters/taximeters/mileometers/pedometers 4.6 0.0 0.0 0.0 10.0 0.0 10.0 5.0 0.0 5.0 20.0 5.0 15.0 843120 Parts for fork-lift and other trucks 32.3 5.0 0.0 5.0 5.0 0.0 5.0 0.0 0.0 0.0 0.0 0.0 0.0 870323 Automobiles, spark ignition engine of 1500–3000 cc 70.1 25.0 2.5 22.5 10.0 5.0 5.0 35.0 5.0 30.0 45.0 2.5 42.5 870894 Steering wheels, columns, and boxes for motor vehicles 97.1 25.0 2.5 22.5 30.0 5.0 25.0 15.0 5.0 10.0 30.0 5.0 25.0 870840 Transmissions for motor vehicles 2.6 25.0 5.0 20.0 1.0 0.0 1.0 15.0 5.0 10.0 30.0 5.0 25.0 851140 Starter motors 2.8 5.0 5.0 0.0 10.0 5.0 5.0 42.5 5.0 37.5 20.0 5.0 15.0 870829 Parts and accessories of bodies for motor vehicle 0.4 25.0 5.0 20.0 30.0 5.0 25.0 15.0 5.0 10.0 30.0 5.0 25.0 870899 Motor vehicle parts 0.2 17.5 2.5 15.0 10.0 5.0 5.0 15.0 5.0 10.0 30.0 5.0 25.0 871419 Motorcycle parts except saddles 0.0 25.0 5.0 20.0 30.0 5.0 25.0 10.0 5.0 5.0 50.0 12.5 37.5 854430 Ignition/other wiring sets for vehicles/aircraft/ships 7.8 17.5 5.0 12.5 10.0 5.0 5.0 10.0 5.0 5.0 17.5 5.0 12.5
Processed Foods (43 firms) 40229 Milk and cream powder, sweetened, < 1.5% fat 2.7 0.0 0.0 0.0 11.5 0.0 11.5 5.0 0.0 5.0 30.0 5.0 25.0 230650 Coconut or copra oil-cake and other solid residues 95.1 0.0 0.0 0.0 9.0 5.0 4.0 0.0 0.0 0.0 0.0 0.0 0.0 170310 Cane molasses 0.80 0.0 0.0 0.0 30.0 5.0 25.0 5.0 0.0 5.0 10.0 5.0 5.0 080430 Pineapples, fresh or dried 7.9 nav nav -- 40.0 0.0 40.0 5.0 0.0 5.0 40.0 5.0 35.0 080450 Guavas, mangoes, mangosteens, fresh or dried 19.2 nav nav -- 40.0 0.0 40.0 5.0 0.0 5.0 40.0 5.0 35.0 080300 Bananas, including plantains, fresh or dried 3.7 nav nav -- 40.0 0.0 40.0 5.0 0.0 5.0 40.0 5.0 35.0 200799 Jams, fruit jellies, purees, and pastes, except citrus 1.0 0.0 0.0 0.0 30.0 5.0 25.0 5.0 0.0 5.0 50.0 5.0 45.0 190590 Communion wafers, rice paper, bakers wares 52.7 6.0 5.0 1.0 30.0 5.0 25.0 5.0 5.0 0.0 50.0 5.0 45.0 151319 Coconut (copra) oil or fractions, simply refined 10.2 5.0 0.0 5.0 nav 5.0 -- 0.0 0.0 0.0 50.0 5.0 45.0 200892 Fruit mixtures, otherwise prepared or preserved 9.5 9.0 5.0 4.0 30.0 5.0 25.0 5.0 0.0 5.0 50.0 5.0 45.0
AFTA = Association of Southeast Asian Nations Free Trade Agreement, ASEAN = Association of Southeast Asian Nations, CEPT = common effective preferential tariff, FTA = free trade agreement, MFN = most favored nation, MOP = margins of preference, nav = non-ad valorem rates.
Notes: MFN refers to the applied MFN tariff rate; AFTA tariff rates are averaged for each product line based on the 2006 CEPT commitment schedules; MOP represents the difference between the MFN and FTA rates.
Sources: WTO (2009), ASEAN Secretariat (2009), and United Nations COMTRADE database (http://comtrade.un.org [accessed 15 December 2009]).
ADBI Workin
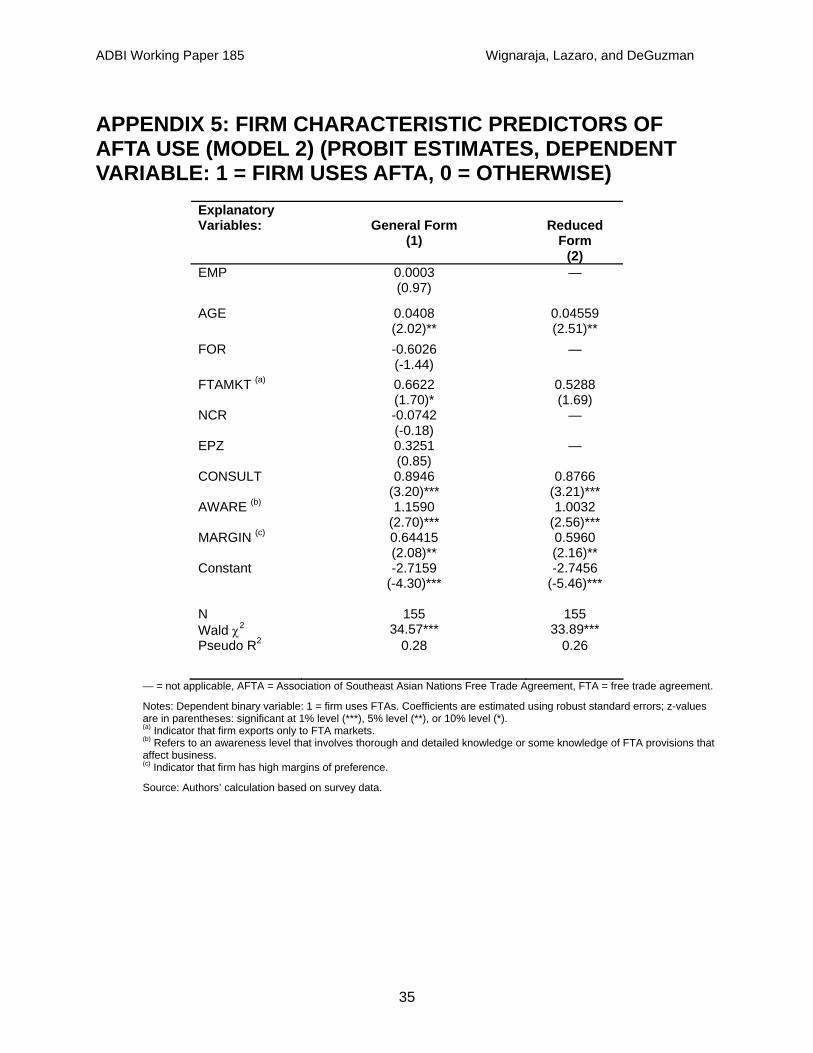
ADBI Working Paper 185 Wignaraja, Lazaro, and DeGuzman
APPENDIX 5: FIRM CHARACTERISTIC PREDICTORS OF AFTA USE (MODEL 2) (PROBIT ESTIMATES, DEPENDENT VARIABLE: 1 = FIRM USES AFTA, 0 = OTHERWISE)
Explanatory Variables: General Form
(1) Reduced
Form (2)
EMP 0.0003 (0.97)
—
AGE 0.0408 (2.02)**
0.04559 (2.51)**
FOR -0.6026 (-1.44)
—
FTAMKT (a) 0.6622 (1.70)*
0.5288 (1.69)
NCR -0.0742 (-0.18)
—
EPZ 0.3251 (0.85)
—
CONSULT 0.8946 (3.20)***
0.8766 (3.21)***
AWARE (b) 1.1590 (2.70)***
1.0032 (2.56)***
MARGIN (c) 0.64415 (2.08)**
0.5960 (2.16)**
Constant -2.7159 (-4.30)***
-2.7456 (-5.46)***
N 155 155 Wald χ2 34.57*** 33.89*** Pseudo R2 0.28 0.26
— = not applicable, AFTA = Association of Southeast Asian Nations Free Trade Agreement, FTA = free trade agreement.
Notes: Dependent binary variable: 1 = firm uses FTAs. Coefficients are estimated using robust standard errors; z-values are in parentheses: significant at 1% level (***), 5% level (**), or 10% level (*). (a) Indicator that firm exports only to FTA markets. (b) Refers to an awareness level that involves thorough and detailed knowledge or some knowledge of FTA provisions that affect business. (c) Indicator that firm has high margins of preference.
Source: Authors’ calculation based on survey data.
35

ADBI Working Paper 185 Wignaraja, Lazaro, and DeGuzman
APPENDIX 6: PROCEDURES FOR THE ISSUANCE OF A PREFERENTIAL CERTIFICATE OF ORIGIN24
1. Exporters or would-be exporters should submit an official request for the evaluation of their export products, in writing, to the ECD or export division (ED), at least five working days prior to the exportation of the products, so that the office concerned, if necessary, may conduct an inspection of the products to be exported.
2. The ECD/ED shall, upon request/application of the exporter, issue the certificate of origin (referring to, for example, Form D if for AFTA use) if the origin of the product can be easily ascertained upon inspection (e.g., handwoven abaca placement). Otherwise, the product shall be subject to pre-exportation verification, for which purpose the ECD/ED shall furnish the exporter with a checklist, together with its attachments.
3. The ECD/ED may also take any steps necessary, including plant visits or the examination of office accounts and records, in order to verify the origin of the product in accordance with the respective preferential schemes. Company visits are required for all first time certificate of origin applicants and new companies.
4. The declaration of the exporter or his authorized signatory on the certificate of origin shall be supported by appropriate and valid documents, such as copies of the export declaration, commercial invoice, bill of lading, airway bill, commodity clearances, and certificates, if needed (e.g., for tobacco products).
5. The supporting evidence/papers used for the pre-exportation verification, especially the cost breakdown, shall be subject to periodic review, consistent with prevailing economic conditions. While said evidence may be used as the basis for the issuance of the certificate of origin for a particular shipment at a particular time, the same shall not always be construed as being applicable and binding for subsequent shipments in the future.
6. In general, the office that processes the export declarations shall issue the corresponding certificate of origin. Certificates of origin shall be issued by the ECD/ED at the time of exportation or as soon thereafter as possible if the product has been found to be eligible for preferential treatment.
24 Excerpted from BOC (2008).
36
ADBI Working Paper 185 Wignaraja, Lazaro, and DeGuzman
APPENDIX 7: PUBLIC AND PRIVATE SOURCES OF SUPPORT FOR FTA USE Public Sources The Philippine DTI is responsible for the implementation and coordination of trade and investment policies, as well as for promoting and facilitating trade and investment. In 1999, then President Joseph Estrada issued Executive Order No. 124, which deputized the senior undersecretary as a special trade negotiator. The Bureau of International Trade Relations provides trade representation abroad, trade information, and export promotion, and leads the country’s bilateral and multilateral trade and investment negotiations, including for ASEAN FTAs and JPEPA. Specifically relating to the bilateral agreement with Japan, at least three working groups and joint coordinating team sessions have welcomed the participation of the private sector. Feedback is also gathered during industry consultations in advance of FTA negotiations, although many stakeholders complain of the lack of broad consultation.
The Bureau of Export Trade Promotion is the lead export promotion arm of DTI, tasked to develop, promote, and expand export trade. A frontline team known as the Export Assistance Network provides real, immediate, and substantial assistance to existing and potential exporters. Among other services, the Bureau of Export Trade Promotion maintains an online system known as Tradeline Philippines (http://tradelinephil.dti.gov.ph) that offers trade statistics, an exporters directory, market profiles, and industry links—particularly updates on policies, trends, and other issues affecting Philippine businesses.
Attached to NEDA is the Tariff Commission, which undertakes public hearings and consultations primarily on antidumping, countervailing, and safeguard investigations, and investigates petitions to vary or remove duty rates (including any changes to tariff classification). The organization has posted an online primer on AFTA and tariff-related issues in FTAs on its website, as well as presentation materials on FTAs that are used during public hearings and consultations.
The Philippine Institute for Development Studies, another agency affiliated with NEDA, is involved in enriching the information pool on FTAs with impact studies and related research. While being a non-stock, nonprofit government organization, it maintains an independent and critical analysis of FTA issues and spearheads research projects on JPEPA and the Philippines-US FTA—including a number of impact assessments and strength-weakness-opportunity-threat analyses for Philippine exporters. In addition, the Philippine Institute for Development Studies conducts regular roundtable discussions, workshops, and other dissemination activities nationwide.
The BOC, under the Finance Department, is responsible for the collection of import and export duties, value added tax, and excise taxes. It is the primary (if not the sole) agency that has the authority to issue and approve preferential certificates of origin for use in FTAs. The export division of the BOC issues notices regarding procedures for securing preferential certificates of origin and gives lectures to industry associations when requested. Jointly with the DTI, the BOC established OSEDC to make export documentation processing (e.g., for export declarations, certificates of origin, and clearances) hassle free for exporters by housing all government agencies in areas where OSEDC operates. Currently, however, the processing of origin certificates is limited to non-preferential certificates of origin and the Generalized System of Preferences; exporters applying for FTA certificates of origin need to do so at BOC offices.
37

ADBI Working Paper 185 Wignaraja, Lazaro, and DeGuzman
Private Sources Philexport is an umbrella organization of Philippine exporters with at least 20 chapters and covering 52 industry associations. It provides the most extensive and useful information on FTAs and support for FTA use for businesses. Under its Universal Access for Competitiveness in Trade program, a trade policy center was set up to enable the private sector to be better informed on trade policy issues and FTAs, and to spearhead a consensus-based national negotiation stance on up-and-coming trade agreements. Among its outputs are question and answer type primers (e.g., ASEAN for Philippine Business, and Understanding JPEPA), policy briefs on FTAs and ROO, and forums and seminars on FTAs.
Philexport goes further, by rendering institutional support for businesses adjusting to FTAs, including technology upgrading for small firms. For example, in 2008, Philexport, through its Export Promotions Fund,25 provided quality testing laboratory facilities for exporters.
PCCI offers advocacy and trade negotiation support, organizes FTA workshops through its regional trade policy consultation program, and conducts studies on topics such as the readiness of priority services in the ASEAN economic community. Also, along with Philexport, PCCI is at the forefront of advocacy for the full computerization of the BOC and other export-related government agencies.
Industry associations (e.g., the Philippine Food Processors and Exporters Organization; Semiconductor and Electronics Industries in the Philippines, Inc.; Motor Vehicle Parts Manufacturers Association of the Philippines: and Chamber of Automotive Manufacturers of the Philippines, Inc.) and business clubs (e.g., the Makati Business Club) also offer occasional services, such as the preparation of industry position papers on FTAs, consultations and advocacy on trade negotiations, raising enterprise awareness, and lobbying for technology upgrades.
Finally, firms generally rely on external consultants (e.g., law and accounting firms) and intermediaries, such as freight forwarders and customs brokers, for their FTA-related needs, including export processing and other firm-specific needs.
25 These services are expected to expand with the additional funding of US$22 million for 2009.
38
ADBI Working Paper 185 Wignaraja, Lazaro, and DeGuzman
REFERENCES Association of Southeast Asian Nations (ASEAN) Secretariat. 2009. CEPT Tariff Schedule
2009. http://www.aseansec.org (accessed 15 December 2009).
Asian Development Bank (ADB). 2005a. Improving the Investment Climate in the Philippines. Manila: ADB.
———. 2005b. Singapore’s TradeNet System. Manila: ADB.
Aldaba, R. 2008a. Globalization and the Need for Strategic Government-Industry Cooperation in the Philippine Automotive Industry. Philippine Institute of Development Studies (PIDS) Discussion Paper 2008-21. Manila: PIDS.
———. 2008b. SMEs in the Philippine Manufacturing Industry and Globalization: Meeting the Development Challenges. PIDS Discussion Paper 2008-15. Manila: PIDS.
Austria, M. 2001. Liberalization and Regional Integration: The Philippines Strategy for Global Competitiveness. Philippines Journal of Development 51, First Semester 2001(XXVIII-1): 54–86.
———. 2003. The Philippines in the Global Trading Environment: Looking Back and the Challenges Ahead. PIDS Perspective Paper Series 3. Manila: PIDS.
———. 2004. ASEAN Free Trade Area: Lessons learned and the challenges ahead. Center for Business and Economics Research and Development (CBERD) Working Paper Series 2004-01. Manila: La Salle University.
———. 2006. Enhancement and Deepening of the Competitiveness of the Philippine Electronics Industry under a Bilateral Setting. PIDS Discussion Paper Series 2006-09. Manila: PIDS.
Avila, J., and G. Manzano. 2007. Philippines Chapter. Trade Issues in East Asia: Preferential Rules of Origin. World Bank Policy Research Report. June. Washington, DC: World Bank.
Balboa, J., E. Medalla, and J. Yap. 2007. Closer Trade and Financial Co-operation in ASEAN: Issues at the Regional and National Level with Focus on the Philippines. ASEAN Economic Bulletin 24(1): 119–137.
Baldwin, R. E. 2007. Managing the Noodle Bowl: The Fragility of East Asian Regionalism. ADB Working Paper Series on Regional Economic Integration 7. Manila: ADB.
Balisacan, A., and H. Hill, eds. 2003. The Philippine Economy: Development, Policies, and Challenges. New York, NY: Oxford University Press.
Bangko Sentral ng Pilipinas. 2009. Monetary, External and Financial Statistics. http://www.bsp.gov.ph/statistics/statistics.asp (accessed July 2009).
Bautista, R., and M. Lamberte. 2005. The Philippines: Economic Developments and Prospects. Asian-Pacific Economic Literature 10(2): 16–31.
Costales, C. 2008. Adjustments in the Agro-Processing Industry and the RP-US FTA. De La Salle University/Angelo King Institute Working Paper Series 2008-10. Manila: De La Salle University.
Cororaton, C. 2004. Philippine-Japan Bilateral Agreements: Analysis of Possible Effects on Unemployment, Distribution and Poverty in the Philippines Using CGE-Microsimulation Approach. PIDS Discussion Paper Series 2004-01. Manila: PIDS.
39

ADBI Working Paper 185 Wignaraja, Lazaro, and DeGuzman
Cororaton, C., and J. Cockburn. 2007. Trade Reform and Poverty—Lessons from the Philippines: A CGE-Microsimulation Analysis. Journal of Policy Modeling 29(1): 141–163.
Dueñas-Caparas, M. 2007. Firm-Level Determinants of Export Performance: Evidence from the Philippines. Philippine Journal of Development 62, 1st Semester 2007(XXXIV-1): 1–26.
International Monetary Fund. 2009. Direction of Trade Statistics. CD-ROM. Data as of June.
Kawai, M., and G. Wignaraja. 2009. The Asian “Noodle Bowl”: Is It Serious for Business? ADBI Working Paper 136. Tokyo: ADBI.
Kawasaki, K. 2003. The Impact of FTA between Japan and the Philippines- CGE Model Simulations (GTAP 1997). Powerpoint presentation presented at the Japan-Philippines Economic Partnership Agreement (JPEPA) roundtable discussion, Tokyo, 8–9 July.
Lazaro, D., and E. Medalla. 2006. Rules of Origin: Evolving Best Practices for FTAs/RTAs. PIDS Discussion Paper Series 2006-01. Manila: PIDS.
National Economic Development Authority. 2004. Medium-Term Philippine Development Plan 2004–2010. Manila: National Economic Development Authority.
Palanca, E. 2004. China’s WTO Entry: Effects on Its Economy and Implications for the Philippines. Philippine Journal of Development 58, 2nd Semester 2004(XXXI-2): 173–213.
Pasadilla, G. 2007. Nontariff Measures faced by Philippine Agriculture Exporters. PIDS Policy Notes 2007-10. Manila: PIDS.
Pasadilla, G., and C. Liao. 2005. Who Are Opposed to Free Trade in the Philippines? Philippine Journal of Development 59, First Semester 2005(XXXII-1): 1–17.
Philippine Bureau of Customs (BOC). 2008. Notice to Exporters: Procedures for Screening Certificates of Origin. Manila: Philippine Bureau of Customs.
Philippine Economic Zone Authority. 2008. Activities Eligible for PEZA Registration and Incentives. http://www.peza.gov.ph/index.php ?option=com_content&view=article&id=111&Itemid=153 (accessed July 2009).
Philippine Exporters Confederation (Philexport). 2007a. ASEAN for Philippine Business. Manila: Philexport.
———. 2007b. Understanding JPEPA. Primer on the Japan-Philippines Economic Partnership Agreement (JPEPA). Manila: Philexport.
PIDS. 2009. Tariffs: (1990 to 2005). Economic and Social Database. http://econdb.pids.gov .ph/index.php?option=com_dirp&tab2=146&class_id=&sort_id=Place_ID&disp_flag =&dat_class=5 (accessed July 2009).
Philippine Tariff Commission. 2009. Frequency Distribution of Tariff Rates, 2007. http://www.tariffcommission.gov.ph/tariff2007.htm (accessed July 2009).
Pineda, A., and O. Tongco. 2007. The Philippines Food Sector: Market Access Limitations and Barriers in the European Union and Ways to Overcome Them. Unpublished manuscript.
Senate of the Philippines, Senate Economic Planning Office. 2007. Japan-Philippines Economic Partnership Agreement: An Assessment. Policy Brief. September. Manila: Senate of the Philippines.
Tan, R. 2004. Prospects and Problems of Expanding Trade with Japan: A Survey of Philippine Exporters. PIDS Discussion Paper Series No. 2004-10. Manila: PIDS.
40
ADBI Working Paper 185 Wignaraja, Lazaro, and DeGuzman
Teteryatnikova, M. 2009. R&D in the Network of International Trade: Multilateral Versus Regional Trade Agreements. WTO Working Paper ERSD-2009-03. Geneva, Switzerland: World Trade Organization (WTO).
Urata, S. and K. Kiyota. 2003. Prospective Economic Impacts of a Japan-Philippines Bilateral FTA. Powerpoint presentation presented at the JPEPA roundtable discussion, Tokyo, 8–9 July.
Wignaraja, G. 2008. FDI and Innovation as Drivers of Export Behaviour: Firm-Level Evidence from East Asia. United Nations University-Maastricht Economic Research Institute on Innovation and Technology (UNU-MERIT) Working Paper 2008-061. Maastricht, Netherlands: UNU-MERIT.
World Bank. 2008. World Development Indicators (WDI). http://www.worldbank.org /data/onlinedatabases/onlinedatabases.html (accessed March 2009).
WTO. 2005. Trade Policy Review – The Philippines. Report by the Secretariat. Geneva, Switzerland: WTO.
———. 2009. World Tariff Profiles – The Philippines. Geneva, Switzerland: WTO.
Yasutake, T. 2004. Philippines-Japan Free Trade Agreement: Analyzing Its Potential Impact Using a Computable General Equilibrium Model. PIDS Discussion Paper 2004-40. Manila: PIDS.
41