Embed Size (px)
Citation preview

A value-chain analysis of international fish trade and food security with an impact assessment of
the small scale sector
Synthesis of back ground reports
NORAD-FAO ProjectAugust 2012
0

Table of contents
Page
1 Introduction 2
2 Bangladesh 4
3 Cambodia 13
4 Canada 20
5 Ghana 27
6 Honduras 37
7 Iceland59
8 Japan 73
9 Kenya 77
10 Maldives 84
11 Morocco 93
12 Norway 98
13 Peru 105
14 Thailand 118
15 Uganda 127
16 Vietnam 141
17 Summary 149
1

1 Introduction
The food and agricultural organisation (FAO) and the Norwegian agency for development cooperation
(NORAD) have initiated a comprehensive value-chain analysis of international fish trade with an impact
assessment of the small-scale sector in developing countries. The aim is to identify ways to improve food
security for local populations through more informed policy decisions.
Fish exports and trade is a major source of income for developing countries. They now represent close
to 50% of global fish exports with their annual net export revenues exceeding US$ 25 billion. Jobs are
created in production, processing and trade, and local food-security is strengthened through the
nutritional contribution of fish to human consumption. In fish production, capture fisheries as well as
fish farming, a large share is carried out by the small-scale sector. It is therefore of crucial importance to
arrive at polices that safeguard the interests of the small-scale producers not only by enabling them to
access international markets but also to obtain prices and margins that let them achieve long-term
sustainability from an economic, social and biological resource perspective.
The objective of the project is to achieve a better understanding of the dynamics of relevant value-
chains in international fish trade and arrive at policy recommendations. The project will analyse the
distribution of benefits in the value-chain and the linkages between the relative benefits obtained and
the design of the chain. Comparisons will be made between domestic, regional and international value-
chains with the view to understand better how developing countries can increase the value derived from
their fishery resources.
The study will in part build on available value-chain analyses carried out by other institutions, including
those concerning developed countries which will serve as a reference of comparison with value-chains in
developing countries. The study will, through the use of case studies from a minimum of eleven selected
developing countries and a minimum of two studies from the small-scale sector in developed countries,
analyse the factors that determine prices and margins throughout the value-chain as well as the
distribution of benefits among the various stakeholders. Aquaculture and inland fisheries will be
considered in addition to capture fisheries. Particular attention will be given to processing in order to
compare the difference in value creation from the export of unprocessed and processed fish.
2

The project involves case studies of fifteen countries, where four are industrialised and the remaining
are developing countries. The industrialised countries include Japan, Canada, Norway and Iceland. The
case study for Iceland and Norway are locally financed. The developing countries are Honduras and Peru
(central and south America); Morocco, Uganda, Kenya and Ghana (Africa); Cambodia, Vietnam, Thailand,
Bangladesh and The Maldives (Asia). The next chapters will deal with the background information of the
fifteen countries which are involved in the study.
The project involves different consultants including the lead consultant, FAO focal point, international
consultants, international steering committee, national consultants from each country and project
consultant. The following organogram presents the organization of the project.
3

2Bangladesh
2.1 Fish production
Bangladesh is a developing country located in the north eastern part of South Asia with a total area of
56,977 square miles. The limits of territorial waters of the country are 12 nautical miles and the areas of
the high sea extending to 200 nautical miles measured from the base lines constitute the economic zone
of the country. In addition, a wide portion of the land is covered by large rivers and thousands of
tributaries.
Fishery plays an important role in the lives of the people and the economy of Bangladesh through
employment, nutrition, foreign exchange and other aspects of the economy. Fishing takes place in three
environments namely inland capture fishery, inland culture fishery and marine fishery (artisanal and
coastal fisheries). The Bangladesh fisheries sector currently contributes 4.64% to the country’s GDP, 23
% to the agricultural GDP and 5.10% to foreign exchange earnings through export. About 13 million
people of the country are directly or indirectly dependent on this sector for their livelihood. Apart from
the capture fishery, aquaculture has the potential to provide new employment opportunities in the rural
areas. It is estimated that 73% of rural households are involved in some form of freshwater aquaculture
on floodplains throughout the country. In addition, fish supplies around 58% of animal protein and the
per capita annual fish consumption is around 15.04 kg.
The country’s fisheries are multispecies in nature: there are 300 species of fish and 20 species of prawns
in Bangladesh. The most common species is Ilish (Tenualosa ilisha) national fish, which accounts for
nearly half of total marine catch. The inland freshwaters of Bangladesh are inhabited by 60 native and
13 exotic species of fish and 20 species of shrimp. Carps are the most important species for pond
culture, there are two subgroups of indigenous carp species in the country. These are major carps (katla,
rohu, mrigel and kalbasu) and minor carps (bata, reba, nandina and gonia). Other major culture species
in Bangladesh include grass carp, common carp, silver carp, tilapia and Pangas. For the study at hand
five species have been chosen, four from the culture fishery and one from capture fisheries. The four
species which were chosen based on the importance of different species are Ruhu (Labeo rohita), Catla
(catla catla), Pangas (Pangasius hypophthalmus) and Tilapia (Oreochromis mossambicus/ O. niloticus).
4

Fish production from different sources
0
200000
400000
600000
800000
1000000
1200000
Year
Prod
uctio
n (to
ns)
Inland captureInland culturemarine
In addition, Ilish, being most dominant species in the capture (inland and marine) fisheries, has been
selected for the study.
The number of fish and prawn farmers are around 0.308 and 0.115 million respectively. In contrast,
number of fishers is estimated at 0.128 million comprising 0.077 million fishers operating on inland
water bodies and 0.051 million operating on marine fisheries. Fisheries Sector Review (2003) estimates
that some 1.1 million people (landless, part time, full time fishers and landowners) are directly involved
in capture fisheries. Accordingly, around 650,000 (67%) are engaged in inland fisheries and 444,000
(33%) in coastal and marine fisheries. In addition around 177,500 people are involved in fish and shrimp
or prawn seed collection, husbandry and distribution.
During the 2008-09, Bangladesh produced a total of 2,701,370 metric tons of fish in which inland
fisheries contributed 80.95% (41.61% from inland capture fisheries and 39.34% from the inland culture
fisheries) and marine fisheries contributed the rest. Fish production has been continuously increasing for
26 years starting 1983-2009, see figure-1. Inland capture fishery had been the major source of fish
production in the country till 2000, after which inland culture fishery surpassed the former and becomes
a dominant source. In the inland culture fishery ponds have the largest share followed by shrimp farms.
Marine fishery had also higher share than inland culture fishery till 1993-94. Fish production growth in
the eighties appears to be slower than those in the later years. The overall fish production in Bangladesh
grew at 5.61% rate per year during the 26-year period from 1983/84 – 2008/09. The highest growth rate
is 10.37% achieved for shrimp farms. Inland culture fishery grew at 9.69% rate over the period. In
addition, inland capture fishery and marine fisheries grew at a rate of 3.78% and 4.34% respectively.
5

Figure 1: Bangladesh fish production
There are three types of fisher’s organisations in Bangladesh. These are Bangladesh Jatio Matshyajibi
Samabay Samity (BJMSS) established in 1960, Bangladesh Jatio Matshyajibi Samity (BJMS) established in
1986 and Bangladesh Jatiotabadi Jele Dal (GJJD) established in 1993. BJMSS is the apex society
organisation registered with the department of cooperatives. Whereas, the latter two societies (BJMS
and GJJD) were established at the national level under different government departments but they do
not have access to societies at field level.
The technologies used for fish harvesting include traditional fishing methods with the help of nets and
boats for the aquaculture sector, rafts for fishing in the shallow waters, trawlers ( both side and stern
trawlers) used for sea fishing and sometimes Shampan is used for fishing in the estuaries or in the off
shore of the bay of Bengal.
2.2 Transportation
Transportation is arranged by the private sector where boats and trucks/lorry are the main means of
transportation. Some of the commonly used packing materials are bamboo baskets, wooden boxes,
plastic crates, oil drums (for live fish), plastic bags, jute bags and other local materials. In addition,
natural materials are used as a means of fish protection and insulation these include hogla leaves,
banana leaves, water hyacinths and mosses.
Rickshaws and man-driven vans are also used for short movement within primary and secondary
markets. In addition, some street vendors, having purchased from the wholesale fish market, supply fish
to households using heal-load with aluminium pots. Some government organisations such as DoF, and
BFDC often use refrigerated/open pick-ups/trucks and vans to supply within the urban markets.
2.3 Final consumption
Bangladesh exports fish and fishery products to different countries of the world. The most important
item of export is the frozen shrimp/prawn. Frozen fish, dry fish, salted and dehydrated fish, turtles/
tortoise/ crab/eel, shark fin and fish maws are also exported. For last 4 years Bangladesh has also started
6

exporting live fish in a limited scale. In terms of quantity and value, shrimp occupies the first position in
the export milieu followed by frozen fish. In 2008-09, quantity of shrimp and frozen fish exported were
50,368 and 19,295 metric tons generating a value of Tk2,744 and Tk451 million. Other items in order of
importance are turtles/tortoise/crab/eel, dry fish, shark fin and fish maws. However, the export of live
fish is very insignificant. The major markets for Bangladesh frozen shrimp are USA, UK, Japan, Belgium,
Netherlands, Thailand, Germany, China, France, Canada, Spain and Italy. Generally, Shrimp is the most
important item of the export followed by frozen and dry fish.
2.4 Fisheries regulations
In Bangladesh fisheries resources, specifically inland fishery resources, are administratively defined as
jalmahals (fishery) or water estates and they are mostly under the ownership of the Ministry of Land
(MoL) being governed by the Land Management Manual, 1990 and other documents issued by the
Ministry afterwards. The MoL defined inland waters as open and closed water bodies. All fisheries or
water estates in flowing rivers are treated as open waters and following the State Acquisition Tenancy
Act, these water estates have been subjected to regulatory power of the state agencies. Other water
bodies- beels, haors (deeply flooded saucer shaped depression), baors and government owned ponds,
reservoirs etc. fall under the closed water category. Closed fisheries, thus, can be both private and public
property. While the Land Management Manual regulates the management of State owned closed water
bodies, parcels of fisheries under private occupancy are at the disposal of the owner who can use the
same for any purpose unless that affects the enjoyment of similar rights by others. There are certain
restrictions imposed by law such as the Agricultural Pesticides Ordinance, 1971 or Irrigation Act of 1976.
Private fisheries are protected by law through the Private Fisheries Protection Act, 1889. The legislation
regarding use, access and rights has suffered many changes; one of the most significant is having access
to and the management of open water bodies. Leasing of fisheries was not restricted to fishermen or
their cooperatives, but rather was open to anybody who wanted to participate in the auction bid for
leases. This system, followed from 1950 to 1965, allowed the rich and influential non-fishers and ijardars
(lessee of water bodies) to gain leases of all fishery ( jalmahals). Due to financial constraints the genuine
fishermen would not bid at the auction for valuable and significant fisheries where the deposit
requirement is higher. After the year 1974, the government of Bangladesh decided to restrict the
auctioning of jalmahals only to registered fisher’s cooperative societies. In addition, in 1995 the Prime
Minister announced the abolition of the leasing of open jalmahals. Thus, there are a lot of different acts
which were intended to protect the country’s fish and fishery activities.
7
In the case of marine fisheries, the Fisheries and Livestock Division under the Ministry of Agriculture
framed the Marine Fisheries Rules 1983, subsequently amended on 28 December, 1992. Under the rules,
every applicant for license either of a local or foreign fishing vehicle shall disclose to the licensing
authority the method of fishing, the areas or amount to be fished. In addition, all licenses to be issued
shall comply with all relevant laws and rules regarding the conservation and management of fisheries in
Bangladesh. In addition, The Territorial and Management Zones Rules, 1974 provides guidelines for the
declaration of closed seasons, during which provision of all or any specified fish or fishing type shall be
prohibited in the economic zone.
Apart from the inland and marine fisheries the Management of the Sundarbans reserve forest lies with
the Department of Forest, under the auspices of the Ministry of Environment and Forest. The Aquatic
Resources Divisions (ARD) and the Sundarbans Management Unit (SMU) are responsible for all
operations of aquatic resources management. The restrictions recently set for the Sundarbans include
minimum size limits (23 cm) and closed seasons (November to April) for ilish and pangas, Prohibition of
the use of small meshes, Closure of fish breeding areas (khals) and crab breeding seasons during
December and February, and notification of the prohibition of fry and post larvae collection of shrimps
and prawns.
There are some legislations specifically relevant for aquaculture, these include the Tanks Improvement
Act 1939 and in the post harvest aspect, the Fish and Fisheries Products (Inspection and Quality Control)
Ordinance 1983, the Piranha Groups Act 2008 and the Fish Feed and Animal act 2010.
2.5 Market structure
Fish marketing in Bangladesh is almost entirely in the hands of the private sector but a small fraction is
handled by the Bangladesh Fisheries Development Corporation (BFDC), an autonomous organisation
under the Ministry of Fisheries & Livestock, figure 2 represents the country’s fish marketing structure.
The private market structure operates through a complex system of hats (village markets), bazaar
(township market), assembly centres, and major urban wholesale and retail markets. There is a
corresponding network of personnel, from buyers who may be hat traders, or agents of bigger bazaar
fish merchants (Bepari/Mohajans) to wholesale market commission agents (Aratdars/Paikers) who
effectively control the whole system. The marketing is managed, financed, and controlled by some
intermediaries known as aratdars (commission agents) and mohajans (financiers or money lenders).
8

Wholesale fish markets are mostly run by few aratdars who greatly restrict the entry of newcomers. The
aratdars provide advances to fish farmers who in return are required to sell fish. The aratdars charge 3%
to 6% commission and take 2 to 4 fish for every 80 fish sold (World Bank 1991).The fish traders also
provide advances to the fishermen, who are required to sell fish to them. Competition is not keen,
especially at the fish assembly stage. The assembling of fish from fishermen is perhaps the most
profitable activity in the entire marketing chain, because the fishermen-lacking access to credit, ice, and
market information- also lack bargaining power. There is evidence of widespread exploitation of
fishermen and the extraction of rent by traders and leaseholders.
There are different market structures in Bangladesh, some of them are primary markets where fishes
are sold in open air to retailers and beparies and these rural markets don’t have access to ice and water
facilities. On the other hand, the retail markets have some form of sitting arrangements and shades with
ice and water facilities. District level markets are better off in terms of seller’s sitting arrangements and
other physical facilities. The sellers have their fixed sitting arrangements and there are extended areas
for accommodating additional retailers beyond fixed installations. Apart from district markets, municipal
markets have better infrastructure with fixed location at one side of the big shade/building. Water and
ice can be made available from the nearby factories. The wholesale markets where bidding takes place
have some infrastructure along with ice and water facilities. Wholesale fish markets are located at
secondary, higher secondary and in terminal markets which may be located at upazila headquarters,
river ports, towns and in cities. However, the spaces in these markets are generally inadequate for
handling highly perishable commodities like fish.
Generally, the Bangladesh fish marketing system has inadequate and unhygienic landing, parking and
auctioning facilities specifically in the retail and wholesale markets. In addition, there is limited supply of
ice in the fish landing sites, in adequate cold storage and insulated transportation facilities, improper
grading and fish packaging, inaccurate weights and measure for which eye estimates of volume are
often substituted, limited market information and high marketing margins which vary between 30% to
50% of the retail price for different fish species and 18% to 60% for prawns. The detailed information on
the marketing profit of fishery products in the domestic and export markets is presented in table-1.
9

Table 1: Marketing Profit of Frozen and Dry fish at Domestic and Export Markets
Marketing profit of frozen fish at different domestic market
Market Ilish Catfish Pomfret Tuna Capture shrimp Average
Primary 6.99 6.37 18.01 11.27 4.50 9.43
Secondary 2.52 3.50 4.09 2.86 2.75 3.14
Consumer 14.20 6.45 15.09 12.69 10.85 13.53
All market 23.71 16.32 37.19 26.82 18.10 26.10
Marketing profit of minor frozen fish at different domestic market
Market Bombay duck
Coral/seabas
Marine eel
Phaisa/Mullet
Shark Average
Primary 5.55 9.76 7.22 7.43 7.88 6.56
Secondary 4.32 2.13 5.14 3.77 4.92 4.06
Consumer 9.40 4.84 7.38 10.16 7.36 8.49
All market 19.27 16.73 19.74 21.36 20.16 19.13
Marketing profit of processing plants/agencies in the export of frozen/dry fish
Market Ilish Catfish Pomfret Coral/vetki Average
Export market for frozen fish 93.75 65.00 190.00 47.00 98.94
Export market for dry fish 92.50 93.00 115.00 60.00 90.12
10

11
Collection centre/rural market within the fishing area: operated by collectors
Collected (through brokers or dalals) by mahajans/mahajans cum-traders. Carried by headloads/boat to primary market
PRIMARY
First landing and distribution centre near thana headquarters of vital communication points. Operated by commission agents called aratdars
Carried by small traders called mahajan
SECONDARY
Second landing & distribution centre in cities/towns. Operated by commission agents called aratdars
Carried by first distributors called beparies
HIGHER SECONDARY
Retail marketing: Paikars sell to retailers
Purchased by second distributors called paikars
FINAL CONSUMING
Sub-urban retailing
Retailers sell to consumers
Urban retailing
Rural retailing
Figure2: Generalised fish marketing channel of BangladeshFigure 2

2.6 Data availability
Fisheries data are generated mainly by three organisations, namely department of Fisheries
(http://www.fisheries.gov.bd/), department of Agricultural Marketing (http://www.dam.gov.bd/) and
Bangladesh Bureau of Statistics (http://www.bbs.gov.bd/). Department of Fisheries publishes annually
Fisheries Statistical Yearbook of Bangladesh. The publication provides details of production statistics by
fisheries resources, species, districts, upazilas and so on. It also provides export statistics of fish and fish
products. Unfortunately, the publication does not provide any information of fish prices. However, the
department of Agricultural Marketing has a mechanism of collecting price information of almost all
commodities including fish. The website of department provides retail prices, wholesale prices and
grower’s prices of different markets under upazillas and districts of different divisions. However, data
might not be consistently available for some species. Generally the status of wholesale price data is
better than those of the retail and grower’s prices.
Bangladesh Bureau of Statistics produces some price statistics of some selected fish species in its annual
publications, Yearbook of Statistics and Statistical Pocket Book of Bangladesh. However, figures vary
considerably across publications.
12

3Cambodia
3.1 Fish production
The Cambodia’s fisheries sector encompasses extensive freshwater fisheries within floodplains, river,
lakes, some aquaculture and marine fisheries. Various types of land and water resources areas that
support inland fisheries in Cambodia include permanent water bodies (river, lake and pond), flooded
forest, flooded secondary forest, flooded grassland, receding and floating rice fields, seasonally flooded
crop fields and swamp. The country’s fisheries sector is managed by the Fisheries Administration (FiA).
Fish constitutes about 75 % of the country’s animal protein intake and most of it comes from freshwater
fisheries, and aquaculture contributes about 10 % of the total inland fish catch of the country. As shown
in table 2, the total fish catch of marine fisheries increased over the years with the exception of 1995,
whereas the catch of inland fisheries fluctuated during 1991–2009. In the case of fish aquaculture, it
increased over the years, with the exception of 2001. However, the capture of shrimp aquaculture
fluctuated over the years.
Table 2: Total fish production during 1991–2009 in metric tonne
Year
Capture (Inland and Marine) AquacultureInland Marine Total Fish Shrimp
1991 74 700 36 400 111 100 6 700 –
1995 72 500 30 500 103 000 8 779 731
2000 245 600 36 000 281 600 14 410 20
2001 385 000 42 000 427 000 13 857 143
2002 360 300 45 850 406 150 14 547 53
2003 308 750 54 750 363 500 18 410 90
2004 250 000 55 800 305 800 20 760 75
2005 324 000 60 000 384 000 25 915 110
2006 422 000 60 500 482 500 34 160 40
2007 395 000 63 500 458 500 35 190 70
2008 365 000 66 000 431 000 39 925 75
2009 390 000 75 000 465 000 49 925 75
13

Cambodia’s inland fishing activity is organised in three levels namely family scale (subsistence), middle-
scale (artisanal) and large-scale (industrial) fishing. The family scale fishing is round year fishing by the
use of harpoon/spear, small gillnet, single hooked line and bamboo traps. The fishing season for the
middle and large scale fishing is between October and May. The middle scale fishers use seine net,
gillnet, cast net, hooked long line and bamboo traps. Whereas the large scale fishers use bagnet,
bamboo/wooden barrage, bamboo fence and traps. The average size of the crew involved in the family
scale, middle scale and large scale fishing are between 1-3, 3-6, and 50-80 crews respectively. The family
scale fishery is as important as the middle and large scale fishery because it contributes a large share of
the inland capture fishery of the country and it provides daily nutrition, employment opportunities and
income to millions of poor fishers and farmers. In Cambodia around 39 % of households are involved in
fishing activities.
There are several fish species in the country, carps and catfish are among the commonly cultured
species. Whereas, frogs, small fish, crabs, snakes, shrimp, fingerling and crocodile are among the pond
and rice fish cultured species.
3.2 Fish processing
Cambodia’s freshwater and marine capture fisheries have been processed by traditional and modern
technology. Most of the products from traditional processing are supplied for domestic consumption,
whereas the modern processing supplies both domestic and export markets. The traditional processing
can be classified into three forms namely small, middle and large-scale. According to FiA (2009), 44,500
tonnes of fish and fisheries products were processed in Cambodia and 54 % was exported. The exported
fisheries products were dry-salted fish, smoked fish, fish paste, fermented fish, fish with ice, fish, shrimp,
crab, squid frozen, dried fish etc.
Small-scale fish processing is an activity of households living near the river, fishing lots, lakes, and also in
upland areas. The processed fish is mostly consumed with in the family and some of the processed
fishery products are fish paste, fish sauce, dried salted fish and smoked fish. Middle scale fish processing
is usually owned by households and they are involved in processing dry-salted fish, smoked fish, Pha-ork
(fermented fish), marm etc. There is high demand for sun-dried fish for animal feed and its production
increased in the past few years. In addition, it is exported to Vietnam. Large scale processing is generally
operated by fisheries enterprise and fish source fagenty. They usually employ 40–60 labours, mostly
ladies who are involved in the activities of transforming fishes into dry-salted fish products, ordinary fish
14

pastes and boneless fish pastes (with high value), Pha-ork (fermented fish), and smoked fish. These
enterprises operate in open season, especially high seasons i.e. from January–February and May–June.
Apart from the traditional processing there are industrial or modern processing facilities owned by
private companies and foreigners, but they are operated under the supervision of the government,
which are represented by fisheries company (KAMFIMEX). There are four processing plants (enterprise)
in Cambodia and they can export to different nations. In addition, there are some small freezing facilities
that undertake contract processing mainly for traders (for example, the state-owned trading company
KAMFIMEX). Some of the products produced from inland fisheries include fish paste, fermented
fish/steamed fish, salted dry fish, smoked fish, fish sauce, dried fish use for animal feed. Whereas, the
products of marine fisheries are salted dry fish, steamed fish, dry shrimp, squid, slingay, processed
shrimp, crab meat, salted carp ,trey bourb, and dry black sea cucumber.
According to one processing company representative (processing plant in Sihanouk Ville) the fish prices
(for the exports in the year1999) are set by the importers in Hong Kong at USD0.80/kg, which is
extremely low for shrimp and squid.
3.3 Transportation
In general, fish and fisheries products are transported by different means through water, land and air.
Transportation via water includes fish cages with large boats, tank boats and sculls; via land includes
trucks, cars, motorbike, horse cars, oxcarts and bicycles; and airplanes.
3.4 Final consumption
In Cambodia, marketing and distribution networks are well developed for inland fishery products. There
are small and middle scale fish traders in the country’s fisheries sector. The fish export of the country
between the years 1995-2009 is presented in table 3, in addition to the figures in table 3 there are
unreported exports to neighbouring countries. The highest export was in 2005 followed by 2000, 2006
&2009, and 2008. The main export markets are Thailand, Vietnam, Singapore, Malaysia, Hong Kong,
China (live fish), Taiwan, Japan, United States (big market for frozen fish, fish fillet, fish boil and salted dry
fish) and Australia.
15

Table 3: Cambodia fish export in tonne
1995 2000 2005 2006 2007 2008 2009
Inland fishery 15,628 26,972 23,660 19,500 10,550 12,450 11,500
Marine fishery 8,188 16,628 28,340 10,500 13,550 12,550 18,500
Total 23,816 43,600 52,000 30,000 24,100 25,000 30,000
Table 4 presents the buying and export price of some important fish species, where Marbled sleeper
(live) has the highest export price (34.95 USD/Kg) and the average export price of the different species is
around 5.28 USD/kg. Apart from export there is high domestic fish consumption, a study conducted by
Mogensen (2001) stated that the daily fish and other aquatic animal consumption is around
79g/capita/day. The other aquatic animals include crab, shrimp, frog, beetle, snail, snake, and other
small aquatic products found in the rice field and in the floodplains.
According to a study conducted in 2002-2003 households are divided into five groups based on the value
of gear owned. First, groups with a gear worth less than USD15; second gear worth between USD15–
100; third USD100–200; fourth USD200–300; and fifth over USD300. Households owning a high value of
gear tend to have high annual catches in both open and closed seasons. In addition, farming households
consumed a greater portion of the catch at home (29–39 %) compared with fishing households (11–25
%).
Table 4 the buying and export price of some important species from all sample traders
Name of species Quantity
Average buying price
Average exported
priceKhmer name English name (kg) % USD/kg USD/kgDamrey (live) Marbled sleeper 1,140 0.76 22.34 34.95Damrey (fresh) Marbled sleeper 210 0.14 8.00 23.20Promah Small-scale croaker 450 0.30 11.33 12.72Khya NA 270 0.18 9.41 10.26Kes Common sheatfish 4,570 3.05 7.04 7.92Kchoeung Frecklefin eel 640 0.43 5.69 6.55Sanday Great white sheatfish 4,080 2.73 4.97 5.72Ta aun Whisker sheatfish 50 0.03 4.50 5.30Ruschek Speckled horseface loach 2,600 1.74 4.25 5.25Tanel Truncated estuarine
catfish200 0.13 4.00 5.00
Ta aun NA 3,000 2.00 4.20 4.66Kray Clown featherback 60 0.04 3.63 4.33Slat Bronze featherback 4,106 2.74 3.49 4.08Krormorm NA 70 0.05 3.18 3.83Kray Royal featherback 30,450 20.34 3.50 3.83
16

Chhdaur Giant snakehead 11,225 7.50 3.30 3.53Raws Chevron snakehead 26,475 17.68 2.85 3.34Chhlonh Chhnoht Peacock eel 5,712 3.82 2.66 3.17Chhlaing Yellow mystus 5,090 3.40 2.08 2.65Kanchrouk Chhnoht Tiger botia 3,000 2.00 1.50 2.50Other 46,320 30.94 1.28 1.63 Total 149,718 100.00 4.26(1) 5.28(1)
Note: (1) average buying and exported price of all fish species
3.5 Market structure
The main players of the fisheries marketing system comprise fishes, collectors or middlemen/women, whole
seller s, semi whole seller s, retailers, exporters, fish processors and final consumers, see figure 3. The
fishermen play a role as workers, and is either part or full time involved in small-, medium- or large-scale
fishing. The fishermen, fishing lot owners, dai fishing owner, local collectors and local fish processors operated
without any organised information system regarding prices, market demand or annual catch volumes.
The whole seller s/distributors are the main traders and providers of the capital to most of the fishermen in
both medium- and large-scale fishing. Whole seller s tends to represent an important part of the marketing
chain, in which often major quantities of fish are channelled through them. Whereas, semi-whole seller s
are those fish traders who have a permanent stall inside/outside a market, whereby fish is brought by
middlemen or whole seller s and sold to them in the market. Semi-whole seller s act sometimes as retailers,
but they usually have an additional function in distributing fish to small retailers who sell fish at local markets
to consumers and processors. The retailers are those who sell fish in markets directly to consumers or
restaurant owners – in many cases they have a permanent stall inside or outside the market. But there are
also retailers who are itinerant traders in which they do not have a permanent stall but sell from a basket or
another container by moving from place to place. However, the market for marine products is relatively small,
and marketing channels for marine products are not particularly well developed.
17
Fishers/ lot/dai owners/ cage/pond owners
Collectors/middlemen
Semi-whole seller s
Retailers
Consumers
Whole seller s
Fish processors/Fagenty
Exporters

3.5.1
Figure 2: Inland fishery value chain with all stakeholders involved, Cambodia.
3.6 Fishery regulations
There are many laws and regulations in the fisheries sector to improve fisheries management,
conservation, development and sustainable fisheries resources utilisation. Those regulations include law
on fisheries, statement of the royal government of Cambodia on national fisheries sector policy, royal
decree on community fisheries establishment, sub decree on releasing and abolishing fishing lots, sub
decree on community fisheries management, proclamation on community fisheries guideline,
proclamation on community fisheries registration, national fisheries management plan, community
fisheries management guidance, five years strategic plan (2007–2011; community Fisheries
Development office), and fisheries development action plan. The FiA is a government authority, which is
responsible for the management of fisheries resources that are based on the fisheries policies and
fisheries law (KoC, 2007). FiA’s responsibilities involves licensing, enforcement of regulations, research
and community fisheries management.
18

The state recognises the fishing rights of family scale for subsistence year round, imposing restrictions
mainly on the fishing efforts; for example, type of gear and mesh size. Small scale fishing has open access
to fishing ground outside dimension of fishing lot and does not require a license. Middle-scale and large-
scale fishing are allowed only in the open season. Middle-scale fishing requires licenses issued by the
FiA. Medium-scale fishers can operate only in the open access areas of the fishing domains. Finally, large-
scale or commercial-scale fisheries or fishing lots are based on “lots”. The rights to operate each fishing
lot are given through a fishing lot auction system, and are resumed every two years through this auction
system.
3.7 Data availability
Currently, the data for the value chain of five specific selected fish species for the study are not available.
However, time series data of quantity and price at the farm gate of selected species will be available
from Dai fisheries, which are collected by MRC during 2005–2010. Thus, the whole seller and retailer
price of selected species will be used. These data was collected via field survey i.e. individual interview,
focus group discussion and key informant interview.
19

4Canada
4.1 Fish production
Fisheries is not a large sector of the Canadian economy accounting for just under 0.015% of GDP in 2006
but on a local level, for both the east and west coasts of the country it is important for employment and
income. Canada’s fisheries are categorised under two headings, only for the study at hand, namely
commercial and aquaculture. The difference between the two production methods is heterogeneity and
risk. Aquaculture production generates a homogeneous (i.e. in Canada primarily Atlantic salmon)
product under industrial production conditions, whereas, commercial fisheries harvest numerous
species with large variations in harvest volume and quality. Figure 4 shows the volume and value of
commercial fisheries and aquaculture production over the period 2006-08. Commercial landings show a
steady decline over the period but value of landings is relatively constant. The decline in landings can be
attributed to the decline in finfish harvest, whereas, value has been maintained by increased harvest and
price received for lobster and snow crab. This contrasts with aquaculture where volume of production
has been mostly stable although its value has declined over the period.
The largest value share of total commercial and aquaculture production is from shellfish harvest.
Shellfish harvest amounted to about 58% ($1.5 billion) of total Canadian fisheries landed value. In 2008,
finfish harvest was second in landed value with 31% of total value of landings. This is mainly due to high
value of salmon production. Ground-fish harvest is third in ranking after shellfish and finfish production
in terms of economic value. Total ground-fish landed value was about $253 million or 10% of the total
Canadian fisheries.
20

Figure 3: volume and value commercial harvest and aquaculture production
Table 5 and 6 indicate the summary statistics for marine fisheries landings and aquaculture production
by major species. Shellfish harvest deserves the closest attention since it captured 48% of the total
commercial (marine) landed volume as well as 79% of the total commercial landed value in 2008.
The main shell fish species include lobster, shrimp, scallop, queen crab, other crab etc. Among the
valuable crustacean’s species, lobster had the highest average landed value per kg at $10.52, queen crap
had the second highest at $3.80/kg and finally, shrimp received only $0.46/kg.
In 2008, the percentage of total Pelagic and finfish landed quantity was 26% and the main species were
herring, mackerel, capelin, swordfish, tuna, eel, salmon and others. The highest average price was
recorded by Swordfish ($6.36), tuna ($6.33), eel ($4.70) and salmon ($4.01) respectively.
In the case of ground fish the main species include cod, haddock, redfish, halibut, hake and etc. In 2008
the average price of redfish ranked first ($11.57) followed by halibut ($6.74).
Table 5: Marine Fisheries Landings, by major species (2008)
Major species groups
Landed quantity (tonnes)
% of Total landed quantity
Landed value (thousands)
% of Total landed value
Groundfish 221751 24% $253,111 14%Pelagic & finfish 238677 26% $123,270 7%
Shellfish 442625 48% $1,450,547 79%Other 15071 2% $15,732 1%Total 918125 100% $1,842,661 100%
In the case of aquaculture production in 2008, finfish accounts 78% of total landed quantity having a
landed value of $670,462,000. Whereas, shellfish accounts 8% of the total landed quantity – see table 6.
21

Table 6: Aquaculture Production, by major species (2008)
Major species groups
Landed quantity (tonnes)
% of Total landed quantity
Landed value (thousands)
% of Total landed value
Finfish 113384 78% $670,462 91%Shellfish 30715 21% $56,725 8%
Re-stocking 585 0% $8,880 1%Total 144684 100% $736,067 100%
Figure 5 reports value and total harvest of aquaculture production for the period 2006-08. Overall, total
production declined by about 19% over the period. Finfish species historically constitute between 75 to
78% of the total farmed species with 22 to 25% for shellfish production. Farmed shellfish averaged $1.85
per kg less than finfish ($5.90 per kg) in 2008.
Figure 4: Aquaculture Landed Value and Volume, 2006-08
Income and employment
The Canadian fishing industry is good source of employment and income, in order to see the
employment opportunities in each sector the Canadian fisheries can be categorized in to three groups;
commercial fisheries, aquaculture production and processing industry. Table 7 reports employment by
category for the years 2007-08. Marine fisheries showed an increase in numbers of fish harvesters and
crew of 9.48% over the period representing just over 58,000 individuals in 2008. Keep in mind that this
number represents part time or seasonal employment and full time equivalent is about 10,000
individuals. The number of people involved in aquaculture is very much smaller compared to fish
22

harvesters but this is a growing sector of the industry and shows impressive growth in employment up
over 20% in 2007-08. The seafood products preparation and packaging sector is large but declining in
employment importance. This sector lost over 2,500 employees over the two year period 2007-08.
Nevertheless, the impressive growth in aquaculture helped increase employment in the overall fishing
sector by 3.5%.
Table 7: Employment by industry, Canada
2007 2008 % ChangeCommercial fish harvesters and crew1 48,239 52,812 9.48%Aquaculture operations1,3 3,970 4,900 23.43%Seafood product preparation & packaging2 30225 27641 -8.55%Total 82,434 85,353 3.54%Source: 1. Canadian Fisheries Fact 2009 Report by DFO, 2. Cansim, Table 301 – 0006, 3. Based on the most recent data (2006) and 2008 is from another DFO's report “socio economic impact of aquaculture in Canada"- only direct employment in the industry.
4.2 Fish processing
The fish processing industry prepares the fish for final market. Compared to other industries in Canada,
this industry is not large generating 0.4% of GDP in 1999. The process involved includes eviscerating,
skinning, filleting, breading, pre-cooking, blanching, canning and other methods of preparing fish.
Industry Canada defines the principal activities as:
Canned fish products, manufacturing; Clams, processed; Crab, canned, manufacturing; Crustacean processing; Fish and chip dinners, frozen, manufacturing; Fish cured, manufacturing; Fish dinners, pre-cooked, frozen, manufacturing; Fish fillets, steaks, blocks, etc., manufacturing; Fish liver oil extraction, crude, and manufacturing; Fish meal, manufacturing; Fish roe, processed, manufacturing; Fish, chilled or frozen, manufacturing; Fish, processed or prepared, manufacturing; Fish, salted or dried, manufacturing; Irish moss, processed; Lobster, processing; Marine animal oil extraction, manufacturing; Mollusc processing; Oyster canning; Ready-to-serve frozen fish products, manufacturing; Seaweed processing;
23

Shellfish canning, manufacturing; Shellfish, processed or prepared; and Smoked fish, manufacturing
In 1998, the processing industry represented about 5.5% ($2.9 billion) of total food manufacturing
shipments in Canada. The raw supply of fish is provided by salt water, fresh water and aquaculture
fisheries. The latter is primarily sold with minimum processing and exported. The processed product is
sold to wholesale or export markets.
The fish processing industry is dominated by few large firms with many outlets and a large number of
small independent firms. The eight largest firms in the industry handle about 30% of processed output
(Industry Canada, 1995). There are about 400 firms in this industry with 60% in Atlantic Canada, 35% in
BC and the remaining in Quebec. According to Industry Canada the fish processing industry has been in a
state of flux since the decline of the East Coast ground-fishery. Production has shifted from ground-fish
species to shell fish and imported fish stocks.
4.3 Final consumption
International trade is a fundamental component of Canadian fisheries with some 80% of harvest
exported. In this situation it is not unreasonable to consider the export market the final market of sale
for Canadian fish products. Retail fish prices in Canada will reflect the export price. Table 8 reports the
value of fish product exports for the years 2006-2009. Total Canadian fish and seafood exports showed a
small increase up to 2008 but the world wide recession forced a decline in export value in 2009. In total,
exports reached $3.6 billion in 2009 after a 6.4% decrease compare to the previous year. Fish and
crustaceans exports carried the highest share, 89% while preparations of fish and seafood recording a
9.5% share of total Canadian fish and seafood exports in 2009. Canada exports to USA, Japan, China,
Hong Kong, UK, Russia, France, Denmark, Germany, South Korea and other.
Table 8: Total Canadian fish and seafood exports (m $)
Product 2006 2007 2008 2009 % of total
export
% Δ in Exports (08-09)
Fish and crustaceans
$3,481,353 $3,369,921 $3,378,263 $3,222,433 88.8% -4.61%
Preparations of fish and seafood
$522,257 $433,798 $426,233 $343,864 9.5% -19.32%
Source: Agriculture and Agri-Food Canada
24

4.4 Market structure
The market structure of Canadian fish sector involves different agents including wholesalers and
retailers. The retail fish sector in Canada represents only 20% total finished product with the vast
majority of finished product going to the export market. With open markets for fish, prices in the retail
sector reflect world fish prices.
Food retailing in general is a large and complex sector that includes supermarkets, grocery stores,
restaurants and fast food operations. There are about 24 thousand retail stores and close to 63 thousand
foodservice establishments in Canada, with total consumer sales of $131 billion in 2005.
Fresh fish does not warrant a separate category in Industry Canada’s retail food breakdown and it is
aggregated under a category labelled ‘other fresh meat’. This category shows an annual value percentage
change of 1% over the period 2005-2007. Frozen fillets, on the other hand, show an annual value
percentage change of 18% for 2005-06 and 13% for 2006-07. Surprisingly frozen fish and chips, for the
same period show a decline of 21% and 10% in value, respectively. Canned tuna fared better but still
registered a decline over the period of 2% and 1% in value, respectively.
4.5 Fishery regulations
In this section the procedures and regulations used in managing Canadian fisheries are briefly presented.
Canada, with coasts to three oceans, holds an important position in world fisheries. Comprehensive
regulations in the domestic industry are enforced to ensure sustainability of harvest. After setting the
total allowable catch (TAC) for each species regulated, DFO allocates harvest shares according to inshore
and offshore areas, vessel length, gear type and geography. From this allocation harvest is regulated
using both individual quota and non-individual quota policies.
In practice, depending on circumstances there are several different forms of individual quota in use in
Canada. In some cases, individual quota units are transferable from one harvester to another. Such
individual transferable quota (ITQ) schemes use the market mechanism to ensure efficiency in the
regulatory process. However, in many cases restrictions are imposed on transferability of quota and the
quota or individual vessel quota (IVQ) is tied to a specific vessel. In each case, the vessel holding the
quota has property rights over a certain share of the TAC. Quota can also be assigned to a specific
enterprise, or enterprise allocation (EA) quota. To support quota regulations alternative policies are used
for the management of some species such as lobster on the east coast and wild salmon on the west. For
lobster regulations are based on size and sex of the lobster. For salmon it is common to set a TAC and
25

allow a competitive fishery to fill the total allocation.
Aquaculture is a relatively new and developing industry. Its potential is in the fact that the market not
nature drives success or failure. Government regulation governs health and safety but management is
left to the firm. Government regulation is particularly concerned with environmental impacts of
production. Growth potential for this industry is based on the availability of abundant coastline and
expected increase in seafood demand in North America by 40% by 2010.
26
5Ghana
5.1 Production
Ghana has an area of 238,538 km2 and it borders with Cote d’Ivoire in the west, Burkina Faso in the north
and Togo in the East. Ghana abounds with water and around 10% of the entire land surface of the
country is covered with water. Thus, the potential for the fishing industry is immense. The country’s
capital is Accra and the other major urban centres include Tema, Kumasi, Tamale and Sekondi –Takoradi.
Both Tema and Sekondi- Takoradi have modern and well-constructed fishing harbours.
The fishing industry in Ghana supports the livelihood of about 10% of the population. The importance of
the fishing industry stems from the significant contribution of around 60% of the national protein supply
and around $87 million exports in 2009. Fish and sea food account for 16% of total household spending
on food.
Ghana’s fish production fluctuated in 1971-2010, refer to figure 6. The country’s fish output increased
appreciably in the late 1960s, thus the marine fish caught between the year 1967-1972 increased from
around 105,100 to 301,762 tonnes. In 1982, the yield was composed of 199,100 tonnes of marine
varieties and 35,000 tonnes of freshwater fish from Lake Volta. In the years 1988, 1991, 2001 and 2009
the fish catch was 302,900; 289,675; 352,722 and 317,446 tonnes respectively. The average fish catch in
the year 2000-2010 was 326,000 tonnes and the general fish landing in the country is presented in figure
6 where it reached its peak in the mid 1990’s.
In the case of the country’s fish stock; although poaching by foreign vessels was noted by Clark (1994) to
have seriously depleted fish stocks in Ghana's 200 mile Exclusive Economic Zone, tuna stocks reportedly
remained unaffected. It was also identified using a super-sampling scheme (SSS) in 2003 that the stock
of small Yellowfin and Bigeye tuna had improved considerably leading to improved stat istics in tuna
stock in general.
27

Figure 5: Ghana fish Landings (tonnes) Source: Data from Fisheries Commission
The type of fisheries in Ghana can be classified into seven categories namely marine, artisanal, inshore,
industrial, lagoon, and inland fisheries. However, the data available from the Fisheries Commission does
not explicitly include lagoon fisheries. Inland fisheries cover fish production from Lake Volta,
aquaculture, dams, other lakes and lagoons. Nonetheless, fishery statistics are collected only from Lake
Volta and aquaculture. Ghana’s marine fisheries incorporate diverse fish species. The country’s marine
catch is dominated by pelagic fish i, Round Sardinella, Flat Sardinella, Chub Mackerel, Anchovy, Frigate
Mackerel, Seabreams, Burrito, Scad Mackerel, Cassava Fish, Tiger Fish, Cuttlefish, Soles, Red Mullet,
Hake, Yellowfin, Bigeye, Skipjack, Black Skipjack and other tuna type fishes. In addition, the major
demersal fish species are lujanidae (snappers), serranidae (groupers), and polynemidae (threadfins).
Generally, the tuna catch is dominated by skipjack or black skipjack though the catch of Bigeye and
Yellow fin are significant.
The marine and inland fisheries have had a wide variety of vessels and every four years or so the
Fisheries Commission performs a census of the fleet structure. As indicated in Table 9, operational
fishing vessels in 2000 were dominated by canoes (97%) and around 58% were motorised canoes.
Whereas industrial fishers and tuna vessels together made up about 0.9% of the total number of
operational boats (11,542). Across the period 1996-2009, semi-industrial motor boats showed the most
variation compared to other boats.
28

Table 9 Shares of operational fishing vessels in Ghana (% Share of Fleet)
Vessel Type 2000 2001 2002 2003 2004 2005 2006 2007 2008 2009Inshore 1.88 1.74 1.49 2.26 2.19 2.08 2.20 2.00 2.08 1.96
Industrial 0.52 0.44 0.46 0.46 0.48 0.42 0.57 0.53 0.50 0.53
Shrimpers 0.03 0.03 0.02 0.02 0.02 0.02 0.02 0.00 0.00 0.00
Tuna vessels 0.38 0.32 0.35 0.36 0.32 0.23 0.28 0.29 0.29 0.29
Tuna carriers 0.03 0.04 0.05 0.00 0.02 0.02 0.02 0.02 0.02 0.02
Canoes 97.15 97.43 97.63 96.90 96.97 97.24 96.92 97.16 97.12 97.20Motorised Canoes
57.98 51.31 51.41 51.03 55.36 55.52 55.33 55.47 55.44 55.49
Source: Fisheries Commission
As stated above, there are several species in Ghana’s water bodies but tuna and tilapia are the two
species chosen for this study. Tuna is of major commercial importance due to its export revenues, its
availability and proven sustainability of its catch. In the case of tilapia, it has immense domestic demand
for both fresh and locally processed variants.
5.1.1 Tuna
Ghana’s tuna fishery is essentially a marine capture activity in which the artisanal sector plays a minor
role. Tuna catch is done through highly commercial modern sector using deep sea fishing vessels. The
country’s sustainable tuna catch has been estimated at 100,000 tonnes annually by the Fisheries
Commission but recent tuna catch has been much lower than this threshold. Tuna vessels operating in
the Ghanaian waters are restricted to 50-75m deep water, though they stray frequently into shallower
waters. The number of tuna vessels in the country ranges from 37-45 and the last available figure was
collected in 2009; where there were 43 tuna vessels out of which 34 were considered operational. The
fishers made use of either purse seine or pole and line with live bait (anchovy) to land tunas (skipjack,
yellow fin and bigeye).
The tuna species include yellow fin, begeye, skipjack, and others. In terms of the total tuna catch,
production has generally increased by about 20,000 tonnes since 2000 with peaks in the year 2001, 2005
and 2007- see figure 7. The highest tuna export was recorded in 2001 and the period since 2002 has
indicated consistently high exports of Tuna of over 40,000 tonnes. This may be one of the positive effects
of the enactment of the Fisheries Act of 2002 (Act 625). Tuna exports are mainly in terms of canned tuna
though some fresh or frozen tuna is exported.
29

Figure 6 Tuna Production in Ghana (in MT)Source: Fisheries Commission data
In the artisanal fishery, tuna is not a major catch because tuna is usually outside the fishing range of
artisanal fishers. Tuna that are landed are usually of smaller size or juveniles and it’s sold in the landing
sites. At a later time, the traditional tuna processors smoke and sell it to the market women or retail it
by themselves. In most cases, tuna is sold by size and the price depends on the bargaining power
between the fishers, processors and traders. Nevertheless the lack of good storage facilities put fishers
to the lower end of the bargaining power scale, placing traders on top.
Some traditional tuna processors also acquire tuna from the tuna firms who have their own fleets. The
artisanal price data for tuna was not reliable as it was based on size and bargaining power, in addition
the modern companies in the tuna sector did not provide price data. Most of the data is collected from
the Fisheries Commission Research Department and through visits to three landing sites at La, James
Town and Tema. The visits revealed the absence of organisation or responsible body for managing the
landing site, however there is fishers association in each site. The James town and La associations
claimed to have existed for over two hundred years and their main role is to be the interface between
fishers and traditional authorities, government and other institutions.
5.1.2 Tilapia
Most Ghanaian tilapia is caught by artisanal fishers and most of the catch is salted and dried or smoked,
and it heads to the domestic market. In 2010 tilapia production from fish farms was around 10,000
tonnes. This figure was based on the data obtained during the field survey at various cage farms in Volta
30

Lake. Tropo Farms, for instance, indicated the production of 3000 tonnes of Tilapia in 2010. In the case of
capture fishery, it may produce an average of 100 tonnes per year from the major landing sites of
Dzemeni, Abotaose, Kpando, Kete Krachi, Yeji, Kpong, and Asutuare. The country’s handling and storage
of fish is generally considered to be poor.
Fish prices of fishers per basket ranged from GH¢2.50 to GH¢6.00 depending on fish sizes, no weighing is
used in the selling of tilapia. Fishers in all cases stated that they earned more than half of their income
from selling tilapia. Usually tilapia was sold to women traders and fish processors who then resell it to
the public. Processing and trading of fish was essentially a female-dominated activity and the processors
claimed to buy fish per basket where the weight of the standard basket of tilapia was about 10 kg. Most
fishers use a combination of wooden traps, nets, hook and line to catch tilapia. However, nets are used
more frequently.
Aquaculture is essentially not a marine activity in Ghana, and production is mainly concentrated on
tilapia and catfish. Tilapia is the major species and constitutes over 80% of aquaculture production. The
catfishes (Clarias sp, Heterobranchus sp) and Heterotis niloticus account for the remaining 20%.
Internal demand for these fish species is very high, thus there are virtually no exports of fresh tilapia or
catfish. On the other hand evidence from the Customs Service at the Kotoka Airport indicates that some
smoked catfish and salted tilapia (koobi) are exported to the EU and USA. Although fish production from
aquaculture has been growing steadily, its contribution to the national economy has not been fully
researched thus; its importance is not fully recognised.
In this project’s survey, three types of tilapia producers were identified namely large scale, medium scale
and small scale farmers. Additionally, the types of culture include ponds, pens and cages. The large scale
farmers use cage culture and produce over 500 metric tonnes of tilapia per annum. They mainly
concentrate on tilapia and have fully commercialised operations with their own hatcheries, cold chain
network, feed production and labour with all the needed skills. The second tilapia producers are the
medium scale farmers and they buy fingerlings from Tropo Farms, Tilapia Farms and other sources. In the
case of feed, they buy it from importers and also produce some of it by themselves. The last tilapia
producers are the small scale farmers which produce up to 50 tonnes of tilapia per year. They usually
depend on the larger farms (although some are produced by the CSIR at Akosombo) for their fingerlings
and technical advice. Most of the small-scale fish farmers consider fish farming as their secondary
income.
The future for aquaculture is rosy given the growing domestic demand for tilapia though the potential
31

has not been fully utilized. Areas identified to be of potential beneficiaries of aquaculture in Ghana
include communities where the practice takes place, the transport industry, suppliers packing the
product, and processing companies of both the fish itself and its waste (being used as a supplement for
chicken feed).
The major problems highlighted by fishers include poor canoes, high cost of outboard motors, clearing of
weeds from the lake, clearing of tree stumps, the use of nets with small mesh sizes, illegal fishing
methods and lack of credit to finance fishing trips. In terms of value chain governance, the project’s
survey indicated that processors and traders had more market power than fishers, and buyers dictate
the price.
5.2 Processing
The absence of cold storage facilities in the landing sites makes the activities of processors very
important in the tilapia value chain. There are five traditional ways of processing tilapia and these are
salting, drying, smoking, frying and fermenting. The industrial processing of tilapia is not done in Ghana.
Tilapia in its fresh form has to be sold within three to twelve hours depending on the temperature to
prevent spoilage. The most common form of processed tilapia is the one which is salted and dried;
popularly known as “Koobi” in Ghana and around 80% of tilapia supplied to the market is in this form.
Koobi is sold according to its size and common agreement among fish sellers in a market. The absence of
cold storage in the fishing industry makes the distribution of fresh tilapia limited to a few kilometres
from the fish landing site.
The main problems associated with tilapia salting and drying are hygiene and cleanliness. The salted fish
is placed on poly-sheets to dry in the best cases, straw mats, trays, or by the road side in some cases.
During the initial stages of drying, flies and other insects are all over the fish. In addition, there are no
specific drying sites and control of processed fish for levels of contamination is non-existent. In the case
of smoking, it is usually done near the landing sites and transportation cost is minimized. However,
traders who purchase from the fish farms arrange their own transportation. One common theme among
processors was the lack of storage facilities for processed fish.
The fish processors have different source of income and the percentage of their income which is directly
associated with fish processing ranged from 15 to 100%. However, around 50% of the fish processors
income generates exclusively from fish-related activities.
In the case of tuna fishery, there were three major commercial processors based in Tema. These are
32

Pioneer Food Cannery Ltd, Myroc Foods Ltd, and GAFCO (Ghana Agro-Food Company). These companies
buy most of the industrial tuna catch and process it into tuna flakes, tuna chunks and tuna mash which
were canned and mostly exported.
5.3 Transportation
Transportation plays a major role in the fishing industry. In Ghana, for traditional traders/processors,
transportation depends on the distance of the market from the fish landing site. Transport prices are
negotiated between the agents or actors involved as there is no standard charge. Traditionally, fresh or
processed fish is transported by head portage or wooden market trolley (push truck) to the processing
site or the market. Thus, very little transportation costs are incurred but the transportation cost is higher
when trucks are used. About 10% of the actors stated that transportation could take up to one-third of
their gross income from fish processing.
5.4 Market structure
In the Ghanaian tilapia sector there are two value chains namely the artisanal value chain and the
modern urban-biased value chain. In the case of artisanal tilapia value chain the producers (capture
fishers on rivers and lakes) sell their fish catch to traders and/or processors who will in return sell it to
the final consumers- refer to figure 8.
Figure 7: Artisanal tilapia value chains
The second value chain is the modern tilapia value chain (modern urban based) where fish farmers have
their own chain which in many cases utilise cold storage facilities-refer to figure 9. As indicated in figure
33

9, the fish farmers sell to the whole sellers or retailers and the retailers (wholesalers) in return sell it to
consumers. In some cases, the producers sell directly to the final consumers who come to the landing
sites or fish farms.
Figure 8: the modern urban-based tilapia value chain in Ghana
The results of the survey which was conducted by Hihelgo (2008) in 2003-2004 are presented in table
16. The data consists of information on the average net income and expense of three fish farmers
associations producing catfish and tilapia at different locations in the western region of Ghana. The
three regions are Sefwi, Dumkwa and Wassa West and the total income of these region was estimated
164,838,300 Cedis. Thus, an estimate of net income of 77.4 % was made from aquaculture making it a
highly profitable activity- see table 10. In 2011 the discussions with officials of the Fisheries Commission
and Fishing Associations put the gross profit margin of fish farmers between 75% and 80%, indicating
further support to Hiheglo’s study. In addition, a study conducted in 2010 estimated the internal rate of
return to be around 49% per annum indicating a much higher rate than any financial savings rate.
Table 10: Income and expense data of fish farmers in the Western region of Ghana
Location Sefwi Dunkwa Wassa West Total % of Total
No. Fish Farmers 15 6 13 34No of Fish Ponds 20 8 14 42Total income (in Cedis)
80,052,500 1,076,800 83,0709,000 164,838,300 100.0 %
Labour Costs 1,856,360 1,635,000 1,181,900 4,673,260 2.8 %Stocking Costs 3,565,500 290,250 6,790,000 10,645,750 6.5%Fertilizer & Nutrients 248,000 0 2,044,000 2,292,000 1.4 %Cost of Feed 1,975,000 348,000 3,635,980 5,958,980 3.6 %Other Costs 850,000 0 5,608,000 6,458,000 3.9 %Total expense 9,882,860 2,293,250 25,005,880 37,181,990 22.6 %
Net income 70,169,640 -1,216,450 58,703,120 127,656,30 77.4 % Source: Hiheglo (2008) pp. 29. Note: all costs are in Cedis with C10,000.00 = GHC1.00
34

5.5 Regulations
The fishing sector had its first regulatory law in 1946 which was the Fisheries Ordinance, Cap 165, enacted by the colonial government. Other legislation and regulations related to the fishing sector since 1964 include:
1. Wholesale Fish Marketing Act passed in 1963 2. Fisheries Act 19643. Fisheries Regulations LI 364 of 19644. NRCD 87 of 1972 (Fisheries Decree 1972)5. Fisheries (Amendment) Regulations 1977 6. AFRCD 30 of 1979 and the accompanying regulation7. Fisheries Regulation 1979 LI 12358. Fisheries Regulation 1984 LI 1294 9. Maritime Zones (Delimitation) Law, 1986 10. PNDC Law 256 of 1991 11. Fisheries Commission Act of 1993 12. Fisheries Act 625 of 2002 13. Fishers Regulation 2010 (L.I. 1968) to give effect to the Fisheries Act 2002 (Act 625) and
prescribed measures for conservation, management and development fisheries and aquaculture in Ghana.
In 1983, Ghana ratified the United Nations Convention of the Law of the Sea (UNCLOS). Kwadjosse
(2009) argues that pre-UNCLOS legislation show little awareness for conservation and replenishment of
fish stock. The legislation before 1984 had their major sections dealing with the building and importation
of fishing craft, manning of boats and licensing issues. The current legislation, Fisheries Act, 2002 (Act
625), was enacted to consolidate all the previous laws on fisheries; to provide for the regulation and
management of fisheries; the development of the fishing industry and the sustainable exploitation of
fishery resources as well as deal with any peripheral issues.
The Fishers Regulation 2010 (L.I. 1968) was passed to give effect to the Fisheries Act 2002 (Act 625). The
Act has 141 Sections grouped under five parts and the parts deal with the establishment of the Fisheries
Commission, management of fisheries, powers of jurisdiction over fishing sector issues and
miscellaneous provisions. In particular, Act 625 provides:
1. Rules and regulations to control industrial, semi-industrial and artisanal fishing through registration and licensing
2. Protection and promotion of artisanal and semi-industrial fisheries through extension services, technology transfer, exemptions, reserved areas for semi-industrial and artisanal fisheries, development of landing facilities, and cooperation among small-scale fish processors and marketers
35

3. Establishment of fishing zones, closed seasons and fishing reserves4. Protection of gravid and juvenile lobsters and other crustacean, juvenile fish and marine
mammals5. Protection of fisheries water from pollution6. Proactive MCS and enforcement through a special unit to work in collaboration with the Ghana
Navy, Air Force, Ministry of Defence and Ministry of Justice for effective policing and prosecution of offenders
7. Arrest, seizure, detention, fining, forfeitures and temporary bans for offending fishing vessels8. Promotion and licensing of aquaculture projects, ensuring that they conform to environmental
laws and specified operational standards 9. Establishment of fisheries development fund to help partially finance the execution of the
fishery development and management strategy and enforce its rules and regulations.
All aspects of the current legal framework have been adequately discussed by Kwadjosse (2009). In
terms of sanitary and health issues relating to fish handling and sales, Food and Drugs Board (FDB) is the
main organisation involved. Its mandate involves ensuring all food products and meets the appropriate
standards of safety and quality through product evaluation, inspection and audit of manufacturing
premises, industrial support services, investigation of consumer complaints and market surveillance
activities. However, it has tended to be concerned about fish imports and not the handling of the
domestic fish catch per se.
FDB certification is needed for fish imports, cold storage facilities and industrial fish processing sites.
They also, to some extent, control the licensing of food service establishments hence they have some
influence in the formal sector on who buys and sells fish. Nevertheless, in most cases, there are no
restrictions on who buys or sells fish. Furthermore, Ghanaian fishers are not allowed to sell their fish
catch in other countries as per ACT 625. The role of the Ghana Standards Board overlaps that of the FDB
in the case of fish imports, since it claims that it is the competent authority mandated to undertake
destination inspection for and on behalf of the Ministry of Trade and Industry.
36

6 Honduras
6.1 Fish production
The Republic of Honduras is part of the Central American Isthmus and has an area of 112,492 km 2.
According to the National Statistics Institute, the population was around 8,045,990 in 2010 where 50.5%
live in urban areas and the rest live in rural areas. The most important sectors of the Honduran economy
are agriculture (coffee, shrimp, tilapia, vegetables and fruits), construction, maquilas and manufacture
(cigarettes, wood products including furniture, paper, board and silver).
Since the early 2000s, the strategic lines of fisheries and aquaculture in Honduras have been shrimp and
tilapia cultures, followed by marine fisheries: Caribbean spiny lobster (Panulirus argus), white shrimp
(Litopenaeus occidentalis) and other varieties of deep-water shrimp in the Caribbean, as well as shallow-
waters shrimp in the Pacific (Gulf of Fonseca), several species of finfish (Caribbean and Pacific) and
queen conch of the Caribbean (Strombus gigas).
The five fishery resources analysed in this study constitute 99,14% of the total fishery production of the
country-see table 11, with the following order of importance: farmed shrimp (71,2%), farmed tilapia
(21%), wild shrimp (3%), Caribbean spiny lobster (2,7%) and finfish (1,3%). The queen conch of the
Caribbean (Strombus gigas) was excluded from the value-chain analysis, which represents 0,9% of the
production volume during the period in question. This fishery has been subject to higher regulations in
recent years, due to the downward trend of their stocks.
Table 11 indicates the decline of marine fisheries production by 187% between 2000 and 2009, while
aquaculture grew by 209% over the same period. The decline in catches is due to the overexploitation of
shrimp and the reduction in finfish and queen conch catches. Although management measures have
been implemented and is expected that these measures will allow recovering the stocks in the medium
and long term, perhaps its effects won’t be displayed in the short term.
37

Table 11 : Honduras Fisheries and aquaculture production (in metric tons)
Fishery type 2000 2001 2002 2003 2004 2005 2006 2007 2008 2009 Contribution
Marine fisheries
5.343,8 3.349,9 3.447,2 2.098,5 2.552,8 2.547,5 2.111,5 2.520,2 2.154,7 1.862,1 7,9%
Shrimp 2.876,3 1.558,3 1.032,1 652,4 853,2 968,5 571,3 771,3 670,6 623,8 3,0%
Spiny lobster 959,8 1.101,0 1.021,9 951,2 1.107,1 958,8 705,0 1.112,3 973,2 716,5 2,7%
Finfish 431,9 277,9 391,2 406,2 592,6 620,2 711,9 517,6 410,9 384,9 1,3%
Queen conch 1.075,9 412,7 1.002,1 88,8 moratorium
moratorium
123,3 119,0 100,0 137,0 0,9%
Aquaculture 13.602,4
18.847,5
22.438,0
29.691,0
33.780,0 38.194,0 46.635,0
43.187,0
38.583,8
41.981,9
92,1%
Farmed shrimp 12.041,0
16.718,0
18.149,0
25.427,0
27.748,0 28.385,0 35.811,0
30.367,0
25.793,1
32.112,8
71,2%
Tilapia 1.561,4 2.129,5 4.289,0 4.264,0 6.032,0 9.809,0 10.824,0
12.820,0
12.790,7
9.869,1 21,0%
Total 18.946,2
22.197,4
25.885,2
31.789,5
36.332,8 40.741,5 48.746,5
45.707,2
40.738,5
43.844,0
100,0%
Growth 17,16% 16,61% 22,81% 14,29% 12,13% 19,65% -6,23% -10,87% 7,62%
The country’s total volume of fish production in the period 2000-2007, the price per tonne and the total
production price is presented in table 12. The average annual volume produced was around 33,793
tonnes and the average annual price was about 11,379 US$. In addition, the analysis conducted by the
FIINPESCA Project for the period 2000 – 2007 indicates that per-capita consumption in Honduras had an
average of 2,12 kilos per person per year.
During the reviewed period (2000-2007), fisheries and aquaculture accounted 5% of the national
economy and 36,6% of the primary sector, with an average value of US$ 384,6 million annually. Although
the sectoral share in the GDP is higher than in other Central American countries, these activities are also
of outstanding importance to Belize (11,3% of GDP), Panama (4,5%) and Nicaragua (4,4%)1.
Table 12: Value of fisheries and aquaculture production in Honduras (at current prices in millions of US dollars)
2000 2001 2002 2003 2004 2005 2006 2007 Annual average
Price per tonne (US$) 10 649,41 10 929,55 10 673,21 10 441,05 11 096,81 11 259,19 12 990,42 12 997,66 11 379,66
Volume production 18 946,23 22 197,38 25 885,25 31 789,51 36 332,78 40 741,48 48 746,45 45 707,15 33 793,28
Production value (million US$)
$ 201,77 $ 242,61 $ 276,28 $ 331,92 $ 403,18 $ 458,72 $ 633,24 $ 594,09 $ 384,56
1 FIINPESCA – FAO / OSPESCA / SWEDEN Project. Macroeconomic indicators of fisheries and aquaculture sector of the Central American Isthmus, period 2000 - 2007.
38
6.1.1 Shrimp farming
Honduras is the largest producer of farmed shrimp in Central America. Between 2000 and 2007 it
produced 44% of the regional volume, followed by Nicaragua (14%), Belize (12%), Guatemala (11%),
Panama (10%), Costa Rica (8%) and El Salvador (1%).The objective specie is the white shrimp of the
Pacific (Litopenaeus vannamei).
In terms of size, cultures bigger than 151 ha are classified as industrial, from 51 to 150 ha are medium-
scale and less than 50 ha are small-scale. The small scale projects are owned by people with some
financial solvency level from different areas of the country, as this is a profitable but high cost activity. In
the case of employment, shrimp aquaculture generates 27 000 direct jobs of which 40% are occupied by
women and it benefits 160 000 people. In addition, it is estimated to create around 120 000 indirect
employments for people involved in the production, processing, transportation and marketing stages.
6.1.2 Tilapia farming
In Honduras, tilapia farming grew 130% between 2002 and 2009. Currently, it is the leading Latin
American supplier of fresh fillet tilapia in the United States market, displacing Costa Rica and Ecuador to
the second and third position respectively. In Central America, Honduras is the second largest producer
of tilapia (Costa Rica 58%, Honduras 26%, Guatemala 9%, El Salvador 6%, Belize and Panama 1%).
The cultured species of tilapia are red (Oreochromis sp.), black (O. mosambicus) and white (O. niloticus)
tilapia. In the case of culture systems, there are intensive in floating cages and ponds, semi-intensive
and extensive ponds.
Regarding employment, there are no consolidated data available but based on the estimates of the
interviewed parties, the industrial and medium-scale fish farming in the central region generates about
6 000 jobs including projects with ponds, floating cages and processing plants. According to DIGEPESCA
(2007), small-scale aquaculture generates around 5 600 jobs, although it is difficult to quantify them
accurately because many farmers and landowners combine fish farming with agriculture and / or
livestock, as they seek to maximise the use of land and water sources available.
6.1.3 Industrial fishing
The resources of major interest for industrial fishing include: spiny lobster (Panulirus argus), shrimp
(Litopenaeus Aztecas, L. duorarum and L. schmitti), finfish fisheries (snapper - Lutjanus spp and grouper -
39
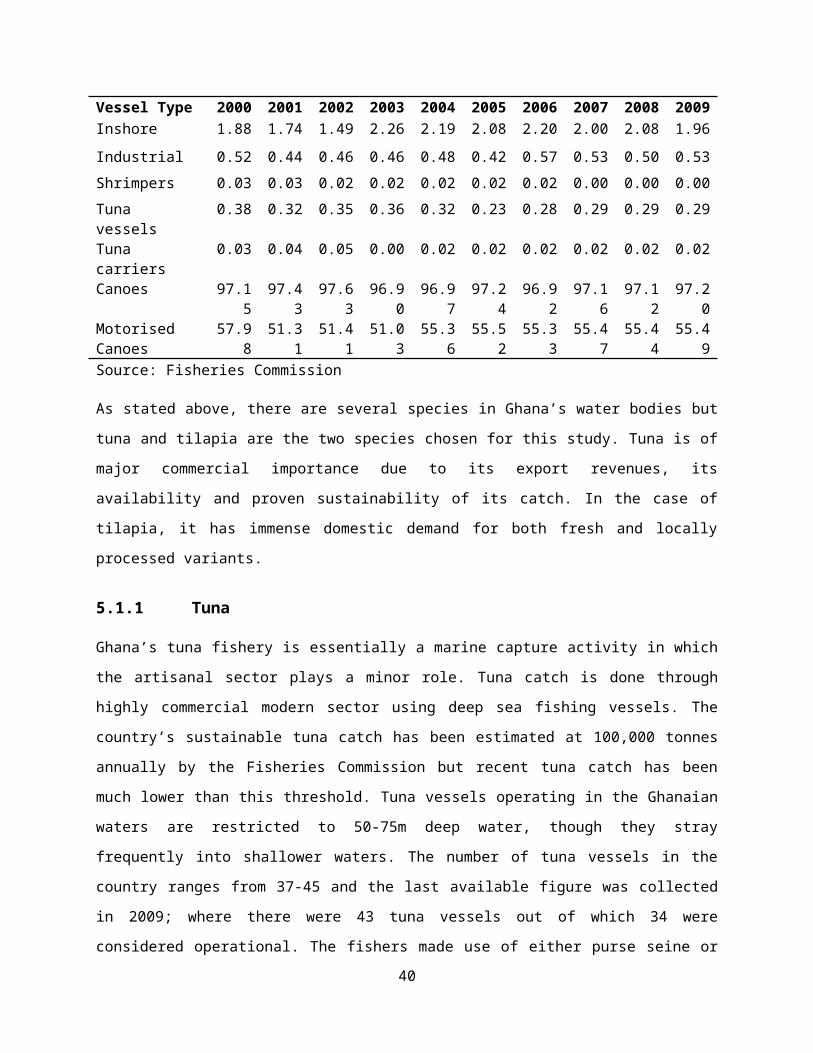
Epinephelus guttatus, among others), as well as queen conch (Strombus gigas).
Regarding fleets, there were 216 active vessels in 2009 based on DIGEPESCA report. The vessels were
composed of spiny lobster vessels with pots (41%), spiny lobster vessels with scuba divers (24%),
trawlers (22%), long-liners (10%) and queen conch(2%).
The industry’s employment generation on board is around 5430 people. In addition, there are 23
processing plants with emphasis on the Caribbean. Each processing plant is estimated to generate
around 86 jobs with 17% full-time and 83% females employed as part-time workers in the processing
area.
6.1.4 Small scale marine fisheries
Small scale marine fisheries develops in the Caribbean and the Gulf of Fonseca, usually within the first
three nautical miles, with basic tools of production: wooden or fibreglass boats from 10 to 25 m in
length, outboard motors of 25, 40 or 75 HP and different gears depending on the fishery (trammel nets,
hand lines, traps and tanks for scuba divers in lobster and queen conch fisheries).
In Honduras there are 17,200 small scale fishers, according to the estimates of FIINPESCA project. The
fishers are dispersed in the Caribbean (63%), in the Gulf of Fonseca (19%) and in inland waters (18%).
The Gulf of Fonseca produces about 50% of the national small-scale fishing; there are about 85
communities with more or less 3 220 fishers and 1 600 boats. Given its strategic importance, since 2003
the Spanish Agency for International Cooperation (AECID, for its abbreviation in Spanish) has been
working in the region with the project "Fisheries Development in the Gulf of Fonseca AECID /
DIGEPESCA" whose main objective is to improve food security through the development of fishing,
processing and marketing of its products through training, quality improvement and equipping of a
market called "Centre of marketing and sanitation of fisheries and aquaculture products in the Gulf of
Fonseca", where works together: fishers, aquaculture producers, informal traders and local authorities
involved in the regulation of prices.
In the case of small-scale fisheries in the Caribbean, since 2005 many fishers have been diversified or
have been converted to eco-tourism to carry national and international tourists in their boats to diving,
fishing, visiting coral reefs and to know other marine attractions. This alternative has proved to be more
profitable than fishing.
6.1.5 Cost structure
In Honduras, there has not been detailed economic analysis about all fisheries and aquaculture.
40

However, the FIINPESCA project between 2007 and 2009 prepared the cost structure and profitability of
spiny lobster and shrimp fisheries in the capture stage. The detailed information on the current status
and profitability of lobster and shrimp fisheries will be presented in this section. This section will also
include the cost structure of shrimp and tilapia farming.
a. Current status of the spiny lobster fishery: The current status of the spiny lobster fishery is
summarised based on three indicators that were analysed in an interdisciplinary way2:
Biological indicator: The fishery is in full exploitation level. It is not sustainable because the effort is
over-dimensioned and data suggest that there are environmental parameters that would probably
affect the proper renewal of the resource.
Social indicator: Only in the capture phase, the fishery generates 4 850 direct jobs. Due to its high
levels of profitability and remuneration for small-scale fishers and crew members of the industrial
fleet, workers are highly dependent on this resource. In Honduras, the indigenous Miskitos
dedicated to scuba diving resist to leave it for lack of other profitable economic alternatives and fast
incomes, which is why it generates a remarkable public and political pressure.
Economic indicator: Spiny lobster fishery is profitable because it is of widespread interest, it
generates significant currencies, it has high international prices and the fishing trips still generate
profit around 35% in the industrial fishing and over 100% in the small-scale fishing. These data is the
result of calculating the average of pots and scuba diving systems, both for the higher and lower
capture seasons. This is one of the most lucrative marine fisheries.
b. Current status of the shrimp fishery: The results of the FIINPESCA Project indicated the
following3 results:
Biological indicator: the shrimp fishery is in a level of overfishing, the stocks have not been
recovered despite management measures implemented for years, which is aggravated for the lower
rainfall that have contributed to reduce salinity which carries sediment to increase productivity. The
impact of climate variability has not been yet proven and it is necessary to evaluate the trend of
environmental variables.
2 FIINPESCA-FAO/OSPESCA/SWEDEN Project. Regional and interdisciplinary analysis of lobster and shrimp fisheries in Central America. January 2009.3 Op.cit.
41

Social indicator: The shrimp fishery generates more employment in small-scale fisheries than in
industrial fishery. Many small-scale fishers have been diversifying their economic activity, but the
crew members of the industrial fleet are more vulnerable if they lose their jobs because they have
minimal access to training programs and to the schemes of subsidiary in periods of shrimp closure.
On the other hand, fish processing plants subsist partly through the maquila of finfish and lobster.
Shrimp fishery contributes to food security through generating income than self consumption.
Economic indicator: shrimp products are for export and domestic markets, although the domestic
markets have grown in recent years. Profitability is affected by the recurrent reduction of the
international prices caused by the strong competition of the Asian shrimp. In addition the fluctuation
in fuel cost affects the shrimp profitability. Shrimp fishery and its by-catch, generates average profits
of 72% to the industrial fishing and 71% to small-scale fishing.
c. Costs structure of shrimp farming
The cost structure of shrimp farming is presented in table 13. Although there is neither updated nor
completed data to calculate the profitability of culture, the data is presented based on industry
representatives interviewed for this study4.
Table 13 : Cost structure of the shrimp farming
Item percentageConcentrated feed 25%Shrimp post-larvae 18%Workforce 20%Electricity 24%Fuels 13%
d. Costs structure of tilapia farming
As in the case of shrimp farming, there is no comprehensive data to calculate the cost structure and
profitability of tilapia farming. However based on the interviews of the present study, it was possible to
obtain the following partial information:
The tilapia business is profitable if high volumes of production are handled and it is an elastic product
which is highly sensitive to price changes. The most representative item is the concentrated feed which
represents 60% of the costs. In the small-scale aquaculture, tilapias which are 750g and more are
harvested after seven months of culture. In 2009 and 2010, the first sale price of gutted fresh tilapia was
4 Personal interview with representatives of ANDAH and the firm "Deli de Honduras S.A de C.V” (Annex I).
42

US$ 2,45 per kilo and the final consumer in Tegucigalpa paid $ 3,38 per kilo while in the aquaculture
areas paid US$ 2,74 per kilo, which means that the profit margin of the intermediaries oscillates
between 12% and 38%. Small scale aquaculture producers who use floating cages in Lake Yojoa (where is
possible to purchase fingerlings and concentrated feed) and they are allowed to use around 4 ha of
water surface, can produce around 4 300 kilos per month.
Some industrial producers, such as the company "Aquafinca Saint Peter Fish SA", support small-scale
aquaculture producers with training in business development.
e. Profitability of the industrial fishing of Caribbean spiny lobster with pots
This fishing method represents 66% of the industrial effort for spiny lobster and generates 27% of the
sources of employment on board, including captains and sailors. Financial data is presented in table 14
based on the prices of December 2007, when the FIINPESCA project conducted the analysis. It was
considered that a fishing trip takes 45 days with three months of closure and it is possible to make up to
six trips per year. The average catch per trip is estimated at 3 185 pounds with a price of US$ 15,42 per
pound.
Revenues ascend to US$ 49 113 by trip and the sum of the fixed and variable costs (including
administrative fees, licensing and maintenance payments during the closure season, when the vessel is
in port) US$ 41 833 giving a return of 14,82% equivalent to US$ 7 279. Payments to the crew are
important item and captains receive 20% of the purchase price (based on USD 15,42 per pound, the
captains receive USD 3,10 per pound from which derive their utility and pay food and crew
remuneration).
Table 14: Cash flow for industrial fishing trip of spiny lobster with pots (2007)
Average incomes per vessel per fishing tripProduction per trip (in pounds) 3 185Average price of spiny lobster (pound) 15,42Total incomes per trip $ 49 113Annual fixed costs per vessel, including the closure of three months
Value (USS) Value per trip Share (%)Licenses, permissions (annual) 1 300 217 0,52%Dry dock and wharfage charges 3 474 579 1,38%Renewal of 3 000 pots 28 203 4 700 11,24%Maintenance personnel (electricians, mechanics, 5 368 895 2,14%
43
welders, carpenters, etc.)Mechanical parts and materials 12 571 2 095 5,01%Cooling system maintenance 421 70 0,17%Fuel and lubricants 2 632 439 1,05%Administrative expenditures (annual) 13 158 2.193 5,24%Total fixed cost $ 67 126 $ 11 188 26,74%Variable costs per vessel and per trip during the fishing seasonFuel (5 200 gallons per trip of 45 days) 15 600 37,29%Lubricants 395 0,94%Bait 855 2,04%Materials for pots 1 316 3,15%Filters for machinery 1 921 4,59%Butane gas (for cooking) 737 1,76%Crew remuneration (20% of 3 185 pounds at US$ 15,42) 9 823 23,48%Total variable cost $ 30 646 73,26%
Total cost per trip $ 41 833 100%Profits 7 279Profit margin 14,82%
f. Profitability of the industrial fishing of Caribbean spiny lobster with scuba diving
The profitability of the industrial fishing of Caribbean spiny lobster with scuba diving corresponds to 34%
of the industrial effort of spiny lobster and it generates 73% of employment on board between captains,
sailors, divers and sacabuzos5. The fishing trip takes 12 to 20 days, including travel time to the region of
the Moskitia. Apart from the three-month closure season, it is possible to make around 13 fishing trips
per year. The average catch is estimated at 6 500 pounds per trip with a price of US$ 15,42 per pound.
The average income is US$ 100 230 per trip and the fixed and variable costs (including administrative
and maintenance) are US$ 67 517, resulting a return of 32,64% equivalent to US$ 32 713 (Table 15). The
remuneration of the crew represents between 20% and 25% of the costs. The sailors earn between US$
265 and 370 per trip, and each diver according to their efficiency, can earn between US$ 635 and 1 587,
including an advance between US$ 106 to 265 that usually they leave to their families before travelling.
Table 15 : Cash flow for industrial fishing trip of spiny lobster with scuba diving, at current prices, 2007
Average incomes per vessel per fishing trip
5 "sacabuzos" is the person who seeks the scuba divers in the Mosquitia region and negotiates with them to join the crew.
44

Production per trip (in pounds) 6 500Average price of spiny lobster (pound) 15,42Total incomes per trip $ 100 230Annual fixed costs per vessel, including the closure of three months
Value (US$) Value per trip Share (%)Licenses, permissions (annual) 1 300 100 0,15%Dry dock and wharfage charges 7 158 551 0,82%Diving equipment 9 474 729 1,08%Maintenance personnel (electricians, mechanics, welders, carpenters, etc.).
7 474 575 0,85%
Mechanical parts and materials 8 316 640 0,95%Cooling system maintenance 1 053 81 0,12%Fuel and lubricants 11 316 870 1,29%Administrative expenditures (annual) 20 842 1 603 2,37%Total fixed cost $ 66 932 $ 5 149 7,63%Variable costs per vessel per trip during the fishing seasonFuel (5 500 gallons per trip of 12 to 20 days) 16 500 24,44%Lubricants 304 0,45%Scuba diving compressors filters 124 0,18%Filters for machinery 148 0,22%Butane gas (for cooking) 166 0,25%Food supply 3 239 4,80%Remuneration to 35 divers (US$ 3,10 per 6 500 pounds) 20 150 29,84%Remuneration to the captain and sailors (20% of 6 500 pounds at US$ 15,42)
20 046 29,69%
Remuneration to the “sacabuzos” 891 1,32%Transportation of scuba divers 802 1,19%Total variable cost $ 62 368 89,87%Total cost per trip $ 67 517 97,49%Profit 32 713Profit margin 32,64%Sources: APESCA (Honduras). INPESCA (Nicaragua)
g. Profitability of small-scale fishing of Caribbean spiny lobster
Data reported by small-scale fishers to the FIINPESCA project includes two levels of income and profit
that are conditioned by the level of catches, while costs remain relatively constant during the year.
In the small-scale pots fishing, the best profitability is obtained when captures goes from 15 to 40
pounds per daily trip, that produce returns from 50% to 68%. On the other hand, when catches range
from 4 to 7 pounds, the profit margin will be from 24% to 30% (table 16). The average price obtained by
fishers is US$ 11,50 per pound, earning a 34% less than industrial fishing, which is explained in part
because operating costs are far lower compared to the vessels owners.
45

Table 16 : Profitability of the small-scale spiny lobster fishing with pots
US$
IncomeHigh 320Low 210
Costs 160
ProfitHigh 160Low 50
profit marginHigh 50%Low 24%
Source: FIINPESCA-FAO/OSPESCA/SWEDEN Project
In the small-scale fishing with scuba diving, the highest profits are achieved with catches from 30 to 60 pounds on daily trips that allow a maximum profitability of 90% while in times of lower catches, fishers can have even losses up to 33% (Table 17).
Table 17: Profitability of the spiny lobster fishing with scuba diving
US$
IncomeHigh 167Low 42
Costs 56
ProfitHigh 111Low -14
profit marginHigh 66%Low -33%
Source: FIINPESCA-FAO/OSPESCA/SWEDEN Project
h. Profitability of the shrimp industrial fishing in the Caribbean
Shrimp industrial fishing trip takes from three to four months and during the year there are eight
effective fishing months and fishers can perform two to three trips. The average catch is estimated at
31 200 pounds per trip, with a price of US$ 3,40 per pound. The total revenue in 2007 was US$
106 080per trip and the total cost accounted to US $ 68 459, giving a return of 35,46% which is
equivalent to US$ 37 6216 see table 18.
Table 18 : Cash flow by trip of industrial shrimp fishing in the Caribbean, 2007
Average income per vessel per tripProduction per trip (in pounds) 31 200Average price of shrimp (pound) 3,40Total incomes per trip $ 106 080Annual fixed costs per vessel, including the closure of four months
6 Op.cit.
46

Value (US$) Value per trip % per tripDry dock and wharfage charges 3 474 1 737 2,54%Maintenance personnel (electricians, mechanics, welders, carpenters, etc.). 5 368 2 684 3,92%
Mechanical parts and materials 17 111 8 556 12,50%Cooling system maintenance 421 211 0,31%Maintenance of fishing nets 4 632 2 316 3,38%Fuel and lubricants 7 895 3 947 5,77%Administrative expenditures (annual) 13 158 6 579 9,61%Total fixed costs $ 52 058 $ 26 029 38,02%Variable costs per trip during the fishing season (8 months = 2 trips of 3 to 4 months)Fuel (12 500 gallons per trip of 4 months) 36 250 52,95%Lubricants 1 184 1,73%Filters for machinery 526 0,77%Butane gas (for cooking) 289 0,42%Crew remuneration (10% of gross profits) 4 180 6,11%Total variable cost $ 42 430 61,98%Total cost per trip $ 68 459 100%Profit 37 621Profit margin 35,46%Source: APESCA (Honduras)
i. Profitability of small-scale shrimp fishing
Data reported by small-scale fishers to the FIINPESCA Project includes two levels of income and profit
according to the abundance of the catches; while costs remain relatively constant during the year 7 refer
to table 19.
The best profitability is obtained with catches of 10 to 56 pounds per daily trip, which produces returns
from 61% to 89%. On the other hand, with catches of 1 to 11 pounds, profitability reaches 19% and even
there are losses higher than 100%. The average price obtained by fishers is US$ 2,64 per pound which
represents 29% less than their industry pairs and, as in the case of spiny lobster fishery, this is explained
by minors operating costs.
After the first sale in the domestic market, the profit margin earned by supermarkets, fish markets in the
cities and other retailers, ranges from 40% to 50% per pound, particularly for pre-cooked and frozen
shrimp.
Table 19 Profitability of small-scale shrimp fishing in the Pacific, 2007
US$High 161
7 Op.cit.
47

Income Low 48Costs 39
ProfitHigh 122Low 9
profit marginHigh 76%Low 19%
Source: FIINPESCA-FAO/OSPESCA/SWEDEN Project
6.2 Fish processing
In general terms, fish and fresh seafood are processed in to frozen products which are either whole or in pieces.
6.2.1 Shrimp
In the case of shrimp, it is sold as a whole or as tails. The products are classified by size and they are
packaged in cardboard boxes waterproofed with paraffin or expanded polystyrene boxes. In addition,
depending on the terms negotiated with each client, the packages could have trade mark of either the
exporting or importing company.
The importers in Europe and United States ask for less processed fish and seafood products in order to
process higher value-added products in their local plants which satisfy the requirements of their
customers. Although majority of Honduran exports are less processed products, three from the eight
shrimp processing plants located in the south of the country (Choluteca and Valle departments). This
plants manufacture products of higher added value that represent an increase of 30% to 50% in the price
per pound, compared to less processed commodities and the European market pays better prices than
the United States market.
The American market buys frozen tails (shelled and shell-on) and value-added products (breaded frozen
shrimp and other frozen preparations). The prices trend has been decreasing with an average drop of
80,5% between 2000 and 2010, from US$ 11,82 to 6,55 per kilo, primarily due to strong competition
from Asian countries such as Thailand Indonesia, China and Vietnam, which sell a 65% of the shrimp
imported into the United States8. Data series of Honduran exports shows the participation of shrimp
products as follows: shell-on frozen 76,6%, peeled frozen 22,9%, breaded frozen 0,3% and other
preparations of frozen shrimp 0,3%.
8 FIINPESCA-FAO/OSPESCA/SWEDEN Project. Marketing study for lobster and shrimp fisheries in Central America and viability to establish a regional certification. 2009.
48

In Europe, mostly farmed shrimp are sold and the main European countries are Spain and England, and
on a smaller scale Germany and the Netherlands. The CENTREX database makes a difference between
prawns and shrimps, but in both cases it refers to farmed shrimp in frozen and cooked state. Between
2003 and 2010 there were some fluctuations on the prices but in absolute terms it showed a growth of
12,3%, from US$ 4,88 to 5,48 per kilo. Prices in Europe have strong variations depending on the
commodities, distribution channels and market trends, but the margins of the importers of frozen
products varies among 5% and 25%, because the excessive competition do not allow to have high
margins, so the final consumer pays an additional 50% over the CIF import price. By contrast, the
importers can gain profits from 30% to 50% with fresh products, so the final consumer price is much
higher9.
Although Europe and the United States are the traditional customers, the market has evolved and today
Mexico is a significant buyer of shrimp tails that pays attractive prices. According to SENASA, 60% of
shrimp exports go to the European Union and 40% is distributed among the United States, Mexico, three
Central American countries (El Salvador, Costa Rica and Guatemala) and Taiwan. Although there is no
series of prices paid by Mexico, SENASA statistics indicate that the average price of farmed shrimp in
2009 was US$ 2, 97 per kilo and in 2010 it was US$ 3, 33 per kilo. In the case of El Salvador, Costa Rica
and Guatemala the average price of Honduran farmed shrimp was US$ 2,53 per kilo in 2009 and US$
2,92 per kilo in 2010.
The traditional shrimp products that are elaborated include shell-on frozen, peeled frozen, peeled and
deveining, butterfly or ¾ butterfly, Individual Quick Frozen - IQF, pre-cooked (ready to cook), shrimp
skewers IQF.
6.2.2 Tilapia
In the case of tilapia, the US exported products include fresh fillet skinless, boneless, tilapia without
adhering fat and whole totally clean fish. Between 2000 and 2010 the price indicated an average growth
of 34.2% per kilo (a change from US$ 5,32 to 7,14).
As regards the European market, frozen fillets of tilapia are exported sporadically since the freight
charges are very high. During the reported period, there were sales to the Netherlands in 2007 and 2008
where the prices of the fillet tilapia was US$ 9,79 and US$ 9,13 for the two years respectively. In
addition, there is processed tilapia skin leather exported to Europe which is meant to produce leather 9 Program of sustainable development for Central America GTZ-FIDE. “Honduras si exporta”.
49

goods such as handbags, wallets and shoes. Tilapia skin leather is the product which is often exported to
France, Italy, Slovakia and the Netherlands, with a relatively stable price ranging between US$ 0,65 and
0,77 per kilo.
6.2.3 Spiny lobster
All Honduran exports are of Caribbean spiny lobster (Panulirus argus) and the products traded are entire,
tails and meat but the statistics indicated an aggregated form. Despite the global economic crisis that
depressed the demand during 2007 and 2008, the price of spiny lobster increased by 33,6% between
2000 and 2010, growing from US$ 21,75 to 29,05 per kilo. The major target market is the United States
and the higher sales seasons are: Christmas, Valentine's Day and the month of July. Its main strength is
to be an exquisite commodity that has not yet produced under culture and therefore maintains its high
price.
Some Honduran entrepreneurs interviewed by the FIINPESCA10 project in 2008, indicated that the level
of incomes and expenditures depends on the season: the highest profits are obtained during the first
five months of the fishing season (July to November) and then decline from December until the end of
February. During the closure period, most processing plants process shrimp and marine fishes.
6.2.4 Marine fishes
NOAA data employed to construct the series of export prices to the United States refers to three
resources: snapper, grouper and several marine fishes. In all cases the trend of prices was increasing
over the decade and shows that grouper is the most valuable product, while snapper is of higher
volume. Grouper and snapper had a price increase of 66% and 35% respectively.
Snapper and grouper, fresh and entire, are the most appreciated products and represent 98% of the
volume of exports, whereas the remaining 2% is frozen entire fish. In the category of other marine fishes,
there are species such as snook (Centropomus nigrescens), scad (Selar crumenophthalmus), weakfish
(Cynoscion albus) and sharks. 60% of these fishes are exported as entire, fresh and frozen fish where as
the remaining are exported as fillets.
6.2.5 Transportation
Transport occurs in all stages of the value-chain, starting from the purchase of inputs for fishing or
10 FIINPESCA-FAO/OSPESCA/SWEDEN Project. Results of the field work for the comprehensive analysis of lobster and shrimp fisheries in Central America. 2008.
50

culture until the placement of fisheries and aquaculture products at points of sale to final consumers.
Generally, the mobilization of inputs in large quantities is paid by the different suppliers, but this section
will address the transport of the products from the vessels and aquaculture areas to processing plants,
and from there to the international broker or the national retailer, who in turn is responsible for
transporting the products to retail outlets.
Processing plants and storage facilities which purchase products from small-scale fishers and aquaculture
farmers, usually travel to communities on boats equipped with isothermal coolers or Styrofoam coolers,
or refrigerated trucks (usually owned by companies) to transport the catch fresh and thus ensure the
best handling and transport from the site of origin. However, this market has not yet been able to ensure
total quality throughout the chain because 80% of the small-scale fishers do not usually carry ice on
board, so the administrators of the market have proposed to the fishers to land their products in their
dock, in order to avoid problems of loss in the cold chain.
Aquaculture enterprises move the harvest of fishes from lakes or ponds toward the processing plant,
using large trucks equipped with plastic bins whose load capacity is 350 kilos per unit and equipped with
ice flakes. The larger trucks can charge up to 12 bins, equivalent to 4 200 kilos of fish per trip. Once the
products are processed, packaged and ready for export, they are kept in refrigerated trucks (contract
with specialized firms) from the processing plant to the airports in Tegucigalpa or San Pedro Sula, where
flights will be arranged towards Miami and New York. In this stage, the only inconvenience is that San
Pedro Sula airport infrastructure does not have cold storage, so there must be good synchronization to
ensure that trucks arrive in the airport shortly before the flight departs.
The small-scale aquaculture producers are also equipped with bins and ice flakes in order to harvest the
production and deliver it to the dealers. Usually this service is rented from local suppliers.
In the industrial fishing of the Caribbean, the transport of the products by road are carried out in
refrigerated trucks, usually of their property, while exports are transported by sea in vessels adapted to
carry refrigerated containers from both the port of La Ceiba, as the Bay Islands, toward Miami and New
York.
6.2.6 Final consumption
Europe and the United States are traditional customers of Honduras fishery. However since 2009,
Mexico, El Salvador, Costa Rica and Guatemala have also become important markets. Honduras exports
farmed shrimp to Mexico. It also exports to other Central America countries; the products include fished
51

and farmed shrimp, marine fish, octopus, squid and crab. The fishery and aquaculture export contributes
around 5% to the national exports. The sectoral export contribution to the national export is presented
in table 20.
Table 20 : Sectoral exports contribution to the national exports ( in millions of dollars and at current prices)
Year National exports Fisheries and aquaculture exports
Contribution
2000 3 343,40 192,27 5,75%2001 3 422,70 217,91 6,37%2002 3 744,90 138,09 3,69%2003 3 754,00 153,29 4,08%2004 4 533,90 159,71 3,52%2005 5 048,00 187,88 3,72%2006 5 276,60 214,65 4,07%2007 5 594,30 204,57 3,66%
Annual average $ 4 339,73 $ 183,55 4,36%Sources: BHC (Honduras) and SIECA
The fisheries and aquaculture production in Honduras is mainly aimed for foreign markets. The
calculation and analysis of social and economic indicators conducted by the FIINPESCA Project concluded
that, between 2000 and 2007 around 77,3% of the processed products were exported to the European
Union, United States, Mexico and Central America. Whereas, the domestic demand is supplied with the
remaining 22,7% of the production and imports from other countries.
6.2.7 Market structure
In this section, the general market structure of Honduran fishery will be discussed first, followed by the
specific value chain analysis of industrial fishing, industrial aquaculture, small scale fishing, small scale
aquaculture and benefit distribution among the value chain agents.
6.2.7.1 General market structure
In Honduras, there are many wholesalers and retailers who are in charge of putting fisheries and
aquaculture products through the formal and informal channels of commercialization. In the case of
wholesalers, their main suppliers are industrial producers, medium and small-scale producers,
intermediaries who collect products in the ports, cooperatives and associations of small-scale fishers, as
well as from imports. They are usually located in the market places of cities and they sell their products
to retailers. Among the wholesalers, there are processing plants who sell their products directly to
52

consumers.
The retails on the other hand are the agents who sell directly to consumers. Retail markets include
points of sale in market places fish markets, supermarkets, "cevicherías"11 and street sales. There has
been a growing share of supermarkets and hypermarkets in Honduras, since they are located in different
areas of the cities and they offer a wide range of quality products, best price and customer service which
generates consumer confidence and encourages consumption.
The fisheries and aquaculture products which are meant for domestic consumption (produced in the
country and imported products) have three marketing channels. These are formal channel, informal
channel and institutional channel. A formal channel includes locals who specialise in food market places,
points of sale in ports, docks, fishing terminals, supermarkets, popular markets and specialist outlets.
The low and middle income people prefer popular markets where as the middle and high income people
prefer supermarkets and specialist outlets. In the case of restaurants and hotels, they prefer market
places and fishing terminals.
An informal channel constitutes street sales both seasonal and itinerant. The supply of this channel is
not constant, neither homogeneous nor quality. With the exception of some high income consumers, the
main customers are those who live in colonies or in lower income neighbourhoods. The last channel is
the institutional channel which consists of restaurants, fast food chains, hotels, clubs and institutions
(hospitals, schools, military and corporate casinos, etc.) which gradually introduced fish and seafood in
their menus.
When products arrive in Europe or United States, a new commercialisation chain is created which
includes small and medium suppliers, processors and distributors. These agents interact as follows12:
Importers: Buy and sell products to processing companies, multiple re-exporters and retailers, including some restaurants and upscale hotels who import fish and seafood directly. Importers usually provide information to the producers in Honduras about quality exigencies, packaging requirements and forms of processing, as well as consumers’ preferences and market trends.
Processing companies: Sometimes the importers also assume the role of processing plants in order to develop higher added value products aimed to the final consumers.
11 Cevichería is a small artisanal restaurant that sells seafood coctels, molluscs and similar products, generally next to the beaches, touristic places in ports and in some cities.12 Program of sustainable development for Central America GTZ-FIDE. “Honduras si exporta”. Available on: http://www.hondurassiexporta.hn/documentos-de-interes/fichas-producto-mercado-para-exportar-a-la-union-europea/
53

Intermediaries’ processors: They buy fish and seafood in order to develop semi-final products, such as fish fillets and fish blocks which will be sold to other processors.
Agents: They are intermediaries between exporters and importers who earn commissions from 2% to 5% of the purchase prices. The agents are usually very well informed about prices, customers and market trends, but over time their role has changed due to the evolution of information and communication technologies which facilitated the direct contact between exporters and importers.
6.2.7.2 Value-chain for industrial aquaculture
Shrimp farming is developed in the southern part of the country, whereas tilapia farming is concentrated
in the central zone. In the production phase, according to DIGEPESCA and SENASA, there are 231 shrimp
farms, 11 hatcheries for shrimp seed production, two diagnostic laboratories for water quality and
aquatic pathology and 13 industrial projects of tilapia.
In the processing stage, there are eight registered shrimp processing plants and three tilapia processing
plants (associated with the three largest farms). Finally, in the marketing stage the number of companies
involved is not known because frequently the same producers and processors are responsible for export
and sales in the domestic markets. The agents involved in the industrial aquaculture include farms,
processing plants, brokers, wholesalers, retailers, different markets and consumers- see figure 10.
Figure 9: Value-chain for industrial aquaculture
6.2.7.3 Value-chain for industrial fishing
The industrial fishing is developed exclusively in the Caribbean and there are 216 vessels involved in the
fishing of lobster, shrimp, finfish and queen conch. In the processing phase, there are 23 packing plants,
54

which are also involved in squid and crab13. As in the aquaculture industry, there is no accurate record of
traders because producers are in charge of exports while domestic sales are done directly or through
wholesalers and retailers. The agents involved in the industrial fishery value chain include fishers,
processing plants, intermediaries of small scale fishing, brokers, wholesalers, retailers and institutional
channel, and consumers- the industrial fishery value chain is presented in figure 11.
Figure 10: Value-chain for industrial fishing
6.2.7.4 Value-chain for small-scale aquaculture
According to estimates of DIGEPESCA, the country has around 5 600 medium and small scale tilapia
aquacultures, which basically sell gutted and fresh fish14. Regarding the marketing phase, there is no
accurate data about the number of wholesalers, retailers and intermediaries involved. However, the
entire production supplies the national market.
The value chain for small scale aquaculture is presented in figure 12, and the main agents are farmers,
intermediaries and processors, wholesalers, retailers, institutions and final consumers.
13 DIGEPESCA. Diagnosis of the fisheries and aquaculture sector. November, 2007.14 Op.cit
55

Figure 11: Value-chain for small-scale aquaculture
6.2.7.5 Value-chain for small-scale fishing
In Honduras, there is no precise data on the number of small-scale fishers. Currently, OSPESCA
(Organisation of Fisheries and Aquaculture Sector of the Central American Isthmus) is conducting a
census of fishing and aquaculture producers in the country. However, according to estimates of the
FIINPESCA Project, there are 17 200 fishers (63% in the Caribbean, 19% in the Gulf of Fonseca and 18%
on inland waters). As in small-scale aquaculture, there is no estimate data about the number of
intermediaries, wholesalers and retailers involved in the processing and marketing of its commodities.
The agents involved in the value chain of the small scale fishing are presented in figure 13 and the agents
include small scale fishers, intermediaries, cooperatives, processing plants, wholesalers, retailers,
institutions and consumers.
56

Figure 12 Value-chain for small-scale fishing
6.2.7.6 Benefit distribution among the value chain agents
Each of the agents in the value chain obtains several benefits expressed in monetary terms and / or
welfare. The most relevant stakeholders are fishers and aquaculture producers, suppliers of equipment,
materials and supplies, traders at wholesale level, retailers and brokers, final consumers (individuals and
institutions who are part of civil society) and the State.
In monetary terms, higher-earning producers are the industrials of the fisheries and aquaculture,
particularly those who have integrated the processes of production, processing and marketing, because
they have more possibilities to avoid the entry of intermediaries, which keep a significant portion of
profits of the business.
In the case of small-scale fishing and aquaculture, intermediaries are the ones which earn the highest
profits. In the marketing stage of these two activities there are many agents involved and this increases
the prices paid by final consumers, which can be between 60% and 100% higher than the first sale price.
The benefits to suppliers of equipment, row materials and supplies for fishing and aquaculture at
industrial and small-scale level, depend on the dynamism of the sector because it determines their
possibility to maintain, decrease or increase their business opportunities.
The benefits for the final consumers and institutional channel (restaurants, hotels, schools, military
forces, etc.), which are the principal representatives of civil society in the value-chain, are defined in
terms of access to fisheries products. Although according to INE, 60% of the Honduran population is
within the poverty line and per-capita consumption was 2,9 kg/person/ in 2007 , in the market there is a
wide offer of fish and seafood of different prices and presentations, accessible to all socioeconomic
57

strata and consumer preferences.
There are also several state benefits such as generating foreign exchange (by approximately US$ 183
million per year through the exports of commodities originated on the five resources analysed in the
value-chain), generating around 65 470 direct jobs (26 250 in small-scale fishing and aquaculture, 32 000
in the industrial aquaculture, 5 420 in the industrial fleet and 1 800 in 23 processing plants). In addition,
Honduras got international recognition as the largest producer of farmed shrimp in Central America, the
first country at global level to obtain the international certification for compliance with the ISTRA
standards relating to good practices in the culture of tilapia, and the second largest producer in Central
American of Caribbean spiny lobster after Nicaragua.
6.3 Fishery regulations
The main rules which govern the performance of the fisheries and aquaculture sector as well as the
processing, quality control and marketing of its products are the following:
- Decree 154 of May 19, 1959 - Fisheries law: It gives the general legal framework of the fisheries and aquaculture sector in the country. It also includes the rules for fauna and flora, their utilisation, marketing and industrialisation.
- Phytosanitary law, Decree 157 of 1994, updated with the Decree 344 of December 16, 2005 : Its purpose is to ensure the health of people, animals and to preserve vegetables, as well as the conservation and safety of their products and by-products of the damaging effects of pests and diseases of economic and quarantine importance.
- Regulations for inspection and zoo sanitary certification of fisheries and aquaculture products, Agreement 1081 of September 23, 1999, updated by the Agreement 728 of January 15, 2009: Its purpose is to govern the hygiene-sanitary and technology inspection procedures of fisheries and aquaculture products of any species, in facilities where they are processed or sold both for domestic consumption or export.
- Regulation of the fishing and aquaculture health, Agreement 1418 of 2000, updated with the Agreement 189 of February 19, 2001: Its objective is to establish the technical, administrative and legal measures to preserve the fishing and aquaculture health of the country through actions to prevent the introduction, establishment and spread diseases of economically, quarantine and social importance that threaten human and animal health.
Furthermore, although not part of the national law, but in compliance with the rules previously
mentioned, SENASA developed in 2009 the "National Programme for analysing chemical and
microbiological residues in the fishery and aquaculture products" that should be applied along the entire
product chain.
58

7Iceland
7.1 Fish production
Few nations in the world are as dependent on fisheries as Iceland if one considers the size of population.
Although Iceland is among the smallest nations of the world, with a population of slightly more than 300
thousand people, it is nevertheless among the world’s largest fishing nations. In 2007, Iceland ranked
16th on a global scale. This is around average for Iceland, as it has been ranking from the 10th to the
21st high place since 1950.
Fisheries in Icelandic waters are now characterised by the most sophisticated technological equipment
available in this field. This applies to navigational techniques and fish-detection instruments as well as
the development of more effective fishing gear. The most significant development in recent years is the
increasing size of midwater trawls and, with increasing engine power has improved the ability to fish
deeper. There have also been substantial improvements with respect to technological aspects of other
gears such as bottom trawl, longline, and handline.
Total catches in Icelandic waters increased from roughly 200,000 tonnes prior to the First World War, to
about 700,000 tonnes between the wars. After the Second World War, the catches of demersal species
stabilised around this level but total catches increased to 1.5 million tonnes because of the herring
fisheries. Subsequently, the herring stocks collapsed and the total catches declined again. Production
increased again in the late 1970s and has, since then, fluctuated between 1 and 2 million tonnes
annually. These fluctuations are explained by the volatile changes in the size of the capelin stock, which
makes up roughly half of the total recent catch.
However, high quantity is not the same as high value. Most of the capelin is processed into meal and oil
that is of relative low value. The highest value is in the cod catches and only two species, cod and
haddock make up more than half the total value of catches in Icelandic waters, although they are
combined only about 20% of the total catch (see Figure 14).
59

Figure 13: Relative catch and catch value in 2008 for the nine most important species in the Icelandic fisheries (Source: Statistics Iceland)
Cod has always been the most important fish in Iceland, accounting for more than half of the total
demersal catch until the early 1980s (Figure 15). The first Icelandic owned trawler started operating in
1905. At that time the total demersal catch by Icelandic vessels was 53 thousand tonnes but the foreign
catches about 130 thousand tonnes after the rapid increase in numbers of foreign trawlers in Icelandic
waters. By 1925, 40 Icelandic trawlers were operating, and the total demersal catch had increased
almost fourfold to 202 thousand tonnes and the foreign catches were only slightly higher. Catches by the
Icelandic fleet decreased during the Great Depression, but increased rapidly during and after WWII, to a
peak of 405,000 t in 1960. After the extension of the EEZ to 200 miles, the number of Icelandic trawlers,
that were mostly state of the art stern trawlers, increased rapidly to more than 100 vessels. Catches also
increased; first catches of cod, then until this day followed by other species. However, with the recent
decreasing TAC for cod, the relative importance of other species has been rising and in 2006 the cod was
only about 36% of the total catch, down from 52% twenty years earlier and 69% forty years earlier.
60

Figure 14: Total catch by major species since 1900 in Icelandic waters and catch of Icelandic vessels in other waters (Source: ICES)
The herring fisheries have also been historically very important for Iceland. They were especially
prominent in the 1960s, when nearly 590 thousand tonnes were caught. The herring stocks collapsed in
1967, and catches remained low for a long time. The herring stocks have, however, recovered fully now
and catches in Icelandic waters have been around 100 thousand tonnes within the Icelandic EEZ since
1988. After the herring stocks collapsed, the Icelandic purse seiners turned their attention to the capelin,
which had been largely ignored before. This fishery increased rapidly to around 1 million tonnes
annually. The capelin stock size can, however, fluctuate wildly, since it is short lived and dies after first
spawning. Landings from pelagic fisheries are now usually more than half of the total annual catch in
Icelandic waters.
The Icelandic motor fishing fleet has traditionally been split into three groups; trawlers, decked boats,
and undecked boats. The decked boat category is by far the most diverse as it ranges from small boats
(smaller than many undecked boats) to large purse-seiners and multipurpose vessels. However, the
separation of decked boats and trawlers is not very clear since many decked boats can also operate
trawls. Many of the decked boats are also structurally similar to stern trawlers, and some of the old side
trawlers were converted to purse-seiners, which put them into the decked boat class. The total number
of fishing vessels at the end of the year 2010 was 1,625. Trawlers counted 57 of these with a combined
size of 65,087 GT, decked vessels were 761 with a combined size of 83,457 GT and undecked boats were
807 with a combined size of 3,857 GT. The number of boats in all categories declined from previous year
61
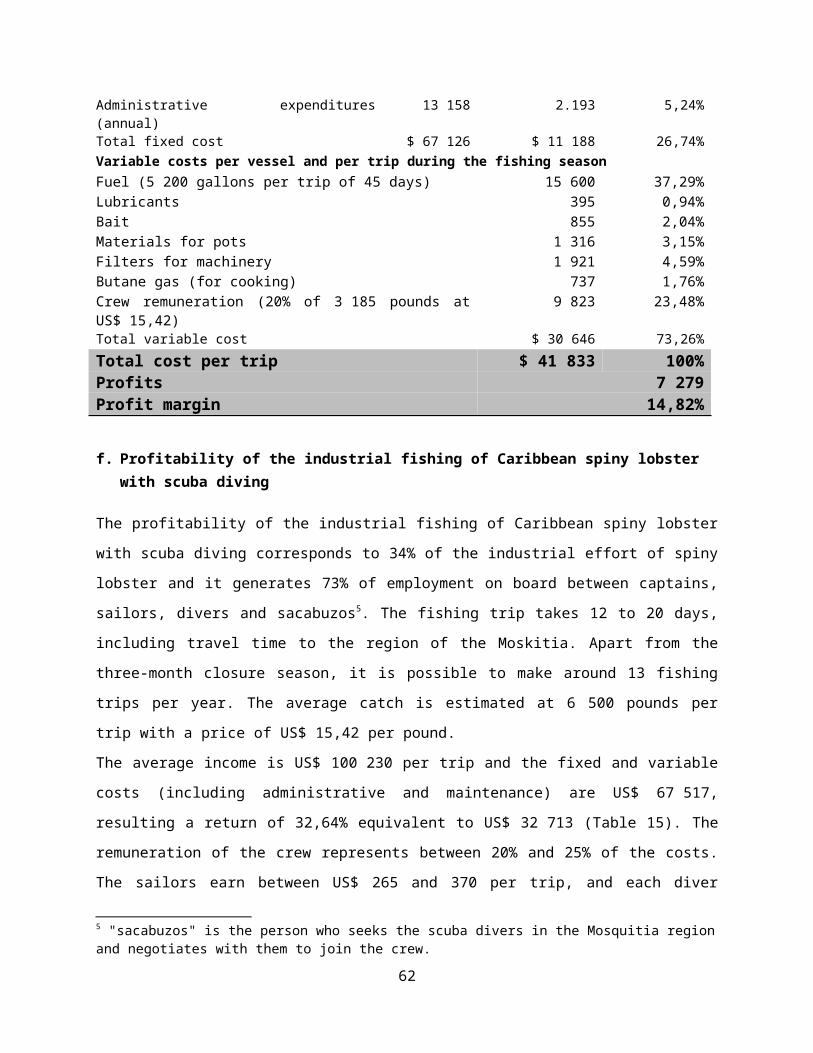
excepting number of undeck boat that increased by 51 in number from 2009 and the total size by 242
GT. In 2009 about 42% of the total catch value was landed by trawlers, just over 1% by the small
undecked boats and 57% by other vessels of varying sizes and capacities. These numbers only apply to
boats that have licenses to fish in Icelandic waters.
The Icelandic fishing fleet is technologically advanced and uses a variety of fishing techniques and gears.
The ranges of fishing gears include handline, longline, gillnet, bottom trawl and Danish seine for
groundfish and flatfish. Purse seine and pelagic (or midwater) trawl are used for pelagic and various
types of dredges, and trawls are used for invertebrates.
Purse seines and quite recently, pelagic trawls catch the highest amounts as they are fishing for a few but
very abundant pelagic fish species. This catch is usually around 2/3 of the total catch. However, this is
not reflected in the value of the catch as the value of pelagics is low compared with groundfish. The
fishing gear that catches the highest value is the bottom trawl with 40%-50% of the value of the total
catch. The second most valuable catch is from longlines. With the exception of lobster, fisheries for
invertebrates are quite low in both value and catch amount. However, valuable scallop and especially
shrimp fisheries have recently collapsed or declined due to environmental factors (Figure 16).
Figure 15: Total catch of Icelandic boats by major fishing gear (Source: Statistics Iceland, weight reports)
62

The Icelandic fishing industry has been profitable since the early nineties. Figure 17 shows the
profitability of the consolidated industry, on average the profit of the industry has been 6.1% of total
revenues. Only in 1997 and 1999 did the industry lose money, 1.4% in 1997 and 1.3% in 1999. The figure
indicates as well, that the profitability of the industry has been improving in recent years. Every year
since 2001 the profit of the fishing industry as a whole has been above 5% of revenues, but between
1993 and 2000 the profitability of the industry was never above 5%. The best years were 2001, when the
profit of the industry was 18.1% of revenues, and 2006, when the profit was 16.9%. The reasons for the
increased profitability of the industry are mainly twofold, increased productivity and higher prices.
The fluctuations of the Icelandic currency (ISK) explain some of the variation in profitability. When the
index is high, the ISK is weak and when it is low, the ISK is strong. The ISK was lowest in 2001 which was
the best year ever for the Icelandic fishing industry. On the other hand, 2005, when the ISK was
strongest, was the 2nd worst year for the industry since 2001.
Figure 16 : Average value of the Icelandic króna (right) and net profit in the fishing industry (left) Source: Statistics Iceland
Aquaculture
Although Iceland is one of the leading fishing nations in the world, the same does not apply for
aquaculture. Real commercial sized aquaculture began only around 1985 with first attempts at salmon
(Salmo salar) farming (Gunnarsson, 2011a). In 1990, after a large- scale build-up, the production reached
about 3,000 t and was at that level for more than 10 years. The salmon farming in Iceland did therefore
63

not grow to anywhere near the same levels as the Norwegian salmon farming, conducted at similar
latitudes. The second phase of salmon farming began in 2004 when production was doubled. This
subsequently collapsed in 2007 and salmon farming has been on a very low scale since (Figure 18).
However, one salmon farming sector is thriving, selective breeding and exporting of eggs and juveniles.
The development of Arctic char (Salvelinus alpinus) farming has developed quite differently. Faming
began at about the same time as salmon farming but was on a very low scale. The growth has
subsequently been slow but steady so in the recent years there has been more Arctic char production in
Iceland than for all other aquaculture species together. Furthermore Iceland is the largest producer of
Arctic char in the world. Arctic char farming can therefore be classified as a success. It has to be
mentioned that along with increased production a strong marketing campaign was conducted to boost
sales and prices.
Iceland has experimented in cod farming since 1992. The growth of this sector has been slow but steady.
On-growing of wild caught fish has proven to be feasible and most of the production is from on-growing.
Farmed juveniles are also produced in experimental stations, but have not yet proven to be economically
feasible on a large scale. Several other species have been experimented with, but most are minor in
comparison with the species above.
Figure 17: Total aquaculture production in Iceland by fish species (Source: Directorate of Fisheries)
i Pelagic fish species are those fishes that are characteristically mobile and migratory and live in the open waters of the sea.
64

7.2 Fish processing
The consolidation within the fisheries sector did not only affect the size of the fleet and concentration of
the quota ownership, but also had the same effect on the processing sector. The most illustrious way is
to look at the development of the official processing licences. In the beginning of ´90s there were slightly
over 400 licences active but in 2007 the total number of processing licences had gone down by 32%. The
largest decrease in processing licences is in freezing at sea (FAS) due to a much lower number of
operators and the large increase in processing capacity on each vessel. The exemption from the general
trend of decreasing number of processors is the growing number of producers of chilled fish products as
can be seen in figure 19.
0
50
100
150
200
1992 1995 2000 2007
Freezing FAS Salting Chilled
Figure 18 : The Number of Icelandic processing companies (Source: Statistics Iceland)
A steadily declining number of people employed in the fish processing goes hand in hand with the falling
trend in the number of processing licences. Between 2000 and 2007 the size of the workforce in fish
processing declined by 58%.
Technological innovation in processing equipment and the widespread use of ITC based solutions and
automation has given rise to a highly significant increase in efficiency and productivity in the processing
sector. According to Federation of Icelandic Fish Processing Plants, the labour productivity has increased
by nearly 30% since 2000 (LÍÚ, 2008). This development has been aided by the general strategy of
product specialisation and focused differentiation in the processing activities. Larger processing units and
specialisation have made way for economy of scale and in many instances for economy of scope. Other
rationalisation steps have been taken such as in better utilisation of by-products and waste mainly cut-
65

offs in filleting, heads, roes and liver. This is a significant proportion of landed volume and was until
recently categorised as waste and used in meal and oil reduction or used in low grade products. This has
changed and all available by-product, waste or off-falls are used in processing of value added products. In
the last five years the processed amount of by-products account for 8-10% of landed volume of cod,
haddock and saithe. This has contributed heavily to higher productivity of input and higher average
product margin.
Traditionally, nearly all demersal wet fish was allocated to freezing, salting or iced whole for export. This
changed with the emergence of freezing trawlers in the 1980s. Since mid 1990s, around one-third of wet
fish has been frozen at sea but land based freezing fell from 45% in 1990 to about 30% on average . These
changes in processing of demersal fish in Iceland occur in the allocation to salting that was increased
temporally to 25% in 1996-2000 but has fallen to 16% in the recent years. The only significant change
since mid 1990s has been the rapid and parallel increase in allocation to chilled products to 12% in 2007.
Since 2005, around quarter of wet fish has been allocated to chilled and iced fish products. Chilled
products are now the second most important category of processed demersals in Iceland or 26% in value
in 2007.
The Icelandic fish processing methods be divided into eight main groups namely frozen, fresh
(processed), fresh (whole), salted, meal, oil, dried, and other (canned, pickled, smoked etc.). As can been
seen in figure 20 frozen products are the most valuable followed by fresh whole fish and fresh
processed. The increase in value from 2008 can mainly be traced to changes in the currency rate of the
Icelandic króna (ISK) (Figure 20).
Figure 19 : Icelandic export value of fish by processing methods in 2009 (Source: Statistics Iceland)
66

7.3 Final consumption
The Icelandic seafood industry currently exports products for about 209 billion Icelandic krónur (ISK),
roughly equal to 1.7 billion US dollars or 1.2 billion Euros in 2009. As can be seen from figure 21 the
majority are exported to Europe.
Figure 20 Icelandic seafood export value by continents in 2009. Source: Statistics Iceland.
Apart from European countries, Iceland exports to America, Asia and Africa. Icelandic products are
known for their high quality and have a tradition on these markets.
The most important export countries in Europe are the United Kingdom, Norway and Spain. A
considerable share is also exported to other European countries like Netherland, France and Germany
(Figure 22). It is interesting to see that Nigeria is bigger in imported value than USA which once was the
most important markets for Icelandic fish.
Most of the exports to Europe are frozen; either on board the processing vessel or in processing plants
ashore. In addition to Europe, markets for frozen products are all around the world as the storage
method does not set limits to shelf life during transport as opposed to the fresh products. For instance,
frozen at sea products from Greenland halibut, redfish and capelin are popular in the Far East but
traditional markets for codfishes (both frozen at sea and on land) are in Western Europe and North
America. Whereas, Shrimp is primarily exported to the UK and nephrops lobster to Spain.
The fundamental markets (in Europe) for frozen products have been; The UK with cod and haddock (for
the traditional British dish; fish and chips) and Germany with frozen redfish and saithe. These markets
have been remarkably stable through history, including recent years. In the case of fishmeal and oil, the
largest buyer is Norway where it is used to feed salmon. Primarily, fishmeal and oil is used as feed for
domestic animals and fish feed in aquaculture.
67
The markets for fresh products are primarily in Western Europe as it is conveniently close to Iceland. A
significant proportion of the Arctic char production is also air freighted to North America.
In the case of dried products, there are two main markets which are quite far apart. Dried cod, haddock
or catfish are a popular and healthy snack in Iceland. Dried codfishes are also popular dishes in West
Africa and as a consequence Nigeria is one of the largest importers of Icelandic fish products.
Figure 21 Icelandic seafood export value for 8 major countries in 2009. Source: Statistics Iceland.
In the case of aquaculture production, the highest annual production year was 2006, with about 5,000 t
exported and about 2,000 million ISK in value (Figure 23). This dropped the subsequent year, due to
sharply reduced salmon production, but has grown again to previous levels partly due to successful
marketing of Arctic char and partly because of favourable exchange rate for the ISK. The largest marked
for Icelandic aquaculture products are the United States, where large part of the Arctic char products are
exported. Halibut juveniles are mostly exported for on-growing to Norway and salmon eggs and juveniles
to Chile.
Figure 22: Total export of Icelandic aquaculture products in volume (left axis) and value (right axis, ISK million at current price) (Source: Statistics Iceland)
68
7.4 Market structure
The exporting of fish products were since the 1930´s regulated by an official export licensing system. The
three large producers organisations (Icelandic Freezing Plants (IFPC), Iceland Seafood (IS) and Union of
Icelandic Fish Producers (UIFP)), which were producers co-operatives held a quasi monopoly of exporting
of frozen and salted products as they had virtually an unlimited export licenses from the authorities.
These marketing and sales organisations (MSOs) had the great majority of processors as members of
their organisations and by contractual agreements; they were obliged to sell all their products through
these organisations. In effect, these three exporting organisations, two in frozen products and one in
salted products, exerted a huge power over the harvesting and processing sectors in their heydays. The
export licensing system was gradually uplifted from 1987 and the last remains were uplifted in 1993.
The decreased fish stock after the 90´s meant that producers often had difficulties in increasing their
value creation by just increasing fishing as they often did before. This increasingly put pressure on the
MSOs to create the type of relationship where producers have the opportunity to get access to
information and knowledge in the network that can support further value creation in their own
companies. The role and power of the producers´ organisation dwindled gradually in the later years of
the 1990s´ due to the abolishment of export licensing and the establishment of new large fisheries
companies. Soon after that the largest vertically integrated fisheries company (Samherji) started
exporting their products as well as a number of new marketing and exporting companies sprang up
when larger independent producers (i.e. producers sourcing wet fish from fish markets or through direct
supplying contracts with vessel owners) did the same. To counter these changes the nature of the
producer’s organisations was changed to limited liability companies where the members got shares in
accordance to their part in the equity reserves. This tied the producers business to these exporting
companies until the three companies were listed on the Icelandic Stock Exchange in 1997 and the
shareholders could capitalise their share value on the stock market. Gradually after 2000, the large
integrated fisheries companies took over most of their exporting and marketing activities and so did a
number of seafood producing companies of frozen and chilled products (Klemenson & Knútsson, 2006).
In recent years, a three-tier structure characterises the exporting and marketing activities in Iceland;
1. The two large exporting and marketing companies, Icelandic and Iceland Seafood International
(ISI), holding a market share of 35-40% in frozen and salted products
2. The fish processing companies´ own marketing divisions
69

3. Independent marketing companies often in close ties or affiliated with fish processing plants.
This three-tier structure of marketing and exporting activities is an open and flexible system which allows
amble space to find the most profitable market options. It must be noted that although there were
severe drawbacks in the market predominance of the large MSOs, they supplied a wide range of services
to their members or business partners. There were also benefits and strengths (economy of scale)
stemming from the market size of the MSOs and from the wide range of products (economy of scope)
they could supply. In many cases the MSOs acted like cartels both at home and on foreign markets.
7.5 Fishery regulations
An extension of the fisheries’ jurisdiction started in 1952 when the limits were extended from 3 to 4
miles and from 4 to 12 miles in 1958. In 1972 the Icelandic government decided, unilaterally, to extend
the jurisdiction from 12 to 50 miles and again in 1975 from 50 to 200 miles. These extensions were made
because of a rapid decline in fish stocks and over-fishing in the fishing grounds around Iceland. After
each of the four extensions, Britain imposed a landing ban on Icelandic ships; West Germany imposed
this after the last two extensions. The third conflict in 1972 also had an effect on the Icelandic fish
industry; Protocol 6 in the EEC agreement meant that, without reaching a satisfactory agreement with
EEC countries, Iceland would not enjoy specific reductions on import duties on fish to EEC countries. This
sanction lasted from 1972 to 1976 when Iceland reached an agreement with regard to the 200 mile limit.
Since 1976 fishing by foreign ships in Icelandic waters has been very limited and does not play an
important role in the total catch.
The next aspect of fishing control that is worth mentioning is the quota system. It was introduced in
1983, with quotas on important species, either in the form of quantities or limitations regarding the
number of days that ships could fish each year. Before 1983 a quota system had been introduced in the
herring fisheries in 1975 and in 1980 this was extended to the fishing of capelin. The main pressure for
introducing the quota system was declining fish stocks; first the collapse of the herring stock and later on
the foreseeable collapse of the capelin stock unless preventive measures were adopted. The same can
be said about the demersal species before 1983 when the stock had been declining due to over-fishing.
Hannesson (1994) has pointed out that the ownership of quotas involves the right to catch the fish but
does not entail ownership of the fish stock. Thus, it is claimed that the quota does not mean the
ownership of the fish but rather the right to catch the fish.
70

According to Fisheries Management Act No 38/1990 no one can catch fish inside the Icelandic economic
zone without permission from the Ministry of Fisheries, and licences are allocated for one year at a time.
Due to this law, all major fisheries inside the Icelandic economic zone operate according to a uniform
system with transferable quotas in all species and fisheries. Hence, nearly all fishing vessels have
individual transferable quotas (ITQ), allowing ship owners to buy or sell quotas between ships. As has
been pointed out earlier, the ITQ grants the right to catch the fish but not the ownership of the fish
stock. In that way, the ITQ permits the owners of the fishing vessel to sell the right to catch the fish.
However, there are limitations to the transferability of the ITQ that could affect the structure of the
fisheries sectors. Firstly it is exclusively owners of fishing vessels with a valid fishing licence that can hold
quotas. Secondly, the holders of quotas must catch at least 50% of their quotas every second year to
maintain the quota shares. There is also a requirement that within the year, the net transfer of quota
from any vessel must not exceed 50%. The third restriction is the geographical restriction to the ITQ
system where the local authorities and respective fisheries unions in local geographical regions can block
the transfer of annual quotas between regions. On the other hand, annual vessel quotas are freely
transferable between fishing vessels within the same region.
In the beginning, the annual quota was issued by the Ministry of Fisheries free of charge. In 1990 this
changed in such a way that now the Ministry collects fees for the annual quota to cover the cost of
monitoring and enforcing the ITQ system (Runólfsson & Árnason, 1996). The fee only covers a very small
amount compared to the price of the quotas on the market.
The Icelandic Parliament passed a new chapter in the Fisheries Management Act in the spring session
2002. This includes a levy on fishing rights allocation and is payable by fishing companies. Fishing rights
for the Icelandic fleet within and outside the EEZ have been levied from Sept 1 2004.
The Icelandic fisheries management system has many supporting measures designed for specific
fisheries. There are extensive nursery areas permanently closed for fishing. Spawning areas of cod are
closed for a few weeks in late winter during the spawning period and the Marine Research Institute has
the right of immediate, temporary closure of areas with excess juveniles. There is a 12 mile limit for large
trawlers in most areas and there are several selectivity measures, such as a mesh size of 135 mm or
equivalent. A sorting grid is mandatory to avoid by-catch of juvenile fish in the shrimp fisheries and
devices for excluding juveniles in the groundfish fisheries are also mandatory in certain areas.
The catch rule for cod is also a very important landmark in the precautionary approach to cod stock
management. This rule, based on scientific recommendations, was adopted by a government decision
and became effective in 1995. It states that the annual TAC for cod is to be set at 25% of the fishable
71

biomass. This implies that the TAC is automatically set after the annual stock assessment. Following the
recommendations of the Marine Research Institute, the government decided in July 2007 that the TAC
for cod in the fishing year 2007/08 should be set at 20% of the fishable biomass.
There are requirements that small fish, i.e. cod and saithe less than 50 cm and redfish shorter than 33
cm must be kept separate in the catch and must not exceed 10% of the cod, saithe, haddock and redfish
catch, the equivalent numbers for haddock are 41 cm and 25%. In compensation, and since this fish has
rather low value, it does not count fully in calculations of the vessels' used quota.
There are also strict requirements for the keeping of logbooks on-board all fishing vessels and they must
be made available for fishery inspectors. Furthermore, the logbooks are important for scientific
assessment purposes.
72

8Japan
8.1 Fish production
Japan has been one of the largest consumer markets of fish and fishery products in the world. It was also
the world’s largest fish producer with a peak of 12.8 million metric tons of capture and aquaculture
products in 1984 but the output has sharply decreased after the late 1980s. The most recent statistics
shows that the fishery production of Japan was 5.6 million metric tons in 2008 which makes Japan as the
world fifth largest producers of aquaculture and capture fishery products after China, India, Peru, and
Indonesia. The two major reasons for the production decline in Japan after the 1980s are the reduction
of Japanese distant-water fishery production and the collapse of Japanese sardine (Sardinops
melanostictus) in the late 1980s. The population decline of the sardine after 1988 possibly occurred as a
result of the abrupt increase in sea surface temperature since 1988 in the Kuroshio Extension region and
suggests a close relationship between inter-decadal climate–ocean variability and sardine population
size.
The country’s fish production could not satisfy the country’s fish demand. Thus, in recent years
approximately forty percent of the seafood consumed in Japan is imported. Import tariff rates for fish
and fishery products are relatively low in Japan, approximately 4% of weighted average making it
relatively easy for foreign fishing firms to export to the Japanese market. Appreciation of the value of
Japanese currency (Yen) also contributed to the increase of import of fishery products into the Japanese
market. Currently, the imported products have more competitive prices than domestically produced fish
(the domestic produced fish dwindled). The Japanese economy also stagnated after the start of the
1990s, which may have contributed to the low fish prices.
Japanese waters constitute variety of species (approximately 3,300 species) and no single species
constitute dominant catch in the country’s fisheries. Aquaculture production is relatively stable in Japan
for the last two decades, as opposed to the rapid increase of the world aquaculture production. Edible
sea-weeds and shellfish are the two largest groups of the aquaculture production in Japan, followed by
saltwater finfish species such as yellowtail and sea-bream.
The number of fishers has decreased from 278,000 to 204,000 and currently 47 % of fishers are over the
age of sixty and there are low numbers of new entrants in the fishing industry. Thus, there is
73
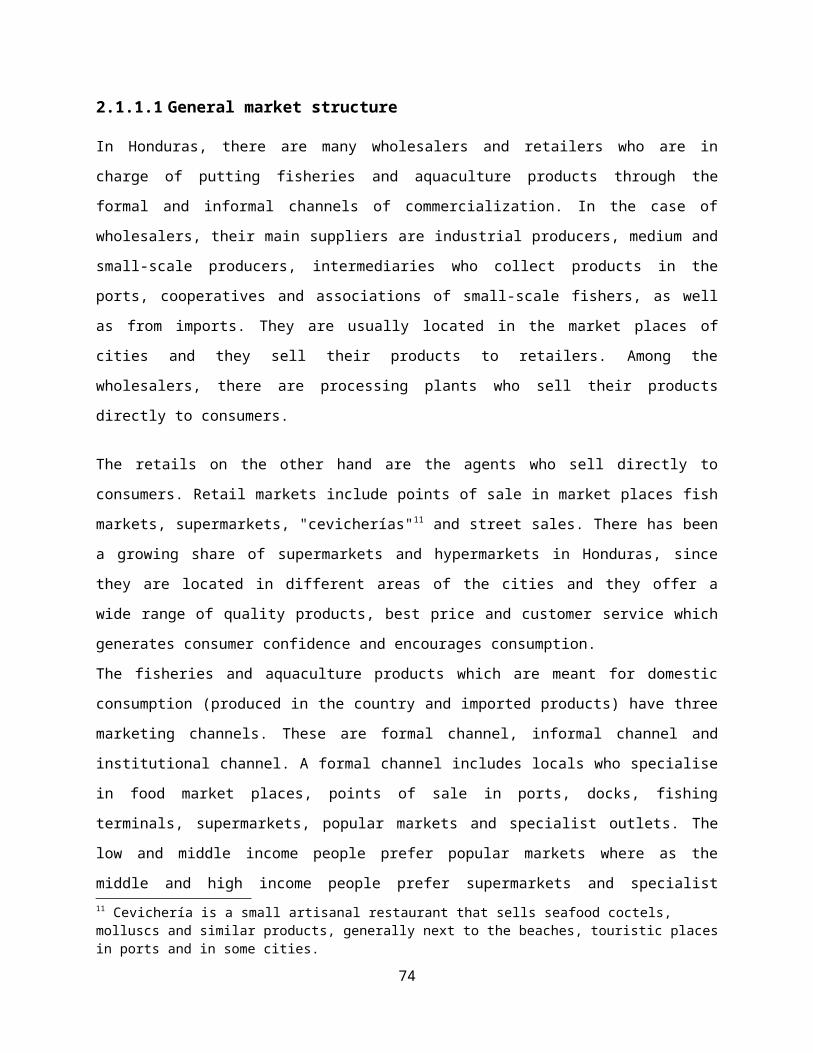
depopulation of the coastal communities.
8.2 Market structure
The domestic fish distribution channel in Japan is composed of multiple layers of traders having two
stages of wholesale markets, see figure 24. The two types of wholesale markets are landing site
wholesale market and consuming site wholesale market. Where the first landing site handles the landed
fish and it includes the middlemen and distributors. Whereas the consuming site wholesale market is a
market located in cities like Tokyo and it includes the whole sellers and brokers. Imported fish can skip
the first two or four steps, and they are usually sold to city wholesale venues or directly to large
supermarkets, see figure 24.
Figure 23: distribution channels of fishery products in Japan
There are 2,914 fishing ports in Japan as of January 2011 and this number exceeds the total number of
landing markets in Japan, not all fishing ports have their own landing markets. In the landing markets the
middlemen and operators usually are the Fisheries Cooperative Associations (FCAs). A middleman
usually acts as a commission agent for fishers to sell their fish. It levies fixed percentage (typically 2-7%)
of the sales prices as commission, and fishers receive the rest of the prices paid by distributors. Although
the governments do not regulate the upper bound of the margin, it has been kept within certain ranges
(2-7% in most cases) through a market mechanism where competitors (other wholesale markets) exist in
74

nearby landing ports located in the same region.
A middleman, acting as an agent for fishers, then sells fish to distributers at the landing site market.
Auction mechanisms exist to settle fish prices between middlemen and distributors at the landing port
market. Although no government permission is required to become a distributor, the number of the
distributors is usually restricted by an autonomous rule agreed upon the members of the market
participants (i.e. existing middlemen). A distributor frequently specialises in the type of fish they deal,
and purchase only a limited variety of species. Consequently, auction prices of certain fish species may
be settled by only one or two bidders, while competitive bidding prices are maintained in some other
fish species.
In the consuming site wholesale markets the operator of the markets shall be municipal or prefectural
governments, and the permission of the Minister of Agriculture, Forestry and Fisheries shall be required
to open a central market. However, the number of consuming markets is declining. In Tokyo, there are
three central wholesale markets for fishery products. These are Tsukiji, Adachi, and Ota, refer to figure
25 to see the volume and value of fishery products of these markets over the years.
Figure 24: the volume and value of the fishery products in the three Tokyo central markets
The whole sellers (Oroshi) in the consuming markets receive fishery products from distributers and/or
importers and sell it to brokers in the consuming markets. Prices are settled through auction or price
negotiations. The whole sellers usually collect approximately 5.5% of the price of fish sold to the brokers,
and the distributors receive the rest of the prices. The brokers, who purchase fish from whole seller s,
sell the fish to supermarkets, small-scale fish retailers, restaurants, or other outlets of fishery products.
The brokers sell to the two major outlets of the fish products, the traditional fish retailers and
75

supermarkets. Supermarkets are considered to have larger purchasing power of fish from brokers in the
wholesale markets. The super markets and traditional fish retailers sell directly to the consumers. Fish
consumption was higher than meat consumption before 2006 but the situation has reversed in recent
years i.e. 2006, 2007, and 2009. Some of the reasons include first, the decrease in the number of older
generation who tend to consume more fish than meat. Second, meat had been expensive food item for
ordinary citizens, but it becomes more popular amid of the rapid national income growth after the
1950s. Third, the change in lifestyle of Japanese people would have contributed to the recent decline of
fish consumption.
8.3 Fishery regulations
There are different fisheries regulations in the Japanese fishing industry, some of these are: permission
by the governor of prefectural government shall be required to open a landing site wholesale market and
consuming site wholesale markets. In addition, permission from the Minister of Agriculture, Forestry and
Fisheries is needed to be a whole seller in the central market. Nonetheless, no government permission is
required to become a broker however; permission or consent by the operator of the market (i.e.,
municipal or prefectural government) is required to be a broker and to join auctions or other trading
activities.
76

9Kenya
9.1 Fish production
The report proposes the study of the following species Lates niloticus (Nile Perch), Rastrineobola
argentea (Dagaa), Oreochromis niloticus (Nile tilapia) and Panilurus sp. (Lobsters).
Lates niloticus (Nile Perch): where the fishery is mainly artisanal but on a commercial basis, the
collection and transportation is organized through agents and part of the catch is industrially
processed while a large proportion is for domestic market.
Oreochromis niloticus(Nile tilapia): where the fishery is also artisanal, a small proportion is
industrially processed but currently does not target export market. The target consumers are the
affluent or upper class consumers through supermarket chains, high class hotels and tourism sector.
Rastrineobola argentea(Dagaa): which is artisanal and its utilization is split between animal feed
industry and human consumption and does not target export market at the moment. A few attempts
to establish export markets have been recorded with low success.
Lobster fishery: that is also artisanal fishery with a very well organized marketing system, agents,
processors and exporters.
The fishery sector in Kenya consists of a complexity of interwoven activities and value chains: fresh
and processed fish, industrial and artisanal processing, domestic and export markets, food and feed
products. Traditionally, Lake Victoria has the largest fishery, it produced 143,908 metric tonnes of
fish in 2006 (Fisheries Statistical Bulletin (FSB), 2007). However, the production declined to 111,369
metric tonnes and 108,934 metric tonnes in 2008 and 2009 respectively, and has the largest number
(44,263) of fishermen operating small crafts and artisanal gears (FSB, 2007). The Coastal and Marine
waters produced 6,959 metric tonnes while Lake Turkana produced 4,559 metric tonnes (FSB, 2007).
Other major fisheries are; Lakes Naivasha, Baringo, Jipe, Chala and the River Tana. Lake Victoria has a
multi-species fishery comprising endemic and introduced species. The endemic species include
tilapiines and haplochromines, cichlids and more than 20 general of non-cichlid fish, including
Mormyrus, catfish, cyprinids and lungfish. The introduced species, especially Nile Perch and Nile
tilapia, were responsible for the increase in total annual fish catches in the 1980s and 1990s.
77

However, in the recent past, there has been a steady decrease in fish diversity and production due to
increase in fishing effort as a result of commercialization of fishing in the last two decades.
In the marine fisheries, there are about 6, 500 artisanal fishermen operating 1,800 simple fishing
crafts with limited access to offshore and the deep sea fisheries and therefore often land very little
catch. These artisanal fishermen land about 7,000 tonnes of fish annually, which is about 4% of the
total national fish production. Fish production from the marine artisanal fishery has remained fairly
stagnated between 5,000 and 8,000 tonnes over the years only showing marginal fluctuations. In
2009, demersal fish species dominated the marine artisanal landings, contributing 49% by weight
while pelagic contributed 30%, sharks and rays made up 10% and crustacean contributed 5%.
Crab, lobsters and octopus fetch high prices locally and in export markets and are increasingly
targeted. The improved market access for these high value crustaceans and octopus has attracted
the interest of sea food companies, local businessmen and migrant fishers. In 2008, crabs were sold
at KES 300 per Kg during low tourist season, which rose to KES 500 per Kg during the high tourist
season. In 2008, the ex-vessel price of lobsters per Kg was KES 600 in Malindi and KES 500 - 600 in
Kipini, while dealers in turn sold them at KES 800 – 1,400 and KES 750 – 900 in the two areas
respectively. The mean catch per lobster fisher per day in 2008 was estimated at 3.3 kg, although this
ranged widely between 0.1 Kg and 20 Kg. Therefore lobster fishers earned an average of about KES
2,000 per day.
Octopus is highly valued species and it attracts many migrant skilled fishers especially from Pemba
Island who are engaged by dealers. Octopus fishing takes place mostly during the North East
Monsoon, especially from October to March. The dealers pay fishers KES 50 for each Kg of Octopus.
The local dealers have shops close to landing sites purposely for buying and preserving octopus,
which they resell to one company called Sea Harvest, which specializes in export of octopus. Dealers
around Malindi buy octopus at KES 70-80 during high supply and at KES 120 per kg during low
supply. They in turn sell to hotels at KES 130-150 per Kg during low supply season and KES 120-250
per Kg during high season (Ochiewo et al, 2008).
Fish production in Lake Victoria is artisanal, employing mainly gill nets, baited long lines, traps and
seine nets. There are currently no mechanised fishing activities in the Kenya part of Lake Victoria.
Fish production from Lake Victoria grew exponentially until1990 when signs of decline were realized
78
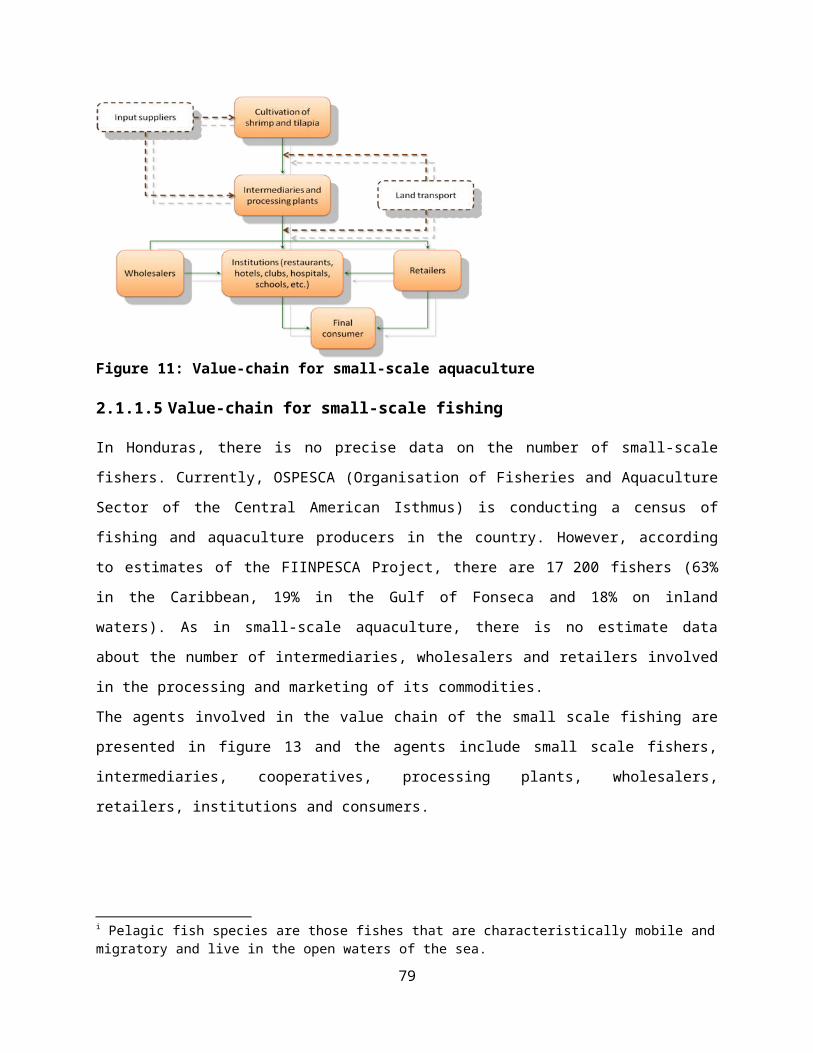
for the first time. The exponential growth in production in the 1970s and 1980 was attributed to the
Nile perch (Lates niloticus) explosion. In recent years, the total annual production of fish from Lake
Victoria fluctuates between 130,000 and 140,000 metric tonnes annually.
Fairly consistent data on the number of fishers is available from 2000 to 2011 when a regional
biannual frame survey was initiated in Kenya, Uganda and Tanzania. The number of fishers was
41,912 in 2010 as compared to 42,257 in 2008, 44,263 in 2006, 37,348 in 2004, 54,163 in 2002 and
38,431 in 2000.
In the case of aquaculture, most fish farmers in the country have formed themselves into producer
groups or association making it easy for advisory service delivery and economy of scale in the
acquisition of farm inputs. During the year 2009, Sagana Aquaculture Centre produced 448,359
fingerlings (of Tilapia, Catfish, Goldfish and Swordfish) worth KES 1,669,914 while Kiganjo Trout
Hatchery produced 53,993 fingerlings worth KES 863,904. Among the recent government efforts to
promote aquaculture include formation of Ministry of Livestock and Fisheries Development in 2002
and later formation of a fully fledged Ministry of Fisheries Development in 2008 where aquaculture
received major attention which it had always deserved in the past but in vain.
9.2 Fish processing
There are 17 industrial fish processing companies in Kenya all of which are export oriented and can
be classified as either land based establishments or water-based freezer vessels. These companies
mainly produce frozen and chilled fish for export to European and other non-European markets.
These companies deal in different fish species including Nile Perch, prawns, lobsters, octopus,
cuttlefish and squids. The 17 industrial fish processors in Kenya have an installed capacity of 437
Tonnes per day of which only 162.7 tonnes per day is utilised.
The introduction of the Nile perch, while ecologically catastrophic, has been of short-term benefit to
large fishing companies around Lake Victoria. The long-term benefit is at stake as over-fishing
reduces its population. In 2004 there were 14 fish processing and exporting companies around the
lake. But due to diminishing fish resources, only 6 factories are operational to date.
The fish industry has a chain of stakeholders which include the artisanal fishermen, agents and sub-
agents, and processors. The fish market has a structure that categorizes traders focusing on the
internal market and others dealing with the international market. The later market requires high fish
79

handling standards of Nile perch fillets, prawns, octopus, cuttlefish and lobsters that are exported to
various countries.
9.3 Transportation
Transportation of fresh fish at production is done by the fishers themselves and using fishing crafts.
At landings, fresh fish for industrial processing is packed and transported in refrigerated trucks to the
processing plants. The trucks are usually owned by the industrial processors. Most of the export fish
is transported by air in containers designed for fish transport.
Fresh fish for domestic market is transported mostly in private small commercial vehicle or by public
transport for small scale traders. The fish is usually packed in ice placed in polythene sheets and
placed in traditional baskets before transportation. Fish packed in this manner usually ends up in
Nairobi and Mombasa through overnight public transport systems.
For lobsters, the fish is kept alive until the dealers transport them either for export purposes or local
consumption. This is usually by road to Malindi, Kilifi, Mombasa and some end up in Nairobi.
Processed fish such as sundried Nile perch, tilapia and Dagaa and deep fried Nile perch meant for
domestic market are transported by road to the various urban markets. The transport may be private
or public and this depends on the quantities to be transported.
9.4 Final consumption
The fish products in Kenya are for export and domestic use, there are many export markets including
Europe, the Far East, Middle East and others. In Europe the main markets in order of importance are
The Netherlands, Italy, Germany, Belgium, Portugal, Spain, Cyprus, Malta, France and Poland. The
European Union (EU) countries imported 34 % and 37% of Kenya’s fish exports in 2002 and 2003
respectively. The EU accounted for an average of 36% of the value of exported fish in the two years.
In the Far East the main markets, in order of importance, are Australia, Japan, Hong Kong, Singapore,
Malaysia and China. This block imported 27% and 24% of Kenya’s fish exports in 2002 and 2003
respectively. The fish imported by these countries represented, on average, 26% of the value of fish
exports.
80

In the Middle East, it is dominated by Israel as a single and important importer of Kenyan Nile perch.
A small amount of fish is also exported to the United Arab Emirates (UAE). This block imported 33%
of Kenya’s fish in 2002 and 34% in 2003. Of these, Israel alone imported 28% and 32% in the two
respective years, making it the most important single destination for Kenyan Nile perch. The fish
imported by Israel accounted for 29% of the value of total fish exports.
Apart from the above export markets Kenya also exports to counties like United States of America
(USA), Venezuela, Colombia and Cuba. Available data indicate that some little fish have recently been
exported to African countries, although the nature of fish export could not be verified. These
countries accounted for 5-6% of fish exports both in terms of quantity and value.
During 2003, a total of 11,114 metric tonnes of fish and fish products were exported from Kenya.
The export earned the country KES 3,715,607,000.00 in foreign exchange as compared to 18,506
metric tonnes in 2009 and earning Kenya KES 4,170,358 in foreign exchange. Fish and fish products
exported were mainly Nile perch fillets, fish maws, Octopus, sharks Sword fish, Crabs and fish skins.
According to KMFRI’s catch records Dagaa constituted about 77, 000 metric tonnes, or 44% of fresh
fish landed on the Kenyan sector of the lake in 1995 (Abila and Jansen 1997). In each of the first
eight years, it has constituted between 37- 45% of the catch (Othina and Osewe-Odera, 1996).
Previously Dagaa has been mainly used as food for humans and has often been referred to as the
“poor man’s food”. The animal feeds industry stated using Dagaa as the main source of crude protein
in the industry in the early 1990s.
For Nile perch exports, the quantity exported from 1996 to 2009 was in the range of 18,000 to
42,000 tonnes, leaving behind 70% to 89% for local consumption. Lobster export ranged from a low
of 8 tonnes to a high of 165 tonnes during the same period and leaving behind about 3.5% to 90% of
the catch for domestic consumption.
The Dagaa trade is more informal and the amounts exported up to 2008 have been minimal. For
Lobsters, no detailed analysis has been carried out on the proportions exported and that for local
consumption.
The Nile Perch accounts for 84% of the total fish exports followed by the tuna accounting for 13%
while the other species account for 3%. The export volumes of Nile Perch show a gradual increase in
volumes though this was interrupted by the fishing ban imposed in 1998/1999 by the European
Union on fish from Lake Victoria. Kenya’s main markets for the Nile Perch are the European Union,
Far East and Israel. Before the exports ban, the EU (Netherlands, Belgium, Germany, Portugal, Italy,
France and Spain) accounted for about 62% of all fish exports from Kenya. New markets emerged
81

during the ban, among them Israel, the Far East, North America, the Middle East, and other African
countries. Israel became the most prominent single importer of Kenya’s fish i.e. the position it has
retained to date. The EU is still, however, the preferred market for fishery exports from Kenya
because of its relative proximity and accessibility, which allows for greater profit margins. Thus,
meeting safety standards in the EU is important for the industry’s future.
During 2009, a total of 18,114 metric tons of fish and fish products were exported. The exports
earned KES 4,170,607,358 in foreign exchange. Fish and fishery products exported were mainly Nile
perch fillets, fish maws, Octopus, sharks Sword fish, Crabs and fish skins. Nile perch fillet exports
accounted for 87.4% of the total quantity and 84.73% of the total earnings. Fish maws contributed
5.6% in quantity and 11.3% in value while Octopus contributed 4.8% in quantity and 3.2% in value.
9.5 Market structure
The largest species of fish processed and exported is the Nile Perch. Other commercially important
species in the domestic market are the small sardine fish and tilapia.
The domestic Market commands about 70% of the total fish market. It is however not well defined or
organized and involves buying fish at the beach by small scale traders and selling to various open-air
markets and fish shops. The fish are sold either dried, fresh or processed for later consumption. The
Artisanal Fish Processors (AFPs) prepare dried and smoked fish. Nairobi forms one of the main
destinations for fish from Lake Victoria, Naivasha, Coast (marine) and even Tana River Dams. The main
markets in Nairobi are Gikomba and City Markets. In the year 2000, the total fish traded in Nairobi was
12,253 metric tonnes, valued at KES 121milion. Other local markets include Central and Eastern
Provinces, who buy fish from fish farmers in the Tana River Dams. Some parts of Rift Valley Province also
receive fish from Lake Turkana, Naivasha and even Lake Victoria. The markets in other districts are fairly
small.
9.6 Fishery regulation
The Fisheries Department is the national institution mandated to manage the fisheries sector and
operates under the Ministry of Livestock & Fisheries Development. Basic fisheries legislation is set out in
six parts and 26 sections of the Fisheries Act 1989 (Act No. 5 of 1989; revised 1991). The Act applies to
both marine and inland fisheries, and broadly empowers the Director of Fisheries, with the approval of
the Minister, to issue regulations to promote the development of fisheries and aquaculture and to
ensure the proper management of specific fisheries, including the possibility of declaring closed seasons
82

and/or areas, access limitations, and restrictions on fishing methods, gear, and the characteristics of fish
that may be caught.
The Act further establishes bases for:
i) Registration of fishing vessels (obligation of registration of fishing vessels and definitions of
governing conditions).
ii) Licensing (Fisher folk, Traders)
• Section 8 of the Fisheries Act (Cap 378 of 1991) provides that no person other than persons
fishing for their own consumption shall catch or assist in catching fish in Kenya fishery waters
otherwise than in accordance with the terms and conditions of a valid license issued to him
under the above Act.
• The Fisheries (General) Regulations 15 (1) provides that no person shall trade in fish or fish
products unless he is in lawful possession of a fish traders license issued under this regulation
and is operating on conformity with the terms and conditions of the license.
• Obligation to be in possession of a valid license to fish Kenya waters.
• Local fishing vessel requirements.
• Foreign fishing vessel requirements.
• Other licenses (requirements for any other fisheries activity including sport fishing).
iii) Offences and enforcement (defines specific offences and penalties):
• Prohibited methods of fishing.
• Trade and commerce of fish illegally caught.
• Obstruction of officers
• Powers of officers.
• Procedure of forfeiture
iv) General provisions (miscellaneous):
• Prohibition on fishing for marine mammals in Kenyan waters.
• Specification of Minister's powers to make regulations (e.g. to organise and regulate marketing
and distribution of fish; establishment of credit schemes, etc.).
v) Kenya Fishing Bans (Omena)
• The ban on fishing and trading omena (Rastrineobola argentea) was implemented in 2001 in
order to conserve vulnerable stocks during the peak breeding period and reduce the overall
effort on this fishery. The ban was published in the Kenya Gazette Notice No.7565-The Fisheries
Act (Cap 378) – Imposition of Management Measures- gave notice that fishing Rastrineobola
83

argentea (Omena) in Kenya waters of Lake Victoria during the period from 1st April to 31st July
each year is prohibited and the respective periods wherever specified, shall be closed seasons or
areas for purposes of this notice.
10Maldives
10.1 Fish production
The Republic of Maldives is an archipelago of 26 natural atolls, consisting of 1190 coral reef islands in
the Indian Ocean. The country has abundant water based natural resources and majority are in the form
of multicoloured coral reefs, tropical ocean fish of every colour and shape, crustaceans, turtles, seaweed
and shells. The abundance of these natural resources forms the basis of the country’s two most
important economic activities - fisheries and tourism. However, the country has few land based natural
resources and the total land area suitable for agriculture (3000ha) is estimated to be less than 10% of
the country’s total land area. Similar to many of the Small Island Developing States (SIDS), the Maldives
encounters various challenges and threats such as environmental disasters, international market shocks,
communication and service delivery problems.
According to the latest figures, the total population of the Maldives is 324,992 of which around 34.68%
live in the capital – Male. The annual population growth is estimated to be around 1.7%. The life
expectancy of males and females is around 71 and 72 years respectively. The country’s literacy rate is
around 98.94%, which is higher compared to neighbouring countries. During the past two decades,
Gross Domestic Product (GDP) growth averaged around 7.5 %, raising per capita income to about US$
2,800 per year. In the past twenty five years the fishery industry contributed about 3 to 12% of the
country’s GDP.
The fisheries sector in the Maldives has been sustainably providing employment and trade for thousands
of years, it engages about 20% of the total labour force. Apart from creating employment, fish is a staple
food in the Maldives, with the exception of some poultry production, and it remains as the main source
of protein comprising around 85% of total animal protein. In addition, the country is one of the highest
fish consuming nations in the world having around 181kg per capita per year. The fishery sector still plays
84

a great role in the livelihoods of the rural communities of the country in terms of trade, employment and
self-sustenance. However, in the central areas of the country tourism has started to play a major role in
the livelihoods of the people. Thus, with the enormous development in the tourism sector, the focus of
policy makers and investors has shifted from the fisheries sector towards the tourism sector.
The fish catch in the Maldives has increased from 21,542MT in 1966 to 94,286MT in 2010. However, the
sector has suffered immense losses due to low harvest and the amount of catch dropped from
180,981MT in 2006 to 141,074MT in 2007- see figure 26. If the case of the two most important species
(skipjack tuna and yellow fin tuna) is considered, the main reason for the decrease in the production of
skipjack tuna could be its stock because it is probably near full utilisation and the stock should be closely
monitored. In the case of yellow fin tuna, its catches in the Indian Ocean should not increase beyond
300,000t in order to bring the stock to biomass levels that could sustain catches at the MSY level in the
long term. If recruitment continues to be lower than average, catches below 300,000t would be needed
to maintain stock levels. Additional reasons for the low fish catch include first, the increase in sea surface
temperature which affects the aggregation process resulting in poor catch ability. Second, the increase in
fuel prices and other commodities in the world market also influences the fish catch.
Figure 25: Fish landings in the Maldives from 1970 – 2010
Skipjack tuna is considered to be the most important species caught in the Maldivian tuna fishery
comprising 70% of the country’s total catch followed by yellowfin tuna (17%) and other species. Skipjack
tuna fishery is primarily a live-bait; pole and line fishery. In the case of yellowfin tuna apart from pole
and line fishery, hand line fishery is also used for the catch of large yellowfin tuna (more than 100 cm FL).
85

Yellowfin tuna caught in the Maldives are, mainly, surface swimming juveniles within the size range of
30-60cm. Hand lining and trolling are also used to catch large size, more than 70cm, Yellowfin tuna.
Maldives ‘yellowfin tuna’ catch records include a small number (around 5%) of bigeye tuna.
The Government has initiated various programs for the development of fishery. The most significant
developments are the mechanisation of fishing vessels and the introduction of the Fish Aggregating
Devices (FAD), locally called OlivaaliKandhufathi. With the mechanisation of the fishing fleet, the
efficiency and range of operation of the fleet has increased. However, as tuna fishery in the Maldives is
based on live-bait pole-and-line, fishers often spend long time searching surface-swimming schools of
fish. Thus, FADs help not only to reduce searching time and fuel costs, but also increase production. By
September 2011, the Government of Maldives has deployed 50 FADs around the atoll rims of the
country.
Figure 26: Price of skipjack tuna by the two main fish companies
Fishers had almost a fixed price for their catch for decades, since a single government company has a
monopoly power in the post-harvest sector. The government owned MIFCO had a social responsibility of
buying fish from fishers, for instance it was obliged to buy fish from fishers when the world tuna market
collapsed in 2000. The Government of Maldives was forced to privatise the skipjack tuna post harvesting
sector in 2003 mainly due to the inability of MIFCO to buy catch from the fishers. Currently there is only
one company, out of the four licensed private companies, in operation. Thus, the State owned MIFCO
and the private company (Horizon Fisheries Pvt Ltd) specialise in exporting skipjack tuna, juvenile
yellowfin tuna and bigeye tuna. The average price of skipjack tuna per kg differs among the two
companies operating in the post harvest sector. Thus, starting January 2006 until December 2010 the
86

price figures of MIFCO and Horizon were MRF 5.67 and MRF 6.83 respectively-see figure 27. However,
the prices during the last quarter of 2010 increased to around MRF10.87/kg. In the case of yellowfin
tuna, the average price fluctuated over the years and the average price from January 2007-October2011
are indicated in figure 28. In 2011, the average price of yellowfin tuna was around MRF 60 per kg.
Figure 27: Average yellowfin tuna prices in The Maldives
In the Maldives the term ‘reef fishery resources’ refers to all fisheries except tuna. These are reported as
one category in the national statistics which include reef and oceanic shark, jack, scads, bream, jobfish,
sail fish, seer-fish, rainbow runners and dolphin fish (mahimahi).The reef fishery resources were hardly
exploited until the late 1990s. However in recent days, the reef associated demersal species are heavily
exploited mainly by tourists, recreational anglers and industrial fishers targeting for the export market.
Reef fishing is done through different gears, depending on the targeted species. The main gear used in
reef fishing is a simple, single hook hand line. Live-bait hand lining is also used occasionally when
targeting jack and large snapper.
A separate grouper fishery, especially targeted for the export industry was also initiated in 1993 in Vaavu
atoll. In about two years time the fishery spread throughout the Maldives and reached its peak,
exporting 1000 tons in 1995. Due to the sudden exploitation of groupers, there was a huge impact on
the grouper stock. Groupers have a very high market value in Southeast Asia mainly in China, Hong Kong
and Taiwan. Grouper fishing is carried out mainly through visual-aided snorkeling and the gears used are
lines with normal hook and sinkers.
Maldives had a minor shark fishery for centuries where sharks were mainly used as a source of oil for
fishing boats. The three main shark fisheries are oceanic shark, reef shark and deepwater gulper shark.
Traditionally, all Maldivian fishing boats (dhoani) were made of wood and require regular hauling up on
the beach to be cleaned and painted with oil, and shark livers were the main source of this oil.
In the 1960s and early 1970s, the Maldivian shark catches was low however, an expansion of shark
87

fishing effort was made since 1976-77 see figure29. Thus, in 1977-2006 the average estimated reef and
oceanic shark catch was around 1440 tone/year. In the late 1970s and 1980s reef shark was probably the
dominant catch however, reef shark was overfished and in the 1990’s oceanic shark dominated the
industry. Since the peak in 2004, estimated catches of shark have declined dramatically.
Apart from the above stated fishing activity, the idea of developing marine mariculture industry has been
introduced recently to diversify the country’s fisheries sector and currently a few mariculture pilot
projects are carried out in the Maldives.
Figure 28: Maldives shark production
There are three major types of fishing vessels used in Maldives, these are mas-dhoani, vadhu-dhoani and
bokkuraa. The first vessel type are Mas-dhoanis, these are open boats with deep bilge and the later
generation of these fishing vessels which exceed 15.6m in length and beam of 5.0m, can hold minimum
of 6MT of fish in ice. Mas-dhoani is used in both the skipjack tuna and yellowfin tuna fishery. The second
vessel types are Vadhu-dhoani, these vessels are smaller than mas-dhoani and they range around 5-7m
in length. Vadhu-dhoani are used mainly for trolling within the atoll basin and in the reef walls outside
the atolls, plus for hand line reef fishing as well as gill netting for sharks. The last vessel types are
Bokkuraa, which are small row boats about 2.5 m in length and are mainly used as tender boats between
the vessel anchorage and the island. In 2009 there were 1033 fishing vessels, of which 920 were
mechanised pole and line vessels (Masdhoni), 42 mechanised trolling vessels (VadhuDhoni), 18 sailing
trolling vessels and 4 row boats (Bokkura).
10.2 Fish processing
88

Before 1970s there were not many forms of fish processing in the Maldives. Basically there were two
types of end products namely traditional smoked and dried tuna (Maldive Fish), and salted dried fish. In
the early 1970s local catch increased considerably due to the mechanisation of fishing vessels. As a result
of the increased local catch, there was a greater need for product diversification and enhanced value
added products, resulting in the establishment of a joint venture canning plant in the island of Felivaru in
1978. However, due to price fluctuation in international markets in early 1980’s, the Japanese company
ceased its operation in Maldives. Thus, the government of Maldives purchased the facilities and
upgraded it to continue the canning and freezing operation in Felivaru.
10.3 Final consumption
Skipjack tuna is among the most important Maldivian diets hence around 20-30% of the total catch is
consumed by locals and tourists whereas the rest of the catch is exported. The Maldives exports
different products of skipjack to countries like Thailand, Sri Lanka, Iran, UK, Tunisia, Japan and Germany.
Thailand is the main export market for frozen and fresh skipjack whereas canned skipjack is exported to
Germany and UK. In the year 2010 the Maldives exported around 59% of its total skipjack export to
Thailand and around 23% to Sri Lanka.
Generally the fishery sector contributes to the country’s export for instance, in the year 2010 it
contributed around 96% of the country’s total physical exports which was worth 74 million US$ (nominal
value). Table 21 presents the export of tuna products in quantity and value in the year 2010. The skipjack
tuna product with the highest value is frozen or stipe-bellied bonito followed by dried skipjack, prepared
preserved skip jack and salted dried skipjack.
Table 21: Export of skipjack tuna products by quantity and value (MRF) in 2010
Description of the Product Quantity (Kg) Value (MRF) Price per kg (MRF/kg)
Frozen Skipjack Or Stripe-Bellied Bonito 16,352,427.70 235,959,209.05 14.43Dried Skipjack (Maldive Fish) 3,807,397.10 143,172,548.01 37.60Salted Dried Skipjack 1,621,606.95 15,891,815.47 9.80Prepared, Preserved Skipjack 688,013.78 36,528,655.51 53.09Fish Chips ( Skipjack , Tuna ) Dried 44,692.00 1,038,371.70 23.23Fresh Or Chilled Skipjack Loins 134.75 5,066.61 37.60Fresh Or Chilled Skipjack Or Stripe-Bellied Bonito 10.04 232.20 23.13
The second most common species is Yellowfin tuna, where more than 95% of the catch is exported and
the rest is consumed in the domestic fish markets. Yellowfin tuna is exported to different countries such
89

as Thailand, France, Italy, UK, Tunisia, Germany, Iran, Spain, Sri Lanka, Switzerland, USA and The
Netherlands. The highest export revenue in 2010 was earned from Thailand (60%) followed by France
(12%) and Italy (9%). Fresh and chilled yellowfin tuna products are mainly exported to France and Italy.
Whereas, canned tuna is preferred in UK and Germany. In addition, frozen loins, steak, fresh and chilled
yellowfin tuna are exported to Europe and United States.
Apart from tuna, reef fish is also locally consumed when tuna harvest is low. The majority of reef fish is
consumed by tourists and the tourist resorts purchase around 167 kg of fish per night to feed their
guests and staff where 38% was estimated to be reef fish (snapper, emperor and grouper). The Maldives
main reef export markets are Taiwan, Sri Lanka and Hong Kong. Taiwan earns the highest reef export
revenue (48%) followed by Sri Lanka and Hong Kong.
In the case of groupers, there was a dramatic increase in the quantity exported from 1994 to 1995- see
figure 30. One of the most important points to be referred in figure 30 is the trend shown in the export
of live groupers. Live export reached a peak of over 400,000 annually between 1995 and 1997, but by
2004 it declined to a quarter of this number. However, live exports have been in an increasing trend since
2007 though the rate of increase was very slow compared to that of fresh/chilled exports. Groupers are
exported mainly to Taiwan and Hong Kong but some of the products are exported to Thailand, Greece,
Malaysia, Singapore, USA and Spain. Groupers are exported in the form of fresh, chilled, live and to a
small extent frozen form. Live groupers are exported mainly to Hong Kong (99%) whereas; fresh and
chilled groupers are exported to Taiwan (96%).
Figure 29: Exported quantity of fresh/chilled and live groupers
90

Source:
10.4 Fishery regulations
In the Maldives there are no fishery co-operatives and the fishers sell their catches individually. Some
regulatory measures are put in place in the skipjack tuna and yellowfin processing sector. The
government regulated the skipjack processing sector by limiting the number of post harvesters which
might indirectly affect the catch levels until the skipjack processing sector was opened for Small and
Medium Scale Enterprises. The yellowfin processors have to pay a royalty charge depending on the
weights of the fish which could also indirectly affect the catch limits. Despite the arrival of the four new
private companies in the harvesting sector, fishers were offered steady price which does not reflect the
high market price the buyers enjoy. In order to protect the livelihoods of the fishers from the competitive
post harvesting companies, the government enforced a minimum base price under section 12 of the
‘Skipjack Purchase and Export Regulation 2001’. Even though the processing companies have never sold
at a price close to the base price, the government has resisted in abolishing the base price.
In 2010, fisheries licensing scheme was introduce for commercial fishers under the regulation “Licensing
regulation for fishing, processing and aquaculture intending for export.” Fishers intending to export fish
or sell to an exporter are required to get licence under the regulation. The licence is renewed annually
after paying a nominal fee. The Government of Maldives stopped issuing or renewing licences for foreign
vessels since March 2009. It was mainly due to lack of compliancy regarding illegal fishing in the
Maldivian water. The longliners which operated before 2009 were mainly from Indonesia and Taiwan and
their main catch were deep swimming adult yellowfin tuna and bigeye tuna. These longline vessels use
to pay royalty for their catches, and they were restricted to fish outside 75 miles. In December 2010, the
Government announced its plan to develop a local longline fishing fleet to catch deep swimming adult
yellowfin and bigeye tuna. The Government of Maldives has submitted a fleet development plan which
includes the plan to develop a longline fishery in the Maldives. According to this plan Maldives will allow
30 longliners to operate between 100 to 200 nautical miles within Maldives EEZ in 2012. In addition, in
the next ten years around three new entries will be allowed.
Under the “yellowfin tuna fishing and exporters regulation”, companies exporting yellowfin tuna had an
agreement with the fishers where the fishers were forced to sell to a particular exporter until 2009. This
allowed the export companies to dictate the prices whereas the fishers were getting lower price. The
Government revised the above stated regulation and removed the clause in 2009. This allowed the
91

industry to be competitive where there was no restriction for new fish processors entering the market
and it also allowed fishers to sell to any processor. However, some of the fish processors provide
incentives, such as ice and fuel, to fishers. In addition, some of the processors also have contracts with
fishing vessels which force them to sell to specific processors.
Development and management of capture fisheries in the Maldives is governed by the Fisheries Law of
the Maldives (Law No. 5/87, August 24, 1987). However, the emphasis of the Law is mainly on protecting
the sovereignty of Maldivian waters and protecting local fishers. The Environmental Protection and
Conservation Act (EPCA) (Law Number 4/93) also contains provisions for the conservation of biological
diversity, protected areas and natural reserves.
The fishery advisory board (FAB) banned the harvest of any shark species within 12 mile radius from the
rim of the Atolls in the Maldives effective from March 1, 2009. The main reason for the ban could be
associated to the high economic contribution of sharks in the tourism industry than in fishing industry. In
addition, the Ministry of Fisheries and Agriculture has banned fishing for dolphins, berried female
lobsters and those less than 25cm in total length, whales, giant clams, triton shells, black coral, napoleon
wrasse, whale shark and turtles. However, these management regulations and decisions are set ad-hoc
and protect the ‘fishers from fishing’. Recently, the government has been faced with heavy criticism on
enforcement of such regulations and monitoring.
10.5 Data availability
The data collection for the Maldivian fisheries statistics officially began in 1959. Island offices report daily
on fish catches to the Ministry of Fisheries and Agriculture (MOFA). Data sheets are also compiled
monthly by the island offices and are returned to Male’ via the atoll offices. The atoll offices act as a
mediator to collect all these monthly reports from the islands to the MOFA. Economic Research and
Statistics Services (ERSS) compiles these records and collects catch and effort data directly from the
Male’ market. ERSS produces annual report of ‘Basic Fisheries Statistics’ as well as periodic multi-annual
summaries. These reports include not only catch and effort statistics, but also export data collected by
the Maldives Customs Service.
There are also concerns regarding over and under-reporting of data in the Maldives data collection
system. For the period of 1970-1984, Anderson (1986) suggested over and under-reporting may to some
92

extent cancelled out and there is a possibility of ±15% inaccuracy in the data. In addition, Parry and
Rasheed reviewed the accuracy of 1994 skipjack and yellowfin tuna catches and suggested a 5% under-
estimation in skipjack tuna catches and 15% in yellowfin tuna catches.
11Morocco
11.1 Fish production
Morocco has a coastline of 3,500 km and is characterized by the diversity of its marine resources
however, pelagic and cephalopod species represent a high percentage in Moroccan seafood exports.
Thus, the first five species which generate high income are sardine, anchovy, hake, whitefish and
octopus.
The country’s fish production originates from coastal and artisanal fisheries with a potential for fish
production estimated at 1.5 million tons. The annual fish production is over one million tons
representing 2.5% of the country’s GDP. Exports average 1.4 billion representing 15% of total exports and
over 50% of Moroccan exports of food products. The turnover generated by seafood products is
witnessing an annual growth of 5% (around $800 million). The fisheries sector generates around 170,000
direct and 490,000 indirect jobs.
The artisanal fleets consist of wooden boats having a length of five to six meters, equipped with
outboard motors. Currently, there are around 15,000 boats and this is a significant increase when
compared with the number of boats in 1981(3,600). In the fishing villages, specifically in the village
‘Souiria Kdima’, the fishing gear used to catch whitefish is the net mesh (30mm in diameter). The
demersal fishermen make around 224 fishing trips per year. In the case of Hake the fishers use trammel
nets for fish capture and currently the fishing activity of Hake decreased due to resource depletion.
While harvesting octopus the jig or octopus pot are used.
According to the fishers, fish prices have increased slightly over the years, and so have costs, which
guarantee stability of the average profit margin of the fishers. However, the profit margin for white fish
(30%) and octopus (35%) is the highest in the South Atlantic. In the case of whitefish, whole sellers are
the one who generate the highest profit margin in the chain (around 50%) and in the Octopus the fish
processors have the highest profit margin (40%). In the case of Octopus, due to its scarcity and high
93

demand, the profit margin of the owners of Octopus fishing boat has increased.
In Morocco there are different costs and profit structure for each fish species as indicated in table 22.
Some fish species might also have different cost and profit margins depending on the fishing village
(area) e.g. Octopus. Each species has its own costs and profit margin like tax, maintenance, fixed costs,
variable costs crew share and ship owner’s profit- table 22 presents the detailed cost and profit margin
of the most important species of the country.
Table 22: the cost and profit structure of different fish species
Costs and profit per selling price
SpeciesAnchovy Demersal
fishHake Octopus Sardines
Oued Eddahab-Legouira region
Souiria KdimaFishing village
Frozen fresh Frozen
Taxes 22% 6% 5% 4% 6% 2% 17% 12%
Maintenance 4% - -Fuel 20% - -Common costs - - - 11%Fixed cost - 8% - 4%Variable cost - 44% - 24%Charges - - 30%Raw material cost 48%Production costs 6% 33%Amortisation of boat and its equipment
4%
Other costs 10% 2% 8%Ship owner costs 5%Raiss share(owner responsible)
22%
Crew share 22% 21% 33% 30% 40% 43%Ship-owner profit 22% 21% 32% 32% 26% 24%Industrial profit 20% 9%Total 100% 100% 100
%100% 100% 100% 100% 100%
11.2 Fish processing
In Morocco there are around 32 processing units with annual production capacity of 300,000 tonnes of
raw materials and total export of 3.63 billion Dirhams (in 2009). The processing units (e.g. 84 freezing
units in the industrial zone of Dakhla) specialise on different products based on the fish species. Some of
the products include frozen fish, canned fish, semi canned fish, fresh fish, flour, and oil.
The fish canning industry in Morocco is the result of long evolution and accumulation of know how. The
main canned species are sardine, tuna and mackerel. Sardine is sold mostly in the local markets as fresh,
frozen and canned. The canned sardines represent 90% of the total fish canned export of the country.
94

Sardine freezing plants work about 220 days a year, industrial units in Dakhla process about 30 tons/day.
Currently, the export price of entire sardine is MAD 4.20 DH per kg (FOB Dakhla’s Port) but it was set at
MAD 6.60 per kg at 2010.
Octopus: it directly heads to the freezing units to be processed in to whole frozen/chilled or as beaten
and chilled octopus mostly for export mainly to Japan and Spain. The activity of frozen octopus is
irregular because the products scarcity. These plants freeze and export octopus, when available, and
work on other fish species like sardine. Nowadays, the average annual quantity of processed octopus by
freezing unit is 800 tons per year. The large fluctuation of octopus purchasing prices (from MAD 50 to
MAD 86 per kg in 2011, instead of MAD 45/kg in 2010) has influenced selling prices for export that are
between €9 and €11 per kg in 2011 instead of € 6 per kg in 2010.
11.3 Final consumption
Morocco is now a regional platform essential for recovery and export of fish destined for the most
demanding markets, where The European Union remains the main export market. In the last two years
the main exported products were processed canned pelagic (sardines and mackerel), semi-canned
anchovy, frozen cephalopods (octopus) and frozen white fish. Morocco’s exported fishery products are
presented in tables 23 &24. The highest volume of export was in the year 2009 (1,160,935 tonnes)
followed by 2010 and 2001 refer table 23. The country exports mainly frozen fish followed by canned
fish, semi canned fish, fresh fish, flour, and oil see table-24.
95

Table 23 Fishery products export volume from 2001-2010
I-1 EVOLUTION DE LA PRODUCTION HALIEUTIQUE NATIONALE DE 2001 A 2010
TYPE DE PECHE /ANNEES 2001 2002 2003 2004 2005 2006 2007 2008 2009 2010
PECHE COTIERE ET ARTISANALE
978 518 892 865 865 473 862 390 865 378 805 451 823 214 779 386 884 624 896 021
POISSON BLANC 73 970 88 879 95 502 91 985 85 957 87 461 73 392 79 639 82 486 72 169POISSON PELAGIQUE (*) 861 444 754 427 742 957 748 058 742 858 682 170 715 110 657 478 757 969 792 317CEPHALOPODES 38 114 44 906 21 369 16 348 28 916 28 466 26 796 36 120 38 221 25 381CRUSTACES 4 606 4 644 5 368 5 405 5 357 5 046 6 719 5 501 4 883 4 563COQUILLAGE 384 8 277 594 2 794 2 308 1 197 648 1 064 1 591
PECHE HAUTURIERE 113 221 66 661 67 473 75 480 113 215 90 375 88 457 114 901 142 935 158 367
Céphalopodes 69 874 32 019 17 894 13 717 42 302 35 506 24 029 40 782 50 802 30 008 Poisson blanc 25 657 17 343 13 637 12 045 18 076 19 378 21 685 17 528 25 245 24 586 Crevettes 8 690 7 089 5 949 4 020 4 158 3 657 4 014 5 763 4 628 3 834 Poisson pélagique 9 000 10 210 29 993 45 698 48 679 31 834 38 729 50 828 62 260 99 939
AUTRES ACTIVITES 13 443 10 678 13 675 15 454 16 180 17 164 15 394 11 214 12 624 9 131
Algues 10 015 7 919 11 131 13 126 12 812 14 870 12 373 9 037 10 368 7 405 Aquaculture 731 1 047 1 078 975 1 466 291 441 214 272 300 Corail 7 22 11 6 3 2 1 4 3 4 Madragues 2 690 1 690 1 454 1 347 1 899 2 002 2 579 1 959 1 949 1 367 Oursins 32 55
AFFRETEMENT 707 43 101 71 294 106 650 113 498 120 752 73 333
TOTAL 1 105 182 970 204 946 621 954 031 1 037 874 984 284 1 033 715 1 018 999 1 160 935 1 136 851
EN VOLUME ( Tonnes)
Table 24 Value of exported fish in thousands of Dirhams for the year 2010
Destination/Activity Frozen Fresh Canned Semi-Canned Flour OilEuropean Union 3 124 581 869 327 1 527 470 862 508 419 293 232 027Rest Of Europe 85 543 5 843 41 165 3 131 242 848 132 942Oceania 2 671 13 373 10 947Middle East 21 421 194 380 939 4 852 28 171Asia 693 277 11 243 10 637 12 736 28 519 2 469America 199 801 3 195 840 123 693 74 380Africa 203 195 988 1 511 747 939 14 585TOTAL 4 330 490 887 598 3 681 171 1 018 805 807 796 367 438
11.4 Market structure
The National Fisheries Office (ONP) is in charge of marketing seafood products. It manages fish markets
which are the first sale markets located in ports and traditional fishing villages. The ONP acts as an
interface between ship-owners and whole seller on the one hand, and as a market regulator on the
other. The Office has gradually developed, since 2000, its information system called "MAIA". This helped
96

computerise all administrative operations in terms of management of trade and the processing of
accounting and statistical data. The MAIA system is currently operational in all ports and fishing villages
managed by the ONP. It provides an integrated and quasi real-time management of seafood flows and
the related financial flows.
The current number of fish markets in Morocco includes twenty two first sale markets in the major
fishing ports, twenty nine first sale markets in the fishing villages and landing sites including artisanal
fisheries, eight outlets for industrial fish (pelagics) called “Comptoirs d’Agréage du Poisson Industriel”
(CAPI), a cooling outlet in Agadir (2400 tons), and two wholesale markets (second sale) in Casablanca
and Oujda.
Morocco’s most exported fish species have different value chain structure, the demersal fish and octopus
involve almost the same levels (activities) which includes fishing, landing site, sale in the port,
fishmongers, processing plants, and export. Whereas, the value chain of anchovy and sardine involves
additional levels until it reaches the consumer such as the sale in the Counters of Grading of Fish
Industrial (CAPI), whole sellers (semi whole sellers in the case of Sardine) and retailers -refer figure 31. In
the case of Hake the sale is made at the fish market controlled by the national office of fisheries.
97
Sale to semi-canning units
Sale at the wholesale market
Whole seller s
Retailers
Final Consumer
Exp
ort
Anchovy Fishing
Landing at the port
Sale at the first sale market
Sale at the CAPI
Fishmongers

Figure 30 : Anchovy value chain
12Norway
12.1 Fish production
Seafood is the third most important export commodity in Norway after petroleum and metals. Norway
exports seafood to about 140 countries, and is the second largest seafood exporter in the world. Total
export value in 2010 amounted to 53.8 billion Norwegian kroner (NOK). Preliminary figures for 2011
show strong growth compared to the previous year.
Cod (Gadus morhua) is one of the most important demersal fish species in Norwegian fisheries. The total
catch of cod in 2010 was 283,312 tonnes, an increase of 16 % compared to 2009 (figure 32). Whitefish
fisheries are the second largest in Norway, with a total catch of 675,000 tonnes in 2010.
98

Figure 31 : Annual Norwegian whitefish catches in tonnes Source: Directorate of Fisheries
Measured by landed value of total catch, cod fishing was the most important of fisheries in 2010 where
it represents 25% of the total value of catch followed by other species (24%), herring (21%), mackerel
(14%), saithe(12%), shrimp(4%) and blue whiting (3%). Between January 1990 and March 2011, the
average monthly ex-vessel price of cod was NOK 12.64 per kg. The lowest price occurred in June 1996
(NOK 8.25), while price peak occurred in February 1999 (NOK 19.69)15.
All first-hand sales of demersal fish are regulated by the Act of 14 December 1951 No. 3 on the
marketing of raw fish (Raw Fish Act), and are organised in sales organisations (SOs). SOs handle the first-
hand sales of all commercially caught whitefish in Norway, including cod. Depending on where the fish is
landed, different SOs are responsible. To secure equal competition conditions for participants in the raw
fish market, a market-based minimum price is set by the SOs and the industry in cooperation. By
applying minimum prices, fishermen’s income is safeguarded. To secure equal competition conditions
for participants in the raw fish market, a market-based minimum price is set by the SOs and the industry
in cooperation- see table 25. By applying minimum prices, fishermen’s income is safeguarded.
Table 25 Minimum prices for cod from September 19, 2011 until further notice, but not beyond December 18, 2011.
Species/size Minimum price
Cod > 6,0 kg NOK 18,50Cod 2,5-6,0 kg NOK 15,50
Cod 1,0-2,5 kg NOK 13,50
Cod < 1,0 kg NOK 10,00
Source: Norges Råfisklag.
The Directorate of Fisheries (2011) has carried out a profitability survey on the Norwegian fishing fleet
for 2009. The survey shows that the fishing fleet had a total operating profit of 1.5 billion NOK, or an
15 Ex-vessel prices in NOK are converted from EUR.
99

operating margin of 13.3 %. Vessels in demersal fisheries had a positive trend in margins compared to
2008.
Since the 1940s the number of fishermen has decreased by almost 90 %. A total of 121,961 fishermen
were registered either as having fishing as their main or secondary occupation in 1940, compared to
12,280 in 2010. At the same time the number of registered fishing vessels increased about 50% between
1930 and 1960, before decreasing in line with the number of fishermen. The 2010 figure for registered
vessels was 6,309 (figure 33). Annual permits to fish cod, haddock and saithe with conventional gears
north of 62o N have decreased by 37 % (ocean-fishing vessels) and 21 % (coastal fishing vessels)
between 2001 and 2010.
Figure 32: Registered fishing vessels and fishermen in NorwaySource: Directorate of Fisheries
There are two management areas for cod in Norway; the North East arctic cod in the Barents Sea (NEAC)
and the North Sea cod (NSC). The NEAC stock is the largest cod stock in the world, and is jointly
managed with Russia. Total allowable catch (TAC) quotas are set in an annual basis. The NSC on the
other hand is shared with the EU. The stock is in a fairly poor condition, mostly due to overfishing as well
as high grading and discards (fisheries.no). A new management plan has been introduced to cope with
these challenges. The International Council for the Exploration of the Sea (ICES) has recommended that
no catch should be taken from the NSC stock in 2011.
There are two management areas for cod in Norway; the North East arctic cod in the Barents Sea (NEAC)
and the North Sea cod (NSC). The NEAC stock is the largest cod stock in the world, and is jointly
managed with Russia. Total allowable catch (TAC) quotas are set on an annual basis. The NSC on the
other hand is shared with the EU. The stock is in a fairly poor condition, mostly due to overfishing as well
as high grading and discards. A new management plan has been introduced to cope with these
100

challenges. The International Council for the Exploration of the Sea (ICES) has recommended that no
catch should be taken from the NSC stock in 2011.
The cod fishery is conducted in a year round basis, but with a high-season in the first half of the year.
Various fishing gears are being used in the cod fishery; bottom trawl, gill net, longline, Danish seine and
hand line. The annual total catch of cod by fishing gear in the period 2005-2010 is indicated in figure 34,
where bottom trawl and net fishing have the highest annual catch over the years.
Figure 33: Annual total catch of cod by fishing gear Source: Directorate of Fisheries.
12.2 Fish processing
Cod is the most common fish species used for the production of dried and salted fish in Norway. Both
fresh or frozen and thawed raw materials are used. In general, production in Northern Norway is based
on fresh cod while in the western part the raw material is frozen and thawed. Fresh cod is usually
processed post-rigor after 2-5 days storage in plate ice.
Dried and salted saithe, haddock, ling and tusk are also produced and exported, but in smaller quantities
and exported to other geographical markets than Portugal. The production of dried and salted fish can
be divided into three steps; pre-salting, salting, and curing during storage. The pre-salting step is done
after splitting / butterfly filleting, and introduced by brine-injection. The salting phase is carried out by
pickle salting, with fish and salt laid in alternating layers in sealed tubs. The final step involves taking the
fish out of the tubs for dry salting on pallets, allowing excessive brine to drain off. In the 21th century it
has become more and more common to add brine in the beginning of the salting step. The costs for
production of dried salted cod include raw materials (80%), work force (11%), and energy (5.9 %).
101

12.3 Transportation
Raw materials are commonly transported directly to the land-based production plants by the fishing
vessels. In some cases, the fish is landed in a different port and transported to processing plants by road.
According to Molnes (2010), dried salted cod is transported in bulk by road or container vessels to the
respective importing countries. Regarding exports to Portugal dried and salted cod is primarily
transported by road. Transportation by road takes approximately 5-6 days from Ålesund in Møre og
Romsdal county to central locations in Portugal. By comparison, transportation by container vessels
takes 12-14 days. Lorries are loaded with 21.5-22.5 net tonnes and one shipment costs around 36,000-
42,000 NOK, depending on the destination. Containers come in two lengths; 20 feet and 40 feet and the
capacity of the largest container is about 26 tonnes of dried salted fish and one shipment costs around
NOK 28,00016.
Portugal imported about 24,900 tonnes dried salted cod in 2010, and is by far the largest market for
Norwegian dried salted cod (60 % of total export). Given that all dried salted cod is transported by road,
and the average transportation cost per shipment is NOK 39,000 and the total transportation cost for
2010 was NOK 44.1 million distributed on 21 weekly shipments. Transportation cost equals 1.77 NOK/kg.
12.4 Final consumption
Before consumption the dried and salted cod needs to be rehydrated for one or two days. This process
reduces the salt concentration in the fish from 20 % to 2-3 %. After rehydration the product’s shelf life
decreases substantially, and storing must not exceed one week in refrigerated conditions.
Norway exports cod fish in large quantity to Portugal and the export from 1999-2010 is presented in
figure 35. The different types of cod fish are clipfish, wet salted, fresh and filets of salted cod. Dried and
salted cod is commonly distributed via a few Portuguese super- and hypermarkets covering the entire
country (80%). It is said to be available everywhere in Portugal, and consumers will find dried salted cod
at restaurants, bistros, diners, etc.
Domestically, dried and salted cod is sold in numerous variants, such as whole fillet, different loin
products and bits & pieces. Products exported to Portugal are whole fillets.
16 J. C. Pettersen, personal communication, August 10, 2011; S. Solbakk, personal communication, August 9, 2011.
102

Figure 34: Annual cod exports from Norway to Portugal (Tonnes)Source: Statistics Norway
12.5 Market structure
The market structure of dried salted code can roughly be illustrated as in figure 36, and it incorporates
different agents such as primary processors, secondary processors, retailers and consumers.
The primary processors are the fishing fleet, both coastal and ocean fleets. Their catches make up for
the input to the secondary processors. All first-hand sales of cod is regulated by the Raw Fish Act and
organised in sales organisations which handle the trade between primary and secondary processors.
Secondary processors are land-based processing plants which transform fresh or frozen raw cod into
dried salted cod. In all seafood export from Norway, including dried and salted cod exports, the
Norwegian Seafood Export Council (NSEC) plays a vital role as the marketing body, among other tasks.
The retailers in Portugal consist of retail chains and independent supermarkets.
103

Figure 35: Market structure for dried salted cod Norway-Portugal
Portugal is the only other country which produces dried and salted cod, and imports cod from Norway at
different processing levels. Besides dried and salted cod, Norway also exports wet salted cod and frozen
cod for domestic production in Portugal to be processed into dried salted cod. Lower production and
labour costs are some of the reasons for the Portuguese choice of producing dried salted code from
Norwegian raw material. Portugal imported 42,055 tonnes of frozen cod in 2010 for domestic
production of dried salted cod, whereas 5,470 tonnes were imported from Russia. Other substitutes to
dried and salted cod from Norway are salted products of cod from Iceland, dried and salted cod of other
cod species (Gadus macrocephalus) from Portugal and Iceland, and dried and salted / salted products of
other fish species such as saithe (Pollachius virens), tusk (Brosme brosme) and ling (Molva molva).
Atlantic cod is though the preferred species in Portugal and accounts for almost the entire dried and
salted fish consumption. Icelandic dried and salted cod has been known to be more expensive than its
Norwegian and Portuguese counterparts.
12.6 Fishery regulations
The country’s general acts of fishery regulations include:
- Act of 5 December 1917 No. 1 relating to the registration and marking of fishing vessels
- Act of 14 December 1951 No. 3 on the marketing of raw fish (Raw Fish Act)
- Act of 26 March 1999 No. 15 on the regulation of the participation in fisheries (Participant Act)
104

- Act of 6 June 2008 No. 37 relating to the management of wild living marine resources (Marine
Resources Act)
Participation in the commercial fishing for whitefish requires a license permitted by the authorities, and
is regulated by the Act of 5 December 1917 No. 1 relating to registering and marking of fishing vessels
and Act of 1999 No. 15 on the regulation of the participation in fisheries. The purpose of the latter act is
to (i) adapt the fishing fleet’s catch capacity to the resource basis in order to ensure a rational and
sustainable exploitation of the marine resources, (ii) increase profitability and value creation in the
industry and thereby secure settlement and employment in coastal areas, and (iii) facilitate for the
harvesting of marine resources in the future.
13Peru
13.1 Fish production
Peru is rich in natural resources and foreign trade is dominated by exports of raw materials. In terms of
export value, gold and copper are the most important economic export goods followed by fisheries
products. Fisheries accounts for 3% of the Peruvian GDP. The conglomerate of all extractive industries
accounts 15% to the GDP, but dominates export value and is therefore the most important source of
105

foreign currency. The strong economic growth during recent years, as evident from Table 26, has created
an environment that fosters development in many sectors, including fisheries and aquaculture.
Table 26: Peru GDP real growth rate (%)
Year 2000 2001 2002 2003 2004 2005 2006 2007 2008 2009
GDP growth
2.4% 3.6% -0.3% 4.8% 4.0% 4.5% 6.4% 8.0% 9.0% 9.8%
Source: CIA World Factbook
Peru has 736 known marine fish species, of which a limited number are caught for commercial purposes.
In terms of volume landed, Peru is among the largest fishing nations accounting for nearly 10% of the
global fish catches.
The cold-water Humboldt Current brings nutrient-rich cold waters that create ideal fishing grounds for
large pelagic schools. The Peruvian anchovy is the world's largest fishery of a single species measured in
landed volume. This species is also the main raw material for the fishmeal and fish oil industry, which is
the largest industry within the fishery sector. The anchovy biomass is located within the productive
Humboldt Large Marine Ecosystem (LME). The population fluctuates as a result of natural events mainly
climatic. Every seven to fourteen years, there is the El Niño event, which brings warm surface water to
the Peruvian coast that suppresses nutritious cold water with negative effects on the stock of anchovies.
Due to the climatic change which appears to be more frequent, there is higher economic risk for the
fishery industry. However, the ecosystems of the Peruvian coasts also supports a number of other
species that are commercially important such as mackerel, horse mackerel, tuna fish, flying jumbo squid,
scallops and many others.
Figure 37 shows the evolution of pelagic fisheries from 1991 to 2009. During this period the catch
volume of pelagic species, predominantly Peruvian anchovy, has been slightly declining but with fairly
strong volatility due to the El Niño events.
106

0
2
4
6
8
10
12
14M
illio
n to
ns
Pelagic
Figure 36: Catch volume of pelagic fish in Peru (Source: Ministry of Production in Peru)
Whereas, figure 38 indicates the other species groups which have few volume catch relative to pelagic
species. Besides mollusks, the other species groups tend to have relatively stable or stagnating trends.
The mollusks group, however, has experienced a strong growth mainly due to the increased capture of
Giant flying squid, which account for the majority of catch volume in this category. In the case of
demersal fish catches, it peaked in 1996 and declined thereafter. Similarly, coastal fish catches peaked in
1998 with a declining trend until 2006 and then increased somewhat until 2009. Finally, crustaceans and
other species have fluctuated with periods of strong growth and strong decline. Overall, the trends in the
Peruvian fish catches are similar to that of other countries with the majority of large commercial species
having reached levels of full or overexploitation, while only the fisheries of few species, such as the Giant
flying squid, has been able to increase in the last couple of decades.
0
100
200
300
400
500
600
1000
tons
Demersal
Coastal fish
Cructaceans
Molluscs
Other species
Figure 37: Catch volumes of major species groups in Peru (Source: Ministry of Production in Peru)
107

The Peruvian artisanal fishing, also called small-scale fishing or non-industrial fishing, is usually small
operation consisting of individual vessels or small group of medium or small-sized vessels. It has special
importance for the economic and social development of the country along the coast, not only due to its
contribution to employment and income but also because of its role as main supplier for the packing and
freezing fish industry.
The construction of artisanal fishing crafts is a major activity related to fishing. These crafts usually have
an average of 12 to 20 meters of length and a hold capacity from 10m 3 to 32.6m3. In the Peruvian
artisanal fisheries there are about 30 thousand people working on approximately 15 hundred vessels
targeting fish for direct human consumption.
In the case of Peruvian aquaculture production, figure 39 shows the country’s aquaculture evolvement
over time. If the aquaculture production is compared to fishery production over the years, there is a
regular pattern of stagnating fisheries production and growing aquaculture production. In figure 39, the
small-volume species are aggregated under the label ‘Others’. In this project the focus is on the three
most important farmed species in terms of economic value, i.e., scallops, shrimp and trout. All of these
species have experienced strong growth during the last decade. However, they are still young industries
where there are much room for continued development and growth due to lack of technology, know-
how and capitalisation.
0
2
4
6
8
10
12
14
16
18
20
1000
tonn
es
Others
Trout
Shrimp
Scallops
Figure 38: Aquaculture production in Peru (Ministry of Production)
This Peruvian report provides information on the country’s four fishery and aquaculture sectors that to
different degree participate in export oriented activities. These four sectors are Peruvian anchovy
fisheries, shrimp aquaculture, trout aquaculture and, scallop aquaculture.
108

13.1.1 The Peruvian anchovy fishery
The Peruvian anchovy (Engraulis ringens) is a small pelagic species caught by purse seiner vessels all
along the Peruvian coast. It is a marine and coastal species that lives mainly within 80 km of coast, but
can occasionally be as far out as 160 km, forming huge schools in surface waters (descending in daytime
to up to 50 m, rising at night). Figure 40 shows the variability of the anchovy’s catches in Peru from 1960
to 2009.
0.00
2.00
4.00
6.00
8.00
10.00
12.00
14.00
1960
1962
1964
1966
1968
1970
1972
1974
1976
1978
1980
1982
1984
1986
1988
1990
1992
1994
1996
1998
2000
2002
2004
2006
2008
Mill
ion
met
ric to
ns
Anchovies catches
Figure 39: Historical catches of anchovies (FAO/Ministry of Production in Peru)
The Peruvian anchovy fishery is characterized by very large fluctuations. During the last fifty years
catches have varied from 12.3 million tonnes in 1970 to 23 thousand tons in 1984 as shown in Figure 40.
The El Niño climate event increases the temperature of the sea surface water in the South-East Pacific
and suppresses upwelling of cold nutritious water. As a result the anchovy stock tends to diminish
drastically when these events occur. However, catches have been fairly stable from 2000 to 2009
compared to the historical landings. The average annual catch during this period was 7.1 mmt.
Natural variability is not the only explanation for fluctuating landings. Poor fishery management has
exasperated variability in catches of anchovies with especially severe consequences in the 1970s, leading
to a prolonged period of 15 years with relatively low catches.
The fleet that targets anchovy consists of 1200 purse seiners. The fleet consists of two distinct segments:
The large scale fleet and the wooden fleet. The former comprises 608 boats mostly made of steel and
larger than 120m3 of fish-hold capacity. The wooden fleet comprises 592 boats that range from 30 to
119m3 of fish-hold capacity. Employment in anchovy fishing involves nearly 40,000 fishermen and
additional members of their families.
109

13.1.2 Shrimp aquaculture
Shrimp aquaculture of Penaeus vannamei takes place along the Northern coastline of Peru using
intensive and semi-intensive production systems. Official monthly production (harvesting) data of
farmed shrimp are available since 2003; in addition domestic sales volumes of shrimp are available on a
monthly basis. Figure 41 presents the domestic production and sales of farmed shrimp from January
2003- June 2010. Generally, the domestic consumption of shrimp is very low compared to the total
production volume.
0
200
400
600
800
1000
1200
1400
1600
1800
2000
Met
ric to
nnes
Production Domestic sales
Figure 40: Domestic production and sales of farmed shrimp (Source: Ministry of Production)
There are no official statistics on employment and income in the shrimp aquaculture sector. Statistics
here must rely on reports and studies. A study by Berger, Quispe and Talavera (2004) suggests
employment figures of 5000 persons during the high season. The same study indicated that each hectar
of shrimp farms using semi-intensive production systems employ 02.-0.4 workers. If this number is
multiplied with the current (2010) number of hectars that have been authorized for shrimp production it
gives a range of 1130-2260 employees on a permanent basis. Some of these farms are intensive and
require 1.5-2 employees per hectar. Another more recent document, however, suggests that the
number of directly and indirectly employed people to be 4 500 and 12 000 respectively. These figures
include all activities related to the industry, including processing.
In the case of associations, there is a trade association called Acuicultura de Langostinos en el Perú
(ALPE). This association represents 18 companies but there are many producers outside of the
association.
13.1.3 Trout aquaculture
Rainbow trout (Oncorhynchus mykiss) is found in freshwaters across Andean Peru but it is not among
110

the native species. It was introduced from Canada in the 1920s to supplement the food supply and
provide poor Andean communities who were working in the mining industry with a much needed boost
of protein in their diets. According to a report by the Peruvian Association of Aquaculture Professionals
(Asoppac), trout production grew the most, with an increase of 19%. This was followed by tilapia (14.5%)
and shrimp (7.5 %).
Figure 42 presents the country’s domestic production, sales and export of trout in 2000-2009. There was
an increase in the level of production each year and it is mostly consumed in the domestic market.
0
2000
4000
6000
8000
10000
12000
14000
2000 2001 2002 2003 2004 2005 2006 2007 2008 2009
Tonn
es
Harvest
Domestic sales
Exports
Figure 41: Domestic production, sales and export of trout in volume 2000-2009 (Source: Ministry of Production)
13.1.4 Scallop aquaculture
Scallop, which is a marine bivalve mollusk of the Pectinadae family, is found all along the Peruvian coast
where it is more widely known as “conchas de abanico”.
The production of scallops in Peru includes both wild harvest and aquaculture. Wild harvest is mostly
artisanal small-scale fishery while in aquaculture there are producers who produce relatively large
volumes. The wild harvest is subject to Peruvian fisheries laws and is regulated through harvesting bans
and restrictions based on scientific evidence and socioeconomic factors.
Aquaculture of scallops, on the other hand, is subject to the Law of Promotion and Development of
Aquaculture, which gives authorizations for marine areas in order to develop this activity in its diverse
forms and allow establishment production facilities (laboratories) for the production of larvae for
reproduction purposes. The scallop aquaculture is rapidly increasing as an export-oriented industry
where most of the scallops are shipped as frozen products; whereas the wild harvest go mainly to the
local market (fresh and frozen). As per estimations of the Peruvian Society of Fisheries (SNP), the private
industry association, every 100 hectares of farming of scallops require an investment of two millions
111

dollars and it produces next to 140 MT per year, generating direct employment for more than 200
people. The extraction of scallops under 65 mm is banned. Maximum volumes of daily extraction by
vessel are subordinated to periods of plenty (or scarcity) of the species.
Figure 43 indicates the total harvest, domestic sales and export volume of scallops from 2000-2009.
Where the highest harvest was registered in 2007 and the highest export volume was registered in
2009.
0
2000
4000
6000
8000
10000
12000
14000
16000
18000
20000
2000 2001 2002 2003 2004 2005 2006 2007 2008 2009
Tonn
es
Harvest
Domestic sales
Exports
Figure 42: Harvest, domestic sales and export volumes of scallops (Source: Ministry of Production)
13.2 Fish processing
The main products produced from anchovy are fishmeal and oil. Fishmeal is used as a protein input in
feeds for farmed fish and animal husbandry, thus this is labelled fish for indirect human consumption
since it will eventually be part of edible fish (aquaculture) or meat (chicken and pork). Fishmeal is also a
popular input in pet foods. The fish meal industry has been going through a process of consolidation and
currently there are 58 companies that participate in exports of fishmeal and fish oil. As Peruvian
processing sector for fishmeal and fish oil is capital intensive it does not need much labour force;
moreover, plants are run by engineers, some assistants and some workers for general maintenance and
security. The key personnel are professional technicians and chemists at the different lab tasks.
In the case of farmed shrimp the processed products include fresh, salted, dried, canned, refrigerated or
frozen shrimp. The majority of shrimp is shipped to the EU and USA is peeled or shell-on frozen, which
requires freezing facilities and facilities for primary processing. These types of primary processing
constitute the largest part of the shrimp production. Very small quantities are further processed; mostly
112

international shipping that would normally take 15-20 days to reach their destinations in freezer
containers with temperatures of minus 35 degrees Celsius.
The Tumbes region in the North of Peru is where most of the shrimp farming is located. In this region
the industry employs around 1500 workers for processing plants, the majority of which are woman.
Most of the production is exported, which means that Peruvian shrimp products compete in the
international market. Apart from export, from the 13 425 metric tonnes (live weight) produced in 2009;
around 939 metric tonnes (product weight) was sold domestically. Converted to live weight this can
correspond to a figure around 10% of the total production.
13.3 Final consumption
Peru is the largest exporting country of fishmeal in the world because of the large Anchovy fisheries.
Fishmeal and fish oil are exported mainly to China and Europe. Export prices are available on monthly
and yearly basis (see figure 44) although several sources have to be crosschecked, such as: Aduanet,
Sociedad Nacional de Pesqueria, Ministerio de la Produccion (Produce) and international sources
(OilWorld and Eurostat).
0
500
1000
1500
2000
2500
USD
per
ton
Fishmeal
Fish oil
Figure 43: CIF fish meal and fish oil prices (Source: Ista Mielke OilWorld)
The marketing of Anchovy for direct human consumption has been proposed in order to reduce
starvation and malnutrition, mainly for low income groups in Peru. However, the predominant use is for
canned anchovy marketed in groceries stores and large supermarket chains. The price tag of these
products means that the main market is middle class Peruvians.
113

0
10
20
30
40
50
60
70
80
90
2000 2001 2002 2003 2004 2005 2006 2007 2008 2009
1000
tons
Frozen
Canned
Figure 44: canned and frozen Anchovy products (Source: Ministry of Production)
Figure 45 shows the volumes of anchovy that are destined for direct human consumption in frozen and
canned products. Fresh anchovy for human consumption is becoming more frequent to find
neighbourhood markets, but the volumes are still small that they are not published in official statistics.
Availability of fresh anchovy depends on geographical proximity of markets to landing ports, the so
called “terminales pesqueros”. Frozen anchovy is currently processed to become future canned anchovy
in order to ensure availability of fish during bans.
The volume of anchovy products for direct human consumption is still modest. Wholesale local prices of
whole anchovy used for consumption are only available from 2007 at production level (for Minka
wholesale local market). Local production prices of anchovy products for human consumption are
unavailable (canned anchovy in oil or tomato sauce) because they are confidential data of the producing
companies.
Thus, the availability of time series data on retail prices in Peru needs to be explored further. Local retail
prices are not yet published by public agencies. Export price data, on the other hand, can be collected
from Peruvian customs agency.
Shrimp A large portion of the shrimp production is exported to EU and USA. Figure 46 indicated the annual
import production volume of both EU and USA from 2000-209. The volume imported by USA is greater
than those of EU and there was an increase in the imported volume each year.
114

0
1
2
3
4
5
6
7
8
9
2000 2001 2002 2003 2004 2005 2006 2007 2008 2009
1000
met
ric to
nnes
EU
USA
Figure 45 : Annual imports of Peruvian frozen shrimp by EU and USA (source: NMFS and Eurostat)
Trout
In the case of Peruvian trout, the main export markets are Europe, United States and Canada, where
local production has fallen and imports have increased. Peru’s main exports were frozen trout fillets (60
%), frozen trout (35 %), fresh or chilled trout (4.8 %) and the remainder was used for canning and other
products. Figure 47 indicates the exported volume of Peruvian trout products to EU and USA. The
exported products were frozen trout to EU and mostly fresh trout to USA.
0
50
100
150
200
250
300
350
400
Tonn
es
Frozen trout EU
Frozen fillet USA
Fresh trout USA
Figure 46: Import volumes from Peru of principal trout products to EU and USA, product weight (Source: Eurostat and NMFS)
115

Scallop
The last species is scallop, and the main export markets for this species are EU and USA. Both markets
import frozen, dried or salted scallop, in addition the USA market import live or fresh scallop. The export
volume to both countries is presented in figure 48, where Peruvian export is higher in EU than USA over
the years. The highest Peruvian export to EU was registered in 2009.
0
1000
2000
3000
4000
5000
6000
7000
Tonn
es
USA
EU
Figure 47: Export volumes of scallops to EU and USA (Eurostat and NMFS)
13.4 Fishery regulations
It should be pointed out that there are differences in regulations of artisanal and industrial fisheries. The
artisanal fisheries tend to take place within the 5-mile limit where fisheries are mainly directed with the
purpose of direct human consumption. This is in particular relevant for the Peruvian anchovy that serves
as raw material for two different uses – for fish meal and fish oil, on the one hand, and for conserved
products destined for direct human consumption, on the other.
In 2009 Peruvian authorities introduced a new management system for anchovy based on individual
vessel quotas. As explained above this system has had a positive impact on the fishery (Tveteras,
Paredes & Peña-Torres, 2011). Some of the main regulations and control & monitoring efforts related to
this management regime are as follows:
- A formal declaration of holds capacity is compulsory
- Entry of new fishing boats is closed
- Licenses required to fish within the 200 mile limit and to land catches
- Security satellite tracking of all boats operating outside the 5 mile limit 24 hour
- Independent recording of landings at 134 unloading points
- Revoking of licenses is in force for any breach of rules
116
There are additional controls and information systems - many imposed to protect the landings of fish for
direct human consumption. The Ministry of Production publishes every day on its web site the name of
the vessels authorized to go out fishing as well as the vessels prohibited to do so.
The processing plants that received landed fish are not authorized to accept fish coming from vessels
without valid license or from artisanal vessels. The plants must stop receiving fish if there is any failure in
their processing equipment in order to protect the environment.
In order to prevent deterioration of the raw material, fish transportation in bulk in artisanal boats or
trucks is prohibited. It is prohibited to land fish from artisanal vessels using systems of pumps and pipes.
There are about 100 operational processing plants with a capacity of 9,000 metric tons of raw
material/hour. About 12,000 persons are employed in processing jobs. Fishmeal plants must possess a
working license from the Ministry of Production and a health certification from ITP (Instituto
Tecnologico Pesquero). Plants must also have HACCP systems in place and many are working towards
implementing quality control systems such as FEMAS and some have also an ISO certification.
AquacultureThe main regulation in shrimp aquaculture is relates to the requirements that must be fulfilled to obtain
a permit for aquaculture production. The basic requirement for obtaining a permit is conducting an
environmental impact study, which must be carried out by a certified consultant.
There is also a domestic market, as farmed shrimp is found in supermarkets and restaurants around the
country. Little information is available about the companies which supply the local market. The industry
consists of 54 individual producers where approximately half of them are registered either as small-scale
and the remaining half as large scale producers.
In the case of Scallops, there are no restrictions for its farming and the commercialisation is free at any
stage of the species.
13.5 Data availability
The Volume and unit value of imported Peruvian (anchovy, shrimp, trout and scallop) products to
Europe is available from Erostat. The data is from January 1996 -January 2011 and it is available in the
Peruvian project report, accessible at:
http://www.fao.org/valuechaininsmallscalefisheries/participatingcountries/peru/en/
117

14 Thailand
14.1 Fish production
In Thailand fish production is mainly from marine fishing (51%), coastal aquaculture (25%), freshwater
culture (17%) and freshwater fishing (7%). Marine fish production was decreasing around 4.6 % per year
from1998 – 2008, see table 27. The decrease was mainly associated with the change in gasoline price
and the issue of joint venture fishing with neighbouring countries. However, the decrease in the marine
fish production has been compensated by fish imports. In 2007 the marine fishing industry had 13,056
registered commercial fishing vessels and the vessels have around 10-50 gross tonnages capacity.
Marine fishing includes inshore and coastal fishing. The inshore fishing contributes almost 80-90% of the
country’s marine fishing. The fishing gears mostly used for inshore fishing are trawl, seine and falling
nets. The marine fishing also includes coastal fishing, which is mostly practiced in small scale and it
contributes around 10-20% of the total marine catch. The main fishing gears are gill nets, traps and
118

other stationary gears. In Thailand there are more than 500 marine species mainly located in the Thai
Gulf and Andaman Sea. The economically important species include Indo Pacific mackerel, king
mackerel, anchovy, croaker, thread fin bream, lizard fish, grouper, big eyes, banana shrimp, school
prawn, squid, cuttlefish, octopus, scallop, green mussel, bloody cockle, sea cucumber, jelly fish and crab.
The second fish production arise from coastal (marine) aquaculture, it mostly takes place in coastal
areas and shallow seas. Marine aquaculture production includes floating raft culture, semi-floating raft
culture, net cage culture, sea ground sowing, vertical culture and pond culture. The seed for aquaculture
is obtained from artificial, semi-artificial and natural breeding. Some of the cultured species include
seabass, grouper, vannamei shrimp, green mussel, oyster, bloody cockle. As can be referred in table 43
the coastal aquaculture sector indicated a yearly increase of 8.5% from 1998-2008. The increase in
coastal aquaculture is associated with the increase in Vannamei production.
The third source of Thailand’s fisheries is from inland fishing which is mostly small scale and temporary.
The inland fishing sector has been increasing around 1.3% per year (1998-2008) and it reaches its peak
production during the rainy season, but it is mostly consumed in the domestic market. Inland fishing is
carried out in inland waters, including lakes and reservoirs. The economically important species are
tilapia, barb, sand goby, giant prawn and local fish species.
The fourth source of fish production is freshwater culture it was increasing around 9.5% per year from
1998-2008 see table 27. The freshwater culture reached its peak in 2004 since private companies
promoted retail sales of fillet tilapia and there was dramatic increase in tilapia demand. However, the
production of freshwater culture decreased since 2005 due to dry season and a large area was needed
for rice paddy fields. The types of production include pond, cage, paddy-field and ditch cultures,
furthermore pond culture accounts around 87.2% of the production. The most common species for this
sector are Nile tilapia, walking catfish, common silver barb, snake skin gourami, striped catfish and giant
prawn.
Table 27 : Fisheries production in quantity by sub-sector (in ’000 tonnes)
YearFishing Culture
Total % Marine % Inland %
Coastal %Aquaculture
Fresh Water %Culture
1998 3,505.8 - 2,709.0 - 202.3 - 367.6 - 226.9 -1999 3,625.9 3.43 2,725.2 0.60 206.9 2.27 441.2 20.02 252.6 11.33
2000 3,713.2 2.41 2,773.7 1.78 201.5 -2.61 467.0 5.85 271.0 7.28
119

2001 3,648.4 -1.75 2,631.7 -5.12 202.5 0.50 534.5 14.45 279.7 3.21
2002 3,797.0 4.07 2,643.7 0.46 198.7 -1.88 660.1 23.50 294.5 5.29
2003 3,914.0 3.08 2,651.2 0.28 198.4 -0.15 703.3 6.54 361.1 22.61
2004 4,099.6 4.74 2,635.9 -0.58 203.7 2.67 736.3 4.69 523.7 45.03
2005 4,118.5 0.46 2,615.6 -0.77 198.8 -2.41 764.7 3.86 539.4 3.00
2006 4,053.1 -1.59 2,484.8 -5.00 214.0 7.65 826.9 8.13 527.4 -2.22
2007 3,675.4 -9.32 2,079.4 -16.32 225.6 5.42 845.3 2.23 525.1 -0.44
2008 3,204.2 -12.8 1,644.8 -20.90 228.6 1.33 808.3 -4.38 522.5 -0.50
%Δ -0.7 -4.6 +1.3 +8.5 +9.5
% 100.0 51.0 7.0 25.0 17.0
Source: Fisheries Statistics of Thailand 2008 and calculate
Thailand’s fish supply consist both production (70%) and import (30%) fishery. The country’s fish supply
and the percentage change in fish production and fish import is indicated in table 28. In the years from
1990-2008, there was yearly increase in fish production (1.82%), import (7.79%), and fish supply (2.97%).
In 2009, fish import accounts 85% of the countries imported products. The main imported fish products
were fresh chilled and frozen tuna (52.38%), and fresh chilled and frozen fish (31.37%). Almost all
imported fish products are processed and re-exported. For instance, tuna products are canned and
other fish species are processed into surimi and fish fillets.
Table 28 Thailand’s fish supply from 1990-2008 (in ’000,000 tonnes)
Year
Million Tons % ChangeProduction
(1)Import
(2)Supply(1+2)
Production Import Supply
1990 2.79 0.48 3.27 - - -1991 2.96 0.66 3.62 6.09 37.50 10.701992 3.24 0.64 3.88 9.46 -3.03 7.181993 3.39 0.79 4.18 4.63 23.44 7.731994 3.52 0.89 4.41 3.83 12.66 5.501995 3.57 0.87 4.44 1.42 -2.25 0.681996 3.55 0.74 4.29 -0.56 -14.94 -3.381997 3.38 0.73 4.11 -4.79 -1.35 -4.201998 3.51 0.78 4.29 3.85 6.85 4.381999 3.63 0.91 4.54 3.42 16.67 5.832000 3.71 0.81 4.52 2.20 -10.99 -0.442001 3.65 0.84 4.49 -1.62 3.70 -0.662002 3.80 1.06 4.86 4.11 26.19 8.242003 3.91 1.16 5.07 2.89 9.43 4.322004 4.10 1.33 5.43 4.86 14.66 7.102005 4.12 1.56 5.68 0.49 17.29 4.602006 4.05 1.56 5.61 -1.70 0.00 -1.23
120

2007 3.68 1.47 5.15 -9.14 -5.77 -8.202008 3.80 1.62 5.42 3.26 10.20 5.24
% 70.11 29.89 100.00 - - -Average 1.82 7.79 2.97
Source: Fisheries Statistics of Thailand 2008
14.2 Fish processing
The marine and freshwater fisheries are processed in to different final products. The marine fisheries
result in fresh chilled and frozen fish, canned, steamed/smoked, fish sauce, shrimp paste, salted and
dried fish. Whereas, the freshwater fisheries result in salted, smoked, fish sauce, fermented and dried
fish. In 2005, there were 2,523 private enterprises involved in the marine fish processing industry-see
table29. In the case of freshwater, there is no specific record of the number of processors involved but it
could be more than that of marine fish processors because they are small scale and are distributed
around the freshwater fishing grounds. The fish processing factories are mainly concerned with freezing
and canning activities.
All fish processing factories have to register with the Department of Industry and Department of Labour.
Although the number of processing companies is not increasing much, there is an increase in the
processing capacity. As can be referred in table 29 the number of processing companies increased from
2,195 (2003) to 2,523(2005). In 2005, there were 922 companied involved in dried and salted fish where
as there were only 41 companies in streaming and 49 companies involved in canning.
Table 29 : Number of Processing Factories by type of products (Unit: Factory)
Type of processing 2003 2004 2005Freezing 162 182 184Canning 47 49 49Fish sauce 171 204 202Streaming 58 37 41Dried and salted 785 812 922Fish Ball 72 174 234Others 900 851 891Total 2,195 2,309 2,523Source: Fisheries Business 2007, Department of Fisheries
14.3 Final consumption
Thailand’s fishery products are consumed domestically and exported to different countries. Table 30
presents the trend in export and domestic fish consumption. Fish export increased from 1.17 million
tonnes in 1990 to 2.34 million tonnes in 2008. The main exported products include frozen shrimp,
preserved (boiled) shrimp, canned tuna and frozen fish. In the case of imported fish, it is mostly re-
121

exported (88%) and the rest is consumed domestically- see figure 49.
Figure 48: distribution of imported fishery products (Source: Estimate from Import items, Amporn 2009)
In 2008, the total consumption was 2.51 million tonnes or 39.62 kg per capita. These figures indicated an
increase when compared with the figures in 1990 where the fish consumption and per capita were1.11
million tones and 19.77Kg respectively- see table 30. In addition, the 2008 figures of domestic
consumption represent over 78% of total production, and it increased by 11% compared with the
consumption in previous year. Per capita fish consumption reached its peak in 2005 (42.67Kg) – see table
30. The main reasons for the increase in domestic fish consumption include: the introduction of more
efficient transportation, retail model of super and hyper markets, better infrastructure, improvement in
sanitary standards, and introduction of cold chain, for live fish and other perishable food products, by big
companies like CP, Batego and Marco.
Table 30 Consumption of Fishery products
Year Export( ‘000,000 tonnes)
Consumption(‘000,000 tonnes)
Consumption per capitaKg/head
1990 1.17 1.11 19.771991 1.36 1.28 22.511992 1.39 1.48 25.741993 1.44 1.71 29.191994 1.64 1.84 31.201995 1.60 1.93 32.401996 1.52 1.91 31.70
122
Import Fisheries Products and processed products
1.59 tonnes
Processing Plants1.4 tonnes
Re- Exported1.4 tonnes
Retail Market for Domestic
consumption0.19 tonnes
Distributors0.19 tonnes
12%
88%

1997 1.74 1.56 25.581998 1.77 1.76 28.691999 1.95 1.82 29.522000 1.66 2.09 33.762001 1.71 2.04 32.742002 1.82 2.34 37.242003 2.09 2.29 36.302004 2.07 2.59 41.762005 2.26 2.66 42.672006 2.43 2.51 39.892007 2.30 2.27 35.962008 2.34 2.51 39.62
Source: Division of Foreign Affair, Department of Fisheries
14.4 Market structure
In Thailand there were twenty one fisheries wholesale markets where fourteen are state markets, six
private owned markets and one belong to a fishery cooperative. The wholesale markets are located in
both urban (eleven markets) and rural areas (ten markets). The state wholesale market recorded a trade
volume of 0.5 million tonnes in 2008 worth THB 16 million. In the Bangkok wholesale market, the trade
volume is decreasing every year because of traffic problems and also due to the establishment of new
private wholesale markets. The fresh marine fisheries products channel at the Bangkok Fish Market was
surveyed by Fish Market Organisation (FMO), which showed that the main route of fish goes through the
urban area, with the Bangkok metropolitan consumer taking 46%, while 35% is distributed to rural areas
in the north and northeast and 18% goes to processors.
14.5 Fishery regulations
In Thailand many organisations have different responsibilities related to the country’s fishing industries
and table31 presents the responsibility of each organisation.
Table 31 : organisations involved in Thailand’s fishing industry Name of ministry Department ResponsibilityAgriculture Fisheries
Fish market organisation Fish markets and fishing portsCooperative extension Fish cooperatives and groups
Natural resource Natural marine resource Marine conservationCommerce International trade Price information, internal fish markets,
international trade extensionSocial and Humanity Livelihoods and labour, and local
administration organisationPublic health Food and drug administration Food safety for internal marketsIndustry Factory ISO 14000Finance Custom Import and export activity and feesNGOs or private National fishery associative, assembly
123

organisations of Thai fisher folks, Thai frozen food association etc.
However, the department of fisheries is involved in several responsibilities and detailed information
follows:
The first responsibility is related to the implementation of various related acts like Fisheries Act B.E.
2490 (1947), Wildlife Conservation and Production Act B.E. 2535 (1992), Enhancement Conservation of
National Environmental Quality Act B.B. 2535 (1992), Hazardous Substance Act B.E. 2535 (1992), and
other relevant Acts. In addition the department of fishery is responsible for marine fishery conservation
policy and recovery of ecosystem.
The activities in the marine fisheries conservation policy include: practice the fishing license system both
in marine and fresh water fishing, limit number of fishing gear: Trawling, mesh size limited, and closed
area season in Thai Gulf and Andaman Sea.
The activities in the recovery of ecosystem are:
Artificial reproduction releasing: artificial release is one of the effective ways of helping ecosystem recovery and increasing fisheries resources. The department of fisheries release more than 5,000 million fries (fish and shrimp fries) a year.
Artificial reef establishment: to recover the marine ecological environment, enhance and protect fisheries resources, the Department of Fisheries and local communities plan to construct artificial reefs.
The second responsibility of the fishery department is to undertake different studies, research and
experiment in the field of fisheries. The third responsibility is to explore, analyse, and research for fishing
grounds beyond Thai waters and promote fisheries cooperation with other states. The last responsibility
is to promote and develop all occupations relating to fisheries and implement other duties as legally
assigned to the Department by the Ministry or cabinet.
The goals and policy of the National fisheries department are stated below:
Fishery Policy in Thai Waters: to maintain the level of fishery production not less than 1.7 million
tonnes per year and to reduce the uneconomic exploitation of fisheries resources not less than
100 000 tonnes per year.
Overseas Fishery Policy: to produce fishery production through fisheries cooperation with
foreign countries at least 1.8 million tonnes per year by employing 3,500 Thai fishing vessels
which are larger than 18 meters in length.
124

Aquaculture Policy: to increase fishery production from aquaculture at the rate of 5% per year in
which the production will reach 550 000 tonnes by B.E. 2539 (1996) of which 250,000 and 305,
000 tonnes are produced from freshwater and coastal aquaculture respectively.
Fishery Industry Policy: to export fishery products not less than 1 million tonnes per year with
value of THB 75 000 million. To increase value of fishery products at the rate of 10% per year
and to increase consumption of fish per caput not less than 30 kg per year.
In addition to the above stated policies the department of fishery is following the fisheries act B.E.2490
for management of fisheries. The Act constitutes six main chapters , these are fisheries, cultivation pond,
registration and application for permission, fisheries statistics, control and penalties, and 86 notification
such as prohibiting some fishing gear in some fishing area; determination of spawning seasons and
kinds, sizes and methods of using of fishing appliances, specification of poisonous substances under the
fisheries Act B.E. 2490 , prohibition of using trawls and push net in Phang Nga bay, determination of
mesh sizes of nets in anchovy fishing, and application of permission and registration to engage in fishing,
trading in aquatic animal or aquatic products, and fishery industry, application for permission to engage
in marine shrimp cultivation, hatchery house, or nursery house for marine shrimp.
14.6 Data availability
Five species have been identified for the study of value chain; these are vannamei shrimp, seabass,
tilapia, walking catfish, and tuna. The species are different in terms of production and trade. However,
there are complete time series of price at each level. Tuna and vannamei shrimp are the main export
products of Thailand in terms of international trade.
Price information is collected by many organisations such as the Department of Fisheries, Office of
Agriculture Economics, fish market organisations and the Department of Internal Trade, as well as
private companies such as Talad Talay Thai (shrimp wholesale market), Talad-Thai Wholesale market
and Mae-Klong Fish market, which falls under a fishery cooperative. The list of the organisations and
their responsibility of price information follows:
Ex-vessel price or Farm price: Department of Fisheries (DOF) and Fish Market Organisation
(FMO) are responsible for collecting price information. DOF publishes a yearly time series price
but FMO collects a monthly time series price for species such as Indo Pacific mackerel, squid,
125

shrimp and trash fish. In the case of fish aquaculture prices, the Office of Agriculture Economics
(OAE) collects prices for vannamei, black tiger shrimp and trash fish. The Agriculture price
information can be found at www.oae.go.th.
Wholesale price: Private and government wholesale market prices are gathered and distributed
as monthly time series. All the main species traded in Bangkok wholesale market are recorded
Some of the species are Indo Pacific mackerel, snapper, seabass, shrimp, squid, bloody cockle,
swimming crab, tilapia and walking cat fish. The fish prices could be found at
www.fishmarket.go.th and the fish price in the private wholesale market are available for
members at www.taddthai.co.th.
Retail price: Department of Internal Trade (DIT) has collected the retail price since 1993 and
there were some improvements since 2001. Fish and processed fish product prices have been
recorded for more than 58 items (36 fresh products and 22 processed products), by size and type
of product. The fresh water fish include tilapia, walking cat fish, snake head fish, frog. The
marine fish species include Indo Pacific mackerel, seabass, red snapper, vannamei shrimp, black
tiger shrimp, squid, bloody cockle, green mussel, mud crab, swimming crab. Whereas, the
processed products are dried snake head, steamed Indo Pacific mackerel, salted Indo Pacific
mackerel, dried shrimp, fish ball and fermented fish.
The price of the above stated products is presented in a monthly series of retail price, classified
by region (Bangkok, North, South and Central). Price information can be found at
www.price.moc.go.th.
Fish price is influenced by several factors such as climate, cost, closed season ban and substitute
products. The main cost involved in fishing and marketing is the fuel cost, thus the fluctuation in fuel
price impacts the price of fish. In addition, the sea water temperature impacts both fishing and
aquaculture. The closed season ban has also an impact on the marine fisheries price such as Indo Pacific
mackerel, squid and other marine fish. In addition, the substitution of products has an influence on price
for instance wild fishery price is impacted by the price of cultured products (e.g. cultured shrimp affects
the price of wild shrimp).
126

15Uganda
15.1 Fish production
Uganda is a land locked country located in East Africa and its location on the equator gives it a tropical
climate with no seasonality and warm temperatures. There are around 165 lakes accounting for 18% of
the country’s total area. Uganda has got five major inland freshwater bodies and River Nile which is
suitable for most of the wild fish catches. The lakes provide 80% of the country’s capture fish production
and Lake Victoria leads the production statistics (58%) of the important export species i.e. Nile perch.
In Uganda there are over 365 fish species, the most important of these for commercial and subsistence
exploitation include Nile tilapia, Sardine-like Rastrineobola sp, African catfish (Clarias gariepinus), Bagrus
docmac, haplochromis and Lungfish (Protopterus sp). Available figures show that the country’s species
abundance is in the order of Nile perch (46%), tilapia (38%), Rastrineobola (6%), Protopterus (4%) and
others (6%). It should be noted that there are no figures for the overall stock standings for the different
127
species although a 2005 survey by the Department of Fisheries Resources (DFR) estimated total annual
yield around 330,000 tonnes.
Small scale aquaculture became practical due to the availability of small lakes, streams, high water table
and local species that can be cultured in controlled environment- like African catfish and Nile tilapia
accounting for 67% and 32% respectively in terms of production statistics. Aquaculture has been
practiced in Uganda since 1950s but has always remained at a subsistence scale with negligible
production volumes and extensive production systems. With production volumes of less than 5000
tonnes annually, it hardly contributed to national fisheries production figures up to the year 2004. Since
2005, the decreasing wild fish catches and exports prompted an alternative to bridge the deficit-see
figure 50. It has grown in the past 10 years from less than 5000 tonnes a year in 2002 to over 50,000
tonnes in 2008 with African catfish (Clarias gariepinus) accounting for two thirds of the production.
Uganda now ranks second in aquaculture production in Sub-Saharan Africa next to Nigeria. In terms of
industrial drivers, there are currently 11 hatcheries providing quality catfish fingerlings to farmers and
one farm with sex reversed tilapia. The government’s target from aquaculture is to achieve a yearly
production volume of 100,000 tonnes by 2017. In Uganda’s aquaculture sector, tilapia and catfish are
low value species and the margins experiences by farmers are usually small with reports of losses in
some cases. A large part of a product’s value addition is made outside the firm, by its suppliers and
customers, who therefore have a large impact on the total cost of the production and margin in the
value chain. Even with best management practices, profitability of aquaculture in Uganda gets crippled
by the rising feed prices (about 60-70% of production costs) without a proportionate improvement in
FCR performance and low fish prices at the end of the chain. However, some sectors like hatchery
production have been considered more profitable than grow-out. Cages also perform better than ponds
in tilapia production. To improve aquaculture fish price, solutions like live fish sales, processing and
establishing niche markets; are being used. Cost-benefit ratios depend on the species being cultured and
currently it is not possible to predict probable profit margins for all production systems.
The Ugandan fisheries sector is mostly artisanal in nature and a combination of traditional and modern
technology is used. Gillnets are the widely used gear for harvesting fish; set in the evening and hauled in
the morning. Harvesting is done first by artisanal fishers with manually propelled boats fishing in areas
less than 30kms offshore and second, those with wooden plank boats that are powered with outboard
engines and fishing in deeper waters. The latter are mostly involved in catches of Nile perch and Tilapia
for export. The lack of industrial fleets has been reported to be a government strategy to protect the
small scale fishers whose livelihoods solely depend on these lakes.
128

0
50
100
150
200
250
300
350
400
450
500
1997 1998 1999 2000 2001 2002 2003 2004 2005 2006 2007 2008 2009
Vol
ume
('000
tonn
es)
Year
Aquaculture
Capture
Est. Capture MSY
Figure 49: Trends in total volumes of capture fisheries and aquaculture in Uganda
Fishing nets range in sizes depending on the target species and size; for example the minimum for Nile
perch capture is a stretch mesh size of not less than 5 inches or fish total length of minimum 20 inches.
The average catch of Nile perch per month varies between 400 and 900 kg for motorised boats and
between 130 and 250 kg for non-motorised boats. With the increasing demand for high quality fish by
processors, there has been a surge in the use of baited long line for the capture of Nile perch. Baits
include Haplochromines and juvenile catfish that are harvested either from the wild or fish farms.
However, the sardine-like Rastrineobola is harvested in shallow waters close to the shoreline using seine
nets similar to mosquito-nets. In aquaculture, the practice involves use of seine nets for sampling and
complete harvest of ponds while cast nets are used to sample cages for example at SoN fish farm. The
use of illegal gear has also been cited, these gears include seine nets, small gill nets of less than the
minimum five inches mesh size, monofilament nets and various active fishing gears which do not allow
for the regeneration of the stocks. Financial losses accruing annually from illegal fisheries as a result of
stock degradation and wastage have been estimated to be $ 30 million.
In Uganda there are two types of landing sites, non-gazetted sites (majority) with little or no
infrastructure and gazetted (upgraded) sites with raised platforms for handling fish and with the most
number of motorised boats. After fish is landed in one of the sites, it is either auctioned in batches or
sold individually. On most gazetted landing sites the auction system is used where a batch of five or
more mature pieces of fish are sold to the highest bidder. The fish is then bought by factory agents,
wholesalers, artisanal processors, retailers and consumers. The price offered per kilogram is determined
129

by the amount landed and the available price offering from factories and therefore price fluctuations are
common. On non-gazetted landing sites around the lakes, fish is sold in pieces to processors and
consumers. These landing sites are common outlets for the illegally caught fishes. In addition, a
considerable amount of fish is harvested and landed across Lake Victoria in Kenya or Tanzania. The
maximum sustainable yield (MSY) for Lake Victoria is approximately 300,000 tonnes and further increase
in wild catches is not probable considering the lake, since it is a shared resource among Kenya, Uganda
and Tanzania. However, by 2004 Uganda was already harvesting above this MSY -See figure 50. The
fisheries export sector in Uganda grew from $ 0.5 million in 1998 to $ 140 million in 2008.
The fishery sector contributes to the GDP of the country for example in 2009, trade in fisheries and
aquaculture contributed about 2.8% of the national GDP. Recent data emphasized the importance of the
fishery sector for poverty reduction as it provides direct source of income for over 266,000 households,
equivalent to around 1.2 million people (4% of the population).
Fish farmers have formed several fish farmers groups in order to sustain the markets for farmed
products, to harness economies of scale through hire of equipment and services, and to purchase inputs
in bulk. Association of fish farmers include Walimi fish cooperative society (WAFICOS) in central Uganda,
Iganga zonal fish farmers in Eastern Uganda and Kabeihura fish farmers in Western Uganda. WAFICOS
particularly has been sound in bargaining and lobbying for both public and private interventions for its
members on issues ranging from production to marketing and training. Proposals for aqua parks are also
underway in order to increase economies of scale from the industry.
15.2 Fish processing
Most of the fish landed in Uganda is sold fresh, only a small proportion is processed. Although fresh fish
is preferred over processed products, it is not available regularly due to bottlenecks in the distribution
system. Available figures from the Uganda Investment Authority indicated that around 60% of the
landed fish is sold fresh, while 20% is processed by traditional methods, mainly smoking. It is illegal in
Uganda to export unprocessed fish thus industrial processing has mostly served the international and
regional export markets.
Available figures approximate the fish processing sector to employ about 5000 individuals (SEATINI
2008). This probably has declined with decreasing fish catches and closure of industrial processing
plants. By 2007 Uganda had 18 fish processing plants however with the rapidly declining fish landings,
six closed down. All fisheries industries were built around Lake Victoria as it is the largest contributor of
fisheries resources.
130

Processing of aquaculture products is still negligible but growing. Processing plants deal in specialised
fish products and are geared to serve primarily overseas market. Some of the leading operators in this
category are Green Fields (U) Ltd, Uganda Fish Packers, Marine and Agro, Hwang sung, Ngege (U) Ltd. A
report by SEATINI (2008) revealed a total installed capacity of about 545 tonnes per day and a 40 %
capacity utilisation of only 255 tonnes per day.
Chilled and frozen fillets make the largest proportion of fish products for export and the affluent market
in Uganda. Majority of Nile perch catches are processed for fillets and by-products that are gaining
particular interest among recent processors. The whole fish constitutes about 37- 40% fillet and the
remainder is by-products which include frames, skins, fats, trimmings, fish bladders, fish maws, and
rejects from the processing line. Tilapia of low quality is sundried and/or salted (makayabu) and sold in
the local and regional markets including Kenya, Sudan and Congo. The domestic market mostly prefer
fresh frames and heads of Nile perch and the regional export market especially Congo is a major
destination for salted heads, frames and skins of Nile perch. In addition, dried or frozen fish maws are
exported to Asia where they are a delicacy in making soup stocks or to Europe for the use of filtering
beer. Tilapia, catfish, and Bagrus are mostly retailed fresh in the local markets but farmed catfish is
smoked or salted for sale within the region. Currently only Greenfields (U) Ltd has been able to process
substantial amounts of farmed catfish for the regional market (WAFICOS sales data). The products are
mainly consumed on the local and regional market where the demand is estimated to be close to million
tonnes.
There are several fish by-products sold locally, regionally and internationally, some of these include fish
maws, fish skins, fish oil, fish bladders and meal. Processing plants for chilled and frozen fillets are the
biggest exporters of fish by-products. Fish meal and fish oil are mainly consumed in the country but
processed Nile perch maws and skins are exported to Asia and Europe. The Rastrineobola is processed
differently i.e. salt is applied (1.66 % w/w) on-board to facilitate the drying process plus its anti-bacterial
and preservation properties. In the landing sites women head-carry the catch from the fishing boats to
the drying area using plastic containers to the drying area. The fish is dried for about 6 to 12 hours on
bare ground (for animal feed industry) or raised platforms (for human consumption) with non-rust
netting surfaces about a meter high. Uganda’s different fish products and by-products are shown in
figure51.
131

Nile perch and tilapines of export grade (75% of
commercial catch)
Nile perch and tilapines for local market (25% of
commercial catch)
High value products for International market (Chilled and frozen fillets, Fish maws)
Rastrineobola (Mukene)By-products of filleting
operationsFactory rejects and spoilt fish
By-catches, juveniles and catfish
and Bagrus
Frames and Heads Trimmings Eggs Skins Fat pads
Fish meal for food and animal feed
Fish cakes, fish fingers, sausages
Unrefined fish oil for local market, skins for
regional market
Smoked and sun-dried fish for local market and
export to regional markets
HARVEST FROM LAKES
HIGH VALUE
FISH
LOW VALUE FISH PRODUCTS
VALUE-ADDED
FISH PRODUCTS
HIGH VALUE FISH PRODUCTS
Figure 50: Uganda’s fishery products
The fish processors incur different costs for instance the artisanal processors who are engaged in fish
smoking have firewood and storage costs. Whereas, those engaged in processing dry Rastrineobola,
tilapia, and fish by-products incur costs of transport, salt, and rent of drying area and protection from
birds. In addition, costs associated with the fish processed for export market include freight costs, raw
material, ice, labour, local transportation, power costs and packaging costs.
15.3 Transportation
In Uganda a typical fishing ground is about two to four hours away from land by motorboats which are
usually too small and cannot accommodate ice. Harvests are placed on the bottom of the boat and
132

covered by plastic sheets or vegetation to protect from direct sun rays and spoilage resulting from high
temperatures. Ice is only applied when the fish reaches the collector boats (kinaala) at the transit sites.
The collector boats are privately owned open outboard motorised boats that deliver fish to the landing
sites and return back loaded with ice supplies. In addition they spend two to three days in the transit
sites (island sites). However, when ice is not available the fish is delivered from the fishers to the landing
sites the same day. The collector boat operators are responsible for selling the fish and handing over the
proceeds to the fishers. Thus, the fishers lack control over the selling process and were often cheated
mostly due to a large time lag between capture and receipt of income.
The country’s less developed infrastructure i.e. underdeveloped road network and lack of railway are
among the major obstacles for domestic fish distribution. Accessibility of landing sites is also important
in the country’s fish trade. The traders in the gazette landing sites are truck or pick-up track traders and
factory agents whereas the non-gazette landing site traders are bicycles and motorcycle traders. The
infrastructure also determines the marketing and prices in the landing sites i.e. the landing sites having
easy access don’t have varied fish prices whereas those which are difficult to reach have different prices.
Export grade fish is iced and delivered by insulated trucks to processing establishments. Generally fishers
associate factory trucks with positive impacts like increased fish prices, ready market for fish and
employment opportunities. Fish for domestic consumption is traded fresh at the landing site and
transported on pickup trucks. Fish that is destined for curing is mostly purchased by women who head-
carry it to smoking kilns. Hired trucks are the most common mode of transporting fish to distant markets
(see figure 52) and traders often share truck space to reduce individual costs. These six to eight ton
capacity trucks operate as regional transportation e.g. Uganda to Sudan and their costs include mileage
and border clearance costs totalling about $ 0.2 per kg of fish which will sell above $ 3 per kg at
destination.
In international trade, it has been reported that trade in freshwater products is limited; partly as a result
of high transportation costs compared to product value except the sale of fresh Nile perch from Africa to
Europe. In the case of Rastrineobola after drying, it is packed in hessian bags and transported on Lorries,
pick-ups and bicycles to different markets. The form of transport varies with market destination where
hired trucks are used for regional markets, pick-ups for locally distant markets and bicycles for nearby
fish markets.
133

0%
10%
20%
30%
40%
50%
60%
70%
80%
90%
100%
Bicycle Own vehicle Hired truck Public transport
Tilapia
Catfish
Nile perch heads and frames
R. argentea
Figure 51: Relative uses of different modes of transport for fish products from Uganda (Source: adapted from Dhatemwa 2009)
The mode of transportation for aquaculture products, for e.g. fresh catfish and tilapia, in the rural areas
include bicycles and motorcycles. However, most farmers sell their fish by the pond side or when they
have access to major town markets they deliver live fish by themselves. Farmers in associations transport
their harvest for sale to the head offices in open tanks at the back of a hired pickup truck. Typical hiring
rates are estimated at about the $ 0.3 to 0.5 per km and live fish sells between $ 2 to 3 per kg. The 65%
increase in fuel prices between 2010 and 2011 has probably pushed these transport costs higher. In
terms of product distribution, these producers should have enough volumes to justify the transportation
costs (Erik 2010). Thus, transportation option is costly to a farmer with inconsistent production output
which is applicable to Ugandan fish farmers.
For hatchery operators, the farmer (fingerlings) or fisherman (bait) also incurs the transportation costs.
Dhatemwa (2009) estimated the cost of transport to be in the range from 30% to 300% of the seed
purchase. There are also incidences of transporting bait over water in jerry cans especially to Tanzania
where fishermen sell it at 200 to 500% of the seed cost which for the preferred size of 9-10 inches is
about $ 0.07 to 0.09. Fishing boats carry 500 to1000 baits that live for four days to allow transportation
from Uganda across the lake and mid water fishing. It is mandatory that transportation of all aquaculture
products is done under a permit issued by MAAIF to reduce incidences of harvesting illegal wild catches
guised as aquaculture harvests. A live fish transport permit is estimated at $ 4 per tonne.
15.4 Final consumption
The major export earner fish species is Nile perch which accounts for 90% of the total formal fish exports
of the country. It is exported mainly to EU (65%), Australia (12%), South East Asia (12%), Middle East
134

(6%), Africa (5%) and to the Americas. Nile perch has been a close substitute of tradition white fillet fish
like cod in these countries but in the recent past the emergence of farmed cod and Pangasius from
Vietnam are threatening exports from Uganda.
In recent years the fish stocks from lakes decreased, some of the main reasons are increased fishing
pressure, pollution and illegal fishing practises. Fish processing industries have closed due to lack of fish
while others operate at low capacity. There was a 46% drop in revenues from fish exports in the period
2006 to 2009 i.e. from $ 141 million in 2006 to $ 75.6 million in 2009 mainly due to decreasing Nile perch
export volumes-see figure53. In addition, the exports dropped further after 2009.
0
20
40
60
80
100
120
140
160
0
5
10
15
20
25
30
35
40
45
1997 1999 2001 2003 2005 2007 2009
Val
ue (m
illio
n U
SD)
Vol
ume
('000
tonn
es)
Year
Value
Volume
Figure 52: Trends in total formal export volumes of fisheries products from Uganda by volume and value
Statistics from the Ministry of Agriculture, Animal Industries and Fisheries showed that from January to
June 2010, only 5,000 tonnes worth $ 25 million were exported. Uganda also exports processed fish to
neighbouring countries mainly Rwanda, DRC and Kenya. It is estimated that about 25,000 tonnes of fish
are exported informally across land borders.
Fish provides up to 50% of animal protein to Ugandan’s. The estimated per capita fish consumption
ranges between 7Kg to 12.7Kg. A report by NEMA/UNEP (2004) revealed that if fish catches were to
remain at a domestic demand growth of 3.4% and catches of about 280,000 tons per year, per capita
consumption would fall to approximately 5 kg, although the catches increased in the subsequent years.
Uganda has a high domestic demand for fish but this is countered by low levels of sophistication and is
dominated by unprocessed and smoked/dried fish. The demand for fish is supported by income and
population growth in urban areas, plus an increasingly food insecure rural population. Fish consumption
spending is also offset by rising food prices caused by slower agricultural growth. There are
135

overwhelming majority of poor households in rural areas in agriculture and their average consumption
expenditure per adult is reported to be about half of that in urban households. Areas with low fish
consumption (e.g. North east and South-west) in Uganda are those with poor distribution, poor markets
and preservation technologies, unreliable transportation networks and cultural ties e.g. the pastoral
communities that have clear preferences for livestock as their source of protein.
As a result of exports, there are very small quantities of Nile perch in domestic markets mostly illegal
catches, factory by-products and rejects reducing fish consumption levels. Nile tilapia is the most
consumed fish followed by Nile perch, Rastrineobola and BagrusMarket structure.
The buying and selling of fish in Uganda is dependent on the prevailing price. At each link in the value
chain, there are hardly any noticeable differences in the prices of fish among actors. In the Islands, there
are big industrial suppliers with boats designed to carry ice and can hold from one to eight tonnes of
fish. These make ‘informal agreements’ with small-scale fishers whom they supply with motorboats and
nets and later pool their catch. These fishers are then paid a commission of the catch. Any form of
marketing is in-kind between a few big suppliers and a large number of small scale fishermen and
controlled by the suppliers.
Majority of the fish landed on non-gazetted landing sites is sold to wholesalers and retailers by size and
rarely by weight. Marketing and ultimately the price is determined by the number of buyers and sellers
available on landing. On gazetted landing sites, the fish destined for industrial processing (Nile perch and
Tilapia) need not spend time exposed; and from the supplier boats it is swiftly weighed and loaded in
refrigerated trucks. Since there are no formal contracts between suppliers and processing plants, the fish
is usually sold to processors offering a relatively high price. It is common practise that these suppliers
receive checks for the fish sold to industries in which case an industry willing to pay cash usually gets
supply priority even when the price per kilo offered is slightly low.
Fresh fish destined for local consumption and processing is auctioned on raised platforms and the
highest bidder gets the fish. In most cases the fish is sold by numbers and size and not by weight. Traders
usually are willing to pay a price within a profitable range as they know the capability of their potential
customers. Fishmongers usually on bicycles and motorcycle ride their fish volumes from landing sites
and follow two paths. Some hawk the fish door to door among households in usually small volumes of
less than 100kg per day. Due to fish’s perishable character the buyer has high bargaining power and it is
common to find fish at a cheaper price in the evenings. In addition the fishmongers buy and trade their
fish in specific markets alongside other retailers of fresh and smoked/dried fish.
136

Retailers in open local markets are the most common source of fish to local consumers. Fish that is
usually small in size (mostly illegal catches) is sold to consumers and/or processors who deep-fry it in
candlelit markets for the final consumer. Large size fish that cannot be bought by a single household is
cut into pieces and sold by weight. Unlike sales by the piece, sales by weight have little or no room for
bargaining on price. There is a small volume of fish that goes as frozen fillets (Nile perch and Tilapia) in
supermarkets and it is sold in grams.
In aquaculture, there is total lack of seller power, fish is sold either by piece to households or by weight
to traders. The fish (Catfish and Tilapia) harvested from ponds is sold to bicycle mongers or transported
to nearby markets for sale. Due to the size of farmed fish, consumers usually pay low prices in
comparison to wild fish. The price customers are willing to pay for a product partly depends on available
substitute products (Grant 2005). There are several protein substitute products listed by the Uganda
Bureau of Statistics that directly compete for the same market with fisheries products. These include
products like chicken, beef and pork see figure 54.
Figure 53: Average retail market prices ($/kg) for animal protein products in the Uganda market (UBoS, FAO)
The existence of these substitutes means that demand is elastic with respect to price of fish. Prices of
substitutes averaged over the whole country have been increasing for the past ten years. Among fish, dry
tilapia and Rastrineobola show the highest and lowest price per kilo respectively while among other
meats chicken is the most expensive- see figure 54. The price per kilogram offered for fish and substitute
137
0
1
2
3
4
5
6
2001 2003 2005 2007 2009
Price (USD/kg)
Year
Chicken
R. argentea
Dry Nile perch
Dry Tilapia
Fresh Nile perch
Fresh Tilapia
Meat
Pork
Farmed Catfish

products has been below $ 3 up to 2007 but current figures in local markets indicate a rise in all food
prices. Most consumers are driven by the price of the fish or substitute product and would buy easily
switch to products that are considered cheap. The low prices offered locally for fresh fish also presents a
barrier for importers to sell fresh fish on the same market.
15.5 Fishery regulations
Management of the fisheries in Uganda is a joint task carried out by several institutions directly under or
alongside the department of fisheries resources. The government of Uganda has set Fisheries
management regulations including the fish act of 1967 for fish control, fish conservation, fisheries
products’ transactions and other fishery matters. There is also a fisheries policy from the Ministry of
Agriculture, Animal Industries and Fisheries (MAAIF) giving guiding principles on the management of the
resource under local and international law like the 1995 FAO code of conduct for responsible fisheries. In
terms of responsible fisheries, food safety and marketing, the rules and regulations are enforced by
issuing permits to stakeholders. These permits are required for domestic, regional and international fish
trade. The permits and respective tariffs act as barriers to entry into or exit from the fishery and specific
markets.
For the export food safety, basic framework for fisheries products was laid out in the EC Directive 91/493
of 1991 and it deals with the production and placing of fishery products, in the market, for human
consumption. According to this directive, Uganda had to put in place systems of inspection and control
to ensure the safety of fisheries products, including the implementation of Good Hygiene Practices
(GHPs) and Hazard Analysis and Critical Control Point (HACCP). The Ugandan industry regained its status
as a ‘safe’ source of fish to the EU by fixing ‘the system’ (regulations and inspections) and performing the
ritual of laboratory testing for all consignments for exports. Fifteen fish processing establishments are
applying modern processing techniques alongside HACCP control systems being fully compliant with
international requirements. All fish exporting companies have food safety systems in place such as ISO
22000, GHP and HACCP with the Uganda Bureau of Standards. The motivation to have this in place is due
to the export market requirements and consequently they devote more time and resources to the
standardisation processes. Other regulations affecting exports of fisheries products are EU Regulation
466/2001 setting the maximum limits for heavy metals in a number of species of fish and shellfish, and
EU Regulation 2065 / 2001 on labeling information of fishery and aquaculture products. The
development of a legal framework to regulate the development of eco-labels and voluntary
certifications, and laying down guidelines for the monitoring of claims in the EU has been reported.
138

Due to the open access nature of the fishery in Uganda, fisheries management restrictions and
regulations are hard to enforce. Mugabira (2008) observed that enforcement of regulations like the ban
on immature fishing and control of gear restrictions, and restricted entry to fish breeding grounds was
not sufficiently done. Slackness has also been noted in enforcing the ban on sale of unprocessed fish
regionally as there reports of fresh fish from Uganda being landed in Kenya and Tanzania across Lake
Victoria. Majority of landing sites in Uganda from which export fish is sourced still fail to comply with
basic hygiene requirements which might put the industry at risk of bans.
Being an Open access fishery, Uganda’s fisheries sector faces the challenges of sustainable exploitation
of capture fisheries; upgrading landing sites; and development of aquaculture as a supplementation
measure. In 2003, the government established a community fisheries management scheme referred to
as Beach Management Units (BMUs). This ensured the decentralisation of fisheries management with
the BMUs as the preferred method of local management at all gazetted landing sites. A BMU committee
requires the representation of four stakeholder groups: 30% boat owners, 30% crew, 30% other and 10%
fishmongers with a representation of 30% women. The processors are reported to have the dominant
representation on these committees. Fisheries management is mostly focused on technical measures like
fish size and mesh size limits (MTTI 2006b). No serious attempt has been made to address the
fundamental open access nature of the fishery (MTTI 2006a). This has resulted in increasing fishing
capacity without control. It is further noted that even effective policies for management are crippled by
lack of implementation capacity.
Uganda’s aquaculture sector suffers from an uncoordinated marketing system. With increased
government commitment to develop aquaculture, the industry has good prospects for further
development. For example Uganda Investment Authority encourages large commercial scale investment
in the sector by providing a tax holiday and an aquaculture development strategy has been drafted and it
will be developed into a policy. The MAAIF fisheries policy stipulates the way forward for development of
commercial aquaculture whose strategy has been recently drafted. The government has placed rules for
governing aquaculture as an enterprise. Further still, responsible aquaculture is ensured by issuing
permits to stakeholders from farm setting to marketing of farmed fish products. Similar to the capture
fisheries permits and respective tariffs, permits in aquaculture can act as barriers to entry or exit in
production and marketing. Uganda is still in the process of developing certification procedures and
regulations that will aid in international exportation of aquaculture products.
At the fishing-grounds cleaning of fishing boats is not a daily practice and when done contaminated
water from the lake is used. For the fish meant for local consumption, additional bruising also results
139

from throwing catches into pick-up trucks while transporting to local markets. In addition, distribution of
fish on the local and regional market to a large extent is done without refrigeration and it is accompanied
by postharvest loss and deterioration.
15.6 Data availability
The study requires time series data for fish prices along value chains of Nile perch, tilapia, Rastrineobola,
catfish and bagrus. Detailed data and information provided by fellow traders, Fishery Officers, Customs
Officers and BMUs is limited. This is mainly due to poor, limited facilities, supplies and equipments used
for data collection and processing, except for the Customs Officers. However prices can be tracked in
primary data collection from most nodes in the relevant value chains.
Some individual firms are not willing to provide information e.g. information related to margins.
However some are willing to share this information as a corporate social responsibility for example
Greenfields (U) ltd. In addition farmers, fishes and local retailers have been cooperative in this regard-
table 32 indicates the available fishery data source of the country.
Table 32: Fisheries Data sources for Uganda
Source Data available Reliability
UBoS Time series fish prices in local markets
Wild catches for Uganda
Good
FAO Time series Fisheries production figures for Uganda
Moderate/Questionable
Ministry of Agriculture Animal Industry and fisheries
Regulations, Surveys Good
Aquaculture Research Development Centre
Aquaculture technologies Good
Fishers, Farmers, Processors, Traders, Local Retailers
Prices (need to visit several of them to develop a time series)
Excellent
Online Prices of products outside Uganda Hard to Verify. Difficulty in tracking time series data on retail prices of Products (Nile perch and Tilapia) in Europe by
time.
140

16Vietnam
16.1 Fish production
Vietnam, with a coastline of over 3,260 kilometers (km) and more than 3,000 islands and islets scattered
offshore, plus up to 2,860 rivers and estuaries, has been geographically endowed with ideal conditions
for the thriving fishery sector which currently exists. For centuries, the Mekong River Delta in the south
and the Red River Delta in the north have been used for wild catch fishing as well as extensive fish
farming. The Mekong River Delta, one of the most productive fishery zones, covers an area of about
40,000 square km and striped catfish are raised popularly in its freshwater bodies. In addition, there are
about 4,200 square km of rivers, lakes and other natural bodies of water. Furthermore, there are inland
waters which swell to an additional 6,000 square km during periods of seasonal flooding.
The fishery sector plays an important role in the national economy, accounting for about 6.1 % of the
country’s GDP in 2006. Fish production grew at an average rate of 7.05% from 1991 to 2000, and 10.25%
from 2001 to 2010. In 2010 fishery production reached around 5.2 million tons (increased 406% relative
to 1990), creating more than 5.0 billion USD of export revenue-see table 33. The growth in production,
most of it, could be due to the expansion of aquaculture, which increased from a 30 % share of the
sector in 1990 to 52 % in 2010.
Table 33: Vietnamese fishery production 1990-2010
Year Catch (tons) Aquaculture (tons)
Total production (tons)
Export value (1000 USD)
Export growth (%)
1990 709,000 310,000 1,019,000 205
1991 714,253 347,910 1,062,163 262,234 27.92
1992 746,570 351,260 1,097,830 305,630 16.55
1993 793,324 368,604 1,161,928 368,435 20.55
1994 878,474 333,022 1,211,496 458,200 24.36
1995 928,860 415,28 1,344,140 550,100 20.06
1996 962,500 411,000 1,373,500 670,000 21.80
1997 1,062,000 481,000 1,543,000 776,000 15.82
1998 1,130,660 537,870 1,668,530 858,600 10.64
141

1999 1,212,800 614,510 1,827,310 971,120 13.11
2000 1,280,590 723,110 2,003,700 1,478,609 52.26
2001 1,347,800 879,100 2,226,900 1,777,485 20.21
2002 1,434,800 976,100 2,410,900 2,014,000 13.31
2003 1,426,223 1,110,138 2,536,361 2,199,577 9.21
2004 1,923,500 1,150,100 3,073,600 2,400,781 9.15
2005 1,995,400 1,437,400 3,432,800 2,738,726 14.08
2006 2,001,656 1,694,271 3,695,927 3,357,960 22.61
2007 2,075,000 2,123,000 4,197,000 3,763,000 12.40
2008 1,850,000 3,399,000 5,249,000 4,509,000 19.82
2009 2,277,700 2,569,900 4,847,600 3,488,000 11.12
2010 2,450,800 2,706,800 5,157,600 5,034,000 18.40
In Vietnam, according to the country’s statistics, around 10% of the population derives his/her main
income from fishery. For example, the catfish industry was boost up during 1997-2008, involving 800,000
farmers in Mekong Delta and millions of labours in the backward (inputs) and forward (processing and
trading) sectors of the industry. In the striped catfish aquaculture industry more than 500,000 labours
and 50,000 farming households have been involved in 2003. Farm price of catfish fluctuate in the range
of 15,000 – 18,000 Vietnam dong/kg (~ 0.78-1.00 USD/kg) while the price of exported catfish fillets was
around 2.3 USD/kg during 1997-2009.
Shrimp is also one of the most important species of the country. Shrimp production in the Vietnam’s
Mekong Delta is a farming practice in different production systems ranging from large scale intensive,
semi-intensive and extensive. The extensive or “improved extensive” where some modifications (or
improvements) have been made to the pond system, is the largest production system type by area and
production and is largely characterized by small-scale farmers with less than three hectares in farm area
per farmer/family. Before 2000, all shrimp cultured in Vietnam are black tiger Panaeus monodon. Since
2002, lots of shrimp farmers have transferred to whiteleg shrimp, especially since 2005 (Figure 55). The
peak of whiteleg shrimp aquaculture is in 2007 when its production reach 153000 tons, valued at 612
million USD.
142

0
50,000
100,000
150,000
200,000
250,000
300,000
350,000
2002 2003 2004 2005 2006 2007 20080
200,000
400,000
600,000
800,000
1,000,000
1,200,000
1,400,000
Giant tiger prawn Quantity (tonnes)Whiteleg shrimp Quantity (tonnes)
Giant tiger prawn Value (1000USD)Whiteleg shrimp Value (1000USD)
Figure 54: Shrimp production in Vietnam 2002 – 2008
Apart from shrimp and catfish, hard clam Meratrix lyrata is a species of high value mollusk kept and
harvested in the “culture based catching beds” in coastal Vietnam. Mollusk production in Vietnam is
estimated at 300,000-350,000 tons a year, including 50,000-60,000 tons of hard clams. In 2009 the clam
production in Ben Tre has been awarded a MSC certification.
The fishery sector contributes a lot to the country’s GDP; however there are some constraints the
industry faces. The fleet of vessels for the various types of fisheries was insufficient and inefficient,
transportation and retailing facilities (storage, depuration establishments, or “cold chain” facilities, etc.)
were underdeveloped, access to credit was difficult, extension services and marketing channels were
lacking, and there was low awareness among farmers and processors with respect to hygienic standards,
quality tools and chemical monitoring. These constraints or shortcomings led to a very low added value
products, which affects the competitiveness of the fishery products in the international markets.
16.2 Fish processing
In Vietnam different fish species are processed, for instance striped catfish is processed mostly in fillets
form for the purpose of exports. Fresh catfish are sold mostly in the domestic market but some are
exported. In striped catfish processing sector, there are more than 290 processing plants in catfish
industry who can buy farmed fish to process before export to foreign markets. The processing sector
involves 150,000 farmers in Mekong Delta.
There are more than 300 companies in Vietnam related to shrimp trade, in which 60 bigger companies
cover more than 80% export value and 120 companies reached the export sales of 1 million USD. In
143

2009, Vietnam exported shrimp to 82 foreign countries in which 10 biggest markets (cover more than
80% export value) include Japan, USA, Korea, Taiwan, German, China, Australia, Canada, United Kingdom
and Belgium.
16.3 Final consumption
The fishery products of Vietnam are consumed domestically and exported to different nations across the
world. Currently Vietnamese fishery products have reached more than 120 countries and territories on
five continents. The bulk of Vietnam’s fishery exports are bound for Japan, Taiwan, South Korea, Hong
Kong, the United States and the European Union. With a twenty four-fold increase in fishery exports
since the 1990’s, Vietnam now ranks among the top ten seafood exporters in the world.
Markets of the United States (157 thousand tones, valued $972 million) and Japan (135 thousand tones,
valued $897 million) are the two largest export destinations, by country, while European Union nations,
as a group, had the largest share of exports by volume (364 thousand tonnes) and by value ($1.2 billion,
cover 23.5%) in 2010 (Figure 56).
050000
100000150000200000250000300000350000400000
0
200
400
600
800
1,000
1,200
1,400volume (tonnes)value (million USD)
Figure 55: Vietnam's Fishery Products Export Market, 2010
Catfish and shrimp are by far the largest share of aquatic exports, accounting for over 22% and 44%,
respectively, of the total export earnings in 2006. The annual export value of catfish was around 1.4
billion USD in 2008 with 650,000 tons of volume. The export volume of catfish in 2010 was 660,000 tons,
valued 1.43 billion USD.
Currently, striped cat fish has foreign market in 140 countries over the world. Price is determined
through negotiation between processors and farmers. Some of the processing plants have contracts with
fish farmers but mostly for an agreement of purchase or sale of farmed catfish, not for price. The farm
and export prices of catfish have increased considerably since last quarter of 2010. The average export
144

price in March 2011 was 3.6 USD/kg in fillet frozen forms while the farm price reaches 25,000 VND/kg (~
1.25 USD) in a peak.
In the case of shrimp export, frozen shrimp stands first place in the Vietnamese fishery exports structure.
Shrimp export covers 40% total fishery export revenue of Vietnam, in which white leg shrimp exports
doubled its value in 2010 relative to 2008 as the global demand for white leg shrimp is increasing. In
2010, Vietnam exported 241,000 tons of shrimp, valued to 2.1 billion USD in which around 62,400 tons
are from white leg shrimp, valued 415 million USD, covering 20% of total export value of shrimp. Farm
price of white leg shrimp was 70,000 VND/kg (3.5 USD/kg). Generally, shrimp export increased over the
years- see figure 57.
0
50,000
100,000
150,000
200,000
250,000
2000 2001 2002 2003 2004 2005 2006 2007 20080
200,000
400,000
600,000
800,000
1,000,000
1,200,000
1,400,000
1,600,000Quantity (tonnes)Value (1000USD)
Figure 56: Vietnamese shrimp exports 2000-2008
EU is the biggest market of Vietnamese clam as this market consumed 73.8% export volume. The other
markets include, but not limited, the US, ASEAN, Canada, China and Hongkong. A study in Hochiminh
City in 2010 indicated that most Vietnamese people prefer eating fresh clams to frozen ones but there
exists an increasing trend in domestic consumption of frozen products from clams as half of surveyed
consumers expressed their positive attitude towards clam products and they use clams at least one time
per week.
Vietnam’s strategy of increasing its fishery exports faced a number of constraints and deficiencies. Some
of these were common to other commodities from Vietnam. The geography and topography of Vietnam
makes the country highly vulnerable to natural hazards. Each year, natural disasters such as typhoons,
storms, floods or drought have severe effects on fishery industry. The lack of awareness and control on
the marine fishery capture significantly impacted coastal fishery resources and aquatic biodiversity.
Fish demand is increasing in the Vietnamese domestic market, especially in Hochiminh city, the most
dynamic and populated economic area in Vietnam. Generally the consumption of marine fish is higher
145

than fresh water fish – see figure 58. Current studies indicate consumer’s preference of fresh fish
compared to frozen fish. However, consumers view towards frozen fish is positive (a current study
indicated that 37% of the respondents were in favour of frozen where as only 10% were not in favour)
since it is convenient and time saving to prepare. Some of the advantages of fish according to
Vietnamese consumers include less cholesterol, cheaper price and better taste compared to other
animal meats.
0
2
4
6
8
10
12
14
1980 1985 1990 1995 2000 2005 2007
Cephalopods Crustaceans Demersal Fish Freshwater Fish
Marine Fish Molluscs Pelagic Fish
Figure 57: Consumption of fishery products in Vietnam
16.4 Market structure
The country’s fishery market structure involves different parties including input suppliers, farmers,
collectors, processors traders and consumers. A catfish market structure (the value chain of shrimp is
similar to the catfish’s) for the year 2009 is presented in figure 59. There was a change in the percentage
of the catfish transfer from one agent to the other in two years i.e. 2008 and 2009. For instance, the sale
of catfish from farmers to brokers increased (8.9% to 13.8%) decreasing the sale from farmers to
processors (91.1%- 86.2%). The decrease in exported percentage of catfish production from 91.4% in
2008 to 77, 6% in 2009 expressed an increase in domestic consumption due to great effort of catfish
processors toward domestic market during and after the global financial crisis. In the case of the
transaction from brokers to wholesalers (2.2%-4.6%) and retailers (4.5%-9.2%) there was an increase-see
figure 59. The wholesaler’s catfish sales to local consumers decreased (6.7%-4.6%) in the year 2009 than
in 2008. Where as in the case of sales of catfish from retailers to local consumers increased (6.7%-9.2%).
In Vietnam there is no price data for the whole Vietnamese market, however there are prices for specific
146

locations i.e. provincial data.
Figure 58: Catfish market structure in 2009
The value chain of hard clam in Mekong Delta includes agents like local nursing farmers, collectors,
processors, domestic markets, export markets and etc. The value chain of hard clam in Mekong Delta is
summarised in the figure 60.
Figure 59: Value chain of hard clam in Mekong Delta 2009
147
Catfish farmer
s
Processors
Wholesalers
Inputs supplier Farmers Collectors Processors Traders
Associations
Trade promotion Centres
Retailers
4, 6%
9, 2%
Export markets
86, 2%
13, 8%
9, 2%
4, 6%
77, 6%
8, 6%
NAFIQUAD
Banks
Consumers
VASEP
ProductionInput
suppliersSeedFood
Medical chemicals
Provincial extension systemResearch institutions/Universities
BrokersLocal
Consumers
Collector
Local nursing farmers
Collectors
Clam seed (wild
harvested/bred
Processor
s
Domestic markets
Collectors
Grow-out
keeping
Northern clam
keeping beds
100% 10%
90%
52, 3%
47, 7%
99, 5%
0,5%
93, 2%
6,8%
Export
markets
95, 0%

16.5 Fishery regulations
In Vietnam there are, currently, more strictly regulations related to environment protection, quality
control and health/sanitary guarantees. The Vietnamese striped catfish is facing more non-tariff barriers
in international trade, such as anti-dumping measures and sanitary requirements. However, there is no
restriction on who can buy and sell the fish. Although the Vietnamese Association of Seafood Exports
and Processing (VASEP) and Vietnamese Fisheries Society (VFS) have given support to farmers on quality
management and some governmental support to the catfish industry. Although most catfish farms are
managed by individual farmers, some of the big catfish farms are owned by processing plants who want
to create whole chain of catfish production in one corporation.
International standards such as Global GAP are followed, implemented initially by biggest farms and now
spread out to smaller ones. After a dispute with WWF in some European countries on responsibility for
environment and nature protection in Vietnamese catfish industry, most catfish companies are
considering the application of ASC (Aquaculture Stewardship Council) standards in their farming
practices. A target for environmental responsibility is already agreed between Vietnamese Fishery
Department (Ministry of Agriculture and Rural Development) and WWF International in which 100%
commercial catfish farms will meet ASC standards by 2015. The target is expected to enforce a
sustainable development in Vietnamese catfish industry.
148

17Summary
Project name: Value-chain analysis of international fish trade and food security with an impact assessment of
the small scale sector.
Main objective: To achieve a better understanding of the dynamics of relevant value-chains in international
fish trade and arrive at policy recommendations. The project will analyse the distribution of benefits in the
value-chain and the linkages between the relative benefits obtained and the design of the chain. Comparisons
will be made between domestic, regional and international value-chains with the view to understand better
how developing countries can increase the value derived from their fishery resources. In order to achieve its
objective the project will prepare two reports namely a back ground report and price analysis report. Thus,
this report is the first report which is the back ground report of the countries.
Countries involved: Fifteen (4 industrialised and 11 developing countries). The industrialised countries
include Japan, Canada, Norway and Iceland. The developing countries are Honduras and Peru (central
and south America); Morocco, Uganda, Kenya and Ghana (Africa); Cambodia, Vietnam, Thailand,
Bangladesh and The Maldives (Asia).
Financers: NORAD and FAO (the case study of Iceland and Norway are locally financed)
Summary of the main results: The summary of the results from each country are presented in tables 34
and 35. The fish species included in this study are both capture and culture fishery including marine,
riverine and inland fishery. The number of fish species, for each country, included in the study differs
from country to country ranging from one (Maldives and Norway) to seven species (Canada). A summary
of tilapia and shrimp will be presented in this part since tilapia was presented by six countries among the
most important species where as shrimp was presented by five countries. Thus, further analysis could be
done for these two species.
Tilapia is cultured inland fishery in Bangladesh, Honduras and Thailand, captured fishery in Kenya, and
both captured and cultured fishery in Ghana as well as Uganda. Tilapia could be processed in to the
following products: fresh fillet skinless, boneless, tilapia without adhering fat and whole totally clean
fish, whole gutted/ un-gutted fresh, frozen fillets, salted, dried, smoked, fried, fermented, and processed
skin tilapia for leather products. The main tilapia markets are domestic, regional (e.g. tilapia heading
149

from Uganda to Sudan, Congo and Kenya) and export markets (exported mainly to USA and EU whereas,
tilapia skin is exported from Honduras to France, Italy, Slovakia and The Netherlands).
In the case of shrimp, it is cultured fishery in Bangladesh, Peru, Thailand and Vietnam whereas in
Honduras, it is both captured and cultured fishery. Processed shrimp products includes fresh, salted,
dried, canned, shell-on frozen, peeled frozen, peeled and deveining, butterfly, Individual Quick Frozen -
IQF, pre-cooked (ready to cook), shrimp skewers IQF, and shrimp paste. The main shrimp markets are
domestic and export markets (Europe, USA, Mexico, El Salvador, Costa Rica, Guatemala, Japan, Korea,
Taiwan, China, Australia, and Canada).
The information regarding the means of transport used from production to the final markets was
available for eight countries. Some of the modes of transport are fish cages with large boats, boats,
trucks/lorry, cars, motorbikes, bicycles, refrigerated trucks, ships and airplanes.
150

Table 34: Species, type of fishery and production/harvesting technology of each country involved in the project
0

1
Countries Species Type of fishery Production/harvesting technology
Bangladesh - Hilsa(Ilish) - Captured fishery : marine and riverine
- Fishing
- Rohu, Catla, Pangas and Tilapia - Cultured fishery: inland - Farming
- Shrimp - Cultured fishery - Farming
Cambodia - Pangasius - Cultured and captured fishery - Fishing and farming
- Snakehead
- Crocker - Captured fishery - Fishing
- Reddish
- HenicorhynchusCanada - Lobster - Capture fishery - Fishing
- Dogfish
- Halibut
- Herring
- Sablefish
- Sole
- Wild salmon
Ghana - Tuna - Captured: marine fishery - Fishing
- Tilapia - Captured and cultured ( ponds, pens and cages)
- Fishing and farming
Honduras - Shrimp - Captured and cultured: Marine and aquaculture - Fishing and farming
- Tilapia - Cultured: floating cages and
ponds
- Farming

Table 35 : Processed products, the markets and means of transport
Countries Species Processed products Markets Means of transport
Bangladesh* - Hilsa(Ilish) - Fresh fish, frozen fish, dry fish, fermented fish, salted and dehydrated fish
- Fresh fish and chilled and dried fish are mostly consumed in the domestic market
- Other forms of fish are exported
- Mainly boats and trucks/lorry
- Primary markets: rickshaws and man-driven vans
- Street vendors: heal-load with aluminium pots
- Rohu, Catla, Pangas and Tilapia
- Shrimp
Cambodia - Pangasius - Salted and dried, and other - Mostly sold in the domestic market - Fish cages with large boats, tank boats and sculls, trucks, cars, motorbike, horse cars, oxcarts, bicycles, and airplanes
- Sneakhead - salted-dried fish, salted fish cheek, fermented fish and fish paste
- Mostly sold in the domestic market
- Croacker - salted-dried Croakers - Mostly for domestic market and some exported to Thailand
- Reddish - salted-dried fish and smoked fish
- Domestic market and exported to Thailand
- Henicorhynchus - Salted-dried fish or fermented fish sauce
- Mostly sold in the domestic markets
Canada** - Lobster - Fresh live lobster, frozen lobster ( tails and lobster meat)
- Canada’s main export markets are
USA, Japan, China, Hong Kong, UK,
- No information is available**
2

mainly for export Russia, France, Denmark, Germany,
South Korea etc.
- Dogfish- Processed dogfish exports
include back and belly flaps, fins and tails
- Halibut - Live halibut and other
- Herring - Majority of herring are fished for roe and exported to Japan
- Sablefish - No information is available**
- Sole - No information is available**
- Wild salmon - Fresh, frozen, and other - Exported to some 63 countries with the most important markets in the US, UK and Japan
Ghana - Tilapia - Salted, dried, smoked, fried and fermented Tilapia
- Exported to EU and USA - Head portage or wooden market trolley (push truck), and trucks- Tuna - Fresh, frozen tuna and canned
tuna (tuna flakes, tuna chunks and tuna mash)
- Mostly consumed in domestic market
Honduras - Shrimp - Shell-on frozen, peeled frozen, peeled and deveining, butterfly or ¾ butterfly, Individual Quick Frozen - IQF, pre-cooked (ready
- Consumed in the domestic market
- Exported to countries like Mexico, El Salvador, Costa Rica, Guatemala,
- Boats, refrigerated trucks and large trucks equipped
3

to cook), and shrimp skewers IQF
USA, Spain, England, Germany, Netherlands and other EU countries
with plastic bins and ice flakes. For the export market either airplanes or ships are used
- Tilapia - Fresh fillet skinless, boneless, tilapia without adhering fat and whole totally clean fish, frozen fillets of tilapia, processed skin tilapia for leather product
- Consumed in the domestic market
- Tilapia skin leather is often exported to France, Italy, Slovakia and The Netherlands
- Other export markets for Tilapia are USA and EU
- Spiny lobster - Whole spiny lobster, tails or meat, frozen,
- Consumed in the domestic market
- Mostly exported to USA and EU
- Red snapper - Fresh ,frozen, whole, and other - Consumed in the domestic market
- Exported mainly to USA
Iceland - Cod - Frozen, fresh (processed), fresh (whole), salted, fish meal, oil, dried, and other (canned, pickled, smoked etc.)
- Frozen products: The fundamental market (in Europe) is the UK with cod and haddock (for the traditional British dish; fish and chips)
- Fishmeal and oil: the largest buyer is Norway where it is used to feed salmon. Primarily, fishmeal and oil is used as feed for domestic animals and fish feed in aquaculture
- The markets for fresh products are primarily in Western Europe
- Air or ship (cargo ships)- Haddock
4

- Salted cod were retained, primarily in Spain and Portugal
- The dried products: o Dried cod, haddock or
catfish are a popular and healthy snack in Iceland.
o Dried codfishes are also popular dishes in West Africa and Nigeria is one of the largest importers
- Other markets: Asia (Japan, china, Taiwan, South Korea and Hong Kong) and Oceania (Australia and New Zealand)
Japan*** - Japanese sardine - Fresh, processed, frozen, chilled, and live fish
- Consumed in the domestic market and some amount exported
- No information is available- horse mackerel
- Japanese flying squid
- skipjack tuna
- Pacific saury
- red sea bream
Kenya - Nile Perch - Processed in to frozen, chilled, fillet, sun dried and deep fried Nile perch
- Both for local consumption and export purposes ( Israel is the main market in the Middle East)
- Fishing crafts,
refrigerated
trucks, private
small commercial - Dagaa - Sundried Dagaa, deep - Consumed in the domestic market
5

fried/spiced products both for animal feed industry and human consumption
vehicle, public
transport for
small scale
traders, and
airplane
- Nile tilapia - Sundried tilapia - Consumed in the domestic market
- Lobster - Processed in to frozen, chilled etc.
- Both for local consumption and export purposes
Maldives** - Tuna - Fresh or chilled, frozen, frozen loins, dried, salted dried, steak, smoked, canned etc.
- Mainly for export and some consumed in the domestic market
- The main export market of skipjack tuna are Thailand (frozen), Germany and UK (canned), dried or smoked (Sri Lanka)
- The main fresh fish markets for yellowfin tuna are Japan, Europe and America. Other destinations include Thailand, Tunisia, Iran and Sri Lanka. In the domestic market the consumers are mostly local restaurants and hotels
- No information is
available**
Morocco** - Sardines - Headless/gutted/frozen sardine, fresh and canned sardines
- Both for domestic consumption and exported mostly to EU
- No information is available**
- Anchovy - Semi canned anchovy
- Hake ** - Processed hake ( the processed products are not specified)
6

- Whitefish - Frozen whitefish and other
- Octopus - Most of the production is exported as whole frozen/chilled or as beaten and chilled octopus
- Very low local consumption
- Frozen octopus is exported mostly to Japan and Spain
Norway - Cod - Dried salted cod - Domestically dried and salted cod is sold in numerous variants such as whole fillet, different loin products and bits & pieces
- Products exported to Portugal are
whole fillets dried and salted cod
- Raw materials: transported directly to the land-based production plants by the fishing vessels and in some cases by road
- Dried salted cod: is transported by road or container vessels to the respective importing countries
Peru** - Anchovy - Frozen, fishmeal, oil, canned anchovy in oil or tomato sauce
- Most of the canned anchovy is consumed in the local grocery stores and large supermarket chains
- Fish meal and oil exported to China and Europe
- No information is available**
- Shrimp - Fresh, salted, dried, canned, refrigerated or frozen shrimp
- Exported to EU and USA
- Trout - Frozen fillets, frozen trout, fresh chilled trout, canned and
- Both for the local market, and exported to EU,USA and Canada
7

other products- Scallop - Frozen, dried, salted scallop,
live or fresh scallop- Both for the local market and
export to EU and USA
Thailand** - Shrimp - Frozen, dried, bail and frozen,
shrimp paste, canned and preserved (boiled) shrimp
- Both for local market and exported to different countries
- The main exported products include frozen shrimp, preserved (boiled) shrimp, canned tuna and frozen fish
- No information is available**
- Seabass - Fresh chilled and frozen fish, canned, steamed/smoked, fish sauce, salted,fish fillets, fish ball, fermented and dried fish
- Tilapia
- Walking catfish
- Tuna - Mostly canned tunaUganda - Nile perch - Processed in to fillets and by-
products- Fish maws are dried or frozen
and exported to Asia where they are a delicacy in making soup stocks or to Europe for use in filtering beer
- Salted heads, frames and skins of Nile perch is exported to Congo
- Exported to EU, Australia, South East Asia , Middle East and Africa
- Bicycle, own vehicle, hired trucks, public transportation
- Mukene - Processed as a dried product - Consumed in the local market
- Tilapia - Whole and gutted or whole and ungutted fresh tilapia
- Smoked and dried tilapia
- Fresh products consumed in the local market and the smoked and dried tilapia exported to regional markets like Sudan, Congo and Kenya
8

- Catfish - Whole and gutted or whole and ungutted fresh products
- Fresh products consumed in the local market and farmed catfish is smoked or salted for sale within the region
- Bagrus - Whole and gutted or whole and ungutted fresh products
- Consumed in the local market
Vietnam** - Pangasius Catfish - Fresh , frozen fillets - Fresh catfish mostly consumed in the domestic market
- Frozen fillets exported to Europe, US, and Russia
- No information was available**
- Shrimp - Frozen shrimp - Mostly exported to Japan, US, Korea, Taiwan, German, China, Australia, Canada, United Kingdom and Belgium
- Hard clams - Fresh and frozen - Consumed in the domestic market and exported to EU, US, ASEAN, Canada, China and Hong Kong
* Bangladesh: No specific information on the processed products of each species and their respective export markets.** There is no information in the reports.***Japan: No specific information on the processed products of each species and their respective export markets, and there is no information on the means of fish transportation.
9