Embed Size (px)
Citation preview

LUNAR CHEMISTRY Larry Haskin and Paul Warren
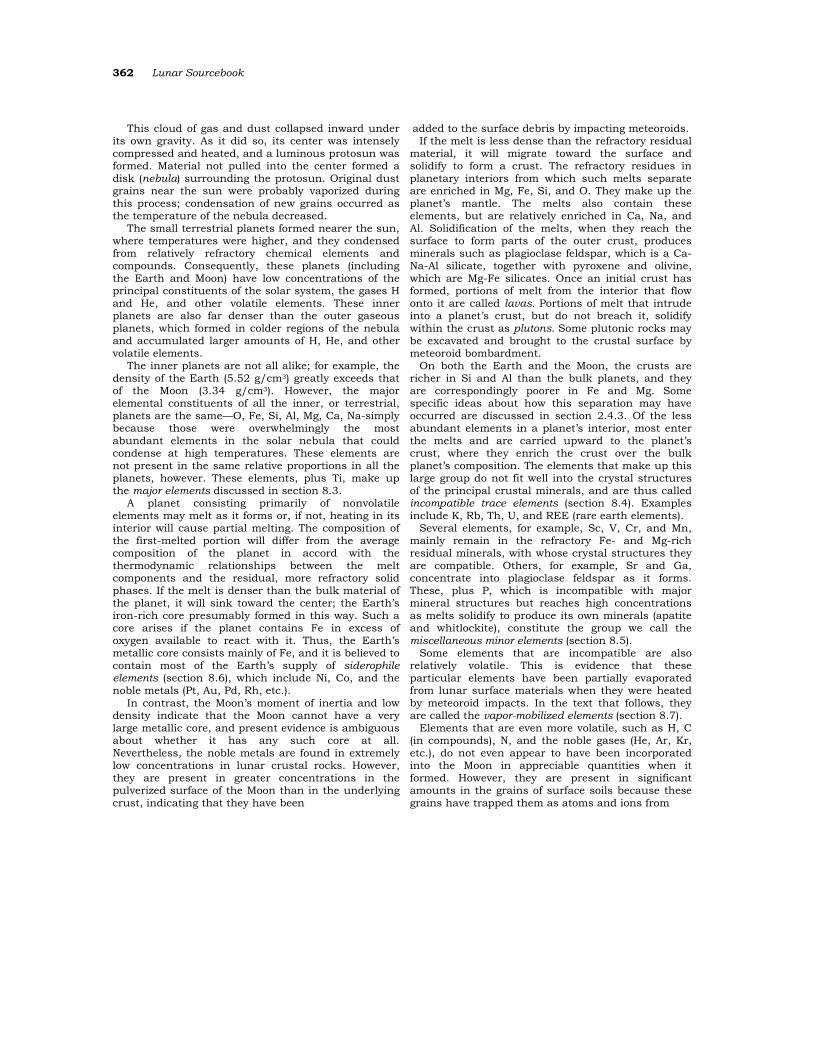
To understand a planet it is essential to determine its chemistry. Our understanding of the Earth, its history, and its evolution has grown steadily with our ability to analyze its rocks. The whole discipline of geochemistry, about a century old, has been devoted to determining the chemistry of terrestrial materials, understanding the way that the different chemical elements behave in geological processes, and using the chemical information to decipher the nature of the processes themselves. The same need for chemical data is equally true for the Moon. Before we could obtain direct chemical measurements, our knowledge of the Moon was limited, and our theories about it were vague and unconstrained.
The Apollo missions provided chemical data in abundance. The returned lunar samples are probably the most intensively analyzed geological materials ever collected, and new analyses are still being made. Sophisticated instruments have made it possible to analyze virtually all the known chemical elements, while the analytical sensitivity has made it possible to obtain results on samples no more than a few milligrams in weight, often without destroying the sample.
As a result, the number of individual major-element, minor-element, trace-element, and isotopic ratios measured on lunar materials is probably in the millions. This information has been determined for the full variety of returned lunar materials—mare volcanic rocks, highland rocks of great variety,
breccias, and soils from all sampling sites. Analyses on new samples continue today, through collection and study of meteorites from the Moon that have been found in Antarctica (section 2.2). Added to this laboratory information are the remote measurements of lunar surface chemistry made from orbit during the Apollo missions (see section 10.2), which allow scientists to extend the data from individual landing sites to wider areas of the Moon.
This immense amount of new chemical information has increased understanding about the Moon to a level from which it is possible to understand the Moon’s place in the solar system and its special relationship to the Earth. With chemical data, scientists can now quantitatively probe major topics that, before the Apollo program, could not have even been subject to more than speculation. What is the origin of the Moon? How is the origin of the Moon related to the origin of the Earth and the solar system? How closely is the Moon related to the Earth? What is the history of the Moon’s crustal regions and what are the processes by which they separated from the bulk Moon? How did the mare lavas form, and when did they erupt? What are the origins of lunar breccias and the lunar soil layers? What was the original chemical composition of the Moon? Was the Moon initially homogeneous? What chemical components have been introduced to the Moon by impacting meteoroids? What chemical species have been carried into the Moon from the
8
358 Lunar Sourcebook
sun in the solar wind? What is the economic potential of the Moon, and how can lunar materials support future human activities in space?
The Moon and the Earth All the chemical elements that make up the Earth
are also found on the Moon. On scales both large and small, however, the abundances and distributions of the elements differ greatly between the two planets. The Moon lacks a large iron core. It has no appreciable atmosphere and therefore does not undergo chemical weathering of the type found on planets with atmospheres. A key difference is that the Moon’s interior and surface have virtually no water or other gases. Without oceans, rivers, and rainfall, and without groundwaters and deep crustal waters, the entire realm of aqueous geochemistry that is so critical on Earth is absent on the Moon.
Most geochemical processes on the Earth, and nearly all those that concentrate chemical elements into ores, require water and therefore have never operated on the Moon. Nevertheless, the evidence from samples of lunar rocks and soils is that the Moon did undergo extensive nonaqueous chemical separations, which produced—among other things—the Moon’s thick outer crust. Many chemical elements were concentrated into portions of that crust, and there may be ores for more elements than we presently realize.
This chapter briefly describes what is known about the concentrations and chemical states of the elements found on the Moon’s surface. Rather than merely listing these states and concentrations, this chapter provides an overview (section 8.2) of how planetary materials attain their varied compositions; this will assist the reader in developing an intuitive feeling for the nature of lunar geochemical processes and a sense for what lunar resources might be available.
Definitions and Conventions The basis for geochemical exploration of the Moon
was provided by over a century of terrestrial geochemical investigations. Some of the definitions and conventions developed for the Earth have been applicable to the Moon; others have not, and new ones had to be developed.
In studying the Earth, geochemists recognized early that different chemical elements behave in different ways in geological processes. These differences in behavior are, in fact, the clues to deciphering the processes themselves. From studies of chondritic meteorites and terrestrial materials, geochemists have grouped the chemical elements
according to their associations with major types of minerals. These groupings are useful because they generally reflect the results of major geochemical processes.
Lithophile (rock-loving) elements are those con-centrated in the silicate rocks of the Earth’s crust, including major elements such as Si, O, Al, Mg, Ca, and Mg, together with lesser elements such as Na, K, Rb, Cs, U, Th, and rare earth elements (REE; La to Lu).
Siderophile (iron-loving) elements are more closely associated with Fe, meteoritic metal, and the Earth’s metallic core, e.g., Ni, Co, and the Pt-group metals.
Chalcophile (copper-loving) elements include Cu and related metals (Zn, As, Sb, etc.) that are usually associated with S in sulfide minerals.
The Moon, even more than the Earth, has not been a closed chemical system since it formed. Both planets receive meteoroid and cometary debris from space, but the Moon lacks Earth’s magnetic field to deflect the ions (section 3.11) that sweep through space. Such particles, coming mostly from the sun as “solar wind,” are a small but important part of the lunar surface. In order to understand the chemical nature and evolution of the Moon, it is necessary to distinguish clearly between chemical components that are indigenous to the Moon and components that have been added later by impacting meteoroids or by the solar wind. Because the basic chemical data come from lunar samples, it is necessary to know the proportions of lunar and exotic chemical components in a given sample. This distinction is not always easy (see sections 6.3 and 6.4). However, two kinds of lunar samples appear to be fundamental samples of the Moon, with no significant additions from the outside. These are mare basalts and certain crystalline highland rocks (sections 6.1 to 6.3). These rocks are called pristine, to indicate that they represent lunar material that has not been contaminated by additions from outside the Moon or by impact mixture with other lunar rock types. Many mare basalts are pristine, but the lunar highlands have been so severely impacted that few highland samples are pristine. Pristine rocks may still be brecciated, but such shattered yet not impact-mixed rocks are called monomict, as distinct from the majority of lunar impact-scrambled samples, which are polymict (see section 6.4).
Meteoroids and meteorites are important to lunar chemistry in two ways. Meteoroids provide the major source of exotic materials to the lunar surface by impact, and they change the chemistry of the resulting breccias and lunar soils. In addition, meteorites (i.e., meteoroids collected on Earth) serve as a chemical standard for discussing the chemistry of both the Moon and the Earth. One group of

Lunar Chemistry 359
meteorites, the chondrites, and especially the CI carbonaceous chondrites, corresponds closely to the composition of the sun (minus H and He) and is therefore used as a first approximation to the material out of which the Moon and the other terrestrial planets formed. Commonly, chemical compositions of lunar and terrestrial materials are normalized to CI compositions to provide a common basis for comparison.
The terms major, minor, and trace are commonly and loosely used to designate approximate or relative amounts of chemical elements in samples or amounts of minerals in rocks. These terms have no firm boundaries, and their use is complicated by the fact that a minor element in one rock may be a trace or even a major element in another. For chemical elements, it will be convenient (although not always accurate) to use the following very rough definitions: major elements >1 wt.%, minor elements >0.1–<1 wt.%, and trace elements <0.1 wt.%. For mineral percentages in rocks, a similar general scale can be used: major minerals >10 vol.%, minor minerals >1–<1 0 vol.%, trace minerals <1 vol.%.
8.1. WHERE TO FIND A PARTICULAR ELEMENT DISCUSSED
8.1.1. Organization of the Data
This chapter divides the chemical elements into six geochemical groups: major elements, incompatible trace elements, minor elements, siderophile elements, vapor-mobilized elements, and solar-wind-implanted elements. These groups are based mainly on the relative abundances of the elements and the nature of the lunar materials in which they occur. In such a grouping, the elements do not correlate in a simple way with their positions in the periodic table, although there is, of course, some relationship. The rationale for the classification according to these six groups is discussed below (section 8.2). The same classification is used in presenting the data on elemental concentrations.
To locate information quickly about a chemical element, find the element in the periodic table (Fig. 8.1). The figure caption indicates the group the element is in and the section of the chapter where it is discussed. Some elements actually fall into more than one group. For example, Co occurs in elemental form in ferrous alloys (a siderophile association), but Co is also concentrated as a divalent ion in the minerals olivine and pyroxene (a lithophile association). Nevertheless, because of its affinity with Fe, information on Co is found in the section on siderophile elements.
This chapter indicates in a broad sense what lunar materials contain what elements in what concentra-tions. To do this, lunar materials are divided into four categories: mare basalts, highland monomict rocks, soils and regolith breccias, and polymict breccias (see Chapter 6). Chemical data are presented graphically, by sample location, to show the range of concen-trations for each element in each of these general categories. The data reflect samples obtained from at least ten locations on the Moon: six Apollo landing sites, three Luna landing sites, and several (unknown) source regions for the Antarctic lunar meteorites (section 2.2).
The appendix to this chapter provides a more detailed statistical summary of elemental concentra-tions in subclasses of various lunar materials. The appendix presents averages, standard deviations, maxima, and minima for those groups of materials for which enough analytical data have been compiled and for which the magnitude of the standard deviations does not exceed about one-third of the mean value. It is important to note that for some elements, which are not routinely analyzed (e.g., Cs, Ga, Mo, In, and Kr), nearly all the available analyses have been compiled to make the tables and graphs for this chapter, but for other elements (including most of the major elements) only a fraction of the many analytical data are used. In addition, most of the available data for relatively rare samples (e.g., soils and fragments from the Luna missions, Antarctic lunar meteorites, and rare rock types such as quartz monzodiorite) have been compiled, but only part of the data for the common Apollo mare basalts, soils, and breccias have been used. For this reason, the number of points for a given landing site shown on a graph does not reflect proportionally the relative amounts of different materials at that landing site or in the overall sample collection.
8.1.2. Types of Lunar Materials Considered
The first category of lunar materials considered is mare basalts. Compositions of mare basalts differ from each other on the size scale of the individual samples allocated for analysis (typically 1 g, or about 0.2–0.4 cm). Compositionally distinct types of mare basalts generally occur at a single landing site (e.g., Apollo 11 low-K and high-K types). Basalt types also differ significantly between landing sites (for details, see sections 6.1 and 6.2).
The second category of materials consists of the igneous rocks that are part of the lunar highland crust. Most of the igneous rocks that formed the early highland crust have undergone extensive shattering or melting from meteoroid impacts. The bulk of the highland rocks near the lunar surface

360 Lunar Sourcebook
Fig. 8.1. Diagrams of the Periodic Table of the Elements, showing the identity and locations of elements discussed in the various sections of this chapter: (a) major elements (section 8.3); (b) incompatible trace elements (section 8.4); (c) miscellaneous minor elements (section 8.5); (d) siderophile elements (section 8.6); (e) vapor-mobilized elements (section 8.7); (f) solar-wind-implanted elements (section 8.8).

Lunar Chemistry 361
have been broken up and mixed into soils and breccias. Relatively few have survived to the extent that we can now identify them unambiguously and determine their original compositions. We call these few surviving specimens highland monomict rocks, indicating that while most or all of them are actually fragments of breccias, we can make the case that they are breccias from a single rock formation or lithology (therefore monomict) as opposed to mixtures of rocks from more than one formation or lithology (polymict). The spread of chemical compositions is greater in highland monomict rocks than in mare basalts. The basalts stem primarily from a single process (mantle melting), which leads to a somewhat limited range of basalt types. In contrast, highland rocks range in character from almost monomineralic to polymineralic rocks, many of which were produced by more complex processes, including processes that operated during the initial formation of the lunar crust and mantle.
The third category is soils and regolith breccias. Lunar soils are the <1-cm fraction of loose debris on the lunar surface (see Chapter 7). This debris is the ultimate in polymict material, being a mixture of pulverized mare rocks, highland rocks, and older soils plus a small proportion of meteoroid material from the various impacting objects that produced this debris. Some soils (e.g., from the Apollo 11 site and from the Apollo 15 site near Hadley Rille) are derived mainly from local mare basalts, but they include small amounts of highland material excavated from beneath the younger lava flows. Other soils (e.g., those from the Apollo 16 site and from Station 2 of the Apollo 17 site) are derived almost exclusively from highland materials (section 7.5.5). Some early soils have been sintered into clods known as regolith breccias (section 7.6). In this chapter, regolith breccias are included with the soils because of their similar origins and compositions. Compositions are given by landing site, usually without detailed discussion of the nature of the soils within a site (see section 7.5.5 for details). Nevertheless, some graphs show the distinctions between soils of mainly mare origin and those of mainly highland origin.
The fourth category, polymict breccias, contains everything not included in the other three categories. Polymict breccias make up the bulk of the highland samples collected. They range in character from materials that are nearly as complex as soils and regolith breccias to materials that deviate only slightly from being monomict. They are not a coherent group in terms of compositional similarity, and they tend to show the same ranges of elemental concentrations that the highland monomict rocks show.
8.1.3. Cautions on Data Use
The statistical data in the appendix are useful for summary purposes, but they should be used with caution. For example, average elemental concentra-tions for breccias are not meaningful for most elements. Exceptions are elements such as O, whose concentrations are nearly the same in all types of lunar material. Similarly, an average composition for highland monomict rocks in general is not meaning-ful, but averages for individual types of highland monomict rocks are. Average compositions for mare basalts are most meaningful if there is one dominant type of basalt at the landing site (e.g., Apollo sites 12, 15, and 17). Averages for soils may be meaningful if all the soils collected at a given landing site are similar in composition (e.g., the Apollo 16 soils, except for those near North Ray Crater), but such averages may be misleading if some of the soils at a landing site are derived mostly from mare material and others mainly from highland material (e.g., Apollo 17 soils). For those elements whose principal source is either meteoroids or the solar wind, concentrations are nearly independent of whether the source of the soil was mainly highlands or mainly mare, and generally depend more on the timespan over which the soil was exposed at the lunar surface.
The significance of averages depends on our knowledge of the extent of chemical heterogeneity at a particular landing site. We know, for example, that the composition of Apollo 16 soils is nearly constant over an area of several square kilometers. The compositions of soils from the U.S.S.R. Luna sites represent material collected by only a single core at each site. Finally, we do not know which source sites are represented by the individual Antarctic lunar meteorites. The reader should remember these cautions when considering the averages given in the tables, and realize that the best use of these tables is in conjunction with the figures that display compositional information for each element.
8.2. OVERVIEW OF PLANETARY SEPARATION PROCESSES
Each planet has a unique chemical character that reflects the chemical and physical conditions in the region of the original solar nebula where the planet formed. It is generally believed that the solar system formed from a mixture of original galactic H, with lesser amounts of other gases and previously-formed solid grains of dust. Astronomical observations indicate that not all star systems have the same composition.
362 Lunar Sourcebook
This cloud of gas and dust collapsed inward under its own gravity. As it did so, its center was intensely compressed and heated, and a luminous protosun was formed. Material not pulled into the center formed a disk (nebula) surrounding the protosun. Original dust grains near the sun were probably vaporized during this process; condensation of new grains occurred as the temperature of the nebula decreased.
The small terrestrial planets formed nearer the sun, where temperatures were higher, and they condensed from relatively refractory chemical elements and compounds. Consequently, these planets (including the Earth and Moon) have low concentrations of the principal constituents of the solar system, the gases H and He, and other volatile elements. These inner planets are also far denser than the outer gaseous planets, which formed in colder regions of the nebula and accumulated larger amounts of H, He, and other volatile elements.
The inner planets are not all alike; for example, the density of the Earth (5.52 g/cm3) greatly exceeds that of the Moon (3.34 g/cm3). However, the major elemental constituents of all the inner, or terrestrial, planets are the same—O, Fe, Si, Al, Mg, Ca, Na-simply because those were overwhelmingly the most abundant elements in the solar nebula that could condense at high temperatures. These elements are not present in the same relative proportions in all the planets, however. These elements, plus Ti, make up the major elements discussed in section 8.3.
A planet consisting primarily of nonvolatile elements may melt as it forms or, if not, heating in its interior will cause partial melting. The composition of the first-melted portion will differ from the average composition of the planet in accord with the thermodynamic relationships between the melt components and the residual, more refractory solid phases. If the melt is denser than the bulk material of the planet, it will sink toward the center; the Earth’s iron-rich core presumably formed in this way. Such a core arises if the planet contains Fe in excess of oxygen available to react with it. Thus, the Earth’s metallic core consists mainly of Fe, and it is believed to contain most of the Earth’s supply of siderophile elements (section 8.6), which include Ni, Co, and the noble metals (Pt, Au, Pd, Rh, etc.).
In contrast, the Moon’s moment of inertia and low density indicate that the Moon cannot have a very large metallic core, and present evidence is ambiguous about whether it has any such core at all. Nevertheless, the noble metals are found in extremely low concentrations in lunar crustal rocks. However, they are present in greater concentrations in the pulverized surface of the Moon than in the underlying crust, indicating that they have been
added to the surface debris by impacting meteoroids. If the melt is less dense than the refractory residual
material, it will migrate toward the surface and solidify to form a crust. The refractory residues in planetary interiors from which such melts separate are enriched in Mg, Fe, Si, and O. They make up the planet’s mantle. The melts also contain these elements, but are relatively enriched in Ca, Na, and Al. Solidification of the melts, when they reach the surface to form parts of the outer crust, produces minerals such as plagioclase feldspar, which is a Ca-Na-Al silicate, together with pyroxene and olivine, which are Mg-Fe silicates. Once an initial crust has formed, portions of melt from the interior that flow onto it are called lavas. Portions of melt that intrude into a planet’s crust, but do not breach it, solidify within the crust as plutons. Some plutonic rocks may be excavated and brought to the crustal surface by meteoroid bombardment.
On both the Earth and the Moon, the crusts are richer in Si and Al than the bulk planets, and they are correspondingly poorer in Fe and Mg. Some specific ideas about how this separation may have occurred are discussed in section 2.4.3. Of the less abundant elements in a planet’s interior, most enter the melts and are carried upward to the planet’s crust, where they enrich the crust over the bulk planet’s composition. The elements that make up this large group do not fit well into the crystal structures of the principal crustal minerals, and are thus called incompatible trace elements (section 8.4). Examples include K, Rb, Th, U, and REE (rare earth elements).
Several elements, for example, Sc, V, Cr, and Mn, mainly remain in the refractory Fe- and Mg-rich residual minerals, with whose crystal structures they are compatible. Others, for example, Sr and Ga, concentrate into plagioclase feldspar as it forms. These, plus P, which is incompatible with major mineral structures but reaches high concentrations as melts solidify to produce its own minerals (apatite and whitlockite), constitute the group we call the miscellaneous minor elements (section 8.5).
Some elements that are incompatible are also relatively volatile. This is evidence that these particular elements have been partially evaporated from lunar surface materials when they were heated by meteoroid impacts. In the text that follows, they are called the vapor-mobilized elements (section 8.7).
Elements that are even more volatile, such as H, C (in compounds), N, and the noble gases (He, Ar, Kr, etc.), do not even appear to have been incorporated into the Moon in appreciable quantities when it formed. However, they are present in significant amounts in the grains of surface soils because these grains have trapped them as atoms and ions from

Lunar Chemistry 363
the solar wind. These are the solar-wind-implanted elements (section 8.8).
8.3. MAJOR ELEMENTS
8.3.1. Concentrations of Major Elements in the Moon
It may seem incongruous for a planet that has no atmosphere, but O is overwhelmingly the most abundant element in lunar surface materials. More than 60% of the atoms are O, but all of them are tightly bound chemically to other elements. The second most abundant element is Si, which contrib-utes another 16–17% of the atoms. Aluminum is third most abundant, contributing about 10% of the atoms in the highlands, but only about 4.5% of those in the thin layers of mare basalts that cover 20% of the Moon’s nearside. Calcium and Mg are about equally abundant, each contributing some 5% of the atoms; Ca is less abundant in the maria (about 4.5%). Iron contributes approximately 2.5% of the atoms in the highlands but 6% of those in the maria. Titanium and Na atoms make up the remaining percent or so.
We call these elements that make up the bulk of common lunar materials the major elements. Conver-sion of their abundances in lunar surface materials from an atom-percent to a weight-percent basis changes their order of abundance somewhat. Oxygen is still the most abundant major element, at about 45% (by weight). Silicon is still second, at 21%. Aluminum is third at about 13% for the highlands, although only about 5% for the maria. Calcium is next, at about 10% for the highlands and 8% for the maria. Iron contributes about 6% to the highlands, but 15% to the maria. Magnesium comes next at 5.5% for both types of material. Titanium and Na each contribute a fraction of a percent in the highlands, but the average Ti concentration exceeds 1% and may be as high as ~5% in the maria.
Traditionally, concentrations of major elements are not reported as elemental percentages. Instead, their chemical combination with O is acknowledged and the available O is partitioned among them as if each were present as a simple oxide. We follow this practice in Fig. 8.2, where the concentrations of each major element are plotted for lunar materials from each sampling site, and in Table A8.1, where some averages and extents of variation are given. Concentrations are shown on a logarithmic ordinate in Fig. 8.2; thus, a factor of 2 difference in concentrations between two materials covers the same linear vertical distance independently of the concentration level. Concentrations for all major elements are plotted on the same scale, so that the concentration range for each element can be readily
compared with those for the other elements. (The order of relative abundances by weight of the oxides for the materials considered here is the same as that of the elements themselves.) We include concentra-tions for O as a “stand-alone” element in Fig. 8.2 and Table A8.1, in contrast to our treatment of the other major elements. Oxygen concentrations are nearly constant at about 45% (by weight) in all common lunar materials.
8.3.2. Minerals and Rocks Formed by Major Elements
Although all major-element cations are in some manner combined chemically with O, they are not present as simple oxides, as might be inferred from the type of compositional information given here. Rather, most major elements are in cation sites of compositionally complex silicate or oxide minerals (Chapter 5) or in glasses that have been produced by impact melting of rocks containing those minerals. Most of these minerals are actually solid solutions of simpler silicate endmember compounds.
The relationships among major-element concen-trations in most lunar materials can be generally understood in terms of the minerals that make up lunar rocks. Both highland and mare rocks contain plagioclase feldspar, which is a solid solution consisting mainly of two components. Anorthite (CaAl2Si2O8) is dominant, while albite (NaAlSi3O8) constitutes only a few percent. Plagioclase is the carrier of nearly all the Al in the lunar crust. The proportion of plagioclase in the highlands is greater than that in the maria, consistent with the higher concentrations of Al detected by orbital remote sensing in the highlands and observed in the analyses of highland samples. That higher proportion of plagioclase, which is white in color, also helps explain the lighter color of the highlands, in contrast to the darker maria.
The most abundant dark mineral at the lunar surface is pyroxene, which occurs in two general varieties—high-Ca and low-Ca. The high-Ca variety consists of solid solutions of Ca2Si2O6, Mg2Si2O6, and Fe2Si2O6. From a mineralogical point of view, high-Ca pyroxene consists mostly of solid solutions of the chemical components diopside (CaMgSi2O6) and hedenbergite (CaFeSi2O6). In the low-Ca pyroxene, the solid solution is primarily between enstatite (Mg2Si2O6) and ferrosilite (Fe2Si2O6) (see Fig. 5.3). Another dark mineral found in lunar rocks is olivine, which consists of solid solutions of forsterite (Mg2SiO4) and fayalite (Fe2SiO4). Titanium mainly forms ilmenite (FeTiO3) and related minerals.
The highlands consist principally of plagioclase-rich rocks such as anorthosite (>90% plagioclase), norite (roughly equal proportions of plagioclase and

364 Lunar Sourcebook

Lunar Chemistry 365
Fig. 8.2. Concentration ranges of major elements in various lunar materials: mare basalts (MBAS), highland monomict rocks (HMCT), soils and regolith breccias (S&RB), and polymict breccias (BX). Horizontal axis shows sample types, separated according to individual missions. Vertical axis shows concentrations in weight percent. (a) Graphical key to the plots and abbreviations. Data are presented for: (b) O; (c) Na2O; (d) MgO; (e) Al2O3; (f) SiO2; (g) CaO; (h) TiO2; (i) total Fe as FeO. Statistical data for these plots are summarized in Table A8.1.
low-Ca pyroxene), and troctolite (plagioclase and lesser amounts of olivine). Some investigators regard anorthosite as the principal rock type of the early highland crust. Others suggest that a plagioclase-enriched norite (leuconorite, mainly plagioclase feldspar plus low-Ca pyroxene) was the principal rock type; its composition more closely matches that of the present average highland surface. A few samples of dunite, a rock type that consists almost
entirely of olivine, are present in highland breccias. Minor amounts of gabbro (mainly plagioclase feldspar and high-Ca pyroxene) and granite (which contains K-feldspar) are also present. Many highland rocks and soils contain ilmenite and related Ti-rich oxides, but usually in minor quantities.
Our present knowledge of the composition of the lunar highland surface is restricted by the limited amount and quality of remote-sensing data. Data
366 Lunar Sourcebook
from remote sensing (e.g., the Apollo 15 and 16 orbital gamma-ray and X-ray data, and Earth-based infrared spectra, discussed in section 10.2) are for surface materials, mainly regolith. It is difficult to relate the types of bedrock in remotely sensed areas to the “ground truth” provided by the Apollo and Luna sample collections. To make this connection, it is necessary to interpret the chemical compositions of polymict highland soils in terms of their parental rock types.
Several types of igneous highland rocks have been identified and characterized. These are the highland monomict rocks. However, it has not been possible to explain the compositions of the polymict breccias and soils by simply mixing together these highland monomict rocks. One difficulty is that we have not yet identified all the highland rock types on the Moon. The bulk of the material sampled in the highlands is polymict; monomict highland samples are rare. One indication that other rock types must be present is that the Mg value [the molar ratio of MgO to (MgO + FeO)] of the highland soils ranges from about 0.67 to 0.71. Most of the monomict highland rocks, especially the norites and troctolites, contain pyroxene and olivine with higher Mg values, 0.75–0.85. The more common ferroan anorthosites (section 6.3.3) have suitably low Mg values, but their total concentrations of MgO and FeO are too low to balance the contribution from norites and troctolites.
Similar polymict materials make up the bulk of the Apollo and Luna collections and the Antarctic lunar meteorites as well. Our failure to account for the compositions of polymict soils and breccias in terms of the primary lunar rock types we have identified so far is a good reminder of how limited our understanding of lunar rocks still is.
In contrast to the lunar highland rocks, the mare basalts have lower proportions of plagioclase and higher proportions of pyroxene, and their pyroxene is mainly the high-Ca type. Many mare basalts also contain olivine. The pyroxenes and olivines in the mare basalts are more ferroan than in the highland rocks (i.e., the pyroxenes and olivines have lower Mg values). This situation explains the high Fe concentrations of mare basalts and of the soils derived from them. Mare basalts contain ilmenite and related Fe,Ti-oxide minerals in proportions that vary from low (about 1 % oxide minerals) to surprisingly high (>20% oxide minerals; see listing of “opaque” oxide minerals in Table 6.1). The Fe,Ti-oxide minerals also contribute to the high Fe concentrations of mare basalts. Mare soils collected so far contain at least a few percent of highland material, presumably excavated by meteoroid impact from beneath the relatively thin lava flows unless mountainous highlands are nearby to shed debris over the lavas.
8.3.3. Abundances and Correlations Among Major Elements
Abundances (Fig. 8.2). Much of the chemical data in Fig. 8.2 can be understood in terms of the principal minerals that make up the samples and the known compositional differences between highland and mare rocks. In the case of TiO2, the Apollo 11 and 17 high-Ti mare basalts stand out relative to lower-Ti basalts and from most other lunar materials analyzed. The contribution of the Apollo 11 high-Ti basalts is strongly reflected in the high TiO2 concentrations of all of the Apollo 11 soils. In contrast, some Apollo 17 soils have relatively low concentrations of TiO2 because they are composed mainly of low-Ti highland material. The highest TiO2 concentrations are in soils consisting of (or containing high proportions of) orange glass spherules. These spherules are essentially mare volcanic ash (pyroclastic deposits; see section 6.1.7), but they are included with the soils because of their physical form. The lowest concentrations of TiO2 are in the highland monomict rocks, particularly in the anor-thosites and dunites.
Iron-oxide concentrations are highest in the mare basalts. In polymict breccias and soils, FeO concen-trations vary depending on the relative proportions of mare basalt and mafic highland materials. Concentrations of FeO in feldspathic highland rocks are also low to very low. Concentrations of MgO are greater in some highland rocks (especially the dunites and spinel troctolites) than in most mare basalts. The mare basalts from the Apollo 12 site stand out, probably because they formed under circumstances that enriched some of them in Fe- and Mg-rich olivine. Plagioclase-rich highland rocks and the Apollo 16 soils have low MgO concentrations.
Concentrations of Al2O3 are highest in the anor-thositic rocks of the highlands. They are lowest in the dunites and are intermediate in the mare basalts. Calcium-oxide concentrations for all lunar rocks fall within a relatively narrow range. The greatest CaO variation is among the highland monomict rocks; dunites and spinel troctolites have the lowest concentrations. Sodium concentrations are low in all lunar materials, but they cover a substantial range in mare basalts. Some of that range may reflect the presence of variable amounts of Na-rich, late-stage melt (mesostasis; see section 8.4) within the individual small samples analyzed. This Na-rich material is heterogeneously distributed on a centimeter-distance scale in some basalt specimens.
Correlations between Al2O3-FeO and Al2O3-(FeO + MgO) (Figs. 8.3a,b). The contrasts between highland and mare compositions, as well as

Lunar Chemistry 367
Fig. 8.3. Correlation plots of different major-element concentrations (in wt.% oxide) in lunar materials, showing the effects of different mineral proportions on major-element compositions. (a) Plot of Al2O3 vs. total Fe as FeO. These two elements show a strong negative correlation. In lunar highland materials (for which FeO < 10%), the Al2O3 concentration decreases as the proportion of Al-bearing plagioclase feldspar decreases and the proportions of Fe-bearing olivine and pyroxene increase. (b) Plot of Al2O3 vs. (MgO plus total Fe as FeO) for both highland and mare materials. The slope of the line is steeper for mare (<15% Al2O3) than for highland materials because of the presence of high-Ca pyroxene in the mare materials, and the higher ratio of Ca-Fe-Mg pyroxene to plagioclase than in the highland rocks. (c) Plot of CaO vs. total Fe as FeO for both highland and mare materials. The highland materials (FeO < 10%) have a steep slope because of their high proportion of plagioclase to mafic minerals. The mare materials (FeO > 10%) show no decrease in CaO, because in mare materials both pyroxene and plagioclase contain significant Ca, and changes in their relative proportions do not affect the CaO value greatly. (d) Plot of Al2O3 vs. CaO for both highland and mare materials. The strong positive correlation in highland rocks (CaO > 12%) is due to the presence of both elements in the mineral plagioclase. The effect is not seen in mare materials (CaO < 12%) because Ca is present in both plagioclase and pyroxene.

368 Lunar Sourcebook
the effects of the variable amounts of different minerals in the samples, become clearer if we examine correlations and anticorrelations among the major elements. For example, there is a well-developed anticorrelation between FeO and Al2O3 (Fig. 8.3a). The principal mineral components of most lunar rocks are plagioclase and mafic minerals (pyroxene and olivine). The higher the proportion of plagioclase, the higher the Al2O3 concentration is. Rocks with higher proportions of plagioclase necessarily contain lower proportions of mafic minerals, which makes their FeO concentrations lower. Thus, to a first approximation, this anticorrelation simply reflects the varying proportions of plagioclase and mafic minerals.
However, a variety of materials plot on the low-Al2O3 side of this trend. These include the magnesian troctolites (diamond-shaped symbols at about 4–5% FeO), magnesian norites (diamonds at about 7–9% FeO), magnesian dunites (diamonds at about 12% FeO), and granitic materials from sample 12013 (inverted triangles at about 9–12% FeO). Furthermore, there is a break in slope at about 8–10% FeO. This break arises because most materials with concentrations of FeO greater than 10% are either mare basalts or soils containing a substantial proportion of mare basalt. Most materials containing <8% FeO are mainly of highland origin. The mare basalts are more ferroan and also richer in ilmenite than most highland materials. If we use the sum of FeO and MgO as the abscissa (Fig. 8.3b), then the slope of the trend to the right of about 12% (FeO + MgO) becomes more steeply negative than when FeO alone is used. This reflects the mineralogic properties of the mare basalts, e.g., the presence of high-Ca rather than low-Ca pyroxene despite the higher proportion of Mg,Fe-silicate minerals and ilmenite to plagioclase as compared to highland materials.
Correlations between CaO-FeO and Al2O3-CaO (Figs. 8.3c,d). The negative slope for mainly highland materials (<8% FeO) in Fig. 8.3c reflects the higher relative proportion of plagioclase to mafic minerals, as described above. As in the case of Al2O3, the CaO values for magnesian highland monomict rocks (diamonds) also fall below the main trend, as do the values for some granitic materials from sample 12013. Highland alkali gabbronorites (diamonds at about 17% FeO) fall to the high-CaO side of the mare basalts. For mare basalts and mare-rich soils, the CaO concentrations are essentially independent of FeO concentrations. This is because the pyroxenes in the mare basalts are the high-Ca variety; their presence dilutes the Al2O3 contribution from the feldspars but also provides compensating amounts of Ca to keep the CaO content constant.
The same effect can also be seen in Fig. 8.3d, where the mare materials plot in a broad cluster at ~10% CaO and ~10% Al2O3.
Correlations between Na2O-FeO, Na2O-CaO, and Al2O3-Na2O (Figs. 8.4a–c). Sodium, which occurs in the plagioclase end member albite, might be expected to show a negative correlation with FeO, as do Al2O3 and CaO. Actually, only a weak correlation is evident in the mare basalts, and no correlation at all appears in the highland materials with <8% FeO (Fig. 8.4a). In highland samples, or in samples rich in highland components, Na2O concentrations span a substantial range and are independent of FeO concentrations. Concentrations of Na2O are highest (up to about 1%) in granitic materials, e.g., the quartz monzodiorite from sample 15405 (diamond at about 12% FeO) and granitic breccia fragments from sample 12013 (inverted triangles at about 9–12% FeO), which lie well above the main group of Na2O concentrations. Nor is there any correlation between Na2O and CaO (Fig. 8.4b) or between Na2O and Al2O3 (Fig. 8.4c), as might be expected if plagioclase were the main carrier of both elements. A plausible explanation of this lack of correlation is that varieties of plagioclase richer in Na than those in most of the highland monomict rocks may be more important in the lunar highlands than we currently realize. These data also indicate that some granitic material is also present in highland breccias and soils. Sodium enrichment can also occur in the maria. Some clasts of relatively alkali-rich Apollo 14 mare basalts have Na2O values well above the main trend for most mare basalts. The highland dunites, which consist almost entirely of olivine, have the lowest Na concentrations.
Correlations between SiO2-FeO (Fig. 8.4d). There is a slight positive correlation between FeO and SiO2 for most highland materials (Fig. 8.4d). This probably occurs because most pyroxenes have more SiO2 (56% to 44%) than anorthite (43%). Therefore, as the proportion of pyroxene increases, the concentrations of FeO and SiO2 increase together. Silicon-dioxide concentrations are highest in granitic materials, such as quartz monzodiorite and the felsite fragments from sample 12013 (see section 6.3.5), and the SiO2-FeO data for the highland magnesian norites show Si concentrations that lie above the main trend of the data (diamonds at 8–12% FeO). This relation reflects the larger amount of Mg-bearing enstatite component (which is also higher in Si than the Fe-bearing ferrosilite component) in the pyroxenes in these rocks.
On the same plot, the mare basalts divide into high-Ti and low-Ti groups. The low-Ti group has higher SiO2 than does the high-Ti group; in the latter group, SiO2 concentrations are diluted by the greater

Lunar Chemistry 369
Fig. 8.4. Correlation plots of different major-element concentrations (in wt.% oxide) in lunar materials, showing effects (or lack of effects) of mineral proportions on the chemical composition. (a) Plot of Na2O vs. total Fe as FeO. Unlike CaO (Fig. 8.3c), Na2O concentrations do not vary with changes in relative proportions of major minerals in highland materials (FeO < 10%), indicating that plagioclase feldspar is not the only carrier of Na2O in these materials. (b) Plot of Na2O vs. CaO; (c) Plot of Al2O3 vs. Na2O. For the same reasons, no simple correlation is present in either of these plots. (d) Plot of SiO2 vs. total Fe as FeO. For highland materials (FeO < 10%), SiO2 concentrations increase slightly with increasing FeO because the SiO2 concentration in low-Ca pyroxene, which becomes a significant component in higher-Fe highland materials, is slightly higher than in plagioclase, which becomes less abundant as the Fe content increases. However, for mare basalts (FeO > 10%), SiO2 decreases with increasing Fe because the pyroxene in such rocks is the high-Ca variety, which has a lower SiO2 concentration than the low-Ca pyroxene present in highland materials. The two trends visible in the mare basalt region correspond to high-Ti basalts (lower SiO2 data) and low-Ti basalts.
amounts of ilmenite (FeTiO3) present. Correlations between MgO-FeO and Mg'-Fe0
(Figs. 8.5a,b). For highland materials with FeO <8% there is a rough correlation between MgO and FeO (Fig. 8.5a) that reflects the varying proportions of mafic minerals (which carry both the Mg and Fe) to plagioclase. The highland troctolites (diamonds at
2% < FeO < 6%, plus one at 9% FeO) display a separate trend because they contain mafic minerals (chiefly olivine) that are more magnesian than those of the polymict soils and breccias. The MgO concentrations are highest in the dunites, which consist almost entirely of magnesian olivine. Another rock type, highland spinel troctolite (diamond at

370 Lunar Sourcebook
about 16% FeO), lies well above the main trend. Between about 9% FeO and the cluster of points for mare basalts, the polymict breccias and soils show a slightly decreasing ratio of Mg to Fe, as the proportion of Fe-rich mare basalts increases.
Among the mare basalts themselves, there is a considerable spread caused by wide variations in the amount of ilmenite. A high proportion of ilmenite produces a high FeO/MgO ratio (equivalent to the low MgO/FeO ratio shown). A low proportion of ilmenite is equivalent to a higher proportion of mafic silicate minerals, which have higher MgO/FeO ratios, and this set of points therefore has a positive slope.
Some of these features can also be seen in a plot of Mg´, the molar proportion of MgO to that of (MgO + FeO) (Fig. 8.5b). The lowest values of Mg´ are for anorthosite 15415; these fall below most values for anorthosites. The highest values of Mg´ are found in the magnesian troctolites and in the two dunites. Data points for the quartz monzodiorite (diamond at about 12% FeO) and for two alkali gabbros (a diamond and an inverted triangle at 10% FeO) fall well below the trend. The values of Mg´ cover a wide range for highland materials (<8% FeO), then decrease for samples representing mixtures of highland and mare materials to the generally lower values for the mare basalts.
Fig. 8.5. Correlation plots of different major-element concentrations (molar or wt.% oxide) in lunar materials, showing effects of mineral proportions on the chemical composition. (a) Plot of MgO vs. total Fe as FeO. MgO concentrations reflect the relative proportions of plagioclase vs. Fe- and Mg-bearing mafic minerals. Data points for some unusual highland rock types, the dunites and troctolites (see section 6.3.4), lie well above the main trend of the data. The spread of FeO concentrations in mare materials (FeO > 10%) within a limited range of MgO concentrations reflects variations in the proportion of ilmenite as well as plagioclase and pyroxene. (b) Plot of the molar ratio of [MgO/(MgO + FeO)] vs. total Fe as FeO. The higher values for highland data points (FeO < 10%) indicate that the proportion of Mg in cation sites in highland minerals is higher than in the same minerals from mare basalts (FeO >10%). (c) Plot of TiO2 vs. total Fe as FeO. For highland materials (FeO < 10%), there is only a gradual increase in TiO2 concentrations with FeO, because the proportion of ilmenite and related Ti-bearing minerals that are associated with mafic minerals in highland rocks is small. For mare basalt materials (FeO >10%), there is a steep, well-defined increase with FeO for the high-Ti basalts and a lower cluster for the low-Ti and very-low-Ti basalts.

Lunar Chemistry 371
Correlations between TiO2-FeO (Fig. 8.5c). Concentrations of TiO2 increase slightly with FeO in highland materials, then increase significantly for polymict materials containing appreciable propor-tions of mare basalt with high TiO2 content. The distinctions between high-Ti and low-Ti mare basalt are clearly displayed in this diagram.
8.3.4. Ores of Major Elements The lunar minerals that contain the major elements
are generally not the same minerals that would be used on Earth as economical sources for those elements. For example, Al is generally extracted from bauxite on Earth, whereas the likeliest source of Al on the Moon would be plagioclase. The common lunar rocks and minerals are therefore unlikely ores in a terrestrial sense. However, the general definition of ore is any material whose use is economical. If resources are to be sought from the Moon, then these rocks and minerals are the chemical forms that we can expect to serve as lunar ores. A more detailed description of some possible lunar major-element ores is provided in section A11.2; some more general considerations are discussed below.
The minerals in lunar rocks are generally tightly intergrown and are difficult to separate from each other. Nevertheless, minerals are the primary entities that can be separated and concentrated by strictly mechanical means, i.e., with no chemical processing, to provide material enriched in a particular chemical element. For some purposes, some of the necessary processing has already been done by nature. There is a great abundance of pulverized rock, the lunar regolith, that forms a surface layer several meters deep. in the regolith, some grains of all lunar minerals occur as single fragments, not interlocked with crystals of other minerals as in the original rocks. Unfortunately, most of the regolith is made up not of such grains but of small rock fragments and glassy agglutinates. Single-mineral grains make up only a small fraction of most lunar soils, so that mineral separations from large volumes of soil would be needed to provide significant quantities of individual minerals.
Any further concentration beyond mechanical mineral separation requires chemical destruction of the mineral or glass containing the element by some process such as dissolution, melting, or evaporation. Such destruction does not necessarily require prior separation of a mineral concentrate, but without some mechanical concentration, the chemical processing will have to be done on a larger quantity of starting material. For this reason, any schemes to
obtain a particular element from a lunar mineral should take into account the methods and economics of mechanically extracting that mineral from bulk rock or soil.
It is almost certain that the bulk raw material for any lunar resource will be a complicated mixture of rocks, minerals, or glasses. Such polymict materials make up most of the Apollo and Luna sample collections and the Antarctic lunar meteorites. Future lunar explorers will surely encounter similar polymict materials at the surface over the whole Moon. In addition to the complex soils, most rocks found at the surface in the lunar highlands will be polymict breccias. Few regions consisting of nearly monomineralic highland igneous rocks such as anorthosite or dunite have been discovered so far by Earth-based spectroscopic mapping of the Moon (section 10.2). Most regions of the highlands for which we have orbital gamma-ray data indicate the presence of significant concentrations of Th and Fe. Some investigators interpret these results as indicating the presence of anorthosite “contaminated” by small proportions of KREEP (see section 8.4). Others who have chemically analyzed polymict lunar samples in the laboratory interpret some data as indicating the presence of plutonic igneous rocks that contain significant amounts of mafic minerals in addition to plagioclase. In this interpretation the compositions may represent igneous precursors (plagioclase-enriched norites or gabbros) that were mixtures of mafic minerals and plagioclase, or they may represent mechanical mixtures of anorthosite with dunite or other igneous rocks rich in mafic minerals. There may be substantial bodies of anorthosite and dunite buried at shallow depths beneath the surface soils seen by remote sensing, but we have no independent evidence for their presence.
A special feature of the Moon is the ubiquitous occurrence of Fe metal as a trace mineral in lunar samples. On Earth, nearly all lavas and intrusive igneous rocks have part of their Fe in the divalent (2+) oxidation state, but at least a few percent is in the trivalent (3+) state. Furthermore, Fe oxidizes readily at the Earth’s surface. In contrast, lunar igneous rocks have no measurable trivalent Fe, but they commonly contain small amounts of Fe metal, a result of the much more chemically reducing conditions on the Moon than on the Earth. The lunar surface, as well as the lunar interior, is a highly reducing environment. Meteoroids that have struck the lunar surface have introduced small amounts (a fraction of a percent in most soils) of metallic Fe-Ni alloy into the surface soils, and have liberated similar metals from lunar soils by reduction of FeO (see section 5.4.3). These alloys could be concentrated by simple magnetic methods. However, much

372 Lunar Sourcebook
of the metal is incorporated into glassy agglutinates and microbreccia fragments, so a clean separate of pure metal cannot be easily obtained.
8.4. INCOMPATIBLE TRACE ELEMENTS A large group of chemical elements does not fit
readily into crystal sites of major minerals. Because of this behavior, they are called incompatible trace elements. Being unable to enter the crystal lattices of common minerals in large amounts, they tend to enter the liquid phase preferentially when rocks and minerals begin to melt, and they tend to remain in the liquid phase when it begins to crystallize. If they become sufficiently concentrated in a liquid after extensive crystallization has taken place, some of these elements form minerals of their own. For example, the mineral zircon (ZrSiO4) forms if the concentration of Zr becomes high enough. Such trace minerals, as well as trace-to-minor minerals such as whitlockite [Ca3(PO4)2], which may form if the concentration of P becomes high enough, serve as hosts for many incompatible trace elements such as Hf, Y, and the REE (see Tables A5.11a and A5.18).
The behavior of the REE in a cooling basaltic lava provides a good demonstration of the processes affecting incompatible elements. The REE (except Eu) are typical incompatible trace elements. The major basaltic minerals plagioclase and pyroxene are considered to “exclude” REE; actually, those minerals will accept them, but they do not compete effectively for the REE because their crystal sites are energet-ically less favorable for REE ions than are the sites in the coexisting silicate liquid. The REE are thus said to be “incompatible” with respect to the mineral phases forming from the melt, and they tend to stay in the melt as crystallization proceeds. As the last portions of remaining melt crystallize, the bulk of the REE may enter late-forming phosphate minerals such as apatite or whitlockite, in which they are compatible minor elements, or they may form trace amounts of a rare earth mineral such as monazite [(REE,Y,Th)(PO4)], which is extremely rare on the Moon but in which the REE are essential components. Late-forming materials rich in incompatible elements thus develop in trace quantities in the interstices between earlier-formed crystals of major minerals, forming a complex mixture of fine-grained minerals and glass collectively known as mesostasis.
Figure 8.6 shows the abundances of the REE in the major minerals and in the mesostasis of a lunar basalt, sample 70135 (Haskin and Korotev, 1977), illustrating how the REE distribute, or partition, themselves among solid and liquid phases. The highest REE concentrations are in the final liquid or
mesostasis, for which the ratios of concentration to those of the whole rock are greater than 1. Ratios of elemental concentrations in the major minerals to those of the whole rock are almost all less than 1, with ilmenite and pyroxene preferentially including the heavier and smaller REE (Tb-Lu) over the lighter REE, and with plagioclase favoring the lighter REE (especially Eu). Partitioning such as this, which occurs both wholesale during planetary differentiation and on smaller scales of local melting or crystallization, is responsible for the variable distributions among all the incompatible trace elements.
8.4.1. Abundances of Incompatible Trace Elements in Lunar Crustal Materials
The incompatible trace elements form a large group that includes many reactive, cation-forming elements whose cosmic relative abundances are low. When planets form, the concentrations of these elements in the planets are too low to produce major minerals. During the early chemical differentiation of the Moon, these incompatible trace elements partially separated as a group from the other chemical elements. They became particularly concentrated in early silicate melts of noritic or gabbroic composition called KREEP (discussed below and in sections 2.4 and 6.3.2). Even though this concentration mechanism has enriched the incompatible trace elements in some lunar surface materials to levels three orders of magnititude above their abundances in meteorites or in the bulk Moon, they remain trace elements (i.e., <0.1 wt.%) in virtually all known types of lunar rocks.
Figure 8.7 shows concentrations of most of the incompatible trace elements in a variety of lunar materials. Table A8.2 provides some statistics of their concentrations in these materials. Many of these elements have been studied extensively by geochemists, because they indicate the types of igneous processes that formed lunar (or terrestrial) rocks and to what extent those processes operated. For example, the concentrations of these elements and their abundances relative to each other can be used to infer the compositions of the source regions that produced the silicate melts now present as igneous rocks of the lunar crust.
For many incompatible trace elements, analytical data from lunar materials are abundant (e.g., K, Rb, and La; Figs. 8.7e,f,m). For others, relatively few analyses are available; such elements are determined infrequently by geochemists, usually because accurate analyses for them are difficult or time consuming. Examples of elements for which relatively few data are available are Pr, Ho, and Tm. Concentrations

Lunar Chemistry 373
Fig. 8.6. Concentrations of REE in mare basalt sample 70135, showing partitioning of the REE between different minerals and the late-crystallizing mesostasis relative to the bulk mare basalt melt. Horizontal axis shows REE in order of increasing atomic number. Vertical axis shows value of the partition coefficient or the ratio of the concentration in the mineral to the concentration in the bulk melt (mare basalt). Data are presented for several minerals: plagioclase (plag), olivine and low-Ca orthopyroxene (ol-opx), ilmenite (ilm), high-Ca pyroxene (cpx), and mesostasis (mesost). Values of the distribution coefficient differ widely between different minerals, indicating that such partitioning is an important separation mechanism for incompatible trace elements. During crystallization of the initially liquid lava, the minerals grew and their composition evolved as the extent of crystallization increased (Haskin and Korotev, 1977). In partitioning between the minerals and the chemically evolving melt, all REE except Eu tend to remain with the melt (coefficients <1), which is a distinguishing characteristic of all incompatible trace elements. Only a small fraction of each available REE enters the major minerals. The fraction entering plagioclase has a higher proportion of lighter REE than of heavier REE, while the fractions entering Fe- and Mg-rich minerals (olivine, pyroxene) have higher proportions of heavier REE. The mesostasis consists of several minerals and glass that formed from the highly-evolved, last several percent of the original liquid to crystallize on cooling. It has higher REE concentrations than the other minerals, and its negative Eu anomaly shows the effect of the compatibility of Eu with plagioclase (positive Eu anomaly), which has depleted the melt in Eu as plagioclase crystallized.

374 Lunar Sourcebook
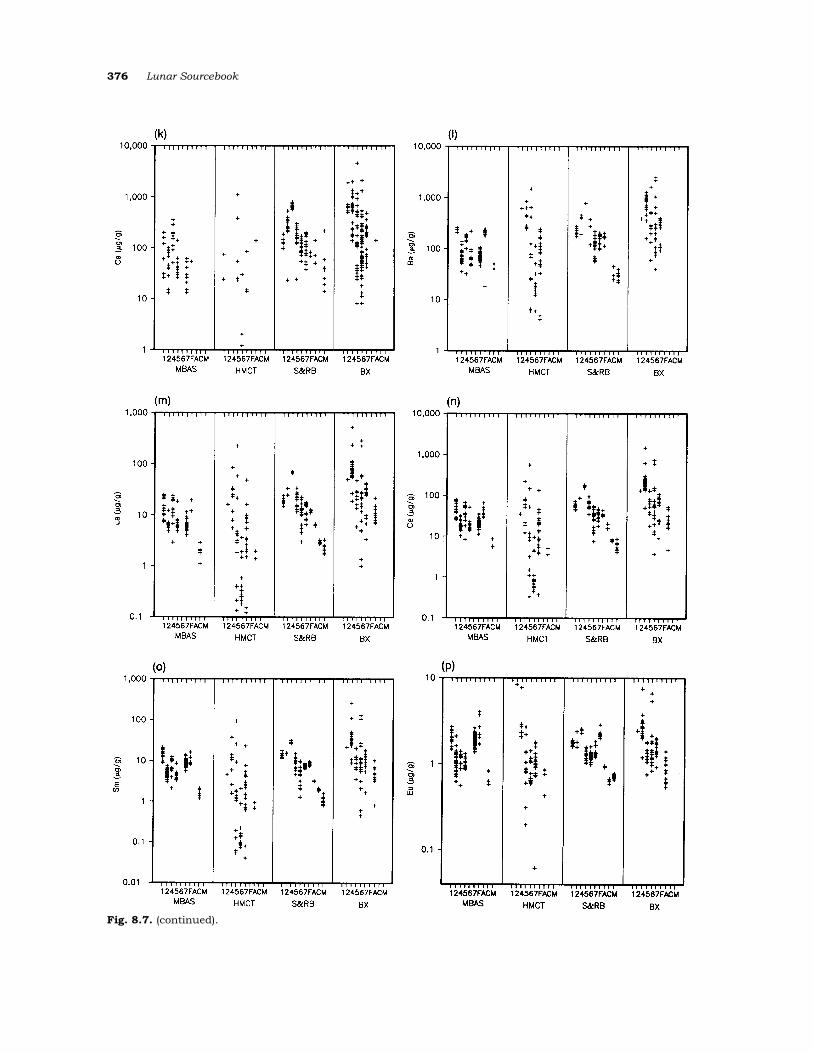
Fig. 8.7. Concentration ranges of incompatible trace elements in various lunar materials: mare basalts (MBAS), highland monomict rocks (HMCT), soils and regolith breccias (S&RB), and polymict breccias (BX). Horizontal axis shows sample types, separated according to individual missions. Vertical axis shows elemental concentrations (in µg/g). (a) Graphical key to the plots and abbreviations. Data are presented for: (b) lithium, Li; (c) beryllium, Be; (d) boron, B; (e) potassium, K; (f) rubidium, Rb; (g) yttrium, Y; (h) zirconium, Zr; (i) niobium, Nb; (j) tin, Sn; (k) cesium, Cs; (l) barium, Ba; (m) lanthanum, La; (n) cerium, Ce; (o) samarium, Sm; (p) europium, Eu; (q) ytterbium, Yb; (r) hafnium, Hf; (s) tantalum, Ta; (t) thorium, Th; (u) uranium, U. Most measurements were made by either mass spectrometry with isotope dilution or by neutron activation analysis. Statistical data for most of these plots are given in Table A8.2. The data shown here are a relatively small sampling of the total available for this widely studied element group. They include most of the analyses of Wänke and coworkers, who provided reliable data for a large number of elements in each sample analyzed. Such multiple data from a single sample are important in deciphering the correlations in behavior among different elements. The data also include measurements by other investigators.

Lunar Chemistry 375
Fig. 8.7. (continued).
376 Lunar Sourcebook
Fig. 8.7. (continued).

Lunar Chemistry 377
Fig. 8.7. (continued).

378 Lunar Sourcebook
Fig. 8.8. Concentrations of REE in a series of samples from the lunar highlands. Horizontal axis shows the REE in order of increasing atomic number. Vertical axis shows the REE concentration in the sample, which has been normalized by dividing it by the concentration in chondritic meteorites (Table 8.1), a procedure that provides a common reference standard. There is a smooth transition between samples with very high REE concentrations (at top) to samples with low REE concentrations (at bottom). The highest concentrations are from a phosphate-rich anorthosite, the second-highest from typical Apollo 14 KREEP. The lowest concentrations are from ferroan anorthosites, except for the sample with very low Eu concentration, which is a dunite. The sharp negative Eu anomalies (upper curves) and positive Eu anomalies (lower curves) are produced by the entry of Eu into plagioclase feldspar, which has been concentrated in the REE-poor anorthositic highland samples and has been depleted in the REE-rich highland samples. The compatibility of Eu2+ with plagioclase makes the compositional range of Eu much lower than that of other REE, or of incompatible trace elements in general.

Lunar Chemistry 379
for these and most other REE are not included in Fig. 8.7. However, because of the general chemical similarities among REE, concentrations for those REE (except Eu) that are not illustrated can be estimated from the data for La, Ce, Sm, and Yb, which are shown (Figs. 8.7m,n,o,q). For example, the concentra-tion of one REE can be estimated from that of a REE of adjacent atomic number by using the ratio of the two REE concentrations determined for a similar material, e.g., KREEP or chondritic meteorites. A better estimate can be made by dividing the concentrations of the analyzed REE in the sample of interest by those for KREEP or chondritic meteorites, and plotting the ratios against REE atomic number, as in Fig. 8.8. The value of the ratio for an undeter-mined REE can then be estimated by interpolation on the graph and multiplied by the concentration in KREEP or chondritic meteorites (whichever was used as the standard to make the graph) to give the desired REE concentration. On such diagrams, when REE concentrations in ordinary chondritic meteorites are used as a standard, the ratios yield smooth curves (except for Eu, which is preferentially incorporated in plagioclase and excluded from most other phases; see Fig. 8.6). These estimates of REE concentration can be quite reliable. For lunar samples, a good alternative to ordinary chondrites as a standard is the REE concentrations in KREEP (e.g., Warren and Wasson, 1979a). Rare earth element concentrations in chondrites and KREEP are given in Table 8.1 (data averaged from several compilations).
Such graphical estimates are reliable for the REE (except Eu), which form a geochemically coherent group, but for other elements it is more risky to estimate the concentration of one incompatible trace element from the concentration of another. However, even for other elements, estimates within a factor of 2 of the correct value can usually be obtained, particularly for samples that have high overall incompatible-element concentrations. In many highland materials, correlations among all elements in the group are strong, and such estimates can be quite reliable.
However, such estimates for elements other than the REE should not be used for comparing widely different lunar materials. Even for the chemically coherent pair Zr-Hf, there is evidence for separation of Zr from Hf in lunar materials. The Zr/Hf ratio in typical highland materials rich in incompatible elements is about 42, but ratios for mare basalts average about 33, which is close to the value of 32 for chondritic meteorites (e.g., Wasson, 1985). Hughes and Schmitt (1984, 1985) have confirmed this difference by careful analytical work and have also found consistent differences in values of Zr/Hf among separate groups of mare basalts.
TABLE 8.1. Concentrations of rare earth elements (REE) in chondritic meteorites and in KREEP, the two most-used standards for REE values
in lunar materials.
Chondrites * KREEP † La 0.319 ± 0.012 115 Ce 0.836 ± 0.043 283 Pr 0.113 ± 0.007 35.8 Nd 0.602 ± 0.019 181 Sm 0.186 ± 0.005 48.7 Eu 0.0724 ± 0.0035 3.1 Gd 0.259 ± 0.012 57.0 Tb 0.0483 ± 0.0022 10.1 Dy 0.324 ± 0.013 64.8 Ho 0.0725 ± 0.0032 14.0 Er 0.21 ± 0.011 39.3 Tm 0.0315 ± 0.0013 5.67 Yb 0.208 ± 0.009 35.8 Lu 0.0328 ± 0.0013 5.48
All values are in µg/g.
* Average of values from Haskin et al. (1968), Nakamura (1974), Leedy chondrite/1.225 (Masuda et al., 1973), and CI chondrite avg./0.796 (Evensen et al., 1978). † Apollo 14 KREEP, adapted from Warren and Wasson (1979a).
The data in Fig. 8.7 provide first-order information on abundances and ranges of concentrations of the incompatible trace elements in a wide variety of lunar materials. Figure 8.7 contains only a small fraction of the available data for REE, Hf, Y, Cs, Zr, Ba, P, K, Rb, Ta, and U in lunar materials, but it contains most of the available data for these elements in certain types of rocks (especially the highland monomict rocks). It also contains most of the available data for Nb, Sn, Li, Be, B, and W in all types of rocks and soils.
Because of the general geochemical coherence of the incompatible trace elements, this group should show about the same relative range of variation as observed for Sm (~104). However, some elements do not show as broad a range in Fig. 8.7 because their analytical detection limits were too high to allow measurement at their lowest concentrations. Com-pilation of a complete database for the most commonly analyzed elements is beyond the scope of this work, but anyone interested in concentrations of the more commonly determined incompatible trace elements will find a large and growing supply of high quality data in the Lunar and Planetary Science Conference Proceedings (e.g., Wänke et al., 1977).
The broadest range of concentrations for most incompatible trace elements is found among the highland monomict rocks. Most of these rocks are
380 Lunar Sourcebook
fragments obtained from lunar breccias, but on the size scale taken for chemical analysis they have not been mixed with other lunar materials. These igneous rocks are survivors from the early highlands, and their compositions were strongly differentiated from that of the bulk Moon (section 2.4.3). Many of these rocks also have compositions that are strongly fractionated compared to compositions of partial melts of bulk lunar material.
Highland monomict rocks are the dominant components of some breccias, and they are respon-sible for the fact that these breccias have a substantial range of concentrations for most ele-ments. Although the soils also consist of mixtures of rock types, they have smaller ranges of concentra-tions than either the breccias or the highland monomict rocks. This situation occurs because the soils are mixtures of a sufficient variety of different materials to average out the compositional differences introduced by the igneous rocks. Among mare basalts, those from the Apollo 11 and 17 sites have significantly higher concentrations of incompatible trace elements than those from the Apollo 12, Apollo 15, and Luna 24 sites. The magnitude of the range of concentrations for incompatible trace elements in mare basalts is about the same as that for all lunar soils.
No rocks with ore-grade concentrations of the incompatible trace elements are yet known. However, these elements are so enriched in some rock types, particularly those that bear phosphate minerals, that in extreme cases the geochemical processes that concentrated them into phosphates may have produced ores.
8.4.2. Incompatible Trace Elements in Lunar Highland Materials: KREEP
In considering the incompatible trace elements, it is useful to discuss highland rocks and soils separately from those of the maria. This is because the concentrations of these elements in highland breccias and soils are so strongly dominated by KREEP that the incompatible trace elements correlate well with each other over a wide range of surface materials.
The nature of KREEP. “KREEP” is a name originally given to an incompatible-trace-element-rich glass (rich in K, REE, and P) that was first discovered among Apollo 12 soil fragments (Hubbard et al., 1971). The term KREEP, originally applied to fragments of glass with this particular composition, is now commonly used as an adjective or as a general term (“KREEP” or “KREEPy”) to refer to any lunar material with the same characteristic set of relative abundances of incompatible trace elements
first found in KREEP. Relative abundances for the REE in Apollo 14 KREEP are shown as the next-to-highest curve in Fig. 8.8, where they are compared with the abundances in chondritic meteorites, whose relative REE abundances are considered to represent the average for planetary starting materials. This figure can be compared with Fig. 2.6, in which the REE of Apollo 14 KREEP are compared to a model whole-Moon composition with REE contents ~2.8 × those of chondritic meteorites. The use of the term KREEP as a noun does not imply a specific major-element composition for a rock or soil. However, most materials having the KREEPy set of relative trace-element abundances also have major-element abundances in the range for the rock type known as norite (a rock with abundant plagioclase and low-Ca pyroxene).
The ultimate origin of the characteristic KREEPy trace-element signature is unknown. A few small samples of “KREEP basalt,” i.e., fine-grained igneous rocks of noritic composition, have been found in the Apollo collection, primarily from the Apollo 15 site (see section 6.3.2). However, other materials enriched in the incompatible trace elements, some with KREEPy relative abundances, have been found in higher concentrations in some highland breccias than in the KREEP basalts. KREEP is thus a material, or a trace-element composition, associated with the lunar highlands, and it is a key feature in under-standing their origin and evolution.
KREEP may have originated when the highlands formed, as incompatible trace elements became concentrated relative to the more abundant major elements, by remaining in the original residual liquids while the more abundant elements crystallized (see Warren and Wasson, 1979a, for a review of ideas on the origin of KREEP). Alternatively, KREEP may have partitioned selectively into liquids formed during the early stages of subsequent partial melting. In either case, the KREEPy abundances probably represent the results of selective extraction processes operating in the lunar crust or upper mantle.
Some investigators regard the characteristic trace-element pattern of KREEP (next-to-highest curve in Fig. 8.8) to be a general characteristic produced by the Moon’s major differentiation into a crust and mantle. In this view, KREEP represents the relative distribution of incompatible trace elements in the lunar crust in a general sense, rather than being the consequence of a specific concentration mechanism or production of a specific rock type. The orbital detection of relatively high intensities of gamma rays from the Th radioactive decay series provides evidence for the presence of substantial areas of KREEP on the Moon’s surface, especially in the vicinity of Mare Imbrium and near several other large

Lunar Chemistry 381
craters (see the map of gamma-ray Th intensities, Plate 10.1).
The smooth transition from KREEPy relative abundances and high concentrations of the incom-patible trace elements to the more varied relative abundances and lower concentrations for a series of typical lunar highland materials is illustrated in Fig. 8.8. The relative REE abundances, compared here to those of chondritic meteorites (assumed to represent the average relative abundances in solar-system matter), change only gradually over most of the range between the highest and lowest REE concentrations. For some polymict materials, this smooth transition occurs because many of the highland materials that contain high concentrations of incompatible trace elements (i.e., >10 times the concentration in chondrites) are mixtures of the characteristic KREEPy materials, rich in incompatible trace elements, with materials having much lower concentrations of incompatible trace elements.
Concentrations of Eu have a far smaller range than the other REE. This is because Eu is present partly in the 2+ oxidation state under lunar rock-forming conditions and, owing to the different chemical properties of Eu2+ compared with those of Eu3+ and the other REE3+ ions, some of the Eu separates from the rest of REE. In particular, Eu2+ becomes enriched relative to the trivalent REE in plagioclase minerals, in which it easily substitutes for Ca2+.
Ranges of incompatible-trace-element concen-trations in highland materials. The lowest con-centrations of incompatible trace elements are found in some of the lunar highland monomict rocks (Fig. 8.7; see section 6.3), especially the anorthosites and dunites. Lunar soils have a range of concentrations. Among polymict samples, the KREEP-rich Apollo 14 soils from Cone Crater and certain breccia fragments (those rich in phosphate minerals) show the highest incompatible-element concentrations. Breccias with high concentrations of incompatible trace elements are discussed in sections 6.3 and 6.4; concentrations of some of these elements in lunar soils are summarized in Tables 7.15 and 7.17. Some entire breccias are relatively rich in incompatible trace elements, e.g., “granitic” breccia 12013, quartz monzodiorites, and phosphate-rich anorthosites. Figure 8.8 shows the relationships between various lunar highland materials in terms of concentration of incompatible REE.
Correlations between incompatible trace ele-ments in highland materials. As mentioned above, the incompatible trace elements are strongly correlated with each other in most sampled highland materials. Typical relationships between concentra-tions of incompatible trace elements are shown in Fig. 8.9, in which concentrations of La, Hf, Th, and
Ba are plotted against Sm for a variety of highland soils and breccias. Samarium is arbitrarily chosen as a useful element for this comparison because it has been determined with good accuracy over a wide range of concentrations and in many samples. To cover all the incompatible trace elements, correlation coefficients for the regression lines for element pairs are listed in Table 8.2.
Because lunar breccias are heterogeneous on a small scale, accurate determination of correlations requires careful analyses of single breccia fragments for a large number of elements. The correlations described in Table 8.2 are derived mainly from analyses by Wänke and coworkers (see citations for Wanke et al. in the reference section). Their data have been supplemented by data from other researchers to confirm the accuracy of their results, to extend the range of concentrations measured for some elements, and to provide data for elements not analyzed by them. In all cases, only pairs of elements from the same analysis were used in determining the parameters of the correlation lines. In no case was an analysis for one element in one sample of a rock used along with that for the second element determined on a different sample of the same rock. The slopes, intercepts, uncertainties, and correlation coefficients are given for the correlation of concentrations of each incompatible trace element with Sm. The range of concentrations over which each correlation line is considered valid is discussed below. Although parameters are given only for correlation lines with Sm as the abscissa, values for correlation lines between any pair of elements can be obtained by solving the corresponding equations for Sm and equating them to each other.
The values given in Table 8.2 were obtained in several steps. First, values were estimated for the intercepts and slopes of the correlation lines for pairs of elements by making an ordinary least-squares fit to the data from a selected suite of highland samples of reliable analytical quality. (A linear fit was used rather than one based on logarithmic axes as shown in Fig. 8.9.) Then, the distance between the observed concentration in each sample for an element plotted on the ordinate and the concentration predicted by the least-squares line was compared to the standard deviation from the line at the corresponding concen-tration level for Sm, based on the quality of the least-squares fit. If the concentration of the element deviated by more than 2.7 standard deviations from the line, its sample was eliminated, and a new least-squares line was determined for the remaining samples. This process was repeated until no further samples were eliminated.
The purpose of this iteration was to give the best estimate of the overall correlation. The eliminated

382 Lunar Sourcebook
Fig. 8.9. Correlation plots for various incompatible trace elements in lunar (mostly highland) materials, plotted against the concentration of Sm, a typical incompatible trace element. Horizontal and vertical axes are both logarithmic and show elemental concentrations in µg/g. (a) La vs. Sm; (b) Th vs. Sm; (c) Hf vs. Sm; (d) Ba vs. Sm. The good correlations produced in all these plots demonstrate the strong coherence of this group of elements in a wide range of highland materials. The strength of the correlations with Sm decreases in the order La, Hf, Th, Ba.
points were not necessarily erroneous; they simply did not fit the correlation. The correlations are in fact not valid for all lunar samples, and they are therefore not as strong as suggested by the data of Table 8.2. The table lists the number of samples for each element for which data were retained in calculating the correlation lines, as well as the number of data points eliminated because they fell too far away from the final line.
For the correlation with Eu, data for Sm <2.5 µg/g were eliminated because the correlation line did not extend to lower Sm concentrations. For Zr, Cs, Dy,
Yb, and Lu, no data were used for Sm <0.08 µg/g, because the correlation clearly ended at about that Sm concentration. For Hf, no data were used for Sm <0.3 µg/g for the same reason. For these elements, the correlations are not valid for samples with Sm concentrations below those levels.
For the elements Li, P, Y, Nb, and W the correlations may appear to be stronger than they actually are because relatively few samples were analyzed for both these elements and Sm. For Na, K, Rb, Cs, REE, and U the fraction of samples whose data do not fit the correlations is 5–15%. Some of these discrepan-

Lunar Chemistry 383
TABLE 8.2. Correlations between individual incompatible trace elements and samarium (Sm) in highland rocks.
Data have been fitted to a correlation line corresponding to the equation y = ax + b, where y = concentration of element, x = concentration of Sm. Original data (see Fig. 8.7) are all in µg/g, except for Na2O, which is in wt.%. * N = number of analyses, a = slope of correlation line, b = intercept, r = residual, rej. = number rejected by program, % rej. = percent rejected.
cies reflect analytical error; however, there is also a significant number of samples whose compositions indicate actual partial separation among the members of the incompatible-trace-element group. This separation also occurs for Zr, Ba, and Ta, but for these elements analytical uncertainty plays a larger role, at least for data obtained by neutron activation analysis. Europium behaves partly as an incompatible trace element in the 3+ state, but also partly as a miscellaneous minor element compatible with plagioclase (in the 2+ state). Because of this unique behavior, the Eu correlation with Sm is less rigorous than those for most other rare earth elements, and 15% of the Eu data had to be excluded in developing the final regression lines.
For many incompatible trace elements the corre-lations are quite strong, and few or no samples deviate from them. Examples of such tight correla-tions are the individual REE with each other, e.g., Sm and La as shown in Fig. 8.9a. Some pairs of chem-ically less closely related elements (e.g., Sm and Hf,
Fig. 8.9c) show similarly close correlations. For other elements there is more scatter, mainly at the lowest and the highest levels of concentration (e.g., Sm and Ba, Fig. 8.9d). Such scatter is even more evident on diagrams with linear, rather than logarithmic axes. The scatter at low concentrations is not caused by poor analyses. The reason for most of this scatter centers around the existence of several different rock types that consist predominantly of different single minerals with low but distinctive trace-element concentrations. At the highest concentrations, individual incompatible trace elements show evidence of partial separation from each other in comparison to their relative abundances in KREEP. This tendency is reflected in the slight change in slope of the data with highest trace-element contents (“super-KREEP”) in Fig. 8.9.
Separations between incompatible trace ele-ments in highland materials. Partial separations are expected between those incompatible trace elements that become concentrated into minor- and

384 Lunar Sourcebook
Fig. 8.10. Correlation plots for Na (a major element) and three incompatible trace elements (K, P, and Eu) in lunar (mostly highland) materials, plotted against the concentration of Sm, a typical incompatible trace element. Horizontal and vertical axes are both logarithmic and show elemental concentrations in µg/g, except for Na, which is in oxide wt.%. (a) K vs. Sm; (b) Na2O vs. Sm; (c) P vs. Sm; (d) Eu vs. Sm. Good positive correlations with Sm are present for both K and P, but those for Na and Eu are poor.
trace-mineral phases and those that do not. That is, members of the incompatible trace element group can behave as “trace-mineral major elements” if concentrations of these elements become high enough to stabilize such minerals. For example, Zr becomes a major element in the trace mineral zircon, where Hf accompanies it as a minor element. In addition, the REE can be concentrated in the minor phosphate minerals apatite and whitlockite. Individual analyzed samples from some rocks show the presence of “excess” whitlockite or zircon (e.g., Lindstrom, 1984). Values for P show a better
correlation with Sm at higher concentrations than at lower concentrations; presumably, this reflects the close association of the REE with whitlockite.
Potassium, a major element in many terrestrial crustal rocks, is scarce on the Moon, where it is an incompatible trace element (<0.1%) in most lunar crustal rocks (see Sm and K data, Fig. 8.10a, and K data in Table A8.2). At high concentrations, there is also some correlation between Sm and the major-element oxide Na2O (Fig. 8.10b) and between Sm and Eu (Fig. 8.10d). However, these correlations break down at low concentrations because Na and Eu are

Lunar Chemistry 385
compatible with the mineral plagioclase while Sm is not. In fact, a significant fraction of the Eu in the lunar highlands is present in plagioclase. There is nevertheless a strong tendency for Eu to correlate with the rest of the REE, because only a fraction of the Eu is in the 2+ oxidation state; the rest is in the 3+ state typical of the other REE, and this remainder behaves coherently with the other REE. Other divalent cations have varying degrees of correlation with Sm. For Sr, a 2+ ion that is also compatible with plagioclase, the correlation is much weaker than for Eu because all the Sr is in the 2+ oxidation state. Other 2+ ions such as Ba deviate from Sm only at high concentrations, in contrast to Sr, which deviates most at low concentrations. This is because Ba is too large to fit readily into the Ca sites of plagioclase and, unlike Sr, does not separate into that mineral preferentially to the REE. Barium does enter potassium feldspar readily, and potassium feldspar is present in some lunar rocks. Separation of potassium feldspar from other minerals, e.g., during late-stage crystallization of a melt, would separate Sm from Ba and K. Such processes may contribute to the scatter of Ba-Sm data in Fig. 8.9d.
There is significant scatter over the entire concen-tration range for Sm and Na2O (Fig. 8.10b), which probably reflects the combined results of differing degrees of separation of the incompatible trace elements from feldspar in different regions of the Moon. In addition, there may be a tendency for Na to separate from the incompatible trace elements in the impact-produced vapor phase during formation of some breccia fragments.
In most sampled lunar highland soils, the incom-patible trace elements are associated with impact glasses, impact-melt breccias, and clast-poor impact melts (sections 6.4.3 to 6.4.5). These rock types are quenched or frozen products of impact melting with variable contributions from KREEP-bearing target materials. Most highland soils are mixtures of rock and mineral fragments, earlier soils, and the products of melting of earlier soils. The mixing process has been continuous and thorough. Few end members for the compositional trends observed in highland soils are themselves pure minerals or single types of igneous rock; most end members are in fact other types of soils (Korotev, 1981, 1987b).
The element concentrations for soils shown in the figures in this chapter, unless otherwise specified, are for the <1-mm size fraction of sieved soils. Compo-sitions of individual soils are not constant for all grain sizes, however (see sections 7.1.7 and 7.5.3, as well as Table 7.17). In several studies, soils from different landing sites have been sieved into four or more grain-size fractions and analyzed for major elements and incompatible trace elements (e.g.,
Papike et al., 1982). The different size fractions have different compositions. In particular, the finest (<20 µm) grain-size fractions of many soils are enriched in Al, Ca, Na, K, the lighter REE, and Th, and they are depleted in Mg, Fe, Mn, and Sc relative to the soil’s bulk composition. In such soils, the components enriched in the finest fraction are those associated with plagioclase and with the fine-grained mesostasis found in many basalts.
For most soils, the extent of enrichment or depletion in the finest size fraction is from a few percent to about 10%; for some soils it is as great as 30%. These variations become even more extreme when very fine material (e.g., <2 µm) is analyzed. The <2-µm size fraction of the Luna 24 soil, relative to the 200–370-µm size fraction, is enriched by 2 times in Al and by more than 3 times in La; it is depleted to 0.4 times in Sc (Laul et al., 1987).
Korotev (1976) discussed possible causes of such enrichments in the finer fraction; he concluded that the principal reason for this effect in four Apollo 17 soils from the primarily basaltic valley floor was the mixing of fine-grained, somewhat KREEPy highland material with comminuted mare basalt. However, Papike et al. (1982) attribute this effect in the soils that they analyzed to differential comminution that preferentially reduces the grain size of plagioclase and of the friable mesostasis, relative to mafic minerals, thus enriching the finest fractions in Al, Ca, Na, and the incompatible trace elements. No compelling criteria to determine the relative importance of mixing vs. differential comminution have yet been developed.
Possible highland ores of incompatible trace elements. Because the incompatible trace elements generally occur in extremely low amounts (<0.1 wt.%) in most highland materials, special concentration mechanisms would be required to produce ore-grade deposits. One such mechanism could be the natural concentration of trace and minor minerals (such as whitlockite or zircon) that are enriched in incompatible trace elements. These concentrations would have to occur on scales greater than any so far observed.
There is as yet no definite evidence that such concentration mechanisms have ever been effective on the Moon, but there are indications that the products of such processes might be present. High concentrations of whitlockite have been found in some anorthositic rocks, e.g., in a white clast in Apollo 14 breccia 14313 (Haskin et al., 1973), which is also the sample with the highest REE concentrations shown in Fig. 8.8. Remote-sensing data from the Apollo 15 and 16 orbiting gamma-ray experiments (section 10.2) show that surface soils in the vicinity of the Apollo 14 landing site are relatively

386 Lunar Sourcebook
rich in Th. To the extent that the chemical correlations shown here are valid globally, this high Th content indicates that the other incompatible trace elements would be concentrated in this general area as well.
It is reasonable to assume that the chemical correlations derived from the lunar highland samples hold for much of the lunar nearside. This view is strengthened by the fact that the same correlations hold even for small fragments of many lunar highland soils and breccias. However, the detailed systematics of incompatible-trace-element concentrations on the lunar farside may not follow the correlations given in Table 8.2. On the farside, orbital remote-sensing data (Plate 10.1) indicate that Th concentrations fall below the limit of validity of the correlation in Table 8.2.
At least some elements of the vapor-mobilized element group (see section 8.7) also correlate to a substantial extent with the incompatible trace elements. During separations of crystals from liquid, most or all of the vapor-mobilized elements probably remain in the liquid with the incompatible trace elements. However, when vapor phases can separate from the liquids, elements of the two groups can separate from each other.
8.4.3. Incompatible Trace Elements in the Lunar Maria
Concentrations of incompatible trace elements in mare basalts do not correlate as closely with each other as they do among highland rocks. However, there is still a strong tendency for all incompatible trace elements to be concentrated together in mare materials.
Figure 8.11 shows REE comparison diagrams for typical mare basalts from the Apollo and Luna missions. A more detailed set of similar diagrams can be seen in Figs. 6.3 to 6.5. For the majority of incompatible trace elements, the range of concen-trations observed in lunar mare basalts (e.g., 1 to 21 µg/g for Sm) is much smaller than that for highland samples (0.04 to 260 µg/g). This difference is also evident in Fig. 8.7 for most but not all elements. Exceptions include Eu, which, because of its occurrence with 2+ as well as 3+ valence, is not totally an incompatible trace element, and Sn, for which few analytical data are available, but whose concentrations may actually vary over a shorter range than other elements of this group.
Mare basalts as guides to lunar mantle com-positions. Despite the narrower range of REE concentrations in mare basalts as compared to highland materials, the relative abundances of the REE to each other are more variable in the mare
basalts, and they are systematically different from those of highland materials. Most mare basalt REE distributions have lower chondrite-normalized relative abundances of the lighter REE (La, Ce) than of the somewhat heavier REE (Nd, Sm, Tb) (see Fig. 8.11). This tendency is also seen in the most common terrestrial basalts, those from the Earth’s ocean floors (see section 5.1.6 and Figs. 5.14 to 5.16). In terrestrial ocean-floor basalts, this pattern is attributed to production of the basalts in regions of the Earth’s mantle that had undergone partial extraction of incompatible trace elements (especially the light REE) prior to the formation of terrestrial ocean-floor basalts (e.g., Gast, 1968; Schnetzler and Philpotts, 1970). An analogous explanation may also apply to the REE distributions in lunar mare basalts. The mare basalts thus appear to represent melts from the lunar mantle that were produced after the separation and formation of much of the highland crust.
This explanation may be incomplete, however. The mare basalts still have concentrations of incompatible trace elements that are higher than the average concentrations for the bulk Moon. Partial melting within the lunar mantle and possibly the lower crust, required for producing the parent magmas of the mare basalts. Within the mantle, this melting extracted those elements that do not readily fit into the major element sites in the principal minerals.. These partial melts were an efficient mechanism for extracting incompatible trace elements from the residual solids and carrying these elements to the lunar surface. Some mare basalts, e.g., those found as small clasts in some Apollo 14 breccias, may also have assimilated some KREEP elements during their rise through the lunar crust (e.g., Shervais et al., 1985a,b).
The concentrations of the incompatible trace elements remaining in the residual solid mantle after such a partial melting episode will be lower than before the extraction. A series of such partial melting episodes will lower the concentrations of incompatible trace elements even further. Any partial melting that occurred soon after the mare basalt source regions formed in the lunar mantle (~4.4 b.y. ago; see section 6.1.9) may have depleted the mantle regions most enriched in incompatible trace elements. Subsequent melting events, which gave rise to the mare basalts we have sampled, would have occurred in a mantle from which any anomalously high concentrations of incompatible trace elements had been extracted. This process, plus physical limits on the extent of subsequent partial melting (probably limited to a few percent of the mantle), resulted in a smaller range of concentrations and a substantially altered set of relative abundances of the incompatible-
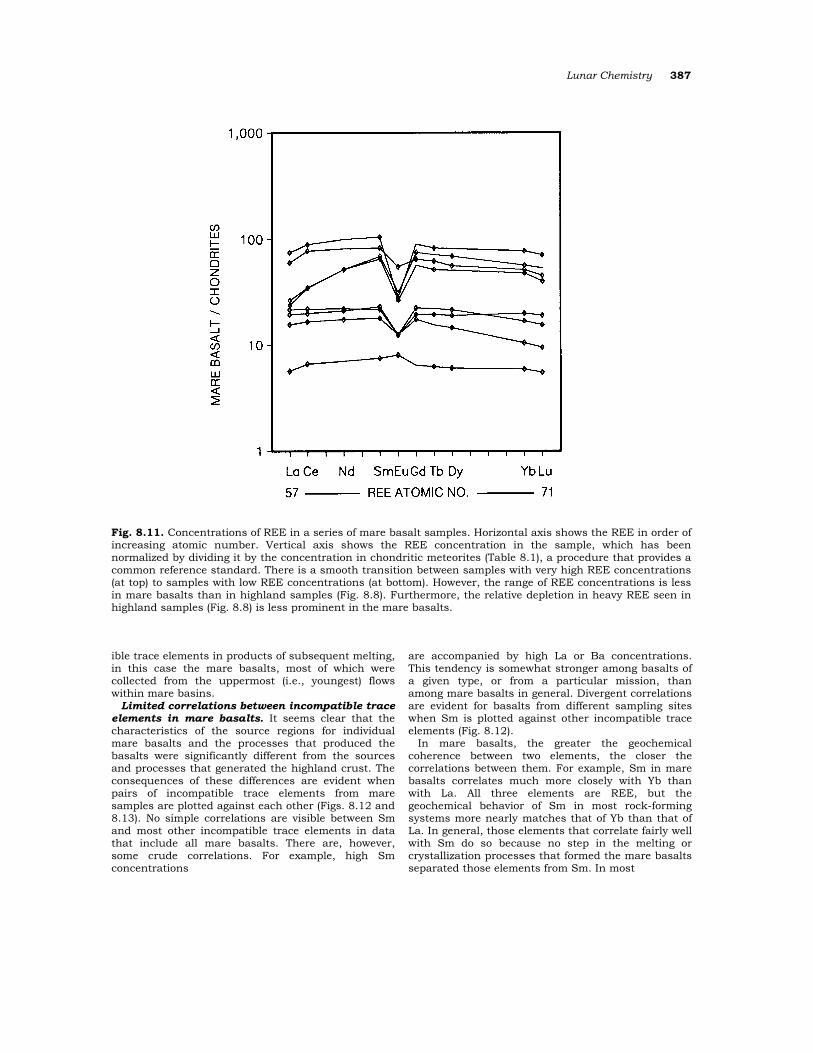
Lunar Chemistry 387
Fig. 8.11. Concentrations of REE in a series of mare basalt samples. Horizontal axis shows the REE in order of increasing atomic number. Vertical axis shows the REE concentration in the sample, which has been normalized by dividing it by the concentration in chondritic meteorites (Table 8.1), a procedure that provides a common reference standard. There is a smooth transition between samples with very high REE concentrations (at top) to samples with low REE concentrations (at bottom). However, the range of REE concentrations is less in mare basalts than in highland samples (Fig. 8.8). Furthermore, the relative depletion in heavy REE seen in highland samples (Fig. 8.8) is less prominent in the mare basalts.
ible trace elements in products of subsequent melting, in this case the mare basalts, most of which were collected from the uppermost (i.e., youngest) flows within mare basins.
Limited correlations between incompatible trace elements in mare basalts. It seems clear that the characteristics of the source regions for individual mare basalts and the processes that produced the basalts were significantly different from the sources and processes that generated the highland crust. The consequences of these differences are evident when pairs of incompatible trace elements from mare samples are plotted against each other (Figs. 8.12 and 8.13). No simple correlations are visible between Sm and most other incompatible trace elements in data that include all mare basalts. There are, however, some crude correlations. For example, high Sm concentrations
are accompanied by high La or Ba concentrations. This tendency is somewhat stronger among basalts of a given type, or from a particular mission, than among mare basalts in general. Divergent correlations are evident for basalts from different sampling sites when Sm is plotted against other incompatible trace elements (Fig. 8.12).
In mare basalts, the greater the geochemical coherence between two elements, the closer the correlations between them. For example, Sm in mare basalts correlates much more closely with Yb than with La. All three elements are REE, but the geochemical behavior of Sm in most rock-forming systems more nearly matches that of Yb than that of La. In general, those elements that correlate fairly well with Sm do so because no step in the melting or crystallization processes that formed the mare basalts separated those elements from Sm. In most

388 Lunar Sourcebook
Fig. 8.12. Correlation plots for four incompatible trace elements (La, Yb, Ba, and Th) in lunar mare basalts, plotted against the concentration of Sm, a typical incompatible trace element. Because of the lower range of concentrations of these elements in basalts, relative to the KREEP-rich highland samples with negative Eu anomalies (Fig. 8.8), the horizontal and vertical axes are both linear; elemental concentrations are shown in µg/g. There is also more compositional scatter for the basalts than for the highland samples. (a) Plot of La vs. Sm. The data show a good correlation between La and Sm, but samples from each Apollo landing site form a different correlation line, unlike the single correlation line for highland samples (Fig. 8.9a). (b) Yb vs. Sm; (c) Ba vs. Sm; (d) Th vs. Sm. In all plots, data for the Apollo 11 low-K basalts overlie those for the Apollo 17 basalts.
cases, the ratios of those elements to Sm in mare basalts are similar to the corresponding ratios for highland materials. However, the correlations between Sm and K, P, Eu, and Na that are present in the highland samples (Fig. 8.10) are very poor or simply not present among the mare basalts (Fig. 8.13). Except for Eu, such correlations are weak or absent for individual types of basalts as well.
Possible maria ores of incompatible trace elements. It is possible that pools of mare basalt, perhaps in relatively small impact craters, might cool slowly enough to allow accumulation of high concentrations of minerals such as ilmenite or chromite (see section 5.2). These accumulations would concentrate such major and minor elements as Fe, Ti, and Cr. However, it is not evident that this

Lunar Chemistry 389
Fig. 8.13. Correlation plots for Na (a major element) and three incompatible trace elements (K, P, and Eu) in lunar mare basalt samples, plotted against the concentration of Sm, a typical incompatible trace element. Horizontal and vertical axes are both linear and show elemental concentrations in µg/g, except for Na, which is in oxide wt.%. (a) K vs. Sm; (b) Na2O vs. Sm; (c) P vs. Sm; (d) Eu vs. Sm. In mare basalts, correlations between these elements are generally poor, but a fair correlation exists between Eu and Sm at low concentrations.
type of concentration would produce an ore of any incompatible trace element. In fact, the reverse process might occur. Accumulation of heavy minerals toward the bottom of a slowly-cooling magma pool might lead to basalt-derived pyroxene- or olivine-rich materials with even lower incompatible-trace-element concentrations than those observed so far, because these elements would tend to remain with the liquid phase.
During partial melting of any single source region in the lunar mantle, smaller percentages of melting will lead to higher abundances of incompatible trace
elements in the melt. Conversely, melts produced by relatively large amounts of partial melting will have lower concentrations of incompatible trace elements. For example, the green glass found at the Apollo 15 landing site, with its low incompatible-trace-element concentrations, indicates a relatively high degree of partial melting of its source region. However, the history of the magma after melting is also important. Once formed by partial melting, a rising magma may reside for significant periods of time in intermediate storage regions (called magma chambers) prior to eruption onto the surface. If appreciable cooling and

390 Lunar Sourcebook
crystallization occur while the magma is in the chamber, the incompatible trace elements may become significantly enriched in the residual liquid before it erupts onto the surface.
The concentrations of incompatible trace elements in mare basalts do not seem related to differences in major-mineral content among different types of basalts. However, the concentrations reported for individual samples of mare basalt may reflect the specific suite of minerals in the particular sample chosen for analysis; this effect has been observed in the small samples of lunar rocks available for analysis. Figure 8.6 shows the concentrations of REE in the separated mesostasis and minerals of a mare basalt. It is evident that differences in the amount of mesostasis in different samples can strongly affect the concentrations of REE measured by chemical analysis. In one careful study of this effect, it was shown that a series of small samples of a single Apollo 17 basalt (basalt 70135; Haskin and Korotev, 1977) produced about the same range of REE concentrations that was observed for the samples analyzed from a large suite of different Apollo 17 basalts.
Although the combined effects of small amounts of melting in the lunar mantle, subsequent crystal-lization to produce enriched residual liquids, and late concentration of mesostasis might enrich the incompatible trace elements in mare basalts, it is unlikely that extreme concentrations of these elements will ever be found in the mare as a result of such events. From the point of view of ores for the incompatible trace elements, the mare basalts do not offer as much promise as highland materials, chiefly because of the far greater concentrations of these elements observed in phosphates and other minor minerals that are more abundant in some highland rocks.
8.5. MISCELLANEOUS MINOR ELEMENTS
The elements discussed in this section (P, Sc, V, Cr, Mn, Ga, and Sr) generally do not conform to any of the major categories (incompatible, siderophile, etc.) into which geochemists like to pigeonhole minor and trace elements. Some of these “miscellaneous minor elements” (e.g., Ga, Sr) partition indifferently between silicate melts and common lunar minerals (i.e., their crystal/melt distribution coefficients are ~1). As a result, there is remarkably little sample-to-sample variation in their concentration. This section includes some minor or trace elements that geochemically resemble certain major elements (e.g., Mn, which is akin to the major element Fe) to such a degree that chemical pro-
cesses such as igneous differentiation seldom have much effect on the ratio of the minor element to its major relative. Other elements discussed here (e.g., P) have little or no tendency to enter any major lunar minerals; instead, they tend to form essential components of specific minor minerals (e.g., phos-phates; section 5.5).
8.5.1. Data Sources
The miscellaneous minor elements generally do not pose extraordinary analytical challenges. Published data, especially relatively recent (post-1974) data, are almost uniformly accurate and, at least for most purposes, adequately precise. Table A8.3 summarizes the main sources used to compile our database for these elements in lunar samples. Element concentrations are shown in Fig. 8.14.
In all cases, the sources we have selected represent only a subset of the entire literature database. The main sources selected for Table A8.3 are not necessarily the most precise available data. However, the sources used are generally reliable and all of them have two important advantages: (1) The elements of interest were determined simultaneously with numerous other elements, allowing the determination of some interesting correlations (e.g., P correlates with incompatible elements such as La). (2) The elements of interest were all determined by the same laboratory, thus providing an internally consistent database for a wide variety of rock and soil samples from a large number of sites. Scandium, Cr, and Mn are particularly easy to determine in lunar samples with the popular instrumental neutron activation analysis (INAA) technique. Vanadium is only slightly harder to determine by INAA. Gallium and Sr were once difficult to determine by INAA, but can generally be measured without much trouble using current techniques. Strontium is often determined with extreme precision using isotope dilution techniques in conjunction with age determinations, but such studies seldom determine enough other elements to allow the Sr concentration data to be unambiguously interpreted, given the small sample masses typically used. Phosphorus is generally determined by the XRF spectrometry technique, which is excellent for relatively high concentrations, but it is not quite sensitive enough for a few unusually P-poor lunar samples.
8.5.2. Phosphorus, Potassium, and Barium
The elements P, K, and Ba are not significant components in most lunar minerals. However, a highly differentiated or evolved igneous melt may produce minerals in which P, K, and Ba may be

Lunar Chemistry 391
major or even essential elements (e.g., K-feldspar or phosphates; Tables A5.11a and A5.18). On the Moon P, K, and Ba behave primarily as incompatible elements (section 8.4).
Phosphorus is infrequently determined in lunar samples. However, the database for P included here probably contains well over half of all the reliable published analyses (Fig. 8.14 and Table A8.3). There is a strong correlation between P and La (Fig. 8.15a), and, for many purposes, the P content of a lunar sample can be satisfactorily estimated from the measured concentration of La (or of some other highly incompatible element), assuming a constant ratio, e.g., P/La = 31.
This method of estimation will be least accurate for samples with extraordinarily high or low concen-trations of other incompatible elements. For example, the monomict quartz monzodiorite fragment from Apollo 15 highland breccia 15405 appears to have an exceptionally low P/La ratio, although the P content has only been imprecisely determined from thin-section studies (see Ryder, 1985).
In general, P behaves as an incompatible element akin to La (Fig. 8.15a). Like most lunar incompatible trace elements, P tends to be most concentrated in samples with major-element compositions resembling basalts, e.g., those with Al contents close to 9 wt.% (Fig. 8.15b), presumably because P was originally emplaced in the lunar crust primarily as some type of KREEP basalt (section 6.3.2). In samples with high concentrations of incompatible trace elements, most of the P is present as phosphate minerals, typically apatite or whitlockite. The phosphide schreibersite, (Fe,Ni,Co)3P, has also been reported as a trace mineral in some highland rocks (e.g., Gooley et al., 1973). In rocks with extremely high contents of incompatible trace elements, the phosphate content is high and the mineral grains may be coarse and heterogeneously distributed. Some of the phosphates may even be present as cumulus crystals (crystals that accumulated during the main phase of differentiation in a large magma body). Fractionation of phosphate minerals probably contributed to the genesis of the extraordinary REE patterns found among evolved lunar rocks such as granites (Warren et al., 1983b; Shih et al., 1985; see section 6.3.5).
The lunar distribution patterns of K and Ba (discussed in more detail in section 8.4) are in most ways analogous to those of P, except that the mineral concentrating K and Ba is K,Ba-feldspar instead of a phosphate mineral. Only a few volumetrically insignificant lunar rock types, most notably the granites, contain more than trace amounts of K,Ba-feldspar. Thus K and Ba also tend to correlate well with incompatible elements such as La, although K and Ba (but not P) are also partially
compatible with a major crustal mineral, plagioclase feldspar (Weill and McKay, 1975; G. A. McKay and Weill, 1976, 1977). From the standpoint of lunar resources, it is important to recognize that, thanks to phosphates and K,Ba-feldspar, lunar rocks with extremely high concentrations (>1 wt.%) of P, K, and Ba probably do exist, although they are not volumet-rically abundant.
When lunar regolith samples are analyzed after being sieved into different grain-size fractions (e.g., Laul et al., 1981, 1983, 1987; Boynton et al., 1976b; Boynton and Wasson, 1977), concentrations of K, Ba, and all other incompatible elements (and thus, by implication, also P) usually have strong inverse correlations with grain size (section 7.5.3 and Table 7.17). The enrichment of these elements in the finer grain sizes seems particularly strong in the soil from the Luna 24 (Mare Crisium) site (Laul et al., 1983, 1987). In these soils the <10-µm fraction is enriched over the bulk soil in K by a factor of ~2.6, and in Ba by a factor of ~2.5.
8.5.3. Scandium, Vanadium, Chromium, and Manganese
These four transition-metal elements, which occur in trace to minor amounts, might be termed “ferrophile” in lunar materials, because during elemental separations they all tend to follow, at least loosely, the major element Fe where it occurs in the ferrous (Fe2+) state in common minerals. They also have weak correlations with Mg and another transition element, Ti, which tend to concentrate in the same major minerals as Fe does. Crystal/liquid distribution coefficients have been determined experimentally for most possible combinations of these elements between major lunar minerals and melts of typical lunar composition (Table 8.3). Vanadium, Cr, and Mn are prone to assume a variety of valence states, although their valences under lunar conditions are most commonly 2+ or 3+. Oxygen fugacity (fO2; see section 5.2) has a major effect on the distribution coefficients for these elements. Table 8.3 shows only the experimental results obtained under Moon-like, extremely low fO2.
In equilibria involving the four most common minerals of the lunar crust (plagioclase feldspar, low-Ca pyroxene, high-Ca pyroxene, and olivine), the elements Sc, V, Cr, and Mn are all incompatible with plagioclase, and they are mildly incompatible to compatible (crystal/liquid distribution coefficients of the order 0.3–3) with the three mafic silicates (olivine, low-Ca pyroxene, and high-Ca pyroxene). The first-order constraint on the lunar distributions of these elements (Figs. 8.14c,d,e,f; Table A8.3) is that they are depleted in anorthositic (i.e., typical
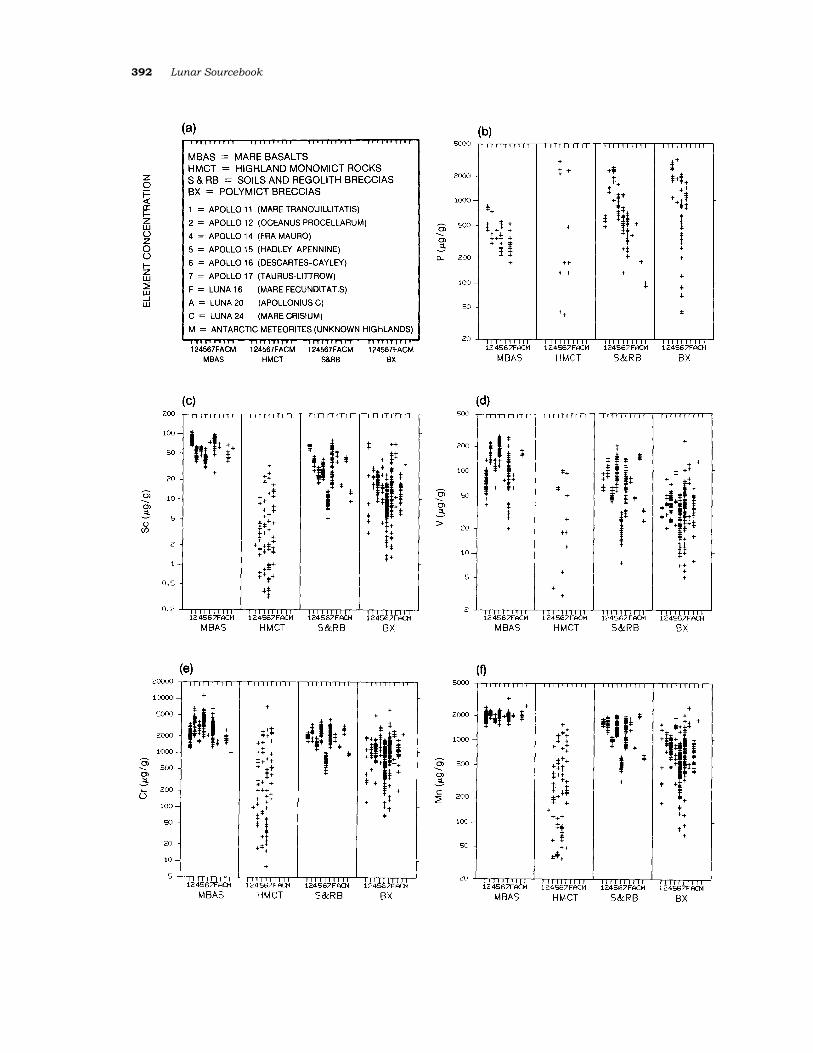
392 Lunar Sourcebook
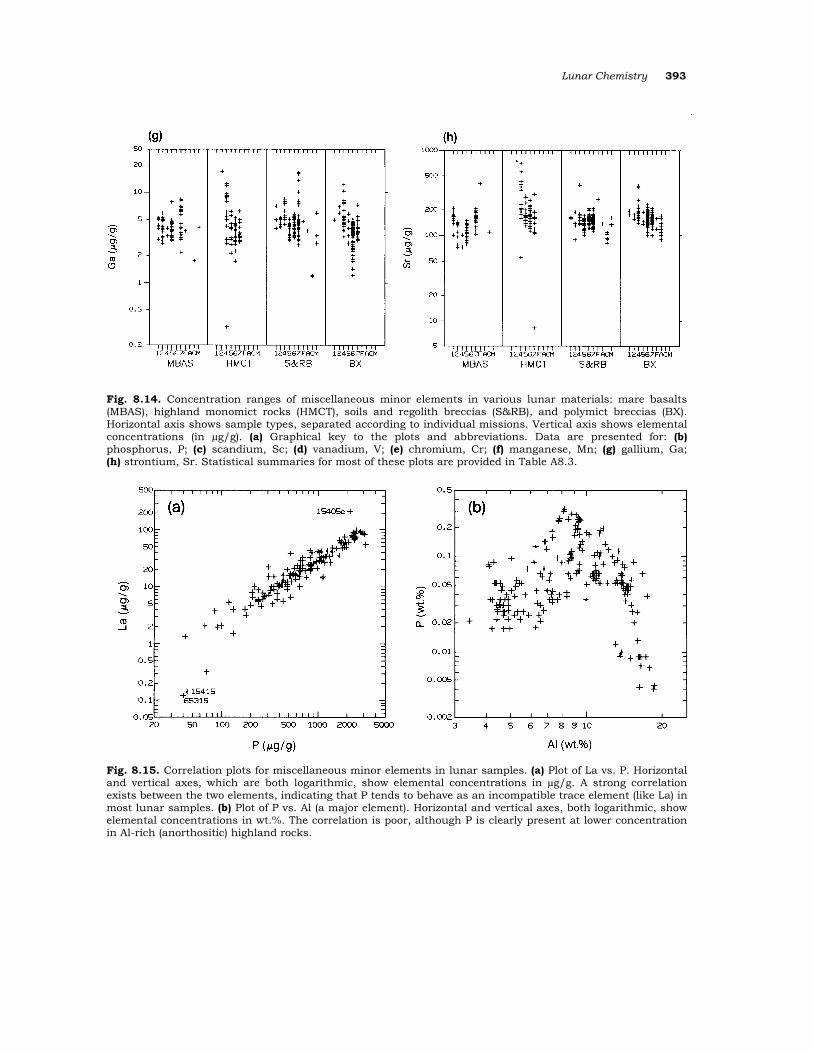
Lunar Chemistry 393
Fig. 8.14. Concentration ranges of miscellaneous minor elements in various lunar materials: mare basalts (MBAS), highland monomict rocks (HMCT), soils and regolith breccias (S&RB), and polymict breccias (BX). Horizontal axis shows sample types, separated according to individual missions. Vertical axis shows elemental concentrations (in µg/g). (a) Graphical key to the plots and abbreviations. Data are presented for: (b) phosphorus, P; (c) scandium, Sc; (d) vanadium, V; (e) chromium, Cr; (f) manganese, Mn; (g) gallium, Ga; (h) strontium, Sr. Statistical summaries for most of these plots are provided in Table A8.3.
Fig. 8.15. Correlation plots for miscellaneous minor elements in lunar samples. (a) Plot of La vs. P. Horizontal and vertical axes, which are both logarithmic, show elemental concentrations in µg/g. A strong correlation exists between the two elements, indicating that P tends to behave as an incompatible trace element (like La) in most lunar samples. (b) Plot of P vs. Al (a major element). Horizontal and vertical axes, both logarithmic, show elemental concentrations in wt.%. The correlation is poor, although P is clearly present at lower concentration in Al-rich (anorthositic) highland rocks.

394 Lunar Sourcebook
` Abbreviation: n.d. = not determined.
References: 1. Lindstrom (1976), as cited in review of Irving (1978); 2. McKay and Weill (1977); 3. Nagasawa et al. (1976), as cited in review of Irving (1978); 4. Ringwood (1970); 5. Duke (1976); 6. McKay and Weill (1976); 7. Weill and McKay (1975); 8. Huebner et al. (1976); 9. Irving et al. (1978); 10. Bird (1971), as cited in review of Irving (1978); 11. Longhi et al. (1978); 12. Malvin and Drake (1987); regarding plagioclase see also Goodman (1972); 13. regarding D for Sr into high-Ca pyroxene, see review by Irving (1978).
highland) rocks, and relatively enriched in basalts and Fe-rich cumulates (i.e., all mare rocks and a few highland rocks). This pattern extends to soils as well; the anorthosite-rich Apollo 16, Luna 20 (Apollonius), and Antarctic lunar meteorite regolith samples have low Sc, V, Cr, and Mn concentrations in comparison to other, more basalt-rich regoliths.
A second-order effect, presumably due to ilmenite fractionation, is that Sc tends to be more concen-trated in high-Ti mare basalts (typical of the Apollo 11 and 17 sites) than in low-Ti mare basalts (typical of the Apollo 12, 14, and 15 sites). The relations are reversed for V and Cr, which do not concentrate as strongly in ilmenite as they do in spinel, the more common oxide mineral in low-Ti basalts (Table 8.3 and Figs. 8.14c,d,e; section 5.2.2).
Correlations with Fe. Correlations between these elements and Fe are shown in Fig. 8.16. The Sc/Fe ratio is generally between 0.0002 and 0.0005. A few olivine-rich cumulate rocks, such as an “olivine clast” from sample 60035 (Fig. 8.16a; Ma and Schmitt, 1982) and a monomict spinel troctolite clast from sample 67435 (Ma et al., 1981a), have exceptionally low Sc/Fe ratios. The correlation between V and Fe is relatively weak (Fig. 8.16b). The monomict fragments of sodic ferrogabbro found in the Apollo 16 highland breccia 67915 (Marti et al., 1983) have exceptionally low V/Fe ratios. Among the highest-Fe samples (i.e., mare basalts), V/Fe ratios scatter widely, probably as a result of fractionation of ilmenite (note the moderately high ilmenite/melt distribution coefficient for V, Table 8.3).
The correlation between Cr and Fe (Fig. 8.16c) also tends to fade at high Fe concentrations, presumably due to ilmenite fractionation [note that the ilmenite/ melt distribution coefficient for Cr (Table 8.3) is only slightly less than that for V]. Even so, bulk-sample Cr/Fe ratios are generally within the range 0.001–0.003. A clast of olivine-rich mare basalt from Apollo 15 breccia 15299 (Warren et al., 1987), a troctolite clast from breccia 67435, and possibly (although the Cr data seem suspect) a monomict ferroan anorthosite clast from Apollo 16 breccia 60215 (Rose et al., 1975) all have exceptionally high Cr/Fe ratios. Low Cr/Fe ratios are found in several samples: an Fe-rich gabbroic (possibly mare) clast from the Yamato-791197 Antarctic meteorite (labelled “Y79” in Fig. 8.16c; Warren and Kallemeyn, 1987), a sodic ferrogabbro clast from breccia 67915, and a monomict granite clast from Apollo 14 breccia 14321 (Warren et al., 1983b). In contrast to the variations shown by the other elements in this group, the correlation between Mn and Fe (Fig. 8.16d) is excellent. The Fe/Mn ratio is so nearly constant (~75 ± 5) in bulk samples from the Moon that it is frequently used as a key test for meteorites suspected to be of lunar origin (the only otherwise-comparable meteorites have Fe/Mn ratios closer to 40).
Limited correlations with Mg and Al. Despite their generally strong correlations with Fe, the elements Sc, Cr, V, and Mn all have only faint correlations with Mg (the best correlations are shown by Cr). The feeble correlations that do exist

Lunar Chemistry 395
Fig. 8.16. Correlation plots for four miscellaneous minor elements (Sc, V, Cr, and Mn) against Fe (a major element) for a range of lunar sample materials. Horizontal and vertical axes, both logarithmic, show elemental concentrations (in µg/g against wt.% Fe). (a) Sc vs. Fe; (b) V vs. Fe; (c) Cr vs. Fe; (d) Mn vs. Fe. Moderate to strong positive correlations exist between all four elements and Fe, indicating that this group of miscellaneous minor elements is strongly associated with FeO in lunar materials.
hold only for low Mg concentrations, up to about 3 wt.% Mg. The inverse correlations that exist between these elements and Al are far more impressive (Fig. 8.17). Even with Al, however, there are notable exceptions. Despite its moderate Al content, the granite clast from breccia 14321 is exceptionally low in Sc, Cr, Mn, and probably in V (not determined) as well. Paradoxically, several dunites, the “olivine” clast from breccia 60035, and
the dunite 72417 (Laul and Schmitt, 1975a), also plot on the low-Cr, low-V, low-Mn, and especially low-Sc sides of trends extrapolated from those shown in Fig. 8.17. This figure also illustrates the uniquely high Mn concentration reported by Murali et al. (1977) for the Apollo 17 high-Ti mare basalt 71535.
Correlations among the “ferrophile” transition elements. Examples of the coherence between pairs of “ferrophile” transition elements in lunar

396 Lunar Sourcebook
Fig. 8.17. Correlation plots for four miscellaneous minor elements (Sc, V, Cr, and Mn) against Al (a major element) for a range of lunar sample materials. Horizontal and vertical axes, both logarithmic, show elemental concentrations (in µg/g against wt.% Al). (a) Sc vs. Al; (b) V vs. Al; (c) Cr vs. Al; (d) Mn vs. Al. Moderate to strong negative correlations exist between all four elements and Al, indicating that the concentration of all elements decreases in Al-rich anorthositic highland rocks.
samples are shown in Fig. 8.18. (Plots for Mn vs. Sc, Cr, and V are not shown because they mirror the analogous plots in Fig. 8.16 for Fe vs. Sc, Cr, and V.) Most of the scatter in Fig. 8.18 is produced by unusual highland monomict rocks, e.g., a granite clast from breccia 14321 (Warren et al., 1983b). The samples with unusual Cr/V ratios include a dunite clast from Apollo 14 breccia 14304 (Warren et al., 1987), a KREEPy clast of “pure dark matter” from Apollo 14 breccia 14083 (Laul et al., 1972a), numer-
ous samples of very-low-Ti (VLT) basalt from Luna 24, and a small ferroan anorthosite (possibly monomict) from Apollo 17 (a clast from soil 70007,298; Ma and Schmitt, 1980). Kinks at the high-V and high-Cr ends of these diagrams result from the fractionation of ilmenite during crystallization of the mare basalt samples.
Chromium is usually considered a minor (if not a trace) element, but in a typical lunar rock much of the Cr resides in a trace or minor mineral in which

Lunar Chemistry 397
Fig. 8.18. Correlation plots for several pairs of “ferrophile” miscellaneous minor elements (V, Sc, and Cr) against each other for a range of lunar sample materials. Horizontal and vertical axes, both logarithmic, show elemental concentrations (in µg/g). (a) V vs. Sc; (b) Cr vs. V; (c) Sc vs. Cr. Good correlations are present between all three pairs of these “ferrophile” elements, indicating that they behave chemically as a coherent group. In addition to the sample numbers shown, “L24MB” represents the Luna 24 very-low-Ti basalt, and “Y79” represents the Antarctic lunar meteorite Yamato 791197.
it is a major element: Cr,Fe-spinel (chromite; section 5.2.2). Although no extremely Cr-rich rocks are known among the limited suite of lunar samples so far collected, the fact that Cr is highly concentrated into a single mineral raises the possibility that Cr-rich cumulate rocks, formed by the separation and concentration of the mineral chromite, may be found among the roughly 2 × 10⁹ km3 of plutonic rocks that make up the lunar highland crust (see section 5.2). On the basis of typical Cr,Fe-spinel
compositions (Table A5.13), such a cumulate rock would probably also be rich in V.
Grain-size distributions in soils. When lunar regolith samples are analyzed after being sieved into different grain-size fractions (e.g., Laul et al., 1981, 1983, 1987; Boynton et al., 1976b; Boynton and Wasson, 1977), the Fe concentrations of the fractions are consistently found to be correlated with grain size (the Fe concentration of the <10-µm fraction is typically about 0.8 times the bulk-soil Fe concentra-
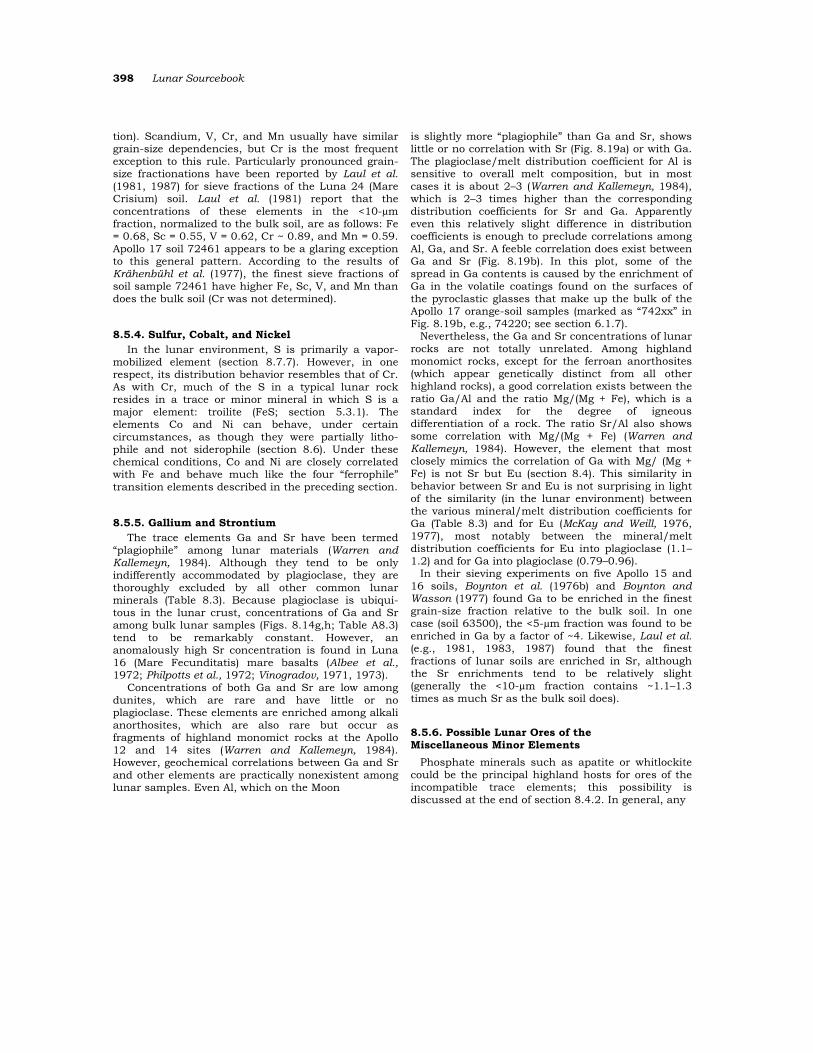
398 Lunar Sourcebook
tion). Scandium, V, Cr, and Mn usually have similar grain-size dependencies, but Cr is the most frequent exception to this rule. Particularly pronounced grain-size fractionations have been reported by Laul et al. (1981, 1987) for sieve fractions of the Luna 24 (Mare Crisium) soil. Laul et al. (1981) report that the concentrations of these elements in the <10-µm fraction, normalized to the bulk soil, are as follows: Fe = 0.68, Sc = 0.55, V = 0.62, Cr ~ 0.89, and Mn = 0.59. Apollo 17 soil 72461 appears to be a glaring exception to this general pattern. According to the results of Krähenbühl et al. (1977), the finest sieve fractions of soil sample 72461 have higher Fe, Sc, V, and Mn than does the bulk soil (Cr was not determined).
8.5.4. Sulfur, Cobalt, and Nickel In the lunar environment, S is primarily a vapor-
mobilized element (section 8.7.7). However, in one respect, its distribution behavior resembles that of Cr. As with Cr, much of the S in a typical lunar rock resides in a trace or minor mineral in which S is a major element: troilite (FeS; section 5.3.1). The elements Co and Ni can behave, under certain circumstances, as though they were partially litho-phile and not siderophile (section 8.6). Under these chemical conditions, Co and Ni are closely correlated with Fe and behave much like the four “ferrophile” transition elements described in the preceding section.
8.5.5. Gallium and Strontium The trace elements Ga and Sr have been termed
“plagiophile” among lunar materials (Warren and Kallemeyn, 1984). Although they tend to be only indifferently accommodated by plagioclase, they are thoroughly excluded by all other common lunar minerals (Table 8.3). Because plagioclase is ubiqui-tous in the lunar crust, concentrations of Ga and Sr among bulk lunar samples (Figs. 8.14g,h; Table A8.3) tend to be remarkably constant. However, an anomalously high Sr concentration is found in Luna 16 (Mare Fecunditatis) mare basalts (Albee et al., 1972; Philpotts et al., 1972; Vinogradov, 1971, 1973).
Concentrations of both Ga and Sr are low among dunites, which are rare and have little or no plagioclase. These elements are enriched among alkali anorthosites, which are also rare but occur as fragments of highland monomict rocks at the Apollo 12 and 14 sites (Warren and Kallemeyn, 1984). However, geochemical correlations between Ga and Sr and other elements are practically nonexistent among lunar samples. Even Al, which on the Moon
is slightly more “plagiophile” than Ga and Sr, shows little or no correlation with Sr (Fig. 8.19a) or with Ga. The plagioclase/melt distribution coefficient for Al is sensitive to overall melt composition, but in most cases it is about 2–3 (Warren and Kallemeyn, 1984), which is 2–3 times higher than the corresponding distribution coefficients for Sr and Ga. Apparently even this relatively slight difference in distribution coefficients is enough to preclude correlations among Al, Ga, and Sr. A feeble correlation does exist between Ga and Sr (Fig. 8.19b). In this plot, some of the spread in Ga contents is caused by the enrichment of Ga in the volatile coatings found on the surfaces of the pyroclastic glasses that make up the bulk of the Apollo 17 orange-soil samples (marked as “742xx” in Fig. 8.19b, e.g., 74220; see section 6.1.7).
Nevertheless, the Ga and Sr concentrations of lunar rocks are not totally unrelated. Among highland monomict rocks, except for the ferroan anorthosites (which appear genetically distinct from all other highland rocks), a good correlation exists between the ratio Ga/Al and the ratio Mg/(Mg + Fe), which is a standard index for the degree of igneous differentiation of a rock. The ratio Sr/Al also shows some correlation with Mg/(Mg + Fe) (Warren and Kallemeyn, 1984). However, the element that most closely mimics the correlation of Ga with Mg/ (Mg + Fe) is not Sr but Eu (section 8.4). This similarity in behavior between Sr and Eu is not surprising in light of the similarity (in the lunar environment) between the various mineral/melt distribution coefficients for Ga (Table 8.3) and for Eu (McKay and Weill, 1976, 1977), most notably between the mineral/melt distribution coefficients for Eu into plagioclase (1.1–1.2) and for Ga into plagioclase (0.79–0.96).
In their sieving experiments on five Apollo 15 and 16 soils, Boynton et al. (1976b) and Boynton and Wasson (1977) found Ga to be enriched in the finest grain-size fraction relative to the bulk soil. In one case (soil 63500), the <5-µm fraction was found to be enriched in Ga by a factor of ~4. Likewise, Laul et al. (e.g., 1981, 1983, 1987) found that the finest fractions of lunar soils are enriched in Sr, although the Sr enrichments tend to be relatively slight (generally the <10-µm fraction contains ~1.1–1.3 times as much Sr as the bulk soil does).
8.5.6. Possible Lunar Ores of the Miscellaneous Minor Elements
Phosphate minerals such as apatite or whitlockite could be the principal highland hosts for ores of the incompatible trace elements; this possibility is discussed at the end of section 8.4.2. In general, any

Lunar Chemistry 399
Fig. 8.19. Correlation plots for two miscellaneous minor elements (Sr and Ga) and Al (a major element) for a range of lunar sample materials. Horizontal and vertical axes, both logarithmic, show elemental concentrations (in µg/g, except Al in wt.%). (a) Sr vs. Al; (b) Sr vs. Ga, a “plagiophile” element concentrated in plagioclase. The lack of good correlations between Sr and either Al or Ga indicates that Sr is not entirely concentrated in plagioclase or plagioclase-rich rocks. In addition to the sample numbers shown, “L24MB” represents the Luna 24 very-low-Ti basalt, “Alk. An.” represents alkali anorthosite, and “742xx” represents the Apollo 17 orange-glass pyroclastic deposits.
lunar ore body rich in KREEP would contain abundant P (which is, after all, the P in KREEP). Among the transition metals that are miscellaneous minor elements, Cr is most likely to form ores as the mineral chromite; concentrations of heavy spinel minerals such as chromite are possible in thick bodies of low-Ti mare basalt, where the low viscosity of the lava would allow gravitational settling and accumulation of the chromite (see section 5.2). Chromite accumulations could also occur in some highland plutonic rocks (see section 8.5.3). Concen-trations of phosphate or chromite ore in the highlands and chromite ore in the mare, however, are still speculative.
8.6. SIDEROPHILE ELEMENTS
Siderophile means “iron-loving.” The elements discussed in this section (Fe, Co, Ni, Mo, W, Ge, Sb, and such Pt-group elements as Pt, Ir, Os, and Au; Fig. 8.1d) are easily reduced to the metallic state, and they therefore tend to concentrate into alloys with metallic Fe. In lunar samples, Fe metal is generally alloyed with a few percent of Ni. This FeNi alloy most frequently occurs as the mineral kamacite with 0–6 wt.% Ni; taenite with 6–50 wt.% Ni also occurs, but tetrataenite (tetragonal structure with ~50 wt.% Ni) is rare (see section 5.4). Generally, any FeNi alloy in lunar samples is referred to simply as “metal.”
The behavior of siderophile elements is conve-niently examined by the degree to which they concentrate in the metal phase, as opposed to the coexisting silicate minerals. Table 8.4 shows metal/ silicate distribution coefficients (Dm/s) for several siderophile elements. These coefficients are defined as the equilibrium weight concentration of an element in metal, divided by weight concentration of the element in coexisting silicate minerals. Distribu-tion coefficients were determined either directly from experiments (Table 8.4, refs. 1, 2, 3, 4, and 7) or estimated from the observed distributions of the elements among the metal and silicate minerals of meteorites or lunar igneous rocks (Table 8.4, refs. 4, 5, and 6). These distribution coefficients are probably highly sensitive to chemical variables (especially to O fugacity and S concentration) and to the temperature of equilibration, but the values in Table 8.4 do indicate at least the relative magnitudes of the fractionations that will result when metal is segre-gated from molten metal/silicate systems.
Compared to the crust of the Moon (or for that matter, to the crust of the Earth), most meteorites are extremely metal-rich. A typical chondrite meteorite has about 20 wt.% metal, and many meteorites are virtually pure metal. In contrast, a typical lunar basalt has <1 wt.% metal (section 5.4.2). Consequently, meteorites also tend to have far higher concentrations of siderophile elements than do lunar
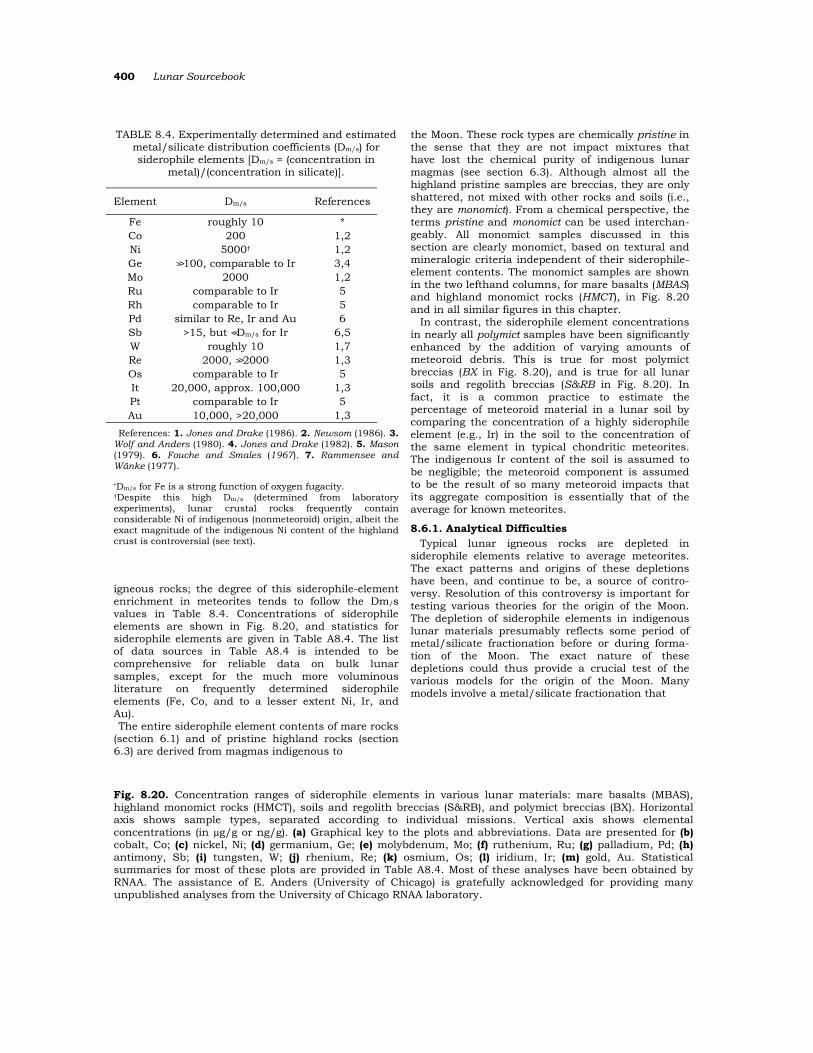
400 Lunar Sourcebook
TABLE 8.4. Experimentally determined and estimated metal/silicate distribution coefficients (Dm/s) for siderophile elements [Dm/s = (concentration in
metal)/(concentration in silicate)].
Element Dm/s References
Fe roughly 10 * Co 200 1,2 Ni 5000† 1,2 Ge >> 100, comparable to Ir 3,4 Mo 2000 1,2 Ru comparable to Ir 5 Rh comparable to Ir 5 Pd similar to Re, Ir and Au 6 Sb >15, but <<Dm/s for Ir 6,5 W roughly 10 1,7 Re 2000, >> 2000 1,3 Os comparable to Ir 5 It 20,000, approx. 100,000 1,3 Pt comparable to Ir 5 Au 10,000, >20,000 1,3
References: 1. Jones and Drake (1986). 2. Newsom (1986). 3. Wolf and Anders (1980). 4. Jones and Drake (1982). 5. Mason (1979). 6. Fouche and Smales (1967). 7. Rammensee and Wänke (1977).
*Dm/s for Fe is a strong function of oxygen fugacity. †Despite this high Dm/s (determined from laboratory experiments), lunar crustal rocks frequently contain considerable Ni of indigenous (nonmeteoroid) origin, albeit the exact magnitude of the indigenous Ni content of the highland crust is controversial (see text).
igneous rocks; the degree of this siderophile-element enrichment in meteorites tends to follow the Dm/s values in Table 8.4. Concentrations of siderophile elements are shown in Fig. 8.20, and statistics for siderophile elements are given in Table A8.4. The list of data sources in Table A8.4 is intended to be comprehensive for reliable data on bulk lunar samples, except for the much more voluminous literature on frequently determined siderophile elements (Fe, Co, and to a lesser extent Ni, Ir, and Au). The entire siderophile element contents of mare rocks
(section 6.1) and of pristine highland rocks (section 6.3) are derived from magmas indigenous to
the Moon. These rock types are chemically pristine in the sense that they are not impact mixtures that have lost the chemical purity of indigenous lunar magmas (see section 6.3). Although almost all the highland pristine samples are breccias, they are only shattered, not mixed with other rocks and soils (i.e., they are monomict). From a chemical perspective, the terms pristine and monomict can be used interchan-geably. All monomict samples discussed in this section are clearly monomict, based on textural and mineralogic criteria independent of their siderophile-element contents. The monomict samples are shown in the two lefthand columns, for mare basalts (MBAS) and highland monomict rocks (HMCT), in Fig. 8.20 and in all similar figures in this chapter.
In contrast, the siderophile element concentrations in nearly all polymict samples have been significantly enhanced by the addition of varying amounts of meteoroid debris. This is true for most polymict breccias (BX in Fig. 8.20), and is true for all lunar soils and regolith breccias (S&RB in Fig. 8.20). In fact, it is a common practice to estimate the percentage of meteoroid material in a lunar soil by comparing the concentration of a highly siderophile element (e.g., Ir) in the soil to the concentration of the same element in typical chondritic meteorites. The indigenous Ir content of the soil is assumed to be negligible; the meteoroid component is assumed to be the result of so many meteoroid impacts that its aggregate composition is essentially that of the average for known meteorites.
8.6.1. Analytical Difficulties Typical lunar igneous rocks are depleted in
siderophile elements relative to average meteorites. The exact patterns and origins of these depletions have been, and continue to be, a source of contro-versy. Resolution of this controversy is important for testing various theories for the origin of the Moon. The depletion of siderophile elements in indigenous lunar materials presumably reflects some period of metal/silicate fractionation before or during forma-tion of the Moon. The exact nature of these depletions could thus provide a crucial test of the various models for the origin of the Moon. Many models involve a metal/silicate fractionation that
Fig. 8.20. Concentration ranges of siderophile elements in various lunar materials: mare basalts (MBAS), highland monomict rocks (HMCT), soils and regolith breccias (S&RB), and polymict breccias (BX). Horizontal axis shows sample types, separated according to individual missions. Vertical axis shows elemental concentrations (in µg/g or ng/g). (a) Graphical key to the plots and abbreviations. Data are presented for (b) cobalt, Co; (c) nickel, Ni; (d) germanium, Ge; (e) molybdenum, Mo; (f) ruthenium, Ru; (g) palladium, Pd; (h) antimony, Sb; (i) tungsten, W; (j) rhenium, Re; (k) osmium, Os; (l) iridium, Ir; (m) gold, Au. Statistical summaries for most of these plots are provided in Table A8.4. Most of these analyses have been obtained by RNAA. The assistance of E. Anders (University of Chicago) is gratefully acknowledged for providing many unpublished analyses from the University of Chicago RNAA laboratory.

Lunar Chemistry 401

402 Lunar Sourcebook
Fig. 8.20. (continued).

Lunar Chemistry 403
occurred on some other body (in most models, the Earth) before the Moon itself formed. Other models relate the observed depletion of siderophile elements to chemical differentiation within the Moon, possibly involving formation of a small metal core. One problem in resolving these questions is the difficulty of obtaining reliable analyses of siderophile elements, especially for the monomict mare and highland rocks, in order to determine what the original siderophile abundances in the Moon really were.
Of the elements discussed in this chapter, only Fe, Co, and (in a few laboratories) W are easily and reliably measured in virtually all lunar samples. The main problem in measuring the others is their extremely low concentrations [typically measured in nanograms per gram (ng/g), compared to micrograms per gram (µg/g) for most other trace elements]. The widely-used technique of INAA can accurately determine Ni in all but a few percent of lunar rocks, including, under optimum conditions of mass and other analytical factors, many monomict varieties. This same technique can also detect Ir and Au in most lunar polymict rocks and soils, but almost never in any type of monomict rock. For most other siderophile elements (the main exception is Mo), the only published data have been determined by the more laborious technique of radiochemical neutron activation analysis (RNAA). Most siderophile-element concentrations reported for mare basalts in the early 1970s are suspiciously high in comparison to data acquired since about 1974, when most of the relatively few analysts still studying lunar rocks came to appreciate the enormous potential for laboratory contamination and to take increased precautions to avoid it (Wolf et al., 1979; Warren et al., 1986).
For highland monomict rocks, there is also a severe sampling problem. Many of these rocks occur as fragments in breccias, and only a few of them are large enough to permit taking splits of even a few hundred milligrams for analysis. In fact, most samples of highland monomict rocks have masses of only a few hundred milligrams. From such samples, only a few tens of milligrams (if any) can be used for destructive analyses. Even for the few kilogram-sized samples, the largest subsamples consumed for analysis never weigh more than a few hundred milligrams.
In any lunar rock, the siderophile elements are concentrated into a few tiny, randomly distributed grains of metal or other opaque minerals. Even for a highly siderophile element such as Ir, replicate analyses of mare basalts, using samples of roughly 200 mg, frequently differ by factors of >3 (Warren et al., 1986; Anders et al., 1971). Highland monomict rocks tend to be coarser grained and more miner-alogically heterogeneous than mare basalts. Thus, even the relatively few highland monomict samples with reliable siderophile data are not clearly representative of any large volume of the lunar crust.
In addition to these problems, the general difficulty of determining most of the siderophile elements (the main exceptions are Fe, Co, and W) inevitably produces a bias toward higher concentrations in the database. Many siderophile analyses provide only upper bounds (determined by the analytical detection limits) on concentration. In some tabulations, no result may be reported for a siderophile-poor sample even though the same author may report data for the same element in similar but more siderophile-rich samples. There is no clear way to compensate for these complexities when calculating average
Fig. 8.20. (continued).

404 Lunar Sourcebook
siderophile concentrations for any particular set of samples. This problem tends to be most acute for the elements with strongest siderophile character (e.g., Re and Os), which are most depleted in lunar samples.
For highland monomict rocks, another factor may bias the database for siderophile elements toward lower contents. One of the prime means for distin-guishing whether a highland rock is monomict or polymict is to compare its concentrations of highly siderophile elements (e.g., Ir, Ni, Re, or Os) to those in meteorites. Since many highland monomict rocks (unlike mare basalts) are so thoroughly brecciated that the evidence from texture and mineralogy may be ambiguous, there could be cases where samples are identified as polymict mainly on grounds of high siderophile contents, when in fact they might simply be uncommonly siderophile-rich monomict rocks.
8.6.2. Iridium: The “Type” Siderophile Element Iridium is one of the most extremely siderophile
elements (Table 8.4). It is also one of the most frequently and most reliably determined elements among the siderophile group. Iridium thus represents a good standard for comparison, particularly for siderophile elements that are often determined simultaneously with Ir. Most of the following general observations about Ir concentrations in lunar materials seem to apply equally well to other comparably siderophile elements (see Table 8.4). The main exception to this generalization is Ni, which is apparently not as Ir-like in its behavior as its Dm/s in Table 8.4 would suggest. In addition, the distributions of Au and Ge may be significantly affected by their greater volatility (see discussions of individual elements in section 8.6.3).
Mature lunar soils derive virtually all their Ir from introduced meteoroid debris; apparently, the indig-enous contribution of Ir from lunar bedrock is virtually negligible. This conclusion is strongly supported by the general observation that all reliable analyses of presumed monomict rocks (mare basalts as well as numerous undamaged—and clearly recognizable—highland monomict rocks) yield extremely low Ir concentrations in comparison to soils and regolith breccias (Fig. 8.201). Since the aggregate composition of all the analyzed monomict rocks from any given site is roughly the same composition as the local soils, the soils evidently receive their Ir from a component (or components) that make up only a few percent of the mass of the soils.
Lunar soils are produced by the disaggregation and crushing of rocks by meteoroid impacts, and it is clear that the average meteoroid contains several
orders of magnitude more Ir than any known lunar monomict rock. Therefore, the obvious source for the Ir-rich component in lunar soils is meteoroid debris. This conclusion is corroborated by studies of the metal grains separated from lunar soils. The larger metal grains generally have compositions and textures that may have formed within a meteoroid host (Wlotzka et al., 1973; Goldstein et al., 1972), although commonly the metal grains appear to have been metamorphosed during an earlier residence in polymict breccias before entering the soil.
Wänke et al. (1971) and Wlotzka et al. (1972) used mass-balance calculations on their data for metal grains from soils and for the bulk soils (including total Fe-metal contents) to estimate that meteoroid metal grains contribute about 53–62% of the total Ir in two Apollo soils (12001 and 14163; Table A8.4). The same approach, applied to Apollo 11 soil 10084, yielded a bogus meteoroid metal-grain Ir contribution of 226%, but Wänke et al. (1972) explained this discrepancy as a consequence of their having analyzed only the coarsest metal grains in sample 10084, whereas for samples 12001 and 14163 metal grains of all sizes were analyzed.
The data from samples 12001 and 14163 suggest that much of the Ir added to the soil comes from meteoroids similar to carbonaceous chondrites, which are common, primitive, volatile-rich meteorites that have roughly the same concentrations of Ir (and other nonvolatile elements) as an average meteorite. However, carbonaceous chondrites contain little or no Fe metal, and their Ir is believed to reside in the ultrafine-grained, amorphous matrix material that constitutes a major fraction of these meteorites. Comets and micrometeoroids, which are also likely objects to collide with the Moon, are believed to be generally similar to carbonaceous chondrites in this regard.
Table A8.4 includes statistics for concentrations of Ir and other frequently determined siderophile elements in two types of lunar samples: mare basalts (monomict samples from the lunar mantle) and soils and regolith breccias (polymict samples). The contrast in Ir contents between monomict mare basalts on the one hand and polymict soils and regolith breccias on the other is probably even more pronounced than this table and Fig. 8.201 would suggest because of the analytical problems discussed above. The sensitivity of the RNAA technique for Ir is so great that Ir has been detected about 90% of the times that RNAA has been applied to mare basalts (e.g., Wolf et al., 1979; Warren et al., 1986, 1987), a far better success rate than for most other siderophile elements. However, even these data may be complicated by occasional failures to detect Ir in extremely low-Ir samples, and there may also be
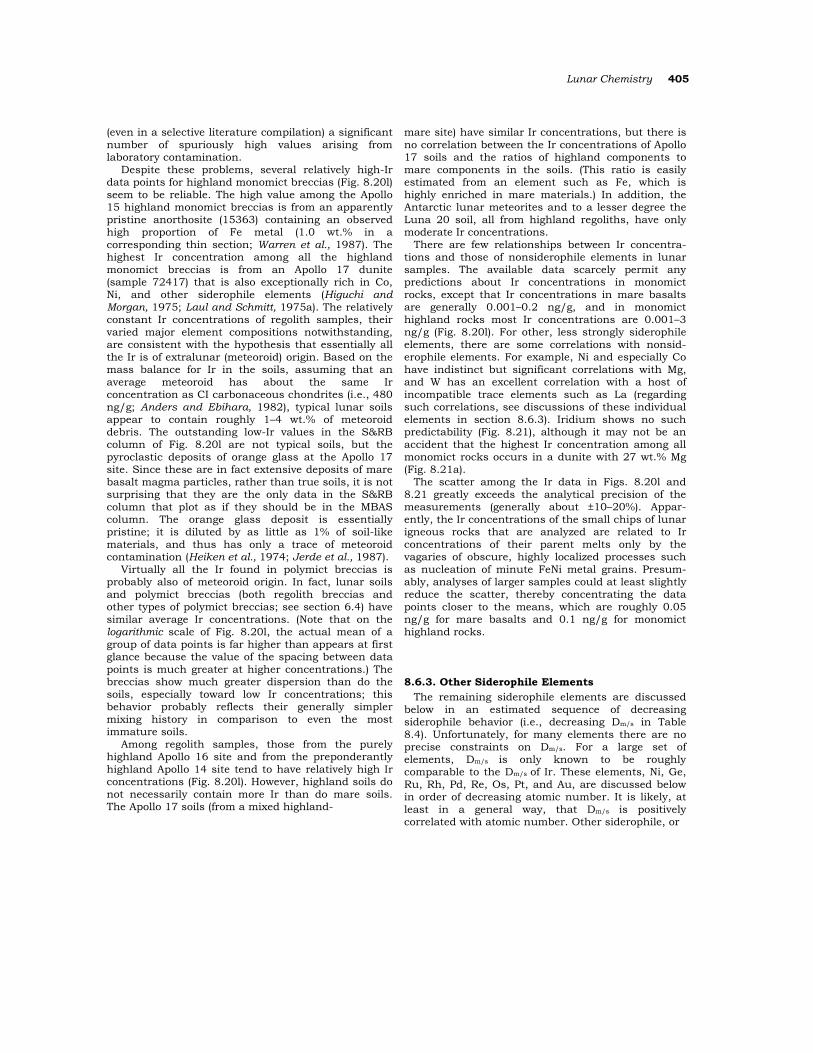
Lunar Chemistry 405
(even in a selective literature compilation) a significant number of spuriously high values arising from laboratory contamination.
Despite these problems, several relatively high-Ir data points for highland monomict breccias (Fig. 8.20l) seem to be reliable. The high value among the Apollo 15 highland monomict breccias is from an apparently pristine anorthosite (15363) containing an observed high proportion of Fe metal (1.0 wt.% in a corresponding thin section; Warren et al., 1987). The highest Ir concentration among all the highland monomict breccias is from an Apollo 17 dunite (sample 72417) that is also exceptionally rich in Co, Ni, and other siderophile elements (Higuchi and Morgan, 1975; Laul and Schmitt, 1975a). The relatively constant Ir concentrations of regolith samples, their varied major element compositions notwithstanding, are consistent with the hypothesis that essentially all the Ir is of extralunar (meteoroid) origin. Based on the mass balance for Ir in the soils, assuming that an average meteoroid has about the same Ir concentration as CI carbonaceous chondrites (i.e., 480 ng/g; Anders and Ebihara, 1982), typical lunar soils appear to contain roughly 1–4 wt.% of meteoroid debris. The outstanding low-Ir values in the S&RB column of Fig. 8.20l are not typical soils, but the pyroclastic deposits of orange glass at the Apollo 17 site. Since these are in fact extensive deposits of mare basalt magma particles, rather than true soils, it is not surprising that they are the only data in the S&RB column that plot as if they should be in the MBAS column. The orange glass deposit is essentially pristine; it is diluted by as little as 1% of soil-like materials, and thus has only a trace of meteoroid contamination (Heiken et al., 1974; Jerde et al., 1987).
Virtually all the Ir found in polymict breccias is probably also of meteoroid origin. In fact, lunar soils and polymict breccias (both regolith breccias and other types of polymict breccias; see section 6.4) have similar average Ir concentrations. (Note that on the logarithmic scale of Fig. 8.20l, the actual mean of a group of data points is far higher than appears at first glance because the value of the spacing between data points is much greater at higher concentrations.) The breccias show much greater dispersion than do the soils, especially toward low Ir concentrations; this behavior probably reflects their generally simpler mixing history in comparison to even the most immature soils.
Among regolith samples, those from the purely highland Apollo 16 site and from the preponderantly highland Apollo 14 site tend to have relatively high Ir concentrations (Fig. 8.20l). However, highland soils do not necessarily contain more Ir than do mare soils. The Apollo 17 soils (from a mixed highland-
mare site) have similar Ir concentrations, but there is no correlation between the Ir concentrations of Apollo 17 soils and the ratios of highland components to mare components in the soils. (This ratio is easily estimated from an element such as Fe, which is highly enriched in mare materials.) In addition, the Antarctic lunar meteorites and to a lesser degree the Luna 20 soil, all from highland regoliths, have only moderate Ir concentrations.
There are few relationships between Ir concentra-tions and those of nonsiderophile elements in lunar samples. The available data scarcely permit any predictions about Ir concentrations in monomict rocks, except that Ir concentrations in mare basalts are generally 0.001–0.2 ng/g, and in monomict highland rocks most Ir concentrations are 0.001–3 ng/g (Fig. 8.20l). For other, less strongly siderophile elements, there are some correlations with nonsid-erophile elements. For example, Ni and especially Co have indistinct but significant correlations with Mg, and W has an excellent correlation with a host of incompatible trace elements such as La (regarding such correlations, see discussions of these individual elements in section 8.6.3). Iridium shows no such predictability (Fig. 8.21), although it may not be an accident that the highest Ir concentration among all monomict rocks occurs in a dunite with 27 wt.% Mg (Fig. 8.21a).
The scatter among the Ir data in Figs. 8.20l and 8.21 greatly exceeds the analytical precision of the measurements (generally about ±10–20%). Appar-ently, the Ir concentrations of the small chips of lunar igneous rocks that are analyzed are related to Ir concentrations of their parent melts only by the vagaries of obscure, highly localized processes such as nucleation of minute FeNi metal grains. Presum-ably, analyses of larger samples could at least slightly reduce the scatter, thereby concentrating the data points closer to the means, which are roughly 0.05 ng/g for mare basalts and 0.1 ng/g for monomict highland rocks.
8.6.3. Other Siderophile Elements The remaining siderophile elements are discussed
below in an estimated sequence of decreasing siderophile behavior (i.e., decreasing Dm/s in Table 8.4). Unfortunately, for many elements there are no precise constraints on Dm/s. For a large set of elements, Dm/s is only known to be roughly comparable to the Dm/s of Ir. These elements, Ni, Ge, Ru, Rh, Pd, Re, Os, Pt, and Au, are discussed below in order of decreasing atomic number. It is likely, at least in a general way, that Dm/s is positively correlated with atomic number. Other siderophile, or
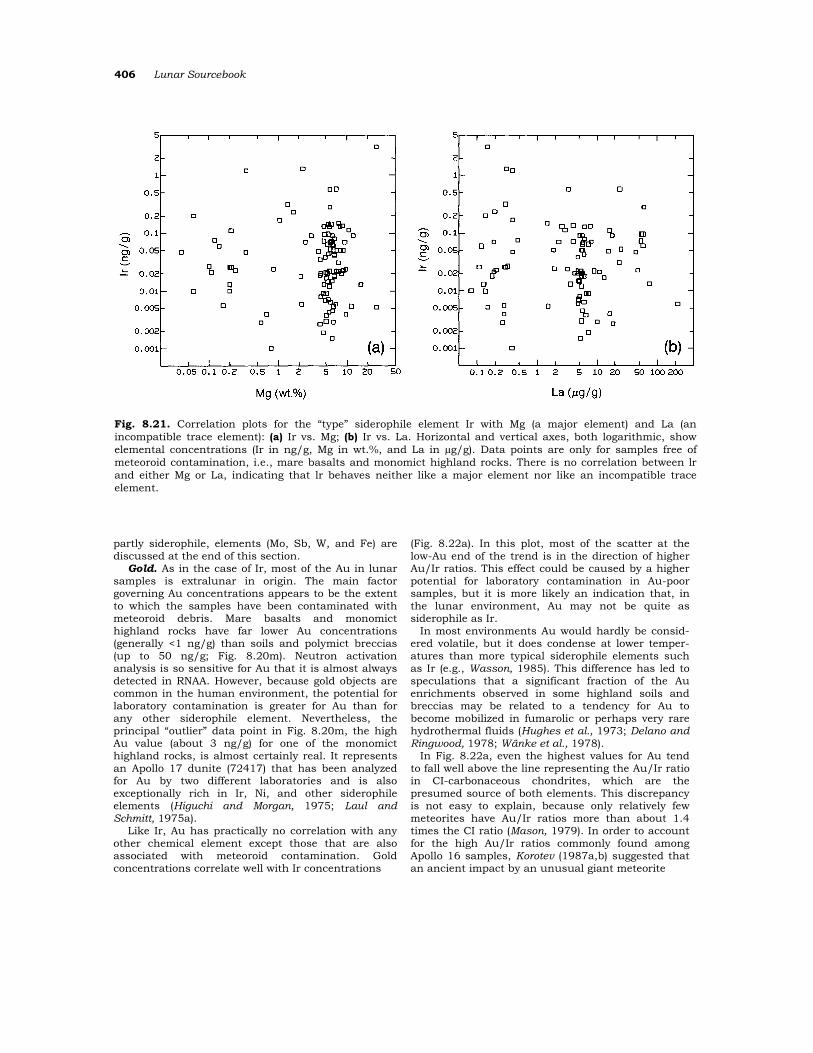
406 Lunar Sourcebook
Fig. 8.21. Correlation plots for the “type” siderophile element Ir with Mg (a major element) and La (an incompatible trace element): (a) Ir vs. Mg; (b) Ir vs. La. Horizontal and vertical axes, both logarithmic, show elemental concentrations (Ir in ng/g, Mg in wt.%, and La in µg/g). Data points are only for samples free of meteoroid contamination, i.e., mare basalts and monomict highland rocks. There is no correlation between lr and either Mg or La, indicating that lr behaves neither like a major element nor like an incompatible trace element.
partly siderophile, elements (Mo, Sb, W, and Fe) are discussed at the end of this section.
Gold. As in the case of Ir, most of the Au in lunar samples is extralunar in origin. The main factor governing Au concentrations appears to be the extent to which the samples have been contaminated with meteoroid debris. Mare basalts and monomict highland rocks have far lower Au concentrations (generally <1 ng/g) than soils and polymict breccias (up to 50 ng/g; Fig. 8.20m). Neutron activation analysis is so sensitive for Au that it is almost always detected in RNAA. However, because gold objects are common in the human environment, the potential for laboratory contamination is greater for Au than for any other siderophile element. Nevertheless, the principal “outlier” data point in Fig. 8.20m, the high Au value (about 3 ng/g) for one of the monomict highland rocks, is almost certainly real. It represents an Apollo 17 dunite (72417) that has been analyzed for Au by two different laboratories and is also exceptionally rich in Ir, Ni, and other siderophile elements (Higuchi and Morgan, 1975; Laul and Schmitt, 1975a).
Like Ir, Au has practically no correlation with any other chemical element except those that are also associated with meteoroid contamination. Gold concentrations correlate well with Ir concentrations
(Fig. 8.22a). In this plot, most of the scatter at the low-Au end of the trend is in the direction of higher Au/Ir ratios. This effect could be caused by a higher potential for laboratory contamination in Au-poor samples, but it is more likely an indication that, in the lunar environment, Au may not be quite as siderophile as Ir.
In most environments Au would hardly be consid-ered volatile, but it does condense at lower temper-atures than more typical siderophile elements such as Ir (e.g., Wasson, 1985). This difference has led to speculations that a significant fraction of the Au enrichments observed in some highland soils and breccias may be related to a tendency for Au to become mobilized in fumarolic or perhaps very rare hydrothermal fluids (Hughes et al., 1973; Delano and Ringwood, 1978; Wänke et al., 1978).
In Fig. 8.22a, even the highest values for Au tend to fall well above the line representing the Au/Ir ratio in CI-carbonaceous chondrites, which are the presumed source of both elements. This discrepancy is not easy to explain, because only relatively few meteorites have Au/Ir ratios more than about 1.4 times the CI ratio (Mason, 1979). In order to account for the high Au/Ir ratios commonly found among Apollo 16 samples, Korotev (1987a,b) suggested that an ancient impact by an unusual giant meteorite

Lunar Chemistry 407
Fig. 8.22. Correlation plots for the “type” siderophile element lr with other siderophile elements (Au, Os, Re, and Pd) for a range of lunar sample materials. (a) Au vs. Ir; (b) Os vs. Ir; (c) Re vs. Ir; (d) Pd vs. Ir. Horizontal and vertical axes, both logarithmic, show elemental concentrations (in ng/g). Data points are for all types of lunar materials, monomict and polymict. The diagonal line indicates the “standard” elemental ratios characteristic of CI-type carbonaceous chondrites (Anders and Ebihara, 1982). Iridium shows good correlations with all the other siderophile elements (especially with Os), indicating that they behave as a chemically coherent group. The Ir-Au, Ir-Re, and Ir-Pd correlations deviate from the CI line at low Ir concentrations, trending to higher Au, Re, and Pd values above the CI line. This may be because of the tendency for these elements to be less siderophile than lr during lunar igneous processes.

408 Lunar Sourcebook
(with a high Au/Ir ratio, similar to the rare Emsland iron meteorite) enriched the breccias near the Apollo 16 site in Au relative to Ir.
It is also possible, however, that our knowledge of Au distributions in all rocks of the lunar highlands is still too limited to determine the real cause of the lunar Au/Ir ratios. Eucritic meteorites, which are basaltic rocks that generally have siderophile-element concentrations (and many other compositional features) similar to those of monomict mafic lunar rocks, are known to have relatively high Au concentrations, e.g., 4.6 ng/g in the Lakangaon meteorite (Warren and Jerde, 1987), 7 ng/g in Juvinas (Morgan et al., 1978), and 9 ng/g in Cachari (Palme et al., 1978). Thus, the evidence from the few small monomict rocks that have been analyzed (Fig. 8.20m) notwithstanding, it remains conceivable that the lunar highland crust contains abundant monomict rocks with Au concentrations >>1 ng/g.
Platinum. Very few data have been reported for Pt because of difficulty in analyzing for it. Vinogradov (1973) reported a Pt concentration of ~50 ng/g for Luna 16 soil. Kolesov and Surkov (1980) reported values of 6–7 ng/g (average 6.7 ng/g) for Luna 24 soil. Considering that the Pt/Ir ratios of meteorites are generally in the range l.7–3.0 (Mason, 1979), these Pt data, especially for the Luna 24 soil, are quite plausible. However, the Pt data reported by Kolesov and Surkov (1980) for Luna 24 mare basalts (7–8 ng/g) are probably spuriously high. Palme et al. (1978) determined the Pt contents of two uncommonly Ir-rich highland polymict breccias to be 60 and 130 ng/g, with an estimated precision of 40% relative. Based on this scanty database, the distribution of Pt among lunar samples appears similar to that of Ir, except that Pt concentrations tend to be roughly 2 times higher.
Osmium. Osmium is another element that is difficult to detect in lunar samples, even using RNAA. Consequently, the database for Os is sparse (Fig. 8.20k). Nevertheless, Os clearly tends to follow the same distribution pattern as Ir, and Os concentrations in mare basalts and monomict highland rocks are far lower than those in soils and polymict breccias. The correlation between Os and Ir is excellent (Fig. 8.22b). The most striking outlier in the Os data (Fig. 8.20k, column HMCT), a concentration of 0.95 ng/g for an Apollo 15 monomict rock, is probably reliable. This point represents the anorthosite sample discussed above (sample 15363; section 8.6.2), which has extraordinarily high concentrations of Fe-metal, Ir, and other siderophile elements. For monomict rocks, the Os data shown in Fig. 8.20k are potentially misleading because they represent the only monomict rocks in which the Os concentration was measured. Seventeen samples for
which only Os upper limits could be established were omitted. These include 12 mare basalts, mostly low-Ti varieties from the Apollo 12 and 15 sites, in which Os upper limits range from <0.01 to <0.06 ng/g, and 5 monomict highland rocks, in which Os upper limits range from <0.003 to <0.03 ng/g, all reported by Wolf et al. (1979).
Rhenium. Rhenium also shows a distribution pattern much like that of Ir, and Re concentrations in mare basalts and monomict highland rocks are also far lower than in meteoroid-”contaminated” soils and polymict breccias (Fig. 8.20j). The correlation between Re and Ir is good, especially for samples with more than about 0.1 ng/g Ir (Fig. 8.22c). The high-Re mare basalt and highland monomict rock outliers in Fig. 8.20j call for special attention. The data point for the high-Re Apollo 15 mare basalt (representing sample 15536) is suspiciously higher than all other mare basalt data, but this analysis is recent (Warren et al, 1987) and considered reliable. The highest Re value for a monomict highland rock represents the same Apollo 17 dunite (72417) for which high but reliable Ir and Au values have been determined, as noted above. The exceptionally low Re value among the Apollo 17 S&RB data represents the orange-glass pyroclastic deposit, which is actually not a soil but a mare eruptive unit, with low concentrations of most meteoroid-derived siderophile elements. The two Re data points for Luna 16 soil are surprisingly high, particularly in view of the only moderate Ir and Au contents of the same analyzed samples (Figs. 8.20l,m), but these data (Laul et al., 1972b) are also believed reliable.
Like Ir, Re has virtually no correlation with any nonsiderophile element in monomict lunar rocks. In particular, there is no correlation between Re and the incompatible trace element La among monomict rocks. Gros et al. (1976) claimed to detect a weak correlation between Re and Cs among 18 monomict highland rocks, but they omitted the Apollo 17 dunite (72417) from their data; restoring this one high-Re, moderate-Cs datum destroys the apparent correlation. Plots of Re vs. such major elements as Al, Mg, or Fe in mare basalts and monomict highland rocks likewise yield only random distributions.
In Fig. 8.20j, the highland monomict rocks seem to have generally higher Re concentrations than mare basalts. However, this pattern is at least partly the result of higher detection limits (i.e., failures to detect Re) among monomict highland rocks than among mare basalts. This situation in turn reflects the fact that different laboratories (using different nuclear reactors for RNAA) have focused their efforts on different rock types. Considering this source of bias, the data show little indication of any real difference
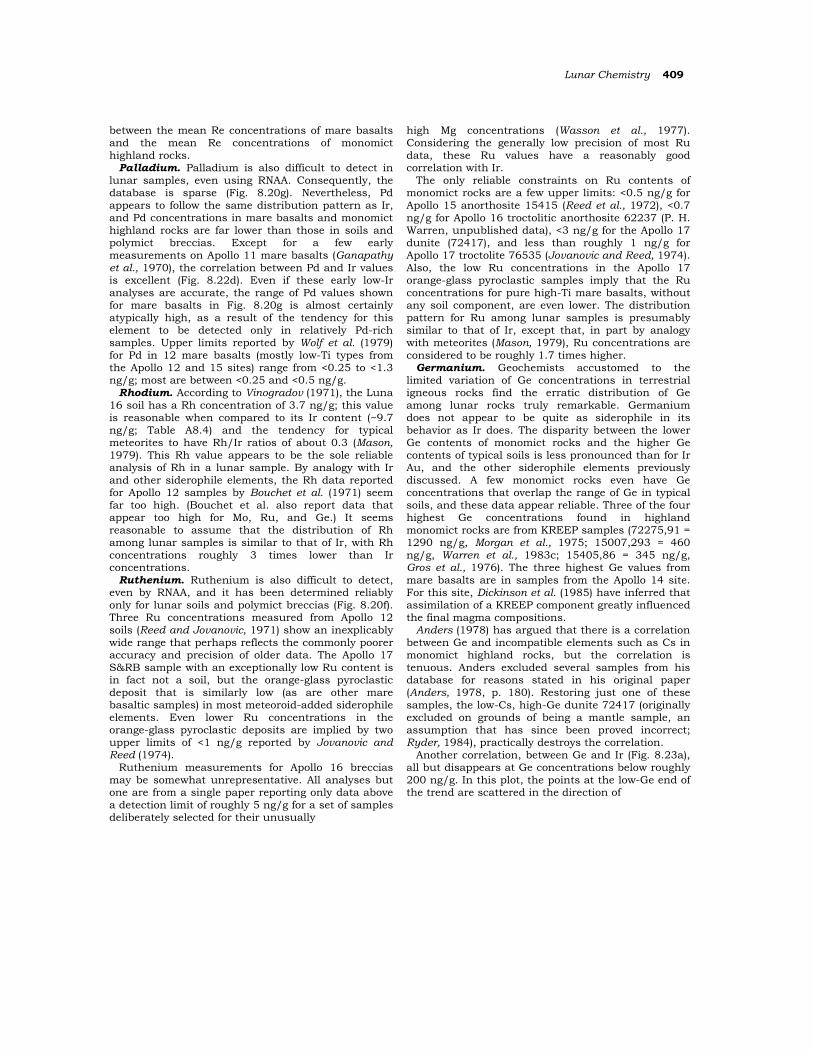
Lunar Chemistry 409
between the mean Re concentrations of mare basalts and the mean Re concentrations of monomict highland rocks.
Palladium. Palladium is also difficult to detect in lunar samples, even using RNAA. Consequently, the database is sparse (Fig. 8.20g). Nevertheless, Pd appears to follow the same distribution pattern as Ir, and Pd concentrations in mare basalts and monomict highland rocks are far lower than those in soils and polymict breccias. Except for a few early measurements on Apollo 11 mare basalts (Ganapathy et al., 1970), the correlation between Pd and Ir values is excellent (Fig. 8.22d). Even if these early low-Ir analyses are accurate, the range of Pd values shown for mare basalts in Fig. 8.20g is almost certainly atypically high, as a result of the tendency for this element to be detected only in relatively Pd-rich samples. Upper limits reported by Wolf et al. (1979) for Pd in 12 mare basalts (mostly low-Ti types from the Apollo 12 and 15 sites) range from <0.25 to <1.3 ng/g; most are between <0.25 and <0.5 ng/g.
Rhodium. According to Vinogradov (1971), the Luna 16 soil has a Rh concentration of 3.7 ng/g; this value is reasonable when compared to its Ir content (~9.7 ng/g; Table A8.4) and the tendency for typical meteorites to have Rh/Ir ratios of about 0.3 (Mason, 1979). This Rh value appears to be the sole reliable analysis of Rh in a lunar sample. By analogy with Ir and other siderophile elements, the Rh data reported for Apollo 12 samples by Bouchet et al. (1971) seem far too high. (Bouchet et al. also report data that appear too high for Mo, Ru, and Ge.) It seems reasonable to assume that the distribution of Rh among lunar samples is similar to that of Ir, with Rh concentrations roughly 3 times lower than Ir concentrations.
Ruthenium. Ruthenium is also difficult to detect, even by RNAA, and it has been determined reliably only for lunar soils and polymict breccias (Fig. 8.20f). Three Ru concentrations measured from Apollo 12 soils (Reed and Jovanovic, 1971) show an inexplicably wide range that perhaps reflects the commonly poorer accuracy and precision of older data. The Apollo 17 S&RB sample with an exceptionally low Ru content is in fact not a soil, but the orange-glass pyroclastic deposit that is similarly low (as are other mare basaltic samples) in most meteoroid-added siderophile elements. Even lower Ru concentrations in the orange-glass pyroclastic deposits are implied by two upper limits of <1 ng/g reported by Jovanovic and Reed (1974).
Ruthenium measurements for Apollo 16 breccias may be somewhat unrepresentative. All analyses but one are from a single paper reporting only data above a detection limit of roughly 5 ng/g for a set of samples deliberately selected for their unusually
high Mg concentrations (Wasson et al., 1977). Considering the generally low precision of most Ru data, these Ru values have a reasonably good correlation with Ir.
The only reliable constraints on Ru contents of monomict rocks are a few upper limits: <0.5 ng/g for Apollo 15 anorthosite 15415 (Reed et al., 1972), <0.7 ng/g for Apollo 16 troctolitic anorthosite 62237 (P. H. Warren, unpublished data), <3 ng/g for the Apollo 17 dunite (72417), and less than roughly 1 ng/g for Apollo 17 troctolite 76535 (Jovanovic and Reed, 1974). Also, the low Ru concentrations in the Apollo 17 orange-glass pyroclastic samples imply that the Ru concentrations for pure high-Ti mare basalts, without any soil component, are even lower. The distribution pattern for Ru among lunar samples is presumably similar to that of Ir, except that, in part by analogy with meteorites (Mason, 1979), Ru concentrations are considered to be roughly 1.7 times higher.
Germanium. Geochemists accustomed to the limited variation of Ge concentrations in terrestrial igneous rocks find the erratic distribution of Ge among lunar rocks truly remarkable. Germanium does not appear to be quite as siderophile in its behavior as Ir does. The disparity between the lower Ge contents of monomict rocks and the higher Ge contents of typical soils is less pronounced than for Ir Au, and the other siderophile elements previously discussed. A few monomict rocks even have Ge concentrations that overlap the range of Ge in typical soils, and these data appear reliable. Three of the four highest Ge concentrations found in highland monomict rocks are from KREEP samples (72275,91 = 1290 ng/g, Morgan et al., 1975; 15007,293 = 460 ng/g, Warren et al., 1983c; 15405,86 = 345 ng/g, Gros et al., 1976). The three highest Ge values from mare basalts are in samples from the Apollo 14 site. For this site, Dickinson et al. (1985) have inferred that assimilation of a KREEP component greatly influenced the final magma compositions.
Anders (1978) has argued that there is a correlation between Ge and incompatible elements such as Cs in monomict highland rocks, but the correlation is tenuous. Anders excluded several samples from his database for reasons stated in his original paper (Anders, 1978, p. 180). Restoring just one of these samples, the low-Cs, high-Ge dunite 72417 (originally excluded on grounds of being a mantle sample, an assumption that has since been proved incorrect; Ryder, 1984), practically destroys the correlation.
Another correlation, between Ge and Ir (Fig. 8.23a), all but disappears at Ge concentrations below roughly 200 ng/g. In this plot, the points at the low-Ge end of the trend are scattered in the direction of
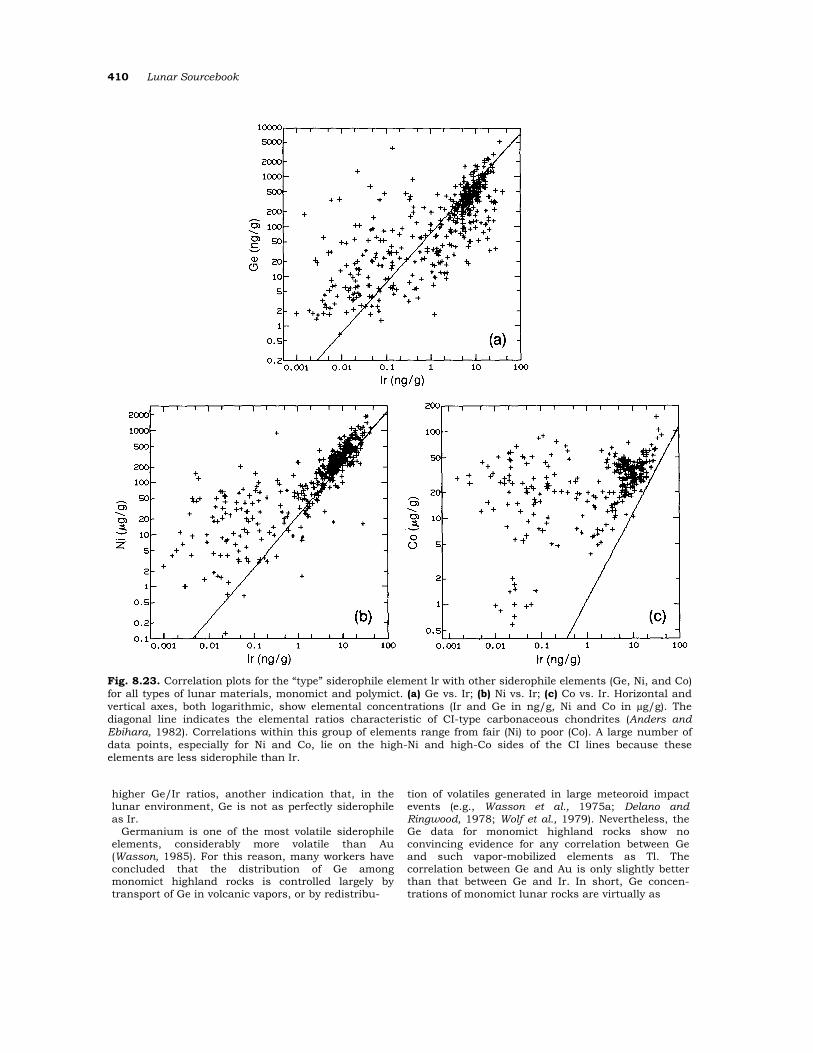
410 Lunar Sourcebook
Fig. 8.23. Correlation plots for the “type” siderophile element lr with other siderophile elements (Ge, Ni, and Co) for all types of lunar materials, monomict and polymict. (a) Ge vs. Ir; (b) Ni vs. Ir; (c) Co vs. Ir. Horizontal and vertical axes, both logarithmic, show elemental concentrations (Ir and Ge in ng/g, Ni and Co in µg/g). The diagonal line indicates the elemental ratios characteristic of CI-type carbonaceous chondrites (Anders and Ebihara, 1982). Correlations within this group of elements range from fair (Ni) to poor (Co). A large number of data points, especially for Ni and Co, lie on the high-Ni and high-Co sides of the CI lines because these elements are less siderophile than Ir.
higher Ge/Ir ratios, another indication that, in the lunar environment, Ge is not as perfectly siderophile as Ir.
Germanium is one of the most volatile siderophile elements, considerably more volatile than Au (Wasson, 1985). For this reason, many workers have concluded that the distribution of Ge among monomict highland rocks is controlled largely by transport of Ge in volcanic vapors, or by redistribu-
tion of volatiles generated in large meteoroid impact events (e.g., Wasson et al., 1975a; Delano and Ringwood, 1978; Wolf et al., 1979). Nevertheless, the Ge data for monomict highland rocks show no convincing evidence for any correlation between Ge and such vapor-mobilized elements as Tl. The correlation between Ge and Au is only slightly better than that between Ge and Ir. In short, Ge concen-trations of monomict lunar rocks are virtually as

Lunar Chemistry 411
erratic as their Ir concentrations. Probably the best way to estimate the Ge concentration of a monomict rock would be to determine Au (or one of the other extremely siderophile elements) and then assume that the Ge/Au ratio is between 5 and 500.
Nickel. Nickel does not appear to be quite as siderophile in the lunar crust as its high value of Dm/s (Table 8.4) would suggest. However, as with other siderophile elements, the contrast in Ni concentra-tions between monomict rock types and soils is substantial (Fig. 8.20c). As for many other highly siderophile elements, the Ni database is potentially misleading because the concentrations of Ni in many monomict rocks are below analytical detection limits. In order to include as many reliable determinations of Ni in Apollo 11 mare basalts as possible, our usual database (Table A8.4) was expanded to include the early analyses of Annell and Helz (1970) and G. M. Brown et al. (1970). Most monomict rocks have Ni concentrations within about a factor of 20 of typical soil concentrations. In fact, several monomict highland rocks (dunites) have higher Ni concentrations than most soils, reflecting the fact that in solid-melt equilibria, mafic silicate minerals (such as the olivine that makes up the dunite) are receptive hosts for Ni. The crystal/melt distribution coefficients measured for Ni have a strong inverse correlation with temperature, but at a typical magmatic temperature of 1200°C they are about 10–20 for olivine and roughly 5 for both low-Ca and high-Ca pyroxene (Irving, 1978).
There is a correlation between Ni and Ir (Fig. 8.23b), but it breaks down at Ni concentrations lower than about 50–100 µg/g. Below these values, the data points scatter almost entirely in the direction of higher Ni/Ir ratios. Data points showing this “surplus” Ni are mostly from monomict rocks with Mg contents greater than about 5 wt.%. The overall Ni-Mg correlation for monomict rocks (Fig. 8.24a) is weak, although better than the random distributions displayed by Ir and the other comparably siderophile elements. The high-Ti mare basalts common at the Apollo 11 and 17 sites have lower Ni concentrations than do the low-Ti mare basalts that predominate at the other sampled sites.
The average Ni concentration of the original lunar crust has been a topic of great controversy. E. A. Ringwood, H. Wänke, and their coworkers (e.g., Delano and Ringwood, 1978; Wänke et al., 1978; Ringwood et al., 1987) have speculated that the existing suite of monomict highland rock samples, for which Ni concentrations are mostly <100 µg/g, may be grossly unrepresentative for Ni. Instead, they argue that the average pristine Ni concentration of the highland crust (i.e., the average Ni concentration that would be found for a representative suite of
monomict highland rocks) may be several hundred micrograms per gram. In support of this idea, these authors have cited the high Ni concentrations, and especially the high Ni/Ir ratios, found in many Apollo 16 polymict breccias (Fig. 8.23b). However, their model for interpreting these enrichments is far from universally accepted (for contrasting views, see Warren et al., 1989; Anders, 1978; Warren and Wasson, 1978; Wolf et al., 1979; Ryder, 1979; Korotev, 1987a,b). As the data in Table A8.4 indicate, the high Ni concentrations (and Ni/lr ratios) typical of Apollo 16 soils are not matched by other highland regolith samples, e.g., those from the Luna 20 highland site or from the (unknown) site(s) that produced the Antarctic lunar meteorites, almost all of which are nearly pure highland regoliths with major-element compositions similar to those of Apollo 16 soils.
Cobalt. Cobalt is decidedly less siderophile than any of the elements discussed above (see Table 8.4). Mare basalts, which are monomict rocks, have a range of Co concentrations little different from those of mare soils (Fig. 8.20b). The Co concentrations of monomict highland rocks tend to be much lower, but the two exceptionally high values in Fig. 8.20b are definitely reliable. These two values represent the same dunites that have anomalously high contents of Ni (see discussion of Ni above).
Cobalt is not closely correlated with other side-rophile elements. Only among soils and breccias with very high Ir concentrations can any correlation between Co and Ir be discerned (Fig. 8.23c). There is a better, but inverse, correlation between Co and Al in monomict samples, except at high Al concentrations (Fig. 8.24b), similar to the correlation with Al shown by the miscellaneous minor elements Sc, V, Cr, and Mn (Fig. 8.17). There are reasonably strong correlations between Co and both Mg and Fe, and these mainly reflect the tendency for Co to partition into Fe- and Mg-rich minerals during igneous differentiation. There are no significant correlations between Co and incompatible trace elements such as La. As with Ni, the high-Ti mare basalts common at the Apollo 11 and 17 sites have lower Co concentrations than do the low-Ti mare basalts that predominate at the other sampled sites.
Molybdenum. Molybdenum is an element that is only seldom, and with great difficulty, determined for lunar samples. As discussed by Newsom (1986), more than half of all the published data for Mo in lunar samples appear to be unreliable. The few reliable data show little difference between mare basalts (which are monomict samples) and mare soils (Fig. 8.20e). Based on analogy with terrestrial rocks, Newsom (1986) suggested that Mo concentrations of lunar samples (which seldom contain more
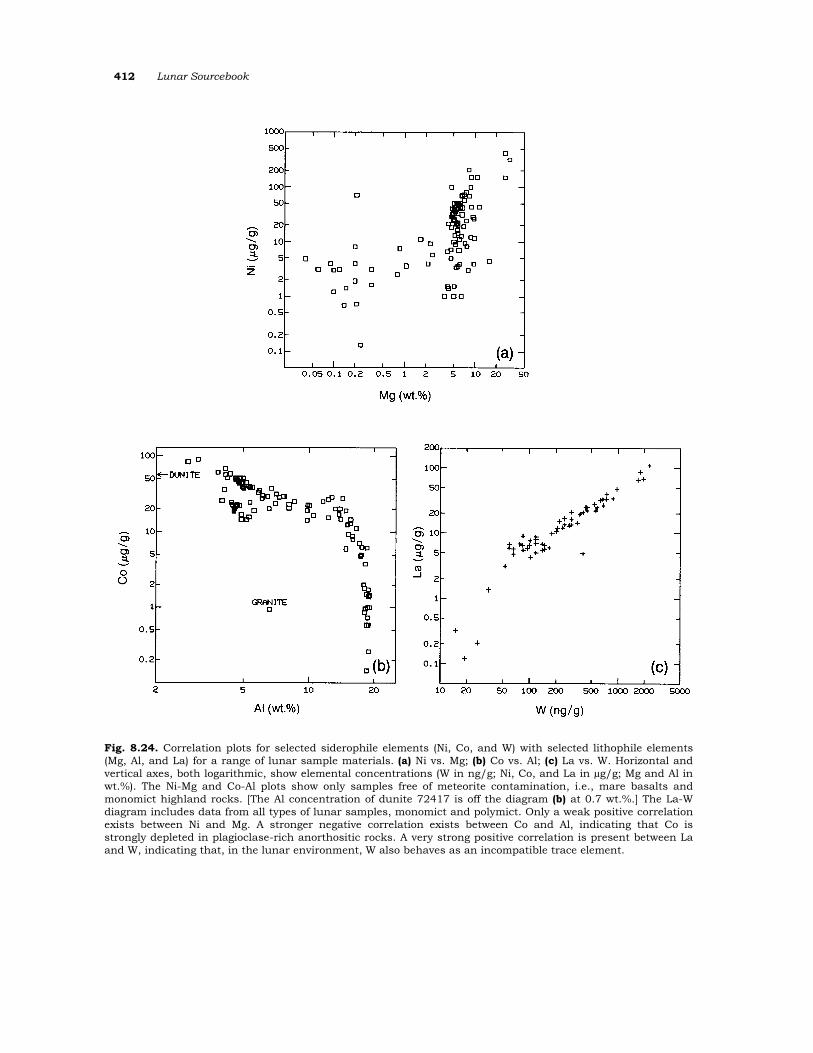
412 Lunar Sourcebook
Fig. 8.24. Correlation plots for selected siderophile elements (Ni, Co, and W) with selected lithophile elements (Mg, Al, and La) for a range of lunar sample materials. (a) Ni vs. Mg; (b) Co vs. Al; (c) La vs. W. Horizontal and vertical axes, both logarithmic, show elemental concentrations (W in ng/g; Ni, Co, and La in µg/g; Mg and Al in wt.%). The Ni-Mg and Co-Al plots show only samples free of meteorite contamination, i.e., mare basalts and monomict highland rocks. [The Al concentration of dunite 72417 is off the diagram (b) at 0.7 wt.%.] The La-W diagram includes data from all types of lunar samples, monomict and polymict. Only a weak positive correlation exists between Ni and Mg. A stronger negative correlation exists between Co and Al, indicating that Co is strongly depleted in plagioclase-rich anorthositic rocks. A very strong positive correlation is present between La and W, indicating that, in the lunar environment, W also behaves as an incompatible trace element.
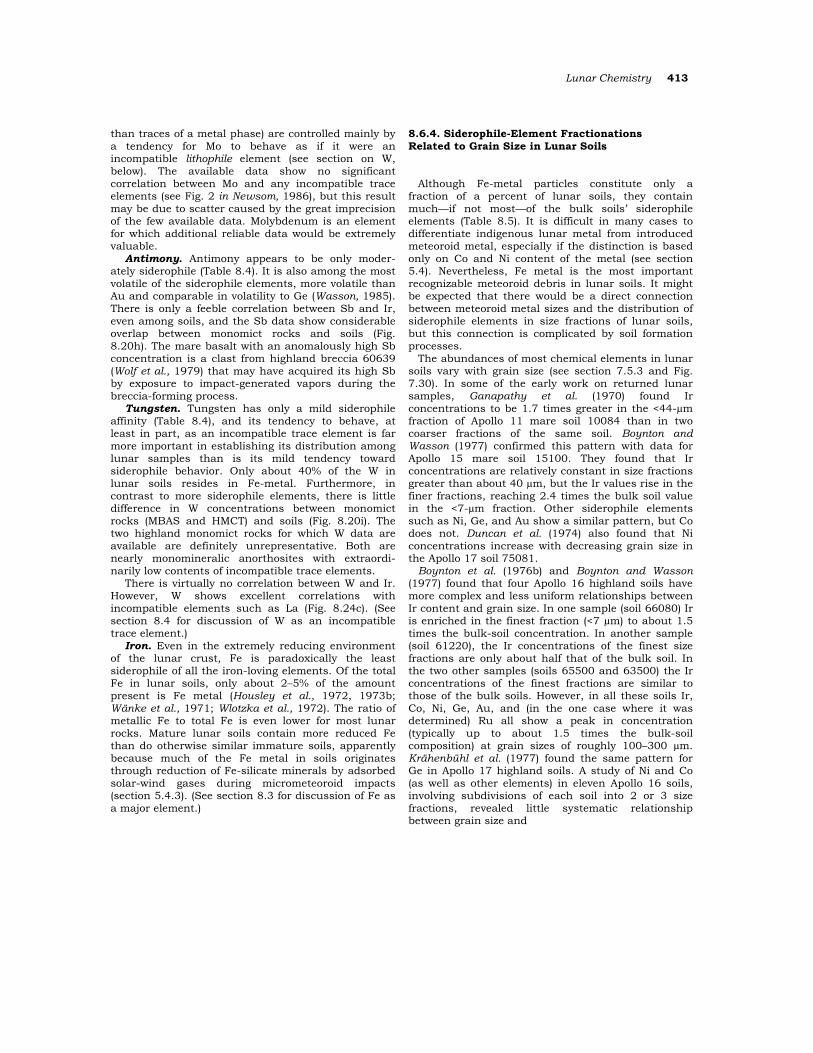
Lunar Chemistry 413
than traces of a metal phase) are controlled mainly by a tendency for Mo to behave as if it were an incompatible lithophile element (see section on W, below). The available data show no significant correlation between Mo and any incompatible trace elements (see Fig. 2 in Newsom, 1986), but this result may be due to scatter caused by the great imprecision of the few available data. Molybdenum is an element for which additional reliable data would be extremely valuable.
Antimony. Antimony appears to be only moder-ately siderophile (Table 8.4). It is also among the most volatile of the siderophile elements, more volatile than Au and comparable in volatility to Ge (Wasson, 1985). There is only a feeble correlation between Sb and Ir, even among soils, and the Sb data show considerable overlap between monomict rocks and soils (Fig. 8.20h). The mare basalt with an anomalously high Sb concentration is a clast from highland breccia 60639 (Wolf et al., 1979) that may have acquired its high Sb by exposure to impact-generated vapors during the breccia-forming process.
Tungsten. Tungsten has only a mild siderophile affinity (Table 8.4), and its tendency to behave, at least in part, as an incompatible trace element is far more important in establishing its distribution among lunar samples than is its mild tendency toward siderophile behavior. Only about 40% of the W in lunar soils resides in Fe-metal. Furthermore, in contrast to more siderophile elements, there is little difference in W concentrations between monomict rocks (MBAS and HMCT) and soils (Fig. 8.20i). The two highland monomict rocks for which W data are available are definitely unrepresentative. Both are nearly monomineralic anorthosites with extraordi-narily low contents of incompatible trace elements.
There is virtually no correlation between W and Ir. However, W shows excellent correlations with incompatible elements such as La (Fig. 8.24c). (See section 8.4 for discussion of W as an incompatible trace element.)
Iron. Even in the extremely reducing environment of the lunar crust, Fe is paradoxically the least siderophile of all the iron-loving elements. Of the total Fe in lunar soils, only about 2–5% of the amount present is Fe metal (Housley et al., 1972, 1973b; Wänke et al., 1971; Wlotzka et al., 1972). The ratio of metallic Fe to total Fe is even lower for most lunar rocks. Mature lunar soils contain more reduced Fe than do otherwise similar immature soils, apparently because much of the Fe metal in soils originates through reduction of Fe-silicate minerals by adsorbed solar-wind gases during micrometeoroid impacts (section 5.4.3). (See section 8.3 for discussion of Fe as a major element.)
8.6.4. Siderophile-Element Fractionations Related to Grain Size in Lunar Soils
Although Fe-metal particles constitute only a fraction of a percent of lunar soils, they contain much—if not most—of the bulk soils’ siderophile elements (Table 8.5). It is difficult in many cases to differentiate indigenous lunar metal from introduced meteoroid metal, especially if the distinction is based only on Co and Ni content of the metal (see section 5.4). Nevertheless, Fe metal is the most important recognizable meteoroid debris in lunar soils. It might be expected that there would be a direct connection between meteoroid metal sizes and the distribution of siderophile elements in size fractions of lunar soils, but this connection is complicated by soil formation processes.
The abundances of most chemical elements in lunar soils vary with grain size (see section 7.5.3 and Fig. 7.30). In some of the early work on returned lunar samples, Ganapathy et al. (1970) found Ir concentrations to be 1.7 times greater in the <44-µm fraction of Apollo 11 mare soil 10084 than in two coarser fractions of the same soil. Boynton and Wasson (1977) confirmed this pattern with data for Apollo 15 mare soil 15100. They found that Ir concentrations are relatively constant in size fractions greater than about 40 µm, but the Ir values rise in the finer fractions, reaching 2.4 times the bulk soil value in the <7-µm fraction. Other siderophile elements such as Ni, Ge, and Au show a similar pattern, but Co does not. Duncan et al. (1974) also found that Ni concentrations increase with decreasing grain size in the Apollo 17 soil 75081.
Boynton et al. (1976b) and Boynton and Wasson (1977) found that four Apollo 16 highland soils have more complex and less uniform relationships between Ir content and grain size. In one sample (soil 66080) Ir is enriched in the finest fraction (<7 µm) to about 1.5 times the bulk-soil concentration. In another sample (soil 61220), the Ir concentrations of the finest size fractions are only about half that of the bulk soil. In the two other samples (soils 65500 and 63500) the Ir concentrations of the finest fractions are similar to those of the bulk soils. However, in all these soils Ir, Co, Ni, Ge, Au, and (in the one case where it was determined) Ru all show a peak in concentration (typically up to about 1.5 times the bulk-soil composition) at grain sizes of roughly 100–300 µm. Krähenbühl et al. (1977) found the same pattern for Ge in Apollo 17 highland soils. A study of Ni and Co (as well as other elements) in eleven Apollo 16 soils, involving subdivisions of each soil into 2 or 3 size fractions, revealed little systematic relationship between grain size and
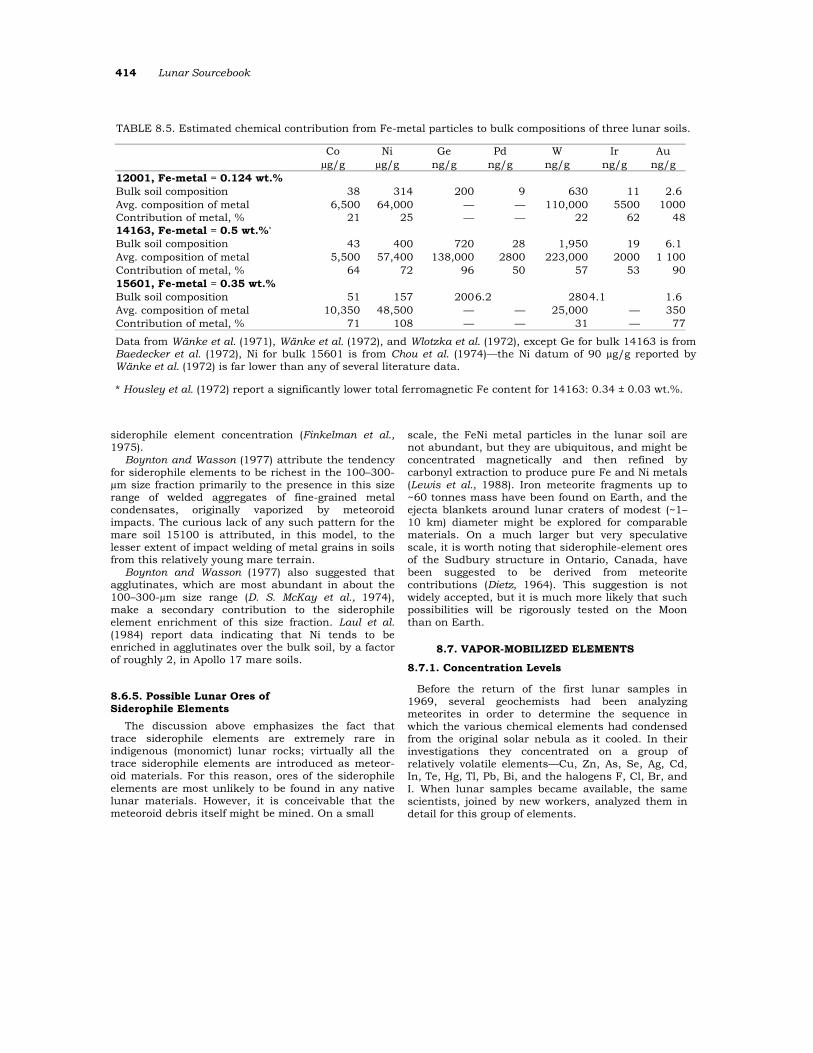
414 Lunar Sourcebook
TABLE 8.5. Estimated chemical contribution from Fe-metal particles to bulk compositions of three lunar soils.
Co
µg/g Ni
µg/g Ge
ng/g Pd
ng/g W
ng/g Ir
ng/g Au
ng/g
12001, Fe-metal = 0.124 wt.% Bulk soil composition 38 314 200 9 630 11 2.6 Avg. composition of metal 6,500 64,000 — — 110,000 5500 1000Contribution of metal, % 21 25 — — 22 62 4814163, Fe-metal = 0.5 wt.%* Bulk soil composition 43 400 720 28 1,950 19 6.1 Avg. composition of metal 5,500 57,400 138,000 2800 223,000 2000 1 100Contribution of metal, % 64 72 96 50 57 53 9015601, Fe-metal = 0.35 wt.% Bulk soil composition 51 157 2006.2 2804.1 1.6 Avg. composition of metal 10,350 48,500 — — 25,000 — 350Contribution of metal, % 71 108 — — 31 — 77
Data from Wänke et al. (1971), Wänke et al. (1972), and Wlotzka et al. (1972), except Ge for bulk 14163 is from Baedecker et al. (1972), Ni for bulk 15601 is from Chou et al. (1974)—the Ni datum of 90 µg/g reported by Wänke et al. (1972) is far lower than any of several literature data.
* Housley et al. (1972) report a significantly lower total ferromagnetic Fe content for 14163: 0.34 ± 0.03 wt.%.
siderophile element concentration (Finkelman et al., 1975).
Boynton and Wasson (1977) attribute the tendency for siderophile elements to be richest in the 100–300-µm size fraction primarily to the presence in this size range of welded aggregates of fine-grained metal condensates, originally vaporized by meteoroid impacts. The curious lack of any such pattern for the mare soil 15100 is attributed, in this model, to the lesser extent of impact welding of metal grains in soils from this relatively young mare terrain.
Boynton and Wasson (1977) also suggested that agglutinates, which are most abundant in about the 100–300-µm size range (D. S. McKay et al., 1974), make a secondary contribution to the siderophile element enrichment of this size fraction. Laul et al. (1984) report data indicating that Ni tends to be enriched in agglutinates over the bulk soil, by a factor of roughly 2, in Apollo 17 mare soils.
8.6.5. Possible Lunar Ores of Siderophile Elements
The discussion above emphasizes the fact that trace siderophile elements are extremely rare in indigenous (monomict) lunar rocks; virtually all the trace siderophile elements are introduced as meteor-oid materials. For this reason, ores of the siderophile elements are most unlikely to be found in any native lunar materials. However, it is conceivable that the meteoroid debris itself might be mined. On a small
scale, the FeNi metal particles in the lunar soil are not abundant, but they are ubiquitous, and might be concentrated magnetically and then refined by carbonyl extraction to produce pure Fe and Ni metals (Lewis et al., 1988). Iron meteorite fragments up to ~60 tonnes mass have been found on Earth, and the ejecta blankets around lunar craters of modest (~1–10 km) diameter might be explored for comparable materials. On a much larger but very speculative scale, it is worth noting that siderophile-element ores of the Sudbury structure in Ontario, Canada, have been suggested to be derived from meteorite contributions (Dietz, 1964). This suggestion is not widely accepted, but it is much more likely that such possibilities will be rigorously tested on the Moon than on Earth.
8.7. VAPOR-MOBILIZED ELEMENTS
8.7.1. Concentration Levels
Before the return of the first lunar samples in 1969, several geochemists had been analyzing meteorites in order to determine the sequence in which the various chemical elements had condensed from the original solar nebula as it cooled. In their investigations they concentrated on a group of relatively volatile elements—Cu, Zn, As, Se, Ag, Cd, In, Te, Hg, Tl, Pb, Bi, and the halogens F, Cl, Br, and I. When lunar samples became available, the same scientists, joined by new workers, analyzed them in detail for this group of elements.

Lunar Chemistry 415
Although most of these elements are not gases under normal conditions, they are more easily volatilized than most elements in meteorites and lunar rocks. In much of the literature, these elements have been called “volatile elements” or simply “volatiles.” To avoid confusion with more conventionally volatile species (H, He, other noble gases, C, and N), the group of elements described in this section is called the vapor-mobilized elements because they tend to be transferred from solid materials into a coexisting vapor phase at relatively moderate temperatures.
Before lunar samples were available, geochemists had determined that the Earth, the differentiated (achondritic) meteorites, and most types of chondritic meteorites were depleted in these vapor-mobilized elements relative to such standards of original solar-system composition as the atmosphere of the sun and the most primitive (e.g., type CI) carbonaceous meteorites.
For lunar materials, it is convenient to treat these elements as a single group. However, this group includes chemically diverse elements, and their chemical behavior is not as coherent as that of the lithophile and siderophile element groups. The only characteristics common to all the elements of this group (and to the alkali metals Na, K, Rb, and Cs) are relative volatility and consequent low abundance in the Moon. Under some circumstances, the behavior of most of the vapor-mobilized elements resembles that of siderophile elements; in other cases they behave like lithophile elements; and in still other cases the vapor-mobilized elements simply do not behave as a coherent group.
Figure 8.25 shows the concentrations of vapor-mobilized elements in lunar samples. Statistical summaries of the data are given in Table A8.5. The low concentrations of vapor-mobilized elements in all lunar materials (Fig.8.25) were immediately apparent when the first lunar samples were analyzed. For example, Keays et al. (1970) reported that concentrations of Cs, Cd, Ag, Bi, Tl, and Br were below 1 µg/g in Apollo 11 mare basalts and those of Zn, Cu, and Rb were not more than a few micrograms per gram, values that were extremely low relative to typical terrestrial basalts. In addition, they found that concentrations of those elements in polymict samples (soils and regolith breccias) were higher than in the monomict mare basalts from the same site by factors ranging from about 1.5 to 20. This pattern of higher concentrations of vapor-mobilized elements in lunar soils than in the local crystalline rocks was eventually found in samples from all lunar sites.
This apparent depletion of vapor-mobilized elements in all lunar rocks was a discovery that had
major implications for understanding the origin of the Moon. Initially, several questions were asked: Did the Moon have significantly higher amounts of vapor-mobilized elements when it formed? Might not these elements have been subsequently lost from the lunar surface as vapors accompanying ordinary volcanic eruptions when fluid lavas spread across the surface and cooled in the lunar vacuum? Or could they have been lost by the heating and vaporization produced by large impact events, especially those that stirred the lunar crust to depths of tens of kilometers?
A strong argument against all such later losses as the principal reason for the low lunar concentrations of vapor-mobilized elements comes from study of the isotopes of the element Sr. One of its isotopes, 87Sr, is produced by the decay of a long-lived radioisotope of one of the volatile (vapor-mobilized) elements, 87Rb, and this process is used extensively by geochemists to measure the ages of rocks. From numerous studies, particularly of meteorites, we know that the initial ratio of the isotopes 87Sr/86Sr for common solar-system materials was about 0.699. As time passed, this ratio has increased because the decay of any 87Rb present in the planets has added 87Sr to them. Many lunar rocks, especially anorthosites, have 87Sr/86Sr ratios that approach the solar system initial ratio; a few rocks even retain this initial ratio, indicating that virtually no 87Sr has been added to them by 87Rb decay since the Moon formed. The small amount of change in the ratio 87Sr/86Sr in lunar rocks overall indicates that throughout their history the rocks were never exposed to concentrations of 87Rb significantly higher than their present values.
Another argument for originally low concentrations of lunar vapor-mobilized elements is the low ratio of Na to Ca in plagioclase feldspars from samples representative of the bulk of the lunar highlands. If Na, which is a relatively volatile element, had been as abundant in relation to Ca on the Moon as it is on Earth, lunar plagioclase would be more sodic. It is unlikely that the Na could have evaporated from an anorthosite (with composition essentially equivalent to pure feldspar) or from mare lavas without leaving excess silica or especially excess alumina, which we do not observe except in extreme cases of impact-volatilized glasses (Naney et al., 1976; Vaniman, 1990). These results indicate that the Moon’s relative concentrations of Rb, Na, and (by inference) other alkali elements have always been low. The volatility of these elements, leading to losses during high-temperature episodes in the formation of the Moon, seems to be the reason for their relative absence on the Moon. If the volatile alkali elements are depleted in the Moon, it follows

416 Lunar Sourcebook
Fig. 8.25. Concentration ranges of vapor-mobilized elements in various lunar materials: mare basalts (MBAS), highland monomict rocks (HMCT), soils and regolith breccias (S&RB), and polymict breccias (BX). Horizontal axis shows sample types, separated according to individual missions. Vertical axis shows elemental concentrations (in ng/g, µg/g, or wt.%). Note that all vertical axes are logarithmic except for S. (a) Graphical key to the plots and abbreviations. Data are presented for (b) fluorine, F; (c) sulfur, S; (d) chlorine, Cl; (e) copper, Cu; (f) zinc, Zn; (g) arsenic, As; (h) selenium, Se; (i) bromine, Br; (j) silver, Ag; (k) cadmium, Cd; (l) indium, In; (m) tellurium, Te; (n) iodine, I; (o) mercury, Hg; (p) thallium, Tl; (q) lead, Pb; (r) bismuth, Bi. Statistical summaries for most of these plots are provided in Table A8.5. The values for I (n) are only lower limits because most of the measurements have been made only on leachable I rather than on total I.

Lunar Chemistry 417
Fig. 8.25. (continued).
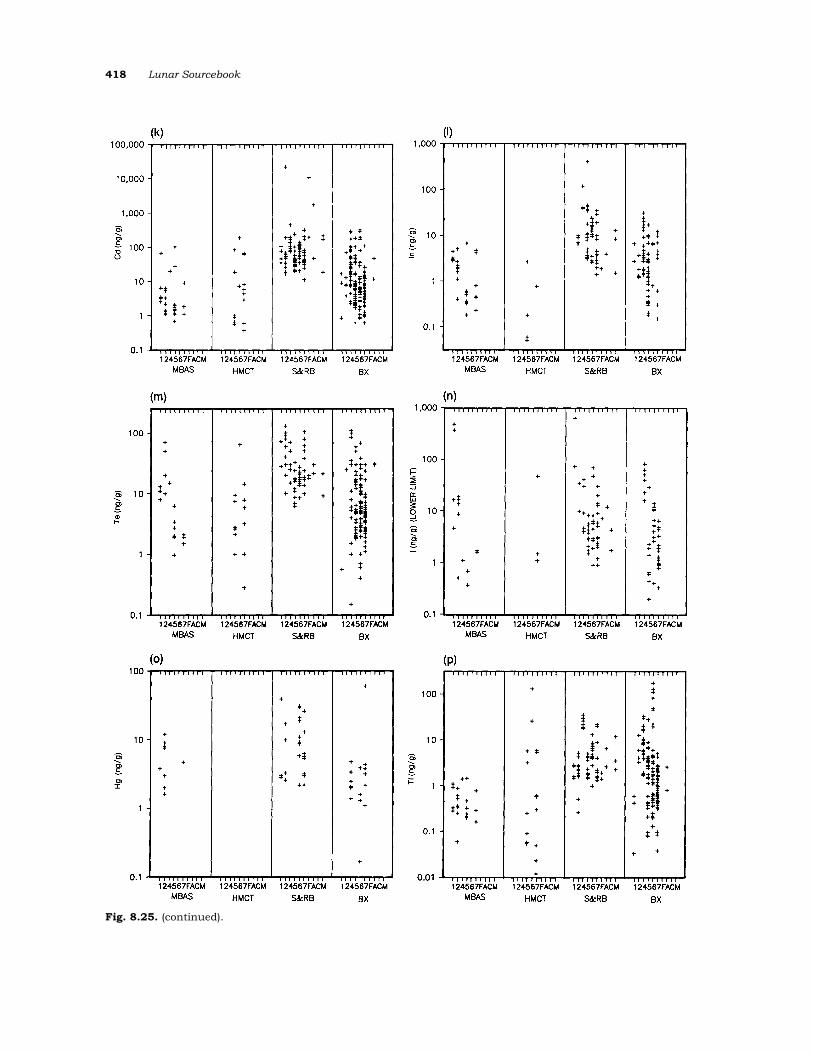
418 Lunar Sourcebook
Fig. 8.25. (continued).

Lunar Chemistry 419
Fig. 8.25. (continued).
that the vapor-mobilized elements should have low concentrations as well.
The different degrees of depletion in vapor-mobilized elements between the Earth and Moon provide clues to their different origins (see Ganapathy et al., 1974). The Moon accreted a lower proportion of material rich in vapor-mobilized elements than did the Earth. Baedecker et al. (1971) suggested that, as the Earth and Moon were accreting, there was a late addition of relatively volatile material to the Earth that the Moon did not capture as efficiently (e.g., Anders, 1968; see also Krähenbühl et al., 1973). Morgan et al. (1972a) noted that the ratios of certain key elements to each other in lunar materials are essentially constant (e.g., Tl/Cs ~ l.2 × 10–2, Cs/U ~ 0.23) and are unlike the ratios in either meteorites or terrestrial basalts. Even more than most elements, the vapor-mobilized elements (such as Tl) reveal that the combination of accretion plus chemical differentiation processes that went on in the Moon were different from those in the Earth. Apparently the Moon had a higher effective “accretion temperature” than the Earth, as indicated by the fact that the Moon has a lower ratio of the more volatile element Tl to the less volatile Cs.
8.7.2. Meteoroid Additions to the Regolith The vapor-mobilized elements, like the siderophile
elements, are more concentrated in lunar soils than in primary igneous rocks (section 8.6). As with the siderophile elements, the addition of vapor-mobilized elements from meteoroids is the main reason for their higher concentrations in the soils. However, unlike the siderophile elements, substantial
amounts of vapor-mobilized elements of indigenous lunar origin are also present in some lunar materials (e.g., Baedecker et al., 1972; Morgan et al., 1972a); these indigenous contributions will be discussed in section 8.7.3. Analyses of the vapor-mobilized elements in lunar rocks and soils provide the raw data for two important areas of investigation. First, any excess of these elements makes it possible to roughly estimate the amount of meteoroid material present in the sample (if corrections can be made for the indigenous component). Second, the pattern of relative abundances makes it possible to identify the chemical variety of meteoroid responsible for the excess.
Nature of the meteoroid component. In most lunar soils of relatively recent age, the meteoroid component most closely matches the CI-type carbonaceous chondrite, a variety of meteorite also believed to represent the original composition of the solid matter of the solar system. Comparisons between lunar materials and CI chondrites are shown in Fig. 8.26, which presents, for 10 vapor-mobilized elements, the ratio between the concentration of the element in lunar materials and the concentration in CI chondrites. The data represent 79 samples of mare basalts (MBAS) and 140 samples of soils, normalized to the standard concentrations in CI carbonaceous meteorites (Mason, 1971). Also shown are concentrations of Au, Ir, and Sb (representative siderophile elements), U (a representative refractory element), and the less-refractory trace elements Rb and Cs.
If all the elements shown in Fig. 8.26 were present in the soils in the same concentrations as in CI chondrites, the tops of all the bars would fall along

420 Lunar Sourcebook
Fig. 8.26. Histograms showing ratios of vapor-mobilized elements in lunar materials, relative to those in standard CI-type carbonaceous chondrites. Data for three siderophile elements (Au, Ir, and Sb) and three incompatible trace elements (Rb, Cs, and U) are included for comparison. (a) Data for lunar soils; (b) data for mare basalt lavas (MBAS). The soils show consistently higher amounts of vapor-mobilized elements than do the mare basalts, indicating that the bulk of vapor-mobilized elements in the soils has been introduced by impacting meteorites rather than derived from the lunar interior. The relative abundances of vapor-mobilized elements in both soils and basalts do not match those in CI chondrites; in general, they are depleted by factors of 10–100. However, the lunar abundances are closer to CI chondrites than to any other meteorite type. Concentrations of the incompatible trace elements (Rb, Cs, and U) in lunar materials are either close to or greater than the CI values. Refractory U shows the strongest enrichments in lunar materials, followed by the heavy alkali elements Rb and Cs. In general, both the incompatible trace elements and the vapor-mobilized elements are enriched in lunar crustal rocks relative to the whole Moon as a result of the igneous differentiation processes that formed the lunar crust.
the horizontal line at unity. If they were present in the same concentrations relative to each other as in CI chondrites, the tops of all the bars would also fall along a horizontal line, but not necessarily at unity.
For soils, concentrations of Au, lr, and most of the vapor-mobilized elements range between about 10–2 and 10–1 times those in CI meteorites. In the mare basalts, they range in concentration between about 10–3 and 10–2 times the concentrations in CI meteorites. The relative abundances in the soils are clearly not the same as in CI chondrites, because the ratios vary over more than an order of magnitude. However, the relative abundances of vapor-mobilized elements in lunar soils are much more similar to those of CI chondrites than they are to those of ordinary chondrite meteorites or the even more fractionated types of meteorites (e.g., Laul et al., 1971).
In Fig. 8.26a, the elemental concentrations in the soils have not been corrected for contributions from the endogenous monomict lunar rocks. In contrast to the siderophile elements, most of whose abundances in monomict rocks can be neglected, corrections are required for vapor-mobilized elements of indigenous origin in order to make quantitative comparisons with CI chondrites (e.g., Gros et al., 1976). However, such corrections do not change the
main conclusion, which is that the relative elemental abundances in the added meteoroid material are roughly similar to those found in the carbonaceous meteorites.
Variations in the meteoroid component with time. Several researchers have tried to use side-rophile or vapor-mobilized elements to unravel the gross variations in meteoroid compositions that impacted the Moon over time. Some of the inferences based on siderophile elements made early on relied heavily on the Apollo 16 highland samples, which now appear to be anomalous in comparison to data from the Antarctic lunar meteorites (see Wasson et al., 1975b; Warren et al., 1989). Although the hypotheses of meteoroid variation with time have been difficult to prove, the concept is important for understanding the evolution of the inner solar system. A three-stage model of meteoroid variation is summarized below.
Anders et al. (1973) suggested three classes of meteoroid additions to the lunar regolith: (1) large planetesimals that produced the major impact basins; (2) smaller objects that formed younger and smaller craters; and (3) a recent flux of even smaller bodies and micrometeoroids that have played a major role in the formation and continuing evolution of the lunar regolith. The earliest additives were the

Lunar Chemistry 421
planetesimals, generally tens of kilometers in diameter, that excavated the major lunar basins such as Imbrium and Nectaris more than 3.9 b.y. ago (see section 4.4). A solid highland crust was already established when these major basins formed. The impact that produced each basin excavated enormous amounts of crust, and these combined basin-forming events largely shaped the present lunar highlands. During these impacts, materials from the projectiles were mixed with much larger volumes of the shattered and melted lunar target rocks to form deposits of melt and breccias. Evidence for this ancient projectile material is seen in the relatively high siderophile-element contents of some highland materials. Distinctive siderophile-element ratios are found within the interiors of ancient breccia fragments in the highland regolith, and especially within melt rocks.
This ancient meteoroid material apparently has no component of vapor-mobilized elements associated with it. One explanation for this observation is that these elements were not a significant part of the original projectiles. This idea is supported by data suggesting that the ancient meteoroid component at the Apollo 16 site has siderophile-element ratios similar to those of some iron meteorites (Korotev, 1987a,b). Another possibility is that the vapor-mobilized elements were so effectively decoupled from the siderophile elements during basin formation (e.g., by vaporization during the impact) that no connection is preserved. In any event, the concentrations of vapor-mobilized elements in highland clast-poor impact-melt rocks are very low, even in samples that show enrichments in the siderophile elements. (The values for Au and Ir shown in Fig. 8.26a are significantly enhanced by the contribution of this ancient component, which is the principal contributor of those elements to most highland soils.)
A second and younger meteoroid addition to lunar soils may come from projectiles up to a few kilometers in diameter that produced the plethora of large visible craters, many of which have rays that extend over large distances. These meteoroids have been accumulated over a long period of time, from about 3.9 b.y. to <1 b.y. ago. However, the extent of this contribution to total meteoroid input is difficult to specify. Anders et al. (1973) estimate it at 5–20% of the meteoroid total, but they were able to say little about its chemical character.
The third and youngest meteoroid component consists of numerous objects ranging from small meter-scale meteoroids to micrometeoroids less than 1 mm in diameter (see section 3.10). This component could be responsible for the relatively high concentrations of vapor-mobilized elements in
the soils and regolith breccias (Anders et al., 1973). This conclusion arises from three lines of evidence: (1) the ubiquity of vapor-mobilized elements in about the same proportions in all lunar soils; (2) the closest similarity of volatile-element abundance patterns of lunar soils to those in carbonaceous meteorites; and (3) indications that carbonaceous meteorites are the most abundant type of material that has impacted both the Earth and Moon, now and perhaps over the past 3 b.y. or more. The bulk of the vapor-mobilized elements in lunar soils appears to be associated with grain surfaces, rather than with grain interiors, as would be expected if the impacting objects vaporized on impact and then condensed onto the granular materials that the impact had disturbed.
Amount of added meteoroid component. The quantity of meteoroid material added to lunar soils and regolith breccias can be estimated by ignoring the ancient component present in older highland rocks and assuming that the added meteoroid material was like CI chondrites (e.g., Keays et al., 1970). The concentration of each siderophile or vapor-mobilized element in the soil, after correction for contributions from the indigenous lunar rocks, is divided by the concentration of that element in the CI chondrites. The results from mature soils are similar for most siderophile and vapor-mobilized elements and correspond to about 1.5–2 wt.% CI equivalent.
Furthermore, if the vapor-mobilized elements come mainly from micrometeoroids impacting the upper regolith (i.e., from meteoroids too small to excavate deep into the regolith), then the concentrations of vapor-mobilized elements should correlate with other measures of regolith surface exposure (see sections 7.3 and 8.8.2). Ganapathy et al. (1974) found a good correlation between the concentrations of Bi and Te in Apollo 16 soils and the measured cosmic ray exposure ages for the same soils. The correlation between Bi and exposure age is shown in Fig. 8.27. From the slope of the line, Ganapathy et al. derived an influx rate for CI meteorites of about 2.4 × 10⁻⁹ wt.% Cl-equivalent/year for surface-exposed soils, a figure that is within the broad range of estimates based on terrestrial meteorite observations.
Comparisons between uranium and volatile elements. In contrast to the generally low concen-trations of vapor-mobilized elements in lunar soils, the concentrations of U in most soils are tens of times higher than in CI meteorites. This difference is due to two factors. First, the average whole-Moon concentrations of U and other refractory incompatible trace elements are at least as high as in carbonaceous chondrites. Second, crustal con-

422 Lunar Sourcebook
Fig. 8.27. Plot of bismuth (Bi) concentrations in Apollo 16 soils, as a function of exposure ages for the soils determined from cosmogenic 21Ne content (after Ganapathy et al., 1974). Horizontal axis shows estimated exposure age in millions of years; vertical axis shows Bi concentration in ng/g. The Bi concentrations show a good positive correlation with exposure age, indicating that Bi (and other vapor-mobilized elements) in lunar soils have been derived chiefly from infalling meteoroids.
centrations of these elements are enhanced over the bulk-Moon values as a result of the preferential concentration of incompatible trace elements in the melt during the melting and separation processes occurring in the lunar mantle, followed by the transport of these elements into the crust by rising magma bodies. In contrast to U, the concentrations of the volatile incompatible trace elements Rb and Cs in lunar soils are about the same as in CI-carbonaceous meteorites (see Fig. 8.26a). This result indicates that the bulk Moon has concentrations of alkali elements that are lower than those in CI-carbonaceous meteorites because the large-ion alkali metals (Na, K, Rb, and Cs), like U, are incompatible trace elements and have likewise been concentrated into the lunar crust. Since U is substantially more concentrated (relative to CI chondrites) in lunar soils than are Rb and Cs (and Na and K), then the alkali elements must be depleted in the whole Moon, relative to CI chondrites. This depletion is believed to be a consequence of their relative volatility, which may have led to their loss during a period of high temperature prior to or during formation of the Moon.
Solar-wind contributions. In addition to impacting solid bodies, the other extralunar sources of vapor-mobilized elements are the solar wind and the more energetic solar cosmic rays associated with
solar flares (see discussion of the solar wind and solar cosmic rays, section 3.11). Ganapathy et al. (1970) were able to demonstrate that the solar wind is not a major contributor of vapor-mobilized elements to the regolith because of the relatively low solar-wind and solar-cosmic-ray abundances of these heavy atoms (Table 3.5). They estimated that the solar wind contributes only 0.16 ng/g of the Ir in lunar soil, compared with about 7 ng/g of Ir measured in the Apollo 11 regolith. The solar wind contribution thus amounts to about 2% of the Ir present in soils. Similar calculations for vapor-mobilized elements indicate that the solar wind contribution probably does not exceed 5%, even for relatively light and volatile elements such as Se.
8.7.3. Vapor-Mobilized Elements as Incompatible Trace Elements: Indigenous Concentrations in Lunar Materials
Most of the vapor-mobilized elements except the halogens (F, Cl, Br, and I) are chalcophile in behavior (i.e., they tend to concentrate in sulfide minerals). Sulfide minerals make up only a tiny fraction of lunar rocks and occur mainly as late-stage crystallization products. There is no evidence to suggest that sulfide minerals could have retained the more chalcophile of the vapor-mobilized elements deep within the lunar mantle. This view is supported by the observation that the ratio of S to other chalcophile elements is higher in lunar basalts than in terrestrial basalts, making it unlikely that there was extensive sulfide removal from the lunar mantle before the mare basalts were formed.
Without dense sulfide minerals retained deep in the Moon, ions of the vapor-mobilized elements would presumably partition into the rising liquid during the melting and crystallization processes that separated the lunar crust from the mantle (see section 2.4). Under these conditions, the vapor-mobilized elements should behave as incompatible lithophile trace elements. Because of their behavior as incompatible trace elements (section 8.4), it is likely that the vapor-mobilized elements would also have their highest concentrations in those materials that have the highest concentrations of Rb, Cs, U, and other incompatible trace elements.
The most common lunar material concentrating incompatible trace elements is KREEP, a component rich in K, the rare earth elements (REE), and P (section 8.4.2). As expected, KREEP-rich materials do have higher concentrations of vapor-mobilized elements than other lunar rocks. Among lunar soil samples, those from Apollo 14 soils have the highest concentrations of incompatible trace elements (Fig. 8.7). These soils also have the highest concen-

Lunar Chemistry 423
Fig. 8.28. Correlation plots for rubidium (Rb) (an incompatible trace element) and thallium (Tl) (a vapor-mobilized element) against cesium (Cs) (an incompatible trace element) in polymict highland breccias: (a) Rb vs. Cs; (b) Tl vs. Cs. Horizontal and vertical axes, both logarithmic, show elemental concentrations (Tl in ng/g; Rb and Cs in µg/g). The use of a logarithmic scale enhances the scatter present at low concentrations and compresses it at high concentrations, where greater deviations should be expected because of the extreme chemical separation processes required to produce such differences. Despite this effect, Rb and Cs (a) still show a very strong correlation because they are both incompatible trace elements and they behave coherently in chemical processes. In contrast, the Tl-Cs data (b) show a slight tendency for higher Tl concentrations to be accompanied by higher Cs concentrations, but there is considerable scatter. Thallium, like Rb and Cs, behaves as an incompatible trace element in magmatic processes, but the lack of correlation with Cs probably reflects the fact that, unlike Rb, Cs, and U, only a small proportion of lunar Tl comes from the lunar interior; most Tl has been introduced by incoming meteoroids.
tration of Tl (Fig. 8.25p). However, Apollo 15 and 17 soils have the highest concentrations of Zn (Fig. 8.25f), Se (Fig. 8.25h), Br (Fig. 8.25i), and In (Fig. 8.25l) because of pyroclastic contributions (see section 8.7.5). The highest concentrations of Te (Fig. 8.25m) are found in Apollo 12 soils. An anomalous Apollo 12 soil sample (12028,55; Laul et al., 1971) has exceptionally high concentrations of Bi, Cd, and Ag, but does not have high concentrations of incompatible trace elements.
There is a strong correlation between concentrations of the relatively volatile alkali elements Cs and Rb in highland breccias (Fig. 8.28a). The correlation is probably better than shown, because at least some deviations from the correlation line probably reflect analytical error. The correlation results from the fact that the principal sources of Rb and Cs are indigen-ous to the Moon, and, because these two elements are so similar, no major separation between them was produced by the chemical differentiation processes that formed the lunar crust. There are also correlations between Tl and Cs (and Rb) in the same breccias, but many samples show substantial deviations from these trends (Fig. 8.28b). The scatter may arise because there is more than one source of T1 (a meteoroid source as well as an indigenous
lunar one), and some separation process (impact vaporization?) may have operated to cause additional decoupling of concentrations of T1 from those of the large-ion alkali elements.
Gros et al. (1976) investigated the behavior of vapor-mobilized elements as incompatible trace elements by examining the correlations between vapor-mobilized elements and Rb and Cs in samples with very low concentrations of siderophile elements. The low siderophile-element content indicates that this group of samples is monomict, with little or no added meteoroid component, and therefore free of any vapor-mobilized elements from nonlunar sources. Figure 8.29a shows the relationship between concentrations of Zn and a large-ion alkali element, Cs, for 19 monomict samples, together with the regression line determined by Gros et al. The strong correlation in Fig. 8.29a affirms the behavior of indigenous lunar Zn as an incompatible trace element. Similar correlations hold for other vapor-mobilized elements, although there is substantial scatter for some of them.
From such correlations between the vapor-mobilized elements and Rb and Cs, Gros et al. (1976) developed logarithmic equations relating the indigenous concentrations of vapor-mobilized elements
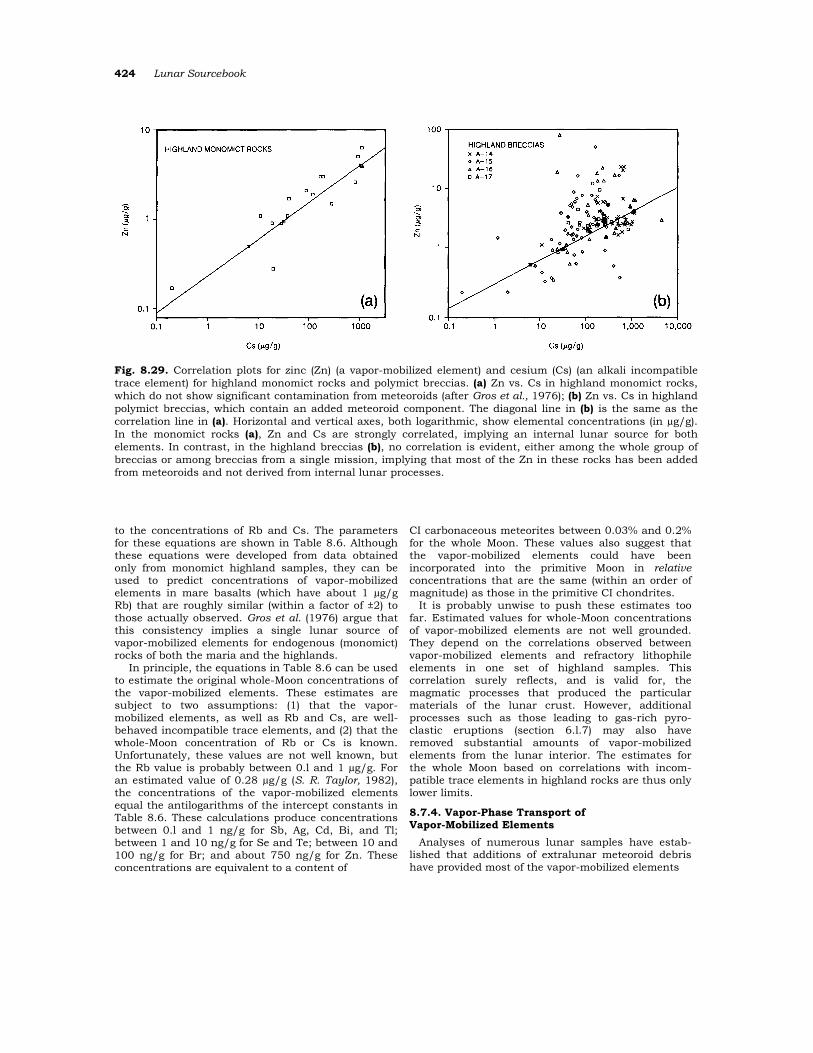
424 Lunar Sourcebook
Fig. 8.29. Correlation plots for zinc (Zn) (a vapor-mobilized element) and cesium (Cs) (an alkali incompatible trace element) for highland monomict rocks and polymict breccias. (a) Zn vs. Cs in highland monomict rocks, which do not show significant contamination from meteoroids (after Gros et al., 1976); (b) Zn vs. Cs in highland polymict breccias, which contain an added meteoroid component. The diagonal line in (b) is the same as the correlation line in (a). Horizontal and vertical axes, both logarithmic, show elemental concentrations (in µg/g). In the monomict rocks (a), Zn and Cs are strongly correlated, implying an internal lunar source for both elements. In contrast, in the highland breccias (b), no correlation is evident, either among the whole group of breccias or among breccias from a single mission, implying that most of the Zn in these rocks has been added from meteoroids and not derived from internal lunar processes.
to the concentrations of Rb and Cs. The parameters for these equations are shown in Table 8.6. Although these equations were developed from data obtained only from monomict highland samples, they can be used to predict concentrations of vapor-mobilized elements in mare basalts (which have about 1 µg/g Rb) that are roughly similar (within a factor of ±2) to those actually observed. Gros et al. (1976) argue that this consistency implies a single lunar source of vapor-mobilized elements for endogenous (monomict) rocks of both the maria and the highlands.
In principle, the equations in Table 8.6 can be used to estimate the original whole-Moon concentrations of the vapor-mobilized elements. These estimates are subject to two assumptions: (1) that the vapor-mobilized elements, as well as Rb and Cs, are well-behaved incompatible trace elements, and (2) that the whole-Moon concentration of Rb or Cs is known. Unfortunately, these values are not well known, but the Rb value is probably between 0.l and 1 µg/g. For an estimated value of 0.28 µg/g (S. R. Taylor, 1982), the concentrations of the vapor-mobilized elements equal the antilogarithms of the intercept constants in Table 8.6. These calculations produce concentrations between 0.l and 1 ng/g for Sb, Ag, Cd, Bi, and Tl; between 1 and 10 ng/g for Se and Te; between 10 and 100 ng/g for Br; and about 750 ng/g for Zn. These concentrations are equivalent to a content of
CI carbonaceous meteorites between 0.03% and 0.2% for the whole Moon. These values also suggest that the vapor-mobilized elements could have been incorporated into the primitive Moon in relative concentrations that are the same (within an order of magnitude) as those in the primitive CI chondrites.
It is probably unwise to push these estimates too far. Estimated values for whole-Moon concentrations of vapor-mobilized elements are not well grounded. They depend on the correlations observed between vapor-mobilized elements and refractory lithophile elements in one set of highland samples. This correlation surely reflects, and is valid for, the magmatic processes that produced the particular materials of the lunar crust. However, additional processes such as those leading to gas-rich pyro-clastic eruptions (section 6.l.7) may also have removed substantial amounts of vapor-mobilized elements from the lunar interior. The estimates for the whole Moon based on correlations with incom-patible trace elements in highland rocks are thus only lower limits.
8.7.4. Vapor-Phase Transport of Vapor-Mobilized Elements
Analyses of numerous lunar samples have estab-lished that additions of extralunar meteoroid debris have provided most of the vapor-mobilized elements

Lunar Chemistry 425
TABLE 8.6. Regression coefficients for concentrations of vapor-mobilized elements against concentrations of Rb and Cs.
Data are from Table 2 of Gros et al. (1976). Regression lines developed from the equation log y = a log x + b, where y = concentration of element, x = concentration of Rb (or Cs), r = residual to least-squares fit, a = slope of regression line, b = intercept of regression line.
now found in lunar surface materials. Nevertheless, the observed patterns of concentrations of vapor-mobilized elements cannot be explained, even to a first approximation, by the simple mixing of indige-nous lunar material (whose concentrations of vapor-mobilized elements are well correlated with those of incompatible trace elements) with meteoroid material similar to CI-carbonaceous chondrites. To explain the relations described in detail below, there must also have been substantial chemical separations, additional sources of vapor-mobilized elements, or both, to account for the complex patterns of concentrations observed.
A typical instance of these complications involves the elements Zn and Cs. Figure 8.29b shows a plot of Zn vs. Cs concentrations for samples of highland breccias. The line on the graph corresponds to the correlation between Cs and Zn determined for the low-siderophile monomict samples discussed above, in which virtually all the vapor-mobilized samples have an indigenous lunar source. As a group, these highland breccias show no correlation between Zn and Cs. Most values fall on the high-Zn side of the correlation line, which would be expected if there were inclusions of micrometeoroid material (containing Zn but not Cs) in the breccias. Some values fall below this line, however, suggesting the loss of Zn by some process from some breccia fragments. Many of the most striking excesses and deficiencies in Zn concentrations are found in samples from the same mission, Apollo 16. Some strong Zn excesses are also present in samples from the Apollo 14, 15, and 17 sites.
If the vapor-mobilized elements found in highland breccias and soils come mainly from two sources, the average meteoroid and the average lunar crust, and if no additional separation processes have affected them, their concentrations should be mutually correlated. Figures 8.30 and 8.31 show concentration plots for different pairs of vapor-mobilized elements. Correlations with Zn are shown in Fig. 8.30 for Apollo 16 soils and breccias (Figs. 8.30a,b), and for highland and mare materials from all missions (Figs. 8.30c,d). There is a rough correlation between Zn and Ag in the Apollo 16 soils and breccias (Fig. 8.30a). The soils have the highest concentrations, probably reflecting micrometeoroid additions to the exposed regolith after most of the breccias formed, or possibly because the breccias were formed from materials at such depths that they did not receive appreciable meteoroid additions. There is a similar crude correlation between Zn and Ag for both mare and highland material from all sampling sites (Fig. 8.30c). Concentrations of both elements in mare materials are relatively low; the bulk of these elements in the soils must therefore come from meteoroid additions and admixed KREEP. The amount of indigenous lunar vapor-mobilized elements in these samples can be estimated from the correlations with Rb and Cs (Table 8.6). The maximum possible lunar contribution can be calculated by using the Rb concentration in the highly enriched quartz monzodiorite (sample 15405, with Rb = 40 µg/g). With this value of Rb, the highest possible indigenous contributions of Zn and Ag in highland materials are about 6 µg/g and 2 ng/g,

426 Lunar Sourcebook
Fig. 8.30. Correlation plots for three vapor-mobilized elements (Ag, Br, and Zn) against each other for a range of lunar materials. (a) Ag vs. Zn in Apollo 16 highland breccias and soils, which contain an added meteoroid component; (b) Br vs. Zn in Apollo 16 highland breccias and soils; (c) Ag vs. Zn in all types of samples; (d) Br vs. Zn in all types of samples. Horizontal and vertical axes, both logarithmic, show elemental concentrations (Ag and Br in ng/g; Zn in µg/g). The Apollo 16 highland materials show a rough correlation between Ag and Zn (a) and no correlation between Br and Zn (b). The more complete suite of lunar materials shows a similar rough correlation between Ag and Zn (c) and little or no correlation between Br and Zn (d).
respectively. These values are far below the highest observed concentrations, which exceed 100 µg/g and 100 ng/g. These Zn and Ag concentrations appear too high to be produced by a combination of meteoroid and lunar sources. Values of 100 µg/g for Zn and 100 ng/g for Ag would require >25% CI meteorite equivalent to be present in the samples with the highest concentrations, an excessive amount that would be unlikely in so many samples.
Data for other vapor-mobilized elements also indicate that the simple introduction of even 25% CI-type meteoroid material cannot be the cause of the
high Zn and Ag concentrations in the highland breccias and soils. Clear evidence for the absence of a large meteoroid component is the lack of any corresponding correlation between Zn and Br in Apollo 16 materials (Fig. 8.30b). There is at best only a rough correlation between concentrations of Zn and Br in rocks and soils from all sites (Fig. 8.30d). Furthermore, the highest Br concentrations (about 1000 ng/g) correspond to the addition of only about 5% CI-type meteoroid. There is no correlation between Se and Br (Figs. 8.31a,c); the highest Se concentrations correspond to <5% CI equivalent

Lunar Chemistry 427
Fig. 8.31. Correlation plots for four vapor-mobilized elements (Br, Se, Tl, and Cd) against each other for a range of lunar sample materials. (a) Br vs. Se in Apollo 16 highland breccias and soils, which contain an added meteoritic component; (b) Tl vs. Cd in Apollo 16 highland soils and breccias; (c) Br vs. Se in all types of samples; (d) Tl vs. Cd in all types of samples. Horizontal and vertical axes, both logarithmic, show elemental concentrations (in ng/g). In the Apollo 16 highland samples, the Br-Se plot (a) shows no correlation, and the Tl-Cd plot (b) shows only a rough correlation. Similarly, in the plots for all sample types, the Tl-Cd data show only a rough correlation (d), while the Br-Se data show no correlation (c).
added. There is a rough correlation between Cd and Ti, both for Apollo 16 samples (Fig. 8.31b) and for rocks and soils from all sites (Fig. 8.3ld), but there are also large deviations. Curiously, concentrations of both Tl and Br in some Apollo 16 breccias lie well above the concentrations found in the soils.
8.7.5. Pyroclastic Volcanic Emissions as an Indigenous Source of Vapor-Mobilized Elements
Discovery of the rust-colored (orange-glass) pyroclastic deposit near Shorty Crater at the Apollo 17 site (see section 10.6.6 and Fig. 10.28)
briefly raised the exciting possibility that oxidizing, hydrous gases might have vented there to produce, among other things, Fe rust. Such a discovery would have been the first firm evidence for the presence of highly volatile materials (especially water) in the lunar interior.
This possibility was quickly eliminated when samples of the pyroclastic deposit were analyzed back on Earth. The orange color is produced by a titaniferous, very dry glass of mare basalt composi-tion, present in the form of small glass spheres (section 6.l.7).
428 Lunar Sourcebook
The pyroclastic glass spheres are products of gas-driven volcanic eruptions, and they are coated with vapor-mobilized elements that were condensed from the volcanic gas. These deposits provide direct evidence that vapor-mobilized elements can separate from incompatible trace elements in the lunar interior, and concentrate to drive volcanic eruptions. Similar coatings of vapor-mobilized elements are also found on the green pyroclastic glass spheres from the Apollo 15 site (section 6.1.7).
It is of interest to compare the concentrations of vapor-mobilized elements in these samples with those in mare basalts (e.g., Baedecker et al., 1974) because the concentrations of major elements and incompatible trace elements in these glass spheres are the same as expected for mare basalts with similarly high concentrations of MgO and FeO. Figure 8.32a plots the ratios of concentrations of a group of vapor-mobilized elements (together with Au, Ir, Sb, Rb, Cs, and U) in the orange glass (sample 74220) to the average concentrations in 79 mare basalts. Ratios for the siderophile elements (Au, Ir, and Sb) and for Rb, Cs, and U all fall near the line at unity, indicating that their concentrations are similar in both materials. However, the concentrations of the vapor-mobilized elements Zn, Br, Ag, Cd, and Tl are l–2 orders of magnitude higher in the orange glass than in the mare basalt average. This contrast demonstrates that some vapor-mobilized elements separated from the other elements during the magmatic and volcanic events that produced the pyroclastic glasses. The processes responsible for these separations are not known. However, the high ratios of the more volatile vapor-mobilized elements (Zn, Br, Ag, Cd, and Tl) to Rb and Cs suggest that there was a general expulsion of excess amounts of the more volatile elements relative to those behaving simply as incompatible trace elements.
The relative concentrations of vapor-mobilized elements to each other in green pyroclastic glasses are similar to those of the orange glasses, although the patterns in the two glasses are distinguishable from each other. The similarities and differences between these two types of pyroclastic glasses are summarized in a comparative plot of the ratios of the element concentrations in the green-glass-rich sample 15426,35 (Ganapathy et al., 1973) and the orange glass (Fig. 8.32b). Concentrations of the vapor-mobilized elements (but not Rb, Cs, U, and some siderophile elements) are 0.06 to 0.6 times lower in the sample containing the green glass than in the orange-glass sample. The compounds containing the vapor-mobilized elements apparently do not coat the surfaces of the spherules uniformly, and the data in Fig. 8.32b may reflect the fact that there are more gaps in the coatings on the green-glass spherules
than in the coatings of the orange-glass spherules (Butler and Meyer, 1976). In addition, the green-glass sample is in fact a recycled mixture of several loosely related pyroclastic glass types, unlike the much more extensive and homogeneous orange glass sample from the Apollo 17 site (see section 6.1.7).
Several studies have confirmed that the vapor-mobilized elements associated with the pyroclastic glasses are surface coatings and are only present in much smaller amounts within the glass spheres. For example, Goldberg et al. (1976) demonstrated that F, one of the more abundant vapor-mobilized elements, is concentrated to the level of ~1.5 × 10¹⁵ atoms/cm2 at the surface of individual orange glass spherules but only to the level of <0.3 × 10¹⁵ atoms/cm2 at depths between 0.1 and 1.2 µm within the spheres. This surface concentration corresponds roughly to a monolayer of F atoms on the sphere surface. They also found approximately the same surface concentrations of F on spherules of green glass, but not as uniformly distributed over the surface. In studying mare basalt samples by the same technique, they found slightly high F concentrations on the surfaces of vesicles (bubbles) in mare basalt samples, relative to concentrations within the basalts. Concentrations of F on the vesicle walls of basalt samples were only one-fifth as high as on the surfaces of the glass spheres, but the bulk F concentrations in the basalts were higher than those inside the glass spheres. There is still some controversy about how labile the F in these samples is to leaching. Jovanovic and Reed (1974) reported that 40% of the F could be leached from the orange glass at pH 5, but Goldberg et al. (1976) found the same surface concentration both before and after leaching.
The orange-glass spheres at the Apollo 17 site are closely associated with black spheres, which are essentially the same material, only darkened by crystallization of the glass. Butler and Meyer (1976) and Cirlin et al. (1978) confirmed that high concen-trations of S, Zn, Cd, and Pb are associated with both orange and black spheres from the Apollo 17, Station 4 core tubes, which sampled the pyroclastic deposit near Shorty Crater. From thermal release patterns, they concluded that the Zn was mainly on the surfaces of the spheres. Wasson et al. (1976) cited the observations of high concentrations of Zn and Pb in samples of orange- and green-glass spheres as evidence for an endogenous origin for the spherules. Of particular importance are the unusually high values of the isotopic ratios 204Pb/206Pb and 204Pb/207Pb measured by Nunes et al. (1974b,c), which indicate that the Pb (and, by association, the other vapor-mobilized elements) in the spheres come from an isolated source whose U and Th were mainly lost early in lunar history, thus preventing the

Lunar Chemistry 429
Fig. 8.32. Histograms showing ratios of vapor-mobilized elements in various lunar materials (“rusty rock” 66095, the Apollo 17 orange glass, the Apollo 15 green glass, and mare basalts), relative to each other and to standard CI-type carbonaceous chondrites. Data for three siderophile elements (Au, Ir, and Sb) and three incompatible trace elements (Rb, Cs, and U) are included for comparison. (a) Concentration ratios of Apollo 17 orange glass (ORANGE GLASS) relative to average mare basalts (MBAS) from all missions. The orange glass, despite its general chemical similarity to high-Ti mare basalts, is highly enriched in vapor-mobilized elements. (b) Concentration ratios of Apollo 15 green glass (GREEN) relative to Apollo 17 orange glass (ORANGE). There is a close match between concentrations of the vapor-mobilized elements in both glasses, although the patterns are distinctively different. (c) Concentration ratios for “rusty rock” 66095 (RUSTY ROCK) relative to CI meteorites. Concentrations of vapor-mobilized elements in “rusty rock” 66095 are depleted by factors of 10–100 relative to CI meteorites, but their relative abundances agree more closely with CI meteorites than with other meteorite types.

430 Lunar Sourcebook
development of significant amounts of radiogenic 206Pb and 207Pb. In other words, the isotopic signature of the Pb from the glass spheres indicates that they did not form by impact melting of evolved lunar crust, which would have more radiogenic Pb. 8.7.6. Surface Mobility of Vapor-Mobilized Elements
Some large samples of Apollo 16 breccias, when first examined in the Lunar Receiving Laboratory back on Earth, were found to have spots of rust (e.g., “rusty rock” 66095). The rust had been produced by the action of water of probable terrestrial origin (from the spacecraft cabin atmosphere, the Lunar Receiving Laboratory, or both) with a reactive mineral, perhaps lawrencite (FeCl2), present in the breccia (e.g., L. A. Taylor et al., 1973a). This mineral had apparently condensed from a vapor phase onto the surfaces of the rock fragments incorporated into the breccias. The samples showing rust also contain abnormally high concentrations of vapor-mobilized elements. Figure 8.32c shows the ratio of concentrations of vapor-mobilized elements (plus Au, Ir, Sb, Rb, Cs, and U) in “rusty rock” 66095 to those in CI-chondrite meteorites; in general, the volatile elements in sample 66095 do not occur in chondritic relative abundances.
In addition to the volcanic gas emissions from deep in the Moon, there are lunar surface processes that can concentrate vapor-mobilized elements as a group and fractionate some of them away from the others. These processes can concentrate vapor-mobilized elements by several orders of magnitude relative to their concentrations in bulk lunar material. For example, surprisingly high concentrations of Ag (301 ng/g), Cd (22,000 ng/g), and Bi (38,500 ng/g) were reported for a sample of soil from an Apollo 12 drive tube (12028,66) by Laul et al. (1971), who believe that these values are not a consequence of inadvertent contamination of the soil with terrestrial material.
The mechanisms that produce such unusual enrichments of vapor-mobilized elements in near-surface lunar materials have not been definitely identified. However, processes based on thermal vaporization are one reasonable possibility. Most of the vapor-mobilized elements in lunar soils are found to be surface-correlated in the soils that contain them; i.e., their abundances are greatest in the smallest grain-size fractions, which have the most surface area per unit volume. This relationship suggests vapor transport and condensation.
The normal daytime surface temperature of the Moon (>100°C) is high enough to cause some materials we normally regard as stable to volatilize but, even in direct sunlight, the daytime tempera-
tures are too low to distill FeCl2 efficiently (mp ~ 670°C). Meteoroid impacts of substantial size, however, can vaporize even silicate minerals, generate pools of silicate melt, and trap large bodies of hot impact debris beneath insulating blankets of ejecta, thus insuring slow heat loss and the preser-vation of high temperatures for long periods of time.
The short- and long-term heat effects associated with meteoroid impacts can be expected to distill vapor-mobilized elements, perhaps in a manner analogous to the hydrothermal circulation within the Earth’s crust that concentrates trace elements into ores. However, in the lunar environment, any such system would have to operate without water. On the Moon, C-O-S compounds of various forms might serve as circulating fluids. Under such conditions, fractional distillation, sublimation, or extraction processes could separate individual vapor-mobilized elements from each other. Such processes may account for the irregular patterns of relative abun-dances among the vapor-mobilized elements that are observed from sample to sample.
Isotopic evidence from Pb supports the idea that the vapor-mobilized elements can be selectively moved by heating. Most of the Pb in lunar samples is produced by radioactive decay of U and Th, and it consists chiefly of the isotopes 206Pb (from 238U), 207Pb
(from 235U), and 208Pb (from 232Th). Most lunar rocks are very old in comparison to geologic time, and their Pb concentrations have been enhanced substantially over time at the expense of their original U and Th concentrations. The concentration of original (nonradiogenic) Pb in a lunar sample can be estimated from the concentration of 204Pb present, because that isotope is not produced by any radioactive decay process. To a first approximation, a lunar rock or soil (if soils are assumed, for simplicity, to be mechanical mixtures of rocks) should have concentrations of radiogenic Pb isotopes (206Pb, 207Pb, and 208Pb) that correlate with the concentrations of U and Th present. Deviations from those correlations between Pb isotopes, U, and Th would indicate that some chemical separation or addition process had occurred.
The U-Th-Pb relations based on radioactive decay are the basis of a fundamental method for measuring the ages of terrestrial rocks and of meteorites, and the same techniques were applied to returned lunar samples. Precise determinations of U, Th, and Pb isotopes were made to measure the ages of individual rocks and to determine the timescales for lunar processes. The results indicate that the concentra-tions of Pb often deviate from what would be expected based on concentrations of U and Th, indicating that Pb separation or addition has occurred.
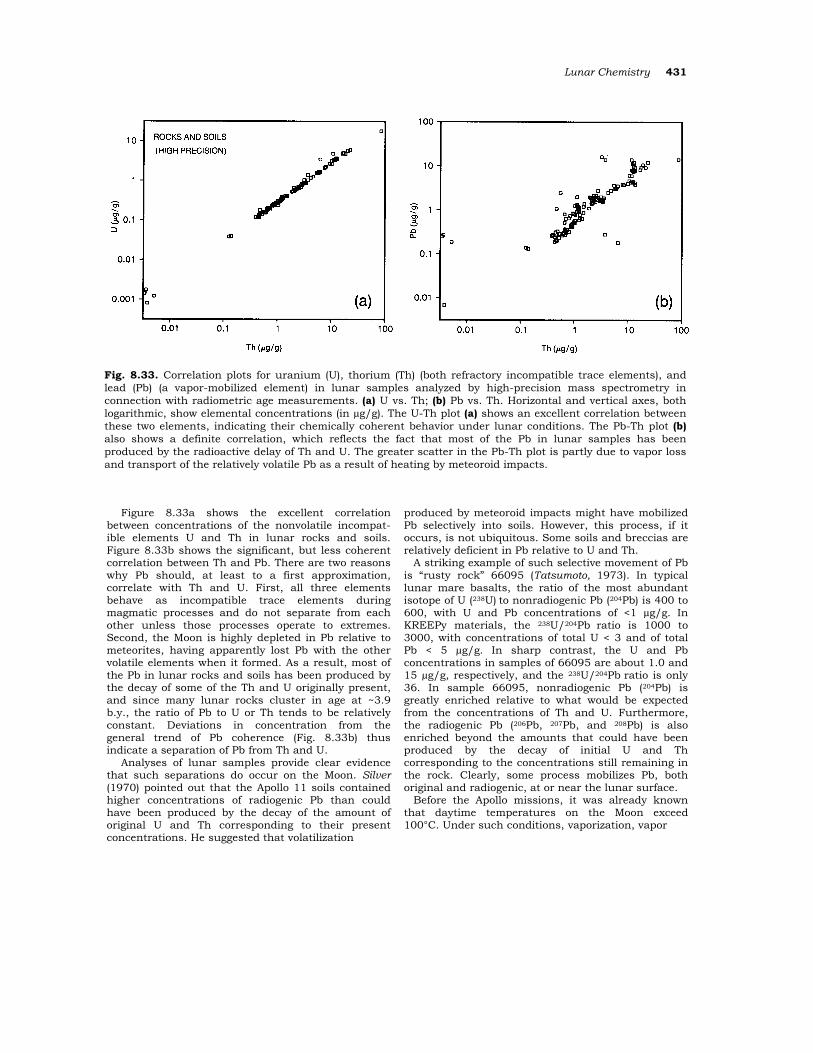
Lunar Chemistry 431
Fig. 8.33. Correlation plots for uranium (U), thorium (Th) (both refractory incompatible trace elements), and lead (Pb) (a vapor-mobilized element) in lunar samples analyzed by high-precision mass spectrometry in connection with radiometric age measurements. (a) U vs. Th; (b) Pb vs. Th. Horizontal and vertical axes, both logarithmic, show elemental concentrations (in µg/g). The U-Th plot (a) shows an excellent correlation between these two elements, indicating their chemically coherent behavior under lunar conditions. The Pb-Th plot (b) also shows a definite correlation, which reflects the fact that most of the Pb in lunar samples has been produced by the radioactive delay of Th and U. The greater scatter in the Pb-Th plot is partly due to vapor loss and transport of the relatively volatile Pb as a result of heating by meteoroid impacts.
Figure 8.33a shows the excellent correlation between concentrations of the nonvolatile incompat-ible elements U and Th in lunar rocks and soils. Figure 8.33b shows the significant, but less coherent correlation between Th and Pb. There are two reasons why Pb should, at least to a first approximation, correlate with Th and U. First, all three elements behave as incompatible trace elements during magmatic processes and do not separate from each other unless those processes operate to extremes. Second, the Moon is highly depleted in Pb relative to meteorites, having apparently lost Pb with the other volatile elements when it formed. As a result, most of the Pb in lunar rocks and soils has been produced by the decay of some of the Th and U originally present, and since many lunar rocks cluster in age at ~3.9 b.y., the ratio of Pb to U or Th tends to be relatively constant. Deviations in concentration from the general trend of Pb coherence (Fig. 8.33b) thus indicate a separation of Pb from Th and U.
Analyses of lunar samples provide clear evidence that such separations do occur on the Moon. Silver (1970) pointed out that the Apollo 11 soils contained higher concentrations of radiogenic Pb than could have been produced by the decay of the amount of original U and Th corresponding to their present concentrations. He suggested that volatilization
produced by meteoroid impacts might have mobilized Pb selectively into soils. However, this process, if it occurs, is not ubiquitous. Some soils and breccias are relatively deficient in Pb relative to U and Th.
A striking example of such selective movement of Pb is “rusty rock” 66095 (Tatsumoto, 1973). In typical lunar mare basalts, the ratio of the most abundant isotope of U (238U) to nonradiogenic Pb (204Pb) is 400 to 600, with U and Pb concentrations of <1 µg/g. In KREEPy materials, the 238U/204Pb ratio is 1000 to 3000, with concentrations of total U < 3 and of total Pb < 5 µg/g. In sharp contrast, the U and Pb concentrations in samples of 66095 are about 1.0 and 15 µg/g, respectively, and the 238U/204Pb ratio is only 36. In sample 66095, nonradiogenic Pb (204Pb) is greatly enriched relative to what would be expected from the concentrations of Th and U. Furthermore, the radiogenic Pb (206Pb, 207Pb, and 208Pb) is also enriched beyond the amounts that could have been produced by the decay of initial U and Th corresponding to the concentrations still remaining in the rock. Clearly, some process mobilizes Pb, both original and radiogenic, at or near the lunar surface.
Before the Apollo missions, it was already known that daytime temperatures on the Moon exceed 100°C. Under such conditions, vaporization, vapor
432 Lunar Sourcebook
transport, and condensation were considered to be possible lunar surface processes, and experiments were carried out on the Apollo missions to determine whether they occurred. Samples were skimmed from the uppermost parts of soils that were permanently shaded by boulders, and were therefore presumably cold. Identical samples were skimmed from nearby unshaded soils that received the full diurnal heating and cooling typical of the lunar surface. Analyses of these shadowed soils and of the nearby control soils showed no differences in concentration for most elements (e.g., Laul et al., 1974; Morgan et al., 1974), but the Hg and Cd contents were both higher in the shadowed soils. The differences for Cd (e.g., Baedecker et al., 1974; Morgan et al., 1974; von Gunten et al., 1982) were small and were not found in all shadowed samples. However, the differences for Hg were substantial (e.g., Reed and Jovanovic, 1970; Reed et al., 197la) and were found consistently by several investigators (see review by von Gunten et al., 1982).
Jovanovic and Reed (1979) analyzed Hg in soil samples obtained with drive tubes and drill cores from the Apollo 14, 15, 16, and 17 sites. Except in deep drill sample 15006, they found a substantial decrease of the weakly-bound Hg (that which can be vaporized from the sample on heating to 130°C) in the uppermost 3–8 cm in all cores. They interpreted this decrease as the result of the diurnal heating of the uppermost soils, which causes the weakly bound Hg to migrate downward to cooler intervals (Reed and Jovanovic, 1979). Deep drill sample 15006 shows a similar increase in Hg concentrations with depth, but also shows an unexplained high value in the uppermost centimeter. At depths greater than 4–8 cm, the Hg concentrations are more scattered.
Jovanovic and Reed (1979) interpret deeper varia-tions in Hg concentration as the product of fossil thermal gradients of surface regolith, frozen in as the surface on which they formed was covered with new layers of regolith that were thick enough to provide thermal shielding against further diurnal disturbance. If this interpretation is correct, then the Hg concen-trations provide an interesting index of surface exposure that is not a cumulative one like solar-wind exposure or cosmic-ray-produced nuclides (see section 7.3).
Jovanovic and Reed (1979) also noted that a portion of the halogen Br is also released at low temperature, and that Br, like Hg, may respond to the lunar diurnal temperature gradient. However, there is no obvious correlation between their reported concentrations of weakly-bound Hg and those of Br released at low temperatures. Furthermore, in contrast to Hg, there is no evident gradient
of low-temperature Br concentrations with depth. In conclusion, evidence for redistribution of vapor-mobilized elements in the upper regolith, as a result of solar heating, is strongest for Hg, weaker for Cd, and questionable for Br.
8.7.7. Sulfur Sulfur has seldom been studied in conjunction with
other vapor-mobilized elements because the required analytical techniques are different (S is commonly determined by spectrometry following acid hydrolysis or O2 combustion to extract the S; neutron activation does not work for S). Nevertheless, S clearly shows at least some of the behavior characteristic of vapor-mobilized elements. Sulfur concentrations are shown in Fig. 8.25c, where values are given in weight percent on a linear scale (unlike the other plots in the same figure, where the vertical scale is logarithmic and values are in micrograms per gram or nanograms per gram). Some analysts argue that S values obtained by some techniques are systematically too high, by perhaps as much as 20%. Unfortunately, the suspected techniques were used to provide most of the S analyses for lunar samples. If this concern is valid, then the majority of the data points in Fig. 8.25c are too high.
The relatively restricted range of S concentrations in most lunar igneous rocks indicates that S is associated with a common mineral that occurs in most samples and controls its abundance. This mineral is troilite (FeS), though other sulfide minerals also occur in lunar samples (section 5.3). The lowest S concentrations are found in highland monomict plutonic rocks such as ferroan anorthosites, some of which have concentrations as low as 0.001%. The highest S concentrations are found in mare basalts, and the high-Ti lavas from the Apollo 11 and 17 sites have, on average, higher concentrations (~0.2%) than do the low-Ti lavas from the Apollo 12 and 15 sites (~0.1%). In comparison, S concentrations in the most common terrestrial lavas (ocean-floor basalts) are generally <0.08%. As indicated by the data on mare basalts, S concentrations tend to be higher in basalts with higher TiO2. This is true not only between the general classes of high-Ti vs. low-Ti basalts from different landing sites, but also within the more closely related basalts of a single site (e.g., Apollo 12 basalts; Gibson et al., 1977).
The partial pressure of S in lunar basalts, and the mechanisms controlling it, are not well understood. Early analyses suggested the pressure was high because of equilibria between S and FeS (troilite) in basaltic magmas. An inverse correlation between concentrations of S and those of metallic iron (Fe°) was initially reported for Apollo 17 basalts; however, an expanded dataset shows that the correlation is

Lunar Chemistry 433
poor (correlation coefficient r = –0.59). The initial result was interpreted as indicating that the Fe° metal was produced by the loss of sulfur from FeS during volatilization (see Gibson et al., 1976, and Brett, 1976, for discussions). However, no such correlation between S and Fe° was found in Apollo 12 basalts (Gibson et al., 1977), and there is no reason to think that a S-volatilization mechanism produced the Fe° in those rocks. On the basis of the initial interpretation of loss of S by volatilization, which implied a high and uniform concentration of S in initial Apollo 17 magmas, Brett (1976) concluded that the Apollo 11 and 17 lavas were saturated in S (relative to immiscible FeS) at the time of their eruption, and that the Apollo 12 and 15 lavas, which have significantly lower S concentrations, were not saturated. However, the vapor pressure of S that would be required for equilibrium with lunar basaltic magma is some 8 orders of magnitude greater than the estimated confining pressure on erupted lavas (Nash and Hansel, 1973).
In lunar soils, the S concentrations reflect the type of terrain, mare or highland, from which the soils are derived. Kerridge et al. (1975a,b) found a strong positive correlation between total Fe and S concen-trations in highland soils from the Apollo 16 site, strongly indicating a common source for both elements in highland materials. The S concentrations in these soils approximately match those calculated from mixing together the various types of igneous rocks from which the soils are derived, using the S values determined for them. Unfortunately, this apparent agreement from a simple mass balance is deceiving (e.g., Kerridge et al., 1975a,b) because such a simple model is ruled out by isotopic measure-ments.
Sulfur isotopes have low enough atomic masses (32–36 amu) to exhibit measurable mass fractionation as a result of chemical separation processes. Indigenous lunar S, as determined from analyses of lunar igneous rocks, has nearly the same relative abundances of the various S isotopes as does S from meteorites. The 34S/32S ratio in lunar igneous rocks is only 0.05% different from the ratio in troilite (FeS) from the Canyon Diablo iron meteorite. However, in lunar soils, the difference in the ratio, which represents mass fractionation of the two isotopes, is higher. In mature bulk lunar soils the fractionation is as high as 1.2% and for the smallest grain size fraction of such soils as high as 1.7%. This difference between lunar rocks and the soils derived from them could result from addition to the soils of an extralunar component enriched in S. However, the most likely extralunar components are common types of meteorites, and these are not enriched in S. The S abundance in the solar wind is too low
to affect the isotopic composition of lunar soil. The relative changes observed for the S isotopes 33S
and 36S (e.g., Rees and Thode, 1972) are proportional to those for 34S, indicating that the cause of the isotopic differences is some process that results in mass fractionation. One obvious process that would fractionate S isotopes in this manner is the loss of S by vaporization following meteoroid impacts (e.g., Clayton et al., 1974). This process would also produce a negative correlation between the amount of enrichment in 34s and the total S concentration, because the light isotopes will be preferentially vaporized and, as the extent of S loss by vaporization increases, the small amounts of residual S will become increasingly enriched in the heavier isotopes such as 34S. Surprisingly, the reverse seems to be the case. Kerridge et al. (1975a,b) found a good positive correlation between the degree of 34S enrichment and the total concentration of S in Apollo 16 highland soils. They also found a good positive correlation between the extent of 34S enrichment and the N concentration. Because N is introduced into exposed lunar soils from the solar wind (section 8.8.3), the N concentration increases with exposure age, and these results indicate that enrichment in S heavy isotopes increases with the exposure age of the soils.
To reconcile these results with the fact that any S loss by vaporization would leave behind a residue enriched in 34S, and to account for the positive correlation between 34S enrichment and total S concentration, Kerridge et al. (1975a,b) suggested that their results reflect the combined operation of two processes: (1) loss of S through vaporization or ion sputtering to produce the observed 34S enrich-ment; and (2) addition of new meteoroid material at a rate that slightly exceeds the total S loss.
Kerridge et al. (1975a) further demonstrated that the S loss from a mature highland soil amounts to several tens of percent of the amount originally present. This estimate is consistent with that of Cripe and Moore (1976), which was based on the mass balance of S between possible parent materials of the soils (Schonfeld and Meyer, 1972) and the actual analyzed S values for the soils. The meteoroid inputs of S required to balance this loss are consistent with those inferred from the concentrations of other vapor-mobilized elements in these soils (section 8.7.2). However, other mechanisms besides vaporization may contribute to the loss of S from lunar soils. Kerridge and Kaplan (1978) favored sputtering over thermal vaporization as the mechanism to account for isotopic fractionation, not only of S, but also of Si and O, at soil surfaces.
Sulfur is the principal vapor-mobilized element in the volatile-rich coatings on glass spheres produced
434 Lunar Sourcebook
by lunar pyroclastic fire-fountain eruptions (Butler and Meyer, 1976; see sections 6.l.7 and 8.7.5). The Apollo 17 orange and black pyroclastic spheres and the Apollo 15 green pyroclastic spheres have clear affinities with mare basalts in their contents of major elements and incompatible trace elements. It might be expected that the spheres, which have mare basalt chemical affinities and also have S-rich coatings, would have anomalously high overall S concentrations. Indeed, the overall concentrations of other vapor-mobilized elements in these soils are substantially greater than in mare basalts, as pointed out above. However, this is not the case for S. The mean S concentration in the orange-glass sample 74220 is between 0.07 and 0.08 wt.%, well below the median, and even the range, for Apollo 17 mare basalts (Fig. 8.25c). The low S concentrations of the pyroclastic deposits may indicate that S, if present in relatively high concentrations in the vapor as inferred for the other vapor-mobilized elements, was in a chemical form too volatile to condense onto the spherules.
Several investigators have argued that it is unlikely that the S in the coatings was deposited as free S, mainly because temperatures on the glass surfaces were too high during eruption (e.g., Butler and Meyer, 1976; Wasson et al., 1976). However, analyses of the surface coatings appear to show that more S is present than would be needed to combine with the measured amounts of such cations as Fe2+ and Zn2+ to form minerals such as troilite (FeS) or sphalerite [(Zn,Fe)S] (see Butler and Meyer, 1976). Proof that elemental S did condense onto the spherule surfaces would provide important constraints on the compo-sition of the vapor phase in these volcanic eruptions, its cooling rate, and the conditions under which it cooled.
Not all the movement of S on the lunar surface is caused by simple evaporation and condensation. In a few breccias, small veins of troilite are observed, and pyroxenes in the breccias have undergone partial replacement by some reaction that left troilite in their place. This form of sulfide metamorphism may be analogous to the formation of sulfide ore bodies on Earth, in which the movement of fluid phases through large volumes of terrestrial rocks results in extraction of trace elements from the rocks and their concentration into ores. On the Moon, the heat present in large ejecta blankets around major impact craters may produce substantial migration of S and extraction of the chalcophile elements.
8.7.8. Halogens The halogens have been studied as a group in
lunar materials mainly by Reed and Jovanovic (e.g., Reed and Jovanovic, 1971, 1972, 1973a,b) using
neutron and photon activation analysis. These investigators found that a substantial fraction (about 50% to 90%) of the Cl and Br in most lunar materials, but especially in soils and breccias, could be leached out with hot water (e.g., Jovanovic and Reed, 1973, 1974). Iodine was also leached out, but the fraction so leached was not determined because the I concentrations of the residues were not measured. The values for I in Figs. 8.25n and 8.34c are therefore lower limits.
The halogens are not an especially coherent geochemical group, nor would they necessarily be expected to show strongly correlated behavior. Figure 8.34 shows concentrations of F, Br, and I plotted against Cl for a wide variety of lunar rocks and soils. The Cl and Br concentrations are only roughly correlated. The calculated correlation coefficient (after the deletion of data points that lie more than 2.7 standard deviations from the regression line) is 0.79. The slope of the calculated correlation line is 3.47 ± 0.24, which is only about four standard deviations lower than the range of 4.4–5.l for cosmic abundances (Anders and Ebihara, 1982) and for average values of CI chondrites (Mason, 1971).
Based on the available data, it appears that concentrations of Cl and F are not correlated (Fig. 8.34b). Concentrations of whole-rock Cl and I (leachable I, in most cases) are also not correlated (Fig. 8.34c), but there may be a crude correlation between leachable Cl and leachable I in many samples, mainly soils and breccias (Fig. 8.34d). There are no apparent correlations among the halogen data for samples from a single mission or of a given sample type, e.g., highland breccias from Apollo 17. In part, this lack of apparent relationship may result from analytical scatter, for replicate analyses by Jovanovic and Reed show scatter of tens of percent for the amounts of all analyzed halogens. The lack of correlation may also reflect the small number of samples analyzed for any single mission or rock type. However, the data more likely reflect a genuine incoherence of behavior between any pair of halogens.
The exact mineral locations of the halogen elements in lunar samples are not well known. On Earth, the phosphate mineral apatite (see section 5.5) normally contains one atom of F or Cl (or an OH–) in its formula unit, with F being more common than Cl, particularly in apatite from igneous rocks thought to have formed under dry conditions. If the F and Cl in lunar samples are located in phosphate minerals (apatite or whitlockite), then the concentrations of F and Cl should correlate with the P contents of the samples. However, there is little evidence for a correlation between F and P in lunar materials and

Lunar Chemistry 435
Fig. 8.34. Correlation plots for four vapor-mobilized halogen elements (Br, F, I, and Cl) in a range of lunar samples of all types. (a) Br vs. Cl; (b) F vs. Cl; (c) I (“lower limits”) vs. Cl; (d) “leachable” I vs. “leachable” Cl (Jovanovic and Reed, 1973, 1974, 1976a,b, 1980a,b). Horizontal and vertical axes, both logarithmic, show elemental concentrations (Br and I in ng/g, F and Cl in µg/g). Most of the I values represent “leachable” I leached from the samples (d), and the I data (c) therefore represent only lower limits. Despite the chemical similarity of the halogen elements to each other, there are no strong correlations between their concentrations in lunar materials. The Br-Cl data (a) show a weak positive correlation, and a weaker positive correlation may exist between the “leachable” I and “leachable” Cl (d). However, the F-Cl data (b) and the I-Cl data (c) show no correlation.
none at all for a correlation between Cl and P. Jovanovic and Reed (e.g., 1976, 1980) have grouped the rocks they analyzed according to the Cl/P2O5 ratio, and they have suggested that each different group represents a different mantle source. However, it is difficult to reconcile their suggestion with other geochemical information (e.g., Taylor and Hunter, 1981). It is also possible that some correlation between halogens and P could be produced during lunar magmatic processes, regardless of the source of the magma, because in such situations the vapor-mobilized elements behave as incompatible trace elements, whose concentrations do correlate with P.
8.7.9. Possible Lunar Ores of Vapor-Mobilized Elements
The chemical forms in which the vapor-mobilized elements occur in lunar materials have not been thoroughly characterized. Overall, the most abundant element of this group is S. Concentrations of S in lunar lavas are even higher than those in terrestrial basalts. The reasons for this difference are not known. It may be related to the extremely reducing conditions under which lunar magmas form. Another possibility is that terrestrial basalts have low S contents because gravitational separa-
436 Lunar Sourcebook
tion of a dense sulfide phase deep in the Earth removed S from the Earth’s mantle where basalts subsequently formed.
The surface coatings of volatile materials on pyroclastic spheres, such as those from the orange-glass deposit 74220 and similar pyroclastic deposits (section 8.7.5), may be too thin to serve as an economic source of these elements. For example, a tonne of such spheres contains only 200 g of Zn and 700 g of S. Instead, the surface coatings may be more important in demonstrating that chemical separation during vapor transport has occurred in conjunction with volcanic eruptions on the Moon. In exceptional cases, this process may have been carried far enough to produce ore-grade concentrations of these otherwise rare elements.
Vapor mobilization in the regolith, due to the heat produced in meteoroid impacts, also might produce ores. The highly enriched, albeit small, soil sample from the Apollo 12 drive tube (12028, Laul et al., 1971) apparently contains a minor particle that is highly enriched in some vapor-mobilized elements (Ag, Cd, and Bi; see section 8.7.6). This indicates that, at least on a small scale, very high concentrations (>20 µg/g) of elements such as Cd and Bi can be produced. Perhaps some soils will be rich in such particles. The formation of sulfide veins and the replacement of pyroxene by sulfide minerals in some breccias are other indications that vapor mobilization can concentrate these elements.
Large amounts of vapor-mobilized elements may have been concentrated in large craters at the lunar poles (section 3.8), where permanently shaded crater floors can act as long-term cold traps for volatile substances. These elements could reach the lunar surface either by outgassing of the lunar interior or as materials vaporized from meteoroids and comets that have struck the Moon. These polar craters have not yet been examined by any type of remote sensing, including imaging.
Whether or not the Moon has ores of vapor-mobilized elements, it is already clear that these elements are not abundant on the Moon. Their concentrations in pristine lunar rocks are generally low, and they are typically more abundant in the regolith, where their abundances have been aug-mented by material from meteoroids and microme-teoroids, whose vapor-mobilized elements vaporized on impact and subsequently condensed onto the surfaces of soil grains.
However, the overall low lunar concentrations of vapor-mobilized elements should not discourage further consideration of the possibility of ore-grade concentrations. The occurrence of such concentra-tions will depend on the interplay between processes that concentrate vapor-mobilized elements and
processes that destroy the ores that have formed. Such ores exist on Earth, even though both the whole Earth and its crust are also depleted in vapor-mobilized elements, although generally not as depleted as the Moon (e.g., Krähenbühl et al., 1973).
8.8. SOLAR-WIND-IMPLANTED ELEMENTS
It is no wonder that the search for biogenic materials (H, C, and N compounds) in the Apollo samples proved to be extremely difficult. Concentra-tions of H, C, and N in lunar samples are in the 100-µg/g range or below. Concentrations of the noble gases (He, Ne, Ar, Kr, and Xe) are even lower. The Moon apparently never accreted significant amounts of these elements when it formed, just as it apparently never accreted much of the vapor-mobilized elements. As with the vapor-mobilized elements, the lunar soils are richer in the biogenic elements (H, C, and N) and noble gases than are the lunar igneous rocks. However, unlike the vapor-mobilized elements, the principal source of the biogenic elements and noble gases in lunar soils is the solar wind, and not meteoroids. For this reason, this group of elements (H, C, N, and the noble gases) are designated the solar-wind-implanted elements. 8.8.1. The Solar Wind
The solar wind (see section 3.11.1) is a plasma of chemical elements, expelled as ionized atoms from the atmosphere of the sun. It bombards all objects in the solar system. Earth’s magnetic field and atmosphere deflect and absorb the solar wind and prevent it from reaching the Earth’s surface and interacting with it. The Moon has no such protection; ions from the solar wind strike the lunar surface with kinetic energies of about 1 keV per nucleon and embed themselves to depths of up to a few hundredths of a micrometer in exposed materials. Solar cosmic rays (associated with solar flares) consist of similar particles with mega-electron volt and higher energies, which penetrate farther (Table 3.5). The solar wind, however, supplies about 2 orders of magnitude more particles than solar cosmic rays, and is therefore the more significant source of solar-wind-implanted elements.
The principal component of the solar wind is H, and there is relatively less deuterium (D) present in the solar wind than in the Earth. The solar-wind isotopic ratio D/H is at least 3 orders of magnitude less than the terrestrial value (1.5 × 10⁻⁴), and for practical purposes is essentially zero because D that may have originally been present in the sun has been destroyed by nuclear reactions there. The second most abundant component of the solar wind is He, with an isotopic ratio of 3He/4He = 4 × 10⁻⁴. This

Lunar Chemistry 437
ratio is substantially higher than the value for terrestrial atmospheric He (1.4 × 10⁻⁶), which has been strongly affected by addition of 4He from the radioactive decay of U- and Th-series elements within the Earth. Next most abundant in the solar wind are C, N, and O, with concentrations an order of magnitude lower than that of He. Heavier elements are also present, most at concentrations too low to observe in lunar soil grains.
8.8.2. Noble Gases (He, Ne, Ar, Kr, and Xe) The fundamental character of the solar-wind-
implanted elements is evident in the concentrations and behavior of the noble gases He, Ne, Ar, Kr, and Xe. These gases, and their various isotopes, can be measured in incredibly small amounts with very high precision by mass spectrometry. These measurements provide unique and extensive information about a broad range of fundamental questions: the chronology of earliest solar-system development; the surface exposure and radiation histories of lunar rocks and soils; the outgassing histories of planets; the nature of the solar wind; and the composition of the sun. The importance of this information and the interest in obtaining it has generated such an extensive literature on noble gases as to create the impression that these gases must be far more abundant in lunar materials than is actually the case.
Concentrations and sources. Concentrations of noble gases in lunar materials are shown in Fig. 8.35. Statistical summaries of the data are given in Table A8.6. In accordance with the convention used for other trace elements in this chapter, these data are presented in weight proportions, i.e., micrograms per gram or nanograms per gram. However, in most of the literature noble gas concentrations are reported as atomic abundances, which have been converted to their equivalent volumes in cubic centimeters of gas at STP (T = 25°C, P = 1 atm) per gram of sample. These values are usually multiplied for convenience by some factor such as 108 (because the volumes are on the order of 10–8 cm3/g). Using micrograms per gram or nanograms per gram instead of atomic percentages for noble gas concentrations partly masks the wide differences in atomic abundance among the noble gases, because the higher atomic weights of the heavier gases (e.g., Kr and Xe) compensate in part for their lower atomic abundances.
There is a consistent pattern to noble gas concen-trations in lunar materials: soils have the highest concentrations and igneous rocks the lowest (Fig. 8.35). Igneous rocks with low noble gas contents may be either monomict samples from the lunar interior (MBAS and HMCT columns in Fig. 8.35) or
they may be polymict materials that were completely melted and outgassed during meteoroid impacts (low values in the BX column of Fig. 8.35, representing mostly clast-poor impact melts; see section 6.4.5). Breccia samples span a range that extends from concentrations as high as those found in soils (for breccias consisting of indurated soils) to as low as those in igneous rocks.
Noble gases in lunar materials can be expected to come from five different sources: (1) an original accretional component trapped in the lunar interior when the Moon formed; (2) radioactive decay within the Moon, involving (a) 40K, which produces 40Ar by beta decay, (b) U- and Th-series elements, which produce 4He by alpha decay, and (c) 235U, 238U, and 244Pu, which produce heavy noble gases (Kr and Xe) by spontaneous fission; (3) the solar wind; (4) impacting meteoroids; and (5) spallation reactions produced in lunar materials by energetic solar and galactic cosmic rays (see section 3.11 and 38Ar data in Fig. 7.27e). The relative contributions from each source can be determined from the isotopic ratios of the various noble gases, which vary substantially from sample to sample. For example, Fig. 8.36 shows the atomic ratios 4He/3He, 22Ne/21Ne, 40Ar/36Ar, and 36Ar/38Ar for various rock types and soils.
Examination of the various noble gas isotopic ratios shows that the contribution from primordial noble gases trapped in the lunar interior is negligible, except perhaps for Xe, a component of which has been attributed either to indigenous lunar Xe or to an early solar wind component (Eugster, 1986; Eugster and Niedermann, 1987). The contribution from meteoroids and comets impacting the lunar surface is also negligible (e.g., Ozima and Podosek, 1983). However, the contribution from the solar wind is important for all noble gases and in fact accounts for the bulk of the noble gases contained in the lunar regolith. Isotopic ratios of solar wind gases fall close to the soil and regolith breccia (S&RB) values shown in Fig. 8.36; more detailed summaries of solar-wind isotopes can be found in Eberhardt et al. (1970) and the monograph by Ozima and Podosek (1983).
The major contribution of the solar wind to the contents of all noble gases produces a large number of good correlations between various noble gases across a wide range of concentrations (Fig. 8.37). These correlations reflect the fact that the data points in Fig. 8.37 include two sources: soils that are rich in noble gases introduced by the solar wind, and lunar igneous rocks, which have little noble gases of any kind. The correlations are tightest between Ne, Kr, and Xe, because these elements do not contain any component produced by radioactive decay within the Moon. The substantial scatter in correlation diagrams based on pairs of these elements
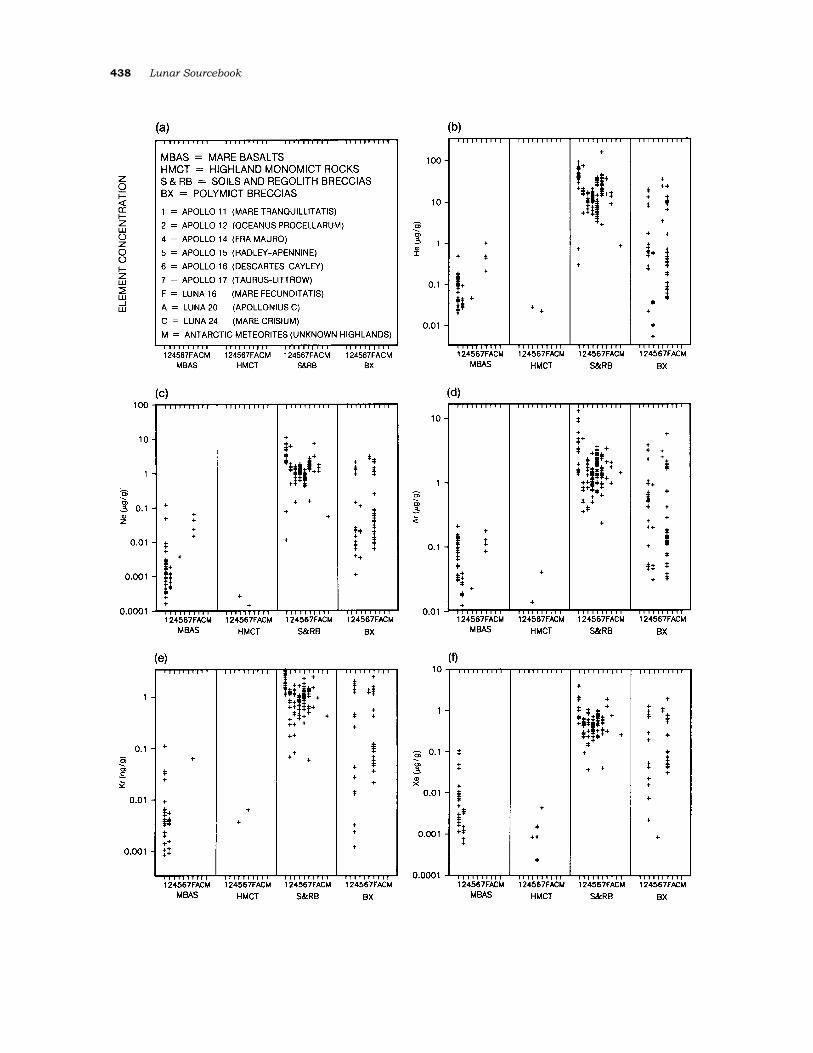
438 Lunar Sourcebook

Lunar Chemistry 439
Fig. 8.35. Concentration ranges of solar-wind-implanted noble-gas elements (He, Ne, Ar, Kr, and Xe) in various lunar materials: mare basalts (MBAS), highland monomict rocks (HMCT), soils and regolith breccias (S&RB), and polymict breccias (BX). Horizontal axes show sample types, separated according to individual missions. Vertical axes show elemental concentrations (Kr and Xe in ng/g; He, Ne, and Ar in µg/g). (a) Graphical key to the plots and abbreviations. Data are presented for (b) helium, He; (c) neon, Ne; (d) argon, Ar; (e) krypton, Kr; (f) xenon, Xe. Statistical summaries for most of these plots are provided in Table A8.6.
arises in part from different rates of loss by diffusion for the individual noble gases from soil grains.
Solar-wind contributions. The influence of the solar wind is also evident in all four of the isotopic ratios plotted in Fig. 8.36. For lunar soils (S&RB), these lie in a narrow range, at or near the highest or the lowest values observed for all samples, because the solar wind is the principal source for those elements in most soils. Deviant values occur for some soils because they are immature (i.e., they have not been exposed near the surface long enough to attain the high concentrations of noble gases present in most other soils). The noble gas concentrations and isotopic ratios have been used to determine the average exposure ages of lunar soils (e.g., Ozima and Podosek, 1983).
The high soil and regolith breccia values for 22Ne/21Ne (Fig. 8.36c) and 36Ar/38Ar (Fig. 8.36d) reflect the relatively high solar wind values for those isotopic ratios. In addition, the 22Ne/21Ne ratio is particularly sensitive to Ne produced by spallation reactions (e.g., Ozima and Podosek, 1983). The mixing of spallation-produced isotopes of Ne, Ar, and other noble gases with the noble-gas isotopes from the solar wind is responsible for the spread in values for the 22Ne/21Ne and the slight variability in 36Ar/38Ar ratios (Figs. 8.36c,d), and is partly responsible for the spread in the other isotopic ratios shown in Fig. 8.36. The 40Ar/36Ar isotopic ratio for lunar soils lies at the low extreme for all lunar materials. This is because the principal source of 40Ar in lunar materials is 40K, which decays to produce 40Ar. 36Ar, which is not produced by radioactive decay but is introduced mostly from the solar wind, can be used as a standard of comparison. The radioactive decay of 40K
raises the 40Ar/36Ar isotope ratios of the rocks (Fig. 8.36e), in which the total Ar concentrations are low (Fig. 8.35d). However, the low K concentrations of most lunar rocks do not generate enough 40Ar to make a significant contribution to the higher Ar concentrations found in most soils, much of which has been introduced by the solar wind. Therefore, materials with high 40Ar/36Ar ratios tend to be those that are low in total Ar, i.e., the lunar rocks.
It might seem that the 4He/3He ratio (Fig. 8.36b) would also be low in lunar soils because of the similarity to 40Ar/36Ar in that there is a substantial contribution of 4He from radioactive decay within the
Moon, as there is of 40Ar. However, this is not the case, and the difference lies in the amount of He produced by galactic and solar cosmic rays in spallation reactions. Lunar materials with low 4He/ 3He ratios are also those with low overall concen-trations of He and other noble gases, and their 4He/ 3He should be the most affected by 4He added from radioactive decay. However, this effect is overwhelmed by the very low 4He/3He ratios for spallation products (~5, Ozima and Podosek, 1983). No samples of lunar igneous rocks have yet shown a combination of low He concentrations and very high 4He/3He ratios. Any such rock would have had to have an extremely short residence time near the lunar surface, so there would have been little time to form He by spallation, and the rock’s He content would be dominated by the 4He produced through radioactive decay.
Spallation reactions also affect the isotopic ratios of other noble gases. For Kr and Xe, the relative proportions of the lightest and least abundant isotopes are most affected by contributions from spallation. Additional scatter for Kr and Xe is produced by contributions of these heavy noble gases from spontaneous fission of such heavy atoms as 244Pu and 235U; these fission contributions have been observed in some lunar samples (e.g., Bematowicz et al., 1977).
The lunar atmosphere. Some of the 40Ar and 4He produced in the lunar interior by radioactive decay is carried to the lunar surface by volcanic eruptions, some leaks to the lunar surface by diffusion through fractures in the crust, and some is released from near-surface soils and rocks by heating and vaporization during meteoroid impacts. Much of this gas is lost to space because of the Moon’s low escape velocity (2.38 km/sec) and because of accelerations due to ionization by the solar wind (section 3.9). Surprisingly, a significant proportion of it is recaptured and trapped in the lunar surface. This effect is particularly evident for 40Ar, which has much higher concentrations relative to the other Ar isotopes in lunar soils than can be explained by contributions from the solar wind, in which the value of 40Ar/36Ar is negligibly low (<10–4; Clayton, 1968). It appears that a significant fraction of the 40Ar atoms that reach the lunar atmosphere and become ionized are accelerated not into space
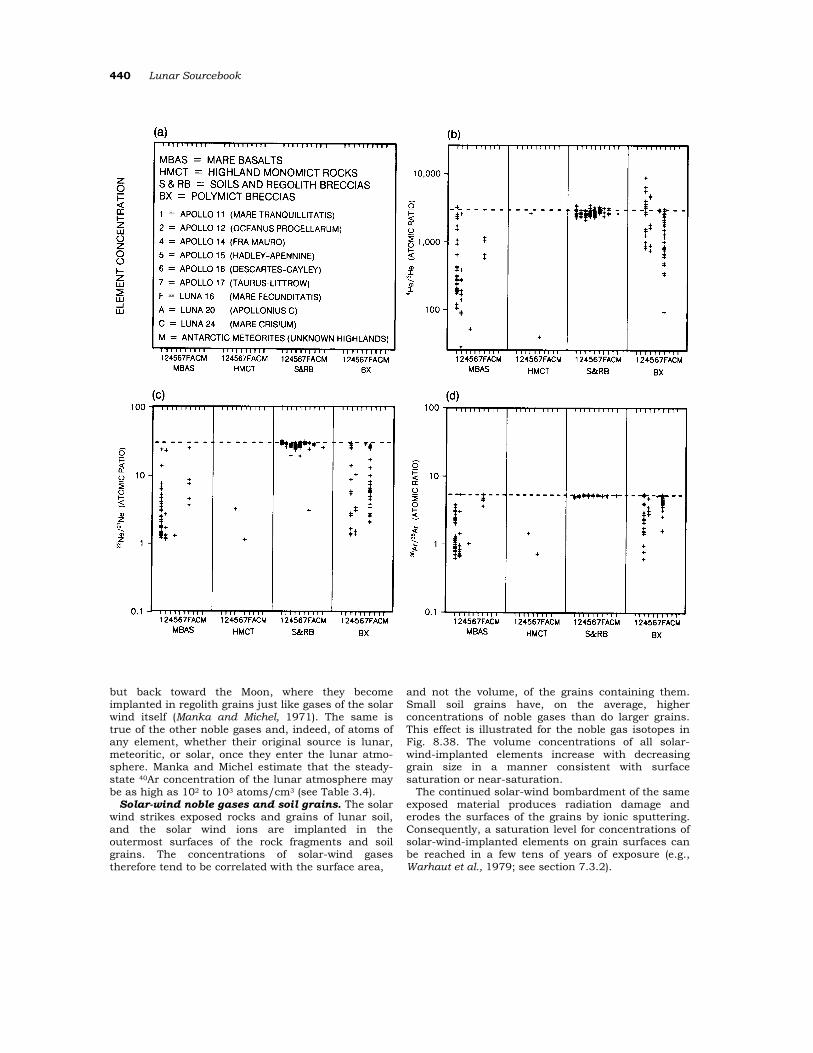
440 Lunar Sourcebook
but back toward the Moon, where they become implanted in regolith grains just like gases of the solar wind itself (Manka and Michel, 1971). The same is true of the other noble gases and, indeed, of atoms of any element, whether their original source is lunar, meteoritic, or solar, once they enter the lunar atmo-sphere. Manka and Michel estimate that the steady-state 40Ar concentration of the lunar atmosphere may be as high as 102 to 103 atoms/cm3 (see Table 3.4).
Solar-wind noble gases and soil grains. The solar wind strikes exposed rocks and grains of lunar soil, and the solar wind ions are implanted in the outermost surfaces of the rock fragments and soil grains. The concentrations of solar-wind gases therefore tend to be correlated with the surface area,
and not the volume, of the grains containing them. Small soil grains have, on the average, higher concentrations of noble gases than do larger grains. This effect is illustrated for the noble gas isotopes in Fig. 8.38. The volume concentrations of all solar-wind-implanted elements increase with decreasing grain size in a manner consistent with surface saturation or near-saturation.
The continued solar-wind bombardment of the same exposed material produces radiation damage and erodes the surfaces of the grains by ionic sputtering. Consequently, a saturation level for concentrations of solar-wind-implanted elements on grain surfaces can be reached in a few tens of years of exposure (e.g., Warhaut et al., 1979; see section 7.3.2).
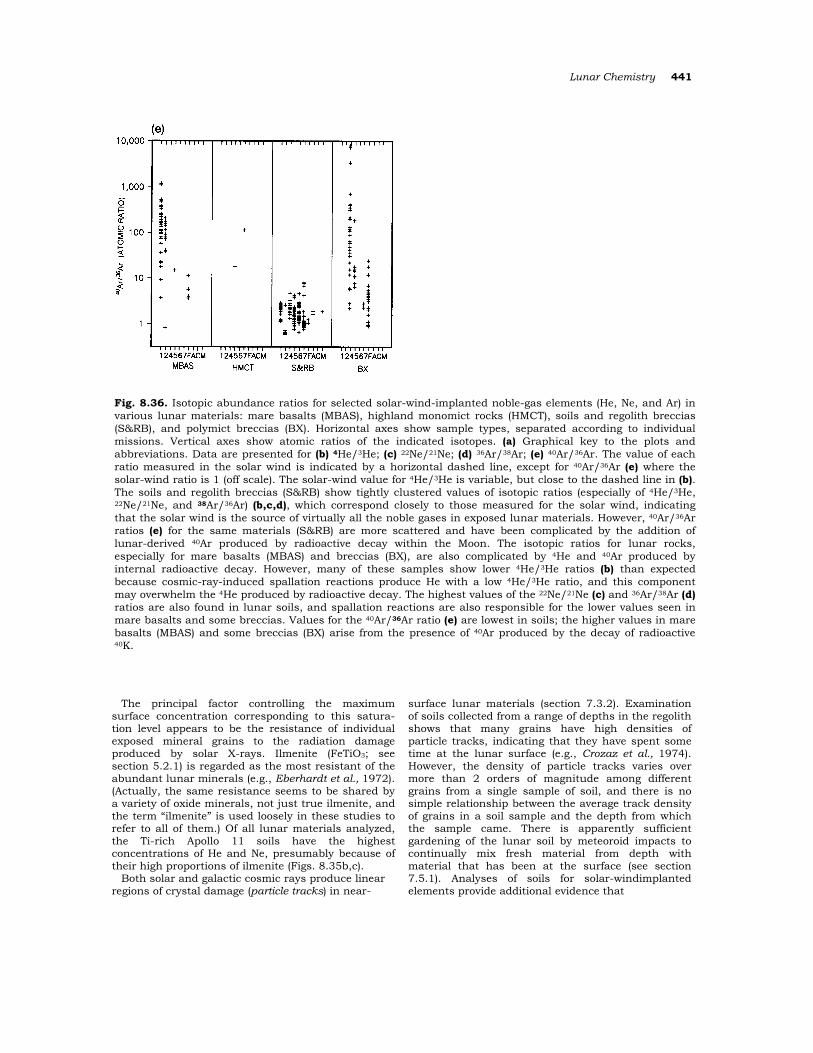
Lunar Chemistry 441
Fig. 8.36. Isotopic abundance ratios for selected solar-wind-implanted noble-gas elements (He, Ne, and Ar) in various lunar materials: mare basalts (MBAS), highland monomict rocks (HMCT), soils and regolith breccias (S&RB), and polymict breccias (BX). Horizontal axes show sample types, separated according to individual missions. Vertical axes show atomic ratios of the indicated isotopes. (a) Graphical key to the plots and abbreviations. Data are presented for (b) 4He/3He; (c) 22Ne/21Ne; (d) 36Ar/38Ar; (e) 40Ar/36Ar. The value of each ratio measured in the solar wind is indicated by a horizontal dashed line, except for 40Ar/36Ar (e) where the solar-wind ratio is 1 (off scale). The solar-wind value for 4He/3He is variable, but close to the dashed line in (b). The soils and regolith breccias (S&RB) show tightly clustered values of isotopic ratios (especially of 4He/3He, 22Ne/21Ne, and 38Ar/36Ar) (b,c,d), which correspond closely to those measured for the solar wind, indicating that the solar wind is the source of virtually all the noble gases in exposed lunar materials. However, 40Ar/36Ar ratios (e) for the same materials (S&RB) are more scattered and have been complicated by the addition of lunar-derived 40Ar produced by radioactive decay within the Moon. The isotopic ratios for lunar rocks, especially for mare basalts (MBAS) and breccias (BX), are also complicated by 4He and 40Ar produced by internal radioactive decay. However, many of these samples show lower 4He/3He ratios (b) than expected because cosmic-ray-induced spallation reactions produce He with a low 4He/3He ratio, and this component may overwhelm the 4He produced by radioactive decay. The highest values of the 22Ne/21Ne (c) and 36Ar/38Ar (d) ratios are also found in lunar soils, and spallation reactions are also responsible for the lower values seen in mare basalts and some breccias. Values for the 40Ar/36Ar ratio (e) are lowest in soils; the higher values in mare basalts (MBAS) and some breccias (BX) arise from the presence of 40Ar produced by the decay of radioactive 40K.
The principal factor controlling the maximum surface concentration corresponding to this satura-tion level appears to be the resistance of individual exposed mineral grains to the radiation damage produced by solar X-rays. Ilmenite (FeTiO3; see section 5.2.1) is regarded as the most resistant of the abundant lunar minerals (e.g., Eberhardt et al., 1972). (Actually, the same resistance seems to be shared by a variety of oxide minerals, not just true ilmenite, and the term “ilmenite” is used loosely in these studies to refer to all of them.) Of all lunar materials analyzed, the Ti-rich Apollo 11 soils have the highest concentrations of He and Ne, presumably because of their high proportions of ilmenite (Figs. 8.35b,c).
Both solar and galactic cosmic rays produce linear regions of crystal damage (particle tracks) in near-
surface lunar materials (section 7.3.2). Examination of soils collected from a range of depths in the regolith shows that many grains have high densities of particle tracks, indicating that they have spent some time at the lunar surface (e.g., Crozaz et al., 1974). However, the density of particle tracks varies over more than 2 orders of magnitude among different grains from a single sample of soil, and there is no simple relationship between the average track density of grains in a soil sample and the depth from which the sample came. There is apparently sufficient gardening of the lunar soil by meteoroid impacts to continually mix fresh material from depth with material that has been at the surface (see section 7.5.1). Analyses of soils for solar-windimplanted elements provide additional evidence that

442 Lunar Sourcebook
Fig. 8.37. Correlation plots for solar-wind-implanted noble-gas elements (He, Ne, Ar, Kr, and Xe) in a range of lunar sample materials. (a) Ne vs. He; (b) Ar vs. He; (c) Xe vs. He; (d) Xe vs. Kr. Horizontal and vertical axes, both logarithmic, show elemental concentrations (in µg/g, except Kr and Xe in ng/g). Data are the same as shown in Fig. 8.35. The various noble-gas pairs show positive correlations that range from weak [Xe-He, (c)] to strong [Xe-Kr, (d)]. The correlations tend to be better between pairs of heavier noble gases [Xe-Kr, (d)] because these have similar (and lower) diffusion coefficients and come mainly from a single source, the solar wind. Much of the scatter is due to differential loss by diffusion for different elements, to significant contributions of some isotopes from other sources (e.g., 4He and 40Ar from radioactive decay), or to both.
soils at all depths contain materials that were once exposed at the lunar surface. Soils collected from as deep as the bottoms of the Apollo deep-drill cores (2–3 m down) contain essentially the same bulk concentrations of solar-wind-implanted elements as do soils collected from the surface (e.g., Pepin et al., 1975).
There is some evidence for significant variations in the strength of the solar wind or in the rate at which solar-wind-implanted elements have been added to the Moon over geologic time; this evidence
is summarized in section 7.7.2. In general, ancient soils exposed at the lunar surface about 4 b.y. ago contain approximately the same concentrations of solar-wind-implanted elements as are found in much younger soils. However, some soils are deficient in solar-wind-implanted elements and in other features produced by long surface exposure. Such soils are either associated with young craters, which have excavated and exposed material that has had little or no previous exposure to the surface, or they occur within thick layers of similar materials,

Lunar Chemistry 443
Fig. 8.38. Concentrations of different solar-wind-implanted gases as a function of grain size in two lunar soil samples. (a) Noble-gas measurements were made on a sample of soil 76321 that had been sieved into separate grain-size fractions (Bogard et al., 1974); (b) H concentrations vs. grain size for soil 15080 (DesMarais et al., 1974). Horizontal axes show grain size (in µm); vertical axes show gas content (in µg/g). For all solar-wind-implanted gases, there is a definite increase in concentration with decreasing grain size, indicating that the amount of noble gas present is closely correlated with the surfaces of the grains and not with the volumes.
indicating that they were buried shortly after their exposure on the surface and have been protected from gardening ever since. The concentrations of solar-wind-implanted elements in lunar soils generally correlate with other indices of soil maturity, such as IS/FeO and agglutinate content (see Fig. 7.14). 8.8.3. Biogenic Elements (H, C, and N)
Concentrations and contamination. Concen-trations of total H, total C, and total N in lunar materials are shown in Fig. 8.39. The analyses plotted have been carefully selected from the literature, and many analyses, especially early ones, have been omitted for a variety of reasons, discussed below.
Many early analyses of lunar rocks (both mare basalts and highland monomict rocks) have been omitted. These samples were probably contaminated with N2, H2O, and CO2 from the Earth’s atmosphere before being placed in the curatorial processing cabinets, and they were probably contaminated further with N2 from the atmospheres within the cabinets themselves (e.g., Becker et al., 1976). Epstein and Taylor (1972), on the basis of release temper-atures and isotopic compositions, suggest that about half the H in early analyses of lunar soils is from terrestrial water contamination. More recently obtained measurements support this view (e.g., Gibson and Bustin, 1987). Lunar soils have a small but significant adsorptive capacity for water (~1500 µg H2O/g soil) and other gases, although
they have almost no absorptive capacity (e.g., Cadenhead et al., 1972; Fuller et al., 1971; see section 3.9.1).
Contamination by H, C, and N gases is plausible in view of the collection and transport histories of the lunar samples. When collected on the lunar surface, the samples were placed in teflon bags, in which they were transported to Earth. Unfortunately, these bags allowed some of the outside atmospheric gas to enter by diffusion, and the samples were therefore exposed to the Apollo spacecraft atmosphere and then to the atmosphere of the Lunar Receiving Laboratory for various lengths of time before they were finally stored in ultrapure nitrogen gas.
Hydrogen concentrations in monomict lunar rocks are probably less than 1 µg/g, and those of N and C may also be that low. These measurements of H, C, and N were made on interior rock fragments, after the samples had been warmed to high enough temperatures to insure that all terrestrial contami-nation had been removed. However, even these low amounts may not be indigenous to the Moon, because the measured gases may include a component produced by cosmic-ray-induced spallation reactions. Because of this complication, the true indigenous levels of H, C, and N in lunar monomict rocks are only known to be very low, and their isotopic ratios are uncertain.
In selecting soil analyses, if results from more than one analysis of a single sample were available, and one result was substantially higher than the rest, only

444 Lunar Sourcebook
Fig. 8.39. Concentration ranges of solar-wind-implanted biogenic elements (H, C, and N) in various lunar materials: mare basalts (MBAS), highland monomict rocks (HMCT), soils and regolith breccias (S&RB), and polymict breccias (BX). Horizontal axis shows sample types, separated according to individual missions. Vertical axis shows elemental concentrations (in µg/g). (a) Graphical key to the plots and abbreviations. Data are presented for (b) hydrogen, H; (c) carbon, C; (d) nitrogen, N. Values generally range between 1 and 100 µg/g. Statistical summaries for most of these plots are provided in Table A8.6.
the lower values were included in Fig. 8.39. For other soil samples, some values that include contaminating terrestrial H, C, and N were undoubtedly retained. (This problem is even more serious among the breccias, for which few duplicate analyses are available. In fact, for many breccias, true duplication of an analysis is impossible because of the small-scale heterogeneity within breccias.)
The H concentrations in most mature soils are about 50 µg/g, and N concentrations are about the
same (Figs. 8.39b,d). Some soils may have concen-trations of C exceeding 100 µg/g (Fig. 8.39c) and comparable N concentrations. Similarly, some breccias may have concentrations higher than 100 µg/g for C or N, but such high values are open to question in view of the ease with which contamination can occur. In summary, despite an attempt to select the most accurate data, Fig. 8.39 probably contains some values for soils, and surely contains some for breccias, that are too high because of
Lunar Chemistry 445
terrestrial contamination. In any case, concentrations of H, C, and N are
uniformly low in all lunar materials. As with the vapor-mobilized elements and the noble gases, the biogenic elements are more abundant in lunar soils than in lunar rocks. In fact, many soils and some breccias that contain former soils have H, C, and N concentrations some 2 orders of magnitude higher than those of mare basalts and highland monomict rocks. However, some breccia fragments also have very low concentrations, indicating that they are either (1) fragments of mare basalts or of highland monomict rocks that are uncontaminated by solar wind or (2) impact-melt rocks that have been so thoroughly outgassed that they no longer contain volatile elements. It is not known how many of the breccia samples plotted in Fig. 8.39 contain a combination of solar-wind gas and terrestrial contaminants. The data for breccias are the least well screened against contamination of any group of samples.
Solar-wind contributions. The solar-wind origin for most of the H, C, and N found in lunar surface materials is well established. Therefore, the ratios of H, C, and N concentrations, especially in soils and breccias, should correspond to the ratios in the solar wind, much as in the case for the noble gases. Correlations between H, C, and N concentrations in lunar soils are shown in Figs. 8.40a,b. Although the elemental ratios in lunar soils are close to those in the solar wind, the data show substantial scatter. Some of this scatter may reflect analytical error, and some may reflect actual differences in the retentivity of different elements in the lunar soil, but much of the scatter probably reflects terrestrial contamination.
Soils from the Apollo 17 drill core (see section 7.4.3) have H concentrations that correlate reasonably well with He, and their H/He ratios are close to those of the solar wind (Stoenner et al., 1974). In contrast, samples of soils from the Apollo 16 drill core (section 7.4.3) analyzed by the same investigators have H/He ratios a factor of 2 higher. The higher H/He ratios in these Apollo 16 soils presumably arise from preferential loss of He by diffusion. This process would occur to a lesser extent in the Apollo 17 samples, because they have higher proportions of the mineral ilmenite, which retains He better than other minerals.
In evaluating the accuracy of measured concen-trations of H, C, and N in lunar soils and rocks, the occurrence of these elements in solar-wind propor-tions, together with strong mutual correlations between their concentrations in a suite of related samples, provide the best evidence that the measured quantities are true, uncontaminated lunar
concentrations. A good discussion of correlations between H, C, N, and He as related to a solar-wind source is given by Becker (1980); Fig. 8.40c shows the correlation between C and He. Thiemens and Clayton (1980) demonstrated, for soils from the Apollo 15 and 17 drill cores, that there is a good correlation between N concentrations and measures of soil maturity such as IS/FeO (e.g., Housley et al., 1973a,b; Morris, 1976) (Fig. 8.40d; see also Fig. 7.14f for N-IS/FeO correlations in surface soils).
Meteoroid contributions of biogenic elements to the “lunar atmosphere.” In addition to the major contributions of H, C, and N from the solar wind, appreciable amounts of water and carbonaceous materials have been introduced into the lunar environment by the impact of carbonaceous meteo-roids, asteroids, and comets. Much of this material must have been vaporized by impact-produced heating and evaporated into space. Volatile materials such as water and light hydrocarbons, once released into the lunar atmosphere, undergo photoionization, and once ionized they are accelerated by the electrical fields associated with the solar wind. These ionized species become entrained in the flow of the solar wind and are either swept away into space, or accelerated toward the Moon and into the regolith, as discussed above (section 8.8.2). This process, combined with continued solar heating of the lunar surface and repeated gardening of the regolith, would cause most of the volatile materials introduced by impacting objects to be lost into space. Nevertheless, our direct exploration of the Moon is still limited, and it is possible that polar lunar craters with permanently shaded floors might contain substantial quantities of water and carbonaceous material that has been cold-trapped there from the temporary atmospheres that formed when comets, carbonaceous meteoroids, or other volatile-rich bodies collided with the Moon (e.g., Arnold, 1979; Hodges, 1980; Lanzerotti and Brown, 1981; see section 3.8).
Bibring et al. (1974a) considered the probability that C and its compounds, which had been released temporarily into the lunar atmosphere from any solid sources, could be reimplanted in the lunar soil. They concluded that such a source was negligible relative to the C from trapped solar wind.
Despite the possibility of reimplantation in the lunar regolith of volatile materials brought to the Moon in impacting objects, little if any actual contribution of H, C, or N to the lunar regolith from cometary or meteoritic sources can be confirmed. Epstein and Taylor (1973) and Wszolek et al. (1973) discussed meteoroid sources, and Gibson and Moore (1973b) suggested a cometary origin for C in Apollo 16 soil 61221 on the basis of gas-release

446 Lunar Sourcebook.
Fig. 8.40. Correlations between solar-wind-implanted biogenic elements (H-C and N-C), and relative to He (a solar-wind-implanted noble gas) and IS/FeO (a measure of metallic Fe that is an index of soil maturity) in a range of lunar sample materials. (a) H vs. C; (b) N vs. C; (c) He vs. C; (d) N vs. IS/FeO. Horizontal and vertical axes, both linear, show elemental concentrations (in µg/g, except IS/FeO in arbitrary units). Although the H-C correlations (a) are poor, the N-C correlations (b) and He-C correlations (c) are better, indicating that the principal source for both the biogenic elements and He is the solar wind. Concentrations of these elements, especially N, correlate closely with indices of soil maturity, such as IS/FeO, indicating (as would be expected) that solar-wind-implanted gases are more abundant in soils that have been exposed at the lunar surface for longer periods of time. Data for the N-IS/FeO plot (d) are from Thiemens and Clayton (1980). Data points for the other elements are from the same dataset used in Fig. 8.39.
patterns. Thiemens and Clayton (1980), however, found no evidence to require any other source than the solar wind for lunar H, C, and N. They point out that soil 61221 actually has relatively low concen-trations of solar-wind-implanted elements; it is not a mature soil, so its exposure on the lunar surface has not been long. They note that the special property of 61221 that makes it appear rich in H, C, and N is the ease with which its volatiles are released on pyrolysis. This characteristic may
actually be a consequence of the soil’s immaturity, because the proportion of glassy, impact-produced agglutinates is so low that only a small fraction of the H, C, and N has been embedded in the more retentive glass. In soil 61221, these elements still reside near the boundaries of grains of mineral and lithic fragments, from which they are easily released during pyrolysis.
The most promising samples in which to look for higher concentrations of H, C, and N, either of

Lunar Chemistry 447
primordial lunar origin or from later meteoroid or cometary additions, may be the Apollo 16 breccias that have high contents of vapor-mobilized elements and that show signs of Fe oxides, e.g., “Rusty Rock” sample 66095 (see section 8.7.6). However, Epstein and Taylor (1974) concluded, on the basis of D/H ratios and the low temperatures of release for most of the H in samples of this rock (20% of the H released at 25°C, and nearly all by 200°C), that the H in sample 66095 comes from reaction of lunar chlorides (probably lawrencite, FeCl2) with terrestrial water. The possibility that significant indigenous water is present in lunar materials is not improved by the very low 0 fugacities observed for lunar basalts (<10–15 to 10–12; Sato et al., 1973), indicating the virtually total absence of water that would dissociate to produce O during their crystallization.
Various experiments show that the bulk of the H, C, and N in lunar soils is either located near the surfaces of rock and mineral grains or is rather uniformly distributed within agglutinates, in which many grains are embedded intact in a glassy matrix. Des Marais et al. (1975) indicate, from analyses on different grain size fractions, that about half the C in a typical soil is surface-correlated (i.e., enriched in the finer grain sizes), but a higher proportion is near the grain surfaces in immature soils. Filler et al. (1978) found about a third to half of the C to be in the outer 0.5 µm of grains. Stripping experiments, in which the outer portions of the grains are progressively dissolved (e.g., by HF leaching) and the released gases analyzed, confirm this proportion (e.g., Becker et al., 1976).
To explain these results, Warhaut et al. (1979) provided a model involving the production of traps within grains, combined with rates of surface erosion of grains by radiation damage, to account for the observed profiles of solar-wind-implanted elements as a function of depth within lunar soil grains. Those soil processes that are constructive (i.e., processes like agglutinate formation and shock lithification that produce larger particles from smaller ones) trap these elements within glassy agglutinates and lightly-heated breccias.
Many of the solar-wind-implanted elements trapped in lunar soil grains have reacted to form molecules, and these molecules have been partially characterized. Ions of H, C, and N in the incoming solar wind are implanted in lunar soil grains with kinetic energies that significantly exceed the energies typical of chemical reactions. The kinetic energies of the incoming ions disrupt the crystal structure in the vicinity of the implanted ions and enable the ions to react aggressively with the 0 in the crystal lattice.
Pyrolysis of lunar soils releases CO, CO2, H2O, and other, less abundant species (e.g., Simoneit et al.,
1973). Nitrogen is released as N2 gas; any N oxides present before analysis are probably destroyed during pyrolysis. The products of pyrolysis of lunar soils appear over a range of temperatures, but most of the H, C, and N compounds are removed at temperatures in the vicinity of 700°C or higher (e.g., Simoneit et al., 1973), and complete melting of the soils is required to extract a substantial high-temperature fraction.
Despite the tendency of H, C, and N molecular species to be released only at high temperatures during pyrolysis, much additional information about them has been obtained at lower temperatures, especially in experiments that involve crushing, grinding, and leaching. Only a small fraction of these compounds is released on crushing of the samples (e.g., Gibson and Andrawes, 1978b). Graham et al. (1979) showed that grinding of a basalt in air results in strong adsorption of N2 and CO2 from air onto the pulverized basalt, and they demonstrated that these adsorbed gases are released at high temperatures (principally in two releases, at ~700°C and 1050°C) that are comparable to the temperatures required for release of the same gases from mature lunar soils. Leaching of soils with deuterated acid produces small amounts of C2H2, CH4, HCN, and their deuterated counterparts, as well as CO2 and N2. Bibring et al. (1974b) implanted D, C, and N ions into feldspar grains and were able to simulate many of the thermal release and leaching patterns of lunar soils. Pillinger et al. (1974) argued that their leaching and hydrolysis patterns indicated the presence of C in the form of carbide.
Because D is converted to 3He by nuclear reactions in stars, the original D in the sun has been largely consumed. As a result, the D/H ratio in the solar wind is so low that any D released from lunar samples must come from some other source (e.g., Epstein and Taylor, 1970; Hintenberger et al., 1970). Small amounts of D not associated with terrestrial contamination and released at high temperature have been definitely identified in lunar rocks. This D may have been produced in the rocks by cosmic-ray-induced spallation.
Solar nitrogen anomalies. Thiemens and Clayton (1980) found that the old, immature soils in the Apollo 17 deep-drill core have 15N/14N ratios some 7% lower than that of the present terrestrial atmosphere, while the young, mature soils have values closely approaching the terrestrial value. Such isotopic anomalies for N have been tentatively interpreted as the result of a secular increase in the 15N/14N ratio of solar-wind N (e.g., Kerridge, 1980; Clayton and Thiemens, 1980; see also Becker, 1980) (see also section 7.7.2, where evidence for an ~15%/b.y. increase in 15N/14N ratio is summarized).

448 Lunar Sourcebook
8.8.4. Solar-Wind-Implanted Elements as Lunar Resources
Concentrations of H, noble gases, N, and C, are extremely low, usually <100 µg/g, in lunar soils. However, with only moderate heating (up to 700°C), the cumulate amounts of these gases in mature soils are adequate to generate pressures of up to 10 atm; most of this evolved gas would be H2. Such high gas pressures would facilitate extraction of the gases from the soil, thus compensating to some extent for the large quantities of soil that would have to be heated to obtain significant amounts of gas.
Such gas extraction on the Moon might prove economical if it could produce H2 with a high enough efficiency to be used as a rocket fuel, principally for near-Earth space activities. Such a use would be even more efficient if the H2 could be combined with lunar-produced O2. Oxygen is abundant in combined form in all lunar rocks and soils, from which it might be extracted by several processes (see section A11.2.5). An additional use of lunar-derived H2 and O2 would be in life support (water and oxygen) for long-term human activities on the Moon.
A relatively fine-grained fraction of any lunar soil, perhaps an ilmenite-rich one, would be the best ore for solar-wind-implanted elements. However, the extra cost of separating individual size fractions from
the already fine-grained and highly cohesive (section 9.1.7) lunar soil might offset the advantage obtained by enriching the soil feedstock.
Recently, an intriguing proposal has been made to mine lunar 3He from the regolith for use as fuel in power-generating fusion reactors on Earth (Wittenberg et al., 1987). Helium-3 has several advantages over tritium (3H; the commonly considered fuel) for large-scale energy production by fusion. In the standard 3H fusion schemes, a byproduct of the power-generating fusion reaction is abundant high-energy neutrons, which can cause extensive radiation damage to the fusion reactors. In contrast, very few neutrons are produced by the 3He reaction, in which high-energy protons are generated rather than neutrons. These protons create no long-term radioactivity from the containment system. In addition, 3H itself is radioactive and therefore a health hazard. Helium-3 is not.
Unfortunately, most of the He available on Earth is 4He that has been produced by radioactive decay, and the amount of 3He available from terrestrial resources is meager. In contrast, the quantities of 3He in the upper meter of the lunar regolith, where it has been introduced by the solar wind for billions of years, are sufficient to supply the energy needs of the Earth for hundreds of years.

Lunar Chemistry 449
APPENDIX: STATISTICAL SUMMARIES OF LUNAR CHEMISTRY
TABLE A8.1. Statistical data for concentrations of major elements (values in weight percent) (see section 8.3, Fig. 8.2).

450 Lunar Sourcebook
TABLE A8.1. (continued).

Lunar Chemistry 451
TABLE A8.1. (continued).
Note that standard deviations are not given for those categories where the number of analyses (N) is <3. N = number of analyses, Std. dev. = standard deviation, MBAS = mare basalts, S&RB = soils and regolith breccias, BX = polymict breccias, AMET = Antarctic lunar meteorites. Highland monomict rocks (HMCT in Fig. 8.2) are listed by individual rock type name (anorthosite, norite, and troctolite; see section 6.3). References: Blanchard et al. (1974, 1975a, 1978); Compston et al. (1972a); Dymek et al. (1975a,b); Gillum et al. (1972); Haskin et al. (1973, 1974, 1981); Helmke et al. (1973); Hubbard et al. (1973); James et al. (1984); Jerome and Phillipot (1973); Kallemeyn and Warren (1983); Korotev (1981); Korotev et al. (1983); Laul and Schmitt (1973a,b); Laul et al. (1977, 1983); M. Lindstrom (1984); M. Lindstrom et al. (1984, 1986); Lunatic Asylum (1970); Ma et al. (1977); D. S. McKay et al. (1986); Nava and Philpotts (1973); Ostertag et al. (1986); Palme et al. (1978, 1983); Rhodes and Blanchard (1980, 1981); Rhodes and Hubbard (1973); Rhodes et al. (1974, 1976, 1977); Ryder and Norman (1978, 1979); Shervais et al. (1985a,b); Vinogradov (1971, 1973); Wänke et al. (1970a, 1971, 1972, 1973, 1974, 1975, 1976, 1977); Warren and Kallemeyn (1986); Warren and Wasson (1979b, 1980); Winzer et al. (1974).

TABLE A8.2. Statistical data for concentrations of incompatible trace elements (values are in µg/g) (see section 8.4, Fig. 8.7).
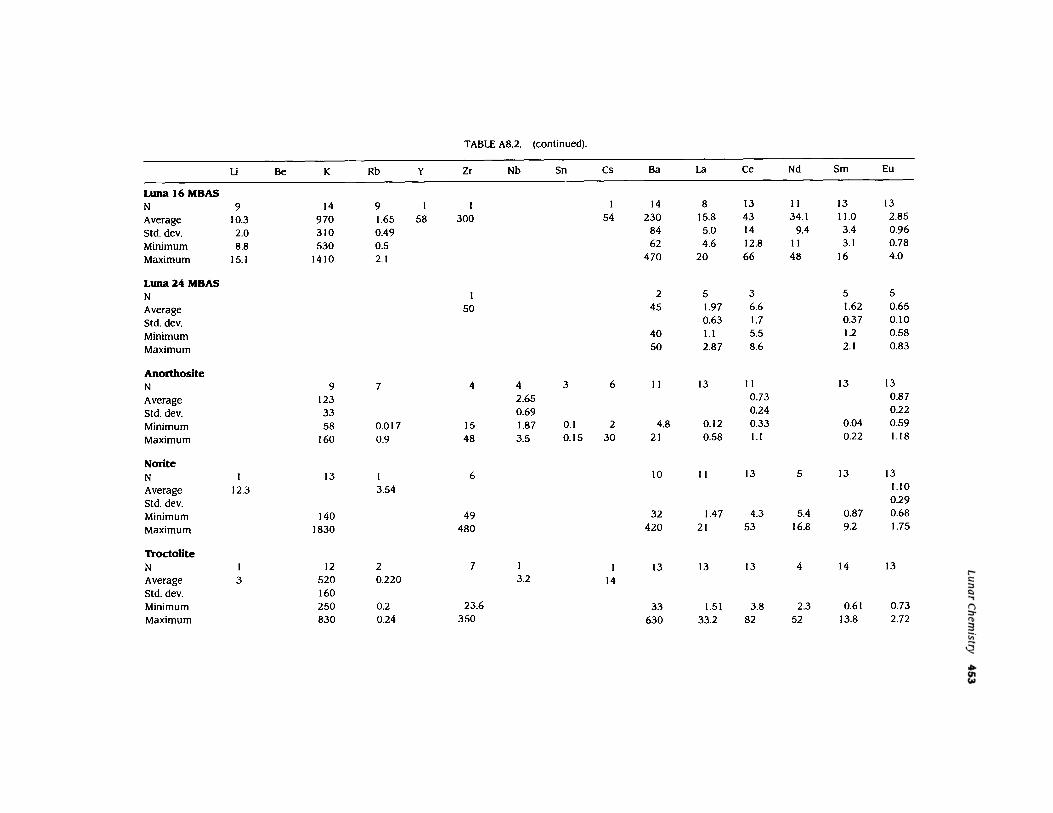

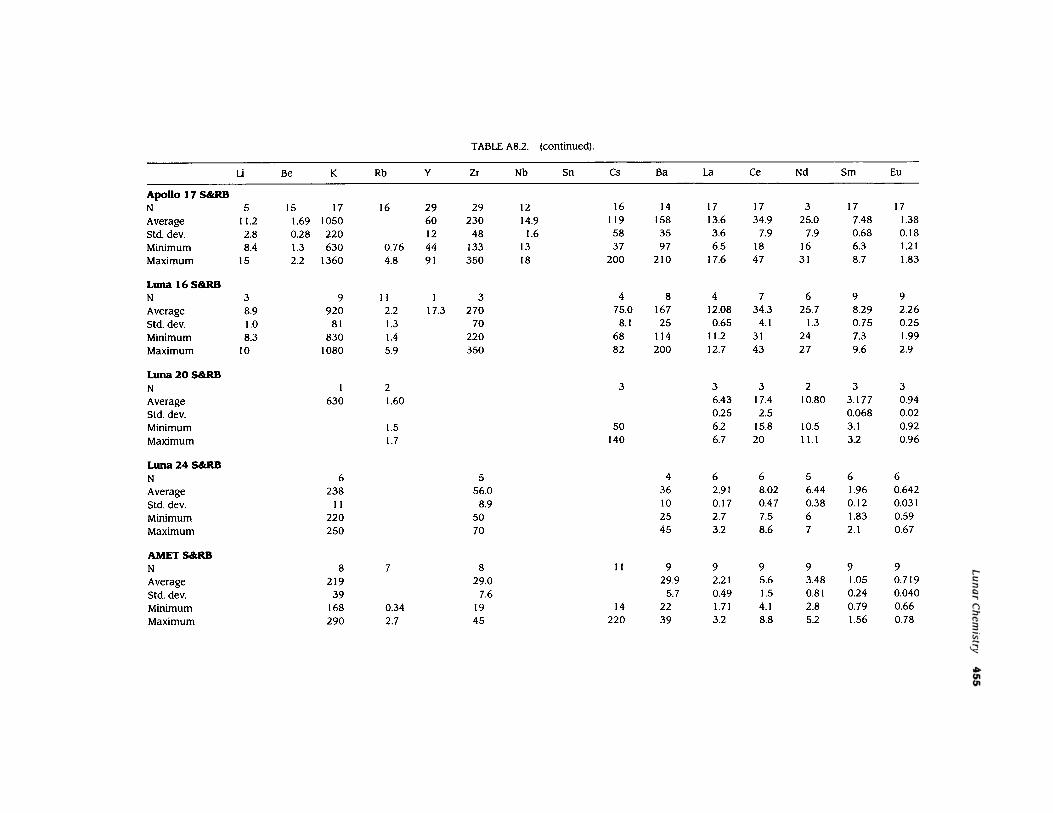
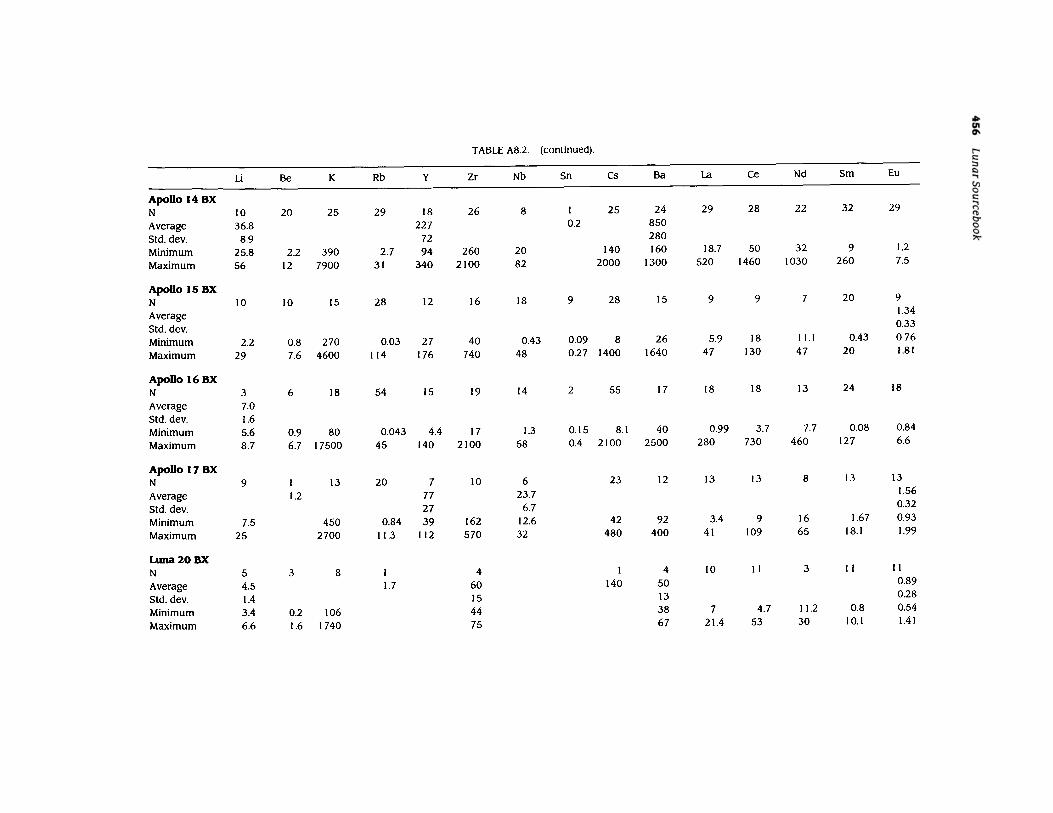

TABLE A8.2. (continued).


TABLE A8.2. (continued).

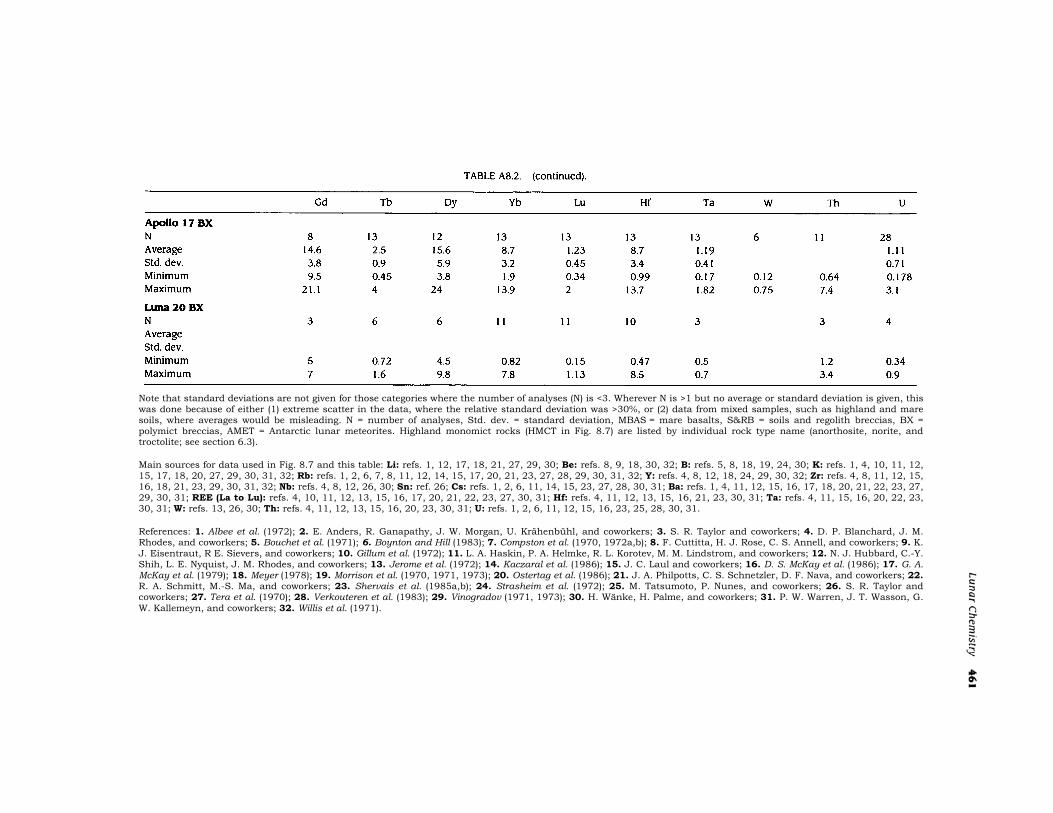
Note that standard deviations are not given for those categories where the number of analyses (N) is <3. Wherever N is >1 but no average or standard deviation is given, this was done because of either (1) extreme scatter in the data, where the relative standard deviation was >30%, or (2) data from mixed samples, such as highland and mare soils, where averages would be misleading. N = number of analyses, Std. dev. = standard deviation, MBAS = mare basalts, S&RB = soils and regolith breccias, BX = polymict breccias, AMET = Antarctic lunar meteorites. Highland monomict rocks (HMCT in Fig. 8.7) are listed by individual rock type name (anorthosite, norite, and troctolite; see section 6.3).
Main sources for data used in Fig. 8.7 and this table: Li: refs. 1, 12, 17, 18, 21, 27, 29, 30; Be: refs. 8, 9, 18, 30, 32; B: refs. 5, 8, 18, 19, 24, 30; K: refs. 1, 4, 10, 11, 12, 15, 17, 18, 20, 27, 29, 30, 31, 32; Rb: refs. 1, 2, 6, 7, 8, 11, 12, 14, 15, 17, 20, 21, 23, 27, 28, 29, 30, 31, 32; Y: refs. 4, 8, 12, 18, 24, 29, 30, 32; Zr: refs. 4, 8, 11, 12, 15, 16, 18, 21, 23, 29, 30, 31, 32; Nb: refs. 4, 8, 12, 26, 30; Sn: ref. 26; Cs: refs. 1, 2, 6, 11, 14, 15, 23, 27, 28, 30, 31; Ba: refs. 1, 4, 11, 12, 15, 16, 17, 18, 20, 21, 22, 23, 27, 29, 30, 31; REE (La to Lu): refs. 4, 10, 11, 12, 13, 15, 16, 17, 20, 21, 22, 23, 27, 30, 31; Hf: refs. 4, 11, 12, 13, 15, 16, 21, 23, 30, 31; Ta: refs. 4, 11, 15, 16, 20, 22, 23, 30, 31; W: refs. 13, 26, 30; Th: refs. 4, 11, 12, 13, 15, 16, 20, 23, 30, 31; U: refs. 1, 2, 6, 11, 12, 15, 16, 23, 25, 28, 30, 31.
References: 1. Albee et al. (1972); 2. E. Anders, R. Ganapathy, J. W. Morgan, U. Krähenbühl, and coworkers; 3. S. R. Taylor and coworkers; 4. D. P. Blanchard, J. M. Rhodes, and coworkers; 5. Bouchet et al. (1971); 6. Boynton and Hill (1983); 7. Compston et al. (1970, 1972a,b); 8. F. Cuttitta, H. J. Rose, C. S. Annell, and coworkers; 9. K. J. Eisentraut, R E. Sievers, and coworkers; 10. Gillum et al. (1972); 11. L. A. Haskin, P. A. Helmke, R. L. Korotev, M. M. Lindstrom, and coworkers; 12. N. J. Hubbard, C.-Y. Shih, L. E. Nyquist, J. M. Rhodes, and coworkers; 13. Jerome et al. (1972); 14. Kaczaral et al. (1986); 15. J. C. Laul and coworkers; 16. D. S. McKay et al. (1986); 17. G. A. McKay et al. (1979); 18. Meyer (1978); 19. Morrison et al. (1970, 1971, 1973); 20. Ostertag et al. (1986); 21. J. A. Philpotts, C. S. Schnetzler, D. F. Nava, and coworkers; 22. R. A. Schmitt, M.-S. Ma, and coworkers; 23. Shervais et al. (1985a,b); 24. Strasheim et al. (1972); 25. M. Tatsumoto, P. Nunes, and coworkers; 26. S. R. Taylor and coworkers; 27. Tera et al. (1970); 28. Verkouteren et al. (1983); 29. Vinogradov (1971, 1973); 30. H. Wänke, H. Palme, and coworkers; 31. P. W. Warren, J. T. Wasson, G. W. Kallemeyn, and coworkers; 32. Willis et al. (1971).

462 Lunar Sourcebook
TABLE A8.3. Statistical summary of the database for concentrations of seven “miscellaneous minor elements” in mare basalts (MBAS) and in soils and regolith breccias (S&RB); all values are in µg/g
(see section 8.5, Fig. 8.14).

Lunar Chemistry 463
TABLE A8.3. (continued).

464 Lunar Sourcebook
TABLE A8.3. (continued).
Note that only the mare basalts (MBAS) and the soils and regolith breccias (S&RB) are included in this table. The data for highland monomict rocks (HMCT) and polymict breccias (BX) show so much scatter that statistics are practically meaningless. For the data listed, standard deviations are not given in those categories where the number of analyses (N) is <3. Abbreviations: N = number of analyses, Std. dev. = standard deviation, MBAS = mare basalts, S&RB = soils and regolith breccias, AMET = Antarctic lunar meteorites. Main sources of data used for this table: P: refs. 1*, 2; Sc: refs. 1, 2, 3, 4, 5; V: refs. 1, 2, 3†, 4, 5; Cr: refs. 1, 2, 3, 4, 5; Mn: refs. 1, 2, 3, 4, 5; Ga: refs. 1, 2, 3, 4; Sr: refs. 1‡, 2, 3, 4§. References: 1. H. J. Rose and coworkers (a series of 9 papers published in the Proceedings of the Lunar Science Conference, beginning with Rose et al., 1970, and ending with Rose et al., 1975 and Christian et al., 1976): data from XRF spectrometry (P, Cr, Mn) or one of several techniques based on “wet” chemistry followed by spectrographic analysis (P, Cr, Mn, Sc, V, Ga, Sr). 2. H. Wänke and coworkers (a series of 9 papers published in the Proceedings of the Lunar and Planetary Science Conference, beginning with Wänke et al., 1970a, and ending with Palme et al., 1984, and Ostertag et al., 1987): data from XRF (P, Cr, Mn) or INAA (Cr, Mn, Sc, V, Ga, Sr). 3. Brunfelt et al. (1971, 1972a,b, 1973a,b, 1974a,b); data from INAA. 4. P. H. Warren and coworkers (a series of 14 papers published in the Proceedings of the Lunar Science Conference, beginning with Boynton et al., 1976b, and ending with Jerde et al., 1987, and Warren et al., 1987): data from INAA. 5. R. A. Schmitt and coworkers (a series of 23 papers published in the Proceedings or in the abstracts of the Lunar and Planetary Science Conference, beginning with Wakita et al., 1970, and ending with Delano et al., 1986): data from INAA. In addition to these references, data for a broad range of miscellaneous minor elements were obtained from Laul et al. (1972a,b), Laul and Schmitt (1973a), and Ma et al. (1978). Some of the data plotted but not tabulated for highland monomict rocks are from Ryder and Norman (1979); additional P data for Apollo 11 MBAS are from Compston et al. (1970). For samples from the U.S.S.R. Luna missions, sources used in addition to those enumerated above are Albee et al. (1972), Bakos et al. (1977), Bansal et al. (1972), Barsukov et al. (1980), Blanchard et al. (1978), Bobrov et al. (1980), Cimbalnikova et al. (1977), Gangadharan et al. (1974), Gillum et al. (1972), Helmke and Haskin (1972a,b), Helmke et al. (1973), Hubbard et al. (1972b, 1977), Jerome and Philippot (1973), Jerome et al. (1972), Jovanovic et al. (1978), Kolesov and Surkov (1980), Kuznetsov et al. (1979), Lau! et al. (1978b, 1981), Murali et al. (1979), Nava and Philpotts (1973), Nyquist et al. (1978), Philpotts et al. (1972), Surkov and Kolesov (1979), and Vinogradov (1971, 1973). Essentially all these data were obtained using INAA. For the Antarctic lunar meteorites, Koeberl et al. (1989) and Warren et al. (1989) list all the published sources used, which are generally based on INAA. * The P data reported by Rose and coworkers appear unreliable at concentrations below roughly 0.04 wt.%. †The V data reported by Brunfelt and coworkers for Apollo 16 samples appear unreliable (too high). ‡ The Sr data reported by Rose and coworkers for Apollo 12 samples appear unreliable (too low). §Schmitt and coworkers also report Sr data in some of their most recent papers.
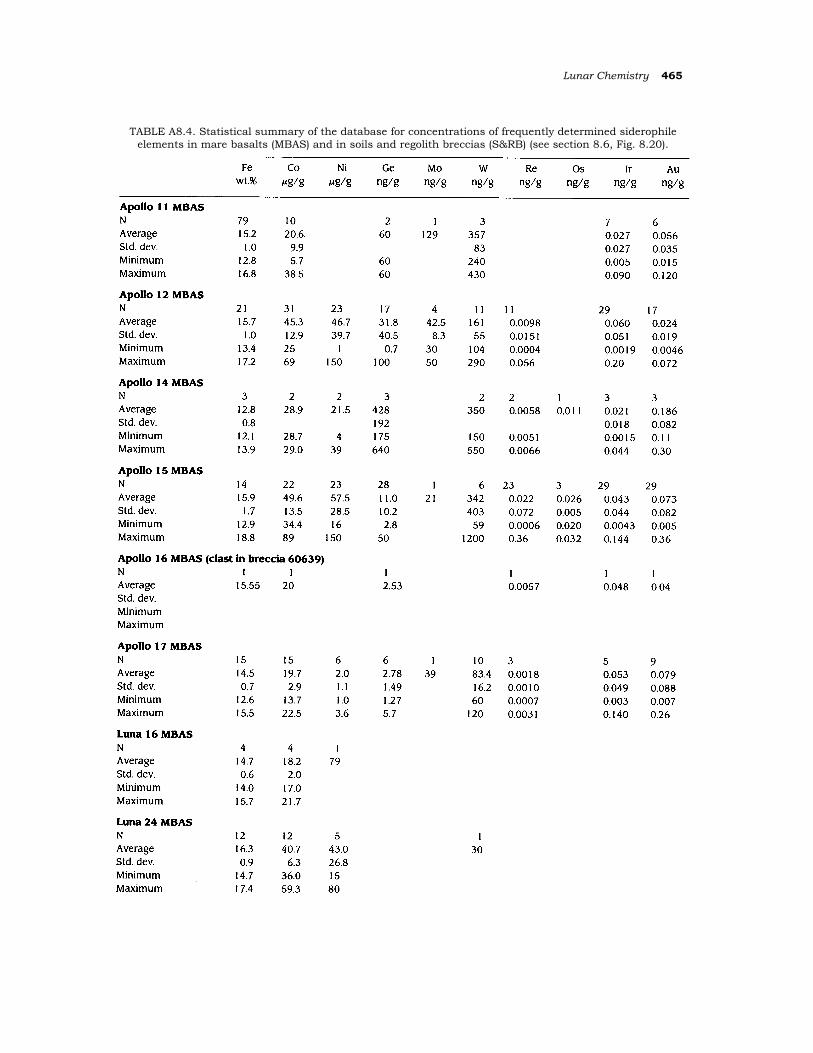
Lunar Chemistry 465
TABLE A8.4. Statistical summary of the database for concentrations of frequently determined siderophile elements in mare basalts (MBAS) and in soils and regolith breccias (S&RB) (see section 8.6, Fig. 8.20).

466 Lunar Sourcebook
TABLE A8.4. (continued).

Lunar Chemistry 467
TABLE A8.4. (continued).
Co Ni Ge Sb w Ru Pd Re Os Ir Au j.Lglg j.Lglg ng/g ng/g ng/g ng/g ng/g ng/g ng/g ng/g ng/g
Luna24 S&RB
N 14 13 I 1 2 2 Average 49.4 158 53 6.2 7.7 6.9 7.0 Std. dev. 4.1 65 Minimum 42 90 5.7 5.9 Maximum 60 350 8 8
AMETS&RB
N 4 4 4 4 4 4 4 Average 18.6 159 291 < 130 0.53 8.1 6.1 2.8 Std. dev. 1.5 29 83 0.10 0.8 0.7 1.5 Minimum 17 121 200 0.42 7 5 1.07 Maximum 21 198 402 < 130 0.66 9 6.8 5.1
Note that data for the highland monomict rocks (HMCT) and polymict breccias (BX) show so much scatter that statistics are practically meaningless. Even among the MBAS and S&RB categories, standard deviations are often very large, and statistical data should be used with caution. For the data listed, standard deviations are not given in those categories where the number of analyses (N) is <3. Abbreviations: 11g/ g = micrograms per gram (parts per million), ng/ g = nanograms per gram (parts per billion), N = number of samples, Std. dev. =
standard deviation, MBAS = mare basalts, S&RB = soil and regolith breccias, AMET = Antarctic lunar meteorites.
Main sources for data for siderophile element concentrations of rocks (including breccia clasts) and bulk-soil samples: Fe: refs. 1, 2, 3, 4, 5, 6, 7; Co: refs. 1, 2, 3, 4, 5, 6, 8; Ni: refs. 1, 2, 3, 4, 5, 6, 8; Ge: refs. 1, 2, 8; Mo: refs. 4, 7, 9; Ru: refs. 1, 10*; Rh: see text; Pd: refs. 2, 8; Sb: refs. 8; W: refs. 2, 4, 5, 11 *; Re: refs. 1, 2, 8, 11 *, 12*; Os: refs. 1, 8, 12*; Ir: refs. 1, 2t, 3t, 8, 12*; Pt: ref. 2; Au: refs. 1, 2t, 3t, 5t, 6*, 8, 12*.
References: 1. J. T. Wasson, P. H. Warren and coworkers (a series of 17 papers published in the Proceedings of the Lunar Science Conference, beginning with Wasson and Baedecker, 1970, and ending with Warren et al., 1987; also several papers published elsewhere: Wasson et al., 1973, 1975a; Boynton et al., 1976a; Boynton and Wasson, 1977); data mostly from INAA and RNAA. 2. H. Wanke and coworkers; data mostly from INAA and RNAA. 3. R. A. Schmitt and coworkers (same publications cited in the footnotes to Table A8.3); data mostly from INAA. 4. S. R. Taylor et al. (1971, 1972, 1973a,b); data from spark source mass spectrometry. 5. Brunfelt et al. (1971, 1972a,b, 1973a,b, 1974a,b); data mostly from INAA and RNAA. 6. H. J. Rose and coworkers (same publications cited in the footnotes to Table A8.3); data mostly from XRF spectrometry. 7. Turekian and Kharkar (1970) and Kharkar and Turekian (1971); data mostly from INAA and RNAA. 8. E. Anders, J. W. Morgan and coworkers (a series of 15 papers published in the Proceedings of the Lunar Science Conference, beginning with Ganapathy et al., 1970, and ending with Wolf et al., 1979; also the data of Morgan et al., 1979, published elsewhere); data from RNAA. 9. Newsom ( 1986), data from RNAA. 10. Reed and Jovanovic ( 1971, 1972), Reed et al. (1972), Jovanovic and Reed (1973, 1974), and Jovanovic et al. (1978); data from RNAA. 11. Michel et al. (1972), data from RNAA. 12. Lovering and Hughes (1971) and T. C. Hughes et al. (1973); data from RNAA. For samples from the U.S.S.R. Luna missions, sources used in addition to those enumerated above are Barsukov et al. (1980), Blanchard et al. (1978), Bobrov et al. (1980), Cimbalnikova et al. (1977), Gangadharan et al. (1974), Gillum et al. (1972), Helmke and Haskin (1972a,b), Helmke et al. (1973), Hubbard et al. (1977), Jerome and Philippot (1973), Jerome et al. (1972), Kolesov and Surkov (1980), Kuznetsov et al. (1979), Laul and Schmitt (1973a), Laul et al. (1978b, 1981), Surkov and Kolesov (1979), and Vinogradov (1971, 1973). Essentially all these data were obtained using either INAA or RNAA. For the Antarctic lunar meteorites, Koeberl et al. ( 1989) and Warren et al. ( 1989) list all the published sources used, which are based on INAA and RNAA analysis.
*Only data for soils and regolith breccias were used (data for other types of samples, where reported, frequently appear suspiciously high). tOnly data for soils, regolith breccias, and polymict breccias were used (data for mare basalts and monomict
highland rocks, where reported, frequently appear suspiciously high).

TABLE A8.5. Statistical data for concentrations of vapor-mobilized elements (see section 8.7, Fig. 8.25).

TABLE A8.5. (continued).

TABLE A8.5. (continued).

TABLE A8.5. (continued).
Note that data for the highland monomict rocks (HMCT) are not given because the concentrations in the HMCT scatter so much that statistics would be meaningless. For the data from other sample types, wherever the number of analyses (N) is >1 but no average or standard deviation is given, this was done because of either (1) extreme scatter in the data, where the relative standard deviation was >30%, or (2) data from mixed samples, such as highland and mare soils, where averages would be meaningless. Standard deviations are also not listed where N is <3. N = number of analyses, Std. dev. = standard deviation, MBAS = mare basalts, S&RB = soils and regolith breccias, BX = polymict breccias, AMET = Antarctic lunar meteorites.
Main sources for data used in this table: F: refs. 37–41, 56, 69, 71–73, 99, 101–103; S: refs. 1, 9, 15–19, 22–24, 28–32, 35, 47–49, 55, 57, 58, 70, 75–80, 83, 96, 106; Cl: refs. 36–44, 69, 72–74, 97–103; Cu: refs. 4, 15, 25, 53, 69, 88–90, 98–103; Zn: refs. 2, 3, 5–8, 10–14, 25–27, 33, 34, 45, 46, 51–53, 59–63, 95, 104, 105; As: refs. 69, 99–103; Se: refs. 3, 10, 26, 27, 33, 34, 45, 51, 53, 59–63, 95; Br: refs. 3, 14, 25–27, 33, 36–44, 46, 50, 51, 53, 54, 60–63, 69, 71–74, 101, 102, 104; Ag: refs. 3, 8, 25–27, 33, 34, 45, 51, 53, 59–63, 95; Cd: refs. 3, 5–8, 11–14, 25–27, 33, 34, 45, 51–53, 59–63, 95, 105; In: refs. 3, 5–8, 11–14, 25, 26, 33, 45, 52, 60, 61, 95, 105; Te: refs. 2, 3, 25–27, 33, 34, 45, 51–53, 60–63, 95; I: refs. 37–43, 71, 72, 74, 101; Tl: refs. 2, 3, 25–27, 33, 34, 45, 51, 53, 59–63, 95; Bi: refs. 2, 3, 25–27, 33, 34, 45, 51, 53, 59–63, 95; Pb: refs. 21, 64–68, 81, 82, 84–87, 91–94.
References: 1. Agrell et al. (1970a); 2. Allen et al. (1974); 3. Anders et al. (1971); 4. Annell and Helz (1970); 5. Baedecker et al. (1971); 6. Baedecker et al. (1972); 7. Baedecker et al. (1973); 8. Baedecker et al. (1974); 9. Barsukov et al. (1977); 10. Boynton and Hill (1983); 11. Boynton et al. (1975); 12. Boynton et al. (1976a); 13. Chou et al. (1974); 14. Chou et al. (1975); 15. Compston et al. (1970); 16. Compston et al. (1971); 17. Cripe and Moore (1974); 18. Cripe and Moore (1975); 19. Cripe and Moore (1976); 20. Des Marais (1978); 21. Doe and Tatsumoto (1972); 22. Duncan et al. (1973); 23. Duncan et al. (1974); 24. Engel and Engel (1970a,b); 25. Ganapathy et al. (1970); 26. Ganapathy et al. (1973); 27. Ganapathy et al. (1974); 28. Gibson and Moore (1973a,b); 29. Gibson and Moore (1974); 30. Gibson et al. (1975); 31. Gibson et al. (1976); 32. Gibson et al. (1977); 33. Gros et al. (1976); 34. Higuchi and Morgan (1975); 35. Hubbard et al. (1974); 36. Jovanovic and Reed (1980a); 37. Jovanovic and Reed (1973); 38. Jovanovic and Reed (1974); 39. Jovanovic and Reed (1975); 40. Jovanovic and Reed (1976a); 41. Jovanovic and Reed (1977); 42. Jovanovic and Reed (1978a); 43. Jovanovic and Reed (1978b); 44. Jovanovic and Reed (1981); 45. Kaczaral et al. (1986); 46. Kallemeyn and Warren (1983); 47. Kaplan and Petrowski (1971); 48. Kaplan et al. (1970); 49. Kerridge et al. (1975a,b); 50. Korotev et al. (1983); 51. Krähenbühl et al. (1973); 52. Krähenbühl (1980); 53. Laul et al. (1971); 54. Lindstrom et al. (1986); 55. Maxwell et al. (1970); 56. Meyer (1978); 57. Moore et al. (1972); 58. Moore et al. (1974); 59. Morgan and Petrie (1979); 60. Morgan et al. (1972a); 61. Morgan et al. (1972b); 62. Morgan et al. (1973); 63. Morgan et al. (1974); 64. Nunes and Tatsumoto (1973); 65. Nunes et al. (1973); 66. Nunes et al. (1974a); 67. Nunes et al. (1974b); 68. Nunes et al. (1975); 69. Palme et al. (1978); 70. Petrowski et al. (1974); 71. Reed and Jovanovic (1970); 72. Reed and Jovanovic (1971); 73. Reed and Jovanovic (1973a); 74. Reed et al. (1972); 75. Rees and Thode (1972); 76. Rees and Thode (1974); 77. Rhodes and Hubbard (1973); 78. Rhodes et al. (1974); 79. Scoon (1971); 80. Scoon (1972); 81. Silver (1970); 82. Silver (1972); 83. J. W. Smith et al. (1973); 84. Tatsumoto (1970); 85. Tatsumoto et al. (1971); 86. Tatsumoto et al. (1972a); 87. Tatsumoto et al. (1972b); 88. S. R. Taylor et al. (1971); 89. S. R. Taylor et al. (1972); 90. S. R. Taylor et al. (1973a,b); 91. Tera and Wasserburg (1972a); 92. Tera and Wasserburg (1972b); 93. Tera et al. (1972); 94. Unruh and Tatsumoto (1978); 95. Verkouteren et al. (1983); 96. Vinogradov (1973); 97. Wänke et al. (1970a); 98. Wänke et al. (1971); 99. Wänke et al. (1972); 100. Wänke et al. (1973); 101. Wänke et al. (1974); 102. Wänke et al. (1975); 103. Wänke et al. (1977); 104. Warren and Kallemeyn (1986); 105. Wasson et al. (1976); 106. Willis et al. (1972).

472 Lunar Sourcebook
TABLE A8.6. Statistical data for concentrations of solar-wind-implanted elements (see section 8.8, Figs. 8.35 and 8.39).
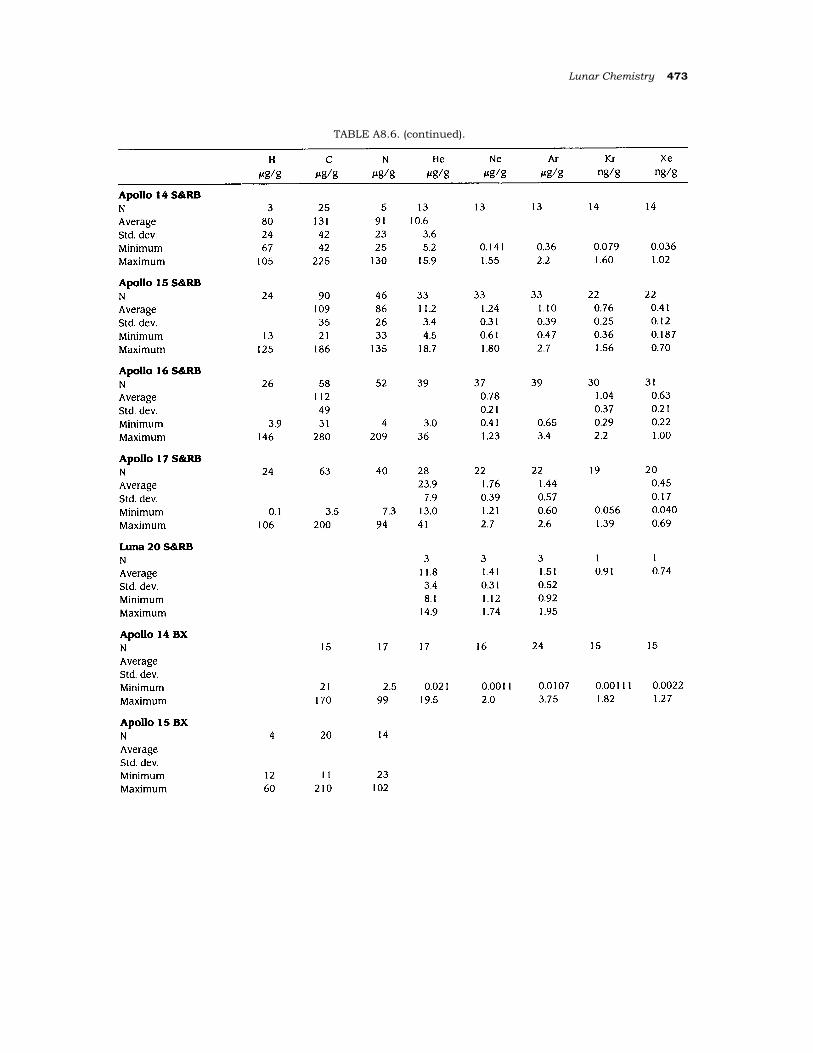
Lunar Chemistry 473
TABLE A8.6. (continued).
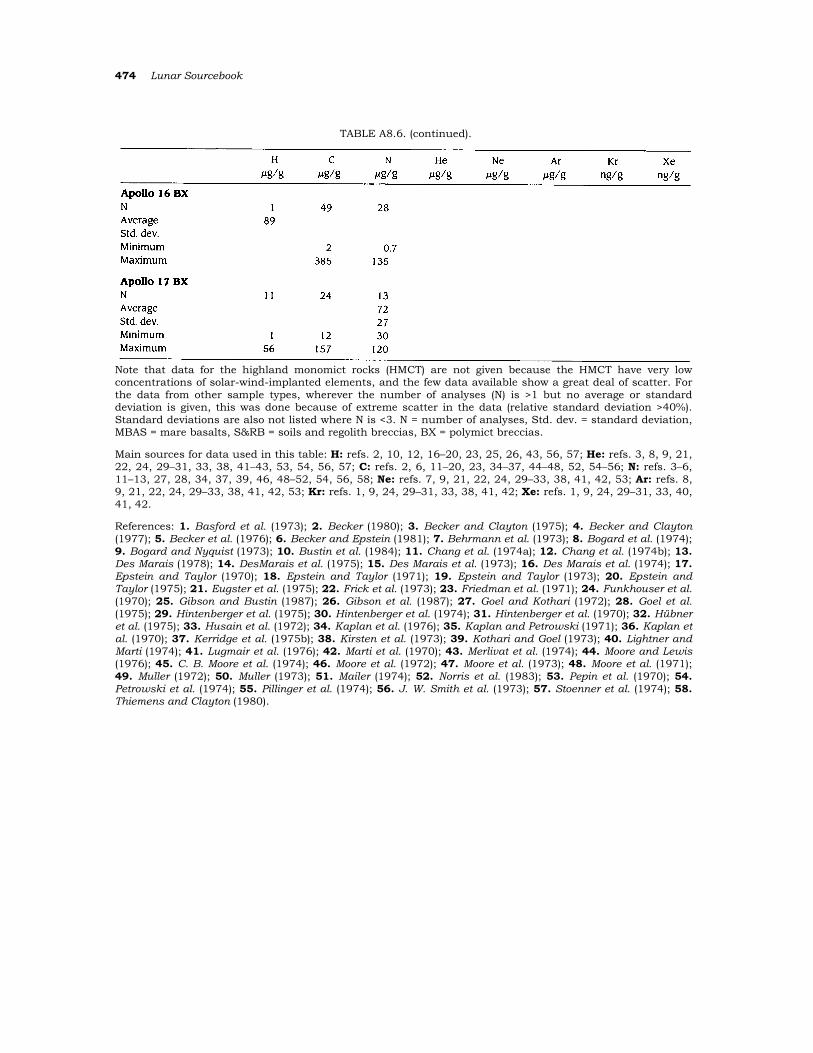
474 Lunar Sourcebook
TABLE A8.6. (continued).
Note that data for the highland monomict rocks (HMCT) are not given because the HMCT have very low concentrations of solar-wind-implanted elements, and the few data available show a great deal of scatter. For the data from other sample types, wherever the number of analyses (N) is >1 but no average or standard deviation is given, this was done because of extreme scatter in the data (relative standard deviation >40%). Standard deviations are also not listed where N is <3. N = number of analyses, Std. dev. = standard deviation, MBAS = mare basalts, S&RB = soils and regolith breccias, BX = polymict breccias.
Main sources for data used in this table: H: refs. 2, 10, 12, 16–20, 23, 25, 26, 43, 56, 57; He: refs. 3, 8, 9, 21, 22, 24, 29–31, 33, 38, 41–43, 53, 54, 56, 57; C: refs. 2, 6, 11–20, 23, 34–37, 44–48, 52, 54–56; N: refs. 3–6, 11–13, 27, 28, 34, 37, 39, 46, 48–52, 54, 56, 58; Ne: refs. 7, 9, 21, 22, 24, 29–33, 38, 41, 42, 53; Ar: refs. 8, 9, 21, 22, 24, 29–33, 38, 41, 42, 53; Kr: refs. 1, 9, 24, 29–31, 33, 38, 41, 42; Xe: refs. 1, 9, 24, 29–31, 33, 40, 41, 42.
References: 1. Basford et al. (1973); 2. Becker (1980); 3. Becker and Clayton (1975); 4. Becker and Clayton (1977); 5. Becker et al. (1976); 6. Becker and Epstein (1981); 7. Behrmann et al. (1973); 8. Bogard et al. (1974); 9. Bogard and Nyquist (1973); 10. Bustin et al. (1984); 11. Chang et al. (1974a); 12. Chang et al. (1974b); 13. Des Marais (1978); 14. DesMarais et al. (1975); 15. Des Marais et al. (1973); 16. Des Marais et al. (1974); 17. Epstein and Taylor (1970); 18. Epstein and Taylor (1971); 19. Epstein and Taylor (1973); 20. Epstein and Taylor (1975); 21. Eugster et al. (1975); 22. Frick et al. (1973); 23. Friedman et al. (1971); 24. Funkhouser et al. (1970); 25. Gibson and Bustin (1987); 26. Gibson et al. (1987); 27. Goel and Kothari (1972); 28. Goel et al. (1975); 29. Hintenberger et al. (1975); 30. Hintenberger et al. (1974); 31. Hintenberger et al. (1970); 32. Hübner et al. (1975); 33. Husain et al. (1972); 34. Kaplan et al. (1976); 35. Kaplan and Petrowski (1971); 36. Kaplan et al. (1970); 37. Kerridge et al. (1975b); 38. Kirsten et al. (1973); 39. Kothari and Goel (1973); 40. Lightner and Marti (1974); 41. Lugmair et al. (1976); 42. Marti et al. (1970); 43. Merlivat et al. (1974); 44. Moore and Lewis (1976); 45. C. B. Moore et al. (1974); 46. Moore et al. (1972); 47. Moore et al. (1973); 48. Moore et al. (1971); 49. Muller (1972); 50. Muller (1973); 51. Mailer (1974); 52. Norris et al. (1983); 53. Pepin et al. (1970); 54. Petrowski et al. (1974); 55. Pillinger et al. (1974); 56. J. W. Smith et al. (1973); 57. Stoenner et al. (1974); 58. Thiemens and Clayton (1980).


![⃝[anthony young] lunar and planetary rovers](https://img.dokumen.tips/doc/110x75/568caa611a28ab186da15ce8/anthony-young-lunar-and-planetary-rovers.jpg)