Embed Size (px)
Citation preview

1 | P a g e
ATypologyofPlayers:betweenInstinctiveandContemplative
ArielRubinstein*
TelAvivUniversity
and
NewYorkUniversity
Firstversion:July2014Revision:February2015
AbstractA new typology of players is proposed based on the classification of actions as either instinctive or contemplative. A person's type is the probability of him choosing a contemplative action. To test the typology, results of ten games are analyzed. Actions in each game were classified depending on whether their response time was more or less, respectively, than the median response time of all subjects who played the game. It is argued that fast actions are more instinctive and slow actions are more contemplative. A subject's contemplative index (CI) is defined as the proportion of games in which he chose a contemplative action. It is found that for each of the 10 games, the CI in the other nine games is positively correlated with the chances that a player chooses a contemplative action in that game. The CI is used to shed light on the nature of choice in five additional games.
Key words: Response Time, Game Theory, Typology, Instinctive, Contemplative.
* My thanks to Hadar Binsky for his devoted help in analyzing the data and to Eli Zvuluny for twelve years of dedicated assistance in building and maintaining the site http://gametheory.tau.ac.il. Of the many people who commented on the paper, I would like to thank especially Ayala Arad for many helpful comments and assistance in writing the paper, as well as Antonio Rangel and Mike Woodford for their warm encouragement. Comments from three referees of this journal were remarkably helpful in improving the paper.
I acknowledge financial support from ERC grant 269143.

2 | P a g e
1. Introduction We often differentiate between people who make decisions instinctively and those who reason things out. In particular, in strategic settings we distinguish between people who use strategic reasoning in making a choice and those who go by their gut feeling. The goal of the paper is to suggest a natural typology along this distinction, examine its usefulness in predicting behavior, and interpreting behavior in games. A major merit of the typology is that it resembles the way in which we classify people in real life.
The proposed typology will be based on the classification of actions as either instinctive or contemplative. A person's type will be determined by the probability of him choosing a contemplative action. A player of type p is one who chooses a contemplative action with probability p. I find this typology to be attractive since interesting typologies in Economics should in my opinion be judged not only by their predictive power but also by their ability to capture real-life terminology.
Following a description of the data (Section 2) the paper is structured as follows:
A. Section 3 provides the groundwork for defining the typology. It spells out the experimental results of ten games (most of them familiar ones) which are included in the set of problems at my site gametheory.tau.ac.il (see Section 2 for details) and for which a large amount of data has been collected. Strategies were classified in one of two classes depending on whether their median response time (MRT) was more or less, respectively, than the median response time of all subjects who played the game. Note that the partition is based solely on an objective criterion.
B. Section 4 argues for the interpretation of the fast actions as (more) instinctive and of the slow actions as (more) contemplative. This interpretation is, in my opinion, quite intuitive in most cases; nonetheless, support for the interpretation was obtained by means of a mini-experiment in which graduate students labeled the two classes of actions for each game.
C. Section 5 presents the main innovation of the paper: the Contemplative type is defined as the probability that a subject will choose a contemplative action.
D. Section 6 presents a test for the typology. For each of the basic 10 games, an agent’s “contemplative index” (CI) is calculated, i.e. the proportion of the other 9 games in which he plays a contemplative action. It appears that in most cases the CI based on the other 9 games is positively correlated with whether the agent plays contemplatively in the tenth.
E. Section 7 presents an analysis of five additional games in light of the new typology. It is claimed that the CI (calculated on the basis of the ten games) illuminates the nature of the play in those games and is informative for interpreting behavior.
F. Section 8 discusses another typology (a version of the typology suggested in Rubinstein (2013)): agents are characterized by their relative speed in responding to a problem. This method captures a real life characterization of people as fast or slow responders independently of their

3 | P a g e
choices. A type of a person is estimated using an agent’s GI index which is the median of the agent’s RT positions relative to other players in each game. It appears that GI is also positively correlated with the choice of more contemplative actions (though probably less so than CI).
The use of response time to open the “black box” of decision making is well-established in psychology and goes back 150 years to the work of Franciscus Cornelis Donders (see Donders (1969)). The pioneering studies of choice reaction times include Stone (1960), Luce (1986) and Busemeyer and Townsend (1993).
The current paper follows Rubinstein (2007) where I argued that response time is a useful as a simple, cheap and attractive indicator of the nature of a choice in games. The interpretation of response time as an indication of whether a choice is instinctive or contemplative (cognitive) is in some sense consistent with Kahneman (2011) who classified quick and instinctive responses as being the product of a system I decision process and slower contemplative responses as being the product of a system II decision process (for a critique of the two systems approach, see for example Keren and Schul (2009)). Note however that psychologists typically study response time in contexts where it is measured in fractions of a second (for an exception see, Ratcliff (1978)’s study of memory retrieval tests). In the context of the game situations studied here, response time measures the time spent thinking about a decision and is typically within the range of 30-240 seconds.
Comments on the Literature:
(A) For reasons beyond my understanding, economists were hostile to the use of response time until recently, when it became a legitimate and popular tool. Currently, response time is used in the literature for a number of purposes, which were classified recently by Spiliopoulos and Ortmann (2014). In this study, response time plays the following roles:
(i) Interpreting the meaning of choice in single games. Previous works in Economics that used RT in this way include: Rubinstein (2007) (for a variety of games), Lotito, Migheli, Ortona (2011) (a public goods game), Agranov, Caplin and Tergiman (2012) (guessing games), Arad and Rubinstein (2012) (General Blotto Tournament), and Brañas-Garza, Meloso and Miller (2012) and Hertwig, Fischbacher and Bruhin (2013) (the ultimatum game).
(ii) “Predicting” the behavior of players in a game (see Clithero and Rangel (2013), Rubinstein (2013) and Schotter and Trevino (2013)).
(iii) Defining a typology of players (see Rubinstein (2008, 2013)). (B) A number of previous papers have attempted to find between-game correlations of strategies. Following are some examples which made use of a typology based on level-k reasoning: Costa-Gomes and Crawford (2006) observe the correlation between players’ k-level type within a family of guessing games; Fragiadakis, Knoepfle and Niederle (2013) suggest an original way to determine whether subjects indeed follow any rule within a family of guessing games; Burchardi, and Penczynski (2014) identify one-third of the subjects as non-strategic for a group of games;

4 | P a g e
Georganas, Healy, and Weber (2014) find that k-levels are fairly consistent within a family of games, but not between them; and finally Arad and Rubinstein (2012) take a somewhat different approach by comparing the behavior of a large population of subjects in the Blotto Tournament and the 11-20 request game and find correlations when subjects are partitioned into three groups: level 0, levels 1-2-3 and the rest.
2. The Data
Experiments that study response time require a large number of subjects. For the current study, this was accomplished using the data accumulated on my didactic website gametheory.tau.ac.il. The subjects were students in game theory courses from around the world. As of the beginning of 2014, the site had 50,000 users from 40 countries (some as “marginal” as China and India…). More than half were from the US, Switzerland, UK, Colombia, Argentina and the Slovak Republic. In this respect, the pool of subjects was more diverse than the standard ones in game theory experiments, although needless to say the sample is not representative of the “world” in any serious way. The site contains a bank of game-theoretic and decision-theoretic problems. Teachers, most of whom teach game theory courses, register on the site, assemble sets of problems and assign them to their students. Problems on a particular topic are recommended to be assigned before the material is studied in class. Students respond to the problems anonymously. Teachers have access to statistics summarizing the choices of their students as well as those of all other respondents. The website records both the students’ answers and their response times. A problem in this paper is always a description of a hypothetical game. A subject responds to the problem by specifying his anticipated behavior in the role of one of the players. For each problem, the responses of the quickest 5% of subjects were removed (clearly, many of them chose an answer without even reading the question). Each problem is given two identifiers: a name and a serial number in the gametheory.tau.ac.il system (indicated by #). The serial numbers are included in the paper to make the database easier to use. Response time (RT) is measured as the number of seconds from the moment a problem is sent to a subject until his response is sent back and recorded by the server in Tel Aviv. Given the speed of communication, we can treat this as the time the problem is on the subject’s screen. A commonly used graphic tool is the response time cdf. For any set of strategies C, define to be the proportion of subjects that chose an alternative in and who responded within seconds. Rubinstein (2007, 2013) found that the graphs of the response time cdfs display two remarkable regularities: (1) They have a common shape that resembles an inverse Gaussian or lognormal distribution. (2) The response time cdfs (for a particular problem) are almost always ordered by the “first-order stochastic domination” relation. When for all t, for

5 | P a g e
two exclusive sets of strategies C and D, we say that the C-choosers respond faster than the D-choosers. Comment: I am aware of three criticisms of this type of research and following are my responses to them (the first two already essentially appeared in Rubinstein (2013), page 541): (a) The lack of monetary incentives: I have never understood the source of the myth that paying a few dollars (with some probability) will keep the subjects (who come to the lab on their own volition and are paid a certain amount no matter how they perform in the experiment) as focused on the task as they would be in real life. The opposite would seem to be the case. Human beings have good imaginations and framing a question using the phrase “imagine that…” achieves a degree of focus equal at least to that created by a small monetary incentive. Exceptions might include very boring tasks in which incentives are necessary to ensure that subjects are not just answering arbitrarily. In any case, I cannot see how the incentive provided by the small amount of money involved can be compared to the advantage of quick and easy access to a large number of subjects from a variety of countries. (For a detailed discussion of the monetary incentive issue, see Read (2005) and the references there.)
(b) The use of a non-laboratory setting: The use of web-based experiments does not provide control over what participants are doing. This is indeed true, but do researchers know whether the subject in a laboratory setting is thinking about the experiment or about his troubled love life? Are decisions more natural in a “sterile environment” or when a subject is sitting at home eating pizza?
(c) The pool of subjects: The subjects are students in game theory courses and they may have viewed the problems as a homework assignment rather than imagining that they are playing a game. But when we compare the results to those obtained repeatedly by other researchers, no major differences are observed. The one systematic difference involves a small proportion of subjects (the “victims of game theory”) who chose the Nash equilibrium action even in games where it made no sense to do so and would result in a low expected payoff. Also, note that teachers are asked to assign the problems to their students before they talk about them in class. Finally, there isn’t much variation in the results within large groups who answered the same problem. Overall, it is hard to find evidence that the subjects in this study are more biased than any standard pool of subjects and furthermore, as mentioned earlier, the geographical distribution of the students is much more diverse than what we usually see in experiments.
3. The Basic Collection of Games
The basic collection of games consists of ten games (results for some of the games were reported in Rubinstein (2007) for much smaller samples). There were three criteria for including a game in the collection: (1) It had received a very large number of responses. (2) The distributions of response time for the various actions were significantly different (unlike in the

6 | P a g e
Chicken Game or in the case of the responder in the Ultimatum Game discussed in Section 7). (3) I felt that the classification of actions in that game as either instinctive or contemplative was clear-cut (which is not true, for example, in the case of the Trust Game and the Public Contribution Game discussed in Section 7). Note, however, that this subjective classification does not play any role in the discussion that follows.
The description of each game is accompanied by the distribution of responses, the MRT of the different actions and the RT cdfs. In games where the number of strategies is large, some similar actions were consolidated. The responses in each game are divided into two groups: those with MRT above the overall median (in red) and those with MRT below the overall median. (Recall that the RT cdfs are ordered by the first-order stochastic domination relation). The discussion of each game ends with a brief description of the intuition behind the slow/fast partition.
3.1. Zero-Sum Game (#15)
The following simple zero-sum game was presented to students (like some other games which will follow) in the form of a bi-matrix in which payoffs were presented as numbers, without specifying their interpretation (students in game theory courses are, of course, familiar with this kind of presentation).
n=4715 Percent MRT
T 62% 41s
B 38% 57s
MRT=47s
Fast: T Slow: B
Table 1: A Zero-Sum Game
#15: You are Player 1 in the following game: Player 2 L R
Player 1 T 2,-2 0,0 B 0,0 1,-1
Imagine that Player 2 is an anonymous player. What will you play?
The 4715 subjects “played” the game in the role of the row player. Whether one interprets the payoffs as monetary payoffs or vNM utilities, Nash equilibrium predicts that more players will play B than T. However, the action T was in fact the more popular choice (62%). It’s MRT (41s) is much lower than that of B (57s).
0 50 100 150 200 250 3000
0.1
0.2
0.3
0.4
0.5
0.6
0.7
0.8
0.9
1
Fre
quen
cies
Response Time
T
B

7 | P a g e
The response time findings are consistent with the intuition that a player who does not use strategic considerations will choose T (which is associated with the highest payoff). Choosing B must be an outcome of reasoning, according to which the subject puts himself in the shoes of the column player, who he believes is likely to play R. This makes B his best response. This interpretation is supported by results from two other versions of the game which appear on the site. In one, subjects were asked to play the game in the role of the column player and in the other the column and row roles were reversed and subjects were asked to play the game as the row player (facing the negative payoffs of the original column player). In both versions, between 84 and 87% of the subjects (who did not also play #15) chose the action associated with the payoff of -1.
3.2. Hoteling’s Main Street Game (#68)
The following is a three-player discrete variant of Hoteling (1929)’s Main Street Game with seven locations ordered on a line.
n=8329 Percent MRT
1+7 10% 45s 2+3+5+6 46% 70s
4 43% 42s
MRT=53s Fast: 1,4,7
Slow: 2,3,5,6
Table 2: Hoteling’s Main Street Game Imagine you are the manager of a chain of cafes competing with two other similar chains. Each of you is about to rent a shop in one of the 7 new identical huge apartment buildings standing along a beach strip. Once each of you knows exactly where the other two competitors locate it will be too late to move to another location. You expect that the customers (the residents in the 7 buildings) will not distinguish between the three cafes and will pick the one which is closest to their home. In which building (a number between 1 and 7) will you locate your cafe?
The game’s unique symmetric Nash equilibrium strategy assigns probabilities (0.4, 0.2, 0.4) to positions 3, 4 and 5, respectively. Of 8329 subjects, 43% chose the middle position, which is double what is expected in equilibrium. (In the two-player version of the game, which appears on the site (#71), 69% of the 10,336 subjects chose the middle position.) Only 10% of the subjects chose the dominated actions 1 and 7. The MRTs of the center position (4) and the edges (1,7) were below the median whereas the MRTs of the actions 2,3,5,6 were above it. This is consistent with the intuition that choosing the center position is instinctive while locating a bit off center is an outcome of strategic reasoning.
0 50 100 150 200 250 3000
0.1
0.2
0.3
0.4
0.5
0.6
0.7
0.8
0.9
1F
requ
enci
es
Response Time
1 + 7
2 + 3 + 5 + 64

8 | P a g e
3.3. The Two-Contests Game (#66)
As in Huberman and Rubinstein (2000), subjects were asked to choose one of two contests: “Coin” or “Die”. The subjects compete by guessing, as closely as possible, the outcome of 20 tosses of a coin or die depending on what they chose. The winner in each contest is the best guesser.
n=1901 Percent MRT
Coin 68% 71s Die 32% 88s
MRT=77s Fast: Coin Slow: Die
Table 3: The Two-Contests Game Imagine you are participating in a game with over 200 participants worldwide. Each participant chooses to compete in one of two contests. In contest A, each contestant guesses the outcomes of 20 coin flips (heads or tails). In contest B, each contestant guesses the outcomes of 20 rolls of a die (i.e., each of the twenty guesses is a number 1, 2, 3, 4, 5 or 6). Each contest will be conducted independently. In each contest, you will be competing against people who, like you, chose that contest. After the guesses of all the participants are collected, a computer will simulate a series of 20 coin flips for contest A and a series of 20 rolls of a die for contest B. The winner of each contest will be the person with the most correct guesses. (In the case of a tie, the winner will be chosen by a lottery among those with the most correct guesses.) I choose to participate in:
Of the 1901 subjects, 68% chose “coin” and their MRT was much lower than for those who chose “die” (71s vs. 88s). This must be an outcome of a misconception that it is “easier” to guess the coin tosses and a failure to understand that the difficulty of the task has nothing to do with the chances of winning. A rational strategic player should try to choose the contest he believes will attract fewer subjects.
0 50 100 150 200 250 3000
0.1
0.2
0.3
0.4
0.5
0.6
0.7
0.8
0.9
1
Fre
quen
cies
Response Time
Coin
Die

9 | P a g e
3.4. Relying on the other player’s rationality (#3)
n=13524 Percent MRT
A 60% 56s
B 40% 51s
MRT=54s
Fast: B Slow: A
Table 4: Relying on the rationality of the other player You are player 1 in a two-person game with the following monetary payoff matrix:
Player 2 A B
Player 1 A 5,5 -100,4 B 0,1 0,0
What will you play?
There is a common interest for the players to reach the outcome (A, A). However, player 1 will suffer a large loss if player 2 does not play the dominating action and thus playing A is based on the belief that the other player will play rationally. Among 13,524 subjects, the 60% who chose option A had a higher MRT than those who chose the play-it-safe option B (56s vs. 51s).
3.5. Successive Elimination (#4)
n=13399 Percent MRT
A 4% 77s
B 27% 153s
C 39% 85s
D 30% 89s
MRT=99s Fast: A,C,D
Slow: B
Table 5: Successive Elimination You are player 1 in a two-person game with the following payoff matrix:
Player 2 A B C D
Player 1
A 5,2 2,6 1,4 0,4 B 0,0 3,2 2,1 1,1 C 7,0 2,2 1,5 5,1 D 9,5 1,3 0,2 4,8
What will you play?
0 50 100 150 200 250 3000
0.1
0.2
0.3
0.4
0.5
0.6
0.7
0.8
0.9
1
Fre
quen
cies
Response Time
A
B
0 50 100 150 200 250 3000
0.1
0.2
0.3
0.4
0.5
0.6
0.7
0.8
0.9
1
Fre
quen
cies
Response Time
A
B C
D

10 | P a g e
Only 27% of the 13,399 subjects chose B, the survivor of the successive elimination of dominated strategies, and their MRT is extremely high (153s). The actions C and D have the potential to yield relatively high payoffs and thus they attract the attention of subjects. The MRT of those who chose C or D was below that of all subjects. The 4% of subjects who chose the action A (which is a mistake since it is dominated by C) have the lowest response time.
3.6. The Ultimatum Game (#23)
n=13957 Percent MRT
0-1 11% 55s
2-39 13% 53s
40-49 9% 50s
50 49% 40s
51-60 10% 52s
61-100 7% 47s
MRT=46s Fast: 50
Slow: the rest
Table 6: The Ultimatum Game Imagine that you and another person (who you do not know) are to share $100. You must make an offer as to how to split the $100 between the two of you and he must either accept or reject your offer. In the case that he rejects the offer, neither of you will get anything. What will your offer be? I offer the following amount to the other person (and if he agrees I will get the remainder):
Of 13,957 subjects, 49% chose the equal division and their response time (40s) was clearly the lowest. In fact, it is the only choice to make it into the fast group. The MRT of the 11% of subjects who chose 0 or 1 (the “victims of game theory”) is much higher (55s) as is the MRT of those who chose a number within the range 2-49. Interestingly, 17% of the subjects chose a number above 50 (which might be the result of a desire to be generous or the outcome of confusion between giving and taking).
0 50 100 150 200 250 3000
0.1
0.2
0.3
0.4
0.5
0.6
0.7
0.8
0.9
1
Fre
quen
cies
Response Time
0-1
2-4950
51-100

11 | P a g e
3.7. The one-shot chain store game (#28)
Subjects were asked to play the role of the entrant in a variant of Selten (1978)’s one-shot chain store game.
n=7148 Percent MRT
Enter 47% 84s
Not 53% 68s
MRT=75s
Fast: Not to enter Slow: Enter
Table 7: The one-shot chain store game In your neighborhood, there is one grocery store and one tailor. At the moment, the profits of the grocery store owner are around $10K per month while the tailor's profits are only $4K per month. The tailor asks your advice about whether to change his shop into a grocery store. He figures that if the grocer does not respond aggressively to the new competition, each of them will earn about $6K per month. On the other hand, if the grocer does respond aggressively and starts a price war, then the earnings of each store will be reduced to about $2K per month. What is your advice to the tailor?
The MRT of the 53% of subjects who chose the safe “No Entry” action (68s) was dramatically lower than that of the 47% of subjects who chose the risky “Entry” action (84s).
0 50 100 150 200 250 3000
0.1
0.2
0.3
0.4
0.5
0.6
0.7
0.8
0.9
1
Fre
quen
cies
Response Time
Enter
Not to enter

12 | P a g e
3.8. The Centipede Game (#33)
Subjects were asked to play the role of the leading player in Rosenthal (1981)’s Centipede Game with 100 turns, presented as a strategic game (namely, a player has to choose the turn in which he intends to stop the game; the number 101 stands for "never stop").
n=7111 Percent MRT
1 11% 167s
2-95 10% 108s
96-98 2% 209s
99 9% 174s
100 10% 167s
101 58% 139s
MRT: 145s Fast: 2-95, 101 Slow: 1, 96-100
Table 8: The Centipede Game You are playing the following "game" with an anonymous person. Each of the players has an "account" with an initial balance of $0. At each stage, one of the players (in alternating order - you start) has the right to stop the game. If it is your turn to stop the game and you choose not to your account is debited by $1 and your opponent's is credited by $3. Each time your opponent has the opportunity to stop the game and chooses not to, your account is credited by $3 and his is debited by $1. The game lasts for 200 stages. If both players choose not to stop the game for 100 turns, the game ends and each player receives the balance in his account (which is $200; check this in order to verify that you understand the game). At which turn (between 1 and 100) do you plan to stop the game? (If you plan not to stop the game at any point write 101).
The slow group chose the actions in the range 96-100 (probably reflecting k-level reasoning) or the Nash equilibrium choice of 1. The fast group chose to never stop the game (58% of the 7111 subjects) or one of the seemingly random choices in the range of 2-95 (10%).
3.9. The Stop or Pass Game (#34)
In this game, each of 20 players in turn can either stop the game and receive $10, in which case the others get nothing, or pass. If all 20 players pass, each receives $11. Subjects were asked to imagine that they are the player who starts the game.
0 50 100 150 200 250 3000
0.1
0.2
0.3
0.4
0.5
0.6
0.7
0.8
0.9
Fre
quen
cies
Response Time
1
2-9596-100
101

13 | P a g e
n=6267 Percent MRT
Stop 61% 44s
Pass 39% 49s
MRT: 46s Fast: Stop Slow: Pass
Table 9: The "Stop or Pass” Game You are player number 1 among a group of 20 players participating in a 20-stage game. At stage t, player t has to decide whether to stop the game or pass the game on to player t+1. If he stops the game, he receives $10 while all other players receive nothing. If none of the 20
players stop the game, then they all receive $11 each. Your choice is:
Among 6,267 subjects, the safe action of “Stop” was the most popular and had the lowest MRT.
3.10. The Traveler’s Dilemma (#53)
In this version of Basu (1994)’s Traveler’s Dilemma Game, players announce a demand in the range of 180-300. If one player asks for a strictly lower amount than the other, he receives an additional $5 at the expense of the other player.
n=15215 Percent MRT
180 21% 97s
181-294 19% 85s
295 5% 116s
296-298 3% 118s
299 8% 102s
300 44% 81s MRT=88s
Fast: 300,181-294 Slow: 180, 295-299
Table 10: The Traveler’s Dilemma Imagine you are one of the players in the following two-player game: Each of the players chooses an amount between $180 and $300. Both players receive the lower amount. Five dollars are transferred from the player who chose the larger amount to the player who chose the smaller one. In the case that the same amount is chosen by both players, each receives that amount and no transfer is made. What amount would you choose?
0 50 100 150 200 250 3000
0.1
0.2
0.3
0.4
0.5
0.6
0.7
0.8
0.9
1
Fre
quen
cies
Response Time
To stop the game
To pass the game on
0 50 100 150 200 250 3000
0.1
0.2
0.3
0.4
0.5
0.6
0.7
0.8
0.9
1
Fre
quen
cies
Response Time
180
181-294295-299
300

14 | P a g e
The slow group chose within the range of 295-299 (16%), which is usually interpreted as the range of outcomes of k-level reasoning, or the Nash equilibrium choice of 180 (21%). The prominent choice in the fast group was 300, which attracted 44% of the subjects.
4. Instinctive and Contemplative Actions
The choices in each problem (game) were classified into two categories: fast and slow. The dividing line was the MRT of all the subjects who responded to the problem. All actions for which the MRT of its choosers was below the dividing line went to the FAST group and any other action went to the SLOW group. Note that the criterion is totally objective. (The only sense in which my personal judgment entered in was in the three games in which the number of strategies was more than 100, which was too large in order to relate to each action separately.)
We could continue the discussion without giving the fast and slow categories any further interpretation. However, Economics is about interpretation and there seem to be some attractive features common to the actions in each category. The actions of the fast group seem to be more instinctive, while those of the slow group seem to be more contemplative. By instinctive we mean that the subject follows a gut feeling without applying any strategic analysis. By contemplative, we mean that the subject analyzes the strategic aspects of the game and bases his choice on what he expects the other players will do.
I don’t pretend to be able to provide a theory to explain what makes an action instinctive or contemplative. There are various intuitive explanations for the classification which depend on the particular game. For example, in the Ultimatum Game (section 3.6) the instinctive action is identified as 50, since it an action which is associated with salience and appeals to a sense of fairness. In the Zero-Sum Game (section 3.1), the instinctive action is the one with the highest payoff. High payoffs also attract subjects to the instinctive actions of C and D in the Successive Elimination Game (section 3.5). In “Relying on the other player’s rationality” (section 3.4) and in “Stop or pass” (section 3.9), the instinctive actions are associated with avoiding a very low payoff. In the Traveler’s Dilemma (section 3.10), the instinctive choice of 300 seems to reflect level-0 reasoning. In contrast and as explained in Section 3, contemplative actions seem to be a best response based on a reasonable belief about what the other player will do.
As mentioned, the choice of games in this collection was not arbitrary. These were games in which some actions seem intuitively to be more instinctive than the others. However, my personal intuition is not essential to the analysis (since the classification is based solely on an objective criterion) and is used only to suggest that the fast group makes instinctive decisions and the slow group makes contemplative ones. In order to provide support for my interpretation of the classes of actions in each game, the following mini-experiment was carried out (at the suggestion of Ayala Arad and the journal’s referees):

15 | P a g e
Seventeen graduate students in Economics at Tel Aviv University were recruited (and were paid a flat fee of about $12). All were familiar with basic game theory concepts and had not been exposed to my previous work on the subject. They were approached in small groups of between two and five and participated in a session that lasted about 45 minutes. Each rater received a booklet containing the games discussed in Section 3, each on a separate page. The various strategies in the game were presented below the game’s description in two groups (i.e. fast and slow) without attaching any labels to the groups and in a random order. Raters were asked to circle the group which, in their own opinion, contains the more instinctive actions (which were defined in the instructions as "intuitive, immediate, an outcome of activating gut feeling and not of deliberation and activation of cognitive power"). Raters were told that if in their opinion there is only one instinctive action then they should circle the group in which it appears. At the end of each session, the raters discussed their answers with me in order for me to understand whether there were cases in which they had difficulty deciding. Table 11 summarizes the results.
Table 11: The Raters’ Agreement Rates
Section The game Instinctive Actions
Contemplative Actions
Agreement rate
3.1 Zero-sum Game T B 16:1 3.2 2 contests Coin Die 15:2 3.3 Hoteling 1,4,7 2,3,5,6 13:4 3.4 Relying on other's
rationality A B 8:9
3.5 Successive Elimination
A,C,D B 15:2
3.6 Ultimatum 50 other 13:4 3.7 One Shot Chain store Don’t Change Change 11:5 3.8 Centipede 2-95, 101 1, 96-100 9:8 3.9 Stop and Pass Stop Pass 13:4 3.10 Traveler's Dilemma 181-294,300 180, 295-299 10:7
In 7 of the 10 games, the judgment of the overwhelming majority of the raters agreed with mine. In the other three cases, the raters split equally in their judgments. In no case did the raters’ intuition contradict my own. In the discussion following the experiment, I got the impression that raters who disagreed with my judgment were applying some “simple strategic reasoning” and considered the consequence to be instinctive as well. For example, in "Relying on the other player’s rationality" some raters felt it was obvious that the action A is dominating for the other player and thus classified action A as instinctive for the row player. In both the Centipede Game and the Traveler's Dilemma, some raters felt it is instinctive to stop the game a bit before the end and to ask for a little bit less than the upper limit of 300.
Thus, overall the raters' judgments supported my labeling of the categories as instinctive or contemplative.
16 | P a g e
5. A new typology: on the spectrum between Instinctive and Contemplative
We reach the core idea of the paper – a proposed new typology of players. The typology is relevant in games, like those discussed in Section 3, where an intuitive distinction is possible between actions chosen on the basis of contemplative considerations and those that are the outcome of instinctive reasoning. The player’s type is determined according to his tendency to choose a contemplative action. In a formal model, an agent would be characterized by the probability of him choosing a contemplative action whenever he makes a decision.
A major merit of the typology is its resemblance to the way in which we tend to classify people in real life. It is often said of a person that “his decisions express emotions” or that he “his behavior demonstrates thoroughness”. Such statements are based on the individual’s observed behavior rather than the nature of his deliberation process. Even if one could make better predictions of behavior based on some other kind of information about a subject, (and I bet one would find measures with better predictive power sooner or later) the typology suggested here will still likely provide added value.
Note that by this suggestion a player's type specifies only the probability that he will choose a particular type of action (i.e. instinctive or contemplative) rather than predicting with certainty which action he will choose. This is in line with Arad and Rubinstein (2012) who found a correlation between the behavior of a player in the Colonel Blotto game and his behavior in the 11-20 money request game only after the strategies were grouped together according to the k-level reasoning so that all levels-1-2-3 strategies were put together rather than the level of the strategies. In a sense, this is also consistent with the position taken by psychologists who argue that a basic criterion for explaining behavior in decision situations is the extent to which an individual uses System 2 reasoning (see Stanovich and West (2000))
A comment on the concept of “type”: A "type" is a category of individuals with common characteristics. In both the theoretical and experimental literature, these common characteristics constitute a mode of behavior that is often described using a distinct preference relation or a deterministic procedure of choice. Thus, for example, an agent is type 1 in the k-level literature if he always maximizes his expected payoff as a best response to what he perceives as level-0 behavior. The "crazy" type in the repeated chain store paradox game is an individual who seek confrontation and does so in all circumstances. The impatient type in bargaining is an individual who utilizes a low discount factor.
In contrast, consider, for example, the way in which we classify people as "good” or “evil” in real life. In fairy tales, a good person is always good and a bad person is always bad. In life, a good person does not always choose a good action and an evil person does not always choose an evil action. A good person is one who chooses a good deed significantly more often than an evil person and vice versa. Accordingly, a type in this paper is some range on the spectrum between instinctive and contemplative, rather being located only at one of its endpoints.

17 | P a g e
6. Testing the new typology
Given a set of games and the contemplative/instinctive classification of strategies for each game, a subject’s type is estimated by his contemplative index (CI), which is defined as the proportion of games in which he has chosen a contemplative action. A CI of 1 means that he has always chosen a contemplative action and a CI of 0 means that he has always chosen an instinctive strategy. One possible improvement of the measure would be to weight an action by the degree to which it is contemplative rather than classifying it as either contemplative and instinctive in a binary manner.
The typology is tested using the results for the ten games described in Section 3. Only subjects who played at least 7 of the 10 games are included. For each game, the CI of each subject is calculated on the basis of the results for the other nine (or less) games he played. Ideally, the correlation would be calculated between CI and the probability that the player will play contemplatively in the tenth game. However, each player is observed playing any single game only once, and thus this probability can only be estimated using the frequency with which contemplative actions are chosen by subjects with similar CI.
Table 12 presents ten graphs, each containing ten points. The (blue) diamonds above the point x+.05 on the horizontal axis indicate the proportion of subjects whose CI is between x and x+0.1 and who chose a contemplative action. The (red) bars indicate the proportion of subjects whose CI is within this range.
To emphasize the relationship, each of the graphs includes a linear regression line for the ten points where each point is weighted by the proportion of subjects in the corresponding range. Also reported are the results of a logistic regression to estimate the coefficients, p-values and odds ratio. In the regression, the CI for each subject is used as a predictor variable with 0 or 1 as the dependent variable, where 1 indicates that he played contemplatively and 0 otherwise. Incidentally, the odds ratios calculated from the logistic regression are very close to those calculated from the above weighted linear approximation (i.e., given the regression line PC=a+bCI the odds ratio is the ratio between (a+b)/(1-a-b) and a/(1-a)).
That CI has some predictive power is quite clear from the graphs although in two of the games (The "Stop or Pass” Game and the Traveler’s Dilemma) the correlation between CI and the proportion of contemplative choices is not significant.

18 | P a g
Table 12index (Cindicate tcontemplrange. OR
#15 ‐
logit(PC) = ‐
#66 – T
logit(PC) =
g e
2: The propoCI) in the ba
the proportiolative actionR=odds ratio
‐ Zero-Sum
PC= 13.2
‐0.554 + 0.492
Two-Contes
PC= 11.7
‐0.996 + 0.51
ortion of conasic set of gaon of subject
n. The red bao.
Game (n=1
CI + 36.0
2CI (OR=1.64
sts game (n=
CI + 26.6
13CI (OR=1.67
ntemplativeames. The blts whose CI
ars indicate th
180)
, p=0.081)
=768)
7, p=0.165)
e choices (PClue diamondis between xhe proportio
#68
lo
lo
C) as a funcds above x+.0x and x+0.1on of subject
8 ‐ Hoteling
P
ogit(PC) = ‐0.4
#3 ‐ Relyin
P
ogit(PC) = ‐0.1
ction of the 05 on the hoand who ch
ts whose CI
’s Main Str
PC= 20.4 CI
417 + 0.802C
ng on ration
PC= 37.5 CI
198 + 1.542CI
contemplatorizontal axisose a is within thi
reet Game (n
+ 39.6
I (OR=2.23, p
nality (n=17
+ 45.4
I (OR=4.67, p
tive s
s
n=1314)
p=0.002)
746)
=0.000)

19 | P a g
#4 ‐ Suc
logit(PC) =
#28 ‐ The on
logit(PC) =
#34 ‐ The
logit(PC) =
g e
ccessive Elim
PC= 24.7
‐1.437 + 1.16
ne-shot chai
PC= 34.8
‐0.434 + 1.35
"Stop or P
PC= 5.1 C
‐0.601 + 0.17
mination (n
CI + 18.0
66CI (OR=3.21
in store gam
CI + 38.9
53CI (OR=3.87
ass” Game
CI + 35.0
76CI (OR=1.19
n=1815)
1, p=0.000)
me (n=1345)
7, p=0.000)
(n=1725)
9, p=0.447)
lo
)
lo
lo
#23 ‐ Ult
P
ogit(PC) = ‐0.4
#33 ‐ The C
P
ogit(PC) = ‐1.4
#53 ‐ Trav
P
ogit(PC) = ‐0.4
timatum Ga
PC= 39.1 CI
468 + 1.585CI
Centipede G
PC= 34.0 CI
425 + 1.523CI
veler’s Dilem
PC= 5.7 CI +
483 + 0.198CI
ame (n=168
+ 38.7
I (OR=4.88, p
Game (n=18
+ 17.7
(OR=4.58, p
mma (n=16
+ 37.8
I (OR=1.22, p
9)
=0.000)
813)
p=0.000)
683)
=0.405)

20 | P a g e
7. Applying the typology to additional games
This section discusses five additional games that were not included in the basic set and in which it is unclear (at least to me) which is the more instinctive response. The CI (calculated on the basis of the ten basic games) is used to provide an interpretation of the actions in these games.
7.1. Responders in the Ultimatum Game (#25 and #86)
Subjects were asked to play the Ultimatum Game in the role of responder. They were randomly assigned to respond to an offer of either $10 or $5 (out of $100).
#25 ($10)
n=7978 Percent MRT
Yes 62% 25s
No 38% 24s
#86 ($5)
n=4315 Percent MRT
Yes 54% 24s
No 46% 23s
Table 13: Ultimatum Game: A Responder
You and someone you do not know are to share $100. He makes you an offer and you can either accept it or reject it. If you reject it, neither of you will get anything. #25: He offers you $10 (if you accept, he will get $90). #86: He offers you $5 (if you accept, he will get $95).
Do you accept the offer?
About 62% of the 7978 subjects who received an offer of $10 said that they would accept such an offer while 54% of 4,315 subjects who received an offer of $5 said that they would accept such an offer. In both cases, there is no difference between the RT cdf’s of those who accepted the offer and those who rejected it. Thus, the response time results are unable to provide an indication of whether acceptance or rejection is the more instinctive choice.
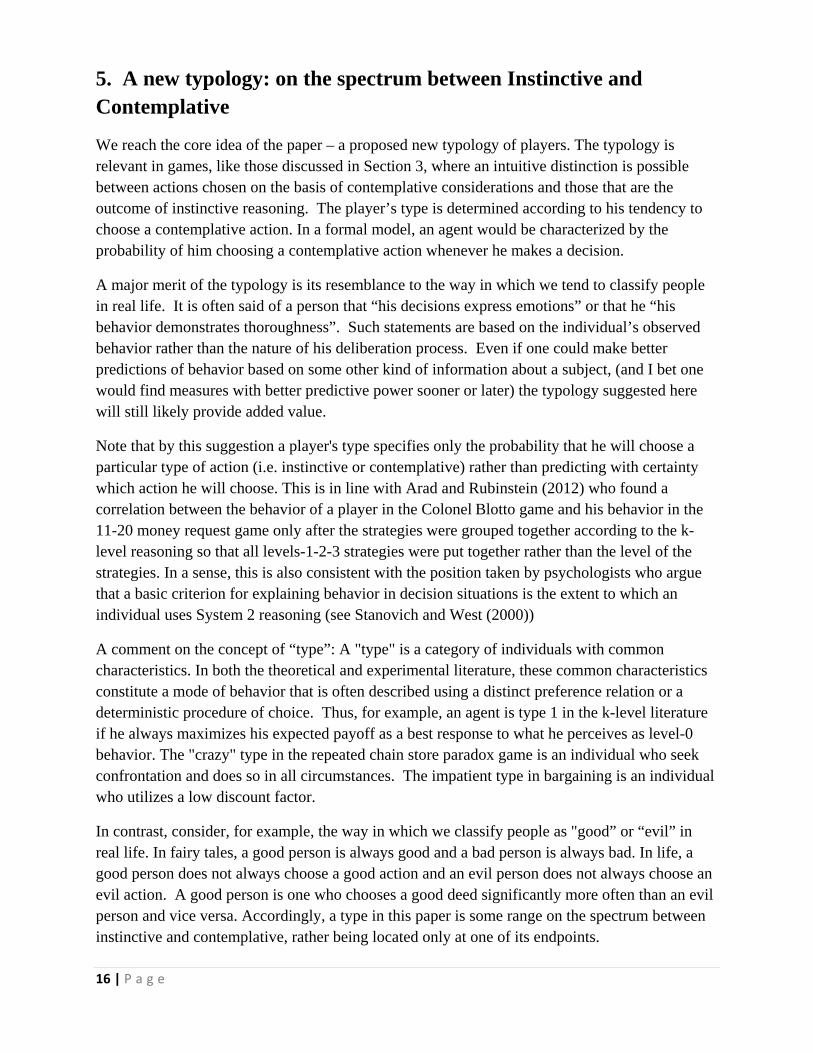
Nevertheless, the graphs in Table 14 do show that CI is correlated with the rate of acceptance. In particular, the acceptance rate for the offer of $10 is 49% for CI up to 0.4 as compared to 68%
0 50 100 150 200 250 3000
0.1
0.2
0.3
0.4
0.5
0.6
0.7
0.8
0.9
1
Fre
quen
cies
Response Time
Yes
No
0 50 100 150 200 250 3000
0.1
0.2
0.3
0.4
0.5
0.6
0.7
0.8
0.9
1
Fre
quen
cies
Response Time
Yes
No
21 | P a g
for CI abwith CI o
Table 14
#25
logit(PC) =
7.2. The
This is a player dethe playeeach of th
TaYYfug(rthyI
g e
bove 0.4. Simof up to 0.4 a
4: The Ultim
– Response
PC= 40.1
‐0.345 + 1.77
Contributio
standard fivecides how toer himself anhe five playe
n=8531
0
1-4
5
6-9
10
able 15: The You are participYou have to decfund: for each tgroup fund: for regardless of hhe 10 tokens be
you wish. allocate the fo
milarly, the aand 59% for
matum Gam
to $10 (n=8
CI + 42.9
79CI (OR=5.92
on Game (#
ve-player Coo allocate 10
nd nothing toers).
Percent M
38%
27%
13%
8%
15%
Contributionpating in a gamcide how to alloken you inveseach token any
how much theyetween the 2 fu
ollowing amoun
acceptance rr CI of greate
me (responde
877)
2, p=0.000)
#79)
ntribution G0 tokens betwo the others)
MRT
108s
101s
94s
109s
130s
n Game me with four otlocate the 10 tost in your persoy player invest
y themselves inunds. You may
nt of tokens to
rate for the oer than 0.4.
er): The rat
lo
Game (see Ocween a privaand a public
ther players. Inokens between onal fund, you ts in the group vested in this f
y mix up the in
the group fund
00
0.1
0.2
0.3
0.4
0.5
0.6
0.7
0.8
0.9
1
Fre
quen
cies
offer of $5 is
te of accepta
#86 ‐ R
PC
ogit(PC) = ‐0.3
ckenfeks andate fund (whc fund (wher
n the game, eac2 different fun
u (and only youfund, each of t
fund). Your denvestment of yo
d:
50 100Respo
s 47% among
ance as a fu
Response to
C= 23.6 CI +
355 + 1.024CI
d Weimann here a token ire a token is
ch player gets 1nds: (1) Your pu) will receive $the 5 players r
ecision is how tour 10 tokens i
150 200 250onse Time
g the subject
nction of CI
$5 (n=602)
+ 42.0
(OR=2.79, p=
(1999)). Eacis worth $4 tworth $2 to
10 tokens. personal $4. (2) The eceives $2 to divide in any way
0 300
0
1-4
56-9
10
ts
I
=0.015)
ch to
o

22 | P a g
“No contresponse high. The(13%) an
The correcorrelatewords, haextreme away or th
Table 1
7.3. The
In this veto $10 togive back
g e
tribution to ttime of the
e middle optnd as expecte
elation betwd with the praving a highalternatives.he other, abo
16: The Con
Trust Gam
ersion of the player B. Tk to player A
the public fu15% who cotion ($5 to thed its MRT i
ween CI and troportion of
her CI makes Thus, playe
out whether o
ntribution G
#79
logit(PC)
me (#133)
Trust Gamehe amount tr
A. Subjects w
und” is the montributed alhe public funis the lowest
the choices mf subjects whs it more likeers who are mor not to con
Game: the pr
9 – The Con
PC= 3
) = -0.282 +
e (Berg, Dickransferred is
were asked to
most popular ll their tokennd) attracts at.
made in the gho chose an eely that the smore contemntribute.
roportion oCI
tribution G
35.3 CI + 43
1.485CI (OR
khaut and Ms then tripledo play the ga
choice (38%ns to the puba sizable pro
game revealextreme valusubject will cmplative app
f the choice
Game (n=116
3.8
R=4.42, p=0
McCabe (199d and player ame in the ro
% of 8531 sublic fund is exportion of th
ls that CI is sue (either 0 ochoose one oear to be mo
e of 0 or 10 a
65)
0.000)
95)), player AB then deci
ole of player
ubjects). Thexceptionallyhe subjects
strongly or 10); in othof the two ore decisive,
as a functio
A can transfedes how mur A.
e y
her
one
n of
er up uch to
23 | P a g
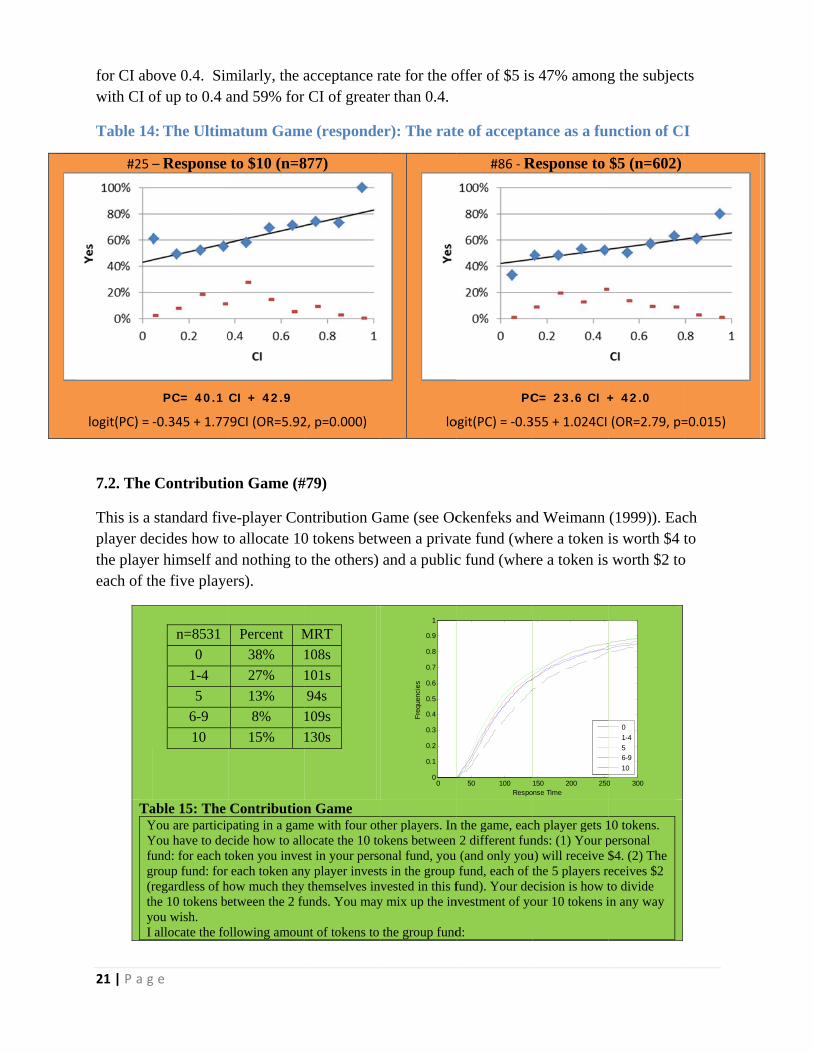
TablePlay($10decis(out Playgive
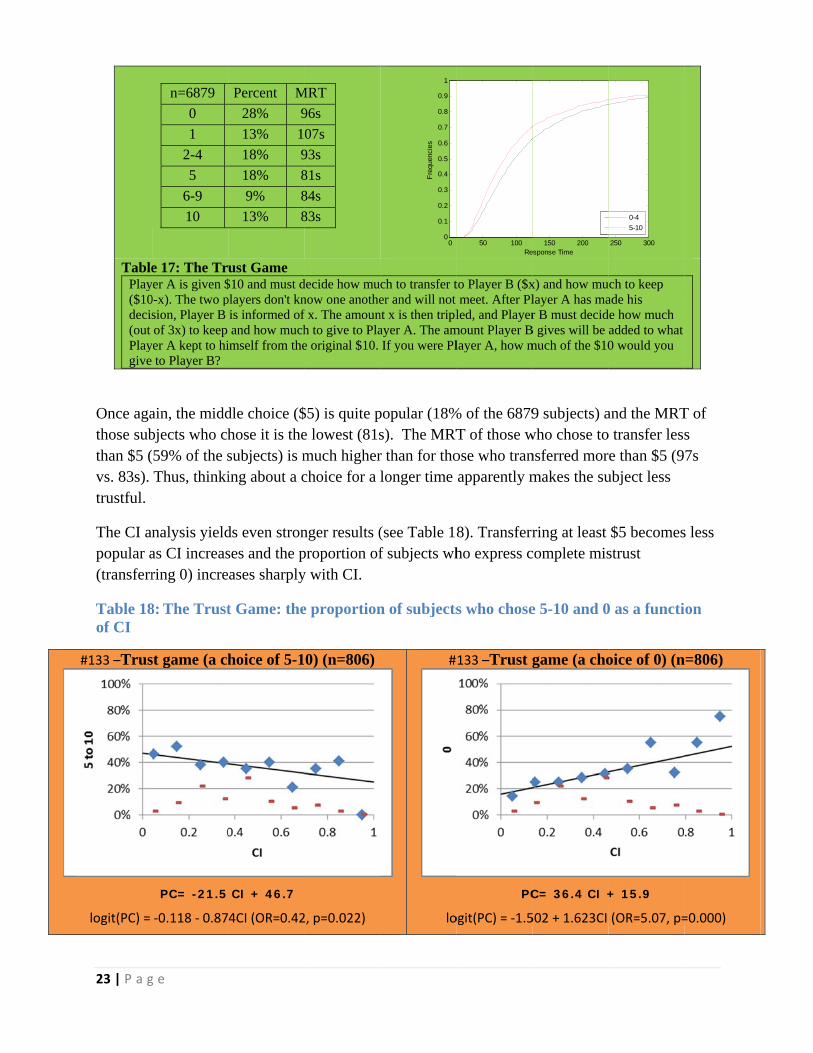
Once agathose subthan $5 (vs. 83s). trustful.
The CI anpopular a(transferr
Table 18of CI
#133 –Trus
logit(PC) =
g e
n=6879
0
1
2-4
5
6-9
10
e 17: The Tryer A is given $0-x). The two psion, Player B of 3x) to keep
yer A kept to hito Player B?
ain, the middbjects who ch(59% of the sThus, thinki
nalysis yieldas CI increasring 0) incre
8: The Trust
st game (a ch
PC= -21.5
‐0.118 ‐ 0.87
Percent M
28% 9
13% 1
18% 9
18% 8
9% 8
13% 8
ust Game $10 and must dplayers don't kn
is informed ofand how much
imself from the
dle choice ($hose it is thesubjects) is ming about a c
ds even stronses and the pases sharply
t Game: the
hoice of 5-1
CI + 46.7
4CI (OR=0.42
MRT
96s
07s
93s
81s
84s
83s
decide how munow one anothef x. The amounh to give to Plae original $10.
$5) is quite pe lowest (81smuch higherchoice for a
nger results (proportion ofy with CI.
e proportion
0) (n=806)
2, p=0.022)
ch to transfer ter and will not
nt x is then triplayer A. The amIf you were Pl
popular (18%s). The MRTr than for tholonger time
(see Table 1f subjects wh
n of subjects
#
lo
00
0.1
0.2
0.3
0.4
0.5
0.6
0.7
0.8
0.9
1
Fre
quen
cies
to Player B ($xmeet. After Pl
led, and Playermount Player Blayer A, how m
% of the 6879T of those wose who tranapparently m
8). Transferrho express c
s who chose
133 –Trust g
PC
ogit(PC) = ‐1.5
50 100Re
x) and how mulayer A has mar B must decid
B gives will be much of the $10
9 subjects) awho chose tonsferred mormakes the su
ring at least complete mis
e 5-10 and 0
game (a cho
C= 36.4 CI +
502 + 1.623CI
150 200esponse Time
uch to keep ade his de how much added to what 0 would you
and the MRTo transfer lessre than $5 (9ubject less
$5 becomesstrust
0 as a functi
oice of 0) (n
+ 15.9
(OR=5.07, p=
250 300
0-4
5-10
T of s 7s
s less
ion
n=806)
=0.000)

24 | P a g
7.4. Chic
Chicken either resany backThe RT c
TablYou
Pl
Wh
Table 20: T
g e
cken (#77).
is a clear exsponse time kground storycdf’s are ver
n=8837 P
A
B
le 19: The Chiu are player 1 i
layer 1 A B
hat will you pla
The Chicken
xample of a gor CI. The gy. The populry similar an
Percent MR
51% 51s
49% 48s
icken Game in a two-person
Player A
3,3 4,2
ay?
n Game: pro
logit(P
game with nogame was prelation of 883d CI is not c
RT
s
s
n game with th2 B
2,4 1,1
oportion of
#77 – Ch
PC= -
PC) = 0.165 + ‐
o discernibleesented to su37 subjects wcorrelated wi
he following m
subjects wh
hicken (n=1
-1.0 CI + 54
‐0.009CI (OR=
00
0.1
0.2
0.3
0.4
0.5
0.6
0.7
0.8
0.9
1
Fre
quen
cies
e correlationubjects as a 2was split eveith the choic
monetary payoff
ho chose A a
159)
4.5
=0.99, p=0.97
50 100 15Respons
ns between b2×2 matrix g
enly betweences made in t
f matrix:
as a function
75)
50 200 250se Time
behavior withgame, withon the two actthe game.
n of CI
300
A
B
h out tions.

25 | P a g e
8. The G-typology
Rubinstein (2013) proposed an alternative typology of choices that will be referred to as the G-topology in order to distinguish it from the typology discussed here which will be referred to in this section as the C-typology. The G-typology classifies people as fast or slow independently of the content of their actions. It is appropriate in contexts where we are unable to observe their choices and even if we are able to observe them we are unable to determine whether they are consistent with the agent’s goals. The G-typology corresponds to statements like “He is a hasty decision maker” or “He deliberates for a long time before making a decision.” In contrast, the C-typology presented earlier in the paper is appropriate in a context where we know the nature of an agent’s choices. For example, consider a bright individual who is also a very quick thinker. The G-typology might classify him as fast although he consistently chooses actions that are considered contemplative, while the C-typology would correct for this problem. Alternatively, consider an individual who bases his decisions on gut feelings but is slow to make them. He might be classified as contemplative according to the G-technology although his choices are instinctive. Again, the C-typology is able to correct for this kind of “mistake” in classifying decision makers. Here is how the G-typology is estimated. A subject’s “Local rank” is defined as the proportion of subjects who answered the problem faster than he did while his “Global Index” (GI) is the median of his local rankings in the games he has played. As in the calculation of CI, we calculate GI using the data for subjects who “played” at least 7 of the 10 basic games. Table 21 illustrates the connection between GI and the tendency to choose contemplative actions. Each graph presents one of the 10 games and each diamond-shaped point corresponds to a GI decile. Thus, the k’th point relates to the subjects in the k’th decile (from the bottom) and indicates the proportion of subjects in the decile who chose a contemplative action. Overall, the positive relationship between GI and contemplative behavior is evident from the graphs. I refrain from formal comparison of the typologies since both are intuitive and make sense as potential typologies.

#28
26 | P a g
Table 21games. Tbottom) subjects
#15 – Zero-
PC= 18.0
#3 ‐ Rationa
PC= 16.2
8 ‐ The chai
PC= 20.2
#53 ‐ Trave
PC= 10.0
g e
1: The propoThe k’th diaand indicatin the decil
Sum (n=118
0 GI + 33.1
ality (n=174
2 GI + 52.4
in store (n=1
2 GI + 43.2
eler (n=1683
0 GI + 35.1
ortion of coamond-shaptes the medile who chose
80)
46)
1345)
3)
ontemplativeped point reian GI in the a contemp
#68 ‐ Hot
PC= 1
#4 ‐ Elim
PC= 1
#33 ‐ The C
PC= 1
e choices aspresents the
he corresponplative actio
teling’s (n=1
13.8 GI + 41
ination (n=
16.2 GI + 20
Centipede (n
16.5 GI + 24
s a function e subjects innding decileon.
1314)
1.0
1815)
0.8
n=1813)
4.4
of GI in then the k’th de and the pr
#66 – Tw
PC=
#23 ‐ U
PC=
#34 ‐ "St
PC
e basic ten decile (from roportion of
wo-Contest
= 19.1 GI +
Ultimatum (
= 11.4 GI +
top or Pass”
C= 4.9 GI +
the f
ts (n=768)
22.3
(n=1689)
48.9
” (n=1725)
34.8
27 | P a g e
7. Final Comments
a. A novel typology is proposed to classify players in games in which a distinction can be made between instinctive and contemplative strategies. The typology characterizes a player according to his tendency to choose contemplative actions (as opposed to instinctive ones). The proposed typology is a hybrid of two approaches: one which uses behavior observed in previous games to predict a player’s behavior and another which uses response time in previous games to predict a player’s behavior. Response time data is used to establish the partition of actions into contemplative (long response time) and instinctive (short response time). A higher contemplative type is an agent who tends to choose contemplative actions more often than instinctive ones.
b. Are high contemplative types more successful in playing games? In the four games in which the “observed expected payoff” can be calculated, the optimal strategies are indeed contemplative although when there are more than two actions to choose from not all contemplative actions do better than all instinctive actions. In the zero-sum game (Section 3.1), the experiment was also carried out for the role of the column player and in that case 85% of the subjects chose R and therefore the contemplative action B is clearly the best choice. In the coin and die contests game (Section 3.3), the die choice is indeed the wise one. In the three-player Hoteling Game (Section 3.2), the vector of expected payoffs is (1.66, 2.13, 2.43, 2.39, 2.44, 2.13, 1.65) and the contemplative actions 3 and 5 are indeed the best choices; however, the instinctive choice of 4 is more profitable than positions 2 and 6. In the Traveler’s Dilemma (Section 3.10), the contemplative action of 299 yields the highest expected payoff but the other contemplative actions are not as profitable as the instinctive action of 300, not to mention the Nash equilibrium action of 180 which yields a disaster.
c. I find it important also to report on failed attempts to find types through the specific choices a subject made. Initially, I was looking for correlations between specific actions taken by a player in pairs of games. I have also tried to use standard techniques of clustering in order to find types of players based on the subject’s vector of choices without classifying the actions. My impression from those attempts is that it is rare to find interesting correlations between the behavior of a subject in two different games, unless the games are very similar. Therefore, it is not unreasonable to view a player’s specific strategies in two different games as approximately independent of one another (for a similar conclusion, see Georganas, Healy, and Weber (2014)). Note again that the correlations reported here are only on the level of instinctive/contemplative and do not relate to specific choices. Furthermore, being contemplative in a particular game has little predictive power in a different game. Nonetheless, if an individual makes contemplative choices in a series of independent games then it is more likely than not that he will make contemplative choices in the next game he plays.

28 | P a g e
References
Agranov, Marina, Andrew Caplin, and Chloe Tergiman, “Naïve Play and the Process of Choice in Guessing Games,” California Institute of Technology, Working Paper (2013). Arad, Ayala, and Ariel Rubinstein, “Multi-Dimensional Iterative Reasoning in Action: The Case of the Colonel Blotto Game,” Journal of Economic Behavior & Organization, 84, no. 2 (2012), 571-585.
Basu, Kaushik, "The traveler's dilemma: Paradoxes of rationality in game theory," The American Economic Review, 84 (1994), 391-395.
Berg, Joyce, John Dickhaut, and Kevin McCabe, "Trust, reciprocity, and social history," Games and economic behavior, 10, no.1 (1995), 122-142.
Branas-Garza, Pablo, Debrah Meloso, and Luis Miller, "Interactive and moral reasoning: A comparative study of response times," University of Bocconi, Working paper 440 (2012).
Burchardi, Konrad B., and Stefan P. Penczynski, "Out of your mind: Eliciting individual reasoning in one shot games," Games and Economic Behavior, 84 (2014), 39-57.
Busemeyer, Jerome R., and James T. Townsend, "Decision field theory: a dynamic-cognitive approach to decision making in an uncertain environment," Psychological review, 100 no. 3 (1993), 432-459.
Clithero, John A., and Antonio Rangel, "Combining Response Times and Choice Data Using a Neuroeconomic Model of the Decision Process Improves Out-of-Sample Predictions," California Institute of Technology, Working Paper (2013). Costa-Gomes, Miguel A., and Vincent P. Crawford, "Cognition and behavior in two-person guessing games: An experimental study," The American economic review, 96 no. 5 (2006), 1737-1768.
Donders, Franciscus Cornelis, “On the speed of mental processes,” Acta psychological, 30 (1969), 412-431. Fragiadakis, Daniel E., Daniel T. Knoepfle, and Muriel Niederle, "Identifying Predictable Players: Relating Behavioral Types and Subjects with Deterministic Rules," Stanford University, Working Paper (2013). Georganas, Sotiris, Paul J. Healy, and Roberto A. Weber, "On the persistence of strategic sophistication," University of London - Royal Holloway College, Working Paper (2014). Kahneman, Daniel, Thinking, Fast and Slow, (New York: Farrar, Straus and Giroux, 2011).

29 | P a g e
Keren, Gideon, and Yaacov Schul, "Two Is Not Always Better Than One A Critical Evaluation of Two-System Theories," Perspectives on psychological science, 4, no. 6 (2009), 533-550. Krajbich, I., K.C. Armel, & A. Rangel. (2010). Visual fixations and the com- putation and comparison of value in simple choice. Nature. Neuroscience, 13, 1292–1298. Hertwig, Ralph, Urs Fischbacher and Adrian Bruhin, “Simple heuristics in a social game,” In Hertwig, Ralph, and Ulrich Hoffrage, eds. Simple heuristics in a social world, New York: Oxford University Press (2013), 39-65. Hotelling, Harold, “Stability in competition,” The Economic Journal, 39, no. 153, 41–57.
Huberman, Gur, and Ariel Rubinstein, “Correct belief, wrong action and a puzzling gender difference,” Unpublished (2000).
Lotito, Gianna, Matteo Migheli, and Guido Ortona, "Is cooperation instinctive? Evidence from the response times in a public goods game," Journal of Bioeconomics 15, no .2 (2013), 123-133. Luce, Robert Duncan. Response Times: Their Role in Inferring Elementary Mental Organization, Oxford University Press, 1986.
Ockenfels, Axel, and Joachim Weimann, "Types and patterns: an experimental East-West-German comparison of cooperation and solidarity," Journal of Public Economics, 71, no. 2 (1999), 275-287.
Ratcliff, Roger, "A theory of memory retrieval," Psychological review, 85, no. 2 (1978), 59.
Rosenthal, Robert W., "Games of perfect information, predatory pricing and the chain-store paradox," Journal of Economic theory, 25, no. 1 (1981), 92-100.
Rubinstein, Ariel, “Dilemmas of An Economic Theorist,” Econometrica, 74 (2006), 865-883.
Rubinstein, Ariel, “Instinctive and Cognitive Reasoning: A Study of Response Times,” Economic Journal, 117 (2007), 1243-1259.
Rubinstein, Ariel, “Comments on NeuroEconomics,” Economics and Philosophy, 24 (2008), 485-494. Rubinstein, Ariel, “Response Time and Decision Making: A "Free" Experimental Study,” Judgement and Decision Making, 8 (2013), 540-551.
Schotter, Andrew, and Isabel Trevino, “Is response time predictive of choice? An experimental study of threshold strategies,” No. SP II 2014-305. WZB Discussion Paper ( 2014).
Selten, Reinhard, "The chain store paradox," Theory and decision, 9, no. 2 (1978), 127-159.

30 | P a g e
Spiliopoulos, Leonidas, and Andreas Ortmann, "The BCD of Response Time Analysis in Experimental Economics," SSRN 2401325 (2014).
Stanovich, E. Keith, and Richard F. West, “Individual differences in reasoning: Implications for the rationality debate?,” Behavioral and Brain Sciences, 23 (2000), 645–726.
Stone, Mervyn, “Models for choice-reaction time,” Psychometrika, 25, no. 3 (1960), 251–260.