Embed Size (px)
Citation preview

A Tree-Ring Based Assessment of Synchronous Extreme
Streamflow Episodes in the Upper Colorado &
Salt-Verde-Tonto River Basins
Press Information August 18, 2005
A Collaborative Project between The University of Arizona's Laboratory of Tree-Ring Research & The Salt River Project
Katherine K. Hirschboeck & David M. Meko Laboratory of Tree-Ring Research
The University of Arizona
With the assistance from: Kiyomi Morino, Ela Czyzowska & Jennifer Lee Laboratory of Tree-Ring Research, The University of Arizona
& The Salt River Project / Water Resource Operations
ACKNOWLEDGEMENTS
This project was been funded by The Salt River Project in collaboration with the City of Phoenix and the U.S. Bureau of Reclamation
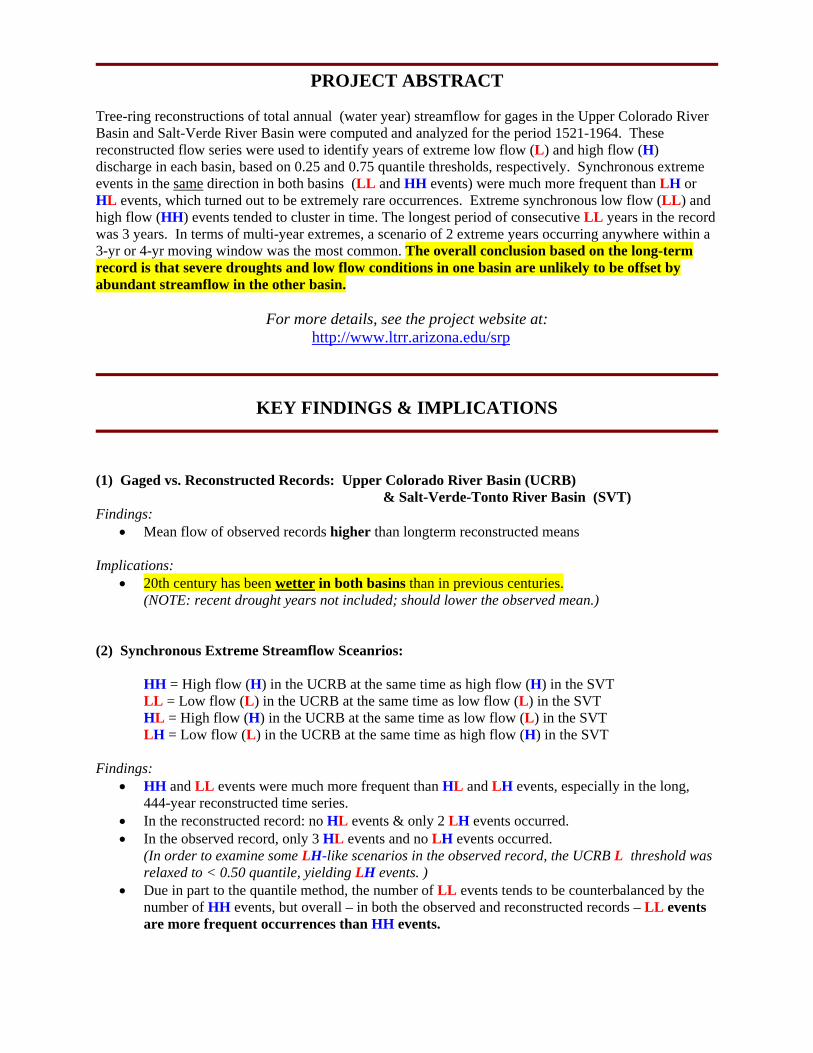
PROJECT ABSTRACT Tree-ring reconstructions of total annual (water year) streamflow for gages in the Upper Colorado River Basin and Salt-Verde River Basin were computed and analyzed for the period 1521-1964. These reconstructed flow series were used to identify years of extreme low flow (L) and high flow (H) discharge in each basin, based on 0.25 and 0.75 quantile thresholds, respectively. Synchronous extreme events in the same direction in both basins (LL and HH events) were much more frequent than LH or HL events, which turned out to be extremely rare occurrences. Extreme synchronous low flow (LL) and high flow (HH) events tended to cluster in time. The longest period of consecutive LL years in the record was 3 years. In terms of multi-year extremes, a scenario of 2 extreme years occurring anywhere within a 3-yr or 4-yr moving window was the most common. The overall conclusion based on the long-term record is that severe droughts and low flow conditions in one basin are unlikely to be offset by abundant streamflow in the other basin.
For more details, see the project website at: http://www.ltrr.arizona.edu/srp
KEY FINDINGS & IMPLICATIONS
(1) Gaged vs. Reconstructed Records: Upper Colorado River Basin (UCRB) & Salt-Verde-Tonto River Basin (SVT) Findings:
• Mean flow of observed records higher than longterm reconstructed means Implications:
• 20th century has been wetter in both basins than in previous centuries. (NOTE: recent drought years not included; should lower the observed mean.)
(2) Synchronous Extreme Streamflow Sceanrios:
HH = High flow (H) in the UCRB at the same time as high flow (H) in the SVT LL = Low flow (L) in the UCRB at the same time as low flow (L) in the SVT HL = High flow (H) in the UCRB at the same time as low flow (L) in the SVT LH = Low flow (L) in the UCRB at the same time as high flow (H) in the SVT
Findings: • HH and LL events were much more frequent than HL and LH events, especially in the long,
444-year reconstructed time series. • In the reconstructed record: no HL events & only 2 LH events occurred. • In the observed record, only 3 HL events and no LH events occurred.
(In order to examine some LH-like scenarios in the observed record, the UCRB L threshold was relaxed to < 0.50 quantile, yielding LH events. )
• Due in part to the quantile method, the number of LL events tends to be counterbalanced by the number of HH events, but overall – in both the observed and reconstructed records – LL events are more frequent occurrences than HH events.

Implications: • Working hypothesis that UCRB can serve as a buffer to compensate for extreme low flow in
the SVT during drought periods needs to be re-evaluated. • Assumption that streamflows in the two river systems are relatively independent of each other
due to a difference in the climatic regimes needs to be reevaluated. • Our analysis indicated that:
-- Flow values in two basins = significantly correlated (444 year record) -- HH and LL events dominated, not HL or LH scenarios.
• Hence annual streamflow variability in the SVT – especially extreme streamflow – is not independent of annual streamflow variability in the UCRB.
• Severe drought in one basin will tend to be accompanied by severe drought in the other basin, even though the two areas are widely separated geographically.
• High volume water supply of the large UCRB may allow continued buffering during climate stress; but demand on this supply also increasing due to non-climatic factors
(3) Persistence of Extreme Streamflow Episodes Findings:
• strong tendency for extreme years to occur in sequences or clusters • strong evidence of a linkage in multi-year drought occurrence in the two basins
Implications:
• If # of wet extreme years = # of dry extreme years, could “cancel each other” on a year-to-year basis little long-term stress on water supply operations.
• Because of clustering tendency, it's more probable that episodes of sustained drought or sustained high flow will persist more of a burden on water systems management
• Reservoir storage can buffer water supplies during these persistent episodes, but supplies will be increasingly strained as droughts extend over multi-year periods
(4) Longterm (multi-century) Variability Findings:
• Some past periods / centuries have experienced more variability in extremes (HH and LL) than others
• 20th and 21st century have fairly good representation of extremes when compared to longterm record; but higher magnitude flows and higher #'s of extremes do occur in reconstructed record
• Low-frequency variation apparent in longterm record Implications:
• Observed record a fairly good indicator of past extremes, but does not reflect highest or lowest flows possible, nor the longest persistence of extremes -- for this we need tree-rings
• Understanding climatic drivers for low-frequency variations key to better longterm management of supply; but at present ultimate causes are unknown
(5) Circulation Patterns Leading to LL, HH, LH and HL Scenarios Findings:
• Characteristic circulation pattern for LL events is higher-than-normal upper level pressure over the west in early winter (Oct -Dec) & over the North Pacific ocean storm track region in mid- to late winter (Jan - Mar).
• Inverse of this pattern leads to HH events. • LH and HL scenarios arise when the Pacific storm track appears to shift to an anomalous
poleward (HL) or equatorward (LH) location

Implications:
• Persistent circulation anomalies are important for development of extreme episodes • Development of circulation patterns may help in assessment of impending scenarios
(6) Driving Mechanisms of Longterm Variability Findings:
• Preliminary examination of El Niño, La Niña influences and ocean indices such as the Pacific Decadal Oscillation (PDO), and the Atlantic Multidecadal Oscillation (AMO) suggest linkage to some – but not all LL years in the observed record
Implications:
• +AMO / -PDO sea-surface temperature anomaly "driver" a possible influence on synchronous episodes, but more analysis needed
• (7) Severity of Recent Drought on Salt River in a Multicentury Context Findings:
• 1-year Salt R flows of the basin decreased beginning in water-year 1994 and culminated in single-year flows for 2000 & 2002 lower than any previously experienced in the observed record
• As a 5-year running mean, the recent drought is about as severe as the lowest-flow period in the 1950s.
• As 11-year running mean, also about as severe as the 1950s --suggests that the period commencing with the decline in water year 1994 and continuing through water year 2004 ranks with the driest conditions in the entire gaged record.
• As 15-year running mean, recent drought no longer ranks among the most severe (due to wet sequence of years in the early 1990s)
• Up to an averaging period of 11 years, the recent drought is at least comparable in severity to any earlier drought in the gaged record.
• Tree-ring reconstruction for SVT ends in 1988, and so does not cover the recent drought, but because the 1950s drought was characterized by flow departure of roughly the same magnitude as the recent drought, we can use the lowest reconstructed flows of the 1950s to indirectly evaluate the relative severity of the recent drought in the context of the reconstruction to A.D. 1199.
• A plot of 11-year running means of the SVT reconstruction with the baseline marked as the low point in the 1950s suggests that the current drought was exceeded in severity several times in the past 800 years
• Eight distinct periods before the start of the gaged record show lower 11-year mean flow than the lowest reconstructed value of the 1950s. The most severe of the tree-ring droughts was in the late 1500s, during the well-documented “mega-drought” of North America, when 11-year average flow is reconstructed about 100 cfs below the lowest flows of the 1950s.
Implications: • BOTTOM LINE: The recent drought, while severe, does not appear to be unprecedented
when viewed in a multi-century context.

A TREE-RING-BASED ASSESSMENT OF SYNCHRONOUS EXTREME
STREAMFLOW EPISODESin The Upper Colorado &Salt-Verde River Basins
A Collaborative Project between The University of Arizona's Laboratory of Tree-Ring Research & The Salt River Project
Katherine K. Hirschboeck & David M. MekoLaboratory of Tree-Ring Research
The University of Arizona

PURPOSE: use long-term records from tree rings . . .
• to reconstruct annual streamflow in the two basins
&• analyze variations of extreme low flow & high flow over the past several hundred years
Upper Colorado River Basin
Salt-Verde-TontoRiver Basin

What’s at stake: Reliability of the Colorado River system
as a water-supply buffer for the Salt River system
during times of extreme drought
The central question guiding the research was:
How frequently have extreme droughts or high flows occurred in both basins
simultaneously in the past?

1900 & 1904 = missing rings
1899 &1902 = narrow rings
1950 &1951 1953 -1956series of narrow rings
1952 (one wet year)
A TREE-RING CORE FROM THE SALT RIVER BASIN showing ring-width variations in the 1900s
1905 -1908 1914 – 1920two wet episodes
1899-1904dry “signature”
pattern 1950’s DROUGHT
↔ ↔ ↔ ↔ ↔ ↔ ↔ ↔ ↔ ↔ ↔ ↔ ↔ ↔ ↔ ↔ ↔ ↔ ↔ ↔ ↔
1900
1910
1920
1930
1940
1950
1960
Extreme Years of High & Low Streamflow in the Salt-Verde-Tonto River Basin
< 10th Percentile < 25th and ≥ 10th Percentile ≥ 25th and ≤ 75th Percentile > 75th and ≤ 90th Percentile > 90th Percentile
Even in a single tree, the record of
extreme wet and dry streamflow episodes
is evident.

OVERVIEW OF PROJECT STEPS:
1. Develop threshold procedure to identify extreme streamflow episodes: Low Flow, L (drought) and High Flow, H in each basin
2. Use existing tree-ring data to refine previous tree-ring reconstructions of streamflow and produce new reconstructions
3. Define extreme synchronous streamflow scenarios: LL, HH, LH, HL in observed & reconstructed records
4. Investigate possible climatic causes of scenarios
5. Develop assessment tool to transfer information into useful operational decision-making format
< 25th > 75th

Determination of Extreme L & H Years by Thresholds:
(based on 25th (L) & 75th (H) percentile thresholds
1900 1910 1920 1930 1940 1950 1960 1970 1980 1990 2000 20100.5
1
1.5
2
2.5
3
3.5x 10
4
L
H
Water Year
Mea
n D
aily
Flo
w (c
fs)
Colo. R. at Lees Ferry, water year, 1906-2001, with mean and L & H thresholds for LL/HH analysis from 1914-2001
Colo R. at Lees FerryMean = 20564cfs
H
L
Example of Colorado River Thresholds for Gaged Streamflow Record

Salt-Verde-Tonto Reconstructed Annual Streamflow
Upper Colorado Reconstructed Annual Streamflow
WHAT THE RECONSTRUTIONS
TELL US:
The observed (gaged) record is a fairly good indicator of past extremes, but does not reflect highest or lowest flows possible, nor the longest persistence of extremes -- for this we need tree-rings


1660
1661
1662
1663
1664
1665
1666
1667
1668
1669
1670 = missing ring
1671
1672
wide rings
shift to narrower rings
↔ ↔ ↔ ↔ ↔
1660
1670
1680
UC
RB
SVT
SALT RIVER BASINTREE-RING CORE
(site near Show Low)
Extreme High & Low Flow Years in BOTH Basins TogetherSalt-Verde-Tonto (SVT) & Upper Colorado River Basins (UCRB)

Extreme High and Low Flow Years in Upper Colorado & Salt-Verde Basins based on Reconstructed Streamflow* 1521-1964
< 10th Percentile < 25th and ≥ 10th Percentile ≥ 25th and ≤ 75th Percentile > 75th and ≤ 90th Percentile > 90th Percentile
Upper Colorado River Basin(UCRB) ↔ ↔ ↔ ↔ ↔ ↔ ↔ ↔ ↔ ↔ ↔ ↔ ↔ ↔ ↔ ↔ ↔ ↔ ↔ ↔ ↔ ↔
Salt -Verde -Tonto River Basin(SVT)
1520
1530
1540
1550
1560
1570
1580
1590
UC
RB
↔ ↔ ↔ ↔ ↔ ↔ ↔ ↔ ↔ ↔ ↔ ↔ ↔ ↔ ↔ ↔ ↔ ↔ ↔
SVT
1600
1610
1620
1630
1640
1650
1660
1670
1680
1690
UC
RB
↔ ↔ ↔ ↔ ↔ ↔ ↔ ↔ ↔ ↔ ↔ ↔ ↔ ↔ ↔ ↔ ↔ ↔ ↔ ↔ ↔ ↔ ↔ ↔ ↔ ↔ ↔
SVT
1700
1710
1720
1730
1740
1750
1760
1770
1780
1790
UC
RB
↔ * ↔ ↔ ↔ ↔ ↔ ↔ ↔ ↔ ↔ ↔ ↔ ↔ ↔ ↔ ↔ ↔ ↔ ↔ * ↔ ↔ ↔ ↔ ↔ ↔ ↔ ↔ ↔ ↔ ↔ ↔ ↔ ↔
SVT
1800
1810
1820
1830
1840
1850
1860
1870
1880
1890
* Reconstructed annual water year discharge
UC
RB
↔ HH years (high flow in both basins)
↔ ↔ ↔ ↔ ↔ ↔ ↔ ↔ ↔ ↔ ↔ ↔ ↔ ↔ ↔ ↔ ↔ ↔ ↔ ↔ ↔ ↔ ↔ LL years (low flow in both basins)
SVT
* LH = Low in UCRB / High in SVT
1900
1910
1920
1930
1940
1950
1960 HL = High in UCRB / Low in SVT (no occurrences)
1520 -1599 LL = 11 HH = 11
1600sLL = 11 HH = 8
1700sLL = 13 HH = 14
1800sLL = 22 HH = 11
1900 - 1964 LL = 8 HH = 14

500 mb Geopotential Height (m) Composite Anomaly, Oct-Sep water year
RESULTS: Atmospheric circulation patterns are unique for each type of extreme-year scenario
LL WATER YEARS HH WATER YEARS
higher-than-normal pressure over both basins
lower-than-normal pressure over both basins
Atmospheric Circulation Anomalies(based on observed record)
HIGHPRESSURE
LOW PRESSURE

Atmospheric Circulation Anomalies for ObservedYears with Streamflow in Opposite Direction
500 mb Geopotential Height (m) Composite Anomaly, Oct-Sep
HL WATER YEARSHigh flow in Upper ColoradoLow flow in Salt-Verde-Tonto
LH WATER YEARSLow flow in Upper Colorado
High flow in Salt-Verde-Tonto
Lower-than normal pressure to northHigher-than-normal pressure to south
Higher-than normal pressure to north Lower-than-normal pressure to south
HIGH PRESSURE
HIGH PRESSURE
LOW PRESSURE
LOW PRESSURE

Key Project Conclusions
• Synchronous extreme events in the same direction (LL and HH events) were much more frequent thanLH or HL events
• Extreme synchronous low flow (LL) and high flow (HH) events tended to cluster in time
• The longest period of consecutive LL years in the record was 3 years
• In terms of multi-year extremes, a scenario of 2 extreme yrs within a 4-yr moving window was the most common
• BOTTOM LINE: Severe droughts and low flow conditions in one basin are unlikely to be offset by abundant streamflow in the other basin


Long-Term Context of Salt-Verde-Tonto’s Current Drought
• Severity of current drought in terms of single years is worst in observed record
• Current drought is about as severe as 1950s in terms of flows averaged over 11 years
• Even during 1950s drought, occasional 1-year “breaks” of above normal flow were not unusual
• 8 other droughts in the long-term tree-ring record were as severe as the current drought
• Late 1500s mega-drought was much more severe than the current drought

• Working hypothesis that UCRB can serve as a buffer to compensate for extreme low flow in the SVT during drought periods needs to be re-evaluated.
• High volume water supply of the large UCRB may allow continued buffering during climate stress; but demand on this supply is also increasing due to non-climatic factors
• Because of clustering tendency, it's more probable that episodes of sustained drought or sustained high flow will persist
more of a burden on water systems management
• Reservoir storage can buffer water supplies during these persistent episodes, but supplies will be increasingly strained as droughts extend over multi-year periods
SOME IMPLICATIONS OF THE RESULTS:
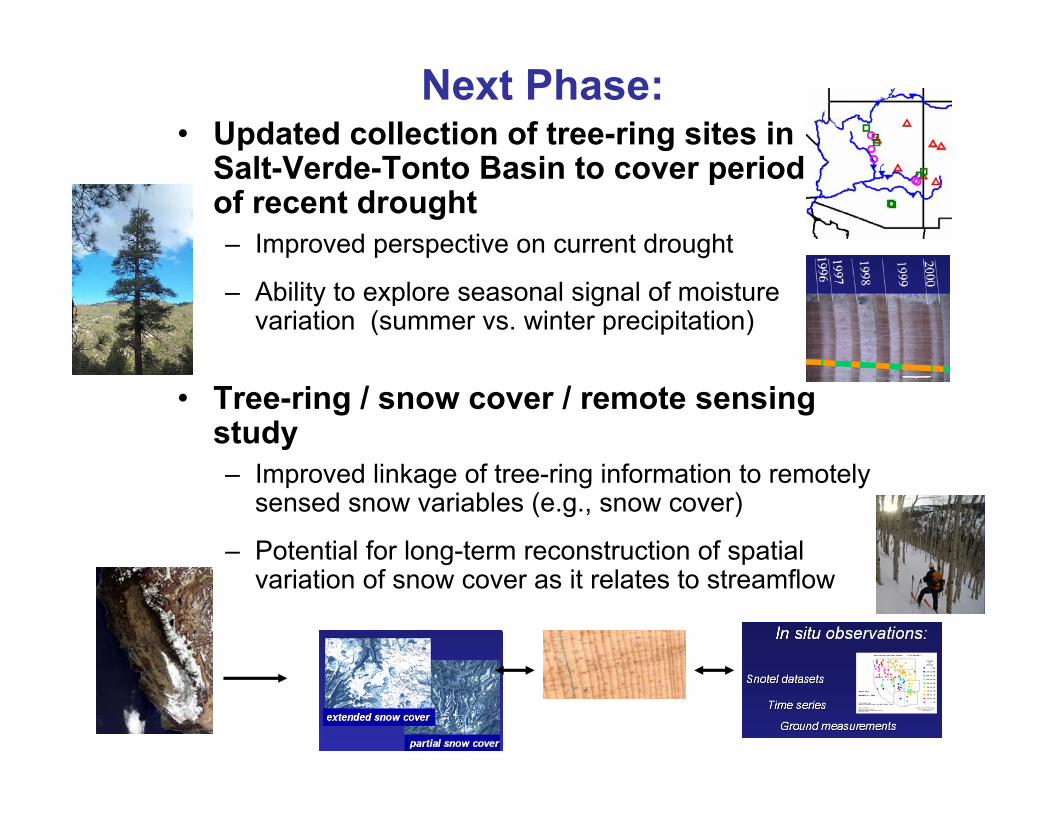
Next Phase:• Updated collection of tree-ring sites in
Salt-Verde-Tonto Basin to cover period of recent drought– Improved perspective on current drought
– Ability to explore seasonal signal of moisture variation (summer vs. winter precipitation)
• Tree-ring / snow cover / remote sensing study– Improved linkage of tree-ring information to remotely
sensed snow variables (e.g., snow cover)
– Potential for long-term reconstruction of spatial variation of snow cover as it relates to streamflow