Embed Size (px)
Citation preview
RESEARCH ARTICLE
A topic model based framework for identifying the distribution of demand for relief supplies using social media dataTing Zhanga,b,c,d&, Shi Shena,b,c,d&, Changxiu Chenga,b,c,d, Kai Sua,b,c,d and Xiangxue Zhanga,b,c,d
aKey Laboratory of Environmental Change and Natural Disaster, Beijing Normal University, Beijing, China; bState Key Laboratory of Earth Surface Processes and Resource Ecology, Beijing Normal University, Beijing, China; cFaculty of Geographical Science, Beijing Normal University, Beijing, China; dCenter for Geodata and Analysis, Beijing Normal University, Beijing, China
ABSTRACTNatural disasters have caused substantial economic losses and numerous casualties. The demand analysis of relief supplies is the premise and basis for efficient relief operations after disasters. With the widespread use of social media, it has become a vital channel for people to report their demand for relief supplies and provides a way to obtain information on disaster areas. Therefore, we present a topic model-based framework and establish a demand dictionary and a gazetteer that aims to identify the spatial distribution of the demand for relief supplies by using social media data. Taking the 2013 Typhoon Haiyan (also called Yolanda) as a case study, we identify the potential topics of tweets with the biterm topic model, screen the tweets related to demands, and obtain the demand and location information from tweets to study the distribution of the relief supplies needs. The results show that, based on the demand dictionary, a gazetteer and the biterm topic model, the effective demand for relief supplies can be extracted from tweets. The proposed framework is feasible for the identification of accurate demand information and its distribution. Further, this framework can be applied to other types of disaster responses and can facilitate relief operations.
ARTICLE HISTORY Received 11 December 2019 Accepted 23 December 2020
KEYWORDS Demand for relief supplies; social media; btm; nature disaster; twitter; emergency management
1. Introduction
In the last two decades, the frequency and severity of natural disasters have increased and resulted in significant economic losses and casualties. In 2011, the Great East Japan Earthquake and Tsunami caused 14,508 deaths and incurred economic costs of 16 to 26 trillion yen Mimura et al. (2011). In 2013, super Typhoon Haiyan hit the Philippines and took approximately 6300 lives (NDRRMC 2014). Unfortunately, the model simulation results project that very intense tropical cyclones will be more frequent due to climate change (Knutson et al. 2010, Bacmeister et al. 2018). Thus, there is a growing requirement for disaster management to reduce natural disaster risks and achieve Sustainable Development Goals 11 (sustainable cities and communities) and 13 (climate action).
CONTACT Changxiu Cheng [email protected]&These authors contributed equally to this work.
Supplemental data for this article can be accessed here.
INTERNATIONAL JOURNAL OF GEOGRAPHICAL INFORMATION SCIENCE https://doi.org/10.1080/13658816.2020.1869746
© 2021 Informa UK Limited, trading as Taylor & Francis Group

The demand for relief supplies (DRS) plays an essential role in disaster management. Generally, disaster management consists of four phases: prevention, preparedness, response, and recovery (Neal 1997, Nazer et al. 2017). The disaster response is the direct operation that provides relief and support to people and minimizes the negative impacts during and immediately after disasters (Abrahams 2001). To reduce both the loss of life and economic losses, a critical problem in disaster response is appropriately allocating the relief supplies to the areas that are affected by disasters (Holguín-Veras et al. 2013, Ruan et al. 2015). The proper allocation of relief supplies requires accurate and timely DRS.
Due to the asymmetric information between the relief supplies from rescue agencies and the uncertain demand of people, disaster responses face a severe supply-demand imbalance issue (Sheu 2007). Moreover, the increasing population and infrastructure complexity make the DRS highly variable and difficult to predict, which leads to unmet demand and an enormous waste of relief supplies (Balcik and Beamon 2008, Bame et al. 2012, Cavdur et al. 2016). A valid and feasible solution is leveraging social media to identify people’s DRS in disaster areas.
Social media has become a significant communication channel to help survivors report their DRS. Users have become sensors of the real world and upload on-the-ground information (Goodchild 2007, Mark and Irina 2011). People use social media platforms (e.g., Twitter, Facebook, Flickr, and Ushahidi) to post messages about requests and needs during a disaster (H.Gao et al. 2011, Stowe et al. 2016). Real-time and massive social media data, combined with information extraction, spatiotemporal analyses, and other methods can be used to obtain dynamic and accurate DRS to assist the disaster relief operations (Kamel Boulos et al. 2011, Dabner 2012, de Albuquerque et al. 2015, Schempp et al. 2019). Because these demands reflect the actual needs of people in disaster areas, the supply- demand imbalance is likely to be mitigated. Meanwhile, accurate demand can directly improve the efficiency of relief operations (Hjorth and Kim 2011).
Nevertheless, mining demand-related information from massive and sophisticated social media data is still a significant challenge. First, social media data contain vast amounts of irrelevant data. Second, due to the limited number of characters (e.g., 280 characters for Twitter since 2017), social media usually have short texts that result in severe data sparsity and semantic understanding problems. Third, the content of social media is mixed with uncertain information, such as spelling errors, unique abbreviations, and shorthand terms, which limit the application of a keyword-based data mining method.
In this paper, we propose a topic model based framework to extract demand and location information and identify the distribution of the demand after disasters by using social media data. This paper aims to providing an innovative framework integrating topic model and geographic information for different disaster events and social media plat-forms. Our framework consists of three stages. In the first stage, we pre-process social media data and use the Biterm Topic Model (BTM) (Yan et al. 2013) to dissect the demand topics. BTM decides the topic of the short text by modeling the generation of the word co- occurrence patterns. In the second stage, we establish a demand dictionary based on high-frequency demand words and expand it with word-pairs, synonyms, and local language usage. In the third stage, we built a gazetteer based on administrative divisions and synonyms, extract demand and location information from the text and map the distribution of demand and its degree.
2 T. ZHANG ET AL.

The remainder of the paper is organized as follows. Section 2 summarizes related works. Section 3 introduces an overview of the proposed framework and elaborates on each phase. Section 4 describes the methods used in our framework. Section 5 describes the case study. Sections 6 and 7 present and discuss the case application results in more detail. Finally, Section 8 presents the main contributions and plans for our future work.
2. Related works
2.1. Classical ways for the identifying demand for relief supplies
According to the process of disaster events, the demand for relief supplies includes two types: pre-disaster demand and post-disaster demand (Wang et al. 2016a). Since the accurate DRS is critical to the success of disaster relief (Sheu 2010), we focus on the post- disaster DRS. A range of models and methods have been proposed to identify post- disaster demand. Case-based reasoning (CBR) is a capable and popular method for forecasting demands (Basu et al. 2019). The principle of CBR is that similar disaster cases have similar situations, and the solutions of similar cases can be adjusted to forecast the demand in a current disaster case. Zhang and Xu (2010) combined the CBR and a multiple linear regression model to build a simulation model for tent use in the historical cases of six typhoons in a particular region and used the model to forecast the tent use in the target typhoon cases. Liu et al. (2012) associated the risk analysis to CBR and forecasted the demand for emergency resources, including its quantity, quality, and type. Time series analysis and modeling is another method for forecasting relief demands. Sheu (2007) proposed a time-varying model to forecast the urgent demands for consumable supplies and equipment used daily in each affected area, which considers the uncertainty and dynamics of the demand for relief supplies. Xu et al. (2010) introduced a hybrid model of empirical mode decomposition and applied the autoregressive integrated moving aver-age to forecast the demand for commodities after disasters. Additionally, other methods, e.g., machine learning (Nguyen et al. 2019) and grey system theory (Sheu 2010), were also applied in demand analysis and forecasting. Wang (2013) proposed a genetic GM (1,1) model to predict food demand after snow disasters and improved the forecasting results for three vegetable crops increased by 27.961%, 27.658%, and 20.83% compared with the traditional grey theory method. However, these traditional approaches rely upon histor-ical data and cannot use demand from in-progress disaster areas.
2.2. The application of social media in disasters
Social media platforms have become increasingly useful and pivotal in disaster responses (Huang and Xiao 2015, Steiger et al. 2015, Nazer et al. 2017, Wang and Ye 2018). Locals in disaster affected regions use social media to keep in touch with the outside, request help, and receive notifications from authorities (Lachlan et al. 2014, Liu et al. 2015, Cheng et al. 2019). Moreover, the data and information gathered from social media can facilitate disaster relief.
Previous research has used social media data to predict disasters or emergencies and issue early warnings, with excellent results reported (Robinson et al. 2013, Paul et al. 2014). Disaster situation awareness and disaster monitoring are also active. Wang and Ye (2018),
INTERNATIONAL JOURNAL OF GEOGRAPHICAL INFORMATION SCIENCE 3

Kent and Capello (2013) used Twitter to enhance situational awareness and analyze the spatial and temporal patterns of wildfire. Fohringer et al. (2015) extracted flooding water depth information from the photos posted on Twitter. Social media messages contain large amounts of real-time data, which makes these studies possible.
Similarly, social media data can also support disaster management and assess disaster losses (Yates and Paquette 2011, Cervone et al. 2016). Ancheta et al. (2017) examined tweets topics during Typhoon Fung-Wong and suggested that Twitter can be a platform for disaster risk reduction. Twitter activities strongly correlate with economic damage and thus can be used for rapid damage assessment of a large-scale disaster (Kryvasheyeu et al. 2016). However, how social media data assists disaster management needs to be further elaborated.
Meanwhile, mining disaster-related information from massive social media data remains a challenge. The topic model has attracted scholars’ attention. Although the keyword-based method is a common method of classification and extraction (Vieweg et al. 2010, Murakami and Nasukawa 2012, Olteanu et al. 2014, Imran et al. 2014, 2015), this approach may not be appropriate for data containing noise data or missing critical information and depends on prior knowledge (Mendoza et al. 2010). The machine learn-ing-based topic models are also popular and feasible methods for classifying texts, including supervised models and unsupervised models. Purohit et al. (2014) converted tweets into semi-structured texts, and then used supervised machine learning methods to classify the texts, and find the relevant text of the disaster relief needs to match with demand providers to achieve the purpose of supply and demand matching. They achieved a 72% improvement over baseline for matching request–offer pairs. Imran et al. (2014). developed the Artificial Intelligence for Disaster Response (AIDR) platform, which combines human and machine intelligence to train an automatic classifier for nine topics related to crises. Their goal was to create a training dataset amenable to any natural disaster. AIDR was successfully tested during an earthquake in Pakistan in 2013, with a maximum classification quality of up to 80%.
Compared to supervised classifications, an unsupervised topic model does not require pre-defined classes and training sample data to identify the topics of texts (Wang et al. 2016b, Nazer et al. 2017, Gorro et al. 2017, Kireyev et al. 2019). Latent Dirichlet Allocation (LDA) is widely used. Liang et al. (2018) combined LDA and Support Vector Machine (SVM) to classify Weibo texts related to Typhoon Meranti, and obtained four topics of early warning information, disaster information, rescue information and irrelevant information. Resch et al. (2018) used LDA to extract Twitter information and conduct hot spot detection to accurately identify earthquake footprints. Due to the short, sparse, and incomplete features of social media texts, BTM is more suitable for short text. BTM composes any two co-occurring words in the same text into a word-pair, and replaces the document layer in LDA with the word-pair layer, which solves the problem of document sparseness. Ligutom et al. (2016) used Biterm Topic Model to understand typhoon-related tweets, revealing the different behaviors of Filipinos during typhoons. Our study introduces perplexity to determine the optimal number of topics, quantitatively evaluates the results of topic classification, and pays more attention to identifying relief supplies from classified tweets.
4 T. ZHANG ET AL.

3. The demand identification framework
This article proposed the topic model based framework (Figure 1) to identify the DRS using social media data. There are three main tasks in this framework: data processing and social media text comprehension, demand extraction, and spatial positioning. Correspondingly, this framework consists of three stages.
Figure 1. The framework to identify the demands distribution.
INTERNATIONAL JOURNAL OF GEOGRAPHICAL INFORMATION SCIENCE 5
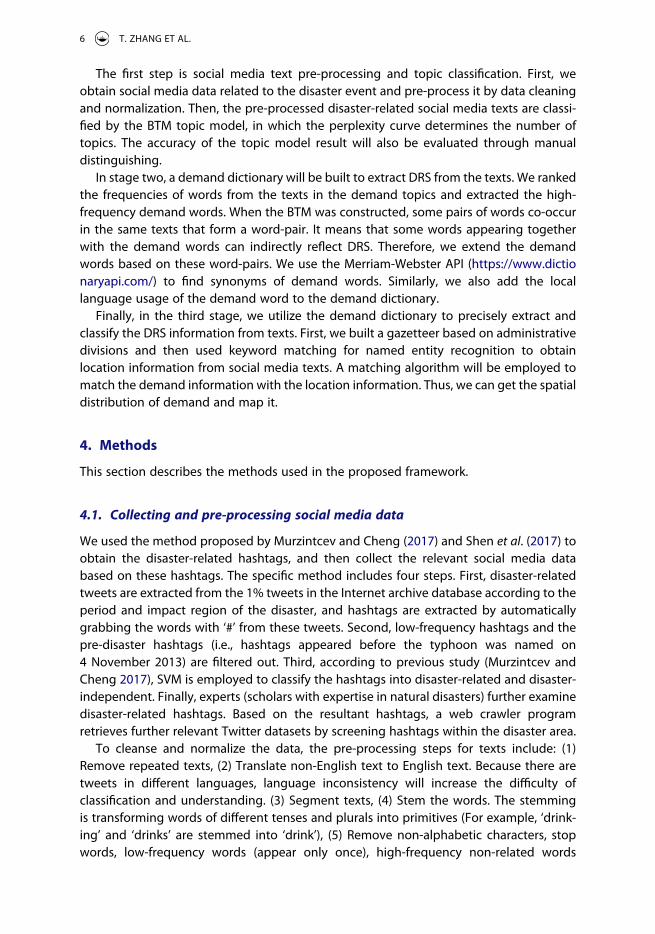
The first step is social media text pre-processing and topic classification. First, we obtain social media data related to the disaster event and pre-process it by data cleaning and normalization. Then, the pre-processed disaster-related social media texts are classi-fied by the BTM topic model, in which the perplexity curve determines the number of topics. The accuracy of the topic model result will also be evaluated through manual distinguishing.
In stage two, a demand dictionary will be built to extract DRS from the texts. We ranked the frequencies of words from the texts in the demand topics and extracted the high- frequency demand words. When the BTM was constructed, some pairs of words co-occur in the same texts that form a word-pair. It means that some words appearing together with the demand words can indirectly reflect DRS. Therefore, we extend the demand words based on these word-pairs. We use the Merriam-Webster API (https://www.dictio naryapi.com/) to find synonyms of demand words. Similarly, we also add the local language usage of the demand word to the demand dictionary.
Finally, in the third stage, we utilize the demand dictionary to precisely extract and classify the DRS information from texts. First, we built a gazetteer based on administrative divisions and then used keyword matching for named entity recognition to obtain location information from social media texts. A matching algorithm will be employed to match the demand information with the location information. Thus, we can get the spatial distribution of demand and map it.
4. Methods
This section describes the methods used in the proposed framework.
4.1. Collecting and pre-processing social media data
We used the method proposed by Murzintcev and Cheng (2017) and Shen et al. (2017) to obtain the disaster-related hashtags, and then collect the relevant social media data based on these hashtags. The specific method includes four steps. First, disaster-related tweets are extracted from the 1% tweets in the Internet archive database according to the period and impact region of the disaster, and hashtags are extracted by automatically grabbing the words with ‘#’ from these tweets. Second, low-frequency hashtags and the pre-disaster hashtags (i.e., hashtags appeared before the typhoon was named on 4 November 2013) are filtered out. Third, according to previous study (Murzintcev and Cheng 2017), SVM is employed to classify the hashtags into disaster-related and disaster- independent. Finally, experts (scholars with expertise in natural disasters) further examine disaster-related hashtags. Based on the resultant hashtags, a web crawler program retrieves further relevant Twitter datasets by screening hashtags within the disaster area.
To cleanse and normalize the data, the pre-processing steps for texts include: (1) Remove repeated texts, (2) Translate non-English text to English text. Because there are tweets in different languages, language inconsistency will increase the difficulty of classification and understanding. (3) Segment texts, (4) Stem the words. The stemming is transforming words of different tenses and plurals into primitives (For example, ‘drink-ing’ and ‘drinks’ are stemmed into ‘drink’), (5) Remove non-alphabetic characters, stop words, low-frequency words (appear only once), high-frequency non-related words
6 T. ZHANG ET AL.

(appear more frequently than 1% of the total number of words), hashtag, (6) Remove low- quality texts (texts with only 0 or 1 word left after step 5).
4.2. Extracting demand related topics
A machine learning-based topic model is employed to identify topics related to DRS from the dataset. Conventional topic models include Probabilistic Latent Semantic Analysis (PLSA) (Hofmann 1999) and LDA (Blei et al. 2003). LDA is developed from the PLSA model and widely used for uncovering the hidden topics in a text corpus (Weng et al. 2010, Chen et al. 2016). LDA and its variants (such as the author topic model (Rosen-Zvi et al. 2010) and the Bayesian nonparametric topic model (Teh et al. 2006)) works well in the topic classification of standard text. However, due to the short, sparse, and incomplete features of social media texts, direct application of conventional LDA-based models on short texts (e.g., tweets) may not work well (Hong and Davison 2010).
The BTM was proposed by Yan et al. (2013) to overcome the shortcomings caused by short texts. Instead of the bag of words (BoW) model, the BTM uses a word-pair model to construct the probability distribution between topics and short texts. The BTM model has the following advantages. BTM enhances topic learning through modeling the word-pair (i.e. biterms) patterns (Yan et al. 2013). BTM solves the sparse problem at the document- level by aggregating word-pair patterns in the whole corpus (Yan et al. 2013). BTM extends the volume of the words from short texts (e.g., tweets) by adding combinations of meaningful terms from the whole corpus. In the BTM, word-pairs contain more useful semantic meaning than the BoW because word-pairs are linguistically specific and avoid the confusion caused by a single word. Therefore, this study used the BTM to identify the topics related to DRS.
4.2.1. Principles and modeling of the biterm topic modelThe BTM directly models the word co-occurrence patterns from an unordered word-pair co-occurrence in a short context. It solves document sparseness by learning topics from the aggregate pattern of the entire corpus. Figure 2 shows its Bayesian network diagram.
θ is the topic’s distribution in the text corpus, φ is the distribution of the word pairs in the topic, Z is the topic corresponding to the word pair, k is the number of topics that a text may have, wi and wj are two different words that form a word pair, Bj j is the number of word pairs in the entire corpus, and α and β are prior parameters.
The process of generating text from the BTM model is as follows:
(1) For the entire corpus, the topic distribution is θ ~Dirichlet αð Þ.(2) For each topic Z, the word distribution of this topic is φZ
~Dirichlet βð Þ.(3) For each word pair b ¼ wi;wj
� �in the set B, (1) randomly extract a topic Z from the
topic distribution θ of the entire corpus, Z ~Multinomial θð Þ; and (2) randomly extract two words wi and wj constituting the word pair b from the extracted topic Z, wi;wj ~Multinomial φZð Þ.
Since the BTM is an unsupervised method, the number of topics is not fixed. We use a perplexity curve determine the number of topics. Perplexity is a measurement of how
INTERNATIONAL JOURNAL OF GEOGRAPHICAL INFORMATION SCIENCE 7

well a probability distribution or probability model predicts a sample. A low perplexity indicates the probability distribution is good at predicting the sample. We calculated the perplexity for a range of topic numbers and draw the perplexity curve. Then, we com-pared and determined the number of topics with the lowest average perplexity. The formula for calculating the perplexity is as follows:
perplexity Dð Þ ¼ exp�P
d log P wdð Þð ÞP
d Nd
� �
(1)
where d is the serial number of documents, wd is the word vector in the dth document, P wdð Þ is the probability of each word in the dth document, and Nd is the number of words in the dth document.
The parameters θ and φ of the BTM are inferred by Gibbs’ sampling (Geman and Geman 1993). The two Dirichlet prior parameters in the model are generally based on empirical values: α = 50/k = 1 and β = 0.01.
4.2.2. Topic model performance evaluationThe Accuracy, Recall, Precision, and F1-measure can be used to evaluate classification performance. The Accuracy evaluates the overall accuracy of the model’s operation, while Recall, Precision, and F1-measure evaluate the inferential accuracy of the model for different topics, these parameters are between 0 and 1 (Chen and Meng 2019). The larger the value, the better the model. The details of calculation formulas of Accuracy, Recall, Precision, and F1-measure are in the Supplementary Material.
4.3. Establishing the demand dictionary
The third phase is to locate and assess the demand degree for the DRS. Due to the various disaster types, severity, and regions, the DRS for each disaster is different. Therefore, we need to establish a specific demand dictionary for the current disasters, and then analyze the specific needs. The generation of the demand dictionary includes two steps:
Figure 2. Bayesian network diagram of the biterm topic model.
8 T. ZHANG ET AL.

Step 1: Extract high-frequency demand words. We perform word frequency statistics on all texts after stemming, and select words with a probability greater than 1% as candidate high-frequency demand words. We then refer to the Classification and code of emergency supplies (CCES) (CNIS 2020)to determine the demand word. CCES is a Chinese national standard, which stipulates the principles and methods of classification and coding of emergency supplies: It combines Chinese domestic and international emergency supply classification standards (such as United Nations Standard Products and Services Code (UNSPSC), United Nations Common Coding system (UNCC)) and focuses on natural disasters. This standard is relatively comprehensive and has a certain degree of universality. If the candidate word exists in the CCES, it is determined as a high- frequency demand word and is added to the demand dictionary.
Step 2: Expand high-frequency Demand word.Word-pairs can indicate demands. For instance, ‘drink’ and ‘water’ constitute a word-
pair. The word ‘drink’ can indirectly reflect the DRS. According to the co-occurrence of such words, we use high-frequency demand word-pairs to expand demand words. Obtaining high-frequency demand word-pairs includes two automated steps: (1) In a tweet, any two words can form a word-pair. Combine each word with all other words to form word-pairs, and word-pair can be expressed as b ¼ wi;wj
� �, where b is word-pair,
wi;wj are any two words in a tweet. Among all word-pairs, the demand word-pairs can be represented by bdi ¼ wd;wið Þ, where wd is the high-frequency demand word extracted in step 1, and wi is other words. (2) Calculate the probability of each bdi in demand-related tweets. When the probability of bdi is greater than 1%, it is considered as a high-frequency demand word-pair. Finally, it is necessary to manually judge whether wi can be added to the demand dictionary. When wionly forms a high-frequency word-pair with one demand word wd , wi can be added to the demand dictionary. This means that both words in the high-frequency demand word-pair are included in the demand dictionary (wd is added to the demand dictionary in step 1).
We use the Merriam-Webster API to identify the synonyms of demand words and add them to the demand dictionary. Since we translated the tweets into English during data pre-processing, some words may not be successfully translated, so local language usage was added to the demand dictionary to identify as many demand words as possible.
4.4. Mapping the distribution of demand for relief supplies
4.4.1. Marking the location information of tweetsThe geographic location tagged by social media users is vital to the identification of the demand distribution. Coordinates and toponyms are the two main types of location information in social media (Huang and Wong 2016). Exact coordinates can be solicited by global positioning systems (GPS) or, if the user chooses to include location informa-tion, can be inferred from the user’s profile. Toponyms are often derived from social media content. In most cases, research locates social media information with geo-graphic coordinates (Wang and Ye 2018). However, the proportion of texts that directly mark the GPS location information is tiny (Dredze et al. 2013), and the locations marked by users are not consistent with the location expressed in texts. Therefore, we obtain the location information directly from the social media content through a named entity
INTERNATIONAL JOURNAL OF GEOGRAPHICAL INFORMATION SCIENCE 9

recognition method. First, we establish a gazetteer based on the administrative divi-sions, which contains the names of all the provinces, cities, and villages in the disaster area. Due to the colloquial and irregular language of social media, people will use abbreviations and nicknames for place names, such as ‘PH’ for ‘the Philippines’. Therefore, when establishing the gazetteer, synonyms such as abbreviations and aliases are also included. Then, we perform keyword matching on the social media text. If the text contains the place-name in the gazetteer, then we mark it as the place-name information of the social media text.
4.4.2. Locating the demandThe resulting corpus of tweets contain both demand information and location informa-tion. The DRS can be localized by matching the demand and place-name of texts. There are four situations in which the matching of demand and place names occur. The first situation is a unique demand and a single place name, which directly attaches the demand to the location. The second situation has multiple demands and a single location. All of these needs are attached to a single location. The third is a unique demand and multiple place names, which project the demands to these locations. The fourth situation consists of multiple demands and multiple place names. We manually determine the correspondence between the demands and the place names by reading the text to infer what the text expresses.
5. Case selection
5.1. Typhoon Haiyan in the Philippines
The Philippines is an archipelagic country in the western Pacific Ocean that is strongly affected by monsoons and suffers frequent typhoons. The Philippines also has one of the largest shares of Twitter users in the world.
At 4:40 am on 8 November 2013, Typhoon Haiyan (or Yolanda locally), the strongest typhoon recorded in the northwest Pacific Ocean, landed in the Samar province of the central Philippines. Figure 3 shows the track (from IBTrACS (Knapp et al. 2018)) and the Public Storm Warning Signal of Haiyan. It struck the central Philippines, causing 6300 deaths and 28,688 injured, with more than 3 million families affected and 1,140,332 houses damaged (NDRRMC 2014). Typhoon Haiyan attracted the attention of the entire Philippines. Many media agencies and users in the Philippines published comments on different topics about Typhoon Haiyan on Twitter, which ensures that the amount of Twitter data is sufficient and that the case is representative.
6. Results
6.1. Twitter data
Using the method described in Section 4.1, we obtained 21 hashtags associated with Typhoon Haiyan (Cheng et al. 2019) (see Supplementary Material, Figure S1). A total of 77,671 original tweets (excluding retweets) from 2 November 2013, to 18 December 2016, were downloaded. Since the International Federation of Red Cross and Red Crescent Societies conducts rapid post-demand assessments within one week after the disaster
10 T. ZHANG ET AL.

(ALNAP 2008), we selected data within one week after the disaster to identify the demands, resulting in a data set of 44,063 tweets.
6.2. Topic classification
To test the results of the BTM, we randomly extracted 100 tweets from each category for manual inspection and artificially classified 500 tweets as valid values (Supplementary Material, Table S2). Total Accuracy of the classification results is 0.68. The Precision of the demand category was 0.64, the Recall was 0.76, and the F1-measure was 0.6.
Using the BTM model and the perplexity measure, we obtained 12 topics. In each topic, the top 20 most frequent words are selected, and then specific meanings of each topic were described. Furthermore, because of their similar ideas, we labelled the 12 topics and further grouped the topics into five categories: demand, praying, reconstruction, disaster situation, and other (Table 1). Due to the particularity of the Twitter language, the spelling of some English words is different from the standard spelling, which does not affect the recognition.
In the 12 topics, topics 1,5,6, and 8 are associated with the two types of DRS. One type directly expresses the shortage of supplies and the demand in some areas. The other type
Figure 3. The track and Public Storm Warning Signal (PSWS) of Typhoon Haiyan in the Philippines. The larger the PSWS number, the stronger the warning level, and the time interval between any two adjacent typhoon centers is 6 hours.
INTERNATIONAL JOURNAL OF GEOGRAPHICAL INFORMATION SCIENCE 11

is the results of the decision-making for materials from government, international, and private institutions that reflect the specific needs of the disaster area. If agencies dis-tributed supplies to particular areas, they are likely to have demands for supplies. Typical examples of the two types of demand tweets are listed in Table 2.
6.3. The distribution of disaster relief supplies
Table 3 shows the demand dictionary of Typhoon Haiyan according to the method in Section 4.3. According to the functions or properties represented by the demand words, we manually classify these demand words into six types: refugee supplies, energy, food, clothing, medical, and water.Keywords were stemmed, the spelling of some English words is different from the standard spelling, which does not affect the recognition.
We extracted DRS information from tweets according to this demand dictionary. After that, based on named entity recognition described in Section 4.4, we marked 19,056 tweets with place-names. We randomly selected 10% (1906) tweets to verify the location
Table 1. Results of the extracted topics.Topic ID TOP20 words Topic description Category
1 Relief, aid, effort, affect, govern, aquino, disast, survivor, respons, recoveri, presid, rehab, govt, assist, gov, nation, fund, support, post, rehabilit
Government disaster emergency response, disaster relief
Demand
2 Sa, ang, ng, po, lang, mga, pa, ni, ko, grabe, sana, yung, guy, tayo, hope, ka, naman, news, si, haha
Filipino text Other
3 Survivor, victim, rais, benefit, support, fund, relief, proceed, photo, light, christma, sale, typhoon, concert, love, tonight, pm, parti, flag, join
Post-disaster fundraising, condolences, commemoration
Reconstruction
4 Samar, leyt, cebu, island, eastern, signal, northern, town, visaya, famili, iloilo, citi, updat, affect, damag, provinc, bantayan, power, hit, guiuan
Disaster area Disaster situation
5 Water, relief, food, cebu, citi, team, survivor, suppli, medic, leyt, send, arriv, aid, oper, affect, power, airport, ship, emerg, hospit
Various relief supplies, medical assistance
Demand
6 Relief, volunt, pack, dswd, repack, effort, oper, drop, center, survivor, accept, call, op, villamor, contact, citi, cebu, check, pm
Rescue, package, distribute supplies
Demand
7 News, watch, report, heart, death, dead, heartbreak, devast, live, toll, break, cnn, leyt, video, aftermath, sad, cri, happen, updat, ndrrmc
News reports, disaster casualties, mass sentiment
Disaster situation
8 Red, text, cross, updat, affect, globe, free, smart, call, person, send, tweet, list, relief, amount, servic, info, hashtag, link
Fundraising, Red Cross, Rescue Demand
9 Citi, leyt, famili, cebu, hous, san, tree, brgi, mayor, school, class, ormoc, evacu, photo, palo, roof, damag, resid, center, jose
Trees, bridges, roofs, etc. are damaged by typhoons, school holidays
Disaster situation
10 God, filipino, hope, prayer, bless, lord, affect, countri, stay, storm, strong, love, super, faith, spirit, visaya, heart, famili, stronger, guy
Bless, pray Praying
11 Wind, pm, rain, manila, strong, pagasa, metro, kph, heavi, expect, weather, updat, eye, signal, stay, citi, novemb, warn, km
Describe the hazard factors such as wind, rain, etc.
Disaster situation
12 Strongest, storm, super, hit, filipino, haiyan, countri, surg, histori, nation, record, cnn, landfal, philippin, god, stronger, stay, cyclon, planet
Describe hazards such as storms, waves, mudslides, etc.
Disaster situation
*Due to the particularity of the Twitter language, the spelling of some English words is different from the standard spelling, which does not affect the recognition.
12 T. ZHANG ET AL.
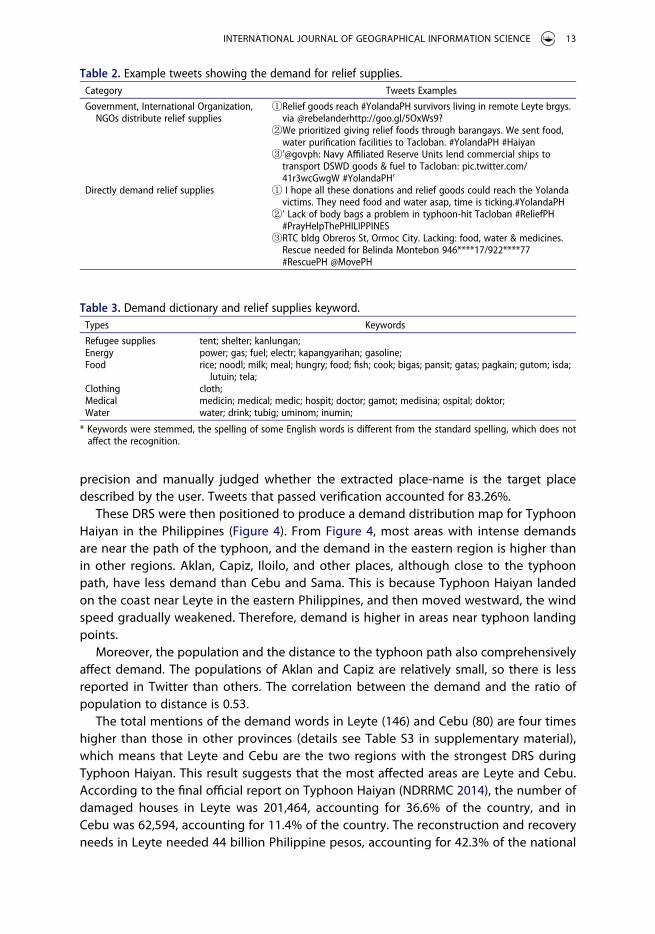
precision and manually judged whether the extracted place-name is the target place described by the user. Tweets that passed verification accounted for 83.26%.
These DRS were then positioned to produce a demand distribution map for Typhoon Haiyan in the Philippines (Figure 4). From Figure 4, most areas with intense demands are near the path of the typhoon, and the demand in the eastern region is higher than in other regions. Aklan, Capiz, Iloilo, and other places, although close to the typhoon path, have less demand than Cebu and Sama. This is because Typhoon Haiyan landed on the coast near Leyte in the eastern Philippines, and then moved westward, the wind speed gradually weakened. Therefore, demand is higher in areas near typhoon landing points.
Moreover, the population and the distance to the typhoon path also comprehensively affect demand. The populations of Aklan and Capiz are relatively small, so there is less reported in Twitter than others. The correlation between the demand and the ratio of population to distance is 0.53.
The total mentions of the demand words in Leyte (146) and Cebu (80) are four times higher than those in other provinces (details see Table S3 in supplementary material), which means that Leyte and Cebu are the two regions with the strongest DRS during Typhoon Haiyan. This result suggests that the most affected areas are Leyte and Cebu. According to the final official report on Typhoon Haiyan (NDRRMC 2014), the number of damaged houses in Leyte was 201,464, accounting for 36.6% of the country, and in Cebu was 62,594, accounting for 11.4% of the country. The reconstruction and recovery needs in Leyte needed 44 billion Philippine pesos, accounting for 42.3% of the national
Table 2. Example tweets showing the demand for relief supplies.Category Tweets Examples
Government, International Organization, NGOs distribute relief supplies
①Relief goods reach #YolandaPH survivors living in remote Leyte brgys. via @rebelanderhttp://goo.gl/5OxWs9?
②We prioritized giving relief foods through barangays. We sent food, water purification facilities to Tacloban. #YolandaPH #Haiyan
③’@govph: Navy Affiliated Reserve Units lend commercial ships to transport DSWD goods & fuel to Tacloban: pic.twitter.com/ 41r3wcGwgW #YolandaPH’
Directly demand relief supplies ① I hope all these donations and relief goods could reach the Yolanda victims. They need food and water asap, time is ticking.#YolandaPH
②’ Lack of body bags a problem in typhoon-hit Tacloban #ReliefPH #PrayHelpThePHILIPPINES
③RTC bldg Obreros St, Ormoc City. Lacking: food, water & medicines. Rescue needed for Belinda Montebon 946****17/922****77 #RescuePH @MovePH
Table 3. Demand dictionary and relief supplies keyword.Types Keywords
Refugee supplies tent; shelter; kanlungan;Energy power; gas; fuel; electr; kapangyarihan; gasoline;Food rice; noodl; milk; meal; hungry; food; fish; cook; bigas; pansit; gatas; pagkain; gutom; isda;
lutuin; tela;Clothing cloth;Medical medicin; medical; medic; hospit; doctor; gamot; medisina; ospital; doktor;Water water; drink; tubig; uminom; inumin;
* Keywords were stemmed, the spelling of some English words is different from the standard spelling, which does not affect the recognition.
INTERNATIONAL JOURNAL OF GEOGRAPHICAL INFORMATION SCIENCE 13

total, and Cebu needed 8 billion Philippine pesos, accounting for 8.4% of the national total. Leyte and Cebu were the worst-hit areas in terms of damage to homes and reconstruction costs. Hence, our results are consistent with the final official report on Typhoon Haiyan.
The ranking of demand words in different regions (Figure 5) shows Leyte (41) and Cebu (19) have the highest demands for medical supplies, followed by Samar (15), which indicates that there are a large number of casualties in these provinces. The report (NDRRMC 2014) showed that Leyte, Samar, and Eastern Samar accounted for 90% of the total number of casualties from Haiyan. For refugee supplies, the highest demand is still Leyte (11), followed by Samar (4). According to the report, the actual numbers of people evacuated before the disaster in the two provinces were 3109 and 504, respectively. The actual numbers of people affected were 2,364,023 and 821,989, respectively, much larger than the number of people evacuated. Therefore, the two provinces have a high demand for tents and shelter. The demands for food and water were the strongest in Leyte (82) and Cebu (50), followed by Capiz (9) and Bohol (9), and some news organizations had made similar descriptions. According to the Guardian newspaper, the latest official update on the relief effort on Friday morning said only 30 towns in Leyte province, which was severely damaged by the typhoon, had received supplies (Branigan 2013).
Using Twitter to study the demand for disaster relief supplies, the resulting demand distribution reflects the gap of the different types of demand in different regions of the Philippines when dealing with a typhoon. The analysis results can be used to guide the distribution of relief supplies and provide references for medical assistance.
Furthermore, Figure 6 shows the development of four main topics related to Typhoon Haiyan. On November 5, early warning signals were issued in various regions,
Figure 4. Post-disaster demand distribution map of Typhoon Haiyan. The pie chart represents the proportion of different relief supplies demands, and the color and border of the province reflect the total demand for relief supplies.
14 T. ZHANG ET AL.

and related tweets began to appear. On November 8, Typhoon Haiyan landed, the total number of tweets reached its peak, but there were relatively few Demand-related tweets. From the third day after the disaster, the number of Demand-related tweets has increased significantly, which is more suitable for analyzing the distribution of relief supplies.
7. Discussion
In this article, we proposed a framework that can identify not only the type and quantity of demand for relief supplies but also their spatial distribution. Compared with previous work (Murakami and Nasukawa 2012, Khare et al. 2020), the proposed framework is complete from social media data collection and processing, topic extraction, demand identification, geocoding to spatial distribution visualization.
Figure 5. Ranking of demand words across the different regions. Regions with no demand are not shown.
INTERNATIONAL JOURNAL OF GEOGRAPHICAL INFORMATION SCIENCE 15

Our results confirm the capability of social media to provide valuable insights for disaster management. Although many previous works more or less stressed the potential of social media data for enhancing disaster management, few previous studies focus on this specific target (Alexander 2014, de Albuquerque et al. 2015, Andris 2016, Chiang et al. 2016). Moreover, researchers also recently noticed the potential of social media on predicting or determining people’s demands after disasters (Schempp et al. 2019, Nguyen et al. 2019). However, the perspective and thinking of our research are different. First, their works used pre-defined relief supply information as a referencing source for the model or framework to extract the corresponding information of people’s demand for the relief supplies from social media data. Conversely, our framework directly retrieves and mines the information of people’s demand for the relief supplies. Second, we utilize the topic model to build a more precise and effective dictionary to identify demand informa-tion instead of keyword-based methods. This dictionary is dynamic, domain knowledge independent, and adaptive to various situations.
The performance evaluation of the BTM model’s classification results shows the accu-racy of our framework and indicates that BTM is a suitable method for the proposed framework. In our research, the total accuracy of this model (0.68) and the tweets related to demand (0.64) are both higher than those of the LDA model (0.51 and 0.54, respec-tively, see Table S1). When analyzing social media data, many factors influence the choice of classification method. As Imran et al. (2015) said, unsupervised methods are appro-priate when the cost of obtaining training examples is high, or when information classes are completely unknown. If there is a high-quality corpus, the result of supervised classification will be better. Therefore, the appropriate classification method needs to be selected according to the actual situation.
Also, removing high-frequency words and low-frequency words improves model performance. Since the data are highly related to Typhoon Haiyan, high-frequency words such as ‘typhoon,’ ‘victim,’ ‘donat,’ ‘Yolanda,’ and ‘philippin’ represent obstacles to the recognition of fine-grained disaster topics and will mask important information.
Figure 6. Daily changes in tweets on different topics related to Typhoon Haiyan in November 2013. The vertical line is the dividing line in different periods of the disaster.
16 T. ZHANG ET AL.

Low-frequency words such as ‘wines,’ ‘patch,’ ‘tine,’ and ‘volumes’ appear only once in the tweet; they may not represent disaster-related topics and add noise to the model. Consequently, the resultant tweet dataset can help us to avoid missing important infor-mation as much as possible.
The construction of the demand dictionary is an innovation of our framework. We establish a demand dictionary and expand demand words with high-frequency demand word-pairs, so that the dictionary can also contain some words that indirectly reflect demand. We also use synonyms and local languages to expand, making the demand dictionary more complete. These improve the demand recognition ability of the framework.
Our framework can be applied to different regions, but attention should be paid to the impact of local language usage. The ‘Other’ topic contains many Filipino stop words, such as ‘ang,’ ‘mag,’ and ‘ng.’ without practical meaning. Therefore, understanding the local language usage is beneficial to data processing, it can effectively reduce noise data and improve the ability to identify the topic model. If the effect of translation into English is improved, or the influence of local language usage on data processing is considered, the reliability may be improved. In addition, since social media language will continuously be updated, a corpus also needs to be updated, which may affect some unsupervised classification methods. In developing countries, it may be more difficult to update the corpus, and the topic model needs to be regenerated, so relevant researchers need to do corresponding work.
Notably, the timeliness of the proposed is limited by social media responding time to disasters. This response is influenced by the speed and content of personal feedback to disasters and the state of communication. In addition, the framework is also affected by the speed of data collection. Since research requires large amounts of data, it takes some time to collect, and the framework has a certain lag.
Our research is also affected by the selection of time scales and spatial units. This paper analyses the demand for DRS in different provinces of the Philippines. However, when relief supplies are distributed, they are usually distributed to smaller communities rather than the province. This problem can be solved by establishing a smaller unit of gazetteer according to the actual situation. Similarly, in terms of time scale, an appropriate time window can also be selected according to the actual situation and research needs.
8. Conclusion
This paper proposes a topic model based framework that directly obtains demand and location information using social media data. Specifically, taking Typhoon Haiyan and Twitter as a case study, we use the BTM to find the topics that are related to demand from tweets and then extract the demand information and location information from tweets. Several the top topics are not actionable, so we optimize the results by processing the text, adjusting the model and other methods. The results show that the BTM is more suitable for short text classification, with a 0.64 demand topic classification accuracy and a 0.76 recall. The framework’s experimental demand distribution for Typhoon Haiyan is consistent with the actual demand distribution. This finding confirms that the proposed framework is feasible for identifying the demands for relief supplies from massive and unstructured social media data. Moreover, the framework in this paper is based on the
INTERNATIONAL JOURNAL OF GEOGRAPHICAL INFORMATION SCIENCE 17

actual demand of people in disaster areas, does not require the accumulation of a large amount of historical data, and is not affected by disaster types.
The proposed framework can be applied to other natural disasters, such as floods, droughts, and earthquakes, and emergency management situations, including civil emer-gencies and social assistance. This work provides a feasible method for GIS researchers and end-users via integrating social media content analysis and geocoding.
The proposed framework can be improved by expanding the demand dictionary by incorporating additional resources, such as news reports, government alerts, Red Cross aid directories, and expert experience. The processing and use of multilingual and social media languages in the framework are also worth exploring. Additionally, the temporal character-istics of demand can be taken into account when identifying the demand changes.
Disclosure statement
No potential conflict of interest was reported by the author(s).
Funding
This work was supported by the National Natural Science Foundation of China [Grant No. 41771537]; Fundamental Research Funds for the Central Universities [Grant No. 2019NTST01]; National Key Research and Development Plan of China [Grant No.2019YFA0606901].
Notes on contributors
Ting Zhang is a master student at the Center for Geodata and Analysis, Beijing Normal University, majoring in cartography and geographic information systems. Her fields of interest are natural disasters, social media data analysis and spatio-temporal statistical analysis.
Shen Shi, PhD, lecturer, works at the Center for Geodata and Analysis, Faculty of Geographical Science, Beijing Normal University. His fields of interest are spatio-temporal statistical analysis, geographical information science, geography complexity, and human-earth coupled model.
Changxiu Cheng is a Professor at the Center for Geodata and Analysis, Beijing Normal University, 100875, Beijing, China. E-mail: [email protected]. Her research interest focus on the study of spatial and temporal differentiations of natural disasters and land use change, and the analysis of big geographical data etc.
Kai Su is a master of Beijing Normal University, majoring in cartography and geographic information systems. His fields of interest are natural disasters and public data analysis.
Xiangxue Zhang is a PhD student, majors in cartography and geographic information systems at the Center for Geodata and Analysis, Beijing Normal university. Her fields of interest are air pollution, natural disaster, public heailth and spatio-temporal statistical analysis.
Data and codes availability statement
The data and codes that support the findings of this study are available in [figshare.com] with the identifier(s) [https://doi.org/10.6084/m9.figshare.11352590.v3]. Complete Twitter data for Typhoon Haiyan cannot be made publicly available to protect research participant privacy and consent, but sample data are provided for experiments.
18 T. ZHANG ET AL.

References
Abrahams, J., 2001. Disaster management in Australia: the national emergency management system. Emergency Medicine, 13 (2), 165–173. doi:10.1046/j.1442-2026.2001.00205.x
Alexander, E.D., 2014. Social media in disaster risk reduction and crisis management. Science and Engineering Ethics, 20 (3), 717–733. doi:10.1007/s11948-013-9502-z
ALNAP. 2008. Guidelines for assessment in emergencies. In: I. a. I. F. o. R. C. a. R. C. eds. Societies. International Federation of Red Cross & Red Crescent Societies. Switzerland, 11–13.
Ancheta, J.R., et al., Computer-assisted thematic analysis of Typhoon Fung-Wong tweets. TENCON 2017–2017 IEEE Region 10 Conference, 5–8 November 2017 Penang, 723–726.
Andris, C., 2016. Integrating social network data into GISystems. International Journal of Geographical Information Science, 30 (10), 2009–2031.
Bacmeister, J.T., et al. 2018. Projected changes in tropical cyclone activity under future warming scenarios using a high-resolution climate model. Climatic Change, 146 (3), 547–560. doi:10.1007/ s10584-016-1750-x
Balcik, B. and Beamon, B.M., 2008. Facility location in humanitarian relief. International Journal of Logistics Research and Applications, 11 (2), 101–121. doi:10.1080/13675560701561789
Bame, S.I., et al. 2012. Monitoring unmet needs: using 2–1-1 during natural disasters. American Journal of Preventive Medicine, 43 (6 Suppl 5), S435–442. doi:10.1016/j.amepre.2012.09.002
Basu, S., Roy, S., and DasBit, S., 2019. A post-disaster demand forecasting system using principal component regression analysis and case-based reasoning over smartphone-based DTN. IEEE Transactions on Engineering Management, 66 (2), 224–239. doi:10.1109/TEM.2018.2794146
Blei, D.M., et al. 2003. Latent dirichlet allocation. Journal of Machine Learning Research, 3, 993–1022.Branigan, T., 2013. Typhoon Haiyan survivors lack food and water one week on [online]. The Guardian.
Available from: https://www.theguardian.com/world/2013/nov/15/typhoon-haiyan-survivors- food-water.
Cavdur, F., Kose-Kucuk, M., and Sebatli, A., 2016. Allocation of temporary disaster response facilities under demand uncertainty: an earthquake case study. International Journal of Disaster Risk Reduction, 19, 159–166. doi:10.1016/j.ijdrr.2016.08.009
Cervone, G., et al. 2016. Using Twitter for tasking remote-sensing data collection and damage assessment: 2013 Boulder flood case study. International Journal of Remote Sensing, 37 (1), 100–124. doi:10.1080/01431161.2015.1117684
Chen, F. and Meng, Z., 2019. Topic discovery in microblog based on BTM and weighting K-means. Journal of Guangxi Normal University(Natural Science Edition), 7 (3), 71–78.
Chen, Q., Yao, L., and Yang, J., Short text classification based on LDA topic model. International Conference on Audio, Language and Image Processing (ICALIP), 11–12 July 2016 Shanghai, 749–753.
Cheng, C., et al. 2019. Assessing the intensity of the population affected by a complex natural disaster using social media data. ISPRS International Journal of Geo-Information, 8 (8), 358. doi:10.3390/ijgi8080358
Chiang, A.L., Vartabedian, B., and Spiegel, B., 2016. Harnessing the hashtag: a standard approach to GI dialogue on social media. American Journal of Gastroenterology, 111 (8), 1082–1084. doi:10.1038/ ajg.2016.259
CNIS, 2020. Classification and code of emergency supplies(GB/T 38565–2020).Dabner, N., 2012. ‘Breaking Ground’ in the use of social media: A case study of a university earth-
quake response to inform educational design with Facebook. The Internet and Higher Education, 15 (1), 69–78. doi:10.1016/j.iheduc.2011.06.001
de Albuquerque, J.P., et al. 2015. A geographic approach for combining social media and authoritative data towards identifying useful information for disaster management. International Journal of Geographical Information Science, 29 (4), 667–689. doi:10.1080/ 13658816.2014.996567
Dredze, M., et al., 2013. Carmen: a twitter geolocation system with applications to public health. Workshops at the Twenty-Seventh AAAI Conference on Artificial Intelligence,Washington.
INTERNATIONAL JOURNAL OF GEOGRAPHICAL INFORMATION SCIENCE 19

Fohringer, J., et al., 2015. Social media as an information source for rapid flood inundation mapping. Natural Hazards and Earth System Sciences Discussions, 3, 4231–4264. doi:10.5194/nhessd-3-4231- 2015
Gao, H., Barbier, G., and Goolsby, R., 2011. Harnessing the crowdsourcing power of social media for disaster relief. IEEE Intelligent Systems, 26 (3), 10–14. doi:10.1109/MIS.2011.52
Geman, S. and Geman, D., 1993. Stochastic relaxation, Gibbs distributions and the Bayesian restora-tion of images*. Journal of Applied Statistics, 20 (5–6), 25–62. doi:10.1080/02664769300000058
Goodchild, M.F., 2007. Citizens as sensors: the world of volunteered geography. GeoJournal, 69 (4), 211–221. doi:10.1007/s10708-007-9111-y
Gorro, K., et al., Qualitative data analysis of disaster risk reduction suggestions assisted by topic modeling and word2vec. ed. 2017 International Conference on Asian Language Processing (IALP), 5–7 December 2017 Singapore, 293–297.
Hjorth, L. and Kim, K.-H.Y., 2011. The mourning after: acase study of social media in the 3.11 earthquake disaster in Japan. Television & New Media, 12 (6), 552–559. doi:10.1177/1527476411418351
Hofmann, T., 1999. Probabilistic latent semantic analysis. Proceedings of the Fifteenth conference on Uncertainty in artificial intelligence. Stockholm, Sweden: Morgan Kaufmann Publishers Inc., 289–296.
Holguín-Veras, J., et al. 2013. On the appropriate objective function for post-disaster humanitarian logistics models. Journal of Operations Management, 31 (5), 262–280. doi:10.1016/j.jom.2013.06.002
Hong, L. and Davison, B.D., 2010. Empirical study of topic modeling in Twitter. Proceedings of the First Workshop on Social Media Analytics. Washington D.C., District of Columbia: ACM, 80–88.
Huang, Q. and Wong, D.W.S., 2016. Activity patterns, socioeconomic status and urban spatial structure: what can social media data tell us? International Journal of Geographical Information Science, 30 (9), 1873–1898. doi:10.1080/13658816.2016.1145225
Huang, Q. and Xiao, Y., 2015. Geographic situational awareness: mining tweets for disaster pre-paredness, emergency response, impact, and recovery. ISPRS International Journal of Geo- Information, 4, 3. doi:10.3390/ijgi4031549
Imran, M., et al., 2014. AIDR: artificial intelligence for disaster response. Proceedings of the 23rd International Conference on World Wide Web. Seoul, Korea: ACM, 159–162.
Imran, M., et al. 2015. Processing social media messages in mass emergency: a survey. ACM Computing Surveys, 47 (4), 1–38. doi:10.1145/2771588
Kamel Boulos, M.N., et al. 2011. Crowdsourcing, citizen sensing and sensor web technologies for public and environmental health surveillance and crisis management: trends, OGC standards and application examples. International Journal of Health Geographics, 10 (1), 67. doi:10.1186/1476- 072X-10-67
Kent, J.D. and Capello, H.T., 2013. Spatial patterns and demographic indicators of effective social media content during theHorsethief Canyon fire of 2012. Cartography and Geographic Information Science, 40 (2), 78–89. doi:10.1080/15230406.2013.776727
Khare, A., He, Q., and Batta, R., 2020. Predicting gasoline shortage during disasters using social media. OR Spectrum:Quantitative Approaches in Management, 42(3), 693–726 doi:10.1007/ s00291-019-00559-8
Kireyev, K., Palen, L., and Anderson, K., Applications of topics models to analysis of disaster-related twitter data. NIPS workshop on applications for topic models: text and beyond, 2019 Canada: Whistler. ed.
Knapp, K.R., et al., 2018. International best track archive for climate stewardship (IBTrACS) project. 4th ed. Asheville: NOAA National Centers for Environmental Information.
Knutson, T.R., et al. 2010. Tropical cyclones and climate change. Nature Geoscience, 3 (3), 157–163. doi:10.1038/ngeo779
Kryvasheyeu, Y., et al., 2016. Rapid assessment of disaster damage using social media activity. Science Advances, 2, 3. doi:10.1126/sciadv.1500779
Lachlan, K.A., Spence, P.R., and Lin, X., 2014. Expressions of risk awareness and concern through Twitter: on the utility of using the medium as an indication of audience needs. Computers in Human Behavior, 35, 554–559. doi:10.1016/j.chb.2014.02.029
20 T. ZHANG ET AL.

Liang, C., et al., 2018. Assessing the effectiveness of social media data in mapping the distribution of typhoon disasters. Journal of Geo-information Science, 20 (6), 806–816.
Ligutom, C., et al., Using topic modelling to make sense of typhoon-related tweets. 2016 International Conference on Asian Language Processing (IALP), 21–23 November 2016 Tainan, 362–365. ed.
Liu, B.F., Fraustino, J.D., and Jin, Y., 2015. Social media use during disasters: how information form and source influence intended behavioral responses. Communication Research, 43 (5), 626–646. doi:10.1177/0093650214565917
Liu, W., Hu, G., and Li, J., 2012. Emergency resources demand prediction using case-based reasoning. Safety Science, 50 (3), 530–534. doi:10.1016/j.ssci.2011.11.007
Mark, L. and Irina, S., 2011. Emergency management, twitter, and social media evangelism. International Journal of Information Systems for Crisis Response and Management (IJISCRAM), 3 (4), 1–16. doi:10.4018/jiscrm.2011100101
Mendoza, M., Poblete, B., and Castillo, C., 2010. Twitter under crisis: can we trust what we RT? Proceedings of the First Workshop on Social Media Analytics. Washington D.C., District of Columbia: ACM, 71–79.
Mimura, N., et al. 2011. Damage from the great East Japan earthquake and Tsunami - A quick report. Mitigation and Adaptation Strategies for Global Change, 16 (7), 803–818. doi:10.1007/s11027-011- 9297-7
Murakami, A. and Nasukawa, T., 2012. Tweeting about the tsunami?: mining twitter for information on the tohoku earthquake and tsunami. Proceedings of the 21st International Conference on World Wide Web. 2012 Lyon, France, 709–710.
Murzintcev, N. and Cheng, C., 2017. Disaster hashtags in social media. ISPRS International Journal of Geo-Information, 6 (7), 204. doi:10.3390/ijgi6070204
Nazer, T.H., et al. 2017. Intelligent disaster response via social media analysis a survey. ACM SIGKDD Explorations Newsletter, 19 (1), 46–59. doi:10.1145/3137597.3137602
NDRRMC, 2014. Final report effects of Typhoon Yolanda (Haiyan). National Disaster Risk Reduction and Management Council Quezon City.Philippines.
Neal, M.D., 1997. Reconsidering the phases of disasters. International Journal of Mass Emergencies and Disasters, 15 (2), 239–264.
Nguyen, L., et al., 2019. Forecasting people’s needs in hurricane events from social network. IEEE Transactions on Big Data, 1. doi:10.1109/TBDATA.2019.2941887
Olteanu, A., et al., 2014. CrisisLex: a Lexicon for collecting and filtering microblogged communica-tions in crises. International AAAI Conference on Web and Social Media. North America: Ann Arbor, 376–385.
Paul, M.J., Dredze, M., and Broniatowski, D., 2014. Twitter improves influenza forecasting. PLoS Currents [online], 6.
Purohit, H., et al., 2014. Emergency-relief coordination on social media: automatically matching resource requests and offers. First Monday, 19 (1).
Resch, B., Usländer, F., and Havas, C., 2018. Combining machine-learning topic models and spatio-temporal analysis of social media data for disaster footprint and damage assessment. Cartography and Geographic Information Science, 45 (4), 362–376. doi:10.1080/15230406.2017.1356242
Robinson, B., Power, R., and Cameron, M., A sensitive Twitter earthquake detector. Proceedings of the 22nd International Conference on World Wide Web, 2013 New York: ACM, 999–1002. ed.
Rosen-Zvi, M., et al. 2010. Learning author-topic models from text corpora. ACM Transactions on Information Systems, 28 (1), 1–38. doi:10.1145/1658377.1658381
Ruan, J., et al., 2015. Relief supplies allocation and optimization by interval and fuzzy number approaches. Information Sciences, 303, 15–32. doi:10.1016/j.ins.2015.01.002
Schempp, T., et al., 2019. A framework to integrate social media and authoritative data for disaster relief detection and distribution optimization. International Journal of Disaster Risk Reduction, 39, 101143. doi:10.1016/j.ijdrr.2019.101143
Shen, S., et al. 2017. Information retrieval of a disaster event from cross-platform social media. Information Discovery and Delivery, 45 (4), 220–226. doi:10.1108/IDD-01-2017-0003
INTERNATIONAL JOURNAL OF GEOGRAPHICAL INFORMATION SCIENCE 21

Sheu, J.-B., 2007. An emergency logistics distribution approach for quick response to urgent relief demand in disasters. Transportation Research Part E: Logistics and Transportation Review, 43 (6), 687–709. doi:10.1016/j.tre.2006.04.004
Sheu, J.-B., 2010. Dynamic relief-demand management for emergency logistics operations under large-scale disasters. Transportation Research Part E: Logistics and Transportation Review, 46 (1), 1–17. doi:10.1016/j.tre.2009.07.005
Steiger, E., de Albuquerque, J.P., and Zipf, A., 2015. An advanced systematic literature review on spatiotemporal analyses of twitter data. Transactions in GIS, 19 (6), 809–834. doi:10.1111/ tgis.12132
Stowe, K., et al., Identifying and categorizing disaster-related tweets. ed. Proceedings of The Fourth International Workshop on Natural Language Processing for Social Media, November 2016 Austin, TX, USA, 1–6.
Teh, Y.W., et al. 2006. Hierarchical dirichlet processes. Journal of the American Statistical Association, 101 (476), 1566–1581. doi:10.1198/016214506000000302
Vieweg, S., et al., Microblogging during two natural hazards events: what twitter may contribute to situational awareness. Proceedings of the ACM conference on Computer Human Interaction-CHI, 2010 Atlanta, 1079–1088.
Wang, Y., et al. 2016b. Using social media for emergency response and Urban sustainability: a case study of the 2012 Beijing rainstorm. Sustainability, 8 (1), 25. doi:10.3390/su8010025
Wang, Y.-S., et al., 2016a. Dynamic demand forecasting method of emergency supplies based on CBR. Journal of Logistical Engineering University, 32 (6), 8–21.
Wang, Z. 2013. A genetic algorithm-based grey method for forecasting food demand after snow disasters: an empirical study. Natural Hazards: Journal of the International Society for the Prevention and Mitigation of Natural Hazards, 68(2), 675–686. doi:10.1007/s11069-013-0644-8
Wang, Z. and Ye, X., 2018. Social media analytics for natural disaster management. International Journal of Geographical Information Science, 32 (1), 49–72. doi:10.1080/13658816.2017.1367003
Weng, J., et al., Twitterrank: finding topic-sensitive influential twitterers. Proceedings of the Third ACM International Conference on Web Search & Data Mining, 2010 New York, 261–270. ed.
Xu, X., Qi, Y., and Hua, Z., 2010. Forecasting demand of commodities after natural disasters. Expert Systems with Applications, 37 (6), 4313–4317. doi:10.1016/j.eswa.2009.11.069
Yan, X., et al., 2013. A biterm topic model for short texts. Proceedings of the 22nd international conference on World Wide Web - WWW ‘13, 2013 Rio de Janeiro, 1445–1456.
Yates, D. and Paquette, S., 2011. Emergency knowledge management and social media technolo-gies: A case study of the 2010 Haitian earthquake. International Journal of Information Management, 31 (1), 6–13. doi:10.1016/j.ijinfomgt.2010.10.001
Zhang, H. and Xu, J., 2010. Research on emergency material demand forecasting model in disaster based on MLR-CBR. Iclem 2010 Chengdu, 2885–2891.
22 T. ZHANG ET AL.