Embed Size (px)
DESCRIPTION
A Toolkit for User Engagement. AMS Annual Meeting. Kevin Werner, CBRFC Kristen Averyt , WWA Gigi Owen, CLIMAS January 27, 2011. Outline. Motivation and Background Grand Junction workshop Results. Background: NOAA River Forecast Centers. River Forecasts - PowerPoint PPT Presentation
Citation preview

A Toolkit for User Engagement
Kevin Werner, CBRFC
Kristen Averyt, WWA
Gigi Owen, CLIMAS
January 27, 2011
AMS Annual Meeting

Outline
Motivation and Background
Grand Junction workshop
Results

3
Background: NOAA River Forecast Centers
• River Forecasts• Support flood warnings (hours to days)• Support water management (days to
months/years)• Support flash flood warnings (hours)
• Decision Support• NOAA mission: “to understand and
predict changes in Earth’s environment … to meet our Nation’s economic, social, and environmental needs”
• New focus for RFCs with the Service Coordination Hydrologist program (2008)

Motivation
Photo: Lake Powell, January 2010
Forecasts:-Weather-Climate-Water
Water Management: agencies responsible for delivering, allocating, or treating fresh water. Examples:-USBR-Metropolitan Water District-Colorado River Commission

Previous Research
Forecasts generally not used. Water management agencies value reliability and quality above all else. Unless those are threatened, agencies have little incentive to use forecasts.
Forecast use correlates with perceived risk. Forecast usage not dependent on agency size or on understanding of forecast skill and reliability.
Policy and infrastructure in USA limit use of forecasts. Many operating decisions are tied to observed data and do not allow flexibility.
Hopeless?No! Long term drought, increasing demands, and climate change projections for less water each present opportunities for increasing forecast usage.
5
Study Method(s) Geographic Area(s)
(Rayner et al., 2005) Field Research: Semi-structured Interviews
USA: Pacific Northwest, Southern California, and Washington, DC
(O'Connor et al., 2005) Survey USA: South Carolina and Susquehanna River Basin of Pennsylvania
(Lemos, 2008) Field Research: Observation of Meetings
USA and Brazil
(Dow et al., 2007) Survey (building on earlier work (O'Connor et al., 2005))
USA: South Carolina and Susquehanna River Basin of Pennsylvania
(Callahan & Miles, 1999) Field Research: Semi-structured interviews
USA: Pacific Northwest
(Ziervogel et al., 2010) Case Study South Africa
(Pulwarty & Redmond, 1997)
Field Research: Semi-structured interviews
USA: Pacific Northwest

Colorado River Supply and DemandColorado River Supply and Demand
Credit: USBR


Strategy: Integrated and Iterative
START
INFORMATION PROVIDERS
(RFCS)
PRODUCT DEVELOPE
RS
RESEARCH & SCIENCE
WORKSHOPS
EDUCATION
INFORMATION PROVIDERS
(RFCS)
Users + ExistingInformation
Better Climate and Water Information
More Informed Stakeholders
Climate and Water Forecast and Information Machine

9
Methods
• Improving Forecasts and Information• Implementing new modeling software• Enhancing ensemble forecast capabilities• Web tool development• Evapotranspiration• Distributed modeling• Etc.
• Connecting with Stakeholders• Annual stakeholder forum• Monthly water supply and peak flow forecast webinars • Forecast verification workshop• Soil moisture workshop• User engagement workshop and toolset

Workshops to date
• Climate Literacy and Information Use Survey
• (Pre- and Post-Workshop)
• Computer-based usability evaluation
• Scenario Exercises
• Used to evaluate how the tool might be used & what information people use to make decisions
April 23, 2010: Grand Junction, CO
30 outside stakeholders with interests in water
May 2010: NWS SAFER Workshop
40 mostly NWS meteorologists
January 2011: AMS Short Course
30 outside stakeholders
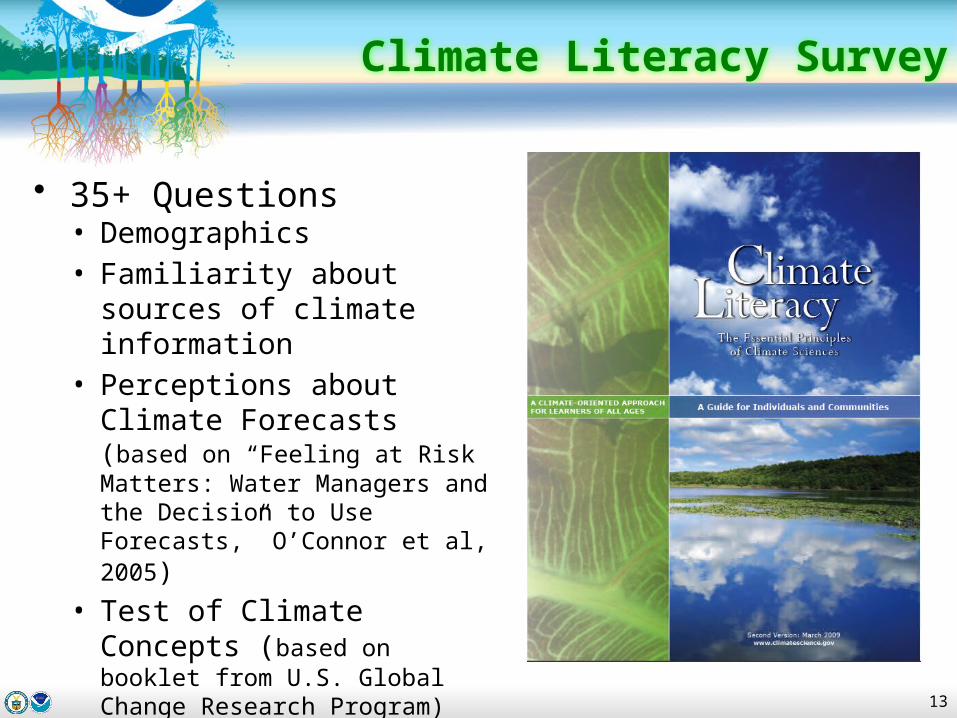
Climate Literacy Survey
• 35+ Questions• Demographics• Familiarity about sources
of climate information• Perceptions about Climate
Forecasts (based on “Feeling at Risk Matters: Water Managers and the Decision to Use Forecasts,” O’Connor et al, 2005)
• Test of Climate Concepts (based on booklet from U.S. Global Change Research Program)
13

Survey Results
1 2 3 4 50
0.1
0.2
0.3
0.4
0.5
0.6
0.7
Confidence in temperature and precipitation forecasts for next 3 months
SAFER WorkshopGrand Junction Workshop
Confidence (low to high)
Resp
on
ses
1 2 3 4 5
0
0.1
0.2
0.3
0.4
0.5
0.6
0.7
Confidence in seasonal streamflow and water supply forecasts for spring runoff period
SAFER WorkshopGrand Junction Workshop
Confidence (low to high)
Resp
on
ses

Survey Results

Survey Results
Which of the following has had the least influence on large-scale global climate over the last 30 years?

Usability Survey
• 37+ Questions• Complete a series of tasks using all different
aspects of the Water Resources Outlook• Feedback on how to improve the tool
• How it looks and ease of use• Practical applications to different lines of work
• “What additional climate information do you need to make a well-informed decision or plan?”
• “What level of skill would make a forecast good enough? How would you know?”
17

Scenarios
18
• Simulate decision making based on forecasts• Decision making using
probabilistic forecasts• Participants given a single
forecast and asked to make a single decision
• Participants given a series of forecasts and asked to make decisions from each
•
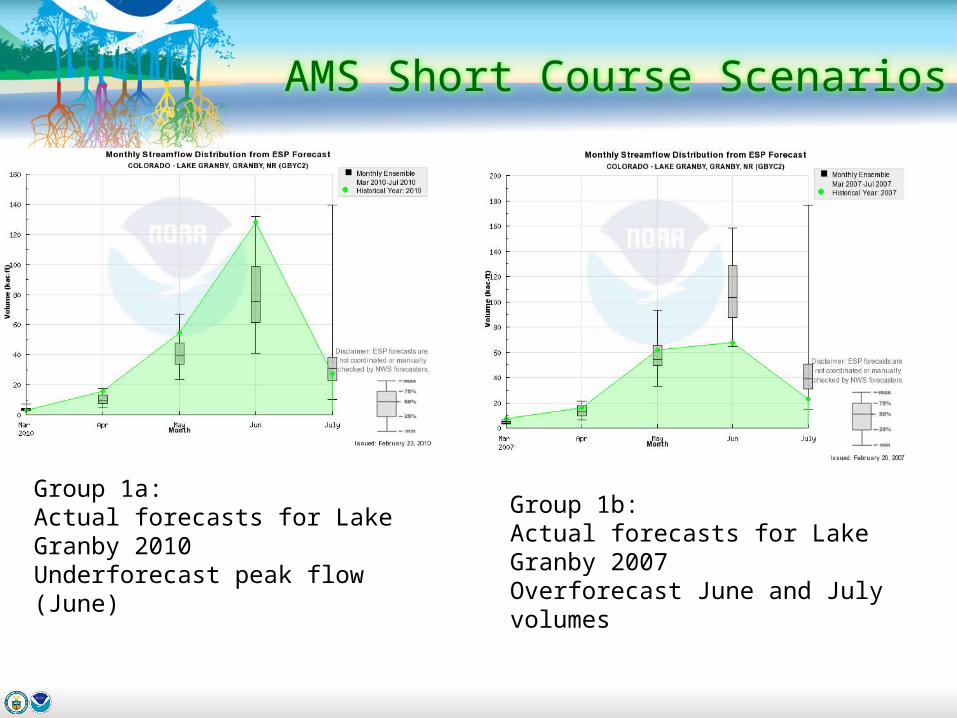
AMS Short Course Scenarios
Group 1a: Actual forecasts for Lake Granby 2010Underforecast peak flow (June)
Group 1b: Actual forecasts for Lake Granby 2007Overforecast June and July volumes

AMS Short Course Scenario Results
20
March April May June July August350
370
390
410
430
450
470
490
Months
March April May June July August400
420
440
460
480
500
520
540
Underforecast scenario
9 of 11 overtopped reservoir
Participant who drew down reservoir early was not familiar with water management or probabilistic forecasts
Overforecast scenario
No one overtopped
Participants most familiar with water management drew down reservoir early

Findings So Far
• Meteorologists more confident in weather forecasts and less confident in climate forecasts than outside stakeholders (literacy survey)
• Stakeholders typically rely on forecast agencies to tell them when forecast skill is sufficient (usability survey)
• Stakeholders interested in flooding and high flows are interested in “worst” case scenarios (scenarios)
• Water management stakeholders tend to plan to median forecast (scenarios)
• People – regardless of background – have difficulties applying probabilistic forecasts to deterministic decisions (scenarios)
21

Next Steps
• Process of creating workshops is continually evolving
• Continually tweaking the techniques used, questions asked – especially important as we talk to different populations – general public vs. more specialized users
• Learning process – we learn from our participants just as much as we hope they learn from us about using climate information
22
NEXT STEPS: Workshops in Utah (Spring and Summer), Workshop in AZ or NM (Fall),
Workshop in Southeast (TBD)
Kevin Werner
CBRFC Service Coordination HydrologistPhone: 801.524.5130
Email: [email protected]
Gigi Owen
Staff Social Scientist, Univ. of ArizonaPhone: 520.621.9001
Email: [email protected]
Kristen Averyt
Deputy Director, Western Water AssessmentPhone: 520.621.9001
Email: [email protected]