Embed Size (px)
Citation preview

A Tool for Multimedia Quality Assessment in NS3: QoE
MonitorI,II
D. Saladino∗, A. Paganelli∗, M. Casoni∗∗
Department of Information Engineering, University of Modena and Reggio Emilia, viaVignolese 905, 41125 Modena (MO), Italy
Abstract
Nowadays, with the continuous rise of Internet-based multimedia services, such
as video sharing websites, web radios and IP-based telephony, multimedia com-
munications are gaining more and more popularity.
From the service provider's perspective, there is an increasing need in pro-
viding high-quality content; at the same time, from the network provider's view,
the requirement is to design networks that can e�ectively support these services
with adequate quality-of-service (QoS). In both cases, engineers and researchers
need suitable planning tools exploitable for providing appropriate designs.
For all these reasons, we have focused our work on the design and imple-
mentation of a novel open-source tool, named QoE Monitor, which consists of
a new module for the NS-3 simulator that can be used to perform quality-of-
experience (QoE) assessments in any simulated network. The goal of this tool
is to predict the video and/or audio quality perceived by an end user through
objective metrics. Moreover, its open-source nature foster its validation and
promote knowledge sharing within the research community, while its modular-
IThe research leading to these results has received funding from the European UnionSeventh Framework Programme (FP7/2007-2013) under grant agreement n° [242411].
IIThis is the preprint, shortened version of the work that has been already submitted toElsevier �Simulation Modelling Practice and Theory� journal for possible publication.
∗Tel. +390592056323∗∗Tel. +390592056167Email addresses: [email protected] (D. Saladino),
[email protected] (A. Paganelli), [email protected] (M.Casoni)
Preprint submitted to Simulation Modelling Practice and Theory May 18, 2012
2
ity eases the implementation of additional software components to expand its
capabilities (e.g., to account for new codecs and/or new QoE metrics).
In this paper, a detailed description of this tool is done and some numerical
results about video streaming performance evaluations are presented, which
show its e�ectiveness for the QoE analysis.
Keywords: QoE evaluation, NS-3, PSNR, SSIM
1. Introduction
Since there is a continuous growth of multimedia distribution over the In-
ternet, it is increasingly necessary to guarantee the transmission of high quality
video and audio content. For instance, regarding video streaming, the qual-
ity perceived by a viewer is subjective and depends not only on image proper
features, like brightness, color, distortions, information contents, but also on
other factors that involve the human vision perception. The latter one, in
turn, is strictly related to image processing operations, like coding, compres-
sion/decompression, �ltering, transcoding, and/or the adopted display features,
like resolution, screen type, frequency, shared memory.
As video processing, and then transmission, may introduce some amounts
of distortions or artifacts in both the received video and audio contents, the
objective assessment of the quality perceived by a user, connected to a given
network, is of paramount importance. Based on this reason, our research is
focused on the implementation of a complete framework that allows researchers
and engineers to assess video and audio quality perceived by the end users, using
numerical simulation tools. In more details, our goal has been to quantify the
impact of a communication network, with a particular con�guration, and of the
employed codec on the quality of the received video and/or audio �le.
2. QoE Monitor: Architecture and Design
As already previously stated, our purpose is the evaluation of the video
quality experienced by a viewer, by adopting objective metrics based on the de-
3
NS3
Raw Video
CODEC PACKETIZER
MULTIMEDIA
APPLICATION
SENDER
MULTIMEDIA
APPLICATION
RECEIVER
Raw Video
Packet
Trace
Sender
TraceReceiver
Trace
MULTIMEDIA
FILE REBUILDER
Reconstructed
Coded Video
CODEC
Coded Video
PSNR/SSIM
Figure 1: The proposed evaluation framework.
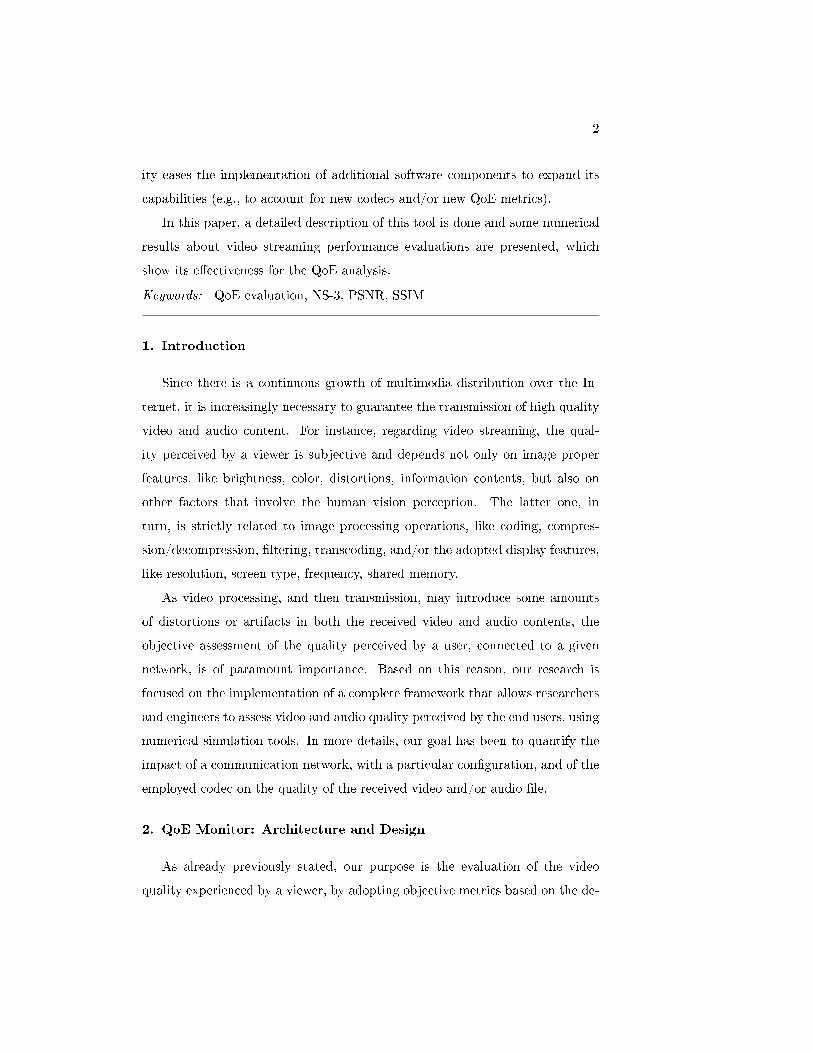
tection of the di�erences (or variations) between the original (reference) video
and the received and/or coded one. Consequently, our work consisted in de-
signing and implementing a complete framework, whose principle of operation
is reported in Figure 1, consisting of a new NS-3 module, written in C++, that
reproduces the main components and the functions of the existing EvalVid tool.
By referring to Figure 1, here we provide a brief sketch of the working prin-
ciple behind QoE Monitor. Since our �nal goal is to predict how the video
frames, transmitted through a simulated network, are perceived by a viewer, a
reference raw (i.e., uncompressed) video is coded using a particular codec (with
the adoption of Ffmpeg).
Then, the coded video �le is packetized by the Packetizer component that, in
addition to the packets, produces a packet trace containing some information like
the packet ID, its size and its timestamps. The produced packets are transmitted
through a network, simulated with NS-3, by the MultimediaApplicationSender
component. Its task is to create the Real-time Transmission Protocol (RTP)
[1] packets, to transmit them within an UDP datagram �ow and to produce a
sender trace, which contains the packet ID and its timestamp.
At the receiver side, the packets are received by the MultimediaApplication-
Receiver component, that extracts the header information of each packet and
reproduces the receiver trace, containing packet ID and timestamp.
Packet trace, sender trace and receiver trace are used by the MultimediaFil-
2.1 NS-3 QoE Monitor Classes Design 4
eRebuilder component to reconstruct the video, reporting a possibly corrupted
video �le. The quality of the reconstructed video depends on how many pack-
ets have been received and, therefore, on network parameters like packet delay,
jitter and error rate, that a�ect the QoS.
At this point, the reconstructed video is decoded, in order to obtain another
raw video �le to be displayed and played out at the receiver side. Now, the re-
ceived video can be compared to the reference one employing PSNR and SSIM
metrics (that will be described next), in order to provide a prediction of the per-
ceived video quality and thus to determine the e�ects of the video transmission
over the simulated network.
Finally, our tool allows to perform a lot of kinds of comparison, e.g., the
transmission e�ects only, the adopted codec e�ects only, or both, as presented
in Figure 1 and carried out in our numerical results, that will be presented
afterwards in Section 4.
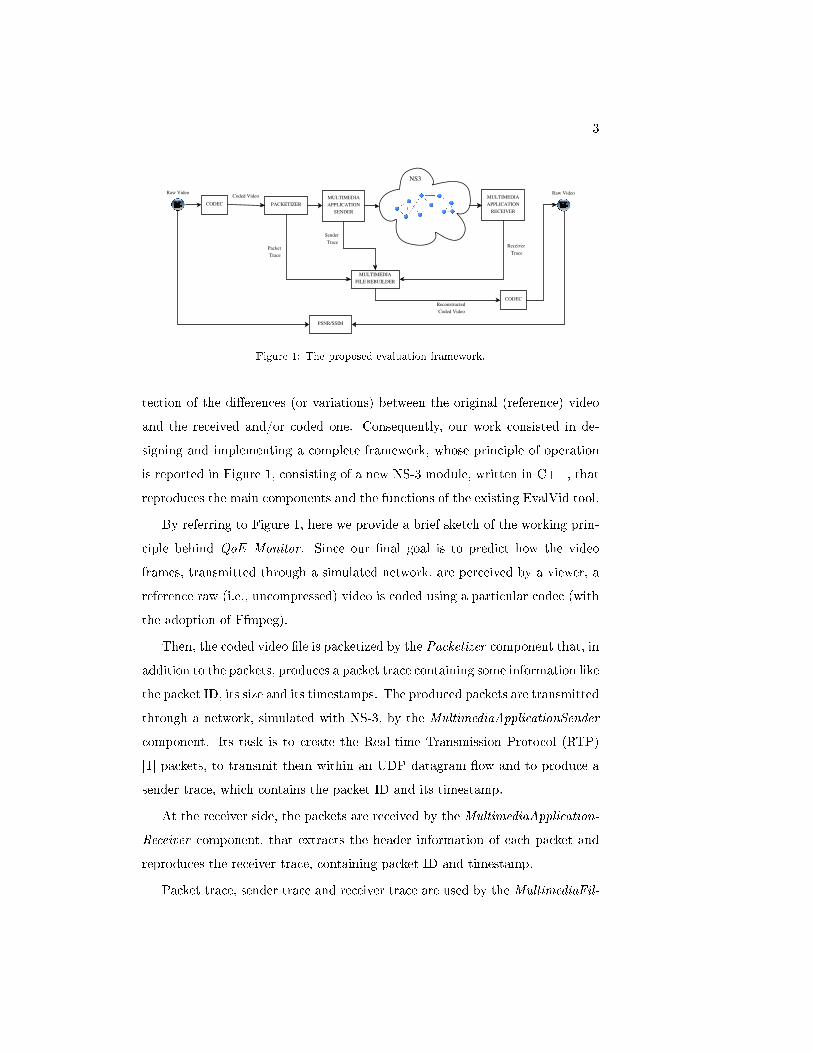
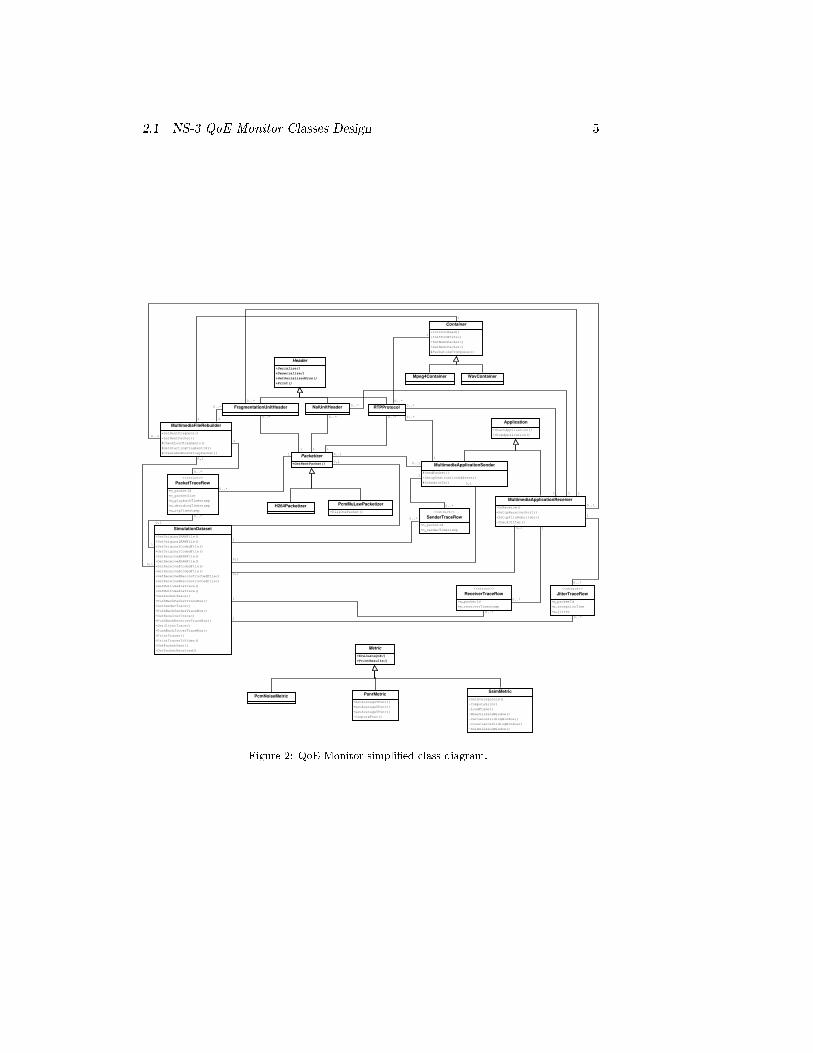
2.1. NS-3 QoE Monitor Classes Design
In this subsection, an overview of the main classes composing the proposed
NS-3 QoE Monitor is presented, with the help of an Uni�ed Modeling Language
(UML) class diagram reporting the classes developed so far and the associations
and relationships among them (Figure 2).
One of the most important classes is SimulationDataset, which includes all
the state variables required to perform the QoE evaluation process. At a glance,
it stores all the multimedia �le names required for the evaluation, together with
all the traces generated by the events related to the actual transmission, as
described before.
Since the proposed QoE Monitor module works with multimedia content,
there are several classes designed to manipulate video and audio �les. More
speci�cally, the pure virtual Container class and all the classes derived from it
(e.g., Mpeg4Container and WavContainer) are responsible for working with the
speci�c chosen �le container (e.g., Mpeg4, Wave).
The actual multimedia content transmission over a generic simulated net-
2.1 NS-3 QoE Monitor Classes Design 5
Header
+Serialize()
+Deserialize()
+GetSerializedSize()
+Print()
FragmentationUnitHeader NalUnitHeader RTPProtocol
MultimediaFileRebuilder
+SetNextFragment()
+SetNextPacket()
#CheckLostFragments()
#GetStartingFragmentId()
#CreateAndPushProxyPacket()Packetizer
+GetNextPacket()
H264Packetizer PcmMuLawPacketizer
+FillOnePacket()
<<struct>>
PacketTraceRow
+m_packetId
+m_packetSize
+m_playbackTimestamp
+m_decodingTimestamp
+m_rtpTimestamp
Container
+InitForRead()
+InitForWrite()
+SetNextPacket()
+GetNextPacket()
#PacketizeFromQueue()
Mpeg4Container WavContainer
Application
+StartApplication()
+StopApplication()
MultimediaApplicationSender
#SendPacket()
+SetupDestinationAddress()
#ScheduleTx()
MultimediaApplicationReceiver
+OnReceive()
+SetupReceiverPort()
+SetupFileRebuilder()
-CheckJitter()
<<struct>>
SenderTraceRow
+m_packetId
+m_senderTimestampSimulationDataset
+SetOriginalRAWFile()
+GetOriginalRAWFile()
+SetOriginalCodedFile()
+GetOriginalCodedFile()
+SetReceivedRAWFile()
+GetReceivedRAWFile()
+SetReceivedCodedFile()
+GetReceivedCodedFile()
+SetReceivedReconstructedFile()
+GetReceivedReconstructedFile()
+GetMultimediaTrace()
+SetMultimediaTrace()
+GetPacketTrace()
+PushBackPacketTraceRow()
+GetSenderTrace()
+PushBackSenderTraceRow()
+GetReceiverTrace()
+PushBackReceiverTraceRow()
+GetJitterTrace()
+PushBackJitterTraceRow()
+PrintTraces()
+PrintTracesToVideo()
+GetPacketSent()
+GetPacketReceived()
<<struct>>
JitterTraceRow
+m_packetId
+m_receptionTime
+m_jitter
<<struct>>
ReceiverTraceRow
+m_packetId
+m_receiverTimestamp
0..*
1
0..*
1
0..*
1
1
0..*
0..*
10..*
1
0..*
1
0..*
1
1
1
0..1
0..1
0,1
0,1
0..*
1
0..*
1
0..*
1
0,1
0,1
0..1
0..1
0..*
1
0..*
1
0,1
0,1
0..*
1
0..*1
0..*
1
0..*
1
1
0..*
Metric
+EvaluateQoE()
+PrintResults()
PcmNoiseMetric PsnrMetric
+GetAverageYPsnr()
+GetAverageUPsnr()
+GetAverageVPsnr()
-ComputePsnr()
SsimMetric
+GetAverageSsim()
-ComputeSsim()
-LoadFrame()
-MeanSlidingWindow()
-VarianceSlidingWindow()
-CovarianceSlidingWindow()
-SsimSlidingWindow()
0,1
0,1
Figure 2: QoE Monitor simpli�ed class diagram.
2.1 NS-3 QoE Monitor Classes Design 6
work is performed by the MultimediaApplicationSender class, which has been
derived from the Application class provided by the NS-3 framework. In order
to have a generic sender, exploitable with any possible codec, we have created a
pure virtual class named Packetizer, which hides the actual packetization pro-
cess to the application.
Since our goal has been to support RTP-based multimedia communications,
in the proposed NS-3 module we have implemented the most basic RTP fea-
tures through the RTPProtocol class. With this class we have simply provided
a packet header that conveys packet ID and timestamp information to the re-
ceiver1, as discussed before.
Since one among the �rst codecs we have considered in our design is H.264,
we have implemented the Network Abstraction Layer (NAL) packet header, too,
with the NALUnitHeader class, according to [2]. Moreover, because NALs could
be larger than the network's MTU, we have created an additional class, which is
exploitable to report to the receiver that the current packet is actually a single
fragment of a longer packet, according to [2]: FragmentationUnitHeader.
The most useful information about each packet produced by a packetizer is
stored in a proper packet trace provided by the SimulationDataset class. In more
details, for each �lled packet a PacketTraceRow structure is created and �lled
with the packet ID, its size, its playback timestamp, its decoding timestamp
and its RTP timestamp; �nally, the �lled row is pushed to the packet trace
structure.
Once the application has obtained a complete RTP packet from the packe-
tizer, it transmits it through the network. The information related to each sent
packet (i.e., packet ID and sending time) composes a SenderTraceRow structure,
that is pushed to the sender trace structure located within SimulationDataset.
The receiver is implemented by the MultimediaApplicationReceiver class.
Upon each packet reception, it performs a jitter estimation and check the cur-
rent packet, according to RFC 3550 [1], to assess whether it is arrived on time
1Further capabilities (e.g., RTCP and the like) have not been implemented yet.

2.2 Currently Available Metrics 7
or not. For each successfully received packet, jitter information is saved in a
JitterTraceRow structure containing the corresponding packet ID, the reception
time and the current estimated jitter value. Then, the JitterTraceRow structure
is pushed in the proper jitter trace stored within SimulationDataset.
Finally, the receiver passes each correctly received packet to a Multimedi-
aFileRebuilder, which rebuilds the transmitted �le. Please note that the rebuilt
�le could be possibly corrupted, if compared to the transmitted one, because
of possible packet losses due to the transmission and the coding process. Since
our QoE evaluation process makes use of both the received and the transmitted
�le (e.g., to compute the di�erence between the transmitted and the received
frame of a given video �le), it has been necessary to align the received �le to the
transmitted one, because the received data can be signi�cantly less than that
composing the �le at the sender side (e.g., in case of high packet loss rate). To
accomplish this, for each lost packet we have chosen to embed the corresponding
amount of dummy data to the output �le.
2.2. Currently Available Metrics
Regarding the video quality evaluation metrics, we have considered PSNR
[3] and SSIM [4], that are the most widespread QoE video objective metrics
found in the scienti�c literature. These metrics are both full reference as they
require the complete availability of the two video �les to be compared.
The class PsnrMetric, as the name suggests, has the purpose to compute the
PSNR value between a reference video and a received, and then reconstructed,
one. Its values can vary from 0 to in�nite (in this paper we have considered 99
as the maximum value): bigger values correspond to better quality.
Given each frame of both video �les, this component compares them by
simply computing the signal-to-noise ratio in order to extract the di�erences
between the two images [3]. This implies that PSNR index analyzes all the
image regions in the same way, without taking into account that each one has
di�erent visual importance. We can conclude that PSNR simply detects the
errors between two images (equally analyzing the overall pixels), without ap-

8
proximating all the real human perception features: to a low PSNR value may
subjectively correspond a high quality image.
The class SsimMetric has been implemented to compute the SSIM metric
[4] to overcome to the PSNR drawbacks described before.
SSIM quality measure [4] takes into consideration the Human Visual System
(HVS) characteristics to extract the structural information of an image (because
spatially close pixels are tightly correlated and have strong inter-dependencies)
and, in particular, to be sensitive to its variation, reproducing this feature in
order to better predict the video quality as perceived by the human eyes. It
gives values from 0 to 1: bigger values represent better quality, with values from
0.9 upwards representing a di�erence almost impossible for the human eye to
detect.
The QoE evaluation through the SSIM index is characterized by a greater
computational complexity than PSNR, because it is necessary the employment
of a sliding window ofN×N size (typicallyN = 8), which is shifted pixel by pixel
from top-left corner to the bottom-right one of each single frame. Therefore,
taken each frame of both video �les, for each N × N block, we compute the
mean value and the variance, and then the covariance between the two current
blocks (see [4] for a more accurate discussion about the mathematical details of
SSIM); then, the structural similarity index is computed.
In the end, with SSIM index we are able to quantify the loss of image struc-
tural information, that can provide a good approximation of the perceived image
distortion.
3. Reference Scenarios and Numerical Results
In this Section, two reference network scenarios are described to provide a
detailed overview of how our proposed tool works. Furthermore, numerical re-
sults showing the capabilities of the current release, are provided and discussed,
too. Finally, for each scenario, the simulation setup consists of NS-3.13, Ffmpeg
0.8.2 and libx264 [5] 0.120.2164.

3.1 Scenario 1: Video Streaming Over a Lossy Link 9
Figure 3: Network con�guration related to Scenario 1.
3.1. Scenario 1: Video Streaming Over a Lossy Link
The �rst scenario (which is available together with the source code as qoe-
monitor-example-1.cc) is composed by a simple network of two nodes con-
nected by means of a point-to-point link at 2Mbit/s, with a delay of 2ms, as
depicted in Figure 3.
The goal of this setup is to show, �rstly in a simple topology, the objective
QoE evaluation, in terms of PSNR and SSIM metrics, of an H.264-encoded video
stream through a lossy link. In our setup, we have chosen the �highway� CIF
reference video [6], encoded with H.264.
The packet-error-rate (PER) of the link can be varied at wish, depending on
the chosen video �le and on the simulation duration. More speci�cally, because
the video �le we have chosen is made up of 2000 frames and the total number of
IP packets composing the data �ow is approximately equal to 11400, the PER
value should not be less than 10−3, in order to provide meaningful statistical
results. For this reason, in our evaluations we considered two PER values,
namely PER1 = 10−3 and PER2 = 10−2.
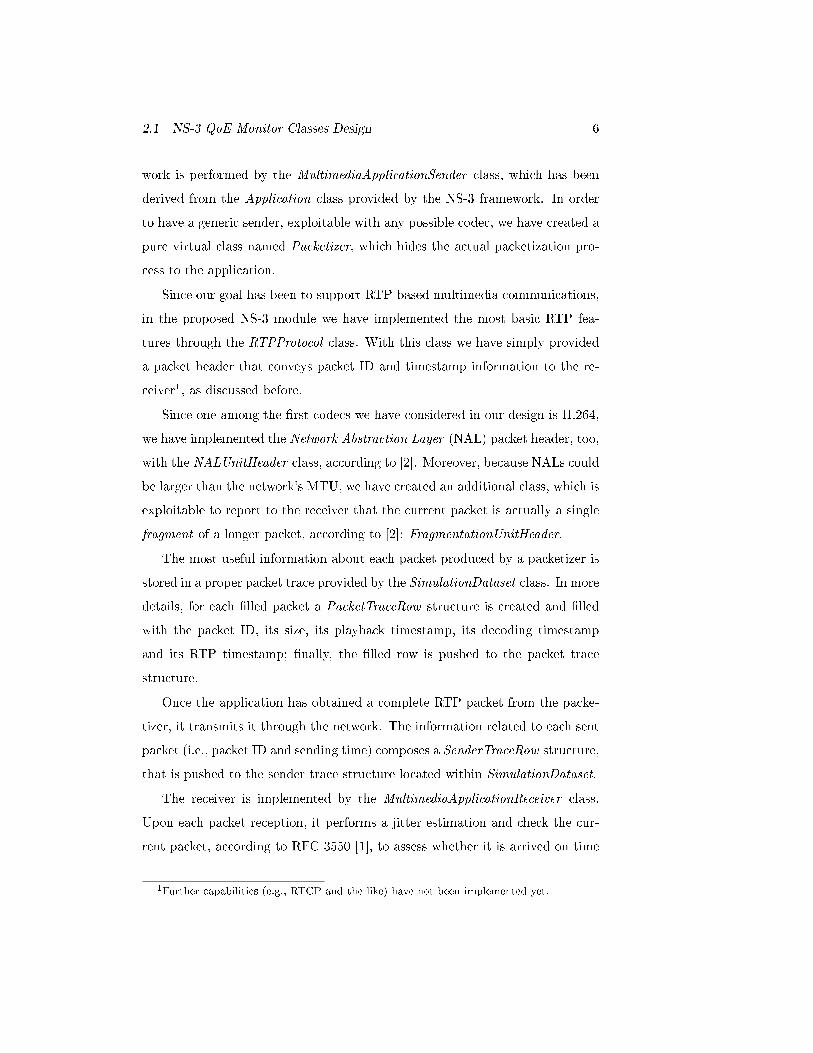
The main simulation outcomes are presented in Figure 4, case (a) for PER1
and case (b) for PER2, respectively. As can be seen, the PSNR and SSIM
pro�les are di�erent for the two cases, which clearly shows that the �rst one has
experienced far better QoE with respect to the second.
In more detail, considering again Figure 4 and taking as an example the
1000-th frame, it is possible to perceptually notice that, for the case where the
error rate is lower (i.e., PER1), the frame quality is high (almost the same of
the transmitted one, with no noticeable artifact introduced), whereas, for the
case where the error rate is higher (i.e., PER2), the image degradation evidently
3.1 Scenario 1: Video Streaming Over a Lossy Link 10
0 200 400 600 800 1000 1200 1400 1600 1800 20000
10
20
30
40
50
60
70
80
90
100
Frame number(a)
PSNR
0
0.1
0.2
0.3
0.4
0.5
0.6
0.7
0.8
0.9
1
SSIM
PSNR
SSIM
0 200 400 600 800 1000 1200 1400 1600 1800 20000
10
20
30
40
50
60
70
80
90
100
Frame number(b)
PSNR
0
0.1
0.2
0.3
0.4
0.5
0.6
0.7
0.8
0.9
1
SSIM
PSNR
SSIM
Figure 4: PSNR and SSIM - Scenario 1 for PER = 0.001 and PER = 0.01.
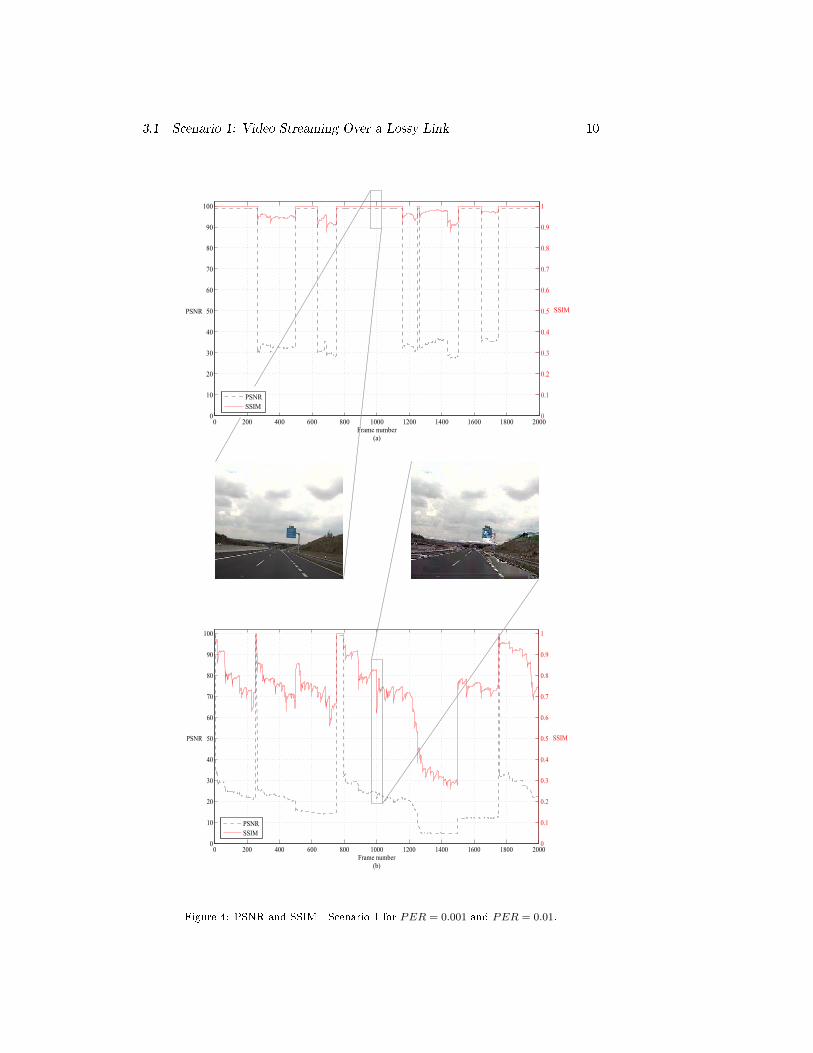
3.2 Scenario 2: Video Streaming in Presence of Cross Tra�c 11
Figure 5: Network con�guration related to Scenario 2.
grows, even if distortions remain acceptable yet.
Finally, please note that even if the PSNR graph is di�erent from the SSIM
one, both trends are quite similar, which clearly shows the positive correlation
of the two considered metrics.
3.2. Scenario 2: Video Streaming in Presence of Cross Tra�c
The second scenario (available as qoe-monitor-example-2.cc) is composed
by a more complex network, with respect to the previous one. In particular, a
butter�y topology consisting of 5 nodes has been implemented, as reported in
Figure 5. Each link is a point-to-point link at 2 Mbit/s, with 2 ms delay.
The goal of this scenario is to show how the proposed tool can be used to
keep track of the QoE variation of a given video transmission, in case of heavy
cross tra�c.
Node 0 and Node 4 are the video sender and the video receiver, respectively,
while Node 1 and Node 5 can be used to inject cross-tra�c in the network.
Again, we have considered the �highway� CIF reference video we adopted in the
previous scenario, also for this case, which translates into a data �ow of about
1.5 Mbit/s (measured at IP layer).
Here we consider only UDP-based cross tra�c for a matter of brevity, but
TCP-based �ows are possible, too.
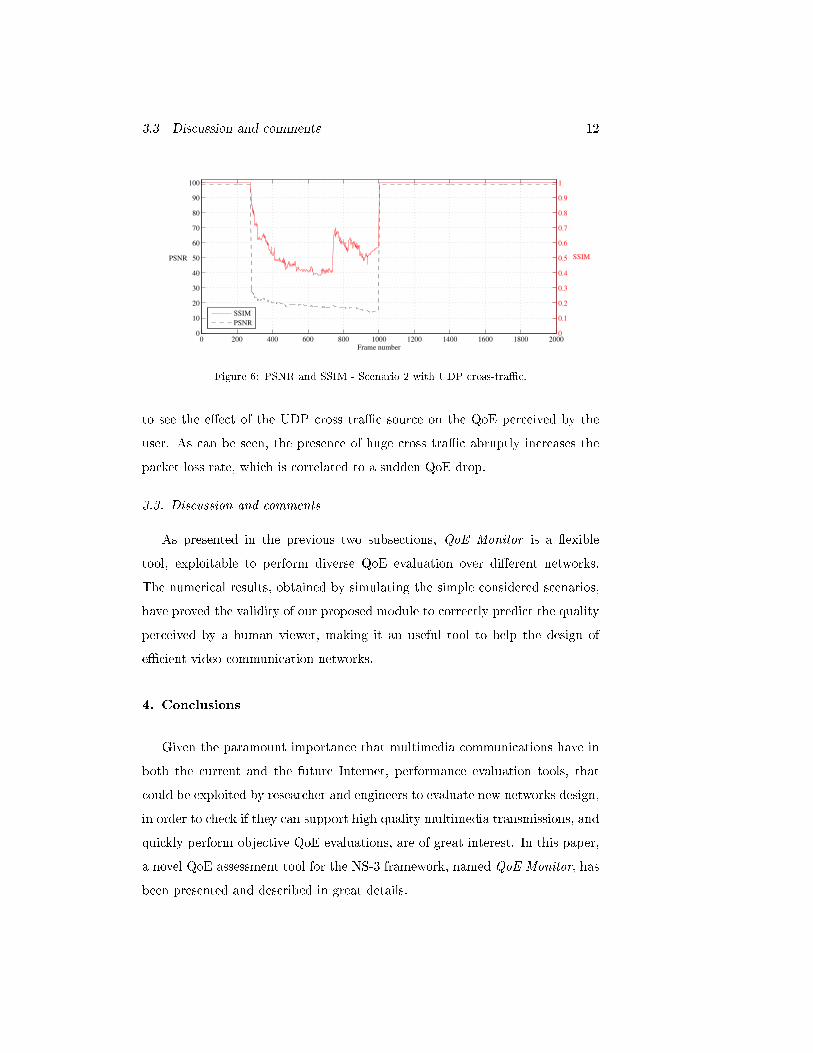
The main simulation results are presented in Figure 6, where it is possible
3.3 Discussion and comments 12
0 200 400 600 800 1000 1200 1400 1600 1800 20000
10
20
30
40
50
60
70
80
90
100
Frame number
PSNR
0
0.1
0.2
0.3
0.4
0.5
0.6
0.7
0.8
0.9
1
SSIM
SSIM
PSNR
Figure 6: PSNR and SSIM - Scenario 2 with UDP cross-tra�c.
to see the e�ect of the UDP cross tra�c source on the QoE perceived by the
user. As can be seen, the presence of huge cross tra�c abruptly increases the
packet loss rate, which is correlated to a sudden QoE drop.
3.3. Discussion and comments
As presented in the previous two subsections, QoE Monitor is a �exible
tool, exploitable to perform diverse QoE evaluation over di�erent networks.
The numerical results, obtained by simulating the simple considered scenarios,
have proved the validity of our proposed module to correctly predict the quality
perceived by a human viewer, making it an useful tool to help the design of
e�cient video communication networks.
4. Conclusions
Given the paramount importance that multimedia communications have in
both the current and the future Internet, performance evaluation tools, that
could be exploited by researcher and engineers to evaluate new networks design,
in order to check if they can support high quality multimedia transmissions, and
quickly perform objective QoE evaluations, are of great interest. In this paper,
a novel QoE assessment tool for the NS-3 framework, named QoE Monitor, has
been presented and described in great details.

13
A couple of practical reference scenarios have been presented to show how
the current version works. Up to now, our tool provides the user with a working
set of functions to assess the QoE performance of H.264-encoded transmissions
over arbitrarily networks.
The obtained numerical outcomes, presented in Section 4, have demonstrated
the validity of QoE Monitor, to provide the QoE evaluation of a video �le
coded and transmitted in two di�erent contexts, that is comparable to the real
perception of human eyes.
References
[1] H. S. et al, RTP: A transport protocol for real-time applications.
URL http://tools.ietf.org/html/rfc3550
[2] Y.-K. W. et al, RTP Payload Format for H.264 Video.
URL http://tools.ietf.org/html/rfc6184
[3] Q. Huynh-Thu, M. Ghanbari, Scope of validity of PSNR in image/video
quality assessment, Electronics letters 44 (13) (2008) 800�801.
[4] Z. Wang, A. Bovik, H. Sheikh, E. Simoncelli, Image quality assessment:
From error visibility to structural similarity, Image Processing, IEEE Trans-
actions on 13 (4) (2004) 600�612.
[5] VideoLAN organization, x264 homepage.
URL http://www.videolan.org/developers/x264.html
[6] YUV CIF reference videos - lossless H.264 encoded.
URL http://www2.tkn.tu-berlin.de/research/evalvid/cif.html