Embed Size (px)
Citation preview

A time for new ideasInnovation in Central Eastern Europe and TurkeyA white paper by the Economist Intelligence Unitsponsored by Oracle

© The Economist Intelligence Unit 2008 1
A time for new ideas Innovation in Central Eastern Europe and Turkey
A time for new ideas is an Economist Intelligence Unit report that looks at the current state and future prospects of innovation in Central Eastern Europe (CEE). The report is sponsored by Oracle. The Economist Intelligence Unit bears sole responsibility for the content of this report. Our editorial team executed the online survey, conducted the interviews, created the economic model and wrote the report. The findings and views within do not necessarily reflect the views of our sponsors.
The report is based on three main components: a worldwide survey of 370 executives carried out in Spring 2008; the Economist Intelligence Unit’s own innovation model; and 25 in-depth interviews with C-level executives, consultants and other experts in the field. In addition, we conducted an extensive programme of desk research.
Over half of the executives surveyed are based in the CEE; all operate significant business in the region; two-fifths have annual global revenues below $100m and 16% over $10bn; over half are either C-suite executives or board members and over one-quarter are CEOs or managing directors, in all representing 19 different industries. The survey element did not include firms operating in Turkey.
The report was written by Paul Lewis. The innovation model was produced by Laza Kekic; and in-depth interviews were carried out by Kester Eddy, Richard Eames, David Dyker and Bernard Kennedy; Harald Heubaum compiled the country data in part 2. We would like to thank all the executives who participated in the survey and interviews for their time and insights.
October 2008
About the research

2 © The Economist Intelligence Unit 2008
A time for new ideas Innovation in Central Eastern Europe and Turkey
Innovation has been a driving force of post-communist economic transition of central and eastern Europe (CEE) over the past two
decades. Most of this has come not from locally owned firms but from the investments of MNCs, on which local economies have come to rely for new ideas and technology. This is particularly so for the development of new products, the main focus of this research paper. Such dependence leaves the region’s economies vulnerable, and to overcome this governments, universities and local businesses will have to work together to improve the environment for innovation. Based on the Economist Intelligence Unit’s innovation model, our survey of over 370 local and foreign executives operating in the region, and in-depth interviews with company executives, academics and policymakers, the results suggest, however, that progress to date in promoting home-grown innovation has been slow and patchy. The report’s key findings are highlighted below:
Innovation is essential for sustainable growth. The impact of innovation is shown to be particularly positive on growth for medium-income countries. CEE governments should therefore not be tempted by the argument that, as catch-up countries, they only need to imitate and assimilate foreign ideas in order to sustain economic growth.
MNC innovation brings few benefits to domestic enterprises. Despite massive foreign direct investment into the region, and the introduction of modern production and management methods, there have not been sufficient “spillovers” of technology and “know-how” into the domestic economy.
The CEE region has underperformed and will
continue to do so… The Economist Intelligence Unit’s innovation model suggests that over the last five years CEE innovation has been modest compared with developed EU economies, and that this underperformance will continue over the next five years.
…unless more is done to boost inputs and improve the innovation environment. Improving innovation performance requires an increase in direct inputs—such as R&D spending, better science education and IT infrastructure—as well as improvement to the overall innovation environment such as less bureaucracy, fairer taxation and more flexible labour markets.
Local SMEs have innovated and exported successfully. Several local SMEs have shown that successful innovation and export is possible, despite poor brand recognition abroad. Such firms may provide a standard for others to follow.
Talent-related issues are a major concern. Three of the four business operational issues regarded as very important by a majority of our survey respondents were talent-related: availability of university graduates; availability of scientists and engineers; and technical skills of the workforce. Finding the right staff has been made harder by the persistence of a “brain drain” from the region.
Innovative firms have mixed views about the ability of government to help. Companies in the region are ambivalent about the effectiveness of government reforms. Typical complaints include lack of effective tax legislation, particularly regarding tax advantages for start-up businesses and employee share ownership, and weak links with universities.
Executive summary

© The Economist Intelligence Unit 2008 3
A time for new ideas Innovation in Central Eastern Europe and Turkey
Summary of innovation rankings current and forecast
Ranking by innovation performance Ranking by innovation enablers
Innovation Global rank Innovation Global rank Innovation Global rank Innovation Global rank performance 2003–07 performance 2008–12 enablers 2003–07 enablers 2008–12 2003–07 2008–12 2003–2007 2008–12Slovenia 7.68 24 7.86 24 7.16 28 7.34 29
Hungary 7.26 27 7.64 26 7.29 27 7.68 25
Czech Rep. 6.83 28 7.04 32 7.41 25 7.62 27
Estonia 6.75 29 7.09 31 7.34 26 7.69 24
Slovakia 6.26 36 6.25 41 6.84 29 6.82 30
Latvia 5.89 39 6.42 38 5.87 40 6.41 39
Bulgaria 5.79 41 6.06 48 5.98 37 6.26 44
Poland 5.65 48 6.14 46 6.21 33 6.71 33
Lithuania 5.52 50 5.77 57 6.09 34 6.35 42
Romania 5.25 53 5.87 53 5.61 46 6.25 45
EU10 average 6.29 6.61 6.58 6.91
Russia 6.07 37 6.39 39 6.37 32 6.70 34
Ukraine 5.37 51 5.77 56 4.69 59 5.11 59
Turkey 5.21 55 5.62 58 5.07 51 5.49 55
EU14a average 8.54 8.66 8.53 8.67
a Pre-2004 EU member states excluding Luxembourg.
Source: Economist Intelligence Unit.
The table below provides a summary of the results of the Economist Intelligence Unit’s innovation model. The first part ranks countries by their respective innovation performance, both current and forecast, based on available patent data. The second part ranks countries according to their respective innovation inputs (or enablers) both current and forecast, based on a wide range of direct and indirect factors that contribute to the environment for innovation.

4 © The Economist Intelligence Unit 2008
A time for new ideas Innovation in Central Eastern Europe and Turkey
Innovation as an economic necessity
Over the past decade the new EU member states from central and eastern Europe (CEE or the EU10) and Turkey have made impressive progress in narrowing the gap in GDP per head with the older members of the EU. Growth until now has been predominantly an “extensive” recovery, based on redeployment of existing resources. However, this process is coming to an end. If growth is to be sustained into the medium- to long-term future, it will have to be based on innovation and technological change.
The conventional wisdom is that innovation is most likely to be important for spurring growth among the most developed countries, and not lower- or medium-income countries such as those in CEE or Turkey. Other sources of growth are believed to be far more important for poor and middle-income economies that can borrow technology from abroad, and therefore have little or no need to innovate themselves. However, recent Economist Intelligence Unit research casts serious doubt on this conventional wisdom. It not only shows that innovation and growth are related across all levels of development, but indicates that the impact of innovation on growth for medium-income countries is disproportionately positive. This opinion appears to be shared by numerous other institutions. The World Bank, for example, concluded in its most recent report on CEE: “Fostering innovation and international competitiveness is a top priority among early reformers in sustaining productivity growth.…Innovation-led productivity growth thus calls for policies that increase private-sector participation in R&D so as to support skill-based industries and move up the value chain in exports.”
However, most of the innovation in the CEE
region in the past two decades has come not from locally owned firms, but from the investments of multinational companies (MNCs), on which local firms have come to rely for new ideas and technology. This over-reliance leaves the region’s economies vulnerable, should those MNCs leave for lower-cost markets. Local firms therefore need to innovate not only to generate an independent flow of new products and ideas, but also to increase their value to multinational investors and hopefully encourage them to invest further in higher value facilities. This will require governments, universities and local businesses to work together, creating intelligent and precisely focused financial incentives, improving links between business and universities, and facilitating a flow of talented and technically skilled graduates into business start-ups and small and medium-sized enterprises (SMEs).
This report focuses mainly on the development of new products, with the emphasis on technological innovation rather than business process innovation, although the latter is still important if sometimes harder to measure. The report begins with an analysis of the current state of innovation in the CEE region, looking at the dominance of MNCs and the lack of spillovers into the domestic economy. The report’s findings are supported by the Economist Intelligence Unit’s innovation model, which combines key innovation inputs and outputs, and demonstrates how innovation activity, outside of MNC investment, is generally weak, and is forecast to remain so over the next five years. This is not to say that some locally based firms have not been able to innovate successfully. In fact, SMEs created in the past decade have been at the forefront of domestic innovation, and the report goes on to look at some of the practical
Introduction

© The Economist Intelligence Unit 2008 5
A time for new ideas Innovation in Central Eastern Europe and Turkey
experiences—based on case studies and survey results—as well as some of the many obstacles they face. These include creating internal systems for generating new ideas, difficulties in finding exporting markets and, crucially, attracting talented staff. The report then looks at how governments may have helped or hindered the innovation process and where improvements can be made.

6 © The Economist Intelligence Unit 2008
A time for new ideas Innovation in Central Eastern Europe and Turkey
The dominance of foreign multinationals
Multinationals (MNCs) have made a huge contribution to the modernisation and technological upgrading of the economies of the EU10 over the past two decades. In most countries in the region, the foreign-owned sector is very large—average foreign direct investment (FDI) penetration in the EU10 is 42% in manufacturing and 31% in services compared with around 28% and 20% respectively in the EU15 economies—but it generates little demand for local research and development (R&D) services. The general pattern is for the cutting-edge R&D work to be kept at MNC headquarters. Some MNCs have established R&D facilities in the CEE region, and there are some examples of R&D facilities that have been set up in the EU10 by MNCs that are engaged in cutting-edge research. But these are tightly integrated into the global R&D networks of the parent MNC and they do not exchange knowledge and experience with domestic actors. As a result, their beneficial impact (“positive spillovers”) on the domestic host economy is limited.
Our survey results generally provide support for this analysis. Foreign companies’ opinions of CEE government efforts to encourage innovation, of local companies and of local academic institutions, and of local suppliers, seem to be relatively low. Of the 146 wholly owned foreign companies in our survey sample operating in the region: ● Almost one-half had no R&D facilities in the CEE
affiliates. Among the companies that had set up such facilities, the vast majority were located in only four countries of the region—the Czech Republic, Hungary, Poland and Russia.
● More than 70% of those headquartered outside the CEE region said that their innovation was carried out exclusively or mostly in company headquarters. Only 12% said that it was mostly carried out in CEE.
● Only 25% of them said that their CEE sales were predominantly based on products and services that had been developed in the CEE region.
● Only 14% said that they expect their innovation activities to increase significantly over the next three years, compared with 26% for domestic CEE companies. For R&D activity, the respective figures for foreign-owned and domestic companies were only 4% and 18% respectively.
● Only 29% of foreign-owned companies reported that they collaborated with other companies in CEE to develop products and services, compared with 42% of domestically owned companies that reported that they collaborated with other firms in CEE on product development.
● Only 12% of the foreign-owned companies rated the innovation environment in their CEE host countries as better than in their home countries, although 21% said that it was the same—and the remainder said that it was worse or much worse.
● Only 7% of foreign companies expected the CEE innovation environment to improve substantially over the next three years, compared with 14% of domestic companies (although some two-thirds did expect some improvement). This lower level of optimism about future trends is partly reflected by our forward-looking measure of the innovation environment (see Table 4).
● Only 5% of foreign companies characterise their relationship with local academic institutions as excellent, compared with 13% of domestic companies.
The current state of play

© The Economist Intelligence Unit 2008 7
A time for new ideas Innovation in Central Eastern Europe and Turkey
One of the few more encouraging responses concerned reliance on local suppliers, which may reflect the fact that this has indeed been increasing in recent years (in the initial years of FDI in the region, foreign companies relied almost exclusively on suppliers from outside CEE). On local suppliers, 28% of foreign firms agreed with the statement that their supply chain was based primarily on local suppliers.
This was significantly lower than the 42% of domestic companies, but perhaps still a higher proportion than might have been expected.
Although the country-specific survey results should be treated with caution because of the limited size of the sample in some cases, they reveal some significant differences in the impact of FDI on the EU10 countries.
Bulgaria 8.3 8.3 8.3 16.7
Czech Republic 31.0 37.9 24.1 31.0
Estonia 50.0 37.5 0.0 12.5
Hungary 33.3 58.3 29.2 29.2
Latvia 50.0 50.0 50.0 25.0
Lithuania 33.3 16.7 50.0 33.3
Poland 48.8 34.1 34.1 36.6
Romania 25.0 56.3 25.0 18.8
Russia 30.0 35.0 22.5 35.0
Slovakia 14.3 14.3 42.9 42.9
Slovenia 14.3 28.6 28.6 28.6
Ukraine 12.5 37.5 25.0 25.0
Ranks Average rank
Latvia 1 3 1 8 1
Hungary 4 1 5 6 2
Poland 3 8 4 2 3
Lithuania 4 10 1 4 4
Slovakia 9 11 3 1 5
Czech Republic 6 4 9 5 5
Romania 8 2 7 10 7
Russia 7 7 10 3 7
Slovenia 9 9 6 7 10
Ukraine 11 5 7 8 10
Estonia 1 5 12 12 9
Bulgaria 12 12 11 11 12
Source: The Economist Intelligence Unit.
Country
Firms that over the past three years
developed in the CEE more than 50% of the
products or services they sold (%)
Firms that rate as good or excellent their relations with
local academic institutions (%)
Firms that agree with the statement that
they rely primarily on local suppliers (%)
Firms that agree with the statement
that they co-operate with local firms to
develop products and services (%)
Table 1 The foreign influence
(% of wholly and partly foreign-owned firms)

8 © The Economist Intelligence Unit 2008
A time for new ideas Innovation in Central Eastern Europe and Turkey
The positive impact on innovation-related factors was most limited in the case of the poorest and newest EU members, Bulgaria and Romania. Also noteworthy are the low rankings for Slovenia and Estonia. The apparently best-performing countries on these measures were Poland and Lithuania, followed by Latvia and Hungary.
However, crucially and unsurprisingly, the ability to integrate the latest foreign technology appeared to be the main driver of performance. Among domestic companies performing better than their peers, 63% rated their company’s ability to absorb foreign technology as excellent or very good. For the underperformers, the percentage was only 35%.
Looking at particular CEE countries, on the key survey question as to the extent to which domestic companies might be integrated, in terms of innovation, with MNC networks, only Slovene companies, and to a lesser extent firms from Lithuania, recorded respectable results.
Table 2 Foreign co-operation
Domestic companies that agree with the statement that their firm co-operates with MNCs to develop new products and services (%)
Slovenia 71
Lithuania 60
Latvia 40
Ukraine 37
Czech Republic 33
Poland 33
Romania 31
Russia 26
Bulgaria 20
Slovakia 20
Hungary 9
Note. Insufficient sample size for Estonia.
Source: Economist Intelligence Unit.
Domestic innovationIf the spillovers from MNCs are relatively weak, the pressure on domestic firms to innovate is high, not least to induce MNCs to integrate local firms into their global operations. On the face of it, our survey revealed some encouraging signs that domestic innovation activity is increasing, and in some cases is now apparently considerable. Some 65% of the domestically owned companies in our sample expected their R&D activity to increase over the next three years, and another 18% said it would increase significantly. More than 60% stated that over one-half of their products and services were developed domestically, and 65% rated their relationship with local academic institutions as good or excellent.
However, when comparing innovation activity in terms of inputs and the environment with actual performance, the link appears to be weak or even non-existent for domestically owned firms. This means that policy designed to improve innovation is not particularly effective. The existence of internal innovation networks and various indicators of the encouragement by firms of innovation appeared entirely unrelated to their financial performance.
Domestic firms
Increase significantly
Increase
Remain unchanged
Decrease
Decrease significantly
Don’t know
Not applicable&; my company doesn’t invest in R&Din CEE and isn’t planning to do so
How do you expect your company’s R&D investment in CEE to change over the next three years?(% respondents)
18
65
9
1
0
2
6
Source: Economist Intelligence Unit.

© The Economist Intelligence Unit 2008 9
A time for new ideas Innovation in Central Eastern Europe and Turkey
There was no relationship at all between expectations on R&D and innovation changes over the next three years and a company’s performance.
A few indicators, however, did reveal a positive link between innovation and performance for domestic firms. Among domestic companies that performed better than their peers, 69% had developed more than 50% of their products domestically. The corresponding figure for companies that underperformed was only 50%. Some 58% of the above-average performers, compared with 42% of the underperformers, said that their relationship with local academic institutions was excellent or good.
Measuring innovation Our innovation model would appear to support the conclusions from our survey that innovation activity in the CEE region has been weak. Measuring innovation, especially at the level of the aggregate economy, has always been one of the most perplexing problems facing empirical economics. The Economist Intelligence Unit’s model distinguishes between measures of innovation outputs or performance, on the one hand, and of innovation inputs or drivers on the other. (For a more detailed analysis of the model, see Appendix 1.)
We constructed four indices of innovation for 82 countries worldwide, drawing on the Economist Intelligence Unit’s business environment rankings (BER) model. The first index measures innovation output or performance, and is based on international patents data. There are also two composite indices, constructed on the basis of BER scores that measure innovation inputs, or innovation enablers. The first covers direct innovation inputs and the second the innovation environment or the policy and institutional framework, that is the broad economic, social and political backdrop that facilitates (stimulates or
hinders) innovation activity. Finally, a fourth index aggregates the index for innovation inputs or enablers that comprises the direct innovation, and the innovation environment indexes. The model looks first at innovation in the 2003-07 period, set out in Table 3, and a forecast index constructed for the 2008-12 period, set out in Table 4.
The results in Table 3 rank each CEE country and Turkey according to its position in the global ranking of 82 countries, first for innovation inputs or enablers, and second for innovation outputs. The table shows that the CEE countries continue to lag some way behind most developed European countries, which in itself may not be particularly surprising. But our forecast ranking for 2008-12 in Table 4, based on current forecasts of innovation drivers, suggests that the performance gap will barely narrow. In other words, unless CEE countries invest more in innovation inputs than appears likely at present and improve to a greater extent their innovation environments, their innovation performance will not improve dramatically and a key future driver of growth will remain underdeveloped.
As the tables show, none of the CEE countries is close to the EU average, and all are significantly behind the EU leaders, Finland and Germany, although Slovenia and Hungary perform best. Only Estonia comes close to the EU14 average on any measure in the indices—namely the overall environment for innovation—and just surpasses the average over the next five years on this measure. However, the measure alone carries less weight overall. Interestingly, those countries at the bottom of the performance ranking—Romania, Lithuania, Poland and Bulgaria—are there despite a relatively less poor ranking of their innovation inputs. In other words, this would suggest that poor policy implementation is holding them back.

10 © The Economist Intelligence Unit 2008
A time for new ideas Innovation in Central Eastern Europe and Turkey
Table 3 CEE innovation rankings, 2003-07
Innovation performance Innovation enablers
1 2 3 4 Patents Index Global Direct Global Innovation Global Innovation Global per m rank inputs rank environment rank enablers total rank
Slovenia 20.2 7.68 24 7.50 26 6.16 46 7.16 28
Hungary 10.4 7.26 27 7.38 27 7.02 25 7.29 27
Czech Republic 5.3 6.83 28 7.75 25 6.38 40 7.41 25
Estonia 4.6 6.75 29 7.31 28 7.41 19 7.34 26
Slovakia 2.1 6.26 36 6.88 30 6.72 30 6.84 29
Latvia 1.2 5.89 39 5.63 40 6.62 35 5.87 40
Bulgaria 1.00 5.79 41 6.06 34 5.73 55 5.98 37
Poland 0.81 5.65 48 6.00 35 6.84 27 6.21 33
Lithuania 0.65 5.52 50 6.00 35 6.37 42 6.09 34
Romania 0.43 5.25 53 5.44 45 6.13 47 5.61 46
EU10 average 6.29 6.59 6.54 6.58
Russia 1.6 6.07 37 6.88 30 4.84 72 6.37 32
Ukraine 0.51 5.37 51 4.94 49 3.96 78 4.69 59
Turkey 0.4 5.21 55 4.69 54 6.22 44 5.07 51
Finland 321.7 9.43 5 10.00 1 8.26 6 9.56 2
Germany 300.3 9.38 6 9.94 4 7.75 13 9.39 6
UK 105.1 8.72 18 9.25 13 8.63 1 9.09 12
EU14a average 8.54 8.87 7.54 8.53
a Pre-2004 EU member states except Luxembourg.
Source: Economist Intelligence Unit.

© The Economist Intelligence Unit 2008 11
A time for new ideas Innovation in Central Eastern Europe and Turkey
Table 4 CEE innovation rankings forecast, 2008-12
Innovation performance Innovation enablers
1 2008-12/2003-07 2 3 4 Index Global Rate of Change Direct Global Innovation Global Innovation Global rank growth in rank inputs rank environment rank enablers rank (%) total
Slovenia 7.86 24 2.3 0 7.56 29 6.68 43 7.34 29
Hungary 7.64 26 5.2 1 7.88 26 7.08 30 7.68 25
Estonia 7.09 31 5.0 -2 7.63 27 7.87 13 7.69 24
Czech Rep. 7.04 32 3.0 -4 7.94 25 6.66 44 7.62 27
Latvia 6.42 38 8.9 1 6.31 39 6.72 41 6.41 39
Slovakia 6.25 41 -0.3 -5 6.81 32 6.84 37 6.82 30
Poland 6.14 46 8.6 2 6.63 36 6.96 33 6.71 33
Bulgaria 6.06 48 4.7 -7 6.25 41 6.29 53 6.26 44
Romania 5.87 53 11.8 0 6.19 43 6.43 51 6.25 45
Lithuania 5.77 57 4.5 -7 6.25 41 6.65 45 6.35 42
EU10 average 6.61 5.1 6.94 6.82 6.91
Russia 6.39 39 5.3 -2 7.19 30 5.23 72 6.70 34
Ukraine 5.77 56 7.6 -5 5.19 54 4.88 75 5.11 59
Turkey 5.62 58 7.8 -3 5.06 57 6.79 39 5.49 55
Denmark 9.33 7 0.4 0 10.00 1 8.29 7 9.57 1
Germany 9.49 5 1.2 1 10.00 1 8.02 12 9.50 5
UK 8.99 15 3.1 3 9.63 9 8.60 3 9.37 7
EU14a average 8.66 8.99 7.70 8.67
a Pre-2004 EU member states except Luxembourg.
Source: Economist Intelligence Unit.

12 © The Economist Intelligence Unit 2008
A time for new ideas Innovation in Central Eastern Europe and Turkey
Despite the findings from our model and survey, some local firms, especially SMEs, have shown that they are able to innovate successfully, although many encounter major obstacles. This section focuses on the practical experiences, including creating the structures and processes required for innovation, accessing export markets, recruiting and rewarding the best staff and improving links with the universities. It shows that home-grown companies are capable of innovating, have developed best practices in generating ideas, have responded well to export pressures, and have overcome prejudices or ignorance about a CEE brand image. Moreover, some of the practical obstacles that these companies face should signal to policymakers where and how the innovation environment might be improved, and indicate the effectiveness of government—the subject of the report’s final section.
Creating new ideasSuccessful innovation depends to a great extent on getting the right internal company structure and processes in place—something that confounds established companies worldwide. Best practices in developed economies suggest that this involves a few basic processes: an independent team of thinkers with time to experiment; direct support from the CEO; a formal process of testing and approving new ideas; and collaboration with suppliers, customers and other outsiders to help generate new ideas. It is a model that has served the likes of US innovation pioneers such as 3M, Procter & Gamble and General Electric well, and although many Western multinationals still fail in this regard, there is evidence that small CEE firms are catching on. As Artur Banach, CEO of NetSprint, a dynamic Polish Internet search firm,
points out, “Ideas come from three main sources: senior management, staff and business partners.” He sees it as senior management’s responsibility to create a spirit of innovation in the company culture. But he notes that the best ideas come from employees: “We have to train our employees to grab ideas and develop business solutions.”
When survey respondents were asked which formal procedures or structures were in place to support innovation, two-fifths said an internal innovation network more than any other process. Next most important was a dedicated team responsible for innovation (28%) and financial compensation for innovation activity (26%). However, these results mask differences between partly or wholly foreign-owned companies on the one hand, and domestic firms on the other. While an innovation network was in place in 43% of foreign-owned companies, this was the case for only 37% of local firms, and only 31% among smaller domestic firms compared with 37% of smaller foreign firms. That foreign-owned companies are better structured to innovate may reflect pre-existing systems at headquarters that are more easily rolled out to their CEE subsidiaries. Interestingly, 30% of domestic firms make greater use of external networks such as universities and local suppliers for new ideas, compared with only 21% of foreign firms, which may indicate a greater dependence on local connections.
As the idea-generation process gains traction, rapidly expanding local firms can easily outgrow their early processes, leaving executives with additional challenges associated with managing change. SIVECO, a Romanian eLearning provider, which in 15 years has grown into one of the country’s leading software firms with some 750 staff, sees a risk that
Innovation in practice

© The Economist Intelligence Unit 2008 13
A time for new ideas Innovation in Central Eastern Europe and Turkey
internal communications becomes more difficult and less effective. It has recently had to set up an R&D department with 15 staff as “mediators of innovation, not the authors of all we do”, says Florin Ilia, vice-president of the company’s commercial division. “By being larger, we don’t want to become less agile and flexible, and to let our past success hinder further success.”
Mr Banach of NetSprint agrees. With growth comes the need for more formal processes, and the company now behaves “much more like a corporation”, he says. “Now if a very good idea comes up and we think it can work, we have a procedure to try to establish how it can work and whether it can be successful or not. Three years ago things were much more lively and we could proceed a bit faster, but the risk of failure was higher.”
Typically, a balance must be struck between effective structures and innovative spirit. “When the company started, innovation was a condition of our existence. Now we have to be innovative but
also not destroy something we’ve already created,” explains Yan Stolyar, business development manager of Devexperts, a St Petersburg-based company that has developed online trading platforms. “We’re not able any more to spend 100% of our energy on innovation.”
The export imperativeOur research suggests that another crucial challenge facing fast-growing firms, particularly from the smaller countries of the CEE region, was to develop export markets—adding yet another layer of business challenges. Many have made a good attempt at overseas expansion, some within the region and others venturing worldwide, despite difficulties getting recognition abroad. When asked to what extent products or services developed in CEE were applicable to other markets, a sizeable majority believed that their products were applicable to other emerging markets as well as to developed markets.
Does your company have any of the following formal procedures/structures in place to support innovation? (% respondents)
Domestic firms
An internal innovation network
Financial compensation for innovative activity
An external innovation network (with suppliers, academia, etc)
A dedicated team responsible for innovation
An award for innovative activity
A process for employees to take time off regular work to pursue innovation projects
Funding allocated specifically to innovation
An internal “innovation champion”
Other
None of the above
Foreign firms
An internal innovation network
A dedicated team responsible for innovation
An award for innovative activity
Financial compensation for innovative activity
An external innovation network (with suppliers, academia, etc)
Funding allocated specifically to innovation
An internal “innovation champion”
A process for employees to take time off regular work to pursue innovation projects
Other
None of the above
37
35
30
27
20
19
15
13
1
18
43
31
28
22
21
17
16
12
1
25
Source: Economist Intelligence Unit.

14 © The Economist Intelligence Unit 2008
A time for new ideas Innovation in Central Eastern Europe and Turkey
However, there was a clear discrepancy between foreign-owned and local firms on the domestic market. Some 34% of domestic firms said that their products were designed exclusively for the domestic market, compared with 24% of foreign firms. The differences between the two ownership types narrowed when referring to regional relevance, with 58% of domestic firms saying that their products or services were exclusively or highly applicable to the region’s consumers, compared with 51% of foreign firms.
A certain degree of cultural awareness is therefore vital. Bucharest-based SIVECO, which sells its eLearning products abroad to more than 6,800 schools worldwide, tailors its market-entry strategy according to country and culture. It relies on partners within each of its export markets to know local practices and attitudes, especially in the Gulf, North Africa and Asia. This includes adapting the 1,700 hours of content in the interactive library to bring it “perfectly in line with a country’s curricula and customs”, according to Mr Ilia. “We have to respect, understand and incorporate the local culture if we want to be successful. We have to be very careful not to come across as naive or arrogant,” he says. Similarly, at Devexperts, “the Asian market is completely different”, notes Mr Stolyar. The firm faced few cultural differences when providing software and servicing for large Japanese banks, but it had to find a
Japanese company to design an interface that met the banks’ requirements.
Much of the difficulty comes down to the lack of CEE brand or country recognition around the world. A Hungarian pharmaceutical firm, Solvo, a 1999 start-up that develops transporter proteins, has survived several near-insolvency moments in its early years. “I would phone up one of the big pharmaceutical companies in the [United] States and a guy would say, ‘Oh yes, we’ll phone you back’, reports Erno Duda, Solvo’s founder. They did not. Nowadays, foreign clients call back more often. Its numerous projects producing purified proteins are almost all for foreign firms.
Hungary has a particularly strong reputation in the pharmaceutical world, which may have helped. But sometimes a good name is not enough. Mr Stolyar of Devexperts believes that there is a perception that Russia is full of cheap programming geniuses, but he counters that there are not that many and nor are they so cheap. Also, negative perceptions of Russian business practices are common. “In the West, there are some prejudices against working with Russian companies—that they’re not solid business partners and don’t usually meet expectations. It takes a huge amount of time and mental strength to beat that,” he says. (See case study, NeoQi: Small nation, big deal.)
Designed exclusively for this market Highly applicable Somewhat applicable Not applicable Don’t know
To what extent are products, services, and processes developed by your company in CEE applicable to your company's business in the following markets? (% respondents)
Domestic firms
Domestic market
CEE region as a whole
Other emerging markets
Developed markets
Foreign firms
Domestic market
CEE region as a whole
Other emerging markets
Developed markets
Source: Economist Intelligence Unit survey.
34 54 7 4 0
11 47 28 11 3
2 28 40 21 9
5 26 43 17 9
24 44 12 15 4
6 45 25 18 5
2 29 38 22 9
5 31 31 26 9

© The Economist Intelligence Unit 2008 15
A time for new ideas Innovation in Central Eastern Europe and Turkey
The war for talent
Perhaps the most important aspect holding back innovative local companies, according to our survey and case studies, is the war for talent. The issue preoccupies companies, large and small, in emerging markets worldwide. In our survey, three of the four
areas regarded as very important by a majority of our survey respondents were all talent-related: availability of university graduates; technical skills of the workforce; and the availability of scientists and engineers.
The availability of university graduates was particularly important for small domestic companies—which are competing for talent against larger and better-resourced players—with 69% rating this as very important compared with 56% by all other respondents. But what constitutes talent? According to Mr Banach of NetSprint, “Some people don’t like innovation and can’t change that easily. This is very important when we’re hiring—we only have people who like to work in an innovative environment.” At Solvo, which now employs over 80 full-timers and operates research centres in Szeged and Budapest, almost all its staff, including the secretaries, have degrees—many have two or more—and most are multilingual. Evidently, the company has achieved what many major multinationals have not—techies with language skills. “We find that many well-educated, skilled engineers do not speak foreign languages at all,” says Thomas Beyer, regional spokesperson for Bosch, a German engineering giant, which has been trying to hire some 400 staff
CASE STUDY NeoQi: Small nation, big deal
Kert Schneider, marketing manager and board member of NeoQi, an Estonian firm that makes sauna and water treatment equipment, says that being from a small country involves difficulties when develop-ing new products. For example, “we don’t have a major car or machinery industry, so the overall knowledge base is small, and there are not many people you can go to
and ask questions,” he says. In addition, testing parts for new prototypes costs NeoQi extra time and money, since these usually have to be imported from western Europe or even Asia.
The company’s sales grew by about 30% in 2007, to reach e2m, and are projected to rise at a similar rate in 2008, mainly to corporate users such as spas, gyms, hotels and beauty salons, although the company wants to sell more to households. NeoQi exports its products to more than 40 countries worldwide. Its biggest markets are in eastern Europe, particularly Russia, Ukraine, Poland
and Belarus. But “the next big thing for us is the US”, says Mr Schneider. “It’s really a very niche product, so not too many sales are generated in one country. We have to go to the next market, and then the next one.” But this means that the company has to devote resources to marketing that might otherwise have gone into product development.
Overseas customers also express doubts about buying from an Estonian company. “They say ‘How can Estonia make this?’ and ask what the quality is like,” says Mr Schneider. “When people ask whether we’re from Italy or Germany, it’s an honour for us.”
Very Somewhatimportant important
How important are the following factors as innovation drivers in CEE for your company?(% respondents)
Quality of IT and communications infrastructure
Technical skills of the workforce
Availability of university graduates
Availability of scientists and engineers
Broadband penetration
Total R&D spending in the country
Private sector R&D spending
Public sector (government) R&D spending
Source: Economist Intelligence Unit survey.
56 37
54 38
56 34
53 29
32 48
24 44
30 38
19 44

16 © The Economist Intelligence Unit 2008
A time for new ideas Innovation in Central Eastern Europe and Turkey
for its R&D department. “We have to reject 60% of candidates for this reason.”
Beating MNCs locally for the best people is only half the task for domestic firms. “Brains are going out to other EU countries,” confirms Pavol Figusch, sales manager of Zadako, a Bratislava-based wireless communications firm, “and it’s getting more and more difficult to find people to fill vacancies.” Of course, as more developed CEE markets lose out to Western countries, so they draw upon untapped talent pools in economic laggards next door (who in turn are drawn westwards to the better pay). Slovenian hi-tech firms say that finding quality engineers and mathematicians is becoming ever more difficult, and are turning to former Yugoslav states to fill the void. Hermes Softlab, the country’s largest home-grown IT company, has hired one-quarter of its 200 headcount in Bosnia, Serbia and Montenegro in the past two years, and with more in the pipeline.
Romania is another favourite talent pool for central European firms. But this process merely shifts, rather than removes, the brain-drain problem. As Mr Ilia of SIVECO points out from his Romanian perspective, the local market for programmers “has evolved explosively” in the past few years. “There used to be one problem—brain drain. There’s still some of that, but now competition on the local market has increased as well, and we’re having trouble getting experienced people.” The company has explored various ways of finding programming talent. It is looking in other parts of the country outside Bucharest; tapping into the small pool of Romanian-speaking programmers in neighbouring Moldova; and outsourcing programming work to Ukraine and as far afield as Pakistan.
The company tries to attract staff through its own academy, which it runs with Romania’s top three universities. The academy, which opened in April 2006, trains students in software engineering and information technology for business.
Most domestic firms continue to rely on established
universities for recruits. Availability of graduates was ranked very important by the largest percentage of respondents (56%). “The main thing that the business sector gets from the universities is highly skilled labour,” says Marika Popp, head of the Technology and Innovation Policy Unit in Estonia’s Ministry of Economic Affairs and Communications.
This need is undoubtedly more critical for local firms that lack the global networks upon which many MNCs can draw. Indeed, it is striking that 65% of domestic firms cited the availability of university graduates as very important as a driver of innovation in the region. An additional 27% said it was somewhat important, with around 90% citing the technical skills of the workforce and availability of scientists and engineers as being important. By contrast, barely one-half of foreign firms cited these factors as being very important.
There is also a fear that the CEE region’s reputation for churning out scientists and neglecting humanities may have reversed during the 1990s in some cases, with a notable shift towards non-technical subjects at universities. When asked how effective academic centres in the certain fields were, a clear majority of our survey respondents ranked information
How effective are academic centres in the each of the following fields in your home country? (% respondents)
Biotech
Information technology
Management sciences
Engineering
Life sciences
Physical sciences
Source: Economist Intelligence Unit survey.
10 35 17 38
32 47 8 13
9 47 27 17
22 49 9 20
7 36 23 34
12 37 17 33
Very Somewhat Very Don’t know/effective effective ineffective Not applicable

© The Economist Intelligence Unit 2008 17
A time for new ideas Innovation in Central Eastern Europe and Turkey
technology and engineering as most important. Getting the incentive structure right can also help
to keep and retain staff, especially in an innovative small company. In our survey, some 35% of local firms said that they had some financial incentives in place for innovation work, a similar level for large or small companies, compared with only 22% of foreign investors.
But this is not a straightforward process. Mr Stolyar of Devexperts sees the innovation process and
compensation issue as being linked, and not always positively. Although the company pays higher wages in some cases, this is not a sustainable solution because it feeds through into higher prices for customers who buy the trading platforms. At the same time, the company is unwilling to outsource its development to lower-cost markets such as India. “We want to have our core competence in one office, so we can have meetings and share ideas,” explains Mr Stolyar.
NetSprint considered introducing a formal
CASE STUDY Instrumentation Technologies: A sharper focus on innovation
Particle accelerators—machines that push electrons and protons to the speed of light—are used in a wide range of scientific research that encompasses cancer treat-ment and nanotechnology. Given the cost and complexity, it is a small and specialised sector. In fact it is so specialised that the accelerators are designed and built by the physicists who want to use them.
Rok Ursic, a Slovenian electrical engineer who had worked with such machines in Italy, the US and Switzerland during the 1990s, realised that accelerator beam detection systems, used to determine how to steer and guide particles to targets, were out of date with technological developments and therefore clumsy and inefficient. So he and a team of eight staff set out in 2003 to design a modern system for beam detection.
Mr Ursic recalls: “The most important thing was to trust in my own foresight, and to persuade the young team that they were part of something really big. Everyone was so different—combining all those different people, their perceptions, expectations
and energy seemed almost impossible sometimes. We had marathon brainstorming meetings that were really stormy.” Helped by a contract from French and British firms, his team achieved its breakthrough with the “Libera”. “It was the first time a beam control system had been put into one box, which at the same time could be put to work ‘out of the box’. It also worked to an accuracy of 1/1000 of a millimetre, which was unprecedented,” he says. “It’s at the limits of technology. The beam is moving near the speed of light, and the Liberas speak to each other at 10 kilohertz. This is why we need a team that includes physicists who understand accelerators and mathematicians and IT experts who understand control systems.”
Future expansionThe Libera laptop-sized box costs €10,000, and a typical accelerator needs 100 of them for a full control system. From a five-man team earning €200,000 in 2003, his com-pany, Instrumentation Technologies, has grown to 30 staff, mostly Slovene, but now including American and British experts, and a Serbian PhD student on a Slovenian government scholarship. Slovenia is self-evidently too small a market to sustain such a product, but exports to China, Japan, Aus-tralia, Europe and the US have boosted the firm’s revenue from €2.4m in 2006 to almost
€5m in 2007. But with only one product, albeit
world-beating and patent-protected, the company is vulnerable. Mr Ursic recognised that constant innovation is essential for survival. While one part of the team is adapting the Libera for use in spectroscopy, a technically simpler but far larger market than accelerators, Mr Ursic is also working on another aspect of accelerators—the radio frequency acceleration part—in an attempt to replicate the success of Libera. “If we take the car as an analogy, Libera is like the steering mechanism, while the radio frequency acceleration is the engine,” he says.
“Libera is not just a product—we collaborate with customers so they can add their own features. And what we found, almost unintentionally at first, is that we have become a focal point for particle accelerators. Now we have a forum, every year, with scientists from all over the world meeting here,” he says. This and other discussions serve as a stimulus for further ideas and innovation.
Mr Ursic, who owns the company, wants to broaden the shareholder base, despite the less than favourable conditions in Slovenia for stock options. “It’s most important that people feel they are part of something that is valuable, and that they get something back from this,” he stresses.

18 © The Economist Intelligence Unit 2008
A time for new ideas Innovation in Central Eastern Europe and Turkey
incentives programme to encourage innovation, but decided against it. “If you implement such a programme, you have to spend a lot of time deciding who the real innovator is and who should be rewarded. And that can be very destructive for team spirit and
people working together,” notes Mr Banach. But the company does link employee bonuses to key performance indicators—both financial and non-financial—in its budget.

© The Economist Intelligence Unit 2008 19
A time for new ideas Innovation in Central Eastern Europe and Turkey
All governments claim that innovation is a priority, and the state’s role is crucial for improving the overall environment for innovation—as our innovation model makes clear. But as Ms Popp of Estonia’s Ministry of Economic Affairs and Communications points out, “Framework conditions are not enough; government has to understand their own strengths and weaknesses.” Typically, the regulatory environment for doing business is viewed as the biggest concern in our survey. A robust economy, the institutional framework including the rule of law; fairness and consistency of the tax regime; and protection of
intellectual property were listed as the next most important factors. Labour market flexibility and access to finance—domestic or EU funds—were deemed less important, although still significant. Companies and officials have also debated how best to improve links with universities, to promote R&D and improve the flow of qualified graduates.
Bureaucracy and inefficiencyOften, state officials charged with promoting innovation simply do not understand what policy tools to use and how to analyse results, especially on tax changes. According to Attila Havas, senior research fellow at the Institute of Economics, in the Hungarian Academy of Sciences, and an expert on innovation policy, officials “are not performing on the most elementary of issues”. Few see the linkages between policy challenges and economic performance, with little effective co-ordination between government departments to link trade, taxation and cross-referencing of data sets. As a result, public money is used where private investment might be sufficient. Mr Havas believes it may take years for state officials to learn the basic economic tools.
In Turkey too, “the main problem is a lack of co-ordination”, according to Sirin Elci, Director of Bilkent University’s Teknokent. “There are government agencies developing many projects but they are not…communicating effectively. Nobody is making sure that [measures taken] are complementing each other and addressing real needs.”
Even in relatively open Estonia, where interdepartmental meetings on innovation policy are conducted by sophisticated teleconferencing technology, discussion can be basic. “The very word ‘innovation’ is still treated with some suspicion”, says
The role of government
How important are the following factors as innovation drivers in CEE for your company? (% respondents)
Macroeconomic stability
Regulatory environment (eg, ease of doing business, licensing, opening new businesses)
Institutional framework (eg, public administration, rule of law, extent of corruption)
Tax regime (eg, tax burden, fairness and consistency of tax system, incentives for investment)
Political stability
Openness of national economy to foreign investment
Protection of intellectual property
Flexibility of labour market
Access to EU funds
Popular attitudes toward scientific advancements
Access to domestic public funding
Very Somewhatimportant important
Source: Economist Intelligence Unit survey.
62 36
68 29
57 39
52 43
47 46
46 41
51 34
34 48
35 39
22 47
20 45

20 © The Economist Intelligence Unit 2008
A time for new ideas Innovation in Central Eastern Europe and Turkey
Ms Popp. “Co-operation and integration is the name of the
game,” responds Mr Havas. In Poland, innovation policy is split between the Ministry for the Economy and the Ministry of Science and Higher Education, which can blur accountability. As a result, officials often pay lip service to the EU’s Lisbon Agenda and other innovation strategies—and become preoccupied instead with disbursing structural funds, notes Dariusz Drewniak, director of Poland’s Department of Strategy and Development of Science. Structural funds are big business in Poland, with some €4bn earmarked for R&D in coming years, and civil servants who work on structural funds are paid more than others, he notes.
The introduction of e-government is a good example of unfulfilled potential. Its introduction in Poland has been slow, possibly because it is harder to implement in a large country or because officials are unfamiliar with the process or fear for their jobs. But even where it is well administered, as in Estonia, there can be unintended—and not always positive—consequences. According to Ms Popp, IT firms become heavily dependent on state contracts and do not try to export. “The only IT companies that do export are ones that have failed to obtain big public-sector contracts—that is, the losers.”
Unsurprisingly, our survey reveals a mixed view of
the state’s role, with 48% overall viewing government as being somewhat supportive, and 41% saying it is unsupportive. The rest are divided evenly between actively obstructive or very supportive.
For Ziga Turk, the Slovenian minister for growth, the government’s role is about “making the environment more business-friendly through tax cuts and the like”. Darij Kreuh, founder of Ekliptik, a Slovenian company that developed a modern micro-positioning sensor to treat bone fractures, recalls that it took 18 months to go from a blank sheet of paper to the market. “We had underestimated the time taken by the bureaucratic procedures,” he admits. In Poland too, officials admit that rules, for example, on tax benefits given to firms that achieve the status of R&D centres have been too bureaucratic and too demanding. In Hungary, a recently created ministry responsible for R&D should streamline the process, and more policy initiatives are promised.
Slovenia’s recently established Government Competitiveness Council may help the government better focus its support. According to Mr Turk, the council aims “to identify the niches of both scientific excellence and business potential, improve the financial environment for high-tech companies and the organisational framework of the R&D sector”. He comments: “Until now, government policies on R&D
5
48
41
4
2
Very supportive
Somewhat supportive
Not supportive
Actively obstructive
Don’t know
How supportive of private sector innovation is your home country’s government? (% respondents)
Source: Economist Intelligence Unit survey.
How do you expect the innovation environment in your home country to change in the next three years? (% respondents)
Improve substantially
Improve
Remain unchanged
Worsen
Worsen substantially
Don’t know
11
66
21
2
0
1
Source: Economist Intelligence Unit survey.

© The Economist Intelligence Unit 2008 21
A time for new ideas Innovation in Central Eastern Europe and Turkey
were so broad that targeted research projects did not exist. There are also very few government-sponsored collaborative R&D projects between the industry and the universities and the institutes.”
For Biznet, a Turkish information security company, getting support is vital. “For a company of our size with a turnover of $2-3m it’s difficult; you need support until you reach the production stage” says Haluk Aydin, one of the company’s partners. “We can get almost 60% of our project expenditures as a grant…but the procedure takes about a year and a half. In the meantime, you have to finance yourself.” He adds that ‘business angels’ “don’t exist”.
Scaling the ivory towers: working with universities Biznet is based at the Middle East Technical University’s “technopolis” (teknokent) ın Ankara, one of 32 technoparks set up on campuses in Turkey aimed at providing valuable resources, advice and synergies for innovative companies. But despite some recent attention by government, more needs to be done to promote relationships between companies and universities and other academic institutions in CEE and Turkey. If CEE could develop national systems of innovation—a huge challenge—the MNCs might
adapt and assimilate this potential to locate their global R&D networks in the EU10. These hopefully would involve multiple linkages into the domestic economy, including both R&D organisations and local companies. It would also help local firms to develop their own innovation capacity, which shows promise but remains marginal to the region’s economic prospects for now. If that does not happen, growth will inevitably falter, because weak domestically owned sectors will not be able to access and assimilate the technology they need to sustain rapid productivity growth. In terms of the EU’s Lisbon Strategy, the new member states will be marooned on the periphery of the new European knowledge economy.
Ms Popp notes: “Ideally, highly skilled graduate personnel should be used to channel university and institute R&D to companies. But when academic institutions insist that everything belongs to them, this leaves little incentive to staff to innovate, or report their innovations.” In general, universities and institutes remain tethered to academic research, despite government attempts to broaden horizons and support business. Rok Ursic, a Slovenian electrical engineer who founded Instrumentation Technologies, a particle accelerator firm (see case study), recounts how the physicists he came across were disconnected
13
42
23
10
2
10
Excellent
Good
Poor
Very poor
Don’t know
Not applicable; my company doesn’t have relationships with universities/academic institutes in CEE
5
36
29
12
2
17
Excellent
Good
Poor
Very poor
Don’t know
Not applicable; my company doesn’t have relationships with universities/academic institutes in CEE
How would you characterise your firm’s relationships with universities/academic institutes in CEE? (% respondents)
Domesticfirms
Foreignfirms
Source: Economist Intelligence Unit survey.

22 © The Economist Intelligence Unit 2008
A time for new ideas Innovation in Central Eastern Europe and Turkey
and out of date with other technical specialisations, a shortcoming that he, of course, managed to exploit.
The Polish Academy of Sciences is still heavily concentrated on basic research and its links with business are weak. Some 190 branch institutes are spread around different ministries, but for political reasons it can be hard to wield the axe, according to officials. Nevertheless, consolidation lies ahead, with new legislation aiming to bring some 80 institutes together and develop 20 special centres, with some to be privatised and others closed down.
There has been progress. In Hungary, legislation passed in 2004 that allows universities to patent and commercialise their research findings has been “a real boon to biotechnology and high-tech start-ups”, notes Mr Duda, founder of Solvo. “When we started the Hungarian Biotechnology Association in 2002, we could barely find ten members. This year we should pass the 100 mark, and many are start-ups.” In Romania, in a rare show of cross-party unity, a new National Pact for Education was adopted, outlining
eight key objectives, including increased spending in the 2008-13 period.
Local firms are more dependent than foreign investors on local academic institutions. Some 55% of domestic firms in our survey said that they enjoyed a positive relationship, of which 13% said the relationship was excellent. This compares favourably with the experience of foreign investors, where only 5% could boast of excellent relationships and only a further 36% said relations were good.
Tax and spendTaxation policy as it relates to innovation-led companies seems to raise hackles region-wide. Mr Duda of Solvo believes that the tax system is hopeless for start-up companies with a high-cost, professional workforce. “They offer a corporate tax break: I don’t care about the 16% corporate tax. I don’t mind paying that when we are making a profit. But what we need is a system that grants young innovative company (YIC) status. This would reduce the burden of personal taxes
Slovenia: trials and errors
Slovenia claims to be a regional leader when it comes to innovation. Given the country’s small size and relatively low penetration of foreign capital, it is often overlooked. But Slovenia has a high-skilled workforce, solid business infrastructure and the highest GDP per head in the region, all of which has supported innovation, especially in high-tech clusters around the capital, Ljubljana, and the second city, Maribor.
Ziga Turk, minister for growth, reaffirms that innovation in the IT and other industries is vital for competitiveness, and insists that the government supports this by promoting an e-economy. “The moves towards e-government have enabled a very high percentage of the population to get acquainted with the Internet, and have been a great support to the IT industry providers.”
Mr Turk also points to the Resolution on National Development Projects 2007-23, which lays out a framework for nine regional economic growth centres
emphasising innovation and entrepreneurship, as well as specialised projects in such areas as nuclear and hydrogen energy. The government is also planning to establish a new science park in Maribor. “The quality of the thinking, enthusiasm and co-operation here in Maribor is really first-class. The [planned] science park will have all the trappings for success,” says John Allen, former head of the Manchester Science Park (UK) and consultant to the Maribor science park project.
Yet not everyone is enamoured with the government’s performance. Mateja Majcen, sales and marketing director at Ekliptik, which invented a new bone surgery process, points out that “Slovenia is a great place for innovation, but, because innovation is not [generally] well supported by the government or venture capitalists, this is difficult. It is hard to get starting capital, and entrepreneurs with technical skills lack the finance, law and business knowledge for starting a business. The government should streamline the bureaucratic procedures needed for start-ups, and make it cheaper.”

© The Economist Intelligence Unit 2008 23
A time for new ideas Innovation in Central Eastern Europe and Turkey
and social security payments when the company needs it, in the first few years. It’s even difficult to offset company ‘staff bonding’ trips as genuine expenses.”
Recent proposals in Hungary to reduce tax and social security contributions by some 10-12% from 2009 for companies with fewer than ten employees have been given a cautious welcome. Gabor Szabo, chairman of the Hungarian Innovation Association, comments: “High total wage costs are one of the central problems, so any initiative in this direction is warmly welcome. On the other hand, this alone cannot solve the problems of YICs. We need a special package for them. Discussions started almost two years ago, but [so far] with no tangible results.”
Perhaps more damaging, in terms of long-term development, are woefully inadequate rules on staff share options—a common complaint in the region—whereby recipients must pay capital gains immediately on receiving shares, not on their sale. Stock options have been a useful device for rewarding staff in fast-growing firms where cashflow is insufficient to compensate top talent, as witnessed during the US Internet boom. Zootfly, which bills itself as Slovenia’s sole computer game design company, even had to offer a purely verbal pledge to many of its 40 staff to offer stock in four years’ time when the company’s venture capital backers want to exit—calling on a remarkable level of trust from staff.
Recently passed legislation will provide companies
with tax-friendly profit-sharing schemes for employees in the form both of direct bonus payments and offers of shares, according to Mirko Music, a venture capital consultant based in Ljubljana. However, Mr Music notes that the new legislation “appears shaped mostly for large companies already on the stock exchange”, in which case the laws will fail to address the needs of start-ups.
To this litany of complaints about tax and bureaucracy, Les Nemethy, managing director of Euro-Phoenix, a Hungarian financial advisory company, adds that intellectual property rights are still an issue in CEE. “The laws are there, but enforcement is a different issue. For example, enforcement of confidentiality clauses and non-compete agreements is more difficult than in western Europe. Hence there is far greater caution in sharing information.”
Mr Duda’s overall verdict on government in Hungary is also mixed: “The Economy Ministry is really open, flexible, seeking to help—and has done. The Ministry of Finance [has] deaf ears—they won’t talk to us. The Ministry of Regional Development (which controls funding) is in the middle. We made a bunch of proposals; they’ve implemented half, I’d guess.” For others, the answer is perhaps simpler. Asked what he would like his government to do to support hi-tech start-ups, Bostjan Troha, co-founder and chief executive of Zootfly, replied: “Nothing; just leave us alone to get on with it.”

24 © The Economist Intelligence Unit 2008
A time for new ideas Innovation in Central Eastern Europe and Turkey
Turkey: harnessing creativity
In many ways, Turkey stands in striking contrast to the former communist countries of Central Eastern Europe. Its population is expanding, but remains largely poor and poorly-educated and is mainly rural or concentrated in far-flung provinces, urban slums or city peripheries. Yet it has a long history of private enterprise and a diverse manufacturing base. As well as a vast stand-ing army of small and micro-enterprises, it boasts a vanguard of larger firms that oper-ate variously as subsidiaries, partners, licen-sees, suppliers and often rivals to foreign multinational companies.
In the mid-1990s, when Turkey entered into a customs union with the EU—which came with customs-free EU imports and low-tariffs for the rest of the world—the country’s lagging, low-tech industries appeared vulnerable to competition. But Turkish firms demonstrated the will and wisdom to survive and prosper, taking advantage of global relocation and outsourcing trends, and in little over a decade increased the dollar value of the country’s exports fivefold to $100bn. However, the limits of growth based on low labour costs—eroded by the recent appreciation of the Turkish lira—have become increasingly apparent. Warning signs include: a current account deficit widening to 6% of GDP; contracting television exports as the competition embraces new screen technologies; and parts of a textiles and clothing industry that have been battered by competition from China, following its entry into the World Trade Organisation.
The government has taken note. Since 2000, it has actively promoted indigenous research and development (R&D). Total public support for science, technology and innovation as estimated by the Turkish Scientific and Technical Research Council (TUBITAK) which disburses much of the
money has risen fourfold in 2002-06, stabilising in 2007 at YTL1.26bn ( 700m). In February 2008, parliament approved a range of tax breaks under a new Research and Development Act. The government is also looking to favour innovative companies in public procurement tenders, and to foster innovative clusters in key cities away from the wealthier west of the country. Indeed, Turkey may even be overstepping EU limits on state support for commercial R&D, particularly for larger companies. Non-government organisations are also playing a role, supporting innovative projects by spreading awareness and sharing information.
Local creativity is strongMany firms have not waited for public assist-ance. Household durables and electronic goods manufacturer Arcelik and its sister company Beko have taken a lead in both R&D expenditures and patent applications. Other examples of successful innovation include the “clean” paint developed by DYO using nanotechnology, and the techno-textiles of fire-proof cloth-maker Akin Tekstil. There are good examples of innovation to be found in the glass, chemicals and food sectors too, while the armed forces, in their quest for technological independence, have made good use of hardware and software advances made by the partly-private defence industry.
But for enterprises that have for decades thrived on copying the ideas of others, the concept of innovation can be hard to grasp. “Most Turkish companies are still not aware that they have to innovate to be competitive,” says Sirin Elci, director of Bilkent University’s Teknokent. “They approach innovation as a fashion.” Many of Turkey’s largest companies, especially in heavy industry, still appear to do little technical innovation. In high-tech sectors such as pharmaceuticals or IT software, Turkey is dwarfed by foreign competition.
Some are rising to the challenge though. The automotive industry, which is largely dominated by multinationals and foreign
joint ventures, has been boosting its capacity to design, co-design and engineer, rather than just reproduce or assemble. The excitement has spread to the car parts industry, which includes many local SMEs.
Yet, as in much of Central-Eastern Europe, not all foreign investors are so gung-ho about innovating locally. While some MNCs, such as Siemens or Nortel, do operate substantial R&D departments, others are reticent, not least because of Turkey’s weak intellectual property rights (IPR) protection. Although noting that legislation is in place, the EU Commission in its 2007 Progress Report concludes that “Turkey remains one of the countries in the world where IPR protection and enforcement is most problematic”.
Perhaps Turkey’s greatest weakness is in its failure to harness the technological contributions made by individual scientists and engineers and start-up and small companies. The creation of technoparks on university campuses, the availability of small public grants and loans and the provision of financial support for patent applications, is obviously welcome. But academia in general pays scant attention to industry and commerce, and access to funding is complicated by bureaucracy, delays and demands for excessive collateral. Such complaints echo those throughout Central and Eastern Europe. Similarly, in the case of small firms or start-ups in Turkey, many generate more technical ideas than have capacity to draw up projects, keep transparent accounts or market their end-products. As for finance, there are only four Turkish venture capital funds, and their impact is insignificant.
In terms of infrastructure, especially education, Turkey is lagging the CEE. The slowing economy will not help. But if the gaps (and overlaps) in the national innovation system can be identified and tackled, and the private sector learns more about the resources available, the country’s innovation indicators may yet improve in coming years.

© The Economist Intelligence Unit 2008 25
A time for new ideas Innovation in Central Eastern Europe and Turkey
The overall picture painted by the macro figures, as well as the survey results, is not particularly encouraging for CEE. It could be asked, given the region’s inevitable reliance on imported technology and MNCs, whether the CEE countries really need developed R&D sectors to support home-grown innovation.
The answer is an emphatic “yes”. CEE governments should not be tempted by the argument that, as catch-up countries, they only need to imitate and assimilate, and therefore do not need to invest in their science. There are several reasons for this. First, innovation is a major driver of economic growth for middle-income countries, not just developed economies. Second, reliance on MNCs leaves these economies vulnerable if
major foreign investors decide to relocate operations to lower-cost markets. Third, home-grown innovation that raises the value added of local production also increases the chances that global companies will locate their R&D bases in the region. And fourth, it means that the region’s economies can also develop a source of innovation that is independent of the activities of foreign multinationals.
None of this is impossible. Despite operational shortcomings, including ineffective regulations, poorly drafted tax rules, difficulty in accessing foreign markets and the ongoing struggle to attract the best brains, there are plenty of signs that local small and medium-sized start-ups in the past decade can rise to the innovation challenge.
Conclusion

26 © The Economist Intelligence Unit 2008

© The Economist Intelligence Unit 2008 27
COUNTRY DATAA time for new ideas
Innovation in Central Eastern Europe and Turkey
Country data
Estonia
Hungary
Czech Republic
Slovenia
Latvia
Lithuania
Poland
Romania
Slovakia
Russian Federation
Turkey

28 © The Economist Intelligence Unit 2008
Regulatory and policy framework
● The Organisation of Research and Development Act (1997, amended in 2002) is the main law regulating R&D in Estonia. It outlines the institutional structure and general principles of financing research, development and innovation (RDI). The country’s current RDI strategy, “Knowledge-based Estonia,” covering the years 2007-13, aims to increase total R&D expenditure to 3% of GDP by 2014, of which 1.6% is to be covered by business.
● Estonian research policy is still heavily oriented towards public universities. Targeted and grant funding is distributed to specific research groups or individual researchers on the basis of competitive applications. Most research institutions are public bodies and are tax-exempt. Companies are exempt from corporate tax on reinvested profits. A benign tax regime, openness to foreign investment, and high-quality IT and communications infrastructure are major contributors to innovation.
● Estonia has several innovation initiatives. The “Spinno” Programme, established in 2004 by the Ministry of Economic Affairs, aims to improve the environment for entrepreneurs and innovation at universities and other research institutions through the financing of new science-intensive activity. A total of €5.8m was invested in two rounds in 2001-07. The Estonian Research Information System (EITS), founded in 2006, aids co-operation between the government, science foundations, R&D institutes and international partners. It acts as an information channel for submitting and processing grant applications. There are ten national Centres of Excellence, six of which are at the University of Tartu, a research hub for biotechnology, physics, chemical and material science, computing, and molecular and clinical medicine.
Innovation inputs and performance
● Estonia’s innovation performance has been improving in recent years. Public R&D expenditure reached 94% of the EU average in 2006, although business R&D expenditure increased more slowly, reaching 0.51% of GDP. Among the CEE countries, Estonia is second only to Lithuania on new science and engineering graduates (94% of the EU average in 2005). A relatively large share of the population has a tertiary education (145% of EU average) and ICT expenditure as a share of the GDP is the highest in the region.
● Estonia boasts one of the EU’s most developed telecommunications networks, the result of early efforts to promote access to information and communications technology (ICT). Broadband penetration rate at 20% of the population is one of the highest in the CEE region. Low connectivity costs and high rates of computer literacy have led to an explosion of innovative service applications in recent years. ICT expenditure was 153% of the EU average in 2005.
● Although Estonia’s innovation outputs are still below the EU average, they are better than in most CEE countries. Estonia ranked fourth in terms of EPO patent applications, behind Slovenia, Hungary and the Czech Republic in 2003. Triad patents stood at 7% of the EU average in 2005.
Estonia
COUNTRY DATA: ESTONIAA time for new ideas Innovation in Central Eastern Europe and Turkey

© The Economist Intelligence Unit 2008 29
Country profile Estonia
2000 2001 2002 2003 2004 2005 2006 2007General data
Population (m) 1.43 1.42 1.42 1.41 1.34 1.33 1.32 1.32
GDP at PPP (US$ bn) 13.3 14.7 16.2 17.7 19.7 22.4 25.7 28.3
GDP per head, at PPP (US$) 9,733 10,773 11,887 13,068 14,599 16,641 19,123 21,060
as % of EU average 39 41 43 47 50 56 60 63
Real GDP growth (%) 9.6 7.7 8.0 7.2 8.3 10.2 11.2 7.1
Innovation inputs
Public R&D expenditure (% of GDP) 0.46 0.46 0.46 0.49 0.52 0.50 0.61 –
as % of EU average 71 71 70 74 81 77 94 –
Business R&D expenditure (% of GDP) 0.14 0.24 0.22 0.27 0.34 0.42 0.51 –
as % of EU average 12 20 18 23 29 36 44 –
New S&E graduates per 1,000 population (aged 20-29) 7.0 7.3 6.6 8.8 8.9 12.1 – –
as % of EU average 69 68 58 72 72 94 – –
Population with tertiary education per 100 population (aged 25-64) 28.9 29.8 29.6 30.4 31.5 33.3 33.3 –
as % of EU average 149 152 149 146 146 149 145 –
Broadband penetration rate (no. of broadband lines per 100 population) – – – – 7.6 11.1 16.6 20.0
as % of EU average – – – – 100 93 101 96
ICT expenditure (% of GDP) – – – 8.9 9.6 9.8 – –
as % of EU average – – – 139 150 153 – –
Innovation outputs
EPO patents (per million population) 10.6 10.5 7.8 15.5 – – – –
as % of EU average 8 8 6 12 – – – –
USPTO patents (per million population) 0.7 0.7 1.9 0.0 – – – –
as % of EU average 1 1 4 0 – – – –
Triad patents (per million population) 0.8 1.8 0.4 1.6 1.3 1.4 – –
as % of EU average 4 9 2 8 6 7 – –
2003-07 Global rank EU rank 2008-2012 Global rank EU rank Economist Intelligence Unit innovation indices
Output index (based on patents) 6.75 29 16 7.09 31 16
Innovation inputs 7.34 26 14 7.69 24 12
Direct inputs 7.31 28 17 7.63 27 15
Innovation environment 7.41 19 10 7.87 13 7
Sources: Eurostat; OECD; World Bank: Economist Intelligence Unit
COUNTRY DATA: ESTONIAA time for new ideas
Innovation in Central Eastern Europe and Turkey

30 © The Economist Intelligence Unit 2008
Regulatory and policy framework
● The Law on Research and Technological Innovation (2004) and the National Reform Programme for Growth and Employment 2005-08 underpin Hungary’s RDI. In addition, the government approved the mid-term science, technology and innovation policy strategy (2007-2013) in March 2007. The strategy sets several targets to be reached by 2010 and 2013, including public R&D expenditure to reach 1.8% of GDP and business expenditure to rise to 0.9% of GDP by 2013.
● The National Office for Research and Technology (NKTH) plays a key role in developing and implementing Hungary’s science, technology and innovation policies. It is financed by the Research and Technology Innovation Fund, set up by the Ministry of Education in 2003. All enterprises, apart from the micro- and small firms, are required to pay at least 0.25% of turnover into the Fund. The government contributes matching funds.
● In 2001 the government introduced a scheme to promote R&D activities of companies, allowing them to deduct 200% of their R&D expenditure from taxable income. A 300% R&D tax allowance is applicable from 2004 if a company laboratory is located at a university or public research institute, thereby encouraging academic-industry co-operation.
● Hungary has six national Centres of Excellence, focusing on computer and automation research, solid state physics and optics, mathematics, experimental medicine and biological research. Four of those centres are located at the Hungarian Academy of Sciences in Budapest.
Survey highlights (35 respondents)
● Macroeconomic stability and the tax regime are seen by a clear majority of respondents (71% and 74%, respectively) as ‘very important’ factors in driving innovation in CEE. But respondents described the country’s performance in these areas as ‘weak’—one of the most significant gaps in the CEE region.
● Companies are confident of their ability to integrate the latest foreign technology: 89% see their ability to do so as either ‘good’ (54%), ‘very good’ (26%) or ‘excellent’ (9%). Over 90% of Hungarian-owned/based firms have a formal structure in place to support innovation and more than one-half of respondents have dedicated R&D facilities in the country.
Innovation inputs and performance
● In 2006 public and business R&D expenditure combined reached only about 1% of GDP. ICT expenditure was relatively high in 2005, at 8.1% of GDP, or 127% of the EU average.
● Hungary lacks new science and engineering graduates and its share of the EU average (40% in 2005) has not increased in recent years. The proportion of the population with a tertiary education is also relatively low. Nevertheless, with 18.9 EPO patents per million population (in 2003), Hungary outperforms the Czech Republic and comes second to Slovenia in the CEE region. USPTO patents stood at 7% of the EU average in 2003 and triad patents accounted for 9% of the EU average in 2005.
Hungary
COUNTRY DATA: HUNGARYA time for new ideas Innovation in Central Eastern Europe and Turkey
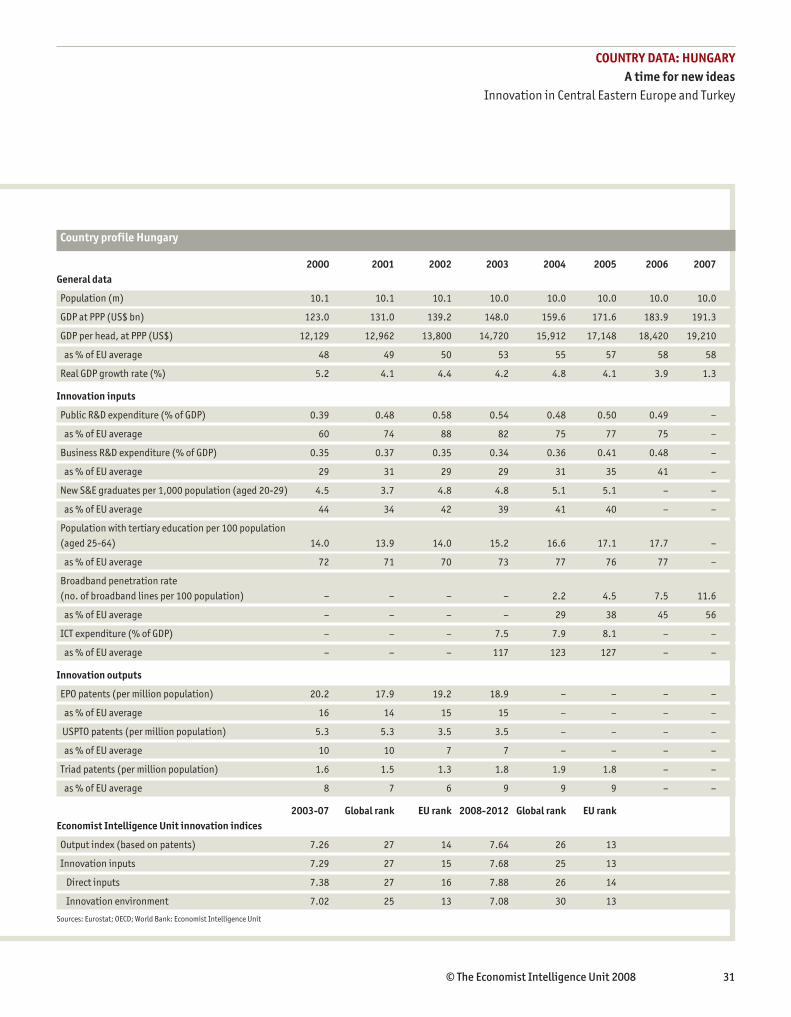
© The Economist Intelligence Unit 2008 31
Country profile Hungary
2000 2001 2002 2003 2004 2005 2006 2007General data
Population (m) 10.1 10.1 10.1 10.0 10.0 10.0 10.0 10.0
GDP at PPP (US$ bn) 123.0 131.0 139.2 148.0 159.6 171.6 183.9 191.3
GDP per head, at PPP (US$) 12,129 12,962 13,800 14,720 15,912 17,148 18,420 19,210
as % of EU average 48 49 50 53 55 57 58 58
Real GDP growth rate (%) 5.2 4.1 4.4 4.2 4.8 4.1 3.9 1.3
Innovation inputs
Public R&D expenditure (% of GDP) 0.39 0.48 0.58 0.54 0.48 0.50 0.49 –
as % of EU average 60 74 88 82 75 77 75 –
Business R&D expenditure (% of GDP) 0.35 0.37 0.35 0.34 0.36 0.41 0.48 –
as % of EU average 29 31 29 29 31 35 41 –
New S&E graduates per 1,000 population (aged 20-29) 4.5 3.7 4.8 4.8 5.1 5.1 – –
as % of EU average 44 34 42 39 41 40 – –
Population with tertiary education per 100 population (aged 25-64) 14.0 13.9 14.0 15.2 16.6 17.1 17.7 –
as % of EU average 72 71 70 73 77 76 77 –
Broadband penetration rate (no. of broadband lines per 100 population) – – – – 2.2 4.5 7.5 11.6
as % of EU average – – – – 29 38 45 56
ICT expenditure (% of GDP) – – – 7.5 7.9 8.1 – –
as % of EU average – – – 117 123 127 – –
Innovation outputs
EPO patents (per million population) 20.2 17.9 19.2 18.9 – – – –
as % of EU average 16 14 15 15 – – – –
USPTO patents (per million population) 5.3 5.3 3.5 3.5 – – – –
as % of EU average 10 10 7 7 – – – –
Triad patents (per million population) 1.6 1.5 1.3 1.8 1.9 1.8 – –
as % of EU average 8 7 6 9 9 9 – –
2003-07 Global rank EU rank 2008-2012 Global rank EU rank Economist Intelligence Unit innovation indices
Output index (based on patents) 7.26 27 14 7.64 26 13
Innovation inputs 7.29 27 15 7.68 25 13
Direct inputs 7.38 27 16 7.88 26 14
Innovation environment 7.02 25 13 7.08 30 13
Sources: Eurostat; OECD; World Bank: Economist Intelligence Unit
COUNTRY DATA: HUNGARYA time for new ideas
Innovation in Central Eastern Europe and Turkey

32 © The Economist Intelligence Unit 2008
Regulatory and policy framework
● The National Innovation Policy for 2005-10 underlies state policy towards R&D and innovation. It aims to raise public expenditure on R&D to 1% of GDP by 2010, focusing on industrial research. Private R&D expenditure is to be increased to 2% of GDP. A National Strategic Reference Framework (NSRF) sets out plans to invest 26.3bn of EU funds by 2013 in line with the Lisbon Strategy.
● Czech R&D support mainly involves block funding for public R&D institutions (universities and the Czech Academy of Sciences) and competitive grants. Institutional funding is channelled through the Ministry of Education, Youth and Sports, and the budget of the Czech Academy of Science, with other ministries distributing smaller budgets. There is tax relief on private-sector R&D spending.
● CzechInvest, the country’s inward investment agency, facilitated the establishment of 94 technology centres for science and research to improve products and technologies. Two of the main programmes launched by CzechInvest are the Klastry (Clusters) programme involving companies and higher education/research organisations aimed at improving competitiveness; and the Prosperita (Prosperity) programme, which supports 16 science and technology parks, 20 incubators and 11 centres of technology transfer.
Survey highlights (38 respondents)
● Despite government programmes aimed at improving competitiveness, 61% of Czech-based respondents saw the government as being only somewhat supportive and 32% said it is not supportive of private-sector innovation.
● However, 89% of Czech-based respondents said that their company has a formal procedure/structure in place to support innovation. Of those, 44% said that they have a dedicated team responsible for innovation.
Innovation inputs and performance
● Public expenditure in R&D as a percentage of GDP has been stable since 2000. Public spending on R&D was just over 0.5% of GDP in 2006; business R&D expenditure rose above 1% of GDP for the first time, better than most CEE countries and four of the EU15. The country lags its EU neighbours in numbers of new science and engineering graduates, and those with a tertiary education. The broadband penetration rate stood at 59% of the EU average in 2007.
● Patent applications to the European Patent Office were 12% of the EU average in 2003, and triad patents applied were 5% of the EU average for the four years to 2005.
Czech Republic
COUNTRY DATA: CZECH REPUBLICA time for new ideas Innovation in Central Eastern Europe and Turkey

© The Economist Intelligence Unit 2008 33
Country profile Czech Republic
2000 2001 2002 2003 2004 2005 2006 2007General data
Population (m) 10.3 10.3 10.3 10.2 10.2 10.2 10.2 10.2
GDP at PPP (US$ bn) 152.8 160.3 166.2 175.9 189.1 207.6 227.8 248.9
GDP per head, at PPP (US$) 14,878 15,688 16,208 17,158 18,451 20,271 22,253 24,336
as % of EU average 59 59 59 62 63 68 70 73
Real GDP growth (%) 3.6 2.5 1.9 3.6 4.5 6.4 6.4 6.5
Innovation inputs
Public R&D expenditure (% of GDP) 0.48 0.48 0.47 0.48 0.46 0.50 0.52 –
as % of EU average 74 74 71 73 72 77 80 –
Business R&D expenditure (% of GDP) 0.73 0.72 0.73 0.76 0.80 0.92 1.02 –
as % of EU average 60 60 60 64 68 79 87 –
New S&E graduates per 1,000 population (aged 20-29) 5.5 5.6 6.0 6.4 7.4 8.2 – –
as % of EU average 54 52 53 52 60 64 – –
Population with tertiary education per 100 population (aged 25-64) 11.5 11.6 11.8 11.9 12.3 13.1 13.5 –
as % of EU average 59 59 59 57 57 58 59 –
Broadband penetration rate (no. of broadband lines per 100 population) – – – – 0.7 4.3 8.4 12.2
as % of EU average – – – – 9 36 51 59
ICT expenditure (% of GDP) – – – 6.5 6.5 6.6 – –
as % of EU average – – – 102 102 103 – –
Innovation outputs
EPO patents (per million population) 10.4 11.3 12.0 15.9 – – – –
as % of EU average 8 9 10 12 – – – –
USPTO patents (per million population) 2.8 2.8 3.5 3.2 – – – –
as % of EU average 5 5 7 6 – – – –
Triad patents (per million population) 0.6 0.9 1.0 1.1 1.1 1.1 – –
as % of EU average 3 4 5 5 5 5 – –
2003-07 Global rank EU rank 2008-2012 Global rank EU rank Economist Intelligence Unit innovation indices
Output index (based on patents) 6.83 28 15 7.04 32 17
Innovation inputs 7.41 25 13 7.62 27 15
Direct inputs 7.75 25 14 7.94 25 13
Innovation environment 6.38 40 17 6.66 44 19
Sources: Eurostat; OECD; World Bank: Economist Intelligence Unit
COUNTRY DATA: CZECH REPUBLICA time for new ideas
Innovation in Central Eastern Europe and Turkey

34 © The Economist Intelligence Unit 2008
Policy highlights
● As holder of the EU rotating presidency (January-June 2008) Slovenia prioritised the European Research Area (ERA) as part of the so-called Ljubljana Process. Key projects on R&D include Joint Technology Initiatives (JTIs); further development of the European Institute of Innovation and Technology (EIT); and improvements to the research infrastructure of the Western Balkans, particularly laboratory facilities.
● In August 2007, the European Commission agreed innovation funding through the European Regional Development Fund (ERDF) of €1.71bn for 2007-13. In line with the Lisbon Strategy, targets have been set to raise the share of innovative companies from 21% to 44%, and increase the employment rate by 1.7%.
● There are ten EU-funded Centres of Excellence focused on research in biotechnology, nanosciences, advanced materials and other emerging technologies. Slovenia’s Network of Excellence, the Slovenian ICT Technological Network, comprises 30 companies and institutions, based mainly in the capital, Ljubljana.
● A recently established Government Competitiveness Council aims to identify key areas of scientific excellence and business potential, improve the financial environment for high-tech companies and the organisational framework of the R&D sector.
● The Resolution on National Development Projects for the period 2007-23 lays out a framework for nine regional “Economic Growth Centres” focusing on innovation and entrepreneurship, as well as specialised projects in such areas as nuclear and hydrogen energy.
● A 20% deduction in corporate income tax is available to businesses investing in R&D. The Slovenian Entrepreneurship Fund supports loan guarantees and subsidies for small and medium-sized enterprises (SMEs) investing in new technology.
● “Slovenia Your Cooperation Partner—(SYCP)”, a quasi-government organisation linking business, research and education bodies, supports co-operation in research, technological development and innovation, and is the first system of its kind in the EU.
Innovation inputs and performance
● Inputs are high for the region. The country spends the highest proportion of GDP on R&D: after a slowdown in 2003 and 2005, public expenditure on R&D was 0.63% of GDP in 2006 (97% of the EU average); private-sector R&D expenditure was 0.96% (82% of the EU average). The broadband penetration rate is higher than the regional average; the number of new science and engineering graduates and ICT expenditure is below average.
● Slovenia performs particularly strongly on innovation outputs. In 2002-03 Slovenian patent applications to the EPO per million population outnumbered those from its closest rival, Hungary, by almost 3 to 1. Over the 2003-07 period, the ratio is 2 to 1. USPTO and triad patents stood at 13% of the EU average in 2003 and 2005, respectively.
Slovenia
COUNTRY DATA: SLOVENIAA time for new ideas Innovation in Central Eastern Europe and Turkey

© The Economist Intelligence Unit 2008 35
Country profile Slovenia
2000 2001 2002 2003 2004 2005 2006 2007General data
Population (m) 2.0 2.0 2.0 2.0 2.0 2.0 2.0 2.0
GDP at PPP (US$ bn) 34.1 36.0 37.9 39.8 42.8 46.0 50.2 54.7
GDP per head, at PPP (US$) 16,944 17,883 18,857 19,799 21,275 22,877 24,960 27200
as % of EU average 67 68 69 71 73 76 79 82
Real GDP growth (%) 4.1 3.1 3.7 2.8 4.4 4.1 5.7 6.1
Innovation inputs
Public R&D expenditure (% of GDP) 0.61 0.63 0.59 0.47 0.48 0.35 0.63 –
as % of EU average 94 97 89 71 75 54 97 –
Business R&D expenditure (% of GDP) 0.80 0.90 0.91 0.84 0.97 0.87 0.96 –
as % of EU average 66 74 75 71 83 74 82 –
New S&E graduates per 1,000 population (aged 20-29) 8.9 8.2 9.5 8.7 9.3 9.8 – –
as % of EU average 87 76 84 71 75 76 – –
Population with tertiary education per 100 population (aged 25-64) 15.7 14.1 14.8 17.7 18.8 20.2 21.4 –
as % of EU average 81 72 74 85 87 90 93 –
Broadband penetration rate (no. of broadband lines per 100 population) – – – – 3.8 7.8 11.4 15.3
as % of EU average – – – – 50 65 69 74
ICT expenditure (% of GDP) – – – 5.0 5.2 5.4 – –
as % of EU average – – – 78 81 84 – –
Innovation outputs
EPO patents (per million population) 36.1 29.4 52.1 50.4 – – – –
as % of EU average 28 23 42 39 – – – –
USPTO patents (per million population) 11.9 11.9 5.3 7.0 – – – –
as % of EU average 23 23 10 13 – – – –
Triad patents (per million population) 1.8 1.7 2.6 2.5 3.0 2.7 – –
as % of EU average 9 8 13 12 14 13 – –
2003-07 Global rank EU rank 2008-2012 Global rank EU rank Economist Intelligence Unit innovation indices
Output index (based on patents) 7.68 24 12 7.86 24 12
Innovation inputs 7.16 28 16 7.34 29 17
Direct inputs 7.50 26 15 7.56 29 17
Innovation environment 6.16 46 20 6.68 43 18
Sources: Eurostat; OECD; World Bank: Economist Intelligence Unit
COUNTRY DATA: SLOVENIAA time for new ideas
Innovation in Central Eastern Europe and Turkey

36 © The Economist Intelligence Unit 2008
Regulatory and policy framework
● The National Development Plan for 2007-13 is the main national medium-term planning document aimed at promoting education and technological excellence for economic growth. It targets an annual increase of financing for research activity of no less than 0.15% of GDP annually until the state funding reaches 1% of GDP.
● The government finances research and infrastructure in higher education establishments through block grants, competitive grants for individual research projects and institutional funding. There are currently no tax incentives for research and development.
● Science-industry collaboration is weak. The most successful partnerships between business, universities and R&D institutions are in the fields of pharmaceuticals, information technologies and new materials. In 2005 the Ministry of Economics launched a programme to support technology transfer with contact points at research institutions, with six technology transfer offices established so far.
● Some two-thirds of Latvian companies work in cluster-like business environments, one of the highest concentrations in the region. The first technology-oriented business structures were established as early as 1993. Today, the country has three innovative business support institutions: The Latvian Technological Center (LTC); The Latvian Technology Park (LTP); and the Business Innovation Centre of Latvian Electronic Industry (LEBIC). Their aim is to bridge differences between higher education, scientific institutions and industry, and to provide a range of services to new SMEs.
Innovation inputs and performance
● Public and business expenditure on R&D reached a combined 0.7% of GDP in 2006, well below the EU average. The country performs reasonably well on the number of people with a tertiary education (92% of the EU average in 2006), and ICT expenditure is almost as high as that of Estonia at 150% of the EU average in 2005.
● The development of applied research and innovative businesses and the commercialisation of scientific output suffer from insufficient public and private investment. Compared with Estonia, Latvia had less than one-half as many applications to the EPO (per million population) in 2003. USPTO patents stood at 3% of the EU average for the period 2000-03. Triad patents reached a comparatively strong 6% of the EU average in 2005.
Latvia
COUNTRY DATA: LATVIAA time for new ideas Innovation in Central Eastern Europe and Turkey
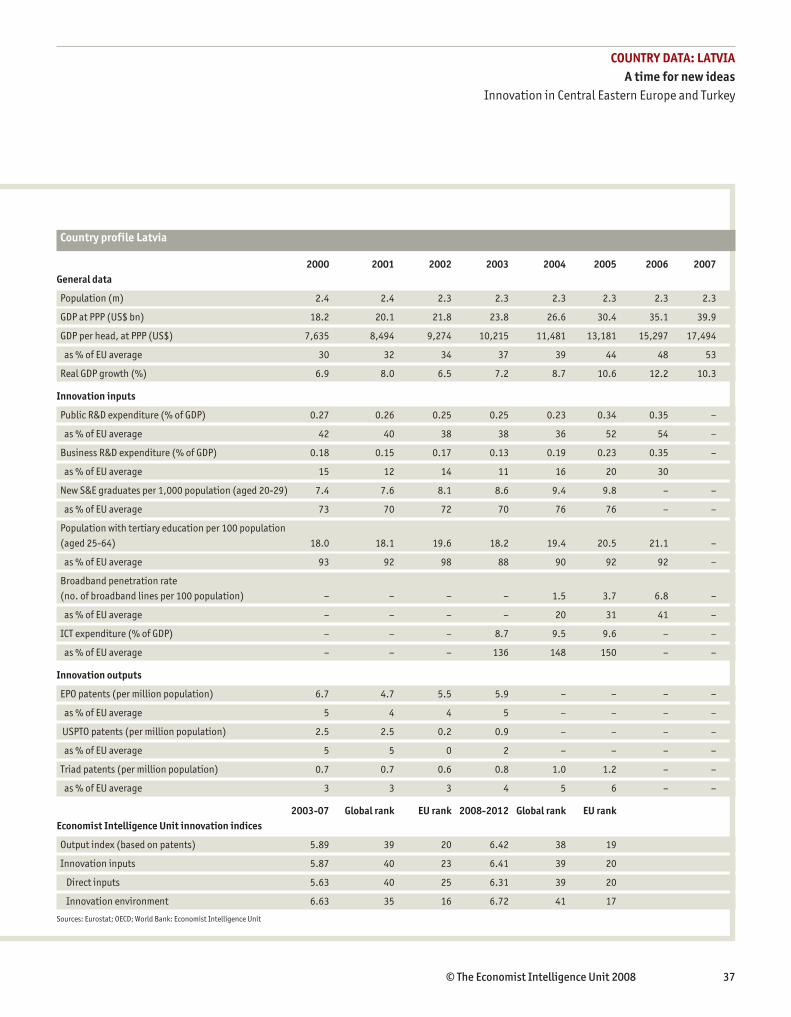
© The Economist Intelligence Unit 2008 37
Country profile Latvia
2000 2001 2002 2003 2004 2005 2006 2007General data
Population (m) 2.4 2.4 2.3 2.3 2.3 2.3 2.3 2.3
GDP at PPP (US$ bn) 18.2 20.1 21.8 23.8 26.6 30.4 35.1 39.9
GDP per head, at PPP (US$) 7,635 8,494 9,274 10,215 11,481 13,181 15,297 17,494
as % of EU average 30 32 34 37 39 44 48 53
Real GDP growth (%) 6.9 8.0 6.5 7.2 8.7 10.6 12.2 10.3
Innovation inputs
Public R&D expenditure (% of GDP) 0.27 0.26 0.25 0.25 0.23 0.34 0.35 –
as % of EU average 42 40 38 38 36 52 54 –
Business R&D expenditure (% of GDP) 0.18 0.15 0.17 0.13 0.19 0.23 0.35 –
as % of EU average 15 12 14 11 16 20 30
New S&E graduates per 1,000 population (aged 20-29) 7.4 7.6 8.1 8.6 9.4 9.8 – –
as % of EU average 73 70 72 70 76 76 – –
Population with tertiary education per 100 population (aged 25-64) 18.0 18.1 19.6 18.2 19.4 20.5 21.1 –
as % of EU average 93 92 98 88 90 92 92 –
Broadband penetration rate (no. of broadband lines per 100 population) – – – – 1.5 3.7 6.8 –
as % of EU average – – – – 20 31 41 –
ICT expenditure (% of GDP) – – – 8.7 9.5 9.6 – –
as % of EU average – – – 136 148 150 – –
Innovation outputs
EPO patents (per million population) 6.7 4.7 5.5 5.9 – – – –
as % of EU average 5 4 4 5 – – – –
USPTO patents (per million population) 2.5 2.5 0.2 0.9 – – – –
as % of EU average 5 5 0 2 – – – –
Triad patents (per million population) 0.7 0.7 0.6 0.8 1.0 1.2 – –
as % of EU average 3 3 3 4 5 6 – –
2003-07 Global rank EU rank 2008-2012 Global rank EU rank Economist Intelligence Unit innovation indices
Output index (based on patents) 5.89 39 20 6.42 38 19
Innovation inputs 5.87 40 23 6.41 39 20
Direct inputs 5.63 40 25 6.31 39 20
Innovation environment 6.63 35 16 6.72 41 17
Sources: Eurostat; OECD; World Bank: Economist Intelligence Unit
COUNTRY DATA: LATVIAA time for new ideas
Innovation in Central Eastern Europe and Turkey

38 © The Economist Intelligence Unit 2008
Regulatory and policy framework
● Building on the Long-Term Strategy for Research and Development (until 2015), the National Lisbon Strategy Implementation Programme 2005-08 and the National Reform Programme (NRP) 2007-13 are the key documents promoting RDI. The NRP aims to raise R&D expenditure to 2% of GDP by 2010—one-half of which is to come from private sources—and achieve a 20% of GDP share of high-tech industries during this period.
● The 2007 Agreement on the Basic Principles of Research and Higher Education Reform introduced competition-based funding. Two National Research Councils and the National Science Foundation have been set up to develop public-sector R&D capacity, improve conditions for business R&D, and facilitate knowledge transfer between public and private R&D. Public R&D is allocated through three major channels—institutional funding (mostly to higher education), targeted, customer-oriented R&D, and competitive R&D.
● The Ministry of Economy established 28 Technology Platforms (NTPs), corresponding thematically to the EU equivalents, to facilitate business-science co-operation. The Ministry of Education and Science initiated five Integrated Science, Study and Business Centres for the 2008-13 period, focusing on areas of existing expertise such as laser and light technologies, nanotechnologies and materials, semiconductor physics, electronics and organic electronics, civil engineering, biotechnologies, molecular medicine, and ICT, mechatronics and related electronics.
● Tax breaks on business R&D were introduced under an amended Profit Tax Law (January 2007), making R&D and patenting expenditure tax deductible. Scientific research activities (although not development or applied research) are not subjected to value added tax.
● The government recently launched its “Brain Drain Prevention Programme” in an attempt to retain and attract back its best graduates.
Innovation inputs and performance
● Public R&D expenditure (at 0.58% of GDP in 2006) is higher than in most other CEE countries, while business R&D stood at only 0.22% of GDP, but with a rapidly growing economy its share of GDP has been flat in recent years.
● Among the CEE countries, Lithuania is strong in producing new skilled science and engineering graduates. At 147% of the EU average in 2005, the country is well ahead of the other new EU member states. Lithuania also performs well on population with a tertiary education. ICT expenditure is above the EU average (122% in 2005).
● Despite this (and perhaps because of the relatively low business R&D expenditure), the country has thus far had little success in transforming innovation inputs into outputs. EPO patent applications stood at 5% of the EU average in 2003. USPTO patents dropped to 1% in 2002 and 2003 (from 3% in the preceding two years) and triad patents amounted to less than one half of one percent of the EU average in 2005.
Lithuania
COUNTRY DATA: LITHUANIAA time for new ideas Innovation in Central Eastern Europe and Turkey

© The Economist Intelligence Unit 2008 39
Country profile Lithuania
2000 2001 2002 2003 2004 2005 2006 2007General data
Population (m) 3.5 3.5 3.5 3.5 3.4 3.4 3.4 3.4
GDP at PPP (US$ bn) 29.2 31.9 34.7 39.1 43.2 48.1 53.4 59.7
GDP per head, at PPP (US$) 8,318 9,149 9,985 11,292 12,527 14,043 15,697 17,631
as % of EU average 33 35 37 41 43 47 50 53
Real GDP growth (%) 4.1 6.6 6.9 10.3 7.3 7.9 7.7 8.8
Innovation inputs
Public R&D expenditure (% of GDP) 0.47 0.48 0.55 0.53 0.60 0.61 0.58 –
as % of EU average 72 74 83 80 94 94 89 –
Business R&D expenditure (% of GDP) 0.13 0.20 0.11 0.14 0.16 0.16 0.22 –
as % of EU average 11 17 9 12 14 14 19 –
New S&E graduates per 1,000 population (aged 20-29) 13.5 14.8 14.6 16.3 17.5 18.9 – –
as % of EU average 132 137 129 134 141 147 – –
Population with tertiary education per 100 population (aged 25-64) 41.8 22.4 21.9 23.2 24.2 26.3 26.8 –
as % of EU average 215 114 110 112 112 118 117 –
Broadband penetration rate (no. of broadband lines per 100 population) – – – – 2.5 5.0 8.4 12.7
as % of EU average – – – – 33 42 51 70
ICT expenditure (% of GDP) – – – 5.9 7.0 7.8 – –
as % of EU average – – – 92 109 122 – –
Innovation outputs
EPO patents (per million population) 2.5 2.2 2.8 5.8 – – – –
as % of EU average 2 2 2 5 – – – –
USPTO patents (per million population) 1.8 1.8 0.4 0.5 – – – –
as % of EU average 3 3 1 1 – – – –
Triad patents (per million population) 0.3 0.3 0.2 1.5 0.4 0.1 – –
as % of EU average 1 1 1 7 2 0 – –
2003-07 Global rank EU rank 2008-2012 Global rank EU rank Economist Intelligence Unit innovation indices
Output index (based on patents) 5.52 50 23 5.77 57 24
Innovation inputs 6.09 34 20 6.35 42 21
Direct inputs 6.00 35 21 6.25 41 21
Innovation environment 6.37 42 18 6.65 45 20
Sources: Eurostat; OECD; World Bank: Economist Intelligence Unit
COUNTRY DATA: LITHUANIAA time for new ideas
Innovation in Central Eastern Europe and Turkey

40 © The Economist Intelligence Unit 2008
Regulatory and policy framework
● The National Development Strategy (NDS) 2007-15 underlies current government efforts towards RDI. Its first (of six) priorities is to improve competitiveness and innovativeness of the economy. A revised Innovation Strategy (2007) forecasts total R&D expenditure to rise to 1.5% of GDP by 2013, with business expenditure accounting for 0.48% of GDP.
● To support further the EU’s Cohesion Policy 2007-13, Poland developed its National Strategic Reference Framework (NSRF), containing plans to invest 67bn of EU funds over seven years, in line with the Lisbon Strategy. The Polish national cohesion strategy is to be implemented with the help of a number of operational programmes.
● The Act on Supporting Innovation Activities (2005) allows for technology credits and tax incentives. By applying for the status of R&D Centre, private businesses can benefit from certain tax incentives. However, R&D spending can only be considered as a cost eligible for deduction from annual revenue before pre-tax profits. In addition, there is tax relief on real estate used to run R&D activities, and companies can deduct up to 50% from the tax base of the estimated cost of acquiring new technology.
● Poland has 14 special economic zones (SEZs) promoting the development and use of modern technologies. There are also 41 technology parks to assist the transfer of scientific research into product development.
Survey highlights (65 respondents)
● Companies operating in Poland identify the government’s lack of support for private-sector innovation as a major problem, with 49% saying that the government is ‘not supportive’ and 6% saying that government is ‘actively obtrusive’. Characterising their firm’s relationship with universities and academic institutions, respondents based in Poland gave a slightly better assessment than in other CEE countries. However, 31% still said such a relationship is only poorly developed, while 11% said it is ‘very poor’.
● Polish-based companies are confident in their ability to integrate the latest foreign technology: 42% rated their firm’s ability on this indicator as ‘good’, 38% as ‘very good’ and 17% as ‘excellent’.
Innovation inputs and performance
● Current R&D expenditure levels suggest that Poland is far behind its target levels: public R&D expenditure was 0.38% of GDP and business R&D expenditure was a mere 0.18% of GDP in 2006, far below the EU average (58% and 15%, respectively). Poland also registers below average on the number of people with a tertiary education. Its broadband penetration rate (at 33% of the EU average in 2007) is behind Romania.
● Numbers for EPO, USPTO and triad patents applied are among the lowest of all the new EU member states and not much higher than those registered for Romania, despite higher R&D research expenditure in absolute terms. EPO patent applications stood at 3% of the EU average in 2003 and triad patent families were a consistent 1% of the EU average for the period 2000-05.
Poland
COUNTRY DATA: POLANDA time for new ideas Innovation in Central Eastern Europe and Turkey

© The Economist Intelligence Unit 2008 41
Country profile Poland
2000 2001 2002 2003 2004 2005 2006 2007General data
Population (m) 38.6 38.6 38.6 38.6 38.6 38.6 38.5 38.5
GDP at PPP (US$ bn) 394.1 408.4 421.4 447.1 484.3 518 567.5 620.5
GDP per head, at PPP (US$) 10292 10,677 11,022 11,703 12,685 13,573 14,879 16,277
as % of EU average 41 40 40 42 44 45 47 49
Real GDP growth (%) 4.3 1.2 1.4 3.9 5.3 3.6 6.2 6.5
Innovation inputs
Public R&D expenditure (% of GDP) 0.41 0.39 0.44 0.39 0.40 0.39 0.38 –
as % of EU average 63 60 67 59 63 60 58 –
Business R&D expenditure (% of GDP) 0.23 0.22 0.11 0.15 0.16 0.18 0.18 –
as % of EU average 19 18 9 13 14 15 15 –
New S&E graduates per 1,000 population (aged 20-29) 6.6 7.6 8.3 9.0 9.4 11.1 – –
as % of EU average 65 70 73 74 76 86 – –
Population with tertiary education per 100 population (aged 25-64) 11.4 11.7 12.2 13.9 15.3 16.8 17.9 –
as % of EU average 59 59 61 67 71 75 78 –
Broadband penetration rate (no. of broadband lines per 100 population) – – – – 0.5 1.9 3.9 6.8
as % of EU average – – – – 7 16 24 33
ICT expenditure (% of GDP) – – – 6.4 6.8 7.2 – –
as % of EU average – – – 100 106 113 – –
Innovation outputs
EPO patents (per million population) 3.1 3.1 4.7 4.2 – – – –
as % of EU average 2 2 4 3 – – – –
USPTO patents (per million population) 0.5 0.5 0.6 0.6 – – – –
as % of EU average 1 1 1 1 – – – –
Triad patents (per million population) 0.2 0.1 0.2 0.2 0.2 0.2 – –
as % of EU average 1 1 1 1 1 1 – –
2003-07 Global rank EU rank 2008-2012 Global rank EU rank Economist Intelligence Unit innovation indices
Output index (based on patents) 5.65 48 22 6.14 46 21
Innovation inputs 6.21 33 19 6.71 33 19
Direct inputs 6.00 35 21 6.63 36 19
Innovation environment 6.84 27 14 6.96 33 15
Sources: Eurostat; OECD; World Bank: Economist Intelligence Unit
COUNTRY DATA: POLANDA time for new ideas
Innovation in Central Eastern Europe and Turkey

42 © The Economist Intelligence Unit 2008
Regulatory and policy framework
● The National Development Plan (NDP) for Romania for 2007-13 provides the basis for all current activities in RDI. Public R&D expenditure targets 1% of GDP by 2011. In addition, the Romanian National Authority for Scientific Research estimates that private-sector R&D expenditure will reach 1% of GDP by that year.
● The 2007-13 Sectoral Operational Programme ‘Increasing Economic Competitiveness and the Knowledge-based Economy’ (SOP-IEC) includes a number of provisions on RDI policies. The programme aims to stimulate university-industry-R&D institutions partnerships, investments in the RDI infrastructure and access of enterprises, especially SMEs, to RDI activities.
● Tax incentives to support private-sector investment in RDI are underdeveloped. Flat taxes and income tax exemptions are available under certain conditions. The 2007-10 National Strategy on RDI promotes fiscal incentives for joint projects between R&D institutes and universities. Local tax exemptions for RDI activities are available in industrial and science and technology parks. The government has prioritised the creation of a National Risk Capital Fund for R&D and innovation but has taken little action to date.
Survey highlights (38 respondents)
● A majority of Romanian-based companies in the Economist Intelligence Unit’s survey have locally based dedicated R&D facilities (61%); 82% of respondents said that their firm has a formal structure in place to support innovation.
● Around one-half of all respondents with operations in Romania said that the government is ‘not supportive’ of private-sector innovation. This number rises to 59% among those based in Romania.
● Macroeconomic stability, the regulatory environment and the protection of intellectual property in driving innovation matter most to companies in Romania. However, only comparatively small numbers rank Romania’s performance on these factors as ‘strong’ (13%, 18% and 8%, respectively).
Innovation inputs and performance
● Expenditure for RDI, particularly business R&D expenditure, has been low, at less than 0.5% of GDP in 2006. Romania is on par with or just behind Slovakia in respect of the numbers of science and engineering graduates, proportion of the population with tertiary education and the broadband penetration rate. Spending on ICT was at 128% of the EU average in 2005.
● In terms of intellectual property, the country lags at only 1% of the EU average for EPO patent applications (2003); USPTO patents reached 1% of the EU average. There is no measurable activity on triadic patents.
Romania
COUNTRY DATA: ROMANIAA time for new ideas Innovation in Central Eastern Europe and Turkey

© The Economist Intelligence Unit 2008 43
Country profile Romania
2000 2001 2002 2003 2004 2005 2006 2007General data
Population (m) 22.4 22.4 21.8 21.7 21.7 21.6 21.6 21.6
GDP at PPP (US$ bn) 136.0 147.2 157.4 169.1 188.6 202.7 225.6 245.5
GDP per head, at PPP (US$) 6061 6,560 7,223 7,782 8,692 9,376 10,424 11,350
as % of EU average 24 25 26 28 30 31 33 34
Real GDP growth (%) 2.1 5.7 5.1 5.2 8.5 4.2 7.9 6.0
Innovation inputs
Public R&D expenditure (% of GDP) 0.11 0.15 0.15 0.16 0.17 0.17 0.23 –
as % of EU average 17 23 23 24 27 26 35 –
Business R&D expenditure (% of GDP) 0.26 0.24 0.23 0.22 0.21 0.20 0.22 –
as % of EU average 21 20 19 18 18 17 19 –
New S&E graduates per 1,000 population (aged 20-29) 4.9 5.3 5.8 9.4 9.8 10.3 – –
as % of EU average 48 49 51 77 79 80 – –
Population with tertiary education per 100 population (aged 25-64) 9.2 10.0 10.0 9.8 10.4 11.1 11.7 –
as % of EU average 47 51 50 47 48 49 51 –
Broadband penetration rate (no. of broadband lines per 100 population) – – – – – – – 6.6
as % of EU average – – – – – – – 36
ICT expenditure (% of GDP) – – – 6.2 7.5 8.2 – –
as % of EU average – – – 97 117 128 – –
Innovation outputs
EPO patents (per million population) 0.8 1.4 1.3 1.2 – – – –
as % of EU average 1 1 1 1 – – – –
USPTO patents (per million population) 0.1 0.1 0.4 0.3 – – – –
as % of EU average 0 0 1 1 – – – –
Triad patents (per million population) 0.01 0.01 0.02 0.03 0 – – –
as % of EU average 0 0 0 0 0 – – –
2003-07 Global rank EU rank 2008-2012 Global rank EU rank Economist Intelligence Unit innovation indices
Output index (based on patents) 5.25 53 24 5.87 53 23
Innovation inputs 5.61 46 24 6.25 45 23
Direct inputs 5.44 45 26 6.19 43 23
Innovation environment 6.13 47 21 6.43 51 23
Sources: Eurostat; OECD; World Bank: Economist Intelligence Unit
COUNTRY DATA: ROMANIAA time for new ideas
Innovation in Central Eastern Europe and Turkey

44 © The Economist Intelligence Unit 2008
Regulatory and policy framework
● In 2007 the Slovak government agreed an innovation strategy and long-term objectives for the state science and technology (S&T) policy to 2015. These documents set several key goals, including the creation of a central body for S&T, increasing overall expenditure on R&D to 1.8 % by 2015, passing innovation legislation and raising the share of innovative enterprises from 23% to 50% by 2013.
● Research funding relies almost exclusively on grants, although equity stakes in new technology firms, tax incentives and subsidised loans are also being considered. Public financial support is administered either through direct transfers and grants to the Slovak Academy of Sciences and higher education institutions or through competitive grants organised mainly by the state’s Research and Development Agency (RDA). The RDA is the major provider of public funding for R&D initiatives and favours projects in applied research, which integrate public- and private-sector participants.
● Links between the public and private sectors are fostered through the Association of Industrial Research, the Slovak Association of Scientific and Technical Societies or the so-called Houses of Technology, which offer various professional workshops, courses, seminars, symposia and congresses.
Innovation inputs and performance
● In 2006 public and business R&D expenditure combined was just below 0.5% of GDP and the business share of this expenditure stood at only 18% of the EU average.
● The number of people with a tertiary education is low compared to other CEE countries and the broadband penetration rate stood at only 38% of the EU average in 2007.
● Accordingly, innovation outputs have been quite small. On triadic patent families, Slovakia performs as badly as Romania, with 0.02 such patents per million population for every year during 2000-05. On EPO patents, the situation is slightly better, with 8.1 patent applications per million population in 2003 (6% of the EU average). That same year, USPTO patents stood at 1% of the EU average.
Slovakia
COUNTRY DATA: SLOVAKIAA time for new ideas Innovation in Central Eastern Europe and Turkey

© The Economist Intelligence Unit 2008 45
Country profile Slovakia
2000 2001 2002 2003 2004 2005 2006 2007General data
Population (m) 5.4 5.4 5.4 5.4 5.4 5.4 5.5 5.5
GDP at PPP (US$ bn) 59.5 63 67.2 71.9 77.8 85.6 95.8 108.6
GDP per head, at PPP (US$) 11,010 11,721 12,492 13,240 14,310 15,721 17,580 19,900
as % of EU average 44 44 46 47 49 52 56 60
Real GDP growth (%) 1.4 3.4 4.8 4.8 5.2 6.6 8.5 10.4
Innovation inputs
Public R&D expenditure (% of GDP) 0.22 0.21 0.20 0.26 0.26 0.25 0.28 –
as % of EU average 34 32 30 39 41 38 43 –
Business R&D expenditure (% of GDP) 0.43 0.43 0.37 0.32 0.25 0.25 0.21 –
as % of EU average 36 36 31 27 21 21 18 –
New S&E graduates per 1,000 population (aged 20-29) 5.3 7.5 7.8 8.3 9.2 10.2 – –
as % of EU average 52 69 69 68 74 79 – –
Population with tertiary education per 100 population (aged 25-64) 10.2 10.7 10.8 11.6 12.8 14.0 14.5 –
as % of EU average 53 54 54 56 59 62 63 –
Broadband penetration rate (no. of broadband lines per 100 population) – – – – 0.4 1.5 4.0 6.9
as % of EU average – – – – 5 13 24 38
ICT expenditure (% of GDP) – – – 6.4 6.5 6.7 – –
as % of EU average – – – 100 102 105 – –
Innovation outputs
EPO patents (per million population) 7.2 4.3 7.7 8.1 – – – –
as % of EU average 6 3 6 6 – – – –
USPTO patents (per million population) 1.3 1.3 0.6 0.4 – – – –
as % of EU average 2 2 1 1 – – – –
Triad patents (per million population) 0.02 0.02 0.02 0.02 0.02 0.02 – –
as % of EU average 0 0 0 0 0 0 – –
2003-07 Global rank EU rank 2008-2012 Global rank EU rank Economist Intelligence Unit innovation indices
Output index (based on patents) 6.26 36 19 6.25 41 20
Innovation inputs 6.84 29 17 6.82 30 18
Direct inputs 6.88 30 19 6.81 32 18
Innovation environment 6.72 30 15 6.84 37 16
Sources: Eurostat; OECD; World Bank: Economist Intelligence Unit
COUNTRY DATA: SLOVAKIAA time for new ideas
Innovation in Central Eastern Europe and Turkey

46 © The Economist Intelligence Unit 2008
Regulatory and policy framework
● The Russian Federation launched its new six-year research programme in 2007 with a €5.6bn budget. The government aims to achieve several specific, innovation-related targets by 2015, including raising gross domestic expenditure on R&D to 2.5% of GDP and increasing the ratio of business expenditure on R&D to 70% of the total.
● In March 2006 the Russian government approved a programme to create new technoparks and scientific research organisations. According to the programme, eight industrial technoparks will have been built by 2012. Key research priorities are energy, the environment, biotechnologies, information and communication technologies, nanotechnologies and transport. Through the creation of the Permanent Partnership Council (PPC), Russia co-operates closely with the EU in promoting joint research activities in areas of common interest.
● The e-government programme (eRussia) and special economic zones (SEZs) are intended to promote further ICT growth, the major driver of which is currently the software outsourcing market. In the SEZs, limited tax incentives are granted to companies conducting R&D activities. St Petersburg is one of Russia’s IT hubs (share of Russian IT exports at 30%) and a number of foreign companies, including EMC, Alcatel, Hewlett-Packard, Sun Microsystems and Intel, have opened R&D centres there.
Survey highlights (63 respondents)
● Although many Russian businesses do not yet invest in R&D and have no clear innovation strategy to date, most (61%) expect their R&D investment to increase over the next three years, and 17% said it will increase significantly.
● The survey points to poorly developed co-operation between industry and higher education; 30% of respondents described such a relationship as ‘poor’, 14% as ‘very poor’, and 19% said such a relationship does not exist.
● The commercialisation of new ideas in research institutions is also held back by the lack of consistent and clear rules on the ownership, management and protection of intellectual property. The survey finds that firms operating in Russia see the regulatory environment, the tax regime and the protection of intellectual property as important factors in driving innovation in CEE countries, but 70% of respondents operating in the country describe the policy environment on these issues as ‘weak’.
Innovation inputs and performance
● In recent years, R&D expenditure has grown strongly in absolute terms, but has been outpaced by the rapid expansion of GDP. In 2006 the combined public and business expenditure for R&D stood at just over 1% of GDP, with business expenditure double that of public expenditure.
● Russia’s innovation potential is probably greater than that of most countries at comparable levels of GDP per head. It has a large science base, human capital endowments and low labour costs. The number of people with a tertiary education still stands at more than twice the EU average. However, the broadband penetration rate (10% of EU average in 2006) is low compared with the new EU member states.
● There is, to date, a significant gap between public and business investments in R&D and observed innovation outputs. There were only 1.3 patent applications per million population to the EPO in 2003 and the numbers have shown no significant improvement since 2000. USPTO and triad patents applied stood at 3% and 2% of the EU average, respectively, in 2003.
Russian Federation
COUNTRY DATA: RUSSIAN FEDERATIONA time for new ideas Innovation in Central Eastern Europe and Turkey

© The Economist Intelligence Unit 2008 47
Country profile Russian Federation
2000 2001 2002 2003 2004 2005 2006 2007General data
Population (m) 146.6 146.0 145.3 144.6 143.8 143.1 142.6 142.4
GDP at PPP (US$ bn) 1115.4 1200.5 1278.8 1401.4 1545.5 1697.5 1880.7 2087.2
GDP per head, at PPP (US$) 7609 8,224 8,801 9,694 10,746 11,861 13,190 14,660
as % of EU average 30 31 32 35 37 40 42 44
Real GDP growth (%) 10.0 5.1 4.7 7.3 7.2 6.4 7.4 8.1
Innovation inputs
Public R&D expenditure (% of GDP) 0.31 0.35 0.37 0.40 0.35 0.34 0.36 –
as % of EU average 48 54 56 61 55 52 55 –
Business R&D expenditure (% of GDP) 0.74 0.83 0.87 0.88 0.79 0.73 0.72 –
as % of EU average 61 69 72 74 68 62 62 –
New S&E graduates per 1,000 population (aged 20-29) – – 10.4 10.9 10.8 11.5 – –
as % of EU average – – 92 89 87 89 – –
Population with tertiary education per 100 population (aged 25-64) 56.1 57.4 55.9 52.0 51.0 52.0 – –
as % of EU average 289 293 281 250 235 232 – –
Broadband penetration rate (no. of broadband lines per 100 population) – – – – 0.6 1.2 1.7 –
as % of EU average – – – – 8 10 10 –
ICT expenditure (% of GDP) – – 3.8 3.8 3.7 3.6 – –
as % of EU average – – 58 59 58 56 – –
Innovation outputs
EPO patents (per million population) 1.5 1.6 1.3 1.3 – – – –
as % of EU average 1 1 1 1 – – – –
USPTO patents (per million population) 1.8 1.7 1.6 1.5 – – – –
as % of EU average 3 3 3 3 – – – –
Triad patents (per million population) 0.4 0.4 0.4 0.4 – – – –
as % of EU average 2 2 2 2 – – – –
2003-07 Global rank EU rank 2008-2012 Global rank EU rank Economist Intelligence Unit innovation indices
Output index (based on patents) 6.07 37 n/a 6.39 39 n/a
Innovation inputs 6.37 32 n/a 6.7 34 n/a
Direct inputs 6.88 30 n/a 7.19 30 n/a
Innovation environment 4.84 72 n/a 5.23 72 n/a
Sources: Eurostat; OECD; World Bank: Economist Intelligence Unit
COUNTRY DATA: RUSSIAN FEDERATIONA time for new ideas
Innovation in Central Eastern Europe and Turkey

48 © The Economist Intelligence Unit 2008
COUNTRY DATA: TURKEYA time for new ideas Innovation in Central Eastern Europe and Turkey
Regulatory and policy framework
● RDI policies are directed and coordinated by the Supreme Council of Science and Technology (BTYK). Its secretariat, the Scientific and Technological Research Council of Turkey (TÜBITAK), implements research programmes and is also the country’s main R&D funding body. In 2005, TÜBITAK’s budget more than trebled, reaching roughly €400 million. This came alongside a general increase in public funding for R&D. In 2005, the government disbursed €580 million. The amount allocated for 2007 stood at €670 million.
● Under the current National Innovation Strategy (2005-2010), the country aims to increase its R&D expenditure to 2% of GDP by 2010, half of which is to be covered by business. Full-time equivalent R&D personnel are to reach 40,000 by the end of the decade.
● Turkey’s largest multidisciplinary research organisation is the TÜBITAK Marmara Research Centre (TÜBITAK-MAM) located east of Istanbul. Established in 1972, it has conducted research in various fields, including ICT, energy and materials. In addition, TÜBITAK’s Research Institutes have been active developing space technology, electronics and cryptology, genetic engineering and biotechnology.
● The Technology Development Foundation of Turkey (TTGV) is a non-governmental organisation meant to bridge the gap between public RDI activities and the private sector in support of small and medium businesses. In 2006 it signed a long-term Collaboration Agreement with the European Investment Fund, the European Union’s specialised financial body for SMEs.
● The Innovation Relay Centres (IRCs) in Anatolia and Ege operate as sub-branches of the Europe-wide IRC Network. They aim to support innovation and technology transfers and
increase collaboration among international SMEs. Established in 2004 the IRC Anatolia Consortium is made up of METU-Technopolis, Turkey’s first and biggest science park, the Small and Medium Industry Development Organisation, and the Ankara Chamber of Industry.
● R&D funding available for the private sector is provided through competitive grants. The Law of Technology and Development Zones (2001) introduced tax incentives for the research activities of companies located in those zones. In addition there are programmes providing fiscal support towards the costs of higher-skilled personnel. The SME Development Organisation KOSGEB supports the use of new technologies through interest-free loans and gives financial support to patent applicants.
Innovation inputs and performance
● Public spending on R&D stood at just over 0.5% of GDP in 2005, though the government has upped investment in 2006 and 2007, while business R&D expenditure lagged at 0.27% of GDP (23% of the EU average). In addition, Turkey has a less than stellar record on new science and engineering graduates, where it ranks far behind most of the CEE countries, at 44% of the EU average. The proportion of the population with a tertiary education is also considerably lower than in the CEE region (at 41% of the EU average).
● Innovation outputs in Turkey have been small. Over the 2000-03 period, EPO patent applications stood at 1% of the EU average; there has been no significant activity on either USPTO or triadic patent families. However, drastically increased public inputs since 2005 and an improved institutional environment may bring about a change in the near to mid-term.
Turkey

© The Economist Intelligence Unit 2008 49
COUNTRY DATA: TURKEYA time for new ideas
Innovation in Central Eastern Europe and Turkey
Country profile Turkey
2000 2001 2002 2003 2004 2005 2006 2007General data
Population (m) 68.3 69.3 70.3 71.3 72.3 73.3 74.3 75.2
GDP at PPP (US$ bn) 404 382.7 420.3 453.7 507.2 561.1 618.7 663.4
GDP per head, at PPP (US$) 5,916 5,521 5,979 6,360 7,010 7,650 8,330 8,820
as % of EU average 23 21 22 23 24 25 26 27
Real GDP growth (%) 6.8 -5.7 6.2 5.3 9.4 8.4 6.9 4.5
Innovation inputs
Public R&D expenditure (% of GDP) 0.43 0.48 0.48 0.47 0.51 0.52 - –
as % of EU average 66 74 73 71 80 80 - –
Business R&D expenditure (% of GDP) 0.21 0.24 0.19 0.14 0.16 0.27 - –
as % of EU average 17 20 16 12 14 23 - –
New S&E grad per 1,000 pop (aged 20-29) – – - 5.2 5.6 5.7 – –
as % of EU average – – - 43 45 44 – –
Population with tertiary education per 100 population (aged 25-64) 8.3 8.4 9.1 9.7 9.0 10.0 9.3 –
as % of EU average 43 43 46 47 42 45 41 –
Broadband penetration rate (no. of broadband lines per 100 pop) – – 0.0 0.2 0.5 1.4 3.0 –
as % of EU average – – 0 3 7 12 18 –
ICT expenditure (% of GDP) – 5.6 4.1 3.2 - - – –
as % of EU average – 89 62 50 - - – –
Innovation outputs
EPO patents (per million population) 1.2 1.3 1.0 1.9 – – – –
as % of EU average 1 1 1 1 – – – –
USPTO patents (per million population) 0.1 0.2 0.2 0.2 – – – –
as % of EU average 0 0 0 0 – – – –
Triad patents (per million population) 0.1 0.1 0.1 0.1 0.1 0.2 – –
as % of EU average 0 0 0 0 0 0 – –
2003-07 Global rank EU rank 2008-2012 Global rank EU rank Economist Intelligence Unit innovation indices
Output index (based on patents) 5.21 55 n/a 5.62 58 n/a
Innovation inputs 5.07 51 n/a 5.49 55 n/a
Direct inputs 4.69 54 n/a 5.06 57 n/a
Innovation environment 6.22 44 n/a 6.79 39 n/a
Sources: Eurostat; OECD; World Bank: Economist Intelligence Unit

50 © The Economist Intelligence Unit 2008
Appendix 1: Economist Intelligence Unit innovation modelA time for new ideas Innovation in Central Eastern Europe and Turkey
Appendix 1Economist Intelligence Unit innovation model
Measuring innovation, especially at the level of the aggre-gate economy, has always been one of the most perplexing problems facing empirical economics. The Economist Intel-ligence Unit¬’s model distinguishes between measures of innovation outputs or performance, on the one hand, and of innovation inputs or drivers on the other.
We constructed four indices of innovation for 82 countries, drawing on the Economist Intelligence Unit’s business environment rankings (BER) model. The first index measures innovation output or performance, and is based on international patents data. There are also two composite indices, constructed on the basis of BER scores, that measure innovation inputs, or innovation enablers. The first covers direct innovation inputs and the second the innovation environment or the policy and institutional framework, that is the broad economic, social and political backdrop that facilitates (stimulates or hinders) innovation activity. Indicators for the two enabler indices were chosen on the basis of factors identified in the accepted, general literature. Finally, we construct a fourth aggregate innovation inputs or innovation enablers index that comprises the direct innovation and the innovation environment indexes. The weights used—.75 for direct inputs and .25 for the environment index—correspond to weights based on the estimated coefficients in the regression equation described below that relates innovation performance to innovation inputs.
The patents data are averages for 2003-05, whereas the innovation enablers are indices based on 2003-07 averages.
All indices are expressed on a 1 to 10 scale using the following conversion formula:
9 * (indicator value for country - minimum value for the indicator)/(maximum value for the indicator - minimum value for the indicator) + 1
Direct innovation inputsThe innovation inputs index is based on an unweighted average of the following indicators:● R&D as a % of GDP● Quality of the local research infrastructure● Education of the workforce● Technical skills of the workforce● Quality of IT and communications infrastructure● Broadband penetration
All indicators are rated on 1-5 scale based on original raw values where relevant and as defined in the methodology at the end. The composite index is converted to a 1-10 scale.
Innovation environmentThis index is based on an unweighted average of the follow-ing 12 indicators:● Political stability● Macroeconomic stability● Institutional framework● Regulatory environment● Tax regime● Flexibility of labour market● Openness of national economy to foreign investment● Ease of hiring foreign nationals● Openness of national culture to foreign influence● Popular attitudes towards scientific advancements● Access to investment finance● Protection of intellectual property
The source for all the indicators is the BER, with the excep-tion of popular attitudes towards science which is taken from the World Values Survey.
All the index values for CEE in 2003-07 are given in the table on page 10 of the report.
Explaining innovation performanceThe explanatory power of our two input indices in explain-ing innovation performance across countries is very high. A regression for the 82 countries shows that the two indices explain more than 90% of the inter-country variation in pat-ents per million of the population. The direct inputs index has a more powerful influence on international patenting, but the innovation environment also has a significant impact.

© The Economist Intelligence Unit 2008 51
Appendix 1: Economist Intelligence Unit innovation modelA time for new ideas
Innovation in Central Eastern Europe and Turkey
Table 1 Dependent variable: International patents index
Coefficients t Stat
Constant 0.266 0.751
Innov1 0.2441 2.9956
Innov2 0.7269 16.9849
Adj R2 0.927
N 82
Innov1: Innovation environment indexInnov2: Direct innovation inputs index
Innovation efficiencyA comparison of a country’s rank on its innovation output (performance) with its ranking on direct innovation inputs can provide an insight into the efficiency of innovation. A large discrepancy in the two rankings suggests either a high level of efficiency (high innovation output relative to inputs) or a high degree of inefficiency if the direct inputs rank exceeds significantly a country’s ranking on innovation performance.
A glance at the innovation environment index can in this context also be informative. A good innovation environment can help to explain why a country’s direct inputs may be efficiently translated into innovation performance (outputs).
An alternative way of measuring efficiency is to compare actual and predicted values from our equation. A ratio between actual and predicted performance that is well below 1 suggests innovation inefficiency—lower than expected outputs relative to inputs. That is the case for practically all CEE. The one exception is of an “efficient innovator” is Slovenia, where the ratio is well above 1—that is, its innovation performance is higher than the inputs would suggest.
Table 2 International patents index
Predicted Actual Actual/ predicteda
Austria 8.60 8.91 1.04
Belgium 8.73 8.80 1.01
Denmark 9.52 9.29 0.98
Finland 9.55 9.43 0.99
France 9.23 8.90 0.96
Germany 9.38 9.38 1.00
Greece 6.02 6.59 1.09
Ireland 8.66 8.46 0.98
Italy 7.54 8.41 1.12
Netherlands 9.18 9.12 0.99
Portugal 6.85 6.58 0.96
Spain 7.86 7.47 0.95
Sweden 9.48 9.45 1.00
UK 9.10 8.72 0.96
Bulgaria 6.07 5.79 0.95
Czech Republic 7.46 6.83 0.92
Estonia 7.39 6.75 0.91
Hungary 7.34 7.26 0.99
Latvia 5.97 5.89 0.99
Lithuania 6.18 5.52 0.89
Poland 6.30 5.65 0.90
Romania 5.71 5.25 0.92
Slovakia 6.90 6.26 0.91
Slovenia 7.22 7.68 1.06
Russia 6.44 6.07 0.94
Ukraine 4.82 5.37 1.11
US 9.53 9.48 1.00
a Predicted values based on above regression equation.
Source: Economist Intelligence Unit.
The estimated equation above can also be used to predict innovation performance over the next five years. Forecast values of the two innovation input indices, based on BER forecast scores, are inserted into the equation to yield forecasts of innovation performance (based on expected patents activity) in 2008-12 (the procedure assumes that estimating errors for the performance equation in 2003-07 also apply in 2008-12). The forecasts for CEE are shown in the table on page 11 of the report.

52 © The Economist Intelligence Unit 2008
Appendix 1: Economist Intelligence Unit innovation modelA time for new ideas Innovation in Central Eastern Europe and Turkey
Innovation performance in CEEResearch and development (R&D) spending has been widely used as a measure of innovation performance. However, R&D is a measure of the inputs that go into the innova-tion process rather than of innovation output or success. A measure of innovation performance should focus on the extent of commercially successful applications rather than on the amount of effort going into developing them. In principle, patenting activity gets closer to this. Although the use of patent data has a number of problems, this is probably the single best available measure for innovation outputs. This conclusion is bolstered by an examination of alternative indicators of innovation performance that correlate closely with patent activity. Despite that, patent numbers are an imperfect proxy for overall innovation activ-ity. Firms often choose to keep secret innovations that are commercially sensitive; inventions can also be protected by trademarks, design registrations and copyrights; the propensity to patent may also vary according to the costs of patenting; and many patents may never be implemented commercially. Patents may even obstruct innovation on occasion if they slow the diffusion of knowledge or pose prohibitive barriers to market entry.
Inventions, moreover, do not all have the same value. The value distribution of patents is skewed: a few patents have a high value, whereas many have lower values. However, as there are no generally recognised, easily applicable methods for measuring the value of patents, researchers merely count the number of patents meeting various criteria. The propensity to patent differs greatly across industries, affecting comparisons based on economy-wide data. International comparisons are also affected by differences in procedures and standards across patenting offices.
One patent measure that reduces some of these problems, and that has been widely used in international comparisons, is that of the so-called triadic patent families. Triadic patents are those that have been applied for at the European Patent Office (EPO) and the Japan Patent Office (JPO), and granted by the US Patent and Trademark Office (USPTO) to protect the same invention. The triadic patents are counted on the basis of the earliest priority year: the year in which a patent was first applied for at any patent office. Data by priority date, as opposed to filing or grant dates, provide a better indication of the date that the invention was made and are thus probably a more accurate measure of inventive performance at any given point in time.
Table 3 Triad patents per million population
2000 2001 2002 2003 2004 2005
Bulgaria 0.11 0.25 0.17 0.40 0.33 0.29
Czech Republic 0.60 0.92 1.05 1.12 1.08 1.11
Germany 53.79 53.56 52.51 53.03 53.97 53.85
Estonia 0.84 1.81 0.42 1.56 1.28 1.42
Hungary 1.62 1.47 1.31 1.76 1.88 1.77
Latvia 0.73 0.68 0.60 0.79 1.01 1.18
Lithuania 0.28 0.19 0.17 1.54 0.36 0.08
Poland 0.16 0.15 0.22 0.18 0.19 0.20
Romania 0.01 0.01 0.02 0.03 0.00 na
Slovenia 1.81 1.73 2.62 2.49 3.00 2.73
Slovakia 0.02 0.02 0.02 0.02 0.02 0.02
EU10 5.45 5.53 5.37 5.72 5.74 6.26
EU15 22.86 23.09 22.20 22.02 22.25 22.33
EU27 20.82 21.02 20.63 20.67 20.85 20.76
Turkey 0.10 0.07 0.08 0.10 0.13 0.21
Sources: Eurostat; OECD.
However, although triadic patents are in some ways easier to compare across countries, they cover only a small subset of total patents. They are also biased towards high-technology fields and thus may present a skewed picture of total innovation performance. We therefore constructed another patent measure as the sum of patents applied for by, or granted to, a country’s applicants by regional centres—that is, the USPTO, the EPO and the JPO. This differs from triadic patents in that a patent need not be filed in all three offices to be counted.

© The Economist Intelligence Unit 2008 53
Appendix 1: Economist Intelligence Unit innovation modelA time for new ideas
Innovation in Central Eastern Europe and Turkey
Table 4 International patents per m, 2003-05
Bulgaria 1.0
Czech Republic 5.3
Estonia 4.6
Hungary 10.4
Latvia 1.2
Lithuania 0.65
Poland 0.81
Romania 0.43
Slovakia 2.1
Slovenia 20.2
Russia 1.6
Turkey 0.4
Ukraine 0.5
Austria 141.3
Belgium 119.2
Denmark 259.8
Finland 321.7
France 139.5
Germany 300.3
Greece 3.6
Ireland 69.9
Italy 64.3
Netherlands 198.3
Portugal 3.5
Spain 14.4
Sweden 334.6
UK 105.1
Sources: Eurostat; OECD.
Alternative measures of innovation outputsGiven the various possible problems with the patents meas-ure, it is worth exploring alternative measures of innovation performance and the sensitivity of innovation performance rankings to the use of the patents measure. We looked at three other indicators that all have various problems, but can be seen as measures of, or imperfect proxies for, inno-vation performance.
1. Citations from scientific and technical journals (per million population). The data are for 2003 from the US National Science Foundation and Thomson ISI, Science Citation Index.
2. The average of the share of medium- and high-technology products in manufacturing output and the share of medium- and high-technology exports in total manufacturing exports. The data are from the UN Industrial Development Organisation’s Industrial Development Report.
3. The results of a survey question from the World Economic Forum’s Global Competitiveness Report, that asked respondents to rate the capacity of firms in 125 countries for innovation. The original results are on 1-7 scale (which we converted to a 1-10 scale).
A composite measure of performance can be constructed that consists of these indicators as well as our patents measure (by converting each indicator to an index on a 1-10 scale). The composite index, which is set out in the table below, gives very similar results to the patents-only measure.
Innovation inputs driversR&D activity is a key direct input for innovation. Educa-tion levels have a significant influence on the availability of human resources for science and technology. Skilled researchers play a key role in the innovation process. The level of information and communications technology (ICT) development is another factor that is associated with inno-vation performance.
The new member states of the EU, with the exception of Slovakia, Romania and Bulgaria, spend non-negligible proportions of their national income on R&D—although these are much lower than during the communist era and significantly lower than the figure for the EU15. Three of the most advanced EU10 spend more than 1% of GDP on R&D.
Although they lag behind the EU15, the numbers of R&D personnel per 1,000 population in the EU10 are relatively large, given these countries’ level of development. However, the output of R&D personnel in the EU10, in terms of commercially useful innovation, is low. Furthermore, the business sector still accounts for only a small share of total R&D personnel in the EU10. In the EU15, by contrast, business sector R&D workers account for well over one-half of the total.
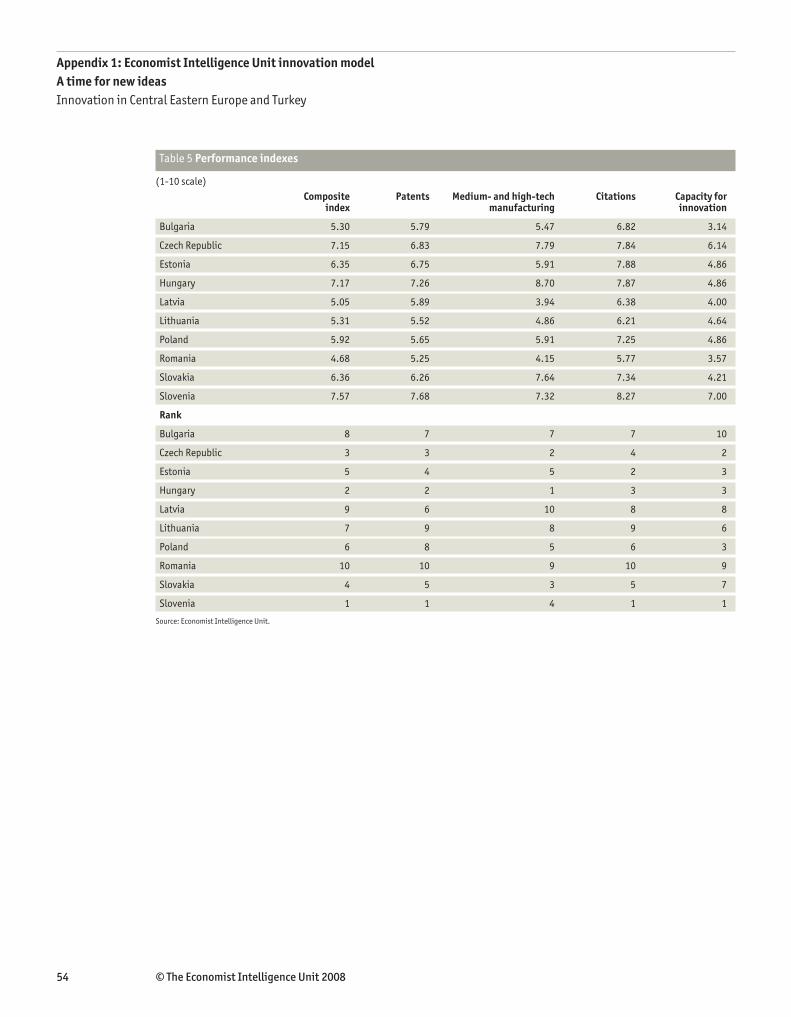
54 © The Economist Intelligence Unit 2008
Appendix 1: Economist Intelligence Unit innovation modelA time for new ideas Innovation in Central Eastern Europe and Turkey
Table 5 Performance indexes
(1-10 scale) Composite Patents Medium- and high-tech Citations Capacity for index manufacturing innovation
Bulgaria 5.30 5.79 5.47 6.82 3.14
Czech Republic 7.15 6.83 7.79 7.84 6.14
Estonia 6.35 6.75 5.91 7.88 4.86
Hungary 7.17 7.26 8.70 7.87 4.86
Latvia 5.05 5.89 3.94 6.38 4.00
Lithuania 5.31 5.52 4.86 6.21 4.64
Poland 5.92 5.65 5.91 7.25 4.86
Romania 4.68 5.25 4.15 5.77 3.57
Slovakia 6.36 6.26 7.64 7.34 4.21
Slovenia 7.57 7.68 7.32 8.27 7.00
Rank
Bulgaria 8 7 7 7 10
Czech Republic 3 3 2 4 2
Estonia 5 4 5 2 3
Hungary 2 2 1 3 3
Latvia 9 6 10 8 8
Lithuania 7 9 8 9 6
Poland 6 8 5 6 3
Romania 10 10 9 10 9
Slovakia 4 5 3 5 7
Slovenia 1 1 4 1 1
Source: Economist Intelligence Unit.

© The Economist Intelligence Unit 2008 55
Appendix 1: Economist Intelligence Unit innovation modelA time for new ideas
Innovation in Central Eastern Europe and Turkey
Table 7 R&D personnel by sector of performance, 2004
(full-time equivalent, per 1,000 population) Total Business Government Higher education
EU15 4.86 2.73 0.64 1.43
Estonia 3.7 0.74 0.74 2.22
Latvia 2.17 0.43 0.43 1.3
Lithuania 3.19 0.29 0.87 2.03
Poland 2.04 0.34 0.52 1.18
Czech Republic 2.83 1.46 0.78 0.59
Slovakia 2.57 0.55 0.74 1.29
Hungary 2.3 0.7 0.8 0.8
Slovenia 3.5 2 1 0.5
Romania 1.52 0.74 0.46 0.32
Bulgaria 1.94 0.26 1.29 0.39
Source: Eurostat, Science, Technology and Innovation in Europe, 2007 edition.
Table 8 below gives comparative data for a range of other indicators that represent, or are associated with, direct inputs for innovation. Creating and implementing innovation requires, above all, a highly trained workforce with skills in science and technology. Indeed, variations in the share of trained scientists and engineers in the working-age population across countries closely mirror differences in R&D intensities.
Table 8 Innovation inputs
2005 2006 2006 2005
EU27 average 12.9 23.0 16.5 6.4
EU15 13.9 26.3 17.6 6.5
Bulgaria 8.6 21.9 -- 9.9
Czech Republic 8.2 13.5 8.4 6.6
Estonia 12.1 33.3 16.6 9.8
Hungary 5.1 17.7 7.5 8.1
Latvia 9.8 21.1 6.8 9.6
Lithuania 18.9 26.8 8.4 7.8
Poland 11.1 17.9 3.9 7.2
Romania 10.3 11.7 -- 8.2
Slovenia 9.8 21.4 11.4 5.4
Slovakia 10.2 14.5 4.0 6.7
Source: Eurostat.
New S&E graduates per 1,000
population (aged
20-29)
Population with tertiary
education per 100
population (aged
25-64)
Broadband penetration rate (no. of broadband
lines per 100
population)
ICT expenditure
(% of GDP)
Table 6 R&D in CEE
Real R&D Private-sector Government- Private-sector spending funded R&D funded R&D funded R&D (% annual (% of GDP) (% of GDP) (% of total) growth, 2004 2005 2004 2004 2004 2001–05)
EU15 1.91 1.91 1.05 0.86 55.2 1.4
EU10
Bulgaria 0.51 0.50 0.14 0.37 28.2 6.6
Czech Republic 1.26 1.42 0.67 0.59 52.8 8.3
Estonia 0.88 0.94 0.32 0.56 36.5 16.5
Hungary 0.88 0.94 0.33 0.55 37.1 5.0
Latvia 0.42 0.57 0.19 0.23 46.3 17.6
Lithuania 0.76 0.76 0.15 0.61 19.9 11.4
Poland 0.56 0.57 0.15 0.41 26.9 1.1
Romania 0.39 n/a 0.17 0.22 44.0 n/a
Slovakia 0.51 0.51 0.20 0.31 38.3 -0.6
Slovenia 1.45 1.22 0.85 0.60 58.5 n/a
Sources: Eurostat; OECD.

56 © The Economist Intelligence Unit 2008
Appendix 2: Survey resultsA time for new ideas Innovation in Central Eastern Europe and Turkey
Appendix 2: Survey results
In Spring 2008, the Economist Intelligence Unit surveyed 370 executives from around the world, but operating in Central Eastern Europe. Our sincere thanks go to all those who took part. Please note that not all answers add up to 100% because of rounding or because respondents were able to provide multiple answers to some questions.
38
19
39
4
Wholly domestically owned or headquartered in CEE
Partially foreign owned
Wholly foreign owned
Other
Which of the following best describes your company's ownership structure? (% respondents)
None 1% to 33% 34% to 66% 67% to 100% Don’t know
Approximately what portion of your company’s local/regional revenues comes from products and services that are less than one year old? Three years old? (% respondents)
Less than one year old
Less than three years old
13 58 13 13 3
7 41 28 21 4
Does your company have any of the following formal procedures/structures in place to support innovation? Select all that apply. (% respondents)
An internal innovation network
A dedicated team responsible for innovation
Financial compensation for innovative activity
An award for innovative activity
An external innovation network (with suppliers, academia, etc)
Funding allocated specifically to innovation
An internal “innovation champion”
A process for employees to take time off regular work to pursue innovation projects
Other
None of the above
39
28
26
24
23
16
14
14
2
22

© The Economist Intelligence Unit 2008 57
Appendix 2: Survey resultsA time for new ideas
Innovation in Central Eastern Europe and Turkey
Which of the following factors are most important for your company in driving its need to innovate? Select up to three. (% respondents)
Competition
Changes in industry or market structure
Changes in consumer tastes or habits
Inadequacy of a process, product or service
Maturity of existing product portfolio
Changes in supply chain
Demographic changes
Other
Don’t know
69
58
45
32
27
9
7
3
1
In which of the following CEE countries does your organisation have dedicated R&D facilities (eg, a formal department or physical R&D site)? Select all that apply.(% respondents)
Poland
Russia
Czech Republic
Romania
Hungary
Ukraine
Other, please specify
Slovakia
Bulgaria
Slovenia
Estonia
Lithuania
Latvia
We do not have R&D facilities in CEE
Don’t know
16
15
11
10
9
7
7
4
4
4
3
3
3
36
3
In the past three years, approximately what share of the products and services sold locally by your company were developed in CEE? (% respondents)
None
Less than 1%
1% to 10%
11% to 50%
51% to 90%
91% to 100%
Don't know
Not applicable
9
6
16
14
13
32
3
8
Exclusively in its headquarters country or region
Mostly in its headquarters country or in its headquarters’ region
Mostly outsourced to another region
Mostly in CEE
Don’t know
Not applicable; my company is headquartered in CEE
If your company is headquartered outside CEE, which best describes the location of its innovation (eg, new product development or process improvement)?(% respondents)
8
26
5
7
5
48
Increase significantly
Increase
Remain unchanged
Decrease
Decrease significantly
Don’t know
Over the next three years, how do you expect the importance of CEE/your home country as an innovation centre for your company to change?(% respondents)
20
43
32
3
1
2

58 © The Economist Intelligence Unit 2008
Appendix 2: Survey resultsA time for new ideas Innovation in Central Eastern Europe and Turkey
Designed exclusively for this market Highly applicable Somewhat applicable Not applicable Don’t know
To what extent are products, services, and processes developed by your company in CEE applicable to your company's business in the following markets? (% respondents)
Domestic market
CEE region as a whole
Other emerging markets
Developed markets
28 49 10 10 3
8 46 26 15 5
2 29 39 21 9
5 30 35 22 9
Excellent
Very good
Good
Poor
Very poor
Don’t know
Not applicable
How do you rate your firm’s ability to integrate the latest foreign technology?(% respondents)
13
37
41
6
1
0
1
Increase significantly
Increase
Remain unchanged
Decrease
Decrease significantly
Don’t know
Not applicable&; my company doesn’t invest in R&D in CEE and isn’t planning to do so
How do you expect your company’s R&D investment in CEE to change over the next three years?(% respondents)
10
57
21
2
1
3
6
8
38
26
11
2
14
Excellent
Good
Poor
Very poor
Don’t know
Not applicable; my company doesn’t have relationships with universities/academic institutes in CEE
How would you characterise your firm’s relationships with universities/academic institutes in CEE? (% respondents)
5
48
41
4
2
Very supportive
Somewhat supportive
Not supportive
Actively obstructive
Don’t know
How supportive of private sector innovation is your home country’s government? (% respondents)

© The Economist Intelligence Unit 2008 59
Appendix 2: Survey resultsA time for new ideas
Innovation in Central Eastern Europe and Turkey
Very effective Somewhat effective Very ineffective Don’t know/ Not applicable
How effective are academic centres in the each of the following fields in your home country? (% respondents)
Biotech
Information technology
Management sciences
Engineering
Life sciences
Physical sciences
10 35 17 38
32 47 8 13
9 47 27 17
22 49 9 20
7 36 23 34
12 37 17 33
1 Agree strongly 2 3 4 5 Disagree strongly Don’t know
To what extent do you agree with the following statements? Rate on a scale of 1 to 5, where 1=Agree strongly and 5=Disagree strongly. (% respondents)
My company collaborates with multinational companies operating in CEE to develop new products and services
My company collaborates with domestic companies in CEE to develop new products and services
My company's supply chain includes primarily local suppliers
My company's supply chain includes primarily foreign suppliers
15 21 23 18 20 4
13 23 24 22 17 2
12 24 22 20 16 6
12 18 26 23 15 6
How do you rate the innovation environment in your home country today relative to that of your company’s headquarters? (% respondents)
Better than headquarters
Same as headquarters
Worse than headquarters
Much worse than headquarters
Don’t know
Not applicable; I am based in my company’s headquarters
8
22
27
9
2
32
How do you expect the innovation environment in your home country to change in the next three years? (% respondents)
Improve substantially
Improve
Remain unchanged
Worsen
Worsen substantially
Don’t know
11
66
21
2
0
1

60 © The Economist Intelligence Unit 2008
Appendix 2: Survey resultsA time for new ideas Innovation in Central Eastern Europe and Turkey
Very important Somewhat important Not at all important Don’t know/ Not applicable
How important are the following factors as innovation drivers in CEE for your company? (% respondents)
Political stability
Macroeconomic stability
Institutional framework (eg, public administration, rule of law, extent of corruption)
Regulatory environment (eg, ease of doing business, licensing, opening new businesses)
Tax regime (eg, tax burden, fairness and consistency of tax system, incentives for investment)
Flexibility of labour market
Openness of national economy to foreign investment
Popular attitudes toward scientific advancements
Access to domestic public funding
Access to EU funds
Protection of intellectual property
47 46 6 1
62 36 2 0
57 39 3 1
68 29 3 0
52 43 4 0
34 48 17 2
46 41 12 1
22 47 27 5
20 45 30 5
35 39 22 4
51 34 13 2
Strong Average Weak Don’t know Not applicable
How do you rate your home country environment on these same factors?(% respondents)
Political stability
Macroeconomic stability
Institutional framework (eg, public administration, rule of law, extent of corruption)
Regulatory environment (eg, ease of doing business, licensing, opening new businesses)
Tax regime (eg, tax burden, fairness and consistency of tax system, incentives for investment)
Flexibility of labour market
Openness of national economy to foreign investment
Popular attitudes toward scientific advancements
Access to domestic public funding
Access to EU funds
Protection of intellectual property
20 56 23 1 1
24 53 21 1 1
9 34 56 1 1
13 40 45 1 1
17 38 43 1 1
13 46 38 2 1
36 50 13 1
12 48 34 3 3
7 38 50 4 1
16 48 31 2 4
12 44 42 1 1

© The Economist Intelligence Unit 2008 61
Appendix 2: Survey resultsA time for new ideas
Innovation in Central Eastern Europe and Turkey
Very important Somewhat important Not at all important Don’t know/ Not applicable
How important are the following factors as innovation drivers in CEE for your company?(% respondents)
Total R&D spending in the country
Private sector R&D spending
Public sector (government) R&D spending
Availability of scientists and engineers
Availability of university graduates
Technical skills of the workforce
Quality of IT and communications infrastructure
Broadband penetration
24 44 21 10
30 38 22 10
19 44 28 10
53 29 11 7
56 34 6 4
54 38 5 4
56 37 4 3
32 48 12 8
Strong Average Weak Don’t know Not applicable
How do you rate your home country on these factors?(% respondents)
Total R&D spending in the country
Private sector R&D spending
Public sector (government) R&D spending
Availability of scientists and engineers
Availability of university graduates
Technical skills of the workforce
Quality of IT and communications infrastructure
Broadband penetration
6 29 58 4 2
7 40 46 5 2
5 25 63 5 2
21 55 21 2 2
27 55 17 1 0
27 54 18 1 1
27 53 19 1 1
14 46 33 4 3

62 © The Economist Intelligence Unit 2008
Appendix 2: Survey resultsA time for new ideas Innovation in Central Eastern Europe and Turkey
Poland
Russia
Czech Republic
Romania
Hungary
Bulgaria
Ukraine
Slovenia
Slovakia
Lithuania
Estonia
Latvia
Other
In which country are you personally based? (% respondents)
18
17
10
10
10
5
4
4
3
3
3
2
11
CEE
Europe (other than CEE)
North America
Asia-Pacific
Middle East and Africa
Latin America
In which region is your company headquartered? (% respondents)
53
31
12
3
2
0
Financial services
Professional services
Healthcare, pharmaceuticals and biotechnology
IT and technology
Construction and real estate
Manufacturing
Telecommunications
Energy and natural resources
Consumer goods
Retailing
Entertainment, media and publishing
Transportation, travel and tourism
Education
Government/Public sector
Chemicals
Automotive
Logistics and distribution
Agriculture and agribusiness
What is your primary industry? (% respondents)
27
12
10
9
6
6
6
5
5
4
2
2
2
2
1
1
1
1
41
15
9
13
6
16
$100m or less
$100m to $500m
$500m to $1bn
$1bn to $5bn
$5bn to $10bn
$10bn or more
What are your company’s annual global revenues in US dollars? (% respondents)

© The Economist Intelligence Unit 2008 63
Appendix 2: Survey resultsA time for new ideas
Innovation in Central Eastern Europe and Turkey
33
56
11
Ahead of its peers
On par with its peers
Behind its peers
How do you rate your company’s recent financial performance compared to that of its peers? (% respondents)
Board member
CEO/President/Managing director
CFO/Treasurer/Comptroller
CIO/Technology director
Other C-level executive
SVP/VP/Director
Head of Business Unit
Head of Department
Manager
Other
What is your title? (% respondents)
7
27
10
4
6
7
6
12
16
5

Whilst every effort has been taken to verify the accuracy of this information, neither The Economist Intelligence Unit Ltd. nor the sponsor of this report can accept any responsibility or liability for reliance by any person on this white paper or any of the information, opinions or conclusions set out in the white paper.

LONDON26 Red Lion SquareLondon WC1R 4HQUnited KingdomTel: (44.20) 7576 8000Fax: (44.20) 7576 8476E-mail: [email protected]
NEW YORK111 West 57th StreetNew York NY 10019United StatesTel: (1.212) 554 0600Fax: (1.212) 586 1181/2E-mail: [email protected]
HONG KONG6001, Central Plaza18 Harbour RoadWanchai Hong KongTel: (852) 2585 3888Fax: (852) 2802 7638E-mail: [email protected]