Embed Size (px)
Citation preview
A Three-Dimensional Analysis of MorphologicalEvolution and Locomotor Performance of the CarnivoranForelimbAlberto Martın-Serra*, Borja Figueirido, Paul Palmqvist
Departamento de Ecologıa y Geologıa, Facultad de Ciencias, Universidad de Malaga, Malaga, Spain
Abstract
In this study, three-dimensional landmark-based methods of geometric morphometrics are used for estimating theinfluence of phylogeny, allometry and locomotor performance on forelimb shape in living and extinct carnivorans(Mammalia, Carnivora). The main objective is to investigate morphological convergences towards similar locomotorstrategies in the shape of the major forelimb bones. Results indicate that both size and phylogeny have strong effects onthe anatomy of all forelimb bones. In contrast, bone shape does not correlate in the living taxa with maximum runningspeed or daily movement distance, two proxies closely related to locomotor performance. A phylomorphospace approachshowed that shape variation in forelimb bones mainly relates to changes in bone robustness. This indicates the presence ofbiomechanical constraints resulting from opposite demands for energetic efficiency in locomotion –which would require aslender forelimb– and resistance to stress –which would be satisfied by a robust forelimb–. Thus, we interpret that the needof maintaining a trade-off between both functional demands would limit shape variability in forelimb bones. Given thatdifferent situations can lead to one or another morphological solution, depending on the specific ecology of taxa, theevolution of forelimb morphology represents a remarkable ‘‘one-to-many mapping’’ case between anatomy and ecology.
Citation: Martın-Serra A, Figueirido B, Palmqvist P (2014) A Three-Dimensional Analysis of Morphological Evolution and Locomotor Performance of theCarnivoran Forelimb. PLoS ONE 9(1): e85574. doi:10.1371/journal.pone.0085574
Editor: Andrew Iwaniuk, University of Lethbridge, Canada
Received May 20, 2013; Accepted November 28, 2013; Published January 15, 2014
Copyright: � 2014 Martin-Serra et al. This is an open-access article distributed under the terms of the Creative Commons Attribution License, which permitsunrestricted use, distribution, and reproduction in any medium, provided the original author and source are credited.
Funding: This study was supported by the Spanish Ministry of Education PhD Research Fellowship (FPU) to AMS, projects CGL2008-04896, CGL2011-30334 andCGL2012-37866 from the Spanish Ministry of Science and Innovation, and project Hum-7248 from Junta de Andalucıa. The funders had no role in study design,data collection and analysis, decision to publish, or preparation of the manuscript.
Competing Interests: The authors have declared that no competing interests exist.
* E-mail: [email protected]
Introduction
Locomotion is crucial for an animal’s ecology. Animals move in
their home ranges to forage for food resources, to search for
mating partners, to avoid stressful environments, to pursue their
prey, or to escape from potential predators [1,2]. Therefore,
understanding the way that an animal moves provides a key aspect
of its biology and helps to define its role within the ecosystem [3].
For this reason, a major issue for both living and extinct species is
to study their locomotor abilities to further understand their
sinecological relationships within present and past communities.
Limb indicators of locomotor strategies –i.e., adaptations– in
the living taxa may provide highly valuable information to
decipher how extinct animals moved. Furthermore, due to the
correlation between the mode of locomotion of extant species and
the type of habitats in which they inhabit, ecomorphological
inferences on the locomotor behavior of extinct taxa provide clues
for reconstructing environmental changes in past ecosystems. In
this way, during the last decades a number of studies have used a
number of shape indicators for estimating the locomotor abilities
of extinct mammals [4–10] and, more specifically, of mammalian
carnivores [11–26]. The morphological indicators used were
presumed to be the result of selective processes that shaped
different anatomical adaptations towards specific modes of
locomotion. However, natural selection is not the only factor that
shapes morphological traits and it is thus important to quantify the
influence of other potential sources of bone variation. An example
would be the phylogenetic legacy of a given monophyletic group, a
key aspect in phenotypic evolution as it determines the develop-
mental routes and biomaterials available to natural selection [27–
29]. Similarly, given that the limbs withstand the animal’s weight,
body mass is one of the most influential factors on limb bone shape
[30–36]. This is particularly important in the case of the forelimbs,
as they withstand the largest amount of body mass in carnivorans
[37,38] and other mammals [39–42] relative to the hindlimbs. For
these reasons, to explore the influence of phylogeny, body mass
and locomotor performance on the shape of the major limb bones
is crucial to any study on the evolution of the appendicular
skeleton. In addition, this information can be used for deciphering
the autecological attributes of extinct taxa and their sinecological
roles within past communities.
In this article, we: (i) quantify the influence of size, phylogeny
and locomotor performance in shaping the morphology of
forelimb bones in mammalian carnivores; and (ii) explore how
their morphological variability reflects functional adaptations. The
order Carnivora is an excellent choice for this study, as it
represents one of the most spectacular cases of repeated and
independent evolution of similar morphologies on a limited range
of ecologies [12,13,16,26,43–49]. Specifically, we characterized
the morphology of the four major bones of the forelimb (i.e.,
scapula, humerus, radius and ulna; see Figure 1A) using three-
PLOS ONE | www.plosone.org 1 January 2014 | Volume 9 | Issue 1 | e85574

dimensional geometric morphometrics methods in order to answer
the following questions: (i) How important are allometric effects
for shaping the morphology of forelimb bones? (ii) Is there a
phylogenetic structure in all of these bones? (iii) Is there a
correlation between locomotor performance and the shape of the
major forelimb bones? (iv) Which are the evolutionary pathways
followed by different families? And (v) could this information be
used in future studies for deciphering how extinct animals moved?
We hypothesize that, although the allometry has probably played
an important role shaping the limb bones and a strong
phylogenetic signal is also expected, the shape of the forelimb
bones of carnivorans should also reflect the biomechanical
demands posed by their adaptations to different modes of
locomotion.
Materials and Methods
DataThe data set comprises 138 scapulae, 185 humeri, 230 radii and
186 ulnae (Figure 1A) from 78 species (46 extant and 32 extinct) of
the order Carnivora (see File S1: Tables S1, S2 and S3 in File S1).
In spite of the fact that this study does not include all living species
of the order Carnivora, the species selected cover a high
morphological and taxonomic variability within the order,
including both living and extinct taxa, in order to avoid biases
in subsequent multivariate analyses (e.g., for quantifying the
phylogenetic signal). However, it is worth to mention that we have
paid special attention to the families with large representatives (i.e.,
canids, ursids, hyaenids and felids). Patriofelis (Mammalia, Creo-
donta) was incorporated whenever possible as an outgroup for
checking how the carnivoran ‘‘bauplan’’ departs from another
highly carnivorous mammalian orders such as Creodonta [52].
Data from adult specimens –as indicated by complete distal
epiphyseal fusion– were the only collected to avoid potential effects
of ontogentic variation. All the specimens analyzed are housed in
the following institutions: American Museum of Natural History
(AMNH, New York), Natural History Museum (NHM, London),
Naturhistorisches Museum (NMB, Basel), Museo Nacional de
Ciencias Naturales (MNCN, Madrid), Museo di Storia Naturale
(MSN, Firenze), Staten Naturhistoriske Museum (SNM, Copen-
hagen), Museo de Ciencias Naturales de Valencia (MCNV,
Valencia). All of them were analyzed by AMS on loan at their
housing institutions with the adequate permissions and under the
supervision of the people responsible of those specimens.
Geometric morphometricsA set of three-dimensional (3D) homologous landmarks (LK)
were digitized by one of us (AM-S) directly to the specimens using
a Microscribe G2X. LKs were chosen following different
anatomical criteria (File S1: Table S4) for capturing as many
morphological aspects as possible in all the bones as well as
measuring the most important lever arms for muscle attachments
(see Figure 1B–D and Figure S1). It is worth noting that special
attention was paid to criteria of homology in the LKs digitized. For
this reason, geometric criteria –e.g., tips of epicondyles, processes
or tuberosities– prevailed in the selection of LKs over others such
as muscle attachment areas, which do not reflect in some cases
either biological or functional homology, particularly in a wide
taxonomic sample. 3D coordinates (x, y, z) of all LKs were
recovered into Excel using the software Immersion Inc. In addition,
the LKs were digitized several times on the forelimb bones of a cat
and a fox for testing data repeatability.
The surface of each forelimb bone of a specimen of Panthera onca
(Carnivora, Felidae) housed at the AMNH was scanned using a
3D-mobile surface scanner (Nextengine HD) and software
ScanStudio Pro. Subsequently, 3D-surface models were imported
into software Landmark [53] from the Institute of Data Analysis and
Visualization (IDAV 2002–2006) and the selected LKs were
located on them. Afterwards, LKs’ coordinates obtained from
statistical analyses with software MorphoJ [54] were also imported
into software Landmark. This allowed the same LKs directly
digitized onto the specimens sampled with Microscribe G2X to be
also digitized onto the 3D-surface models of the P. onca scanned.
Once the correspondence of LKs were established, 3D-surface
models were transformed using thin-plate splines by morphing into
the coordinates of the morphological extremes obtained in each
multivariate axis (see below), which allowed to obtain 3D-surface
models of these morphological shapes following the same
procedures as in Wiley et al. [53], Drake and Klingenberg [55],
Schoenebeck et al. [56] and Singleton [57].It is worth noting that
although these models do not improve the results obtained, they
are useful for visualizing the morphological interpretations derived
from morphometric analyses of complex morphological structures.
However, it should be noted that the zones between landmarks
should be interpreted with caution, as the models for the different
carnivoran taxa analyzed are based on the transformation of a
single original shape. For a detailed description of the advantages
and disadvantages of warping 3D-surface models, see Klingenberg
[58].
Given that 3D models have a low operational value in the
printed version of the article, an interactive 3D-PDF was
computed available at files S3 and S4.
A Procrustes fit [59,60] was performed separately from the raw
coordinates of the LKs digitized on each bone using software
MorphoJ [54]. This procedure removes the effects of rotation,
translation and scaling [61]. Once the specimens were aligned,
Procrustes coordinates and Centroid size (Cs) were both averaged
by species in order to avoid the effects of static allometry within the
sample. Those fossil specimens that were not identified at the
species level or those extinct species without a resolved within-
genus phylogenetic relationship (e.g., Barbourofelis sp., or Smilodon
sp.) were averaged by genus to avoid polytomies.
Assessing the phylogenetic signal in limb bone shapeA phylogenetic tree topology based on previously published
phylogenies [52,62–75] (see File S1: Table S5 and File S2 for
detailed information) was assembled (Figure 2) using Mesquite
[76] for assessing the presence of phylogenetic structure in
forelimb bones and testing for phylogenetic patterning in
multivariate analyses (see below). Branch lengths were incorpo-
rated in the composite phylogeny in million years before present
for improving the accuracy of the reconstructed ancestral states
[69,77]. Branches were scaled in the living species and groups
according to estimates of node dates from the supertree obtained
for all members of Carnivora by Nyakatura and Bininda-Emonds
[75], using information from Koepfli et al. [70] for procyonids.
Fossil occurrence dates were compiled for extinct taxa from
various sources based on species locality and age information [63–
65,71,74,78–81] including the online databases Paleobiology
Database [http://paleodb.org/cgi-bin/bridge.pl?a = home] and
the NOW database [http://www.helsinki.fi/science/now/index.
html] (see File S1: Table S5 for detailed information). Hence,
branch lengths for extinct taxa were estimated from their first and
last appearance data. Where estimates of divergence age based on
molecular data and on stratigraphic ranges of extinct taxa differed,
the oldest dates were chosen.In those cases in which several nodes
overlapped at the same date, an arbitrary difference of 0.1 My was
introduced between consecutive nodes.
Carnivoran Forelimb Evolution
PLOS ONE | www.plosone.org 2 January 2014 | Volume 9 | Issue 1 | e85574

Carnivoran Forelimb Evolution
PLOS ONE | www.plosone.org 3 January 2014 | Volume 9 | Issue 1 | e85574

Figure 1. A three-dimensional analysis of forelimb evolution in carnivorans. A, major limb bones analyzed, exemplified on a jaguar(Panthera onca), and landmarks used in the morphometric analyses of each forelimb bone. B, morphological key features in the shoulder. C, mainmorphological structures in the humerus. D, main morphological structures in the radius and ulna of carnivorans. Muscle origins (red) and insertions(purple) for the main muscles involved in locomotion are shown for each forelimb bone (anatomical keys are taken from Barone [50] and Hombergerand Walker [51]).doi:10.1371/journal.pone.0085574.g001
Figure 2. Phylogenetic tree topology for the order Carnivora (plus the creodont Patriofelis) used in this study. Thick lines for extinctspecies indicate stratigraphic range. Detailed references for the tree topology and branch lengths are given in file S1: table S5.doi:10.1371/journal.pone.0085574.g002
Carnivoran Forelimb Evolution
PLOS ONE | www.plosone.org 4 January 2014 | Volume 9 | Issue 1 | e85574

A multivariate regression analysis [82] of the PIC of the Pco of
each bone against the SD of the standardized contrast (i.e., the
square root of the corrected branch lengths) was performed using
MorphoJ [54], following Dıaz-Uriarte and Garland [83]. SD
values were obtained from the PDAP module for Mesquite
[76,84]. The significance of these multivariate regressions was
obtained by a permutation test against the null hypothesis of
complete independence between the SD and the PIC of the Pco.
This test reshuffles randomly the data (10,000 times) and
recalculates the regression. Therefore, the number of random
regressions with a correlation between the variables equal or
higher than the original one indicates the level of significance. This
test was performed in order to explore the adequacy of: (i) the
model used for tree topology; (ii) the branch lengths used; and (iii)
the model of Brownian motion for our tip data [83].
In order to quantify the presence of phylogenetic signal in both
the shape and size of limb bones, a permutation test developed for
univariate traits by Laurin [85], extended for multivariate analysis
by Klingenberg & Gidaszewski [86] and applied to size (as
univariate trait) and shape (as multivariate data) by several authors
[87–92] was used. This test operates by permuting (10,000 times in
our case) the mean values for species (shapes or sizes) to the tips of
the phylogenetic tree. Subsequently, ancestral shape reconstruc-
tions were recomputed for the permuted data using the squared-
change parsimony algorithm of Maddison [93], weighting by
branch lengths [86,87]. A P-value indicating the proportion of
permutations that result in a tree length equal to or less than our
phylogenetic tree inform us on the presence of phylogenetic signal
[86,87]. This P-value was used for estimating if phylogenetic
structure is present in limb bone shape and size. These tests were
performed with software MorphoJ [54].
Quantifying the influence of size on limb bone shapeThe effects of size on interspecific variation in limb bone shape
(i.e., interspecific allometry) were tested separately for each bone
by multivariate regression analysis [82] of the shape of the
analyzed species (i.e., using Procrustes coordinates-Pco) on their
size (i.e., using log-transformed Centroid size-Cs). Statistical
significance was tested with a permutation test (10,000 in our
case) against the null hypothesis of complete size independence
[55]. However, given that species cannot be treated as statistically
independent entities, as they are related by phylogeny, indepen-
dent contrast analyses (PIC) [94] for the shape and size of limb
bones were performed in order to avoid incorrect interpretations
due to a violation of the assumption of independent sampling –i.e.,
a variant of the classic type I error in statistical analysis [95,96].
Subsequently, the PIC’s for limb bone shapes were regressed on
the PIC for limb bone sizes –a multivariate regression through the
origin [89,92]–, which allowed to extract the morphological
change between sister nodes of the phylogeny (i.e., evolutionary
allometry). The statistical significance of the association between
shape PIC’s and log-Cs PIC was evaluated with a permutation test
against the null hypothesis of complete independence [55]. These
multivariate regression analyses were performed with software
MorphoJ [54].
Quantifying the influence of locomotor performance onlimb bone shape
In order to test for the association between forelimb morphol-
ogy and locomotor performance in the living carnivores, two
ecological variables were chosen: maximum running speed (MRS)
[4,97,98] and daily movement distance (DMD) [99,100]. MRS is a
proxy for the hunting skills of carnivores, because it is crucial for
the hunting success of many pursuit predators and, consequently,
for their survival [3]. Therefore, active predators tend to be faster
than those species which rarely hunt –these species do not improve
their running speed as it has little effect on their survival–. DMD is
a key aspect for locomotor efficiency [99], as those species that
travel long distances need to reduce energy expenditures, hence
achieving a more efficient locomotion through the increase of their
stride length –the highest the more efficient– [13] as well as by
constraining the movements of their limbs within the parasagittal
plane [15]. Log-transformed values obtained from the literature
(see File S1: Table S1) for both MRS (km?h21) and DMD (km per
day) were first regressed (OLS) on the Log-Cs of each bone. In
order to avoid the possible size effects in subsequent regressions,
the residuals were extracted when this correlation was statistically
significant. A multivariate regression analysis [82] of each bone
shape –the shape residuals obtained from the regression of
interspecific allometry– on MRS and DMD (or their residuals)
was computed separately for exploring the associations of these
variables with shape. Obviously, these analyses were restricted to
those living taxa for which data of MRS and DMD were available.
A permutation test against the null hypothesis of complete
independence of shape on MRS and DMD [55] was used for
statistical testing of the association of MRS and DMD with shape.
In addition, the PIC for the size-free shape of each limb bone was
regressed on the PIC for both log-MRS and log-DMD in order to
explore if the association between shape and locomotor perfor-
mance emerges from phylogenetic patterning. Statistical signifi-
cance was tested as in the previous multivariate regression.
Multivariate regression analyses were performed with software
MorphoJ [54].
Exploring the phenotypic spaces for forelimb bones andtheir histories of phylogenetic occupation
Given that a principal components analysis (PCA) finds the
orthogonal axes of maximum shape variance, it is an appropriate
method for exploring the phenotypic variation of limb bones
[101]. A PCA was computed separately for each forelimb bone
from the covariance matrix for bone shape in the species analyzed,
which allowed analyzing the distribution of carnivorans in the
phenotypic shape spaces. To explore the shape distribution
without the effect of evolutionary allometry, the vector computed
from the regression with the independent contrasts of shape and
size was applied to the species-averaged dataset [92]. The residuals
extracted from this vector, subsequently used for the PCAs, are
free of effects from evolutionary allometry [92]. In addition, the
phylogenetic history of the occupation of these shape spaces was
investigated by reconstructing the ancestral states of limb bone
shapes using the squared-change parsimony method weighted by
branch lengths [93]. Subsequently, the hypothetical shapes were
plotted on the original phenotypic spaces and tree branches were
connected to obtain limb bone phylomorphospaces [86–91,102–
104]. Furthermore, the evolutionary trajectories of shape trans-
formation were explored for each forelimb bone by investigating
the shape changes that account from the ancestral states to the tips
of the phylogeny. These analyses were performed with software
MorphoJ [54].
Results
Influence of phylogeny and size on the shape of limbbones
First of all, the multivariate regressions performed between the
PIC of the Pco and the standard deviation of the contrasts (SD)
yielded non-significant results for the four elements (all the P-
values were higher than 0.9), which indicates unequivocally that
Carnivoran Forelimb Evolution
PLOS ONE | www.plosone.org 5 January 2014 | Volume 9 | Issue 1 | e85574
our shape data and our composite tree fit adequately [83] and
evidences that the independent contrast analyses were made
correctly.
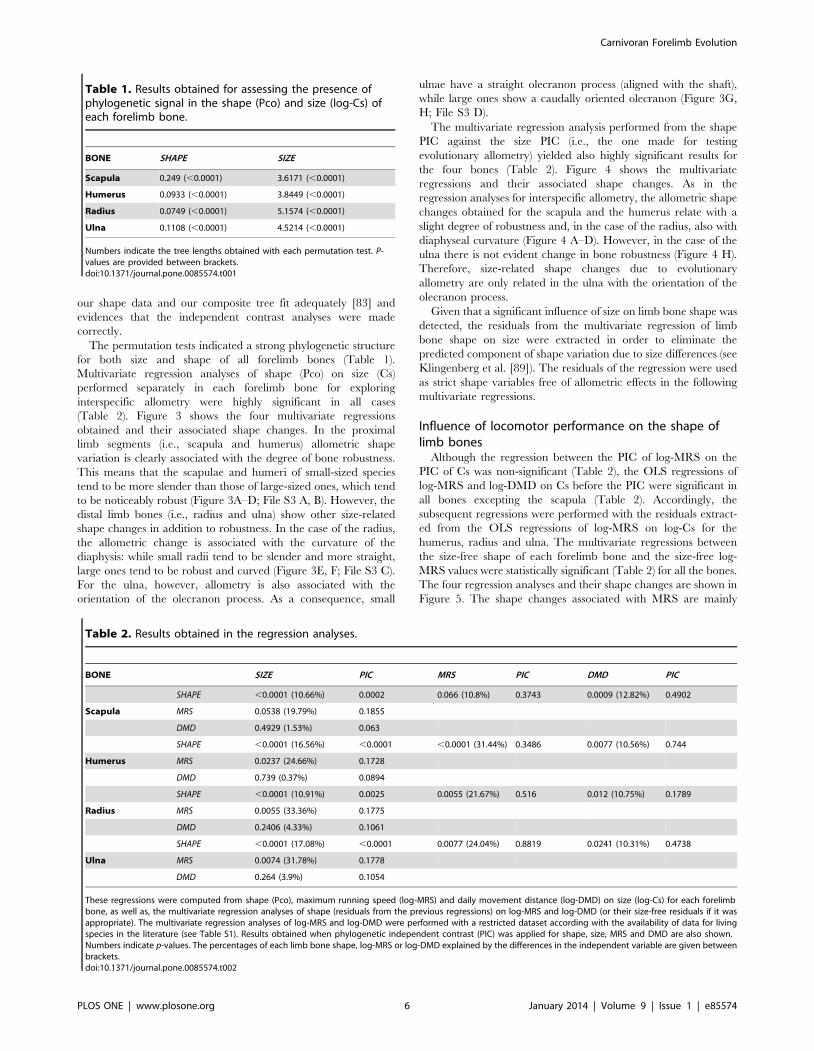
The permutation tests indicated a strong phylogenetic structure
for both size and shape of all forelimb bones (Table 1).
Multivariate regression analyses of shape (Pco) on size (Cs)
performed separately in each forelimb bone for exploring
interspecific allometry were highly significant in all cases
(Table 2). Figure 3 shows the four multivariate regressions
obtained and their associated shape changes. In the proximal
limb segments (i.e., scapula and humerus) allometric shape
variation is clearly associated with the degree of bone robustness.
This means that the scapulae and humeri of small-sized species
tend to be more slender than those of large-sized ones, which tend
to be noticeably robust (Figure 3A–D; File S3 A, B). However, the
distal limb bones (i.e., radius and ulna) show other size-related
shape changes in addition to robustness. In the case of the radius,
the allometric change is associated with the curvature of the
diaphysis: while small radii tend to be slender and more straight,
large ones tend to be robust and curved (Figure 3E, F; File S3 C).
For the ulna, however, allometry is also associated with the
orientation of the olecranon process. As a consequence, small
ulnae have a straight olecranon process (aligned with the shaft),
while large ones show a caudally oriented olecranon (Figure 3G,
H; File S3 D).
The multivariate regression analysis performed from the shape
PIC against the size PIC (i.e., the one made for testing
evolutionary allometry) yielded also highly significant results for
the four bones (Table 2). Figure 4 shows the multivariate
regressions and their associated shape changes. As in the
regression analyses for interspecific allometry, the allometric shape
changes obtained for the scapula and the humerus relate with a
slight degree of robustness and, in the case of the radius, also with
diaphyseal curvature (Figure 4 A–D). However, in the case of the
ulna there is not evident change in bone robustness (Figure 4 H).
Therefore, size-related shape changes due to evolutionary
allometry are only related in the ulna with the orientation of the
olecranon process.
Given that a significant influence of size on limb bone shape was
detected, the residuals from the multivariate regression of limb
bone shape on size were extracted in order to eliminate the
predicted component of shape variation due to size differences (see
Klingenberg et al. [89]). The residuals of the regression were used
as strict shape variables free of allometric effects in the following
multivariate regressions.
Influence of locomotor performance on the shape oflimb bones
Although the regression between the PIC of log-MRS on the
PIC of Cs was non-significant (Table 2), the OLS regressions of
log-MRS and log-DMD on Cs before the PIC were significant in
all bones excepting the scapula (Table 2). Accordingly, the
subsequent regressions were performed with the residuals extract-
ed from the OLS regressions of log-MRS on log-Cs for the
humerus, radius and ulna. The multivariate regressions between
the size-free shape of each forelimb bone and the size-free log-
MRS values were statistically significant (Table 2) for all the bones.
The four regression analyses and their shape changes are shown in
Figure 5. The shape changes associated with MRS are mainly
Table 1. Results obtained for assessing the presence ofphylogenetic signal in the shape (Pco) and size (log-Cs) ofeach forelimb bone.
BONE SHAPE SIZE
Scapula 0.249 (,0.0001) 3.6171 (,0.0001)
Humerus 0.0933 (,0.0001) 3.8449 (,0.0001)
Radius 0.0749 (,0.0001) 5.1574 (,0.0001)
Ulna 0.1108 (,0.0001) 4.5214 (,0.0001)
Numbers indicate the tree lengths obtained with each permutation test. P-values are provided between brackets.doi:10.1371/journal.pone.0085574.t001
Table 2. Results obtained in the regression analyses.
BONE SIZE PIC MRS PIC DMD PIC
SHAPE ,0.0001 (10.66%) 0.0002 0.066 (10.8%) 0.3743 0.0009 (12.82%) 0.4902
Scapula MRS 0.0538 (19.79%) 0.1855
DMD 0.4929 (1.53%) 0.063
SHAPE ,0.0001 (16.56%) ,0.0001 ,0.0001 (31.44%) 0.3486 0.0077 (10.56%) 0.744
Humerus MRS 0.0237 (24.66%) 0.1728
DMD 0.739 (0.37%) 0.0894
SHAPE ,0.0001 (10.91%) 0.0025 0.0055 (21.67%) 0.516 0.012 (10.75%) 0.1789
Radius MRS 0.0055 (33.36%) 0.1775
DMD 0.2406 (4.33%) 0.1061
SHAPE ,0.0001 (17.08%) ,0.0001 0.0077 (24.04%) 0.8819 0.0241 (10.31%) 0.4738
Ulna MRS 0.0074 (31.78%) 0.1778
DMD 0.264 (3.9%) 0.1054
These regressions were computed from shape (Pco), maximum running speed (log-MRS) and daily movement distance (log-DMD) on size (log-Cs) for each forelimbbone, as well as, the multivariate regression analyses of shape (residuals from the previous regressions) on log-MRS and log-DMD (or their size-free residuals if it wasappropriate). The multivariate regression analyses of log-MRS and log-DMD were performed with a restricted dataset according with the availability of data for livingspecies in the literature (see Table S1). Results obtained when phylogenetic independent contrast (PIC) was applied for shape, size, MRS and DMD are also shown.Numbers indicate p-values. The percentages of each limb bone shape, log-MRS or log-DMD explained by the differences in the independent variable are given betweenbrackets.doi:10.1371/journal.pone.0085574.t002
Carnivoran Forelimb Evolution
PLOS ONE | www.plosone.org 6 January 2014 | Volume 9 | Issue 1 | e85574
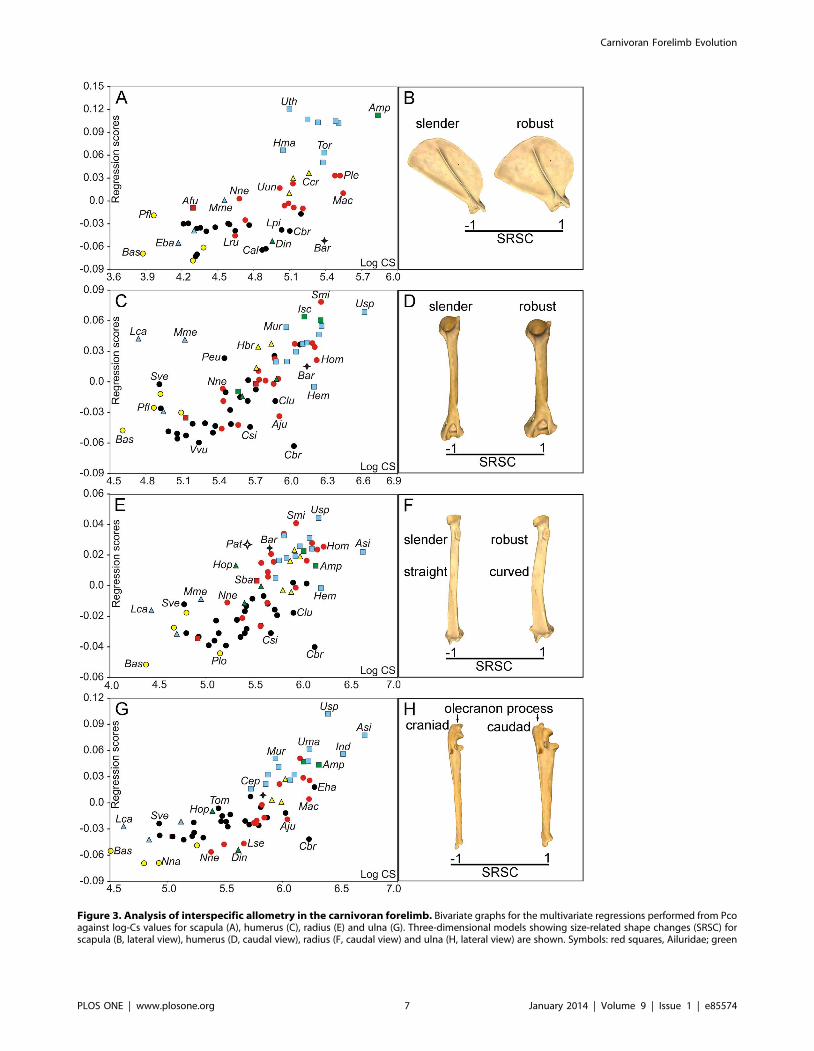
Figure 3. Analysis of interspecific allometry in the carnivoran forelimb. Bivariate graphs for the multivariate regressions performed from Pcoagainst log-Cs values for scapula (A), humerus (C), radius (E) and ulna (G). Three-dimensional models showing size-related shape changes (SRSC) forscapula (B, lateral view), humerus (D, caudal view), radius (F, caudal view) and ulna (H, lateral view) are shown. Symbols: red squares, Ailuridae; green
Carnivoran Forelimb Evolution
PLOS ONE | www.plosone.org 7 January 2014 | Volume 9 | Issue 1 | e85574

related with bone robustness (Figure 5D). Therefore, while species
with low MRS values have robust bones, those with high MRS
values show slender ones. In spite of this, multivariate regression
analyses performed for the PIC of shape on the PIC of log-MRS
were not statistically significant for any bone (Table 2).
Given that the OLS regressions of log-DMD on Cs were non-
significant for any bone with and without accounting for
phylogenetic effects (Table 2), log-DMD values did not need any
correction for size effects. Multivariate regressions for the size-free
shape of limb bones on log-DMD values were highly significant in
all cases (Table 2). With the exception of the ulna, the variation in
shape associated to a variation in DMD is mainly explained by a
change in bone robustness (Figure 6; File S3 E–H). As a result, the
bones from species with low DMD values are more robust than
those from species with high DMD values, which tend to be
slender. In the case of the ulna, however, low DMD values are
associated to a robust and straight anatomy, while high values
correspond to a slender and more curved condition (Figure 6H;
File S3 H). However, when phylogenetic independent contrast was
applied to the regression of shape on log DMD values, an absence
of statistical significance was obtained for the four bones (Table 2).
Limb bone shape spaces and their phylogenetic fillingA PCA performed with the covariance matrix for the regression
residuals of scapular shape indicated that the first three PCs
explained ,70% of the original variance. Figure 6A shows the
phylomorphospace depicted by the first two PCs and the
associated shape changes which these eigenvectors account for.
The first axis (Figure 7A x-axis) mainly depicts the changes from
the long and slender scapula of canids and procyonids, which score
positively, to the wide and robust one of bears, which shows a well-
developed postscapular fossa (which is captured by the landmarks
but not by the scanned surface) and take the most negative scores
(Figure. 7B; File S4 A). In contrast, the second axis (Figure 7A y-
axis) relates to the posterior extension of the metacromion process
(Figure 7B; File S4 A) and basically describes the changes from the
anatomy of felines, which score positively on this eigenvector, to
other species included in the sample. The third axis (Figure 8A y-
axis) is associated with a change in the extension of the teres major
process in two extinct taxa: Barbourofelis and Amphicyon. While
Barbourofelis scores positively and shows a small teres major process
(Figure 8A y-axis, B), Amphicyon scores negatively with a long
process (Figure 8A y-axis, B).
Figures 7C and 8C show the phylomorphospaces depicted by
PCI on PCII and PCI on PCIII, obtained from the PCA
performed on the covariance matrix of the regression residuals of
humeral shape, respectively. These eigenvectors account for
,65% of the original variance. Accordingly, the first PC
(Figure. 7C x-axis; File S4 B) describes a shape gradient from
the slender humeri of the long-legged maned wolf (Chrysocyon
brachyurus) plus other canine canids, which score positively on this
axis, to the robust humeri of the aquatic otter (Lontra canadensis) or
the Eurasian badger (Meles meles), which take the most extreme
negative scores (Figure 7D; File S4 B). In contrast, the second PC
(Figure 7C y-axis. File S4 B) describes the shape change between
the expanded greater tuberosity of the humerus in the living
hyenas, which score negatively, to the reduced greater tuberosity
of the humerus in all living bears, which take positive scores
(Figure 7D; File S4 B). The third PC (Figure 8C y-axis, D)
accounts for the curvature of the humeral shaft and also for the
relative expansion of the two epicondyles of the distal epiphysis.
Those species with positive scores –e.g., Machairodus, Nimravus and
Daphoenus– have a laterally curved shaft and an expanded medial
epicondyle (Figure 8C y-axis, D). In contrast, those species which
score negatively –Ursus spelaeus and some procyonids, mustelids
and hyaenids– have a straight humeral shaft and an expanded
lateral epicondyle (Figure 8C, D).
In the case of the PCA performed on the covariance matrix of
the regression residuals of radius shape, the first three PCs
explained ,67% of the original variance. Figure 7E shows the
phylomorphospace depicted by these first two eigenvectors as well
as the morphological changes that they account for. The first axis
mainly describes the change from the slender radius of most
canids, particularly evidenced in the long-legged Chrysocyon
brachyurus, which take extreme positive scores (Figure 7E x-axis,
F; File S4 C), to the robust radii of Lontra canadensis, the cave bear
Ursus spelaeus, the Pleistocene saber-tooth Smilodon, the creodont
Patriofelis, and the false-sabertooth Barbourofelis, which all score
negatively. In contrast, the second axis depicts a change in the
position of the bicipital tuberosity (Figure 7F y-axis; File S4 C).
The sloth bear Melursus ursinus has this tuberosity more proximally
placed (i.e., it is expanded towards the proximal epiphysis of the
radius) and scores with extreme negative values. In contrast, the
nimravid Pogonodon sp. and the Canadian river otter Lontra
canadensis have both a distally positioned (and more reduced)
bicipital tuberosity, showing positive scores (Figure 7E y-axis, F;
File S4 C). The third PC distributes the species according to the
position of the bicipital tuberosity and the expansion of the styloid
process (Figure 8E y-axis, F). The positive scores of hyaenids,
Barbourofelis and Smilodon indicate a more lateral orientation of the
bicipital tuberosity and an expanded styloid process (Figure 8E y-
axis, F). In contrast, the negative scores of ursids, procyonids and
Patriofelis result from a posterior orientation of the bicipital
tuberosity and a reduced styloid process (Figure 8E y-axis, F).
Figures 7G and 8G show the phylomorphospaces depicted by
PCI on PCII and the PCI on PCIII, derived from the PCA
performed on the covariance matrix of the regression residuals of
ulnar shape, respectively. The morphological changes accounted
for by these eigenvectors, which jointly explain ,81% of the
original variance, are depicted in Figure 7H. The first eigenvector
describes the morphological change from the robust ulna of the
saber-tooth Smilodon, which scores positively, to the slender ulna of
the maned wolf (Chrysocyon. brachyurus), which takes negative scores
(Figure 7G x-axis, H; File S4 D). In contrast, the second
eigenvector accounts for the morphological gradient related with
the length and orientation of the olecranon process. While all
living bears score negatively on this axis, which results from their
short and caudally oriented olecranon, most felid-like carnivores
score positively, which evidences the presence of a long olecranon,
which is aligned with the shaft (Figure 7G y-axis, H; File S4 D).
The third PC depicts a change in curvature of the ulnar shaft
(Figure 8G y-axis, H). Positive scores on this axis correspond to an
antero-posteriorly curved shaft, typical of most canids and other
species like Crocuta crocuta, Lontra canadensis and Smilodon (Figure 8G
y-axis, H). Those species with negative scores –Chrysocyon
brachyurus, Leptailurus serval, Neofelis nebulosa, Tremarctos ornatus and
Nasua nasua, among others– have a straight ulnar shaft (Figure 8G
y-axis, H).
squares, Amphicyonidae; black stars, Barbourofelidae; black circles, Canidae; empty stars, Creodonta; red circles, Felidae; yellow triangles, Hyaenidae;blue triangles, Mustelidae; green triangles, Nimravidae; yellow circles, Procyonidae; blue squares, Ursidae. See file S1: table S1 for species labels. Forthe interactive three-dimensional shape models explained by the variations in size, see file S3, A–D.doi:10.1371/journal.pone.0085574.g003
Carnivoran Forelimb Evolution
PLOS ONE | www.plosone.org 8 January 2014 | Volume 9 | Issue 1 | e85574

Phylogenetic patterns in limb bone shape spaces andancestral bone reconstruction
Visual inspection of the phylomorphospace depicted from
scapular shape in Figures 7A and 8A shows that although many
terminal branches of the tree are relatively short, the internal
branches are longer. This is also applied to Barbourofelis and
Amphicyon in Figure 8A, because despite that they are terminal
branches, they also represent different families. This suggests that
closely related species have similar scapular shapes and, as a
consequence, the different carnivoran families are confined to well
differentiated portions of the shape space (Figures 7A and 8A).
This indicates that phylogenetic legacy had a strong influence on
the evolution of scapular morphology, which is highly conservative
within families. In fact, the reconstructed ancestral states for the
internal nodes of the phylogenetic tree (Figure 2) indicate that the
ancestors from each carnivoran family all showed different
scapular shapes (Figure 9A) and that these shapes were maintained
during their evolution (i.e., the taxa that belong to the same family
experienced few changes in scapular morphology). Strikingly, the
phylomorphospaces depicted from the shape of three major long
bones (i.e., humerus, radius and ulna) are clearly more ‘‘messy’’
than the one performed from the scapula (compare Figure 7A and
8A with Figures 7C, E, G and 8C, E, G), indicated by the presence
of many long terminal branches and relatively short internal
branches. This pattern suggests a high level of homoplasy [86,87].
In fact, the reconstructed ancestral states for these three bones
(Figure 9B, C, D) clearly indicate that although the basal family
nodes are different, these shapes were not maintained through the
evolution of those taxa that belong to the same family. In contrast,
other potential aspects influence the shape of these long bones and
override to some extent their phylogenetic structure. This
difference may be explained if we consider that the scapula,
which is part of the shoulder girdle, has a different origin and
evolutionary history compared to the long bones [105]. Further-
more, there may be also structural reasons, because the long bones
are more exposed than the scapula to changes in robustness due to
their particular shape and structural position within the forelimb.
Discussion
Phylogeny and size as the main sources of bone shapevariation
According to the permutation test, there is a strong phylogenetic
signal in the shape and size of all forelimb bones. This indicates
that evolutionary changes in both size and shape in the bones of
the forelimb are highly conservative within the order Carnivora.
Furthermore, as the species included in our analyses cover a wide
range of size and morphology in both the living and extinct taxa,
these results are not likely to be an artefact from sampling bias. In
contrast, we hypothesize that the morphology and size of the main
forelimb bones were acquired early in the typical ‘‘bauplan’’ of
each carnivoran family. This result is not surprising, as many
authors have found similar significant results for several taxa
[9,23,36]. It is worth noting, however, that collecting more data
for some families with a high variability in locomotor modes (e.g.,
mustelids) may give additional information about the effect of the
phylogenetic structure in the evolution of forelimb shape and size.
Furthermore, we have only tested here the evolution of size under
the model of Brownian motion. Future research for testing other
models of size evolution (e.g., Ornstein-Uhlenbeck) could add new
information on the possible trends in size change followed during
the evolution of the different forelimb bones.
In agreement with previous studies [3,32,35,106,107], our
results demonstrate that the morphology of the forelimb bones is
highly influenced by variations in size. This significant association
does not merely result from a secondary correlation in the
phylogeny, as indicated by phylogenetic independent contrast.
With the only exception of the radius and ulna, size-related shape
changes are mainly associated with the degree of bone robustness.
Allometric shape change relates in the radius to the curvature of
the diaphyseal shaft. In the ulna there is a change in the
orientation of the olecranon process.
Therefore, our results agree with the prediction that larger
animals need more robust limb bones for resisting the increase in
stress resulting from increased body mass [106]. However, other
scaling studies in mammalian limb bones [108,109] have
demonstrated that no general scaling rule applies, because there
are alternative mechanisms for reducing the peak stresses on the
bones, for example to increase the effective mechanical advantage
by adopting a more upright posture [108,109]. However, it is
worth mentioning that Day and Jayne [110] found compelling
evidence for the absence of a relationship in the family Felidae
between changes in posture, on the one hand, and both size and
walking gait, on the other. Our results indicate that allometric
shape changes relate in the ulna with changes in body posture.
Furthermore, the absence in this bone of changes in robustness
associated to size variations probably reflects that it is marginally
connected to the wrist (i.e., the carpals) and most of the ground
reaction force is transmitted through the radius shaft. The case of
the radius is also striking, because while larger animals have more
robust radii than smaller ones, they also have a more curved
diaphyseal shaft. This could be also associated with the necessity to
withstand greater stresses, as this curvature may be linked with the
fact that the distal epiphysis increases in robustness with size more
than the proximal one.
Locomotor performance as a not significant source ofshape variation
A good correlation between shape and MRS was obtained for
each forelimb bone. However, this correlation disappears when
phylogenetic independent contrast is applied. There are two
possible causes that could explain the absence of correlation
between shape and MRS. The first is that MRS does not affect the
shape of the forelimb bones. The second explanation, however,
could result from the fact that reliable MRS data of carnivores are
scarce in the literature (only 20 species) and this scarcity could be
hiding the actual correlation. Furthermore, it is worth mentioning
that MRS data may be biased towards the large terrestrial
carnivorans, as MRS data for arboreal or burrowing species are
comparatively scarce (see File S1: Table S1). In spite of this,
previous research with larger samples that include other mam-
malian orders and using conventional metric variables have shown
only modest correlations between forelimb shape and MRS [4,98].
Similarly to the case of MRS, all bone shapes correlate with
daily movement distance (DMD), showing a morphological
change associated with bone robustness. Those species with higher
DMD values have more slender bones and vice versa. This is in
agreement with the widespread thought that longer and slender
limbs increase locomotor efficiency [13,111]. However, this
correlation vanished when phylogenetic independent contrast
was applied to our data. Therefore, our results indicate that both
DMD and bone shape are strongly influenced by phylogenetic
pattering, because those carnivores from the same family have a
restricted range of DMD values but these aspects vary indepen-
dently within each family.
MRS and DMD are two widespread used proxies for hunting
styles and running abilities of predators, respectively. Given that
our data suggest that the shape of the forelimb bones is not
Carnivoran Forelimb Evolution
PLOS ONE | www.plosone.org 9 January 2014 | Volume 9 | Issue 1 | e85574

Figure 4. Analysis of evolutionary allometry in the carnivoran forelimb. Multivariate regressions obtained from the PIC Procrustescoordinates (Pco) against the PIC log-centroid size (Cs) and models showing the size-related changes in shape (SRSC) for each bone. Scapula (A, B),humerus (C, D), radius (E, F), ulna (G, H). See file S1: table S1 for species labels.doi:10.1371/journal.pone.0085574.g004
Carnivoran Forelimb Evolution
PLOS ONE | www.plosone.org 10 January 2014 | Volume 9 | Issue 1 | e85574
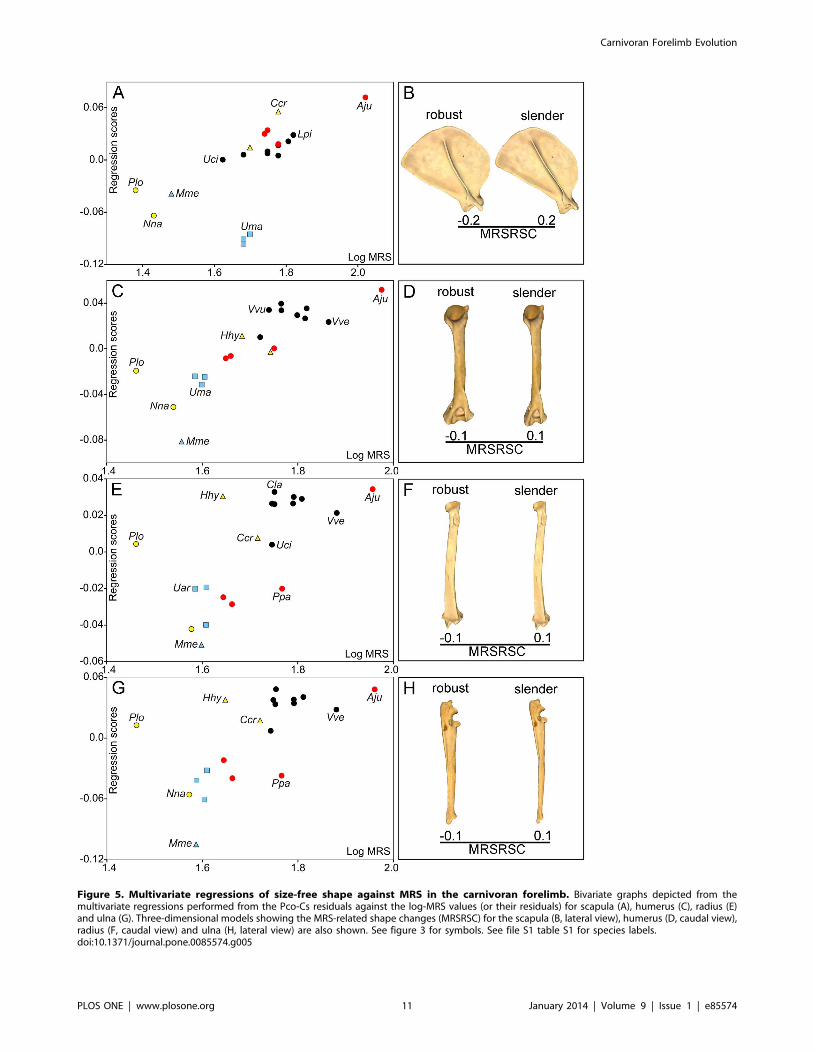
Figure 5. Multivariate regressions of size-free shape against MRS in the carnivoran forelimb. Bivariate graphs depicted from themultivariate regressions performed from the Pco-Cs residuals against the log-MRS values (or their residuals) for scapula (A), humerus (C), radius (E)and ulna (G). Three-dimensional models showing the MRS-related shape changes (MRSRSC) for the scapula (B, lateral view), humerus (D, caudal view),radius (F, caudal view) and ulna (H, lateral view) are also shown. See figure 3 for symbols. See file S1 table S1 for species labels.doi:10.1371/journal.pone.0085574.g005
Carnivoran Forelimb Evolution
PLOS ONE | www.plosone.org 11 January 2014 | Volume 9 | Issue 1 | e85574

Figure 6. Multivariate regression between shape and DMD in the carnivoran forelimb. Bivariate graphs depicted from the multivariateregressions performed from the Pco-Cs residuals against the log-DMD values for scapula (A), humerus (C), radius (E) and ulna (G). Three-dimensionalmodels showing the DMD-related shape changes (DMDRSC) for the scapula (B, lateral view), humerus (D, caudal view), radius (F, caudal view) andulna (H, lateral view) are also shown. See figure 3 for symbols. See file S1: table S1 for species labels. For the interactive three-dimensional shapemodels explained by the variations in DMD, see file S3, E–H.doi:10.1371/journal.pone.0085574.g006
Carnivoran Forelimb Evolution
PLOS ONE | www.plosone.org 12 January 2014 | Volume 9 | Issue 1 | e85574

Figure 7. Principal component analyses in the carnivoran forelimb, PC I and PC II. Bivariate graphs depicted from the two first PCscalculated on the PIC regression residuals (see text for details) for scapula (A), humerus (C), radius (E) and ulna (G). Tree topology is also mapped onthe morphospaces. Three-dimensional models showing the shape changes associated to these axes for scapula (B, lateral view), humerus (D, caudalview), radius (F, caudal view) and ulna (H, lateral view) are shown. Blue empty circle: tree root; see figure 3 for more symbols. See file S1: table S1 forspecies labels. For the interactive three-dimensional shape models explained by the PCs, see file S4, A–D.doi:10.1371/journal.pone.0085574.g007
Carnivoran Forelimb Evolution
PLOS ONE | www.plosone.org 13 January 2014 | Volume 9 | Issue 1 | e85574

Figure 8. Principal component analyses in the carnivoran forelimb, PC I and PC III. Bivariate graphs depicted from the first and third PCscalculated on the PIC regression residuals (see text for details) for scapula (A), humerus (C), radius (E) and ulna (G). Tree topology is also mapped onthe morphospaces. Three-dimensional models showing the shape changes associated to these axes for scapula (B, medial view), humerus (D, caudalview), radius (F, caudal view) and ulna (H, lateral view) are shown. b. t., bicipital tuberosity; l. e., lateral epicondyle; m. e., medial epicondyle. Seefigure 3 and 7 for symbols. See file S1: table S1 for species labels.doi:10.1371/journal.pone.0085574.g008
Carnivoran Forelimb Evolution
PLOS ONE | www.plosone.org 14 January 2014 | Volume 9 | Issue 1 | e85574

Figure 9. Reconstruction of ancestral forelimb bone shapes. Scapula (A), humerus (B), radius (C), ulna (D). Three-dimensional models showhypothetical morphologies for the nodes highlighted (black circles).doi:10.1371/journal.pone.0085574.g009
Carnivoran Forelimb Evolution
PLOS ONE | www.plosone.org 15 January 2014 | Volume 9 | Issue 1 | e85574

indicative of those aspects of locomotion recovered by both MRS
and DMD, these results are in part counter intuitive, as one of the
main functions of the appendicular skeleton is locomotor
performance (but see Harris and Steudel [100]). In any case,
inspection of the distribution of taxa in the phylomorphospaces for
the four major forelimb bones may provide insights on such
unexpected results. However, we must emphasize that this does
not mean that bone morphology does not reflect functional
adaptations, as many other aspects of locomotor behavior (e.g.,
climbing, burrowing or swimming) are not directly related to MRS
and DMD. Furthermore, although for many carnivorans included
in this study MRS has little impact on whether or not these
predators can acquire their prey (e.g., mustelids and procyonids),
this is actually reflected in their low values for this variable (see
Table S1).
Phylomorphospaces and morphological variabilityThe separate distribution of carnivoran families in the scapular
shape spaces suggests a strong influence of phylogenetic legacy on
the evolution of this bone. Furthermore, the reconstructed
ancestral states for scapular morphology indicate that these states
were acquired early in the evolution of each family and, once
acquired, they remained constant among taxa within families. In
contrast, the shapes of the three long bones show more overlap
between the families in their respective phylomorphospaces, as
indicated by a more ‘‘messy’’ appearance, which suggests higher
levels of homoplasy. As a result, it may be deduced that the
influence of functional factors on these bones could be overriding
the phylogenetic legacy of each family, at least more than in the
case of the scapula. In fact, the first PC’s for these three bones
arrange the species according to their degree of bone robustness
(see Figure 7), showing that distantly related taxa may exhibit
similar morphologies. For example, on the one hand, a slender
anatomy for humerus, radius and ulna is present in most canine
canids (with the manned wolf, Chrysocyon brachyurus, as the most
extreme example), hyaenids, the cheetah (Acinonyx jubatus), the
bobcat (Lynx rufus) and the serval (Leptailurus serval) among the felids,
the extinct ‘‘dog-like’’ bear Hemicyon among the ursids, and the
racoon (Procyon lotor) among the procyonids. A slender condition
has been usually interpreted as an adaptation of long bones to
reduce the energetic costs of terrestrial locomotion by decreasing
the moment of inertia of limbs and by increasing stride length
[13,32,112]. Therefore, to have slender long bones allows the
animal to travel longer distances on the ground (by increasing
stamina) and/or to run faster. In other words, this adaptation is
related with cursoriality [12,13,26,32,113,114].
However, there are multiple ecological scenarios where this
morphological trait can enhance fitness [13,113]. For instance, it is
clear that this morphology represents an adaptation for the
cheetah to increase speed during active pursuit of prey [113,115].
In contrast, the slender long bones of most pack-hunting canids
and hyenids mainly reflect their adaptation towards increasing
stamina during long distance foraging [13,99,116]. In the case of
the serval, the scenario is quite different as its slender forelimb
bones most probably represent an adaptation for walking over the
tall grasses typical of its habitat [13,110]. The racoon also has a
slender forelimb, which probably reflects an adaptation for its
special manipulatory abilities [117].
On the other hand, there are distantly related species with
extremely robust forelimb bones (see Figure 7). This is the case of
the Canadian river otter (Lontra canadensis) and the European
badger (Meles meles) among the mustelids, the saber-tooth cat
Smilodon sp. and the ‘‘false’’ saber-tooths Barbourofelis sp. and
Hoplophoneus sp., among cats and ‘‘cat-like’’ species, and Patriofelis
sp. for the extinct order Creodonta. The case of the bush dog
(Speothos venaticus) is also interesting, as this hypercarnivorous canid
diverges from other canine canids towards more robust limb
bones, although it does not reach the level of the species cited
above. The presence of robust forelimb bones has been
traditionally interpreted as an adaptation for resisting axial and
bending stresses [14]. However, such stresses can result from
different activities depending on specific life styles. For example,
the robust forelimb of saber-tooths has been previously proposed
by other authors to be an adaptation to grasp and subdue their
prey to perform a quick and highly specialized killing bite in the
throat [12,14,22,26], because their highly elongated and laterally
compressed canines precluded these predators to use them for
immobilizing their prey [118]. However, in other taxa the
possession of a robust forelimb may represent different adaptations
depending upon their ecological strategies. For example, the
robust forelimb of the otter represents an undisputable adaptation
to swim [113] which could be also the case of the bush dog, which
has a semiaquiatic life style and shows webbed feet [119,120].
Patriofelis sp. also has a robust radius. Although it is worth noting
that this species was initially thought to be aquatic or semi-aquatic
[121], Osborn [122] established a felid-like behavior rather than a
semi-aquatic life style for this taxon. In the case of the European
badger, however, its robust forelimb reflects an adaptation to dig
burrows [12,18,113].
In summary, species with different ecologies but similar
biomechanical needs share parallel morphological changes
towards limited zones of the morphospace (i.e., robust vs. slender
bones). According to the results obtained in PCA, we hypothesize
that, after accounting for size differences, the main factor shaping
forelimb bones was a trade-off between the need of powerful bones
for resisting different kinds of stresses and the need of reducing the
cost of locomotion by having a slender forelimb, as was previously
proposed for dog breeds by Carrier and colleagues [123,124].
However, as noted above, there are many ecological and
behavioral contexts which could favour one or another biome-
chanical and/or morphological solution. As a consequence, there
are several morphological convergences among species with quite
different ecological habits. Most probably, the results obtained in
PCA could explain why there is a poor correlation between
forelimb bone shape and both proxies for locomotor performance
(i.e., MRS and DMD). However, we must take into account the
importance of considering all bones together, particularly in those
cases where the relative proportions of elements become more
important for interpreting locomotor performance. For example,
both semi-aquatic carnivorans and rodents show relatively short
and robust femora, which are paired with a relatively elongated
tibia and enlarged metatarsals [7,26]. The result is that if these
elements are considered separately, it could lead to incorrect
interpretations.
Although the main variance in shape obtained with the PCA
performed with all forelimb bones –i.e., the variance accounted for
by the first PC– is related with changes in the degree of robustness
described above, the second and third PCs account for morpho-
logical changes with other biomechanical implications. The reason
is straightforward, as these morphological features indicate
different functional adaptations related to different biomechanical
needs. The importance of some muscles for limb join mobility is
clearly reflected in these morphological changes. For example, the
second PC obtained from the shape of the scapula accounts for
changes in the expansion of the acromion and metacromion
processes (see Figure 7A, B). Accordingly, felids have both
processes more expanded (see Figure 7A, B), which could reflect
an emphasized function for the acromiodeltoid muscle, which
Carnivoran Forelimb Evolution
PLOS ONE | www.plosone.org 16 January 2014 | Volume 9 | Issue 1 | e85574

originates from them [51]. This fact could be associated with the
reported counteraction of the ground reaction forces during
locomotion in this family [125]. In contrast, the third component
obtained from scapula shape distinguishes the expansion of the
teres major process in two extinct taxa: Amphicyon –with an
expanded process– and Barbourofelis –with a reduced process– (see
Figure 8A, B), which probably indicates more emphasis on the
function performed by this muscle in the first taxa. However, to
derive ecological interpretations here is too speculative, as there is
an absence of close living relatives and ecological analogues for
both extinct taxa.
The second component of humeral variability accounts for a
change in the greater tuberosity (see Figure 7D). This tuberosity
represents the insertion of the supraspinatus muscle (see Figure 1),
which mainly function is to protract the humerus [51]. Although
this trait shows a strong phylogenetic signal (see Figure 7C), it also
has biomechanical implications, because the moment arm for the
supraspinatus muscle indicates its relevance during locomotion. In
those species with a larger moment arm (e.g., felids, canids and,
especially, hyaenids [126]), this muscle plays an important role
during galloping. The reason is that the supraspinatus muscle
assists other muscles in the extension phase of the stance, at least in
the case of canids [127]. In contrast, the species with a smaller
moment arm (e.g., ursids, ailurids and procyonids) rarely gallop, so
the function of this muscle in them is to stabilize the shoulder joint
[127].
We hypothesize that the changes in the curvature of the
humeral shaft and in the expansion of the distal epicondyles
accounted for by the third PC (see Figure 8D) may be related to
changes in animal posture (i.e., adducted or abducted forelimbs).
The expansion of the medial epicondyle is associated with an
increased mechanical advantage of the pronator teres muscle and
of the digital flexor muscles [50]. In addition, a laterally curved
humeral shaft indicates an adducted position for the humerus.
Accordingly, the humeral shaft remains vertical to transmit the
axial loads with a more pronated forepaw. However, we urge
readers to interpret this with caution, because the three taxa that
show this peculiar morphology, which score positively on PCIII,
are extinct –Machairodus, Nimravus and Daphoenus (see Figure 8C; y-
axis). Although in a lesser degree, felids and borophagines also
have an expanded medial epicondyle, which may suggest a
similarity in the function of the forepaw between these two groups.
Nevertheless, this morphological coincidence does not imply
necessarily an ecological convergence, as several muscles and
strucutures are involved. In the opposite extreme of PCIII (i.e.,
those taxa with negative scores), the humeri have a straight shaft
and an expanded lateral epicondyle, which both indicate a more
vertical position for this bone and an increased ability to supinate
the forearm. This morphology is common to procyonids, hyaenids,
some ursids and canines. Therefore, due to the ecological
variability of these taxa, the expansion of the lateral epicondyle
is also difficult to interpret from an ecological point of view.
The PCA performed from radius shape indicate that the second
and third eigenvectors account for changes in the bicipital
tuberosity of the radius (Figure 7F; Figure 8F), which reflects the
forces exerted by the biceps brachii muscle. It is worth noting that
this muscle is inserted in the bicipital tuberosity (Figure 1).
Accordingly, felids and ursids have a more proximal and
posteriorly positioned bicipital tuberosity, which indicates a more
important role of the biceps brachii in the forearm movements. In
contrast, fully terrestrial canids or hyaenids have a more distal
and/or lateral position of the bicipital tuberosity, which suggests a
minor role of the biceps brachii to perform forearm movements.
Given that the position of bicipital tuberosity along both the
proximo-distal and latero-medial axes is not related with the
insertion area of the biceps brachii, there is not an unequivocal
link between the position of the former and the development of the
later. The third component shows also an expansion of the styloid
process in several taxa analyzed, mainly hyaenids (Figure 8E, F),
which points towards a reduced mediolateral mobility of the
forepaw in this group. In contrast, a reduced styloid process
provides higher mobility to the wrist, which is likely associated
with the manipulating and climbing abilities of ursids and
procyonids, as they occupy this area of the morphospace
(Figure 8E, F).
The change in the length and orientation of the olecranon
process of the ulna, depicted by PCII, implies a variation of the
moment arm for the major forearm extensor, the triceps brachii
muscle (Figure 1). For example, the triceps brachii muscle is less
powerful when the olecranon is short and caudally oriented.
However, with a long and cranially oriented olecranon, the triceps
brachii muscle is more powerful and functions with a more flexed
forearm. These shape differences would indicate different loco-
motor abilities. Accordingly, ursids show a short and caudally
oriented olecranon (Figure 7G, H) and, therefore, have a more
upright posture and less mechanical advantage of the triceps
brachii muscle. Canids and hyaenids have a moderately long and
caudally oriented olecranon process (Figure 7G, H), a trait which,
together with their slender ulna, is characteristic of fully terrestrial
carnivores [12]. Cats and ‘‘cat-like’’ species (i.e., barbourofelids
and nimravids) have a longer and more cranially oriented
olecranon, which is associated with their hunting strategy: modern
felids use their forearms for manipulating and subduing their prey
before the killing bite [12,14,22,26], thus needing a powerful
triceps brachii to exert enough force. The position of the forelimb
in these situations is usually more flexed than in the normal
standing posture and, probably for this reason, the olecranon is
cranially oriented.
The third PC shows a morphological change associated with a
posterior curvature of the ulnar shaft (see Figure 8H), which allows
a more upright posture for the limb while keeping constant the
orientation of the olecranon and, thus, the mechanical advantage
for the triceps brachii muscle. Therefore, these morphological
changes are associated with a different way to increase the
mechanical advantage for the triceps brachii when the forearm is
extended than the one showed by PCII. The distribution of species
along this axis (Figure 8G) indicates that some of them belonging
to different groups have achieved the curved ulna independently –
Speothos venaticus, Crocuta crocuta, Lontra canadensis–, and probably in
response to different ecological contexts. The species placed in the
opposite extreme –Chrysocyon brachyurus, Neofelis nebulosa, Leptailurus
serval, Tremarctos ornatus– also suggest an independent evolution
under different ecological scenarios.
Conclusions
The most important bone elements of the forelimb represent a
remarkable case of evolution in which similar morphologies were
acquired to afford the same biomechanical necessities generated in
extremely different ecological scenarios. The results of PCA can be
interpreted as evidencing that most of the morphological variation
in all these bones is associated with two morphological solutions
(slender vs. robust) for affording several ecological problems. For
example, robust forelimb bones evolved towards manipulating
large prey (as in the case of saber-tooths), towards digging (in the
case of the European badger), or for maneuvering during
swimming (in the case of the Canadian river otter). Therefore,
different ecological requirements can be solved with a single
Carnivoran Forelimb Evolution
PLOS ONE | www.plosone.org 17 January 2014 | Volume 9 | Issue 1 | e85574

morphology, in this case having robust bones, as they have similar
biomechanical demands. In contrast, slender bones evolved
towards fast-running (in the case of the cheetah) or to travel
longer distances by increasing stamina (in the case of foxes or
wolves). Again, the same morphological solution (slender limbs)
addresses different ecological problems with similar biomechanical
demands. So, we hypothesize that the morphology of the forelimb
bones is constrained towards being slender and robust. With only
these two morphological extremes, different unrelated taxa have
been adapted to afford the same biomechanical requirements in
different ecological scenarios. Therefore, the ‘‘general morpholo-
gy’’ of the forelimb bones represents an extreme ‘‘one-to-many
mapping’’ case with a remarkable absence of specific morpholog-
ical convergences towards the same ecological environments. We
propose that this absence of a high phenotypic variability in the
forelimb bones is probably associated to balance a trade-off
between maintaining resistance to stresses and increasing the
energetic efficiency of locomotion. As a consequence, those species
in which resistance to different stresses was enhanced at the
expense of reducing locomotion efficiency evolved towards having
more robust forelimb bones. In contrast, those species that have a
more efficient locomotion evolved towards a more slender
condition. However, there are many environmental regimes (or
ecologies) in which one or another morphological solution could
be favoured by natural selection. This ‘‘one-to-many mapping’’
case between shape and ecology led to an absence of correlation
between the shape of the forelimb bones and both MRS and
DMD.
In spite of these, some morphological changes indicative of
specific adaptations to improve the function of the forelimb
through the modification of muscle mechanical advantages and
joint mobility are also recognized in PCA. However, these
functional adaptations are very diverse and they hardly reflect
ecology, as one trait could be useful for different activities.
Therefore, we will use in future projects other analyses such us
canonical variates analysis or linear discriminant functions in the
search for specific bone shape features that finely reflect functional
adaptations in carnivorans –instead of PCA, which allows
describing the major axes of shape variation. Accordingly,
although in this paper we quantify the general morphology of
the forelimb bones and its meaning, future research will be
conducted to find those bone features that better reflect specific
functional adaptations.
Supporting Information
File S1 TABLE S1. Sample sizes used in this study for each
forelimb bone (S, scapula; H, humerus; R, radius; U, ulna). Log-
transformed values of daily movement distance (DMD, km per
day) and maximal running speed (MRS, km?h21) for those taxa
with available data in the literature are also shown. Daggers ({)
represents extinct species. Numbers indicate source references.
TABLE S2. List of specimens for the living species included in this
paper. Host institution and identity number (ID) are indicated.
AMNH, American Museum of Natural History (New York);
NHM, Natural History Museum (London). * Indicates a specimen
in which the scapula was absent; the four bones analyzed here
were present for the remaining specimens. TABLE S3. List of
fossil specimens included in this paper. Host institution and
identity number (ID) are indicated. AMNH, American Museum of
Natural History (New York); NHM, Natural History Museum
(London); NMB, Naturhistorisches Museum (Basel); MNCN,
Museo Nacional de Ciencias Naturales (Madrid); MSN, Museo
di Storia Naturale (Firenze); SNM, Staten Naturhistoriske
Museum (Copenhagen); MCNV, Museo de Ciencias Naturales
de Valencia (Valencia). TABLE S4. Detailed description of the
anatomical position of each landmark used in this study. TABLE
S5. Stratigraphic ranges and time of divergence for the extinct
taxa included in the composite tree used in this paper. The source
references for phylogenetic position and stratigraphic range are
indicated. The time of divergence of two extinct species (Arctodus
simus and Ursus spelaeus) have been obtained from molecular data
(MD). The time of divergence for the order Creodonta and the
family Amphicyonidae was conditioned by the times of divergence
given by Nyakatura and Bininda-Emonds (2012) for the living
Carnivora. References are listed in the main text.
(DOC)
Figure S1 Detailed figure of the landmarks used in thispaper.(TIF)
File S2 Nexus file of the composite tree used in thispaper.(PDF)
File S3 Interactive three-dimensional models of shapevariation in the carnivoran forelimb. Size-related shape
changes for scapula (A), humerus (B), radius (C) and ulna (D).
Shape changes accounted for by variation in DMD in the scapula
(E), humerus (F), radius (G) and ulna (H). Left indicates negative
regression scores and right positive ones.
(PDF)
File S4 Three-dimensional models showing the shapechanges obtained from the PCA’s. A, scapula; B, humerus;
C, radius; D, ulna. PC I top, PC II bottom; left for negative scores,
right for positive scores.
(PDF)
Acknowledgments
We are especially grateful to F. Serrano, J. A. Perez-Claros, C. M. Janis, M.
Laurin, J. X. Samuels and the two anonymous reviewers for their
comments and suggestions during the elaboration of this paper, as they
improve greatly its quality. We are also grateful to S. Almecija for
providing us the bone scanning surfaces. We thank J. Galkin and E.
Westwig (AMNH, New York), R. Portela and A. Currant (NHM, London),
J. Morales and M. J. Salesa (MNCN, Madrid), M. Belinchon (MCNV,
Valencia), L. Costeur (NMB, Basel), E. Cioppi (MSN, Firenze) and K. L.
Hansen (SNM, Copenhagen) for kindly providing us access to the
specimens under their care.
Author Contributions
Conceived and designed the experiments: AMS BF PP. Performed the
experiments: AMS. Analyzed the data: AMS BF PP. Contributed
reagents/materials/analysis tools: AMS BF. Wrote the paper: AMS BF PP.
References
1. Ewer RF (1973) The Carnivores. Ithaca, NY: Cornell University Press. 494 p.
2. Biewener AA (2003) Animal Locomotion. Oxford: Oxford University Press.
281 p.
3. Alexander RM (2003) Principles of Animal Locomotion. Princeton: Princeton
University Press. 371 p.
4. Garland TJ, Janis CM (1993) Does metatarsal/femur ratio predict maximal
running speed in cursorial mammals? J Zool 229: 133–151.
5. MacLeod N, Rose KD (1993) Inferring locomotor behavior in Paleogene
mammals via eigenshape analysis. Am J Sci 293: 300–355.
Carnivoran Forelimb Evolution
PLOS ONE | www.plosone.org 18 January 2014 | Volume 9 | Issue 1 | e85574

6. Argot C (2001) Functional-adaptive anatomy of the forelimb in theDidelphidae, and the paleobiology of the Paleocene marsupials Mayulestes ferox
and Pucadelphys andinus. J Morphol 247: 51–79.
7. Samuels JX, Van Valkenburgh B (2008) Skeletal indicators of locomotoradaptations in living and extinct rodents. J Morphol 269: 1387–1411.
8. Halenar LB (2011) Reconstructing the locomotor repertoire of Protopithecus
brasiliensis. II. Forelimb morphology. Anat Rec 294: 2048–2063.
9. Ercoli MD, Prevosti FJ, Alvarez A (2012) Form and function within a
phylogenetic framework: locomotory habits of extant predators and someMiocene Sparassodonta (Metatheria). Zool J Linn Soc-Lond 165: 224–251.
10. Janis CM, Shoshitaishvili B, Kambic R, Figueirido B (2012) On their knees:distal femur asymmetry in ungulates and its relationship to body size and
locomotion. J Vertebr Paleontol 32: 433–445.
11. Gonyea WJ (1978) Functional implications of felid forelimb morphology. ActaAnat 102: 111–121.
12. Van Valkenburgh B (1987) Skeletal indicators of locomotor behavior in livingand extinct carnivores. J Vertebr Paleontol 7: 162–182.
13. Janis CM, Wilhelm PB (1993) Were there mammalian pursuit predators in the
Tertiary? Dances with wolf avatars. J Mammal Evol 1: 103–125.
14. Anyonge W (1996) Locomotor behaviour in Plio-Pleistocene sabre-tooth cats: A
biomechanical analysis. J Zool 238: 395–413.
15. Andersson K (2003) Locomotor evolution in the Carnivora (Mammalia):evidence from the elbow joint. Doctoral dissertation, Department of Earth
Sciences, Hist. Geol. and Pal, University of Uppsala, Sweden.
16. Andersson K, Werdelin L (2003) The evolution of cursorial carnivores in the
Tertiary: implications of elbow-joint morphology. Proc R Soc Lond B (Suppl.)270: S163–S165.
17. Andersson K (2005) Were there pack-hunting canids in the Tertiary, and how
can we know? Paleobiology 31: 56–72.
18. Schutz H, Guralnick RP (2007) Postcranial element shape and function:
Assessing locomotor mode in extant and extinct mustelid carnivorans.Zool J Linn Soc 150: 895–914.
19. Meachen-Samuels JA, Van Valkenburgh B (2009) Forelimb indicators of prey-
size preference in the Felidae. J Morphol 270: 729–744.
20. Meachen-Samuels JA, Van Valkenburgh B (2010) Radiographs reveal
exceptional forelimb strength in the sabertooth cat, Smilodon fatalis. PLoS one5:e11412.
21. Figueirido B, Janis CM (2011) The predatory behaviour of the thylacine:
Tasmanian tiger or marsupial wolf? Biol letters 7: 937–940.
22. Meachen-Samuels JA (2012) Morphological convergence of the prey-killing
arsenal of sabertooth predators. Paleobiology 38: 715–728.
23. Walmsley A, Elton S, Louys J, Bishop LC, Meloro C (2012) Humeralepiphyseal shape in the felidae: the influence of phylogeny, allometry, and
locomotion. J Morphol 273: 1424–1438.
24. Meloro C, Elton S, Louys J, Bishop LC, Ditchfield P (2013) Cats in the forest:
predicting habitat adaptations from humerus morphometry in extant and fossilFelidae (Carnivora). Paleobiology 39: 323–344.
25. Fabre AC, Cornette R, Slater G, Argot C, Peigne S, et al. (2013) Getting a grip
on the evolution of grasping in musteloid carnivorans: a three-dimensionalanalysis of forelimb shape. J Evol Biol 26: 1521–1535.
26. Samuels JX, Meachen JA, Sakay SA (2013) Postcranial morphology and thelocomotor habits of living and extinct carnivorans. J Morphol 274: 121–146.
27. Alberch P (1980) Ontogenesis and Morphological Diversification. Am Zool 20:
653–667.
28. Smith JM, Burian R, Kauffman S, Alberch P, Campbell J, et al. (1985)
Developmental constraints and evolution: a perspective from the MountainLake conference on development and evolution. Q Rev Biol 60: 265–287.
29. Schwenk K, Wagner GP (2003) Constraint. In: Hall BK, Olson WM, editors.
Key words and concepts in evolutionary developmental biology. Cambridge,MA: Harvard University Press. pp. 52–61.
30. Biewener AA (1983) Locomotory stresses in the limb bones of two smallmammals: the ground squirrel and chipmunk. J Exp Biol 103: 135–154.
31. Schmidt-Nielsen K (1984) Scaling: why is animal size so important? Cambride,
UK: Cambridge University Press. 241 p.
32. Hildebrand M (1985) Walking and running. In: Hildebrand M, Bramble DM,
Liem KF, Wake DB, editors. Functional Vertebrate Morphology. Cambridge,MA: Harvard University Press. pp. 38–57.
33. Biewener AA (1989) Scaling body support in mammals: limb posture and
muscle mechanics. Science 245: 45–48.
34. Alexander RM (2005) Models and the scaling of energy costs for locomotion.
J Exp Biol 208: 1645–1652.
35. Biewener AA (2005) Biomechanical consequences of scaling. J Exp Biol 208:1665–1676.
36. Fabre AC, Cornette R, Peigne S, Goswami A (2013) Influence of body mass on
the shape of forelimb in musteloid carnivorans. Biol J Linn Soc Lond 110: 91–
103.
37. Lee DV, Bertram JE, Todhunter RJ (1999) Acceleration and balance in trottingdogs. J Exp Biol 202: 3565–3573.
38. Walter RM, Carrier DR (2007) Ground forces applied by galloping dogs. J Exp
Biol 210: 208–216.
39. Reynolds TR (1985) Mechanics of increased support of weight by the hindlimb
in primates. Am J Phys Anthropol 67: 335–349
40. Schmitt D, Lemelin P (2002) Origins of primates locomotion: gait mechanics ofthe woolly opossum. Am J Phys Anthropol 118: 231–238.
41. Hanna JB, Polk JD, Schmitt D (2006) Forelimb and hind limb forces in walking
and galloping primates. Am J Phys Anthropol 130: 529–535.
42. Raichlen DA, Pontzer H, Shapiro L, Sockol MD (2009) Understanding hind
limb weight support in chimpanzees with implications for the evolution of
primate locomotion. Am J Phys Anthropol 138: 395–402.
43. Van Valkenburgh B (1985) Locomotor diversity within past and present guildsof large predatory mammals. Paleobiology 11: 406–428.
44. Van Valkenburgh B (1991) Iterative evolution of hypercarnivory in canids
(Mammalia: Carnivora): evolutionary interactions among sympatric predators.
Paleobiology 17: 340–362.
45. Van Valkenburgh B (2007) Deja vu: the evolution of feeding morphologies in
the Carnivora. Integr Comp Biol 47: 147–163.
46. Wroe S, Milne N (2007) Convergence and remarkably consistent constraint in
the evolution of carnivore skull shape. Evolution 61: 1251–1260.
47. Wroe S, Clausen P, McHenry C, Moreno K, Cunningham E (2007) Computer
simulation of feeding behaviour in the thylacine and dingo as a novel test for
convergence and niche overlap. Proc R Soc Biol Sci 274: 2819–2828.
48. Wroe S (2008) Cranial mechanics compared in extinct marsupial and extantAfrican lions using a finite-element approach. J Zool 274: 332–339.
49. Figueirido B, MacLeod M, Krieger J, De Renzi M, Perez-Claros JA, et al.
(2011) Constraint and adaptation in the evolution of carnivoran skull shape.
Paleobiology 37: 490–518.
50. Barone R (1986) Anatomie Compare des Mammiferes Domestiques. Vol. 1:
Osteologie. Paris: Vigot.
51. Homberger DG, Walker WF (2004) Vertebrate dissection. 9th edition.
Belmont, CA: Brooks Cole. 379 p.
52. Gunnell GF (1998) Creodonta. In Janis CM, Scott KM, Jacobs LL, editors.
Evolution of Tertiary mammals of North America: Volume 1, terrestrial
carnivores, ungulates, and ungulate like mammals. Cambridge: Cambridge
University Press. pp 91–109.
53. Wiley DF, Amenta N, Alcantara DA, Ghosh D, Kil YJ, et al. (2005)
Evolutionary Morphing. In: Proceedings of IEEE Visualization 2005 (VIS’05).
pp. 431–438.
54. Klingenberg CP (2011) MorphoJ. Faculty of Life Sciences, University of
Manchester, Manchester. Available from: http://www.flywings.org.uk/MorphoJ page.htm.
55. Drake AG, Klingenberg CP (2008) The pace of morphological change:
historical transformation of skull shape in St Bernard dogs. Proc R Soc Biol Sci
275: 71–76.
56. Schoenebeck JJ, Hutchinson SA, Byers A, Beale HC, Carrington B, et al.
(2012) Variation of BMP3 Contributes to Dog Breed Skull Diversity. PLoS
Genet 8: e1002849. doi:10.1371/journal.pgen.1002849
57. Singleton M (2012) Postnatal cranial development in papionin primates: An
alternative model for hominin evolutionary development. Evol Biol 39: 499–520.
58. Klingenberg C P (2013) Visualizations in geometric morphometrics: how to
read and how to make graphs showing shape changes. Hystrix 24: 15–24.
59. Rohlf FJ, Slice D (1990) Extensions of the Procrustes method for the optimal
superimposition of landmarks. Syst Zool 39: 40–59.
60. Dryden I.L, Mardia K (1998) Statistical Analysis of Shape. Chichester, UK:
Wiley. 347 p.
61. Rohlf FJ, Marcus LF (1993) A revolution morphometrics. Trends Ecol Evol 8:
129–132.
62. McLellan B, Reiner DC (1994) A review of Bear evolution. In: Bears: Their
Biology and Management, Vol. 9, Part 1: A Selection of Papers from the Ninth
International Conference on Bear Research and Management. Missoula,Montana. pp. 85–96.
63. Hunt RM (1998) Amphicyonidae. In Janis CM, Scott KM, Jacobs LL, editors.
Evolution of Tertiary mammals of North America: Volume 1, terrestrial
carnivores, ungulates, and ungulate like mammals. Cambridge: Cambridge
University Press. pp 196–227
64. Wang XM, Tedford RH, Taylor BE (1999) Phylogenetic sytematics of the
Borophaginae (Carnivora: Canidae). Bull Am Mus Nat Hist 243: 1–391.
65. Peigne S (2003) Systematic review of European Nimravinae (Mammalia,
Carnivora, Nimravidae) and the phylogenetic relationships of PalaeogeneNimravidae. Zool Scr 32: 199–229.
66. Rothwell T (2003) Phylogenetic systematics of Northamerican Pseudaelurus
(Carnivora, Felidae). Am Mus Nov 3403. 64 p.
67. Anton M, Salesa MJ, Morales J, Turner A (2004) First known complete skulls of
the scimitar-toothed cat Machairodus aphanistus (Felidae, Carnivora) from the
Spanish late Miocene site of Batallones-1. J Vertebr Paleontol 24: 957–968.
68. Morlo M, Peigne S, Nagel D (2004) A new species of Sansanosmilus: implications
for the systematic relationships of the family Barbourofelidae new rank(Carnivora, Mammalia). Zool J Linn Soc 140: 43–61.
69. Finarelli JA, Flynn JJ (2006) Ancestral state reconstruction of body size in the
Caniformia (Carnivora, Mammalia): the effects of incorporating data from the
fossil record. Syst Biol 55: 301–313.
70. Koepfli KP, Gompper ME, Eizirik E, Ho CC, Linden L, et al. (2007)
Phylogeny of the Procyonidae (Mammalia: Carnivora): molecules, morphology
and the great American interchange. Mol Phylogenet Evol 43: 1076–1095.
71. Krause J, Unger T, Nocon A, Malaspinas AS, Kolokotronis SO, et al. (2008)
Mitochondrial genomes reveal an explosive radiation of extinct and extantbears near the Miocene-Pliocene boundary. BMC Biol 8: 220.
Carnivoran Forelimb Evolution
PLOS ONE | www.plosone.org 19 January 2014 | Volume 9 | Issue 1 | e85574
72. Turner A, Anton M, Werdelin L (2008) Taxonomy and evolutionary patterns
in the fossil Hyaenidae of Europe. Geobios 41: 677–687.
73. Salesa MJ, Anton M, Turner A, Morales J (2010) Functional anatomy of the
forelimb in Promegantereon ogygia (Felidae, Machairodontinae, Smilodontini) from
the Late Miocene of Spain and the origins of the sabre-toothed felid model.
J Anat 216: 381–396.
74. Salesa MJ, Peigne S, Anton M, Morales J (2011) Evolution of the family
Ailuridae: origins and Old-World fossil record. In: Glatston AR, editor. Red
Panda. Biology and conservation of the first panda. London, UK: Academic
Press. pp 27–41.
75. Nyakatura K, Bininda-Emonds ORP (2012) Updating the evolutionary history
of Carnivora (Mammalia): a new species-level supertree complete with
divergence time estimates. BMC Biol 10: 12.
76. Maddison WP, Maddison DR (2011) Mesquite: a modular system for
evolutionary analysis. Version 2.75. Available via http://mesquiteproject.org.
77. Polly PD (2001) Paleontology and the comparative method: ancestral node
reconstructions versus observed node values. Am Nat 157: 596–609.
78. Turner A, Anton M (1997) The big cats and their fossil relatives. New York,
US: Columbia University Press. 234 p.
79. Martin LD (1998) Nimravidae. In Janis CM, Scott KM, Jacobs LL, editors.
Evolution of Tertiary mammals of North America: Volume 1, terrestrial
carnivores, ungulates, and ungulate like mammals. Cambridge: Cambridge
University Press. pp 228–235.
80. Janis CM, Gunnell G, Uhen M (2008) Evolution of Tertiary Mammals of
North America Vol. 2: Small Mammals, Edentates, and Marine Mammals.
Cambridge, UK: Cambridge University Press. 802 p.
81. Wallace SC (2011) Advanced members of the Ailuridae (Lesser or Red Pandas -
Subfamily Ailurinae). In: Glatston AR, editor. Red Panda. Biology and
conservation of the first panda. London, UK: Academic Press. pp 43–60.
82. Monteiro LR (1999) Multivariate regression models and geometric morpho-
metrics: the search for causal factors in the analysis of shape. Syst Biol 48: 192–
199.
83. Dıaz-Uriarte R, Garland T (1998) Effects of branch length errors on the
performance of phylogenetically independent contrasts. Syst Biol 47: 654–672.
84. Midford PE, Garland JT, Maddison WP (2008) PDAP package of Mesquite,
version 1.14. http://mesquiteproject. org/pdap_mesquite.
85. Laurin M (2004) The evolution of body size, Cope’s rule and the origin of
amniotes. Syst Biol 53: 594–622.
86. Klingenberg CP, Gidaszewski NA (2010) Testing and quantifying phylogenetic
signals and homoplasy in morphometric data. Syst Biol 59: 245–261.
87. Gidaszewski NA, Baylac M, Klingenberg CP (2009) Evolution of sexual
dimorphism of wing shape in the Drosophila melanogaster subgroup. BMC Evol
Biol 9: 110.
88. Figueirido B, Serrano-Alarcon FJ, Slater GJ, Palmqvist P (2010) Shape at the
cross-roads: homoplasy and history in the evolution of the carnivoran skull
towards herbivory. J Evol Biol 23: 2579–2594.
89. Klingenberg CP, Dutke S, Whelan S, Kim M (2012) Developmental plasticity,
morphological variation and evolvability: a multilevel analysis of morphometric
integration in the shape of compound leaves. J Evol Biol 25: 115–129.
90. Sanger TJ, Mahler DL, Abzhanov A, Losos JB (2012) Roles for modularity and
constraint in the evolution of cranial diversity among Anolis lizards. Evolution
66: 1525–1542.
91. Figueirido B, Tseng ZJ, Martın-Serra A (2013) Skull Shape Evolution in
Durophagous Carnivorans. Evolution 67: 1975–1993.
92. Klingenberg CP, Marugan-Lobon J (2013) Evolutionary Covariation in
Geometric Morphometric Data: Analyzing Integration, Modularity, and
Allometry in a Phylogenetic Context. Syst Biol 62: 591–610.
93. Maddison WP (1991) Squared-change parsimony reconstructions of ancestral
states for continuous-valued characters on a phylogenetic tree. Syst Zool 40:
304–314.
94. Felsenstein JJ (1985) Phylogenies and the comparative method. Am Nat 125:1–
15.
95. MacLeod N (2001) The role of phylogeny in quantitative paleobiological data
analysis. Paleobiology 27: 226–240.
96. Harvey PH, Pagel MD (1991) The comparative method in evolutionary
biology. Oxford, U.K: Oxford Univ. Press. 239 p.
97. Iriarte-Dıaz J (2002) Differential scaling of locomotor performance in small and
large terrestrial mammals. J Exp Biol 205: 2897–2908.
98. Christiansen P (2002) Locomotion in terrestrial mammals: the influence of
body mass, limb length and bone proportions on speed. Zool J Linn Soc 136:685–714.
99. Garland TJ (1983) Scaling the ecological cost of transport to body mass in
terrestrial mammals. Am Nat 121: 571–587.100. Harris MA, Steudel K (1997) Ecological correlates of hind-limb length in the
Carnivora. J Zool 241: 381–408.101. Adams DC, Rohlf FJ, Slice DE (2004) Geometric morphometrics: ten years of
progress following the ‘revolution’. Ital J Zool 71: 5–16.
102. Klingenberg CP, Ekau W (1996) A combined morphometric and phylogeneticanalysis of an ecomorphological trend: pelagization in Antarctic fishes
(Perciformes: Nototheniidae). Biol J Linn Soc Lond 59: 143–177.103. Rohlf FJ (2002) Geometric morphometrics and phylogeny. In: MacLeod N,
Forey PL, editors. Morphology, shape, and phylogeny. London: Taylor andFrancis. pp. 175–193.
104. Polly PD (2008) Adaptive Zones and the Pinniped Ankle: a 3D Quantitative
Analysis of Carnivoran Tarsal Evolution. In: Sargis E, Dagosto M, editors.Mammalian Evolutionary Morphology: A Tribute to Frederick S. Szalay.
Dordrecht, The Netherlands: Springer. pp. 65–194.105. Kardong KV (2006) Vertebrates: comparative anatomy, function, evolution.
Boston: McGraw-Hill. 782 p.
106. McMahon TA (1973) Size and shape in biology. Science 179: 1201–1204.107. Doube M, Conroy AW, Christiansen P, Hutchinson JR, Shefelbine S (2009)
Three-dimensional geometric analysis of felid limb bone allometry. PloS one 4:e4742, doi:10.1371/journal.pone.0004742
108. Biewener AA (1983) Allometry of quadrupedal locomotion: the scaling of dutyfactor, bone curvature and limb orientation to body size. J Exp Biol 105: 147–
171.
109. Bertram JEA, Biewener AA (1990) Differential scaling of the long bones in theterrestrial Carnivora and other mammals. J Morph 204: 157–169.
110. Day LM, Jayne BC (2007) Interspecific scaling of the morphology and postureof the hind limbs during the locomotion of cats (Felidae). J Exp Biol 210: 642–
654.
111. Steudel K, Beattie J (1993) Scaling of cursoriality in mammals. J Morph 217:55–63.
112. Strang KT, Steudel K (1990) Explaining the scaling of transport costs: the roleof stride frequency and stride length. J Zool 221: 343–358.
113. Taylor ME (1989) Locomotor adaptations by carnivores. In: Gittleman JL,editor. Carnivore Behavior, Ecology, and Evolution, Vol. I. New York: Cornell
University Press. pp. 382–409.
114. Stein BR, Casinos A (1997) What is a cursorial mammal? J Zool 242: 185–192.115. Krausman PR, Morales SM (2005) Acinonyx jubatus. Mamm Species 771: 1.
116. Kram R, Taylor CR (1990) Energetics of running: a new perspective. Nature346: 265–267.
117. Iwaniuk AN, Whishaw IQ (1999) How skilled are the skilled limb movements
of the raccoon (Procyon lotor)? Behav Brain Res 99: 35–44.118. Anton M, Salesa MJ, Pastor JF, Sanchez IM, Fraile S, et al. (2004) Implications
of the mastoid anatomy of larger extant felids for the evolution and predatorybehaviour of sabretoothed cats (Mammalia, Carnivora, Felidae). Zool J Linn
Soc 140: 207–221.119. Bieseigel B, Zuercher G (2005) Speothos venaticus. Mamm Species 783: 1–6.
120. Wilson DE, Mittermeier RA (2009) Handbook of the Mammals of the World.
Vol. 1. Carnivores. Barcelona: Lynx Edicions. 727 p.121. Wortman JL (1894) Osteology of Patriofelis, a middle Eocene creodont. Bull Am
Mus Nat Hist 6: 129–164.122. Osborn HF (1900) Oxyaena and Patriofelis restudied as terrestrial creodonts. Bull
Am Mus Nat Hist 13: 269–280.
123. Pasi BM, Carrier DR (2003) Functional trade-offs in the limb muscles of dogsselected for running versus fighting. J Evol Biol 16: 324–332.
124. Kemp TJ, Bachus KN, Nairn JA, Carrier DR (2005) Functional trade-offs inthe limb bones of dogs selected for running versus fighting. J Exp Biol 208:
3475–3482.
125. Sorkin B (2008) A biomechanical constraint on body mass in terrestrialmammalian predators. Lethaia 41: 333–347.
126. Spoor CF, Badoux DM (1986) Descriptive and functional myology of the neckand forelimb of the striped hyena (Hyaena hyaena, L. 1758). Anat Anz 161: 375–
387.127. Goslow GE, Seeherman HJ, Taylor CR, McCutchin MN, Heglund NC (1981)
Electrical activity and relative length changes of dog limb muscles as a function
of speed and gait. J Exp Biol 94: 15–42.
Carnivoran Forelimb Evolution
PLOS ONE | www.plosone.org 20 January 2014 | Volume 9 | Issue 1 | e85574