Embed Size (px)
Citation preview

A GEOMORPHIC INVESTIGATION OF RETROGRESSIVE TUAW SLUMPS AND ACTIVE LAYER SLIDES CN HERSCHEL ISLAND, YUKON TERRITORY
Valentina de Krom Department of Geography
McGill University, Montreal AUgust, 1990.
A thesis submitted to the Faculty of Graduate Studies and Research in partial fulfillment of the requirements for the
Degree of Master of Science.
~ Valentina de Krom

i
Abstract
This thesis investigates the geomorphology of retrogressive thaw slumps and active layer slides on Herschel Island, northern Yukon Terri tory. In particular, i t examines the formation and morphology of both landforms, and the ground ice characteristics of retrogressive thaw slumps. During 1988-1989 a number of retrogressive thaw slumps and active layer slides were surveyed and monitored. Field and laboratorj investigations involved (1) documentation of landform distribution, setting and morphology, (2) examination of processes of landform formation, and (3) the examination of cryostratigraphy, ground ice characteristics and material properties.
Retrogressive thaw slumps developed in areas of low to moderate slopes underlaln by a variety of sediments with ice contents up to 4500% (on a dry weight basis). Slump headwall retreat rates of up to 19.5 m/yr were recorded. By comparison, active layer slides developed on steeper slopes underlain mainly by marine silts and clays. The sediments exposed in the slide floors and headwalls displayed no visible ground ice, but moisture contents were between 15-35%. Retrogressive thaw slumps and active layer slides form by entirely different processes. However, they do occur in close association and are influenced by many of the same parameters.

l
ii
Resume
Le présent mémoire de maîtrise porte sur la géomorphologie des éboulements de fonte (retrogressive thaw slumps) et des glissements de mollisol sur l'île Hershel, dans le nord du Yukon, et plus particulièrement sur leur formation et leurs aspects morphologiques ainsi que sur les caractéristiques de la glace dans les éboulements de fonte. Un certain nombre de sites ont été observés et arpentés en 1988 et en 1989. Les travaux sur le terrain et en laboratoire ont couvert trois aspects, à savoir 1) l'évaluation de la distribution, de l'environnement immédiat et de la morphologie des formes de terrain, 2) l'étude des processsus de formatIon et 3) l'étude de la cryostratigraphie, des ~.:lractéristiques de la glace et des propriétés des matériaux.
Les éboulements de fonte se manifestent au droit de pentes faibles à moyennes, dans des sédiments variés ayant Jusqu'à 4 500 % de contenu en glace (par poids sec). On y a mesuré un taux de recul des falaises maximum de 19,5 rn/an. Par contre, les glissements de mollisol s'inscrivent dans des terrains plus pentus riches en limons et en argiles marines. Bien que le contenu en eau de ces sédiments soit de 15 à 35 %, aucune concentration de glace n'a été observée soit en coupe ou encore le long de la ~urface de glissement. Quoique issus de processus géomorpllologigues fort différents, les éboulements de fonte et les glIssements de mollisol n'en sont pas moins des formes associées régies en grande partie par l~s mêmes paramètres.

1
iii
Acknowled.qements
l would like to acknowledge my supervisor Dr. W.H.
Pollard for his guidance a!ld encouragement throughout the
field seasons and during the writing of this thesis.
This project was supported by the Natural Sciences
and Engineering Research Council of Canada Operating
Grant and Northern Supplement (Dr. W.H. Pollard), and
the Northern Scientific Training program (DINA). The
Polar Continental Shelf project, Canadian Department of
Energy Mines and Resources and the Inuv ik Research
Laboratory, Science Institute of the Northwest
Terri tories provided generous logistical support. l
would also like to thank the Yukon Heritage Branch and
Yukon Parks for allowing me to carry out my research on
Herschel Island. Mete0rological data provided by
Atmospheric Environment Service is appreciated.
The field assistance of Mr. R. House and Mr. R.
Rowsell is sincerely appreciated as is the assistance of
Dr. M. Bouchard, Mr. F. Caporuscio (Geotechnical
Research Centre, McGill University), Dr. D. Pattie
(Northern Alberta Institute of Technology), Yukon Park
Rangers, Angie Mansi, Jim Rowland and Scott smith. A
heartfelt thank-you to my best friend, my family and Mr.
and Mrs. Kisiell. Finally, thanks to my fellow graduate
students for helpful advice, softball and good food.

.. iv
Table of Contents
Abstract .............. " ..................................... 1
Resurné ............................................................................................. i i
Acknowledgements ..................................... i i i
Table of Contents .......................................................................... i v
ListofFigures .................................................. ~ ......................... vi
List of Tables ................................................................................ ix
Preface ............................................................................................... x
Chapter 1
1.1 1.2
Chapter 2
2.1 2.2 2.3 2.4 2.5
Chapter 3
3.1 3.2 3.3
3.4 3.5
3.6
Introduction
Introduction ............................................................ 1 study Aims ................................................................ 3
Background Literature
Introduction ............................................................ 5 Permafrost ................................................................ 6 Ground Iee ..................................................... Il Thermokarst . . . . . . . . . . . . . . . . . . . . . . . . . . . . . .. 19 Mass Wasting .............................. 25
study Area and Methodology
Introduction .............................. . 33 Historical Perspective ................... . 35 Regional Setting ......................... . 38 3.3.1 Physiography ..... . ............... . 38 3.3.2 Geologie History .................. . 41 3.3.3 Surfieial Deposi ts ................ . 45 3.3.4 Regional Climate .................. . 47 3.3.5 Permafrost and Ground Iee ......... . 50 Study si tes .............................. . 54 Methodology .......................•....... 55 3.5.1 Field Work ........................ . 55 3.5.2 Laboratory Analyses ............... . 56 Organization of Results ..........•........ 59
'i1

v
Chapter 4 Landf~rm Morphology
4.1 Introduction .............................. 62 4.2 Retrogressi ve Thaw Slumps ..••....••.....•. 63 4. 3 Active Layer Slides •...•.......•....•..•.• 75 4.4 Discussion ........ " ....................... 79
Chapter 5 Cryostratigraphic and Material Controls
5.1 Introduction .............................. 86 5.2 Cryostratigraphy and Ground Ice ..•...•.... 86
5.2.1 Re..:rogressive Thaw Slumps .•...•.•.. 89 5.2.2 Active Layer Slides ........ _ ....... 101
5.3 Ground Ice Chernistry .........•...........• 102 5.3.1 Type A Ground Ice .................. 105 5.3.2 Type B Ground Ice .................. 108
5.4 Summary ................................... 111
Chapter 6 Landform Processes
6.1 Introduction .............................. 112 6.2 Retrogressi ve Thaw Slumps .......•......... 113
6.2.1 Process Terrninology ................ 113 6.2.2 Slump Initiation ................... 114 6.2.3 HeadwaI1Retreat ................... 117 6.2.4 Runoff ............................. 127
6. 3 Active Layer Slides ....................... 128 6.4 Discussion ................................ 134
Chapter 7 Summary and Conclusions
7.1 Introduction .............................. 140 7.2 Retrogressive Thaw Slurnps •...•...•••..•••• 140 7.3 Active Layer Slides ....................... 142 7.4 Conclusions ............................... 14~ 7.5 Recommendations for Future Research •...... 145
Referer,ces ................................. 147

"
vi
List of Figures
2.1. Global permafrost distribution rnap .................. 7
2.2. Permafrost distribution map of Canada ............... 9
2.3. Ground ice classification after Mackay (197~) ...... 14
2.4. Ground ice field classification, after Philainen and Johnston (1963) ............•.......... 15
2.5. Photographs illustrating different ground ice types ........................................... 16
2.6. Photographs of retrogressive thaw slurnps, (a) Herschel Island, and (b) Yukon Coastal Plain .... 23
2.7. Classification of mass movernent types (a) Carson and Kirkby (1972), and (b) Varnes (1978) ............ 28
2.8. Photographs of active layer slides (a) Herschel Island, and (b) Eureka, Ellesmere Island ............ 30
3.1. Study area rnap, Hersch2l Island, r.orthern Yukon Terri tory . . . . . . . . . . . . . . . . . . . . . . . . . . . . . . . . . . . .. 34
3.2. Photograph showing gully formation ln the vicinity of Collinson Head, Herschel Island .................. 40
3.3 Photographs of wheel ruts caused by che landing of a Twin otter ,tircraft ............................ 42
3.4. Climatic data for the Yukon Crastal Plain station, Shingle Point ....................................... 48
3.5. Photograph of ice-wedge ice, Thetis Bay ............. 52
3.6. Study site locations and ground ice distribution map, Herschel Island ................................ 53
4.1. Photographs showing (a) retrogressive tpaw slurnps along the Thetis Ray shoreline, and (b) a slump in the vicinity of Collinson Head ...................... 64
4.2. Schematic representation of (a) t'I"~trogressive thaw slump, and (b) landslip, after Ritter (1978) ....... 66

vii
4.1. Photograph illustrating the ~lassic bowl shape of (a) RTS 1, and (b) the lateral headwall of the thaw slump at King Point, Yukon Coastal Plain ...•........ 67
4.4. Photographs showing Ca) mud lobes at the headscarp, and (b) the dendritic pattern of the floor .•....... 70
4.5. Frequency histograms for (a) disturbed slopes within thaw slump floors, and (b) undisturbed slopes surrounding thaw slumps ...................... 72.
4.6. Slope profiles for Ca) RTS 1, and (b) RTS 2 •........ 73
4.7. Pho~ograph illustrating microtopography of (a) slide floor, and (b) the base of the slide ...•.. 77
4.8. Frequency histograms (a) disturbed slopes for active layer slide floors, and Cb) undisturbed terrain surrounding active layer slides ............. 80
4.9. Slope3 profiles for active layer slides nnd the undisturbed terrain surrounding them ........ 81
4.10. Photograph illustratinq the irregular shape of RTS 3 .....................................•........ 82
4.11. Photographs of airphotos of the Thetis Bay shoreline in (a) 1951, and (b) 19"1 /) •••••••••••••••• 84
5.1. Photograph of deformed sediments and ground ice exposed within the headwall of a retrogressive thaw slump along the Thetls 3ay shorel ine ........... 88
5.2. Photographs of the exposed headwdll of (a) RTS 1, and Cb) an ice dyke exposed in the headwaJl .•.....•. 90
5.3. Photograph o~ exposed headwall at RTS 2 ...........•. 92
5.4. Photograph of exposed headwall at RTS 4 .....•.....•• 94
5.5. Grain size distribution curves for retrogressive thaw slump sediments .................•............•• 98
5.6. Flow curves (liquid limits) for samples from RTS 1 and 2 ......................................... 99
5.7. Graph of moisture content vs. distance from the headwall at RTS 1 and 2 ...........•..........•.....• 100
5.8. Grain size distribution curves for active layer sI ide sediments ..................................... 103

viii ..
5.9. Flow curves (liquid limjts) for samples frow active layer slides .......... ~ ............................ . 104
6.l. Levelopment of a retrogressive thaw slump within an active layer slide at ALS 1 ....................... 116
6.2. Plotted headwall retreat for RTS 1 and 2 ••.••••••••• 119
6.3. Maximum and minimum air temperatures recorded inside 2nd outside 51 ump bowl at RTS 1 •.•..••••.•... 121
6.4. Cumulative headwall retreat for RTS 1 and 2 .•••..... 122
6.5. Photograph of ~now covered headwalls in late June, 1988 . . . . . . . . . . . . . . . . . . . . . . . . . . . . . . . . . . . . . . . . . . 124
6.6. Photograph of stabilized portion of the headwall a t RTS 3 • . . • . . • • • . . • • • • . • • • • • •• ••••••••••.••••••.•• 126
6.7. Photograph of active layer slide floor illu:.. "rating the slickenslide surface ..••.....••................. 131

( List of Tables
4.1. Morphometric parameters for retrogressive thaw slumps on Herschel Island ......•...•....•• 69
4.2. Tabulated results of slope angle measurernents for retrogressive thaw slurnps, active layer slides and stable slopes ....••..........••....• 74
5.1. Ground ice chernistry for samples of varying ice type from Herschel Island ...•.......•...••...••
6.1. Documented annual retreat rates for retrogressi ve thaw slumps .•.•......••...••....•
106
120
1 ... , '.
ix

Tha Formation of Ground-Ice Depressions -A Record of an Alternative Explanation.
x
Isbrants Ides, writing in 1706 of an expedition to Siberia, (Sloane, 1728) reported that:
"Amongst the hills, which are situated ta the northeast of Makofskc,i, not far from thence, the Mammut 1 s tongues and legs are found; as they are also particularly on the shores of the rivers Jenize, Trugan, Mongamesa and Lena ... Concernin;J this Animal there are very different reports. The heathens of Jakuti, Tugusi, and Ostiacki say, that they continually, or at least by reason of the very hard frosts, rnostly live under ground, where they go backwards and forwardsi to confirm which, they tell us, that they have often seen the earth heaved up, when one of these beasts was on the march, and after he was past the place, sink in, and thereby make a deep pit. They further believe, that if this animal cornes so near the surface of the frozen earth, as to smell, or discern the air, he immediately dies, whicn they say is the reason that several of them are found de ad on the hiyh banks of the river, where they unawares come out of the ground. "

Chapter 1
'À Introduotion
1.1 Introduction
The Yukon Coastal Plain and Mackenzie Delta are possibly
the most ice-rich permafrost areas of the Canadian Arctic
(Pollard and French, 1980) . These areas are also
characterized by a large number of natural thermokarst
landforms, inc.luding: retrogressive thaw slum,ps, thaw lakes,
beaded drainage, and collapsed pingos. However, with the
exception of studies by Kerfoot (1969) and Mackay (1966) there
has been little research on thermokarst processes in this part
of the Arctic. Furthermore, apart from a number of si te
specifie thermokarst studies (e.g., Are, 1988; Black, 1969;
French and Egginton, 1973) this aspect of the geomorphic
environment has received limited consideration. h similar
problem also does exist concerning active layer slides. As
a result, confusion has arisen from conflicting and often
geomorphologically incorrect use of terms in the description
of the se features.
Surficial deposits of the Yukon Coastal Plain, including
Herschel Island, conta in considerable volumes of massive
ground ice and ice-rich permafrost. It j s not surprising then
that retrogressive thaw slumps and active layer slides are
sorne of the most active landscape-formlng processes. The
general aim of this study is to investigate retrogressive thaw
1

slumps and active layer slides in the Herschel Island area of
the Yukon Coastal Plain. A study of this nature will
contribute to a better understanding of the role of thaw
induced processes in landscape evolution. Furthermore,
information leading to an improved comprehension of geolTlorphic
processes may help to resolve problems of interpretation
brought about by contradictory terminology. Finally, there
is still a need for detailed site specific permafrost studies
to help develop a more complete data base of permafrost and
ground ice conditions in the Canadian Arctic. In view of the
planned development of oil and gas resources of the Bea'lfort
region and the anticipated stress upon the environment
aSEociated with predicted global climate warming, there is an
immediate need for detailed investigations of both thermokarst
and thaw related slope processes. Retrogressive thaw slumps
are of particular
dynamic modifiers
understanding of
significance because they are extremely
of permafrost landscapes. A better
the geomorphology of retrogressi ve thaw
slumps and active layers slides, together with an improved
data base on ground ice and permafrost conditions for Herschel
Island, will assist in the planning and management of the
Herschel Island Heritage Park and the North Yukon National
Park, as weIl as with any further development of Beaufort Sea
oil and gas.
The landscape of the Yukon Coastal Plain is characterized
by evidence of previous thermokarst activity, such as thaw
2

lakes,
slurnps.
cernetary mounds and stabilized retrogressive thaw
The cyclic nature of thermokarst, together with the
high d~gree of thermokarst activity, forms the basis for a
nurnber of geornorphic questions. Is the present period of
therrnokarst activity triggered by global change? What causes
the polycylic nature of retrogressive thaw slumps? What is
the triggering rnechanism for both retrogressive thaw slumps
and active layer slides? It is not possible for a site
specifie short-term study such as this ta fully answer these
questions; however, it is hoped that by investigating some of
the processes and landforms invol ved we may be better equipped
to focus on these fundamental questions.
1.2 study Aims
The spe~ific aims of this research are:
(1) ta document the distribution and setting of retrogressive
thaw slumps and active layer slides on Herschel Island,
(2) ta investigate retrogressive thaw slump and active layer
slide processes, including (a) factors influencing their
initiation, (b) mechanisrns and rates of retreat and (c)
the polycyclic nature of retrogressive thaw slump
occurrence,
(3) ta investigate and compare
retrogressive thaw slurnps and
through the measurement of a
the morphology of
active layer slides,
number of standard
morphornetr ic parameters (e. g., total length, total width,
3

J
scar length, and scar depth),
(4) to examine material and ground ice characteristics (grain
size, Atterberg Limits, moi sture contents) of
retrogressive thaw slump and active layer slide
materials, in order that the role of moisture in slump
and slide morphology and process may be assessed, and
(5) to assess the use of traditional mass wasting and
thermokarst terminology te de scribe these features.
4

Chapter 2
Background Literature
2.1 Introduction
The study of earth materials having temperatures less
than or equal to oOe is called geocryology. The recognition
of geocryology as a science (Shumski, 1964; Washburn, 1980)
has given rise to a specialized terminology (van Everdingen,
1976) in which the prefix "cryo" and term "cryotic" refer
specifically to subzero (OC) thermal conditions, and the term
"frozen" refers to the solid phase of moisture found in
cryotic materials.
Permafrost geomorphology is concerned with landforms and
processes associated with the occurrence of permafrost (Brown,
1974; Mackay, 1971a; Rampton, 1974). This includes both
aggradational and degradational phenomena. Geocryology and
permafrost geomorphology are relatively new branches of the
earth sciences. Although they have their origins in climatic
and periglacial geomorphology, their relevance today is
directly related to problems associated with climate change
and northern development.
Over the pa st four decades, an extensive body of
permafrost literature has been produced, yet several important
topics remain shrouded in confusing and contradictory
terminology, or are poorly understood. This is the case for
sorne aspects of therrnokarst processes and landforrns. The
5

, l
fo11owing will brief1y summarize important concepts and
background information on permafrost, ground ice and
thermokarst.
2.2 Permafrost
Permafrost is defined as ground (soil or rock) that
remains at or below OoC for at least two years (Permafrost
Subcommittee, 1988). Although the thermal nature of
permafrost is implicit in this definition, its applied
significance is directly related to the behaviour of waterj ice
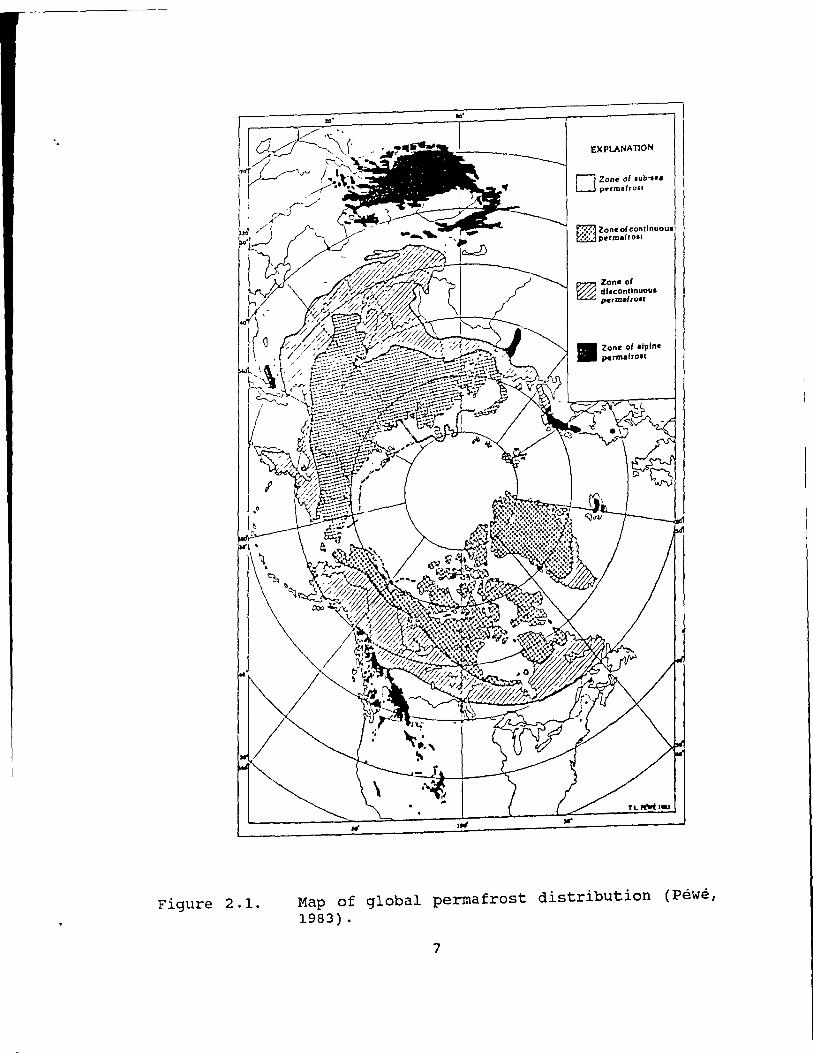
at or below O°C. Permafrost underlies approximately 20% of
the earth's land surface (Figure 2.1), including as mu ch as
50% of Canada and the Soviet union and 80% of Alaska (Brown,
1978; Péwé, 1983). The occurrence of permafrost reflects the
complex interaction between climate (i. e., mean annual and
winter air temperature), geothermal gradient and material
characteristics. In North America permafrost distribution is
divided into continuous and discontinuous permafrost. Alpine
and subsea permafrost are also recognized.
The continuous and discontinuous zones of permafrost in
Canada are defined on the basis of spatial extent, areal
coverage and permafrost depth. Within the continuous zone,
permafrost exists almost everywhere beneath the landls surface
and may extend to depths of 500-1000 m (Brown, 1972). In
theory, the colder air temperatures and corresponding
shallower active 1ayers experienced in areas of continuous
6
'.
Figure 2.1.
EXPl..".NATION
D Zon" 0/ ,ub-ua permafrou
Map of global permafrost distribution (Péwé, 1983) .
7

•
permafrost will limit the nature and intensity of thaw-induced
processes. At lower latitudes permafrost distribution becomes
discontinuous in nature and is characterized by the presence
of permafrost and nonpermafrost areas in close association.
As discontinuous permafrost grades from widesprcad to
sporadic, site specifie factors, such as topography,
vegetation, snow cover become increasingly important variables
influencing the distribution of cryotic and noncryotic
materials (Brown, 1963a, 1963b, 1973; Nicholson and Granberg,
1973) . The discontinuous zone is further subdi v ided into
widespread permafrost in the north to sporadic permèfrost at
its southern limit (Figure 2.2). Discontinuous permafrost
ranges in depth from 100 m to only a few eentimetres ncar its
southern limit, where its presence may be quite transient
(Brown, 1970). Altitudinally (azonal) induced permafrost is
termed alpine permafrost. Subsea permafrost exists beneath
coastal shelf areas of the Arctic Ocean, and may either be in
equilibrium with negative seabottom temperatures or a relie
of cold climates during former emergent conditions (Are, 1988;
Lewellen, 1973; Mackay, 1972a).
The temperature of permafrost in the continuous zone,
measured at the depth of zero annual amplitude, ranges from
about -lSoC in the High Arctic to about -5°C at lower
latitudes. In the discontinuous zone, the temperature ranges
from approximately -SoC to oDe (Brown, 1978; Judge, 1973).
Alpine and subsea permafrost temperatures are comparable with
8

o 1
Figure 2.2.
USA /~.-U
1000Km 1 1
/' ARCT/C OCE'~N
Pergelisol conllnu _ :Jntmuous çermotrcsl
Pergélisol dlscontll'.' [[[[J]] Dlsccntlnuous pe,",,",rrn''''
~ Pergélisol alpm ~:':~;,.~, Alpine permatrest 1.···" ~ '.
Pergélisol sous- f:-:-:~~ Kno ... n otfsnore mann reconnu - - - permatrosl
< 1000 degrés / FreeZtn9 Index Jours de gel 1 <1000 deqr~-4cy
Permafrost Distribution Map of Canada (after Brown, 1978).
9
...
the discontinuous zone. In most permafrost regions a
surficial ground layer, termed the active layer, lies above
the permafrost table and experiences seasonal freczing and
thawing. In the continuous zone, active layer thickness
ranges from 10-20 cm in the coldest areas, but often ceachcs
one metre near the southern limite In the dlscontinuous zone
active layers tend to increase in thickness from north ta
south, up to a maximum of two to three metres ( Gold, 1967;
Gold and Lachenbruch, 1973; Goodrich, 1982; Lachenbruch,
1959) .
In North America, permafrost or geocryological sci~nce is
a relatively recent scientific field. For example, the term
'permafrost' was introduced in 1947, by S.W. Muller as a short
form for "perennially frozen ground". Sorne of the earl iest
scientific observations of permafrost and ground ice
condi tions in North America were for the Yukon and Alaska
coasts as part of a geological study undertaken by Leffingwell
(1919). The Soviet Union has a longer history of permafrost
research which began in the early 1900's; such research lS now
a weIl established discipline (e.g., Tsytovich, 1975). This
is in part due to their long history of northern settlement
and resource developrnent. The rapid development of perma frost
science in North America, the Sovist Union and, recently China
is weIl illustrated by the proceedings of five International
Conferences on Permafrost (1963, 1973, 1978, 1982, 1988).
10

2.3 Ground Ica
Ground ice is a major component of permafrost. Its
aggradation and degradation contribute significantly to the
evolution and modification of periglacial landscapes (Brown,
1974i Harry, 1988i Rampton, 1974). For example, ground ice
aggradation associated with the formation of ice-wedge
polygcns and ice-cored mounds (pingos) is responsible for the
unique appearance of many permafrost areas. Equally, ground
ice degradation may dramatically modify a landscape and
contribute to high rates of erosion. From an appl ied
perspective, the presence of ground ice within permafrost has
long been recognized as a key factor influencing the design
and the high cost of construction and maintenance of northern
engineeringprojects (e.g., Brown, 1970i Ferrians etai., 1969i
French, 1979; Muller, 1947}.
Ground ] ce is broadly defined as all ice occurring
beneath the surface of the ground, irrespect ive of age and
origin (Brown and Kupsch, 1974i Mackay, 1Y66). In theory,
this definition includes ice occurring within both seasonally
and perennially cryotic groundi however, in North America the
term is generally limited to ice occurring within permafrost.
Ground ice may be either syngenetic or epigenetic in origine
Syngenetic ice forms simultaneously with sediment deposition
and, thus, is part of the original depositional sequence. For
example, ice-wedge growth in a river flood plain. Epigenetic
Il

ice is younger than its enclosing sediments (e.g., iee
aggrading into sediments). The volume of ground ice varies
both horizontally and vertieally, and is dependent upon the
type of enclosing sediments, the availability and source of
moisture, the rate of freezing, and the thermal and geologic
history at a given location. Ice content may be expressed ~s
a percentage by weight or volume of the enelosing seLiment.
Massive ground ice is a term used to describe large masses of
pure ice. It is charaeterized by a gravimetrie ice content
equal to or greater than 250% (Mackay, 1971b, 1972b) or
approximately 85-90% by volume (Pollard, 1990).
During the past three decades consideraLle research has
focused on the nature and occurrence of ground iee, dealing
specifically with its origin, distribution and geotechnical
significance (Browr., 1978; Johnston, 1981; Mackay, 1989;
Mackay et al., 1978; Pollard, 1989, 1990; Williams, 1979).
Areas of Alaska, Canada and Siberia have undergone extensive
drilling programs in support of engineering investigations for
pipeline construction, water resources, research purposes and
hydrocarbon exploration. This has provided the opportuni ty
to record the depth and eharaeter of frozen mated al and
subsurface conditions. Examples include Mackay's (1971b) use
of borehole logs to interpolate the geometry of massive lce
on the Tuktoyaktuk Peninsula. Bouchard (1974) used a similar
method to map the distribution of ground ice on Herschel
12

r
Island. Using the Mackenzie Valley Geotechnical Data Bank,
Pollard and French (1980) calculated an approximation of
ground ice volume for Richard's Island in the Mackenzie Delta.
In Canada, two general ground ice classifications have
been adopted, the genetic classification by Mackay (1972b) and
a field classification by Philainan and Johnston (1963).
Mackay's classification (Figure 2.3) is based upon the origin
of water prior to freezing, the mode of water transfer, and
the types of ground ice formed. Philainen and Johnston' s
classification (Figure 2.4) is based C~ visual examination of
frozen samples. It is qualitative in nature and was designed
for engineering purposes as part of a larger permafrost
analysis procedure.
Ground ice types frequently observed in permafrost
include: ice-wedge ice and vein ice, segregated ice (massive
tabular ice, lce layers, ice lenses), intrus ive ice and pore
ice (Mackay, 1972b; Pollard and French, 1980) (Figure 2.5).
In addition, buried surface ice (buried snowbank ice, glacier
ice) is being documented in many areas (Pollard, 1989; Pollard
and Dallirnore. 1988).
Ice wedges occur where thermal contraction cracking
during winter months is common. They are vertically foliated
and characteristically wedge shaped bodies of massive ice,
which may appear "milky" in col our (due to high concentrations
of gas inclusions) compared to near pure ice. They grow by
the incrernental accumulation of annual ice veins, which forro
13

Origin of Water Prior to Freezing
Atmosphenc water
Surface water
Subsurface water
Principal Transfer Prncess Ground Icc FOI ms
Vapor diffusion
Thermal contraction Single vem iœ
Gravity transfer lee wedge Ice
Tension rupture Tension crack le:!
Vapor diffusion Clo~eLl C3Vlty Jct!
EpigenetIc iet!
Therm:ll and pressure potential Segregated ice AggraLlatJonal Ice
Sill ice
Pressure potential Intrusive ice Pingo ice
In place free7Jng Pore ice
Source: Mackay (1972)
Figure 2.3. Ground ice classification by Mackay.
14

'.
Subgroup SymboI
Field ~ 1:u n G ro Il p SymboI Description Identification
Poorly bonded fc~ not vj~ibk N or friable Nf HJ!1d examm~tion
\Vell bonded Nb Thaw sampJe ta
No excess ice Nbn deterrnine excess ice (super-
Excess ice Nbe natant water)
Vi~jble ice Jess V lndividual ice VisuaI Examina tion th:m 2.5 cm thick cryst~ls Of Vx ObservatIons on:
inclusions Icc~tion
!ce coatings on orientation
particles Vc thickness Iength
Random or spacmg irregularIy Vr size oriented ice shape fonnations pattern of
S tfatIfied or arrangemen t
distinctly hardness Vs structure oriented ice
formations colour
VISIble ice greater VisuaI examination !ce with soil Observations on: than 2.5 cm thick ICE inclusions Ice + soil hardness - hard,
type soft structure - c1e~r,
!ce without cIoudy, porous, soil inclusions IeE candIe d, granular,
s!ratified, colour admi\wres
SQurce: Pihlainen and Johnston (1963)
Figure 2.4. Ground ice field classification proposed by Philainen and Johnston.
15

A
8
Figure 2.5. Photographs illustrating differen-'(: ground iee types: (a) ice-wedge segregated ice body, lenses and pore ice.
16
ice penetratlng massive and (b) retlculated i~e

>.
by the freezing of water that enters thermal contraction
cracks. An excellent theoretical discussion on t.hermal
contraction cracking is presented by Lachenbruch (1962). The
aggradation and degradation of ice wedges is responsible for
the distinct polygonal appearance of many arctic landscapes.
Our current understanding of ice wedge growth has been greatly
advanced by studies by J .R. Mackay in the Mackenzie Delta
(1974a, 1974b, 1975b, 1976a, 1980, 1984).
Segregated ice forms by the migration of groundwater to
the freezing front as permafrost aggrades into unfrozen
material (e.g., Mackay, 1966; Penner, 1972). Segregated ice
may occur as discrete lenses, lay8rs or massive bodies of ice
and range from thin discontinuous hairline lenses to extensive
tabular ice bodies. The complex thermodynamic processes
responsible for ice segregation may also produce alternating
layers of ice and soil. Sorne of the thick bodies of massive
ice described in the Mackenzie Delta and Yukon Territory may
have been formed by a combination of ice segregation and
inj ection. Al though the depth to which segregated ice can
occur in permafrost remains uncertain, massive segregated ice
has been documented from an appreciable fraction of drill
holes which exceed a depth of 40 m (Mackay, 1966, 1976b). The
permafrost literature of the U.S.S.R. also includes numerous
references to massive ice that appears to be segregated in
nature. vtyurin (l973) reports that test borings have
revealed the presence of segregated ice in unconsolidated
17
deposits to depths of 130 metres or more. The terms "massive
ground ice" and "massive icy bodies" were proposed by Mackay
(1971b) to describe the thick horizontally extensive masses
of nearly pure ice and icy sediments which are common in the
Mackenzie Delta. Such bodies of massive ice are frequently
responsible for prominent topographie rises (Rampton and
Mackay, 1971).
Pore ice forros as a freezing front moves through t.he sail
colurnn, freezing interstitial water 111 SItu. It acts as a
bonding or cementing agent l>y holding soil grains together and
occurs as ice crystals in pore spa ces or as a film of ice
surrounding individual particles. The main distinction
between pore and segregated ice, besides their genetic
processes, is that pore ice yields no supernatant water. The
thawing of pore ice will not cause ground subsidence, although
there may be a loss of bearing strength (Brown and Kupsch,
1974; Johnston, 1981). By comparison, segregated ice often
contains excess ice, defined as the volume of ice that exceeds
the total pore volume that the ground would have under
nonfrozen conditions. As a result, a sail containing exccss
ice will settle under its own weight during thawing until it
attains a consolidated state. This is af considerable
importance when considering slope stability (Rampton, 1974).
Apart from the varied character of the mineraI and
organic fractions within permafrost beds, it is necessary to
18

"
describe the multiplicity of other conditions which may exist.
Ice lenses and veins may be interspersed with frozen material
thus resulting in complex configurations. A considerable body
of research now exists examining grourld ice cryotextures
(Mackay, 1989; Pollard, 1989, 1990; Pollard and Dall imore,
1988) . Ground ice shows great variations in soil both
qualitatively and quantitatively. For example, in sorne areas
It may consist of almost pure clear ice as exemplified by ice
wedges. On the other hand, drier permafrost will generally
have only small quantities of ice present, usually as pore or
cement ice (Linell and Tedrow, 1981).
2.4 Thermokarst
Thermokarst is defined as the process by which
characteristic landforms result from the thawing of ice-rich
permafrost (Permafrost Subcommittee, 1988). The thawing of
permafrost containing excess ice resul ts in surface subsidence
and the developmen~ of thermokarst terrain. Recent research
has addressed both the processes and landforms associated with
this phenomenon. Both are of considerable importance, since
naturally occurring thermokarst represents one of the most
dynamic processes modifying arctic and subarctic landscapes
(French, 1974). In addition, the avoidance of human-induced
thermokarst represents a major challenge to northern
development (e.g., construction of the town of Inuvik). A
process-response model which defines the factors related to
19
.. the disturbance of tundra and forest-tundra environments has
been presented by Mackay (1970). Surface disturbance results
from the disruption of the thermal equilibrium of the
underlying permafrost due to changes in geomorphic,
vegetational and/or climatic conditions.
Mackay (1970) suggests that thermokarst subsidence be
differentiated from thermal erosion. For example, melt-out
of a pingo ice core is a thermokarst process which results in
surface subsidence and the formation of a circular depression
with a "doughnut shaped" rampart. By comparison, processes
such as flowing water thermally erode an ice body (e.g., ice
wedge or thaw face). This may be an important process in
tundra environments, particularly during spring snowmel t. For
example, thermal erosion along ice wedge troughs can lead to
degradation of polygon terrain (Mackay, 1974a), the
development of thermokarst gullies and the formation of
isolated polygon remnant cemetary mounds (French, 1974). In
coastal and fluvial environments, thermal erosion of ice-rich
sediments contributes to rapid rates of shoreline recession
(e.g., Harry et al., 1983). Rates of coastal erosion by wave
action may also be influenced by ground ice distribution.
For example, Are
failure in areas
(1988) has documented catastrophic block
of ice-wedge polygon terrain along the
Beaufort shoreline. Similar processes were observed in 1988
by the author on the north and west sides of Herschel Island.
20
In Siberia, long-term the1.'1nokarst processes has produced
a distinctive relief, the end stage being the development of
large "alas" depressions (Czudek and Demek, 1970). Alas
topography is rare in North America, indicative of differences
in climate and the geomorphic history between the two regions.
A close equivalent in North America may be the extensive
lacustrine plains of north Alaska and the Canadian western
Arctic, which appear to have developed in response to
initiation, growth, and drainage of thaw lakes (Sellman et al.,
1975). Several cycles of this process may have been repeated
during Holocene times (Billings and Peterson, 1980). Black
(1969) identified a number of problems regarding the
initiation and subsequent development of thaw lakes, of which,
unfortunately, many remain unresolved. Sorne thaw lakes appear
to originate as small tundra ponds formed by the thawing of
ice wedges (French and Egginton, 1973), while others may grow
by coalescence of pOIlll:::: located within low-centered polygons
(Harry and French, 1983). However, the processes associated
wi th thernlokarst lake development are still poorly understood.
Thermokarst may develop in response to local disturbance
and regional environmental change. For example, a forest fire
near Inuvik, N.W.T., resulted in a significant increase in
active layer thickness, as weIl as melt-out and redistributIon
of ground ice (Heginbottom, 1973, 1974). Similarly, manyof
the active thermokarst processes on eastern Banks Island are
21

•
believed to occur in response to changes in local geomorphic
conditions (French, 1974; French and Egginton, 1973) •
However, ~here is also evidence in the \lestern Arctic of
regional thermokarst acti vi ty induced by Hypsi thermal cl imatic
warming approximately 9,000-10,000 yrs. B.P. (Rampton and
Bouchard, 1975). It is clear when flying over the Yukon
Coastal Plain that rnany areas owe much of their present
landscape characteristics to local and regional thermokarst
processes.
Retrogressive Thaw Slurnps
One distinctive forrn of backwearing therrnokarst (Figure
2.6) produces bowl-shaped depressions that resemble scars
resul ting from slumps or flows in nonperrnafrost environrnents.
Several terrns have been used to describe this landforrn,
including ground ice slump, thaw slurnp,
thermocirque and retrogressive thaw slurnp.
thawilow slide,
In this case, the
term "slurnp" refers to the resemblance of the landform shape
to slumps occurring in nonpermafrost areas, and not to its
genetic processes. The term retrogressive thaw sI ump is
currently recomrnended by the Perma frost Subcolnrni ttee of the
National Research Council of Canada.
Studies have docurnented the rnorphology and dynamics of
retrogressi ve thaw slurnps observed in northern Canada (French,
1974; Kerfoot, 1969; Lewkowicz, 1988; Mackay, 1966), but few
studies in the North American literature relate the
22

A
Figure 2.6. Photographs of retrogressive thaw slumps: (a) Herschel Island (June 1987), and (b) Yukon Coastal Plain (July 1987).
23

•
morphology of thermokarst landforms to the mechanics of slump
development. Furthermore, most studies have been concerned
with thermokarst initiated by human-related disturbances
(French, 1975). Retrogressive thaw slumps occur where bodies
of massive ice or ice-rich sediments are exposed by mass
wasting or erosion and they are extreme1y active agents in
landscape modification. French and Egginton (1973) recorded
scarp retreat rates on eastern Banks Island of up to 10 m per
year and Edlund et al (1989) have documented 25 m of retreat
over a period of 38 days on Ellesmere Island. Radiational
energy input into the ice face of retrogressive thaw s1umps
may be high during the brief summer period (e.g., Pufal1 and
Morgenstern, 1980a, 1980b) particularly on south - facing
exposures. Radiometer measurement of a retrogressive thaw
slump near Tuktoyaktuk, N.W.T., revealed temperatures of up
to lace at the ice-water interface (Mackay, 1978) Many thaw
slumps develop in a cyclical fashion, with periods of activity
separated by periods of stability (Mackay, 1966). This
process appears to be a function of changes in climate, slope 1
rate and pattern of erosion, and the distribution and quanti ty
of ground ice (Lewkowicz, 1988).
Retrogressi ve thaw sI ump formation invol ves a combinat ion
of thermal and mass movement processes, namely: (1) ablation
of the ice-rich face, (2) falling and slumping of sediment and
organics from the headwall and overly ing active layer, (3)
24
1

sliding ànd flowing of material off the ice face, and (4) flow
in the slump floor of supersaturated mud derived from the
headwall and sediment contained within the ice (Lewkowicz,
1988; Mackay, 1966). These processes are self perpetuating
until the slump is stabilized by one or more of the following
mechanisms: (1) the accumulated sediment. either covers the
thaw face or assumes a gradient insufficient to remove
material by mudflow, (2) the body of ground ice completely
melts, resulting in a standstill of headwall retreat, (3) the
ice content of the frozen ground decreases, or (4) the depth
of the overburden changes. Any of these processes results in
a decrease in the available mel twater and causes burial of the
face (Lewkowicz, 1988). The resul ting landform is often
shaped like an elongated horseshoe, although, dimensions are
highly variable. Lewkowicz (1988) suggests that slump size
decreases wi th increasing latitude. However, i t remains
uncertain whether differences in size are the result of
variations in grou~d ice distribution, slope characteristics
or the local energy balance.
2.5 Mass wasting
Mass wasting is the collective term for aIl gravi ty
induced downslope movements of weathered debris (Permafrost
Subcommittee, 1988). As the definition implies, gravit y is
the sole driving fo~cer although other agents of erosion may
contribute by inducing unstable slope conditions. For
25

example, groundwater may reduce internaI strength through
increased pore water pressure, or erosion by running water may
cause oversteepened slopes; in both cases unstable conditions
may resul t (Rampton, 1974). Forms of mass wast.~ ng most
frequentIy described in arctic environments are solifluction,
bIockfailure and skinflows. There are few references in the
general mass wasting literature to other forms of thaw-induced
mass movements. However, considerable work has been
undertaken
environments
addressing slope problems
(AIgus, 1986; Chandler, 1972;
in permafrost
Harris, 19-/3;
McRoberts, 1973; McRoberts and Morgenstern, 1974a, 1974b).
Analysis of mass wasting of any one particular slope
failure is a difficult problem, since most mass wasting
occurrences display more than one mechanism of motion, and
since lTiOst field studies attempt to reconstruct slope failures
a posteriori based upon resul tant Iandforms. Thus, ev idence
concerning the processes in operation may not be conclusive.
Nevertheless, two broad classes of mass wasting are generally
described: ( 1) surface mass movements, which are
characterized by the transfer of debris downslope as a thin
layer often overlying bedrock (creep, solifluçtion), and (2)
deep seated mass movements, which affect and alter the bedrock
surface (rockfalls and landslides). Each type of movement is
influenced by a number of variables, including: cl imatic
condi tions, slope angle, nature of debris and vegetation
26

f
-
cover.
There are numerous classifications which attempt to
categorize the various ferms of mass movement by their
mechanism of transport. A widely accepted classification
developed by Carson and Kirkby (1972) separates the mechanism
of mass movement into three categories: (1) slides, which
include falling, slumping and sliding movements, (2) flows,
and (3) heaves. By placing these particular processes on the
corners of a triangle diagram, and using moisture content and
rate of movement to differentiate the rnechanisms (Figure
2. -; . a), they have demonstrated that most mass rnovement events
are a combination of two or three mechanisrns.
Another classification by Varnes (1978) is based
primarily on the type of material and the type of rnovement.
The categories defined in Varnes' study include falls, slides
and flows, with no consideration of heave mechanisms. This
classification does take into account moi sture content, amount
of deformation and rates of rnovement (Figure 2.7.b). Falls
are a type of mass movernent which invol ve the descent of rock
or soil material of any size from steep slopes or cliffs.
Common types are stone, boulder, rock and soil falls.
Observations of fall lTIass movements in the arctic include
those occurring wi thin thaw slumps and along coastal bluffs
as a result of melting-out of ground ice (Are, 1988;
Lewkowicz, 1988; Mackay, 1966). Thermal erosion of an exposed
ice face may cause the formation of overhangs weIl in excess
27

Flow A
Source: ClrSOl1 ;lild KI! khy ( JtJ72)
B Type of Movement Type of Haterial
Bedrack Coarse Fine
Falls Rock Debr~s Eùrth
Topples Rock Debr~s Earth
Ratatianal Rock slump Debris slu::p Eùrth slump Slides Black sl1de Black sl~de Bloc}~ sllùe
Translational Rock sl~de DebrIS silde Earth silde
Lateral spreads Rock Debt"is I:arth
Flows Rock D8brls Earth
Camplex Comblnation of two or more types of movement
Source: afterVarnes (1978).
Figure 2.7. Classification of mass rnovement (a) Carson and Kirkby (1972), and (b) Varnes (1978).
28
fi
of onp. metre which may collapse and fall from a height of
several metres.
Active Layer Slides
The most common sliding phenomena are those which occur
on planar surfaces, termed translational slides. Initiation
of these sI ides occurs when the material' s shear strength
along a predeterminect failure plane is exceeded. Active layer
slides dre a form of rapid mass wasting found in permafrost
environments (Figure 2.8). The term active layer slide is one
of several adopted in the literaturei other terms include
active layer glides, active layer detachments, skinflows and
thaw slides (Lewkowicz, 1988). They aIl refer to the
downslope movement of seasonally thawed material as a discrete
mass over a translational surface (McRoberts and Morgenstern,
1974ai 1974b). Active layer slides are long and shallow, and
usually involve movement over an inclined planar surface (the
top of permafrost). The resultant landform is a small ribbon
like scar oriented parallel to the slope (Lewkowicz, 1988).
Al though t:hese features have been widely reported in the
Arctic (e.g., Lamonthe and st. Onge, 1961i Lewkowicz, 1988;
McRoberts and Morgenstern, 1974a, 1974b), few studies have
been concerned with their genesis, morphology, material and
ground ice characteristics, and possible association with thaw
slumps. The most useful research to date is a series of
studies concerned with the relationship between active layer
29

A
8
Figure 2.8. Photographs of active layer sI ides: (a) Thetis Bay, Herschel Island (July 1988), and (b) Eureka, Ellesmere Island (August 1988).
30

slides and material properties in the Mackenzie Valley
(McRoberts and Morgenstern, 1974a, 1974bi Morgenstern and
Nixon, 1971).
Flows are mass movements in which the displaced body of
material deforms as a viscous fluide They are characterized
by internaI shear, acceleration downslope, and a veloci ty
profile which decreases with depth into the flowing maSSe
Flow dominated processes are commonly described as mudflows
(Lewkowicz, 1988). They are produced by the downslope
movement of saturated soil and are frequently associated with
retrogressive thaw slumps (Mackay, 1966). Retrogressive thaw
slump flows occur on the floor of the slump, where
supersaturated fine-grained material moves downslope away from
the headwall as the supernatant water drains. Flows have
traditionally been defined as rapid mass movements; however,
in many cases their rate is extremely variable and dependent
upon water content.
Heave mechanisms are the main process in slow mass
movements which are frequently termed creep. Frost heave is
defined as the upward or outward movement of the ground (or
objects in the ground) caused by the formation of ice in the
soil, and is an important component of pattern ground
(Permafrost SUbcommittee, 1988). A common heave process in
the arctic is solifluction, defined as the downslope flow of
unfrozen earth material on a frozen substrate (Permafrost
Subcommittee, 1988). Geomorphologically, solifluction is a
31
1
highly significant forrn of slow mass movement, more effective
than those forrns generally occurring in temperate regions.
Our present understanding of heave type processes has been
greatly advanced as a result of engineering projects such as
pipeline and road construction (Johnston, 1981; Konrad and
Morgenstern, 1984; Williams, 1979).
32

Chapter 3
" study Area and Methodology
3.1 Introduction
Herschel Island is loeated in the northern Yukon
Territory at 69°41'N 139°01'W, approximately 60 km east of the
international boundary between Yukon and Alaska (Figure 3.1).
It is situated 3 km north of the Yukon coast, and forros part
of the Yukon Coastal Plain physiographic region which is
bordered by the British and Richardson Mountains to the south
and south-east, the Mackenzie Del ta to the east and the
Beaufort Basin to the north.
Herschel Island was selected as the study area for this
research for five reasons:
(1) the ice-rich nature of the permafrost, together with
steep slopes and rapid coastal erosion, is ideal for the
initiation of retrogressive thaw slumps and active layer
slides;
(2) there is a paueity of detailed permafrost process studies
for the yukon Coastal Plain, yet generally good
background geologieal information
Rampton, 1982; Mackay, 1959);
(Bouchard, 1974;
(3) there is relatively easy aeeess to the island from either
Tuktoyaktuk or Inuvik by helicopter or fixed wing
aireraft;
(4) the study is a natural compliment to the research studies
33

-@-
1
Figure 3.1.
Beaufort Sea
Herschel Island
'i
LEGE~JO
ê land above 155m
 Spot e!evatlon (m)
Col"nson Head
Herschel Thetls Bay
o i
SCALE 5
km
10
Study area map, Herschel Island, Yukon Territory.
34
"

• "
on massive ground ice nature and genesis currently being
~ carried out by Dr. W.H. Pollard;
(5) in recent years, Herschel Island has become a centre of
interest for three reasons: (1) it has a colourful and
relatively long cultural history; in 1987 it was
designated as the first Territorial Heritage Park, (2)
it lies within the Herschel Basin which is a weIl known
hydrocarbon area, and (3) its high elevation and offshore
position make it an ideal location for a remote early
warning station (Department of National Defence).
3.2 Historica1 perspective
Archaeological investigations indicate that Herschel
Island was inhabited by western Thule peoples during the
period from about 1000-1400 A.D. These inhabitants exploited
seal, fish, caribou, whale and other species during their
occupation of the area (Yorga, 1980). The abundance of
various wildlife and game species like caribou (porcupine
Caribou Herd), musk-ox, Arctic Fox, wolf, grizzly and polar
bear, wol verine, moose and various marine mammals (seal r
beluga and bowhead whale) have attracted, and continue to
attract, seasonal hunting activities of the Inuit and Dené
people.
The earliest recorded visit by Europeans to Herschel
Island was by John Franklin 1 s first expedition to map the
arctic coast in 1823 (Francis, 1984). Franklin named the
35
island after the British astronomer, William Herschel,
changing it from its local name Kigirktayuk.
During the late 1800's and early 1900's Herschel Island
took on an entirely new significance. Since Pauline Cove on
the east side of the island provides the only safe deep water
harbour between Point Barrow, Alaska, and the Mackenzie Delta,
it became the centre for Beaufort whal ing acti vi ties by
American whaling companies. By wintering up to 15 ships at
Herschel, Americans were able to obtain a he ad start on the
season in the Beaufort Sea. Between 1892 and 1905 the
presence of the whalers had a strong impact on wildlife and
the Inuit. Epidemies such as the measles (1902) nearly
eliminated the Inuit population and hunting depleted the
caribou and bowhead whale numbers. The net resul t was a
tremenclous erosion of the native culture. In 1903, an
Anglican mission, a trading post (Hudson's Bay Company) and
a Royal North West Mounted Police (RNWMP) post were
established at the s<.me time as buildings for the whaling
companies. This resul ted in the settlement of Herschel at
Pauline Cove. In 1914 whaling was abandoned, and by 1931 the
Hudson' s Bay Company decided to return to supplying arctic
posts by river; thus, the importance of Herschel Island
diminished. The RNWMP maintained a detachment there unti l
1932. The RNWMP did reopen the post following the Second
World War; however, it only lasted for a short periode
The earliest scientiflc studies of the Herschel Island
36

area were by O'Neil (1924) and Bostock (1948). As part of the
1913-1918 Canadian Arctic E~{pedition O'Neil made a number of
interesting geological observations. For example, he noted
a similarity between the Pleistocene marine deposits found on
Herschel Island and thnse covering much of the Yukon Coastal
Plain between the Firth River and the Mackenzie Delta. He
also proposed the the ory that Herschel Island may be a remnant
of a former or paleo Mackenzie River Delta. O'Neil (1924)
documented the occurrence of widespread erratic boulders on
the island's surface and large bodies of ice in its sediments.
At approximately the same time, Leffingwell (1919) produced
his detailed observations of materials, permafrost and ground
ice for part of northern Alaska. Roughly two decades later
Bostock (1948) lead a Geological Survey of Canada expedition
to the northern Yukon. However, i t was the work of J. R.
Mackay in the 1950's, as a member of the Geographical Branch
(University of British columbia), that shed light on the
origin of Herschel Island. In 1959 Mackay suggested that
Herschel Island was the result of glacial tectonic processes.
He observed a number of structures in support of this theory,
including folds, inclined beds, overlap faul ts and shear
planes. Mackay also noted the presence of erratic boulàers
at an elevation of approxlmately 165 m and the occurrence of
massive ground ice bodies. Bouchard (1974) conducted a
detailed study of the surficial geology of Herschel Island and
commented on ground ice conditions and topography. Rampton
37

(1982) summarized the Quaternary geology of Herschel Island
and Yukon Coastal Plain based on his extensive field work as
weIl as that of co-workers. More recently, work on Herschel
Island has been concerned with examining soil and vegetation
(Smith et al., 1990) and the investigation of ground ice
characteristics (Pollard, 1989, 1990).
3.3 Regional Betting
Compared to the rest of the Yukon Coastal Plain, Herschel
Island displays a number of distinct characteristics resul ting
from its glacial origin, exposed position and the ice rich
nature of its permafrost. It is interesting to note that
Herschel Island is the only sizeable island found along the
Yukon and Alaska Coastal Plains west of the Mackenzie Delta.
The following will highlight sorne of its distinctive
characteristics.
3.3.1 Physiography
Herschel Island has a crude rhombohedral plan shape that
has been streamlined by more than 40,000 years of wave action
by the Arctic Ocean. It covers an area of 108 km! and has
dimensions of approximately 15 km along a north - south axis
and 8 km along an east - west axis. It has a maximum
elevation of 180 m above sea level, which is curiously higher
38

than other coa~tal areas of the Yukon Coastal Plain.
Approxirnately 30% of its area is 90 rn ab ove sea level
(Bouchard, 1974).
The topography of the island displays two marked trends
which roughly divide the island in half. The north and north
eastern portion is characterized by the hignest elevations and
the steepest relief. The south and south western portion is
lower in elevation and the coast is rnarked by a gently sloping
plain. The morphology of hjgh relief areas is dominated by
rolling and hummo~ky moraines which form a series of high
parallel ridges and hill~ with narrow asymmetrical valleys in
between. The ridges are breached by a series of deep gullies
(Figure 3.2) which, in places, form steep valleys up to 45 m
deep. The paraI leI ridge and asymmetrical valley sequence is
interpreted as glacially ice-thrust ridges (Mackay, 1959).
The coastline of the north-northeastern side of the island is
dominated by steep bluffs up to 50 rn high. Undercutting of
frozen sediments by wave action results in coastal retreat by
block failure (Are, 1988). Where coastal sediments conta in
high ice content numerous retrogressive thaw slumps and active
layer slides contribute to rapid bluff retreat.
The leeward side of the island (the southwest, south and
east sides) have large aggrading spits cornposed of coarse
gravel, sand and sandy silt. The largest, Avadlek spit, is
roughly 6 km long while Herschel spit and Osborne Point are
each between 2 - 3 km in length. Beaches are best developed
39

Figure 3.2. Photograph showing gully formation in the vicinity of Collinson Head (July 1987).
40

along the southwest side of the island, but are still only a
few metres wide, conta in gravel, and are locally strewn with
boulders (Bouchard, 1974). On the southeast side, the
shoreline is mantled by a thick accumulation of supersaturated
clays, clayey sil ts and organics.
thaw-induced mass wasting ar.d
This is a residue from
thermokarst activity.
Eisewhere, the beaches are generally narrow to non-existent.
The island's interior contains lower concentrations of
retrogressive thaw slumps and active layer slides, but other
forms of thermokarst are present, including melt-out of ice
wedges, beaded drainage and thaw lakes. There is also
evidence of human-induced thermokarst in the form of gullying
along 1960's seismic lines and wheel ruts from a Twin Otter
landing in 1987 (Figure 3.3).
3.3.2 Geologie History
Rampton (1982) mapped Herschel Island as part of the
Yukon Coastal Plain geologic unit. The Yukon Coastal Plain
is considered a pediment, formed by the parallel retreat of
escarpments in areas
climatic conditions.
plain slopes gently
of aY.'id or semi-arid non-periglacial
The pediment surface of the coastal
from the Barn and British Mountains
tûwards the coast, where the surface is covered by a thick
mantle of unconsolidated glacial, fluvial-glacial and
lacustrine deposits. The age of the erosional surface of the
Yukon coast is uncertain and difficult to determine. Hughes
41

Figure 3.3. Photographs of thermokarst as a resul t of wheel ruts caused by the landing of a Twin otter in the late summer of 1987.
42

(1972) noted similar surfaces throughout much of the Yukon
(e. g., Klondik.e Plateau and Eagle Plains) , but has been unable
to determine their age or the climatic conditions which
produced them. However, it is apparent that they formed under
conditions very different from those which prevail today
(Hughes, 1972). It is believed that the age of the Yukon
Coastal Plain postdates regional tilting and faulting
associated with the Laramide Orogeny of the late Cretaceous.
This is evident where stream channels and a fault escarpment
incise the surface of its northwest slopes, near the Mackenzie
Delta (Rampton, 1982). The maximum age of this surface is
defined by its youngest rock, the Aklak Member of the Reindeer
Formation which is late Cretaceous or early Tertiary (Young,
1975). Rampton (1982) believes that aIl evi~ence points to
a late to middle Tertiary age for the formation of this
surface because climatic conditions are known to have been
warmer than those of the present.
Generally, Herschel Island owes its origin to Pleistocene
glaciotectonic acti vi ty. Topographie and structural
characteristics of the island and the Mackenzie Basin support
a glacier ice-thrust hypothesis first proposed by Mackay
(1959). In theory, a lobe of the Laurentide ice sheet
(Buckland Glaciation) moved northwest ward from the Mackenzie
Valley and excavated material from the current position of
Herschel Basin more than 40, 000 years B. P. (Rampton, 1982).
As the lobe impinged upon the Yukon coast it produced an ice-
43

thrust moraine complex which currently forms ~he main body of
Herschel Island (Bouchard, 1974). Evidence in support of this
theory includes (1) the presence of a submarine ridge of
probable glacial origin 40 km west of Herschel Island
(Rampton, 1982), (2) the volume of sediments missing from
Herschel Basin located southeast of the island is proportional
to the size of the island (Mackay, 1959), and (3) the deforned
nature of the sedi111ents is believed to have been caused by the
overriding of Pleistocene glaciers (Mackay, 1959; Mackay and
Mathews, 1964; Mathews and Mackay, 1960). Deformations are
preserved in frozen sediments as folds, inclined beds, thrust
fault planes and simple shear planes. These structures are
readily exposed along stream cuts and coastal bluffs, and in
the surface of ridges along the northwestern side of the
island (Bouchard, 1974). Sorne deformation of sediments may
have also occurred as permafrost aggraded into earth materials
exposed subaerially following deglaciation. other evidence
supporting a glacial origin is the presence of erratic
boulders, meltwater drainage channels, glacial fluvial
deposits and glacial till (Bostock, 1948; Mackay, 1959, 1963;
O'Neil, 1924; Rampton, 1970, 1973).
Deposits predating glaciation are found at the base of
coastal exposures on the north and west sides of Herschel
Island and along the coastal plain toward the west. Bouchard
(1974) classifies the pre-glacial deposits into three
categories: (1) marine sediments, containing shells or
44

fragments of shells, (2) mixed sediments, containing
occasional shells and detrital terrestrial organics, and (3)
non-marine, containing only organic materials. The marine
unit is a brown and grey silt with sand laminae, which ranges
from 1. 2 m to more than 10 m in thickness. The mixed
sediments consist of interbedded brown to grey sil ty clays and
fine-grained sands with pebbles, organic detritus, wood and
shell fragments. The mixed sediment unit is up to 20 m thick.
Bouchard's non-marine pre-Buckland unit consists of 60 cm of
peat underlain by sand and sil t. Paleoecological studies from
the northern edge of Thetis Bay indicate that deposition of
marine sediments took place under relatively shallow nearshore
conditions of an arctic region (Rampton, 1982). Naylor et al
(1972) analyses of molluscs from the same section suggests
that marine conditions were similar to those of the present,
and that the mixed sediments were deposited in brackish
shallow marine waters during a period of marine transgression.
Quaternary sea levels for this region are perhaps the least
docurnented and most poorly understood of aIl arctic coastal
regions in Canada (Forbes, 1980; Hill, 1985).
3.3.3 Surficial Deposits
The surficial geology of Herschel Island, as weIl as
rnaterials from the Mackenzie Basin support the glacier ice
thrust origin proposed by Mackay (1959). The general absence
45
of till from the Herschel Island geology is somewhat
problematici however, the widespread bouldery clay diamicton
and erratics may be interpreted as reworked tille Since the
mid-Wisconsin, the top(..graphy and surficial depos i ts have been
reworked by permafrost aggradation, thermokarst and slope
processes. The maj ori ty of research undertaken on the gcology
and geomorphology of the Yukon Coastal Plain (e.g., Bouchard,
1974; Forbes, 1980; Mackay, 1959; Pollard, 1989, 1990;
Rampton, 1982) have focused primarily on processes and events
that post-date glaciation.
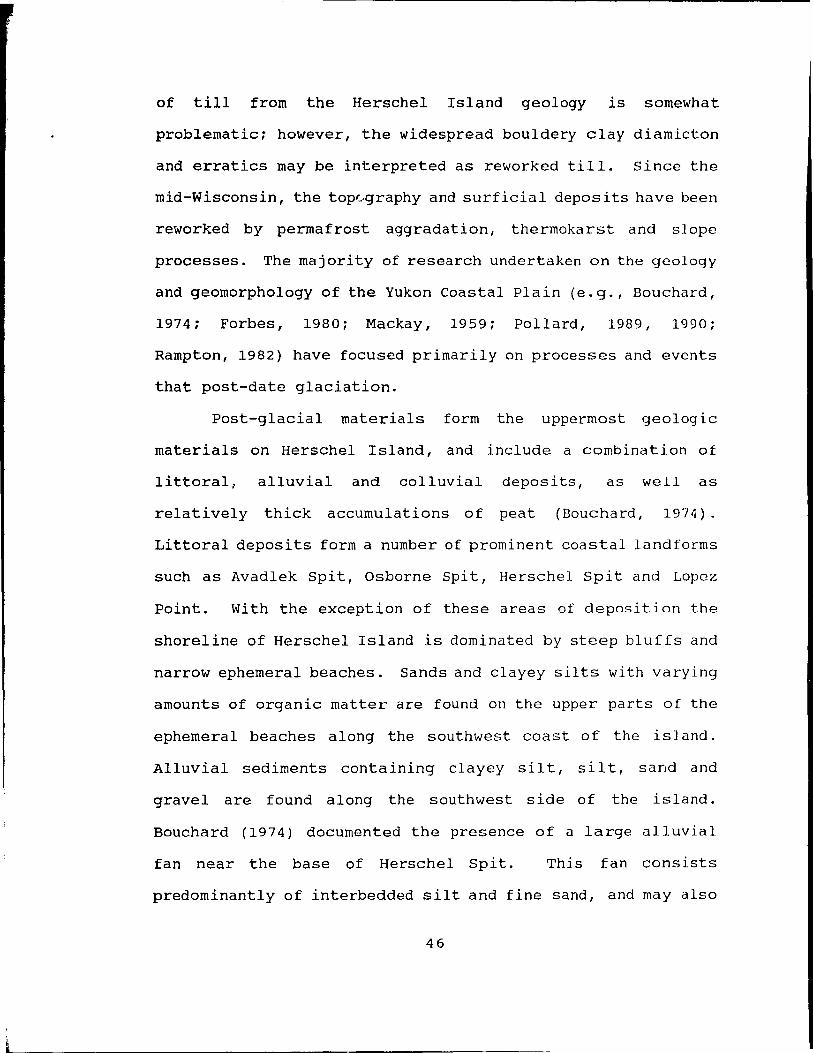
Post-glacial materials form the uppermost geologic
materials on Herschel Island, and include a combination ot
littoral, alluvial and colluvial deposits, as weIl as
relati vely thick accumulations of peat (Bouchard, 1974).
Littoral deposits form a number of prominent coastal landforms
such as Avadlek Spit, Osborne spit, Herschel Spit and Lopez
Point. with the exception of these areas of deposition the
shoreline of Herschel Island is dominated by steep bluffs and
narrow ephemeral beaches. Sands and clayey silts with varying
amounts of organic matter are found on the upper parts of the
ephemeral beaches along the southwest coast of the island.
Alluvial sediments containing clayey si l t, si l t, sand and
gravel are found along the southwest side of the island.
Bouchard (1974) documented the presence of a large alluvial
fan near the base of Herschel Spi t. Thi s fan consists
predominantly of interbedded silt and fine sand, and may also
46

cont n ice lenses (Bouchard, 1974). Colluvial materials
consist of a widespread surface diamicton (Bouchard, 1974).
This layer is up to 1 m in thickness and consists primarily
of pebbles and silty-clay sediment, varying in colour from
light brown to dark grey. other colluvial deposits are the
result of mass wasting and thermokarst activity. organic
sediments occur as peat layers and wood fragments, most of
which are associated wi th ice wedge polygons. Bouchard (1974)
described peat bogs in the eastern section of the island 180
m in length with ice-wedge polygon dimensions of 25 m X 35 m.
3.3.4 Regional Climate
Climate is the single most important variable influencing
permafrost and thermokarst processes (Brown, 1963a, 1973; Gold
and Lachenbruch, 1973). The climate of Herschel Island
clearly reflects the combined influence of the Arctic Ocean,
the close proximity of the island to the continental landmass
and the regional physiography. Climate data are collected at
two locations on the Yukon Coastal Plain, namely, shingle
Point (Figure 3.4) and Komakuk Beach. These Distant Early
Warning meteorological stations have been in operation since
1957 and 1961, respectively. There are also climate records
from Herschel Island for the periods 1896-1918, 1974-1975 and
1986-1988; however, the se records are very fragmented and
provide little useful information. The harsh, cold arctic
climate which characterizes the Yukon Coastal Plain is
47

40
30
20
10
0 4
-10
........ ~ -20 -...... ra .... ~ -40
E ~ -50
-60
J f
Figure 3.4
00
75
70
GO
00
50
E fiJE
C 45 C
1 ro +-
.\0 c.. 1 u
C,J
1 :I5a:
1 1 3)
1 1 1 1 :5
1 1 1 ~XJ
1 1 1 1 • 1 1 1 1 15
• 1 1 1 1 10
1 1 1 1 5
0
m a m J j a s 0 n
Month Temperature and precipitation data from Shing le Point, Yukon Coastal Plain (1957-1981, and 1988) . (1) mean daily temperature, (2) meùn daily maximum, (3) mean daily minimum, (4) extreme maximum, (5) extreme minimum, (6) rncùn total precipitation, and (7) greatest precipi tation in 24 hours. The symbol ( • ) represents mean monthly tempe rature for 1988. No data is available for the months of October and November (Source: Wahl eL al . 1987).
48

'.
generally dominated by continental arctic air in winter and
maritime arctic air in summer. The mean annual air
tempe rature is -10°C at Shingle Point and -11°C at Komakuk
Beach. Mean daily tempe ratures for Komakuk Beach average 8°C
and -2SoC, and at shingle Point 11°C and -27°C, for the months
of July and January, respectively. Maximum recorded
tempe ratures rarely exceed 25-26°C on the Yukon Coastal Plain,
while the extreme minimum temperature generally is about -SO°C
(Wahl et al.. 1987). No ground (subsurface) temperatures are
available for Herschel Island. However, in the Richard' s
Island and Tuktoyùktuk region (approximately 200 km east of
Herschel Island) the average annual temperature of the ground
15 m below the surface is approximately -7 to -10°C (Mackay
and Mackay, 1972). Ground temperatures along the Yukon
Coastal Plaln, including Herschel Island, are probably quite
similar. The total annual r~ecipitation is less than 20 cm,
most of which falls as rain or drizzle during the short summer
when the Beaufort Sea is ice-free. Snow cover averages 50 cm
on the coastal plain (Rampton, 1982), but on Herschel Island
it varies from a few centimetres on exposed ridges to 2-3 m
in narrow valleys and in the lee of major obstructions. Winds
are an important element of the regional climéice, with a
dominant direction roughly parallel to the Yukon coast - from
the west to the northwest. Its exposed position along the
Yukon Coast means it is highly susceptible to wind activity.
49

3.3.5 Permafrost and Ground Ice
The Yukon Coastal Plain is underlain by continuous
permafrost (Brown, 1978, Figure 2.2) which is believed to have
existed prior to glaciation. Permafrost thickness is in
excess of 300 m (Judge, 1973), although it is thinner under
active or recently drained lake basins and may be absent under
aggrading spits such as Herschel Spit. The age of permafrost
and ground ice of Herschel Island are believed to be qui te
similar to the rest r)f the Yukon Coastal Plain; however,
insufficient research has been done to confirm this.
On Herschel Island ground ice lS an important
constituent of permafrost materials. It occurs mainly in the
form of ice-wedge ice, epigenetic and syngenetic scgregated .. ice layers, ice lenses and massive tabular ice bodies, pore
ice, buried snowbank and glacier ice (Pollard, 1989, 1990).
The island also exhibits periglacial features such as tundra
tussocks, patterned ground, frost mound phenomena (palsas),
solifluction and frost creep.
Air photo analyses and field reconnaissance revealed that
ice wedges are widespread on Herschel Island and can be round
in various stages of development. In North America, few ice
wedges have been reported extending more than 7-8 m below the
ground surface or exceeding 3 m in width. In the coastal
lowlands of Siberia syngenetic ice wedges frequently excced
5 m in width and 40-5f) m in depth (Harry et :Ji. 1985;
50

Leffingwell, 1919). On Herschel Island, ice-wedge ice exposed
in the headwall of a retrogressive thaw slump measured 3 m
wide and 10 m deep (Figure 3.5). Segregated ice exposed in
51 ump and coastal sections range from ice lenses a few
centimetres thick to horizontal massive tabular ice bodies 4-
5 m thick. Pore ice is found in most exposures, but i ts
content varies considerably. Buried snowbank ice occurs in
areas of previous thermokarst activity and is limited to near
surface deposits. Buried glacier ice was tentatively
described in areas of glacial] y deformed and ice-thrust
sediments (Pollard, 1990).
Bouchard (1974) mapped the depth and distribution of
ground ice based upon field evidence and drill logs (Figure
3.6). sixt y-one drill logs were compiled for Herschel Island
- the deepest being 35 m in length - with an average depth of
25 m. Bouchard found that most massive ground ice encountered
was at depths of 5 m and at 18 m. For 15 cores, the drill did
not completely pierce the massive ice body or icy sediments.
For the 12 cores that did cut through massive ice and icy
sediments the materials immediately below were either dry or
ice-poor. Drill logs have revealed that the average maximum
depth of the massive ice and ice-rich sediment is
approximately 13 lU, whereas on the adj acent Yukon Coastal
Plain it is approximately 5-9 m (Rampton, 1971). Cores which
encountered deep massive ice where commonly overlain by a clay
or a clayey gravel unit, probably the main unit forming the
51

Figure 3.5.
• al #~ •
.-J- ... , 1 ,.~.. • .... _,.
.:A .. - '"1..- - • ti:t I*r.*' •
, .. <,~ :<-.. ." • .... ~" "'..... -J ,. '-.-. ~... -. (~-.....- ---, ;~~~ - ~... ., --
~:: • f • '" 4 .. ~;"w-. -__ ......... _ - ~ .. "~l ........ /. ,. ... ;'... .. , "-
'jt_,.. .,j (~ .... ~ _'Zo1 ...... '. J - - ''-; ,-~~.,..~
Photograph of ice-'wedge ice, Herschel Island (July 1987).
52
Thetis Bay,

o
Figure 3.6.
=
3
km 6
HERSCHEL ISLAND
Herschek~
Thetis Bay
LEGEND
o RTS SITES li AlS SITES
,.. - Area underlain by f \..,,) ground ice
Study site location map. The map shows the location of RTS 1-4 and ALS 1-4. It also illustrates the distribution of ground ice on Herschel Island, after Bouchard (1974), revised by Pollard (1989).
53

preglacial materials.
3.4 study sites
Thetis Bay was selected as the primary study area because
bath retrogressive thaw slumps and active layer slides occur
in close proximity. AIso, based on the presence of numerous
stabilized and revegetated scars, there appears to be a long
history of these processes. Another reason for this decision
was the accessibility of this area from the base camp on
Herschel Island. Within this thesis retrogressive thaw slump
sites have been abbreviated to RTS (RTS 1-4). Although the
geomorphic accuracy of the term "slump" is questionable, i t
is retained throughout this thesis since it is recommended by
the Permafrost Subcommittee (1988), and also for the purpose
of internaI consistency.
Three retrogressive thaw slumps up to 3.5 km west of the
camp were selected for detailed investigation. These slumps
occur on south - facing slopes adjacent to Thetis Bay. Two
thaw slumps were chosen for detailed investigation (RTS land
2) and a third (RTS 3) for less intensive study. Another
retrogressive thaw slump located near Collinson Head (RTS 4)
is included in the discussion of permafrost stratigraphy, ice
content and geochemistry. RTS 4 is located 2.5 km east of the
Herschel base camp in an area of ice-push moraine, steE:p
coastal bluffs and deep drainage channels (Figure 3.6).
The four areas of active layer slide activity exarnined
54

are in the vicinity of Thetis Bay and Collinson Head.
Generally, active layer slides are found along seepage lines
in areas experiencing various types of mass wasting (e. g. ,
creep, solifluction) (Figure 3.6). within this thesis active
layer slide sites have been abbreviated to ALS (ALS 1-4).
3.5 Methodology
Research methodolcgies used in this thesis are divided
into two components: first, the collection of field data on
the physical characteristics of retrogressive thaw slumps and
active layer slides, and factors which influence their
occurrence, and, secondly, a laboratory component concerned
wi th the analysis of samples obtained in the field. Fieldwork
for this study was carried out during June-July 1988, April
and June 1989.
3.5.1 Field Work
Field work focused on three aspects of retrogressive thaw
slump and active layer slide occurrence: lllorphology, material
properties and ground ice characteristics, and process.
Examination of morphology involved the mapping of location,
measurernent of dimensional parameters and examination of
topographie conditions. Detailed surveys and slope profiling
of slurnp and slide form and the surrounding terrain was
undertaken using a TO-184244 Wild theodolite, 50 m survey
tape, range pole and Abney level. Examination of slump
55
processes involved installation of a grid of survey stakes
around the slump headwall with regular measurement of headwall
position in order to record rates of retreat. Survey stakes
installed within the slump floor allowed determination of the
rates of movement wi thin the slump floor. ExaminaU on of
processes invol ved in sI ide occurrence was attempted by
reconstructing processes based upon the resultant landform,
"an eye witness" account of a slide occurrence and Iaboratory
analyses. Although technical and logistical support was not
available to undertake a complete micrometeorological study,
daily air temperature was recorded at base camp, as weIl as
inside and outside of the slump bowl at RTS 1. Several types
of ground ice were documented on Herschel Island; however,
this thesis only focuses on three ice-rich slumps containing
massive ground ice.
the description of
relationships, and
Ground ice lnvestigations involved (1)
ground ice types and stratigraphie
(2) sampling at 25 cm intervals for
calculation of ice content and geochemical analyses. Sediment
samples were collected from both thaw slumps and active layer
slides for geotechnical analyses.
3~S.2 Laboratory Work
Laboratory analyses focused on (1) the measurement of
soil properties, including Atterberg Limi ts and grain size
distribution, and (2) the analysis of ground ice, including
the calculation of moisture content and geochemistry.
56

Atterberg Limits provide a measure of the rheological or flow
properties of a soil, and were determined for both thaw slumps
and active layer slides. The limits are defined by the soil
water cuntent required to produce a specified resistance to
deformation.
The liquid limit of a sail is the water content
(expressed as a percentage of the weight of the oven dried
soil) at the bounctary between the liquid and plastic states.
Using a Casagrande ASTMD 423-66 instrument, the soil sample
is molded wet, placed in a bowl, and levelled parallel to the
base. A grooving tool is used to separate the sail mass into
two parts. A cam allows the bowl ta fall from d predetermined
height at a rate of 2 drops/sec on ta a standard hard rubber
base. After several turns, the two parts of the soil mass
flcw together and join for at least 25 mm. This procedure was
repeated three ta four times per sample ta obtain readings
between 15 and 35 drops. Water content was calculated for
each test as a percent dry weight of sail. Results were
graphed with water content on the y-axis (arithmetic scale)
and number of drops on the x-axis (semi-logarithmic scale).
A bast fit line was then plotted through the points. The
liquid limit is read as t~e water content corresponding ta the
point of intersection of the twenty-five drop ordinate with
the best fit line (Wray, 1986).
The pJastic limit of a soil sample is the water content
at the l imi t between plastic and semi-solid states. The
57

plastic limit is defined as the lowest water content at which
soil can be rolled into threads approximately 3 mm in diameter
without the threads breaking into pieces (Wray, 1986). Three
tests were made per sample and the average was taken.
Knowledge of the size of sail particles forming a certain
soil type, and their relative proportion in the sail mdSS, lS
used to determine how a soil will behave with respect ta shear
strength, settlement, permeability and susceptibility to frost
action and ice segregation processes. Grain size analyses
were undertaken ta assess the importance of soil type and soil
size on the occurrence of active layer slides, retrogressive
thaw slumps and ground ice. Samples were taken from the
headwall and floor of both landforms, for sieve and
hydrometer. Sieve analysis (V.S. numbers 4, 10, JO, 50, 100
and 200) determined the range of particle sizes and their
relative distribution for particles greater than and equal to
the No. 200 sieve. Hydrometer analysis, using a standard ASTM
152 H hydrometer, determined particle size and distribution
of particles which passed through the No. 200 sieve.
Procedures discussed in Lambe (1951) and Wray (1986) were
followed for this study. Results are plotted in the form of
a grain size distribution curve. The analyses of material
properties was undertaken at the Centre for Geotechnical
Studies laboratory, McGill University.
Ice content is an important variable influencing the
behaviour of permafrost sediments upon thawing and are
58

•
expressed as a percentage of the dry weight of soil. It is
obtained by measuring the weight of the frozen sample,
subtracting the weight of the oven dried sample (i.e.,
remaining sediment), and dividing by the weight of the dry
soil. Samples were thawed, filtered and oven dried in the
soils laboratory at the Inuvik ~lsearch Laboratory, Inuvik,
N.W.T.
Ice geochemistry provides an indication of the origin of
water which forms the ground ice. Samples for each of the
massive ground ice types were analysed for major ion
concentrations. Water from ice samples was filtered through
Whatman GF jC paper and stored between 2 - 4 oC. Electrical
conductance and pH measurements were made on a Yellow Springs
model 32 conductance meter and a Fisher Accumet pH model 210
meter. Cations (Ca, K, Na, Mg) were determined using atomic
absorption spectrophotometry, anions (Cl, S04) through ion
chromatography. Geochemical analyses were undertaken at the
Department of Renewable Resources, MacDonald Campus, McGill
University.
3.6 organization of Results
In the investigation of any aspect of the physical
environment there is a distinction between form and process
(Young, 1972). This notion is fundamental to geomorphology,
as is the understanding that "form" refers to the morphology,
or shape and structure, of a portion of the land surface at
59
a given moment in time, and that "process" refers to the
agents active in producing a change in form. Traditionally,
geomorphologists often studied form and process indcpendently.
This segregation is no more apparent than in early slope and
mass wasting studies, in which the focus on form gave risc to
a distinct body of morphometric literature (Crozier, 1973;
StrahIer, 1950), and the study of process concentrdted more
on slope stability analysis and the investigation of slope
failure as a function of material properties (e.g., Carson,
1975). However, the current emphasis on process gcomorphology
has forced researchers to resolve geomorphic problems withln
adynamie framework in which form and process are consldered
together. The remainder of this thesis presents the rcsults
and discussion of a geomorphic Investigation of retrogressive
thaw slumps and active layer slides by first prescnting
characteristics of form and setting (Chapter 4). Since
environmental conditions such as geology, climatc and
vegetation influence form (Young, 1972) then form, SI'll'dl ],Jlo,
is not restricted to the ground surface. Because permafrost
and ground ice are the two most important controls influenclng
thaw slump and active layer slide occurrence, then the next
body of observations is concerned with cryostratlgraphlc
controis and material properties (Chapter 5). In many cases,
process is inferred from a combindtion of morphologie and
materiai property analyses, particularly in the study of rapid
60

forms of mass movement such as slides and slumps, for which
direct process measurements are few. However, in the present
study the predictable nature of, at least, thaw slumps has
allowed for sorne direct observation of process (Chapter 6).
Several conclusion can be drawn from this study, they are the
focus of Chapter 7.
61

Chapter 4
Betting and Morphology
4.1 Introduction
Despite the geornorphic differences between retrogressive
thaw slumps and active
phenomena discussed in
rnorphornetric approach
considerable meri t and
reasons, including:
layer sI ides, or sl ump and sl ide
th~ literature, the traditional
to landforrn analysis retains
is used in this study for several
(1) it provides a basis for the application and assessment
of standard morphometric indices,
(2) it allows for direct comparison of measurements with
other studies using one or the other approach,
(3) it provides the framework for an analysis of form and
process relationships.
In this study, morphologic investigations focus primarily
on the dirnensional characteristics of the landforms and slope
characteristics. Process studies focus on changes in form
over time as weIl as the dynamics of this change. The latter
involves analysis of several parameters (e.g. , air
temperature, moi sture content) that directly influence the
frequency and magnitude of process. Since the landforms and
processes under investigation are thaw-induced or thaw
related, th en the analysis of material characteristics must
focus upon permafrost and ground ice conditions.
62
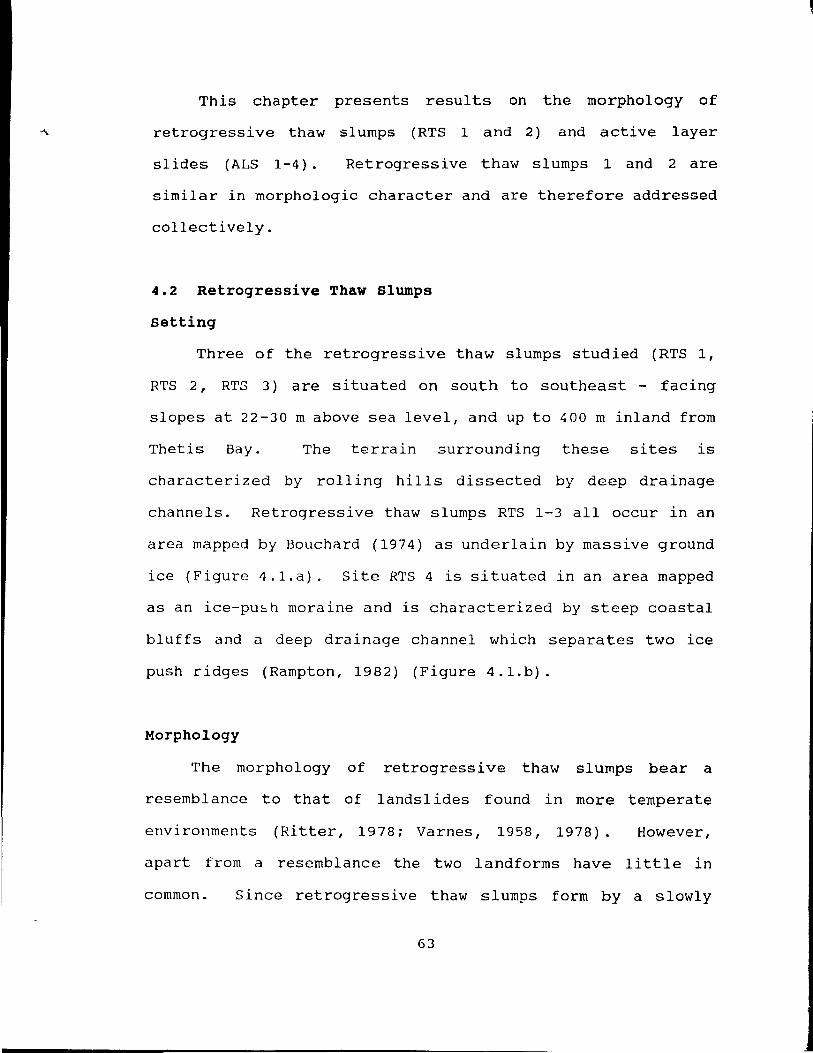
This chapter presents resul ts on the morphology of
retrogressive thaw slumps (RTS 1 and 2) and active layer
slides (ALS 1-4). Retrogressive thaw slumps land 2 are
similar in morphologic character and are therefore addressed
collectively.
4.2 Retrogressive Thaw Blumps
Betting
Three of the retrogressive thaw slumps studied (RTS l,
R'1'S 2, RTS 3) are si tuated on south to southeast - facing
slopes at 22-30 m above sea level, and up to 400 m inland from
Thetis Bay. The terrain surrounding these sites is
characterized by rolling hills dissected by deep drainage
channels. Retroqressive thaw slumps RTS 1-3 aIl occur in an
area mapped by Bouchard (1974) as underlain by massive ground
ice (Figure 4.1.a). site RTS 4 is situated in an area mapped
as an ice-push moraine and is characterized by steep coastal
bluffs and a deep drainage channel which separa tes two ice
push ridges (Rampton, 1982) (Figure 4.1.b).
Morphology
The morphology of retrogressi ve thaw slumps bear a
resemblance to that of landsl ides found in more temperate
environments (Ritter, 1978; Varnes, 1958, 1978). However,
apart from a resemblance the two landforms have little in
common. Since retrogressive thaw slumps form by a slowly
63
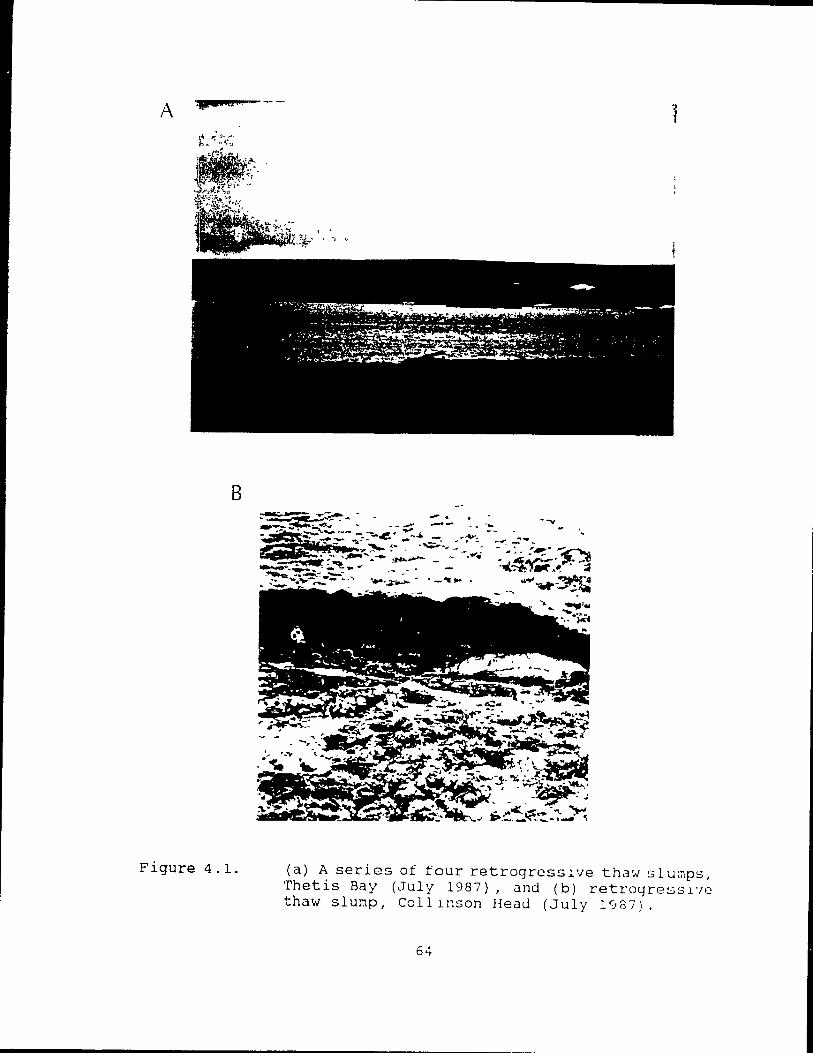
A .. po. a
B
Figure 4.1. (a) Aser ies of four retrogrcss l ve thaw s l u:nps 1
Thetis Bay (cTuly 1987) 1 and (b) retrogressl'/c thaw slump, Colllnson Heaù (July 1987),
64

retreating headwall, they lack many of the structures
indicative of rapid slope failure. For example, the rupture
plane, the rotational failure plane, tension cracks in the
parent slope above the crown and the displaced mass are aIl
absent (Figure 4.2). However, retrogressive thaw slumps can
be divided into three parts (1) the active layer, which is a
component of aIl permafrost areas, (2) a headsGarp consisting
of a thermal erosional belt which retreats retrogressively by
melting of exposed ground ice and ice-rich permafrost, and (3)
the slump floor which consists of residual thaw material and
flow deposlts. The headwall is the most dynamic part of the
retrogressive thaw slump. The processes in thaw slump
development will De discussed in Chapter 6.
Both RTS 1 and RTS 2 display the classic amphitheatre or
bowl shape; however, plan dimensions of other slumps around
Thetis Bay are variable, as are those found along the Yukon
Coastal Plain. For example, coastal erosion at King Point
exposed a body of maSSlve ground ice more than 1.3 km in
lateral extent (Figure 4.3).
Retrogressive thaw slump 1 was the larger of the two
slumps surv~yed in June 1988. It was 194 m long, 67 m wide,
and had a headwall ranging between 5-7 m in height. The total
area covered by RTS 1 was 13,000 m2• RTS 2 measured 83 m in
length, 76 m in width and 5-7 m in height. The total area
covered by this slump w?s 6,300 m2• In 1989, RTS 1 measured
204 m ln length and 70 m in width (14,280 m2), and RTS 2 was
65

-àt
A
B
Undercut org:lnlC m.1l1tle (3Ctl\ e 13yer)
Dtrectlon of 110\\
t-.ludlobes and melted slurry
TranSI erse ereVlee
TIl' R Idl,t!
Bulgc lreVICC
HllJJ()\~
Second ~e,lrp
1 Ie.ld Mall1 \L.Ir!1
krr.ll~lt~
SurLH ~ 01 111(11111('
Sauru!: 1~llter ( Jin.':)
Figure 4.2. Schernatic representations of (a) retrogrcssivc thaw slumps, and (b) landslip (Ritter, 1978).
66

d.'ri ,peJ ,
B
Figure 4.3
,-
Photographs illustrating (a) classic bowl shape of I:TS 1 (July 1987), and (b) the lateral headwall at King Point (July 1987).
67

92 m in length and 86 m in width (7,900 m2). In the vicinity
of RTS 1 and RTS 2 there are several slumps of variable size,
with lengths up to 300 m. Based on 1970 air photos (A21921
102-163) taken at an elevation of 7000 m ASL with a lens of
6", the mean size of 33 slumps on Herschel Island was 10,120
m2
, averaging 110 m X 92 m (Table 4.1). This range in size is
comparable to that for slumps documented by MacKay (1966) in
the Mackenzie Delta and French and Egginton (1973) for Banks
Island. However, a number of the slumps on Herschel Island
exceed the maximum dimensions reported for those areas (200
m X 3 00 m). For example, based on the 1970 air photos, RTS
3 was 245 m long and 230 m wide. Helicopter reconnaissance
along the Yukon coast revealed only one slump with greater
dimensions. At King Point, a retrogressive thaw slump had a
headwall 1. 3 km long and was roughly 60 m deep (Harry l't .JI •
1985; Rampton, 1982) (Figure 4.3.b).
The floor at the base of slump headwalls is
characterized by supersaturated soils and pools of standing
water. The microtopography downslope from the headwaJ l is
very irregular. It contains turf blacks, slumped debris, mud
lobes and runoff channels which frequently form a dendritic
pattern (Figure 4.4).
68

SI U!"1D
1 2 3 4 5 6 7 8 9 10 Il 12 13 14 15 16 17 18 19 20 21 22 23 24 25 26 27 28 29 30 31 32 33
Table 4.1.
l1orphometric l1easurel':lents of Retrogressive Th a", Slumps on Herschel Island, Yukon.
Humber Asnect' Length(m} Width(m} Arpa (m2 }
180 193.75 66.50 12,998 180 82.60 76.0 6,277 170 244.80 231.20 56,597 250 190.40 122.40 23,304 250 95.20 149.60 14,241 250 81. 60 102.00 8,323 260 91.80 68.00 6,242 250 98.60 68.00 6,704 240 71. 40 68.00 4,855 120 84.32 54.40 4,587 350 74.80 54.40 4,069 120 74.80 47.60 3,560 150 149.60 102.00 15,259
0 122.40 68.00 8,323 10 115.60 47.60 5,502
270 69.36 40.80 2,829 280 149.60 108.80 16,276 330 129.20 95.20 12,299 300 136.00 122.40 16,646 325 115.60 183.60 21,224 300 98.60 149.60 14,750 265 224.40 136.00 30,518 270 40.80 54.40 2,219 345 95.20 78.20 7,444
80 95.20 57.12 5,437 35 149.60 88.40 13,224
355 95.20 40.80 3,884 360 68.00 108.80 7,398
10 27.20 95.20 2,594 180 54.40 54.40 2,959 180 61.20 61. 20 3,745
90 108.80 149.60 37,818 90 126.40 94.80 11,982
Morphometric parameters for 33 slumps found on Herschel Island.
69

, ,
A
B
Figure 4.4.
- --1 !
Photographs illustrating characterlstics of slurnp floors: (a) mudlobes near the headscarp, and (b) the dendritic pattern of the lower slurnp flaar.
70

Slope Condi tions
S lope conditions consti tute an important compcnent of
form analysis. Inforn.at.ion on slope form is often treated as
a source of evidence for process and landform evolution. A
series of slope profiles and a large n~mber of slope angles
were obtained for undlsturbed surfaces above and beside the
slumps and for disturbed surfaces within slump bowls (Figure
4 .5) • Slope angles within slump bowls are highly variable.
In the case of RTS l, values range between 0-4 00, wi th an
average of 9') and a standard deviation of 9.3 0• For RTS 2,
values Rre between 0-35", wlth an average of 7° and a standard
deviation of 7.5°. St~epest slopes (up to 40°) are found at
the base of the slumps where a coastal bluff is actively being
eroded by wave action, thermoknrst, thermal erosion, and mass
wasting. The slump headwalls have low to moderate slope
angles, wi th a maximum value recorded of 35°. Lower slope
angles (5-10 0) were recorded for stable sidewalls. The scarp
face at these si tes are concave, except for areas at RTS 2
where there is oversteepening of sidewalls. Slope angles ot
terrain adjacent to slump sites and above the active headwalls
are between 2" and 8", w i th an average of 4 0 and a standard
deviation of 1.30 (Figure 4.6 and Table 4.2).
71

A Slc::e J..nç!e V!l Frequency, UfI:ltacle Sjurnp Fi()Cf::S, T~e:!1 t:: :1, HI y;
>()
~ .30 ;:) -o w e::: IL..
20
IC~ 1 r-h o ,lliil,ljljiiliiililjilliltlii, Illilil!j.l!lil!I!!!!!!!
n=l43
a 5 1 a 15 20 25 ~o .35 4D 45 50 55 $lOPE ANGLE (degrees)
B Siope Angle ~. Frequency for Stable Slope~, TheU~ Bay, H.I. YT.
>()
60~
50
~.30 ;:)
o w e::: IL..
20
la n=67
O~,-'j~j~j~,~i-Tj~j~j~,~j~i ri i~,~i~jrrt~l~l-ririri rl-ri~i~irjririri~iTiTiTiTi~i i
Figure 4.5.
a 5 10 15 20 25 JO .35 40 SlCFE ANGLE (cegree~)
Frequency histograms for (a) disturbed slopes within thaw slump floors, and (b) undisturbcd slopes surrounding thaw slumps.
72
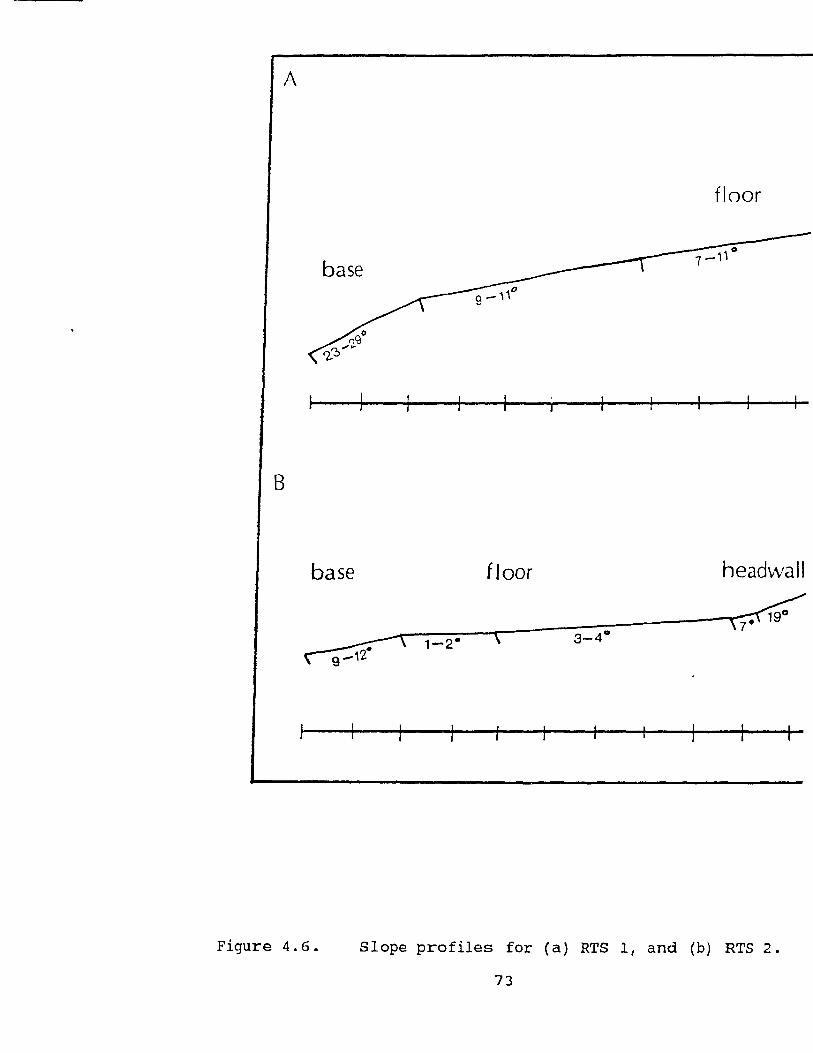
A
floor
base
B
base floor headvvall
~ ~ 1-2- \ 3 4°
Figure 4.6. Slope profiles for (a) RTS 1, and (b) RTS 2.
73

headvvall
flocr
headvvall ]
o 20 40 Distance (m)
1
l (b) RTS 2.

Site Total Number of Min Max Average STO Variance Readings
RTS 1 70 1 40 9.3 9 3 86 RTS 2 49 1 31 6.8 7 5 56.4
ALS 1 66 1 37 10.7 8.6 73.6 ALS 2 52 l 36 7.4 7 1 50.7 ALS 3 33 I 33 11.0 10.0 99.9
*1 17 2 8 3.9 l.3 1.6 *2 20 1 Il 4.8 3 0 9.3
(KI) for stable terrain near RTS l, and (*2) for stable terrain near ALS
Table 4.2. Tabulated results of slope angle measurernents for retrogressive thaw slumps, active layer slides and stable slopes adj acent ta the si tes.
74
..
1.

4.3 Active Layer Slides
setting
The active layer slides examined are situated on a
variety of slopes displaying a range in aspect, slope angles,
material properties and vegetation character istics. Fi vc
slide SCdrs are present at site ALS l and one each ,lt ALS ;:>,
3, and 4.
ALS l is located 1.5 km from retrogressive thaw slumps
RTS 1 and RTS 2, and contains fi~e closely spaced active layer
slide scars. AIl of the slide scars at this site beCJln
between 35-40 m above sea level, approximately 200 m inland,
and are situated on south - facing slcpes. TerraIn conditions
surrounding this si te are characterized by steep, th in l y
vegetated slopes dissected by deep gullies. An interestJng
aspect of these slide scars is their 1nitiation dt
approximately the same elevation.
The sI ide scar at ALS 2 is si tuated on a south to
southeast facing slope directly upslope from a large
alluvial fan and spit that forms Herschel Spit. Terrain in
the vicinity of this site can be described as gently rolling,
although steep coastal bluffs, dissected by deep gullies, are
prevalent towards the east.
The sI ide scar at ALS 3 is si tua ted on a south to
southwest - facing slope, also upslope from the same alluvial
fan as ALS 2. The slide is confined to an area between ridges
and has abrupt, steep sidewalls. The terrain at this site lS
75

1 characteri~ed by steep, poorly vegetated slopes.
The sl ide scar at ALS 4 is located on a south to
southeast facing slope near Collinson Head and is the
1argest of the slides examined. The topography of this area
is gently rolling and we1l - vegetated, with steep coastal
bluffs characterizing most of the shoreline.
Morphology
Active layer slide scars (ALS 1-4) are ribbon-like
features reseillb1ing mudslides found in more temperate
environments, except that they tend to be sha110wer in nature
(Figure 2.8).
The slide scars at ALS 1 measure up to 200 m in length
and 20 m in width, and slide headwalls measure only 70 cm in
depth. Average slide area was 3,240 m2 with a maximum of
4,080 ml. The most extensive slide disrupted a large section
of the hil1side; the displaced mass forming the slide base was
up to 2 m in height and had sI id approxlmate1y 25 lU into
Thetis Bay. The slide floor and lower slide sidewalls are
abrupt and are characterized by slickensl ides. The slide
floors also conta in residual blocks of tundra and material
which had broken away from the headwalls probably sorne time
after the initial failure (Figure 4.7.a).
The slide scar at ALS 2 has a headwall-to-toe length of
177 m, width of 52 m, headwall height of 1 m, and covers an
area of 9,200 m2• The slide f100r at this site contains
76

A
B
Figure 4.7. Photagraphs illustrating microtopogrJphy 0 f (J)
slide floor (July 1988) and (b) the bd se 01-slide (July 1988).
77

numerous residual blocks of tundra. Displaced material that
formed the base of the slope had moved as an intact layer.
At the base of the sl ide tr,e mass took on a r idged or
corrugated 3ppearance. These ridges were up to 1.5 m in
height and had a compressional index of 0.89 (undeformed
lengthjdeformed length) (Figure 4.7.b).
The active layer slide scar at ALS 3 measures 60 m in
length, 12 m in width, and has a headwall height of 1.5 m.
It covers an area of 700 m2• Unlike many of the active layer
slides on Herschel Island, this slide was deeply incised. At
its mid-point it measured 2.5 m in depth. This slide can be
described as a textbook example of a~ active layer slide - it
is wide at its uppermost point of slope detachment, narrow
near its mid-section and widens at its base. The slide floor
is characterized by residual blocks of tundra and the
sidewalls display numerous slickenslides. The base at this
site also has a corrugated appearance with a compressional
index of 0.85.
The large failure at ALS 4 consists of three small slide
scars which coalesce 45-50 m downslope from their point of
initiation. This resulted in the disturbance of an area over
9,860 m2• It appears that the slides must have been initiated
simultaneously, otherwise there would be evidence of
overriding of material. Total slide length is 290 m, with a
width of 34 m at the point where the three small slides
coalesce. The height of the headwall averaged 90 cm. The
78

slide floor is characterized by s1 ickensl ides and numerous
partiall~ to fully-detached biccks of material. The failure
followed the topography of the ro11ing terraIn, taklng on a
"roller coaster" appeardnce.
Slope Conditions
Slope profiles and a large number of slope angles were
obtained both for disturbed surfaces within slidc fleors and
for undisturbed surfaces above and adjacent te nctive layer
slide scars (Figure 4.8 and 4.9). Slope angles of the slide
floor at ALS 1 rantje between 1-37°, average la", and have a
standard deviation of 8.6". At ALS 2 angles within the slide
floor range between 1-36°, average 7°' and have a standard
deviation of 7.1°. Slope angles at ALS 3 range between 1-33°,
average 11°, and have a standard deviation 0 f la'"' (Table 4.2).
Greatest angles (up to 37°) were recorded at the slide
headwall and slide base. These were areas of slide
initiation, gully formation or coastal bluff development.
4.4 Discussion
Although RTS 1 and 2 display the classic amphitheatre or
bowl shape, very large slumps containing a variety of ground
ice types may develop very irregular shapes (Figure 4. la) .
The shape of RTS 3, si tuated between RTS 1 and RTS 2, is
influenced by several large iee wedges exposed in the slump
headwall. In 198B it was observed that iee wedges exposed in
79

A Slc~e Angle vs FrequenC"I, Un!llaole Slide Floors, Thel/s
Bay, HI YT
60
50
,... 40 ..s >u as JO ::> o w Cl:: !..
20
la n= \77
O~~~~~~~~~Tn+n~TMTh~TM~ o 5 la 15 20 25 30 35 ~O 45 50
SLOPE #lGlE (deqrees)
B Siape Angle vs Frequenc:y, AdJocent to ActIve Loyer:! SI/de!!
Figure 4.8.
>u
40
.30
~ 20 :::l o W Cl:: t...
10
n=38
ojO~~5~~1~O~15~~2hOTn2~5~~~~O~J~5~~~~~45. $lOPE ANGLE (degrees)
Frequency histograms for (a) disturbed slopes within active layer slide floors, and (b) undisturbed terrain surrounding active layer slides.
80

A 6-a o
B~
D
Figure 4.9.
up to 15 0
Slope profiles for active layer slides (A-C) and undisturbed terrain surrounding them (0).
81

1
e 1
o 20 40 Distance (m)
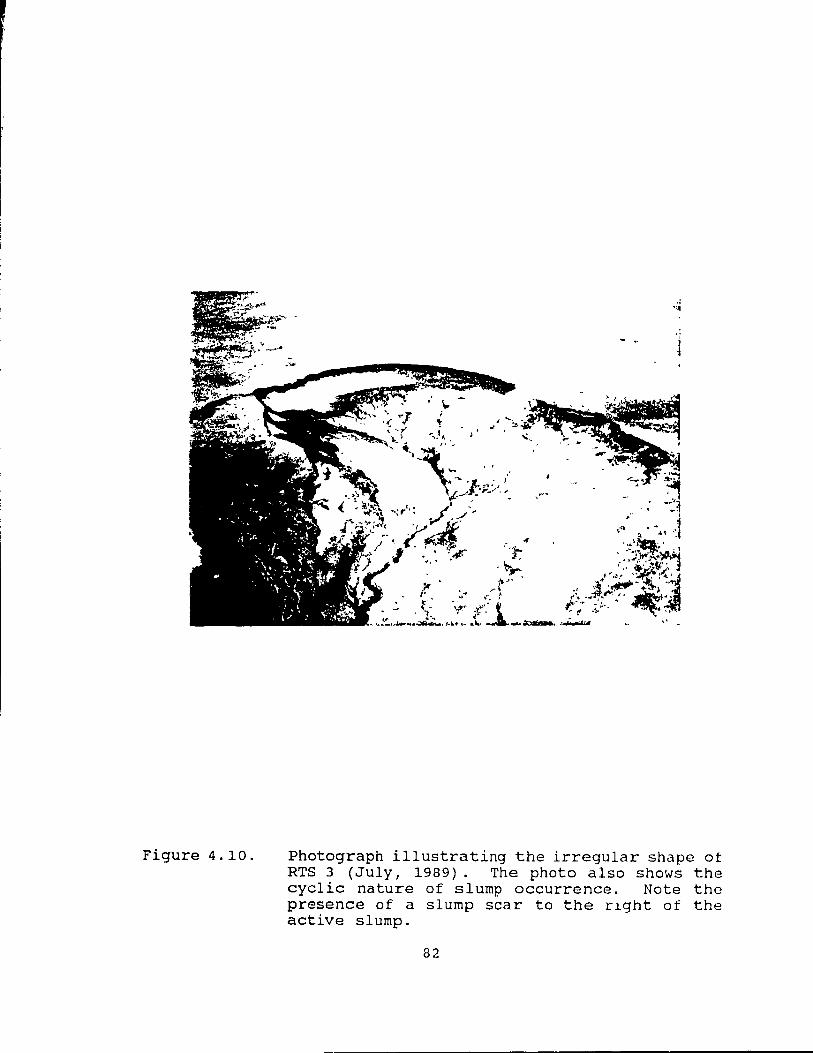
Figure 4.10. Photograph illustrating the irregular shape ot RTS 3 (JuIy, 1989). The photo also shows the cyclic nature of slurnp occurrence. Note the presence of a slump scar ta the rlght of the active slurnp.
82

l
the slump he~dwall tended to melt slower than the enclosed
massi ve ground ice and ice-rich sediment. The irregular
ablation rates across the slump caused a jagged or serrated
appearance. By comparison, RTS 1 and RTS 2 which exhibit a
synunetrical ampl:.i theatre shape contain no ice wedges and two
small weGges, respectively. Thus, morphologie differenceR
between slumps may be the result of subtle differences in
ground ice conditions and character. The shape of RTS 1 and
RTS 2 reflect rclatively homogeneous ground ice conditions.
The aqe of the two slumps is unknown. RTS 1 and 2 are
not visible on air photos from 1951 (A13470 138-140; A14361
90-95), and are thus less than 39 years old. In 1951 the
current locations of RTS 1 and 2 were areas of stable terrain
(Figure 4.11.a). Based on the air photo~ and field work, it
is evident that bath sites had experienced former thermokarst
activity in the form of retrogressive thaw slumps. This is
clearly indicated by the presence of stabilized rtvegetated
slump scars above the active headwall at both sites. The air
photos from 1970 (A21921 135-136) show a headscarp present at
RTS 1 and a small active slump (Figure 4.11.b). In 1970 the
headscarp of RTS 1 was approximately 110-120 m from the coast
and unstable (freshlj disturbed) hummocky terrain occurred
within the slurnp flolJr. In addition, melt-out along ice-wedge
troughs and a srnall thaw lake are evident above the retreating
headwall. In the case of RTS 2, the 1970 air photos show a
polygonal pattern of ice wedges, dS weIl as slumping and bloek
83

A
B
Figure 4.11. Photographs of airphotos of the Thetis Bay shoreline in (a) 1951 (A13470 140) 1 and (b) 1970 (A21921 136). RTS 1 and 2 are nat visible on 1951 photos. Hawever, by 1970 RTS 1 is visible and RTS 2 displays slumping and black failure along the shoreline.
84
J

(
(
failure along the shoreline.
Unlike retrogressive thaw slumps. active layer slides
are not a thermokarst landform, but are the result of unstable
slope conditions. They are usually elongated, shallow, and
variable in size.
Active layer slides are influenced by topography. sites
ALS 1 and 3 are classic textbook examples of slope failure in
permafrost environments; they are wide at the point of
detachrnent, narrow at the midsection and wide at the base.
The morphology (dimensions, in particular) of active layer
slides cease to change to any great extent subsequent to the
sliding event. However, Chapter 6 does describe the
development of a retrogressive thaw slump within the floor of
an active layer slide scar.
85

Chapter 5
cryostratigraphic and Material Controls
5.1 Introduction
since retrogressive thaw slumps are a form of
thermokarst, then their cryostratigraphy, including the type
and volume of ground ice is the dominant variable controlling
slump location and growth. By comparison, since active layer
slides are a thaw-induced mass wasting process, then slope
conditions, material properties, depth of thaw and soil
moisture are the main factors influencing their location,
magnitude and frequency. In both cases, a complexity of other
related factors such as air temperature, radiation, snowrnelt,
runoff , precipitation, a.,d vegetation also determine site
specific processes and morphologic characteristics. This
chapter presents observations and analy.:.es of rheological
properties of materials and ground ice characteristics
associated with retrogressive thaw slumps and active layer
sI ides on Herschel Island.
5.2 cryostratigraphy and Ground Ice
The deforrned fine-grained lacustrine sediments and
glacial sand and silt of Herschel Island are known to conta in
considerable volumes of ground ice (Bouchard, 1974; Mackay,
1959; Pollard, 1989,1990). Many of the primary depositional
sedimentary structures and stratigraphie sequences have been
86
1 J

--------------------------------- ------ _ .. --- --
l deformed and modified by the epigenetic aggradation and, in
sorne cases, melting of ground ice. Figure 5.1 illustrates the
complex nature of ground ice and deformed sediments found on
Hersch81 Island. The reworking of ice-rich sediments by
thermokarst activity has produced a deep thaw unconformity
observed at several locations, and an upper diamicton unit
which mantles much of the landsedpe. This stratigraphie
relationship has also been described for a number of sites
along the Yukon coa3t (Harry et al., 1985; Pollard, 1989;
Pollard and Oallimore, 1988). Ground iee observations were
initially made at ten locations between 1987 and 1989.
However, this thesis will presen~ stratigraphie observations
only from three retrogressive thaw slumps located along Thetis
Bay and in the vieinity of Collinson Head.
Since active layer slides are a thaw-related mass wasting
landform, their occurrence is not dependent upon the melting
of exposed massive ground ice or ice-rich sediments.
Therefore, unlike thaw sl~mps, whieh are often eharacterized
by headwalls more than 10 rnetres in height, active layer slide
headwalla reach a maximum height of only 1.0-1.5 m. Thus,
detailed stratigraphie analyses for comparison with
retrogressive thaw slumps could not be undertaken, and
consequently, field and laboratory analyses of active layer
slides focused upon rnaterial properties.
87
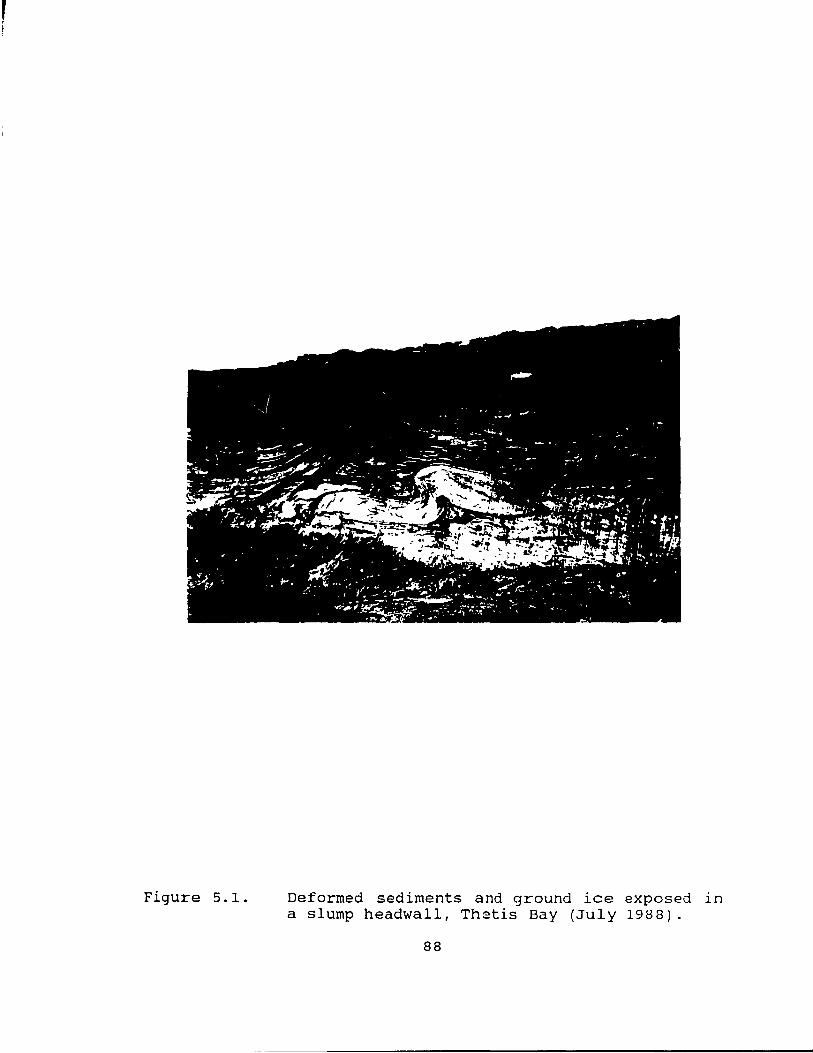
r ,
Figure 5.1. Deformed sediments and ground ice exposed in a slump headwall, Thatis Bay (July 1988) .
88

5.2.1 Retrogressive Thaw Slumps
stratiqraphy
The headwall of RTS l ranged between 5 and 7 m in height
and contained 3 distinct stratigraphic units (Figure 5.2.a).
The lowest unit (Uni~ lA) was a 2.5 m to 3.0 m thick massive
ice body. It consisted of dirty ice interbedded wi th numerous
layers (20-30 cm thick) of pure ice which contained thin (2-
5 cm) discontinuous sil ty clay bands. The latter were
inclined 15-20° towards the northeast. The foliated
appearance of the ice was enhanced by high concentrations of
gas inclusions assoclated with sediment bands. Unit lA was
unconformably overlain by an ice-rich, dark brown to grey
brown, silty clay layer (Unit lB). This unit contained clear
ice veins and lenses 2-3 cm thick which, in places, formed a
reticulated cryotexture. Isolated horizontal ice layers and
lenses 5-10 cm thick occurred randomly thrcughout this unit.
Where the headwall lay beneath a former thaw slump scar a thin
diamicton unit (Unit le) unconformably overlay unit lB. This
unlt consisted of an icy brown clay which graded upwards into
10-40 cm of organic silt and surface root mat. The base of
Unit lC, interpreted as a thaw unconformity, was marked by a
dark organic-rich Glay layer and a distinct change in ice lens
pattern. A steeply dipping band of pale brown ice 20-30 cm
wide cut discordantly across the entire face, terminating at
the thaw unconformity (Figure 5.2 .b). This structure is
interpreted as an ice dyke, which has recently been described
89

A
B
Figure 5.2. (a) Exposed headwall of RTS l (July 1987), ~nd (b) ice dyke exposed in the headwall of RTS l (July 1987). Unit lA, the lower unit, ~as a 2.5-3.0 m thick mass~ve ice body WhlCh over lay unit lB, an ice-rich, dark brown ta grcy brown sil ty-clay layer. Uni t le, the upper unl t, consisted of an icy brown clay wh~ch gradcd upwards into 10-40 cm of organic, S 11 t and root mat.
90

.~
in detail by Mackay (1989). Ice dykes consist of intrusive
ice injected from depth into overlying frozen sediment, and
occur primarily along fractures and faults. Since this ice
~llts across existing structures it must be younger than other
ice bodies in the sequence.
Ground ice contents for RTS 1 ~anged between 150% in the
thawed organics which make-up the active layer, and 4500% for
massive ice bodIes. Moisture contents within the slump flocr
ranged between 10-30%. Ground ice types observed at this site
are segregated ice, intrus ive ice (ice dyke) and pore ice.
The headwal1 of RTS 2 ranged between 5 to 7 m in height
and contained two strati~raphic units (Figure 5.3). unit 2A,
exposed at the base of the section, was a fOliated, massive
ice layer greater than 3 m in thickness. This unit contained
Iayers of dirty ice, interbedded wi th layers of grey-brown
sil ty clay and pure segregated ice. Cobbles 5-10 cm in
diameter and fine sand aiso occurred as sediment bands. Gas
inclusions and thin discontinuous bands of sediment occurred
within dirty ice and pure ice layers. The unit had a foliated
appearance which resulted from the discontinuous horizontal
sediment layers. These were gently inclined at 10-12° towards
the north-northeast. The] ower contact of this unit was below
the level of the slump floor. A dark brown silty clay 1.5-
2.5 m thick unconformably overlay Unit 2A. Unit 2B had a
blocky cryotextnre and contained lenses and layers of clear
and sediment - rich ice. A reticulated pattern of thin ice
91

, i t l',
Figure 5.3. Exposed headwall at RTS 2 (July, 1987). Unit 2A, the lower unit, was a foliated, massive ice layer greater than 3 m in thickness, and was overlain by Unit B, a dark brown s~l ty clay layer 1.5-2.5 ID thick. unit B was overlain by 45 cm of thawed organics.
92

l veins occurred imm~diately above the contact bet~een units 2A
and 2B. The top of Unit 2B graded into a 45 cm layer of
thawed organic si l t which contained pods of peat and root
fibres (acLive layer). Two small ice wedges 30 cm wide and
1.0-1.5 m deep are exposed at the base of the acci ve layer and
penetrated the upper part of unit 2B.
Ground ice contents at RTS 2 varied trom 35%, for
partially dessicated clays and organics, to greater than 4500%
for massive ice. Moisture contents of thawed material within
the slump floor were between 10-30%. The dominant ground ice
types observed in the slump headwall include segr0gated ice,
ice-wedge ice and pore ice. Sediments and stratigraphic
characteristics described for RTS 1 and 2 are consistent with
the "mixed
According
sediment" unit described
to Bouchard, this unit
by Bouchard (1974).
represents preglacial
deposition in a nearshore marine and shoreline environment.
The occurrence of both shell fragments and detrital organics
in these sediments is also consistent with Bouchard's
description.
A small retrogressive thaw slump occurred at Collinson
Head (RTS 4) in 1987-1988. RTS 4 was ~ituated at the head of
a deep gully between ice-push ridges, and contained roughly
3.0-3.5 m of massive ice and ice-rich diamicton (Figure 5.4).
The massive ice and ice-rich sediments were divided into three
units. The lowest unit (Unit 4A) consisted of a 2.0-2.5 m
arched body of layered "whitish" ice that pinched out at both
93

Figure 5.4. Exposed headwall of RTS 4 (July, 1987). Unit 4A, the lower unit, is a body of "whi tish ice" which overlay unit 4B, which conslsted of an irregular, ice-!'ich, grey-brown clay diamicton. Unit 4C, the upper unit, consists of horizontal ice layers and lenses.
94

1 ends of the exposure. This ice contained oval to elongated
bubbles and fine suspended sediment which formed distinct
horizontal bands. The massive ice of unit 4A was composed of
two different ice types - a lower body of white layered ice
was oV9rlain by a massive body of brown colored ice. These
iee bodies, particularly the lower, more extensive arched iee,
are very different from any other type of ice documented for
Herschel Island. Stratigraphie studies and the detailed
analyses of ice crystallography and analyses of ice chemistry
lead to the speculation that this ice unit was buried glacier
iee and segregated ice preferrentially incorporated during
the iee-thrusting process that formed the nearby ridges
(Pollard, 1990). unit 4B eonsisted of 1.0-1.5 m of irregular
and undulating ice-rich, grey-brown clay diamieton. The
contact between units 4A and 4B was abrupt and unconformable,
representing a thaw unconformity produ::ed during either a
previous thermal disturbance or during syngenetic ice
formation which is consistent with a buried glac~er origin.
'l'he upper unit (Unit 4C) contained thick horizontal ice lenses
and layers and irregular bodies of massive pale brown ice -
possibly a buried snowbank. Reticulated ice veins occurred
throughout the diamicton. 'rhe active layer, 40-50 cm in
thickness, contained a thawed portion of the diamicton, as
weIl as organies and other detrital materials.
Ground ice contents at RTS 4 varied from 35% in surface
organics to a maximum of 8000% in massive ice layers. Ground
95

ice types observed at RTS 4 include segregated ice, pore ice
and possibly buried glacier and snowbank ice.
By 1989, the Collinson Head site no longer displayed the
clear massive ice or ice-rich permafrost that it had in 1987-
1988. The slump had stabilized, although the area as a whole
is experiencing rapid fluvial erosion and gully formation.
These processes are perpetuated by the melting of snow and
exposed ground ice.
Sediments and stratigraphic characteristics at RTS 4 are
typical of the "marine" and "mixed" sediments described by
Bouchard (1974). These sediments are the result of deposition
in a nearshore marine environment which were subsequently
repositioned by glacial processes.
Material properties
Grain size characteristics, moisture contents and
Atterberg Limits were analysed to assess the role of material
properties on ground ice occurrence and to evaluate the
relaLlonship between ice content and material behaviour upon
thawing.
silt and clay sized sediments are the dominant particle
sizes in materials where thaw slumps and massive segregated
ground ice bodies occur; however, sand and gravel si zed
(cobbles 5-10 cm diameter) materials occurred as bands within
massive ice and formed a residue on the slump floor. These
observations are comparable wi th data from the Mackenz ie Del ta
96
,
J

l where fine r.mterials, such as sil t and clay, are associated
with massive segregated ice (Mackay, 1966) and with Bouchard
(1974) for Berschel Island. Sand sized sediments are found
as layers within and beneath sorne of the massive ground ice
bodie~ at Thetis Bay (Figure 5.5). This association supports
the segregated ice interpretation for massive ground ice at
sites RTS 1 and 2.
The liquid limits for sediments taken from retrogressive
thaw slump headwalls range between 30-40% (Figure 5.6), whi1e
plastic 1imits were between 15 and 25%. The ice content of
material in the slump headwall normally exceeds the liquid
limit of the sediment. As a result, thawing produces a slurry
of supersaturated sediment that initially pools near the base
of the headwall and eventually flows onto the slump floor.
Sediment samples taken from distances up to 10 m from the
headwall had the highest moisture content. This is believed
to be the result of graduaI settling of the coarser sediment
fraction. Fresh material at the base of the headwall often
disp1ayed much lower molsture content because ic frequently
consists of blocks of drier sediment from the active layer;
it eventudlly, however, becomes part of the mud slurry. At
a distance of 15 m from the hea~~all, moisture contents of
sediments drop below their plastic limit (Figure 5.7).
97

100
90
BO
70
60
t!l Z H 50 Ul Ul < a.
~ 40
30
20
10
0 0 0 ....
Figure 5.5.
GRAVEL SILT -[- CLAY
.LIli 1
0 ~ .... .... .... .... 0 0 a
PARTICLE SIZE (mm)
Representative grain size distribution curJes for retrogressive thaw slump sediments.
98
___ J
1----1 ..... a a a
if

:.. A
"'"' .!,
ê: CI>
ê: 0
u ... '" ~
B
,.... .!, -c:
ID
ê: 0 ()
... ID (; 3:
Figure 5.6.
Flow Curve
50
45
40
35
30
25
20 z J 4
10 /IIumber of 8lows
Flow Curve
50
45
40
,55
30
25
20 z J 4
10 Number of Blows
Representative flow curves (liquid limits), for sediment samples from retrogressive thaw slumps (a) RTS 1 and (b) RTS 2.
99

1
".-....
~ '-' ..... c (1.) ..... c a (.)
(1.) ;..... ::: ..... CJJ o-C
~
35~--------------------------------~
30
25
20
15
RTS 2 10
RTS 1 5
o--~--~------~--~--~--~--~--~~
o 5 10 15 20 25 30 35 40 45
Distnnce from the he3dwall (m)
Figure 5.7. Graph of moisture content vs. distance from the headwall at RTS 1 and RTS 2. There is d
rise in moisture content associated with pooling of water near the base of the headwall, and a gradual decrease at distances greater than 10 ID, a resul t of dewatering of sedlments.
100

--------"--------- _._-_ .. -------
5.2.2 Active Layer Slides
Observatio~s from four sites (ALS 1-4) eontaining one or
more active layer slide scars are described. In this part of
Herschel Island, the majority of sI ides occur on steep slopes
forming the Thetis Bay shorelinei the most extensive slide
occurred in the vicinity of Collinson Head where relief is the
greatest. The following summarizes material properties of
sediment from four slides and shallow stratigraphie
observations documented during headwall excavation of ALS 2.
These sites are aIl located in Bouchard's (1974) pre
glacial deposits. According to Mackay (1959), emplacement of
these sediments is related to glacier ice-thrusting.
Bouehard's map (1974) designates the area around ALS 1 as non
differentiated pre-glacial materials, and the area where ALS
2, 3 and 4 occur as marine sediments. Marine sediments are
the most abundant of the preglacial deposits, and consist
primarily of clays and clayey silts or elayey silts with sand
laminae.
Due to their shallow nature, slide headwall exposures aIl
contain two stratigraphie units consisting of (1) an overlying
vegetation and root mat corresponding to the Ahy cryosol
horizon of Smith et al (1990), and (2) a marine clayey silt
and clay unit. The latter contains scattered marine shells,
shell fragments and sand laminae. Since these materials forro
part of the modern active layer, the absence of massive iee
101

was expected: however, discontinuous horizontally layered ice
lenses up to 2 cm thick and thin continuous ice layers less
than 0.3 cm are common in frozen exposures.
The massive sediments contain 10% sand, 60% silt and 30%
clay (Figure 5.8). This unit ranged from massive silt and
clay to faintly bedded silt and clay with sand laminae.
Occasional gravel or cobble sized part1cles also occur, but
are most noticeable as 1ag deposits with sand on the slide
floors. The liquid limits of these materials vary between 25-
30% (Figure 5.9), with corresponding plastic limits of 10% or
]ess.
Moisture contents of soils having small ice lenses from
the slide headwall range from 15-35%. 8y mid-August an active
layer thickness of up to 70 cm is not unusual. Around the
same time, soil moisture content at the ba~e of the active
layer frequently is near saturation (30-40%). This is
particularly the case near seepage lines. Excavation of a
slide headwall revealed a relatively continuous and uniform
zone containing ice lenses from 2-5 cm thick at a depth of 70-
80 cm. This ice-rich zor.e is common and is generally
interpreted as aggradational ice. ~ce contents of this ice
rich zone ranged between 1CO-250%.
5.3 Ground Ice Geochemistry
The chemlcal regime of ground ice is a potential tool for
elucidatin~ the genesis of water for ground ice formation and
102

Figure 5.8. Representative grain size distribution curves for sediments from active layer slides.
103

,
A
,-,.
~
C ID
ë 0 u "-ai
i5 ~
B
,.... ~
C .! c 0
U
"-.! ~
Figure 5.9.
Flow Curve
40
35
:SO
25
20+-------------~------.-----.---~ z
10 Number of 810ws
Flow Curve
40
.35
.30
25
,o+-------------r-----~~--~--~ 3 2
10 Number <:-f Slows
Representative flow curves (liquid limits) for sediment samples from active layer slides (a) ALS 1 and (b) ALS 2.
104
-

the cornplex rnechanisms involved. For exarnple, if massive ice
is the product of ice segregation then one would expect it to
display chemical characteristics consistent with those of soil
and groundwater from its point of origine By comparison,
ground ice formed from recent atmospheric water (ice wedges,
buried snowbank ice, ice lenses and pore ice in the active
layer) will reflect the chemical characteristics of recent
precipitation and generally have low total dissol,·ed solids
(TDS) . In theory, buried glacIer ice rnay show distinctly
different chemical characteristics from ice in enclosing
sediment or other massive ice types.
Samples were collected in polyethylene containers, thawed
and the supernatant waters were analysed. Due to limitations
arising from co st and time, only selected sarnples were
analysp.d (Table 5.1). The following will discuss the nature
and significance of ground ice hydrochernical characteristics
and thus the influence of ice type on slurnp development. Ice
types have been categorized into two broad types: Type A,
forrr,nd from rneteoric water frozen in s~tu, and Type B, ground
ice formed from ground and soil water by segregation and/or
injection processes.
5.3.1 Type A Ground Ice
According to Mackay's (1972b) classification, a variety
of ground ice types rnay have rneteoric water as their immediate
105

No.
1
site l 2 3
4 5 6 7
site 8 2 9
10 Il 12
13 14 15
site 3 16 17 18
19 site 4 20
21 others 22
23
'rable 5.1.
Ph Ec Cl S04 F 11.1 K Cd :1'1 (mS/cm) --------- units tl rc in ( mIt) --- ---- ----
6.88 .11 10.14 9.60 .09 5. ·17 1 . ~ li U • 1 () 7.83 .38 11. 06 51. 74 .19 25. ·15 7.62 ~B. BI) 8.10 2.01 60.20 917.66 .20 173. 3·1 26.59 1(,3.91
7.58 .21 3.94 31.87 .26 9.·10 3. 'll 21.BO 7.37 .12 6.70 .77 .ll 3.91 • f3 fi 13. J()
7.48 .75 132.60 66.8Ï' .45 11-1.58 '1.fl2 l'J.HO
8.15 2.49 572.60 174.53 .46 386.11 2.39 10.'J{) 7.18 .93 170.25 115.01 .36 134.15 8. ·11 21.6() 7.73 3.23 761.93 347.52 .38 513.82 23.46 27.30 7.96 1. 60 342.74 74.69 .35 235.81 12.70 ?2.<J() 7.22 3.76 834.26 501.12 .28 606.93 26.39 33.90 8.10 .32 33.15 34.56 .13 33.38 4.50 18.00
6.21 .01 .80 .29 .00 10.67 .66 1.50 7.91 .35 33.50 45.12 .12 18.97 3.01 1~.n()
7.55 .23 14.64 7.87 .09 8.30 2.62 ?B.;:>()
7.64 .76 24.46 2U5.92 .13 25.70 4.69 /16.~()
8.15 2.27 169.58 859.20 .14 145.16 Il. 18 190.00 8.44 4.12 936.01 453.12 .42 671.30 28.15 7 (J • () ()
7.53 .09 12.66 .77 .02 8.51 .08 6.20 7.46 .05 4.89 2.02 .01 7.77 1. 76 4. 11
7.55 .89 74.53 215.04 .08 74.85 .39 91 . (JO
7.75 .16 15.60 14.69 .09 12.67 .39 11.50 7.84 .31 82.15 20.35 .07 68.74 5.08 13.50
Ground ice chemistry of various ice types from Herschel Island.
106
,'. Bd
'J. 'Il
'1,. III
1 . 1 (J
;'. 11)
'1 • li}
·ll}.I}I]
Il.O{) (,j.{)O
1 1 . l Il Il') (J()
6.hO
• 1 (J
<) • f.r]
1 • f.r) ;'.'. li]
1 .' '1 • f)(}
1 l • 1) 1)
1 . lH • '1 (,
Il. (,1)
1 • ;:> Il ·1 . J·1
1
J

source (e.g., pore ice, ice-wedge ice, sorne forms of
aggradational ice, and shallow segregation ice). Ground ice
fed by atmospheric moisture and surface water should have low
TDS values (Brown, 1963c; Hallet, 1978; Levinson, 1974).
Ice chemistry analyses (Table 5. 1) indicates that samples
13, 14, 15, 16 and 20 formed by meteoric water have low
concentrations of TDS. Samples 13 and 14 (snow), form an
ideal standard because recent snow is known to have low TDS
(Levinson, 1974). Although ice types fed by meteoric water
have low concentrations of TDS, anomalies may resul t from
freezejthaw activity, fractionation and residue inclusion
(Brown, 1963c; O'SullivRn, 1963). Freezing not only reduces
the diluting effect of recharge by precipitation, but also
increases the concentration of the dissolved mineraI content
at the freezing front. This includes ice formed near the base
of the active layer or at the contact of two stratigraphie
units (Levinson, 1974).
Significant differences in ice chemistry occur between
relict ice-wedge ice (16), which has a high sediment ir.clusion
content, and modern ice-wedge ice (15, 20) which have low
sediment ~nclusion content. Brown (1963c) has explained
differences in chemical composition of ice-wedges as a
function of water supply (meteoric) and residue inclusion.
Mineral and organic materials either drop into thermal
contraction cracks, or are washed in during spring mel t.
Anothp.r possible explanation for higher TDS of ice wedges
107

(e. g., sample 9) is that sediments and sorne ions may be
incorporated from the sides of the wedge, especially at depth
(Brown, J963c. Sample 9 (modern ice-wedge ice) taken from a
depth of 1.0-1.5 m has a high sediment inclusion content which
may possibly explain the increase in TDS compared to that of
sample 20, which was taken from the surface of the ice wedge
and had no visible sediment inclusion. It is suggested tnat
differences in chemistry of ice-wedge ice (formed by meteoric
water) at Herschel Island are possibly the resul t of the
incorporation of mineraIs and organics during ice wedge
formation.
5.3.2 Type B Ground Ice
The sec~nd ice type, massive segregated ice, is believed
to have a ground or soil water origine Massive segregated ice
samples 3, 7, 8, 10, Il, 17, 18 have higher levels of TDS
compared to that of ice Type A. This may be a function of (1)
the inclusion of mineraIs and organics, and/or (2) solute
rejection (fractionation) during the freezing process. Ice
samples 6, 8, 17, and 18 have a high mineraI and organic
content and a corresponding higher concentrations of TDS.
Massive ground ice with low TDS incJude samples l, 2, 4, 5,
12, 19, 22, and 23. These low concentrat ions are best
explained as a combined result of low inclusion content of
mineraIs and organics and fractionation, a process of solute
rejection as water changes to ice. Fractionation may cause
108

surrounding materials to have high TDS. Similarly,
fractionation may occur during the formation of segregated ice
layers and lenses, resul ting in an enrichment of pore water
in the surrounding sediment. This may be the case for sample
8, which has a low TDS, and the enclosing ice-rich material
sample 11 which has higher concentrations.
The resul ts of ice chemistry analysls for samples from
Herschel Island are supported by findings presented in the
permafrost literature. Hallet (1978) documented solute
rejection from soil water as soil freezes from the surface
down. Solutes tend to accumulate at the freezing front, but
may also diffuse downwards (samples 10, 9, 11 fJ!OW increasing
TDS with increasing depth). with continued preferential
rejection of solutes by the growing ice lens or layer through
moisture migration (samples 1, 2, 4, 5 and 12), the solute
concentration in the unfrozen soil progressively increases.
The end result is a zone of high concentration of TDS at the
permafrost table (samples 3 and 10). High TDS may also be
influenced by the residence t.ime and the migration route of
water during the ice segregation process (Brown, 1963c). In
both cases, there is likely to be a greater incorporation of
unfrozen dissolved minerals and leached organics. There may
well be buried glacier ice on Herschel Island particularly
along the north side of the island. However, stratigraphie
analyses, ice petrofabrics documented by Pol lard (1989, 1990)
and ice chemistry (samples 22 and 23) do not conclusively
109

1 support a glacial origin. Overall, most massive ice bodies
sampled have low TDS; the incorporation of organics and
mineraIs may be held re~;ponsible for higher TDS in samples
described as dirty massive ice.
An interesting compQnent of massive ice samples 7, 9, Il
and 18 is the higher level of sodium and chloride ions
compared to other massive ice samples. Sodium and chloride
ions generally occur to a limited extent under normal
conditions, but these samples contain at least 2-3 times that
of other segregated ice samples, and several hundreJ times
that of ice-wedge ice and snowbank ice. Higher levels of
these ions woulr:l predominate in a marine env ironment 1 and
particularly in ground ice formed within sediments deposited
in either marine or coastal marine conditions. These ice
samples come from an area within Bouch;- rd' s "mixed sediments"
classification. According to Bouchard (1974) this unit
represents preglacial deposi tion in nearshore marine and
shoreline environments. Thus the presence of higher
concentrations of these salts provide strong support for the
interpretation of these ice bodies as segregated ice.
However, the higher concentrations leave a number of
unanswered questions concerning the permafrost history of
Herschel Island. Since bath sodium and chloride ions are
highly mobile they would be readily removed by groundwater
movement and surface water infiltration. Assuming an
abunt~ance of freshwater following deglaciation sodium and
110
J
chloride ions would have readily been removed during the early
- mid Wisconsin. The presence of sodium and chloride ions
suggests that permafrost developed shortly after emergence and
possibly even before being glacially deformed during the
Buckland Glaciation.
5.4 Summary
The nature and distribution of ground ice is the
important factor influencing retrogressive thaw slump
development. This is not strictly the case for active layer
slides, however, the marine silty clays which occur in the
Thetis Bay and Collinson Head areas may have a low yield
strength and a decrease in cohesion upon saturation.
Several types of ground ice were documented, the most
abundant of which include various forms of segregated ice,
ice-wedge ice, snowbank ice and pore ice. The origin of ice-
wedge jce, ice layers and lenses, pore ice and, more recently,
snowbank ice are weIl understood. However, uncertainty still
rernains concerning the origin of massive tabular ice bodies
which ~ie fr8~uently several metres in thickness. Thus more
studies concer11ing ground ice are needed in order that
permafrost e':olution for Herschel Island and the Yukon Coastal
Plain may be better understood.
111

6.1 I~troducti~n
Chapter 6
Landform Process
There are few process studies based upon the measurement
or direct observation of rapid forros of mass movement.
Furthermore, there are no documented cases of rapid mass
movements in are as underlain by permafrost. This is mainly
due to the difficulty in predicting the occurrence of slumps
and slides as well as instrumenting their location. The lack
of documented cases also reflects the complex nature of
factors influencing slope instability at any given time.
Geotechnical analysis can provide an indication of which
slopes have high failure potential (low safety factor), and
possibly even the type of process or event that may occur,
but there is no way of knowing, ipso facto, when they will
occur. As a result, the majority of studies have been
concerned with morphometric and/or material characteristics
of failed slopes in areas underlain by permafrost (AIgus,
1986; Mackay, 1966; McRoberts and Morgenstern, 1974a, 1974b).
The latter applies specifically to active layer slide process
studies. In the case of retrogressive thaw slumps, their slow
rate of growth (relative to true slumps) and their growth by
therrnokarst and thermal erosion lend this process to more
detailed direct observations. The following is a suwmary of
112

process investigations for three retrogressive thaw slump
sites and four active layer slide sites on Herschel Island.
6.2 Retrogressive Thaw Slumps
6.2.1 Process Terminology
Retrogressi ve thaw slumps are a ferm of backwearing
thermokarst, of which the dominant genetic processes are thaw
subsidence and headwall retreat generated by the me~ting of
massive ground ice and ice-rich permafrost. Secondary
processes are block failure and flow of supersaturated
sediment on the slump floor. In this context, the use of the
term "slump" to define these features, although prefixed by
the descriptive and genetic modifiers " r etrogressive thaw" is
geomorphically incorrect. Thermokarst is not recognized as
a mass wasting process, even though it involves a downward
movement of material under the influence of gravi ty. The role
of runoff produced by melting ground ice as a transporting
medium is generally believed to be significant enough to
categorize thermokarst and mass wasting as entirely different
geomorphic processes. However, as the following summary will
show, this distinction is not clear when standing within an
active retrogressive thaw slump. The accuracy of the term
"slump" is discussed later in this chapter.
The retrogressive thaw slumps RTS 1 and RTS 2, as weIl
as a nurnber of other slumps observed on Herschel Island and
along the Yukon coast, are polycyclic in nature. This simply
113

, r
means that the current slump is growing wi thin a former 1
stabilized slump. In sorne cases, evidence of more than one
previous episode of slump activity exists.
6.2.2 Slump Initiation
It is generally accepted that retrogressive thaw slumps
are initiated by the erosion and mass wasting of ice-rich
sediment, although there are no references to support this.
On Herschel Island, coastal retreat, thermal and mechanical
erosion of ice wedges, and fluvial erosion frequently produce
ice-rich permafrost exposures up to 15 m high. Based on
topographie position, ground ice characteristics and
information obtained from 1951 and 1970 air photos (A 13470
and A21921, respectively), it is believed that RTS 1 was
initiated by a cornbination of coastal retreat and thermal
erosion of ice wedges. The 1970 air photos clearly show the
polygonal pattern of ice wedges in the vicinity of RTS 1, as
weIl as the presence of a thaw pond above the active headwall.
Thaw pond occurrence may be the result of melt-out along ice-
wedge troughs. In 1988, the pond was no longer present. In
the case of RTS 2, initiation is believed to have been a
resul t of coastal retreat. This is based upon ground ice
c~aracteristics (lack of ice-wedge ice) , and the close
proxirnity of the RTS 2 headwall to the coast in 1987 (Figure
4.11) • The presence of fresh water shells (NaylCJr ct c'11.,
114

1972) and detrital wood in thick peat deposits exposed in the
walls of RTS 3, as weIl as a deep thaw unconformity that
mirrors a surface depression, suggests that this site is a
former thaw pond. The air-photos from 1970 reveal no surface
expression of ice wedges surrounding the site, nor evidence
of their disruption, as is the case at RTS 1. Hence, RTS 3,
which is the Iargest slump in the Thetis Bay area, was likely
triggered by coastal erosion of ice-rich sub-Iake sediment.
During this study it became apparent that several other
factors could contribute to the initiation of thaw slumps.
For example, during 1988-1989, a small retrogressive thaw
slump developed within the floor of an active layer slide (ALS
1). The thaw slump was bowl-shaped and roughly 9.8 m long,
7.5 m wide and 2.5 m high (Figure 6.1). Within the headwall,
a 2-5 cm ice lens was found at a depth of 1.2 m. On another
occasion, it was observed that human activity could also
induce thermokarst, and in particular, reactivate thaw slump
activity. In this case, regular use of a foot path to access
the RTS 2 sI ump floor caused a stable headwall to become
active. Subsidence cracks initially developed perpendicular
to the headwall; they widened and gradually exposed massive
segregated ground ice which began melting, eventually causing
block failure and thermal erosion of exposed ground ice.
115
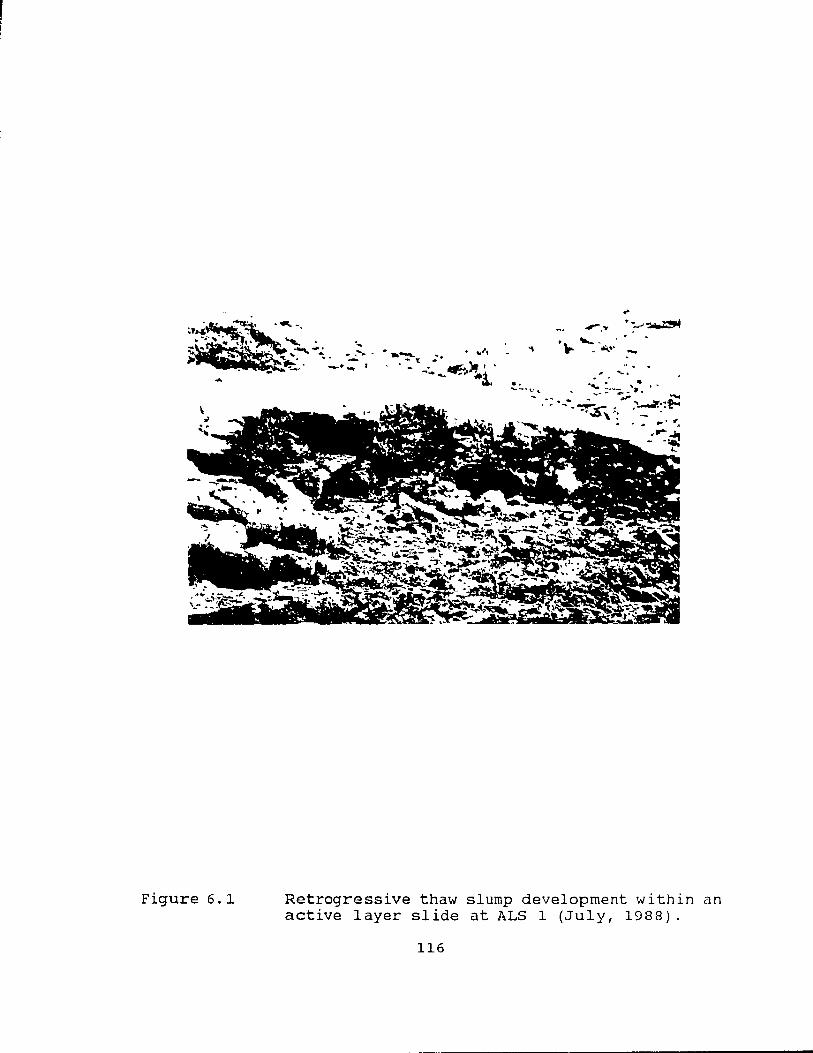
Figure 6.1
.. -..... ~-;.....-~
-- - ...... , - t: ... . .-:..:.. ' . - -:. .... ""'::;-.... 1
°L ~ - .' . r - ..... _
Retrogressive thaw slump development within an active layer slide at ALS 1 (July, 1988).
116

",
6.2.3 Headwall Retreat
Introduction
The bowl or amphitheatre shape that typifies
retrogressi ve thaw slumps expands primarily by headwall
retreat. The headwall of RTS 3 has relatively straight and
long segments (Figure 4.10), but the semicircular headwalls
of RTS 1 and 2 are more eommon. The headwalls of RTS land
2 tend to increase in height from the ends of the semieircle
towards the middle, and the most rapid retreat oceurs at that
portion of the slump with the highest headwall.
Survey Technique and Timing
The investigation of thaw slump processes and, in
particular, headwall retreat involved installation of a grid
of survey markers around the slump headwall and on the slump
floor. The weekly measurement of the position of the headwall
relative ta survey markers provided the basis for headwall
retreat rates and retreat direction. Survey markers were
installed in June 1988, at RTS 1--3, as weIl as at two coastal
bluff locations for comparison with the retrogressive thaw
slumps sites. RTS 3 was mcmitored ta test the hypothesis that
larger slumps experience higher rates of headwaii retreat.
Retreat
Headwall retreat at RTS 1 for a six week period in the
summer of 1988 (June-August), averaged 2.3 m with a maximum
117

of 7.8 m. Retreat for the same period at RTS 2 averaged 3.5
m, with a maximum of 12.2 m, and at RTS 3 retreat averaged 3.4
m with a maximum value of 4.0 m. Detailed surveys in April
1989 allowed computation of an annual retreat rate for 1988.
Annual retreat for the three sites averaged 6.5 m. At RTS 1
annual retreat ranged between 0 to 10.7 m, with an average of
5.8 m. Up to 19.5 m of retreat occurred for a 12-15 m long
segment of the headwall at RTS 2, and averaged ~O rn for the
site. Figure 6.2 presents plotted survey data for RTS 1 and
2 and shows how differential retreat can modify slurnp shape.
It was anticipated that RTS 3, which is the largest of the
thaw slurnps, would experience the highest annual headwall
retreat rates; however, this was not found to be the case.
Annual retreat rates at RTS 3 were up to 10.7 m, with an
average of 9.3 m. The retreat rates recorded at I-l'erschel
Island are arnongst the highest recorded in the literature for
the development of retrogressive thaw slumps (Table 6.1).
Maximum and minimum air temperatures were recorded both
inside and outside the slump bowl at RTS 1 (Figure 6.3). Over
a six week period, average daily maximum tempe rature inside
the slump was 4°C warmer on clear days (approximately 75% of
the tirne) than outside the slump. Figure 6.4 illustrates the
cumulative headwall retreat at RTS 1 and 2 for the period of
June ta August, 1988. Highest rates of headwall retreat were
documented from July to early August, when daily air
temperatures are at their warmest. It was found that retreat
118

Legend
ro, '. " 1)',,1 nn
Il' {N r j "1
(Il ' S f 7 f~ r~
Ir)) ;. l J~ Il
(~~) 21 ' G ff)
o Slilbhzeù slurnp
B Act Ive heaùwall
@ Slilble he~dwall
- Survey hile
L Slop'1 :11lr]le 3. d.recl.on
Site 2:
. ' /
l' /. ( •
\
\
.... ~ ....
\' \ J
Site 1:
-N
· ............ ~~ .. _ ..• ~ ... ~~ ........ , ... : .. ~ .. " .•.
... , ....... ,., t2.-3' \
L 1- 40
L9-12'
...
\
... ~, .... : ... '" .....
0 25
metres
/'
Figure 6.2. Diagrarn illustrating headwall retreat at RTS 1 and RTS 2 from June 1988 to June 1989.
119
:' /: Il
./ 1 1

Table
Locnlion
Arctlc cua!>t, U.S S R. Central Yakutln, U.S S R Elle! RIgne!> bland, N W T E Mclvllk bland, N W.T. E Bank., Islaml, N. W T. E. Banks Island, N.W T. S. I3ank\ blaml, N W T Tuk. PClllIl\ul,l, N W T. Garry blanù, N W T. MackenzIe Delta. N.W T. 1\layo. Yukon Tcrntory Cuh Ille Del ta, AI:I\ka 1\ lacleod POInt, Al,lska
10 7-9.5 7-10 7-8 7-10 6-8 14 7 7.2 1.5-4.5 14-16 1-3 10-18
SlIurce
Are (11)!)3) Are ( 1 c)7~) Llmollthe and St Onge (1 %)) 1 IeglllbottOlll ( (llH.I) french and Fgglllton ()1)73) French (11174) Le\, kOWIl7 (1'):-\7) M,ILk,IY (II)X(,) Kerfoot and M.lck,IY «(1)72) M,lckay () %(1) Burtl (1 lM)
\v,lIher (1 ():-\3)
I3l.llk (1 I)H3)
6.1. Docurnented annual retreat rates for retrogressive thaw slurnps for various locations (Burns and Friele, 1989).
120

Mo/imum and Minimum Temperature Out of Thow Siump 06/26-15/07/88.
38.0
.3.3.0
280 ,,-..... () .............. 230 v ~
::J 180 ......,
a ~
v 0... 130 E v
1-8.0
JO
-2.04-~~~~~-r-r-r~~~~~~-r~~ 178 180182 184 186 188 190 192 194 196
Julian Day
Maximum and Minimum Temperature in Thaw S/ump 06/26-07/'5/88.
cv ~
38.0
.33.0
28.0
23.0
.2 180 a L
cv 0...
E cv
1-
Figure 6.3.
13.0
8.0
3.0
- 2.0 -+-.....-..--.........,-....---.-"'""'T'"-r--r--.--~~,......,~--r....,..-,-ï 178 180 182 184 186 188 190 192 194 196
Julian Day
Maximum and minimum air temperatures recorded inside and outside the slump bowl at RTS 1.
121

Figure 6.4.
A Cumulatl'/O Hoadwall Retrem for RTS 1, 21/06-31/08/88
r-.. E ~ .......
JoJ 0 1> ....
JoJ 1> œ 1> .~ C 3 E ~
u
1 i i i 1 il i i 1 il i i il 1 l,Ir Il i 1 ITTTTTI Il i 1111 l'
150 160 170 180 190 200 210 220 2JO 240 250 Julion Day
B Cumulative Heodwoll Retreot for RTS 2, 21/05-31/08/88.
1> > -:; o :l
E ~ u
/
150 160 170 180 I!JO 200 210 220 2JO 240 250 Julian Day
Cumulative headwall retreat (average retreat for the site) for (a) RTS land (b) RTS 2.
122

rates diminished, or the section of the headwall stabilized
quic~cly, when ground ice contents fell below 150%. Sidewall
retreat is particularly slow because of low ~ce content, the
rapid burlal by mudf]ow from the headwa:l, and/or because the
gradient nf the slump floor perpendicular to the sidewall is
low. Kerfoot (1969) notes that the critical factor
influencing the longevity cf thaw slumps is the maintenance
of fresh exposures of substrata that have a high ice content.
In comparison to slump headwalls, coastal bluff retreat over
a distance of 100 m along Thetis Bay averaged only 30-50 cm
per year, with a maximum retreat of 1 m.
Evolution of Thaw
In early June of 1988, the headwall of RTS 1-3, with the
exception of the upper 1-2 m at each site were snow covered
(Figure 6.5). Headwall retreat of the exposed portion of the
face (primarily the active layer) began on June 9-10,
approximately 16 days after mean daily temperatures were
consistently above O°C. Retreat at this time ranged between
0-15 cm/week. By mid-June slumped blocks of organics and
sediment from the active layer accounted for up to 50-70 cm
of weekly retreat at each of the sites. The highest rates of
retreat in the early thaw season occurred along the south -
facing headwalls at RTS 1 and 3, and the southeast - facing
headwall at RTS 2. These segments were the highest parts of
the ice faces, cleared of snow and debris, and contained
123

Figure 6.5. Photograph of snow covered headwall in late June 1988. Snow rernained within slurnp bowls until the first week of July.
124

massive segregated ice and ice-rich permafrost. Even though
active headwall retreat was taking place, thawed debris from
the exposed portion of the face and active layer toppled onto
snowbanks within the slump bowl. This acted as insulation
which, in turn, reduced rates of ablation of the lower 4-5 m
of the ice face.
By early July, warmer air temperatures (average
tempe rature at Shingle Point for the first week in July was
13.7°C) caused higher rates of snowrnelt and increased exposure
of the headwall. This resulted in a corresponding increase
in ablation rates of the ice face and headwall retreat. By
July 6-7 aIl snowbanks within slump bowls had melted. At this
time the south - facing headwall of RTS 3 was very active with
recorded retreat rates of 10-45 crn/day. However, as the thaw
season progressed the rapid accumulation of slumped material
buried the face and stabilized most of the south - facing
headwall (Figure 6.6). simul taneously, the west and
southwest - facing segments of the headwall became very active
and experienced retreat rates of up ta 50-80 cmjday. Thj~
portion of the headwall displayed massive ground ice in the
form of layers and ice-wedge ice. In the case of RTS 1 and
2, retreat rates were highest on the south - facing portions
of the headwall. Retreat along the west - and east - facing
headwall of RTS 1 was very limited and only localized. At RTS
2, retreat for a period of approximately six weeks was as high
125

Figure 6.6. Slurnped rnaterial caused stabilization of the south - facing headwall at RTS 3 (July 1988).
126

as 6.7 m for the east - facing headwall and 9.8 m for the west
- facing headwall. The highes~ retreat rates at aIl sites
occurred from mid-July ta early August, during which time warm
temperatures caused high ablation rates and the collapse of
large blacks of thawed material up ta 1.5 m in length from the
overlying active layer. Based on survey data and the analysis
of slump shape change, it is suggested that the relatively
high rates of retreat, particularly at RTS 2, are due to the
combined influence of high ice content, southerly aspect and
above average air temperatures within the slump bowl.
6 • 2 • 4 Runo f f
Drainage channels develop on the slurnp floor both as
meltwater from the ice face and residual snowhanks and water
from supersaturated mud lobes drain. A dendritic pattern of
drainage channels deeply incise stable parts of the bare slump
floor at aIl sites (Figure 4.4). The largest channel found
at RTS 1 had a depth of 1.0-1.5 m. By July, with headwall
retreat very active, the floor at the base of the headwall,
and an area up ta 5 rn away, was covered by a mass of
supernatant mud. A dam of plastic mud at the base of the
headwall maintained this condition until a lobe of fluid rnud
either breached or overflowed the obstruction. These lobes
move downslope and are bordered by mud levees left by previous
flows. The lobes at the terminus of the rnud stream develop
transverse ridges and both radial and transverse cracks after
127

hardening. Flow at the base of the slump is concentrated into
streams which carry dirty water and liquid mud. Thus, there
is a succession from less stable material near the headscarp
to stable material away from the headwall (Figure 5.7).
Survey markers were installed in the slump floor to monitor
movement of material. Although measured at weekly intervals
for the greater part a season it was found that the floor at
aIl sites was not moving, but that material was sliding over
the existing slump floor. This resul ted in the burial of
survey markers. As an alternative, measurements were taken
in order to monitor the growth of mud lobes on the floor at
RTS 1 and 2. Over a period of four weeks mud lobes grew 16
m and 20 m in length at RTS 1 and 2, respectively.
6.3 Active Layer Slides
A maj or problem confronting researchers attempting to
document active layer slide processes is predicting where they
will occur and observing and measuring the process taking
place. Active layer slides are a thaw-induced rapid mass
movement involving failure and mass displacement of material
by a single event. This differs signiticantly from the
graduaI growth of retrogressive thaw slumps. Consequently,
the analysis of active layer slide occurrence is based mostly
on a posteriori evidence and on a combination of material
properties, timing of the event and meteorological data.
128
J

During the period of this study, several active layer slides
are known to have occurred (in the late summer of 1987, one
slide was witnessed by a biologist training park rangers).
Thus, this discussion is based on a combination of inferred
and observed events.
Physical Characteristics
Air photo interpretation and field reconnaissance by foot
and helicopter revealed that more than 50 active layer slides
have occurred on Herschel Island. Based on the degree of
revegetation, and comparison between 1970 air photos and the
present, more than 40% of the 30 slides in the Thetis Bay area
may be considered to be recent. It is apparent that active
layer sI ides on Herschel Island have occurred wi thout a
preferred orientation. Furthermore, they occur on both gentle
« 100) and steep (> 300
) slopes and on bare to well-vegetated
surfaces (Figure 4.8).
Slides ALS 1-4 occurred during a two week period
beginning in mid-August, 1987. Of particular interest is an
eyewitness report of the largest of five slides that
developed in this period at ALS 1. The slide happened over
a period of twenty minutes on August 13, 1987 (personal
communication, Dr. D. Pattie, Northern Alberta Institute of
Technology, and Mr. F. Elanjk, Yukon Territorial Government).
According to these reports, "movement was initially slow, but
velocity increased as material progressed downslope. Failure
129

and sliding of a large section of slope consisting of pieces
of the vegetation mat and nearly one metre of underlying
sediments exposed liquified mud and ground ice in the slide
floor". subsequently, the slide floor and sidewalls were
covered by a layer of smoothed, grooved wet clay forming a
slickenslide (Figure 6.7). Slickenslides are cornmon in this
forro of slope failure, and are generally indicative that the
type of mass wasting process taking place is that of sliding
along a translational failure plane.
Meteoro1ogica1 Observations
To better explain the slide activity in August, 1987,
meteorological records for shingle Point, as weIl as fragments
of data for Herschel Base Camp, were analysed. These data
reveal that in July 1987, temperatures were 2-3 Oc warmer than
the average 11°C at Shingle Point. Meteorological data
recorded at base camp revealed a mean average monthly air
tempe rature of 14°C for July, and temperature extremes of
24.6°C recorded at Shingle Point. Warm temperatures would
ini tiate early snowmel t and enhance thawing of the active
layer. Rainfall for the Yukon Coastal Plain and Herschel
Island is generally low. Total annual precipitation for the
arctic slope averages less than 200 mm, most of which falls
as rain or drizzle during the summer months. According to
territorial park records, the last heavy rainfall recorded at
Herschel Island was on August R, five days prior to the
130
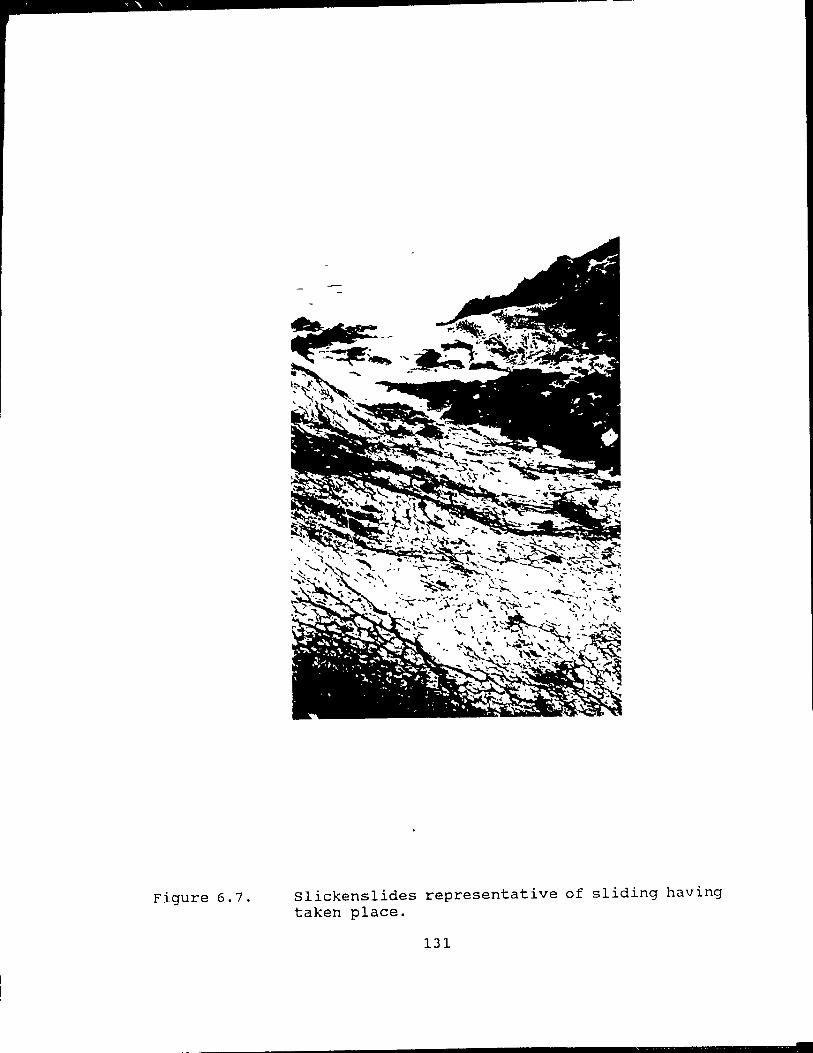
Figure 6.7. Slickenslides representative of sliding having taken place.
131
=

occurrence of the active layer slide on August 13. Although
heavy rainfall is frequently a triggering mechanism of
conventional slides, they do not seem to be directly
responsible in this case. A model for active layer slide
occurrence is proposed later in this chapter.
Field Observations
In the summer of 1988 su~vey markers were installed above
the slide headwalls and within the floors in order to monitor
subsequent change in form. No further movement was recorded
on slide floors, but headwall retreat of up to 1.0 metre at
ALS 1 and 1.5 m at ALS 2 was documented. As no icy permafrost
was exposed in the headscarp, ablation sensu stricto was not
the mechanism of retreat. A network of tension cracks
oriented perpendicular and parallel to the headwall widened,
and blocks of material broke away from the headwall as the
season progressed. These blocks tended to tumble only a few
metres from the face. Slide floors were dry, except for areas
immediately below the headwall or at the slide base which were
characterized by damp spots and ponding of water. The source
of water was either from the melting of snow that naturally
collects in these depressions or from the melting of
aggradational ice exposed in some of the headwalls. Water
pooled at the base of the headwall and eventually flowed into
drainage chélnnels that had developed in the sI ide floors.
132
J
Water also pooled at the lower end of the scar because the
dlsplaced material blocked further drainage, particularly
where material de~eloped a ridged corrugated appearance
(Figure 4.7.b). Each ridge is the width of the slide, and
therefore acts as a barrler to the movement of water
downslope. Ponding also occurred because of the nearly
impermeable nature of the underlying frozen sediment at the
base of the active layer.
Failure planes occur at depths of 60-100 cm, with an
average of 70 cm. In 1988, active layer development which was
monitored at ALS 1, 2, and 3 was found to range from 20 cm to
a maximum of 65 cm in ctepth by August. It was also obserJed
that active layer depths ~ended to increase in the upslope
direction and were deepest in areas at, and immediately above,
the slide headwall. Active layer slides occur along seepage
zones and on relatively steep slopes. Slope angles at the
point of detachment (failure) range between 10-30°. Areas
above slide headwalls recorded lower slope angles of up to 8°
(Figure 4.9). During excavation of the slide headwall at ALS
2 in 1988, a 2-5 cm thick ice lens was exposed at a depth of
70-80 cm. Furthermore, ice-rich sediments and semi-continuous
ice lenses and layers up to 5 cm in thickness were aiso
c,bserved at the base of the active layer in the exposed
sections of thaw slumps. Given the general lack of
precipitation, moisture essential for active layer slide
occurrence was probably provided by the melting of subsurface
133

aggradational ground ice, caused by the downward penetration
of the active layer.
6.4 Discussion
The occurrence of retrogressive thaw slumps and active
layer slides on Herschel Island has resulted in extensive
terrain disturbance. Observation and measurement of retreat
revealed that retrogressive thaw slump growth is the result
of five interacting processes, including (1) detachment and
freefall, or sliding, of blocks of sediment and organics from
the active layer, (2) thaw of ice and ice-rich material from
and immediately below the active layer, (3) ablation and
thermal erosion çf the ice face, (4) sloughing of material off
the ice face, and (5) mudflow at the base of the thaw face ~nd
within the slump floor. Each process contributes, within a
broad polygenetic framework, at different stages in the
seasonal development of the retrogressive thaw slumps.
Collapse of large blocks of sediment in response to ablation
did not occur on a daily basis, but increased in frequency as
the season progressed. Where ice wedges penetrated massive
ground ice bodies or ice-rich sediments, they tended to melt
slower than the enclosing ground ice. This may be due to
differences in crystal size, shape, dimensional orientation,
c-axis orientati on characteristics and sediment associat.ed
with different ice types (Pollard, 1989; 1990). DifferentiaI
melt rates resulted in the formation of protruding ice masses,
134

overhangs and uneven retreat across the headwall. As thawing
progressed the overhangs were undercut and unstable material
either slid down the ice face, or toppled "catastrophically"
from a height of several metres to the base of the ice face.
Where closely spaced ice wedges truncate relatively ice-poor
sediment their ablation also caused the intervening sediment
to be isolated as separate blocks which also collapse.
Failure of blocks of thawed and frozen material up to 50 m3
from the slump headwalls was documented. Based on regular
measurement, an estimated 10-15% of retreat was attributed to
this mechanism. These processes are self-perpetuating until
stabilization occurs by one or several mechanisms, for example
when the ice cont~nt of the frozen ground changes or the ice
body completely melts (Lewkowicz, 1988).
It is difficult to fully comprehend the cyclic nature of
retrogressive thaw slumps. However, in order for
retrogressive thàW slumps to be polycylic no one thermokarst
event can be responsible for complete melting of a ground ice
body, and a disturbance is needed to reactivate retrogressive
thaw slump activity. Areas containing massive ground ice
which is several metres in depth and several metres in
horizontal extent may require two or three cycles of
thermokarst over the course of many years (e. g., RTS 1 and 2) .
Retrogressive thaw slumps which are r.ot cyclic (RTS 4 is not
situated within a former thermokarst scar) develop in areas
of limited ground ice which seems to melt completely within
135

the COi.lrSe of a thermokarst event.
Active Layer Blide Model
Based upon evidence provided by stratigraphie and
material analysis together wi th observations on topography and
active layer development, the following genetic model for
active layer slide occurrence on Herschel Island is proposed.
Active layer sliùes develop during summers experiencing
above averag0 temperatures which produce deeper than average
seasonal thaw. As the active layer propagatE's beyond the
normal range of development it begins to melt a zone of
aggradational ice which often occurs near the top of
permafrost. In areas of fine-grained sediment, l ike the
marine silts and clays which make up this part of the island,
the supernatant water releasecl by the mel ting of aggradational
ice does not readily drain, creating a zone of high pore water
pressure. Furthermore, the material may be slightly
thixotrophic due to the marine clays that make up 30% of its
volume. Since the active layer tends to mirror the surface
topography, the shallow valleys t~at characterize the seepage
lines where active layer slides occur experience a slightly
greater accumulation of supernatant water and thus are
weakened further. A critical situation develops where the
shear stress of the increased active layer mass (produced by
the increase active layer depth) and the slope angle will
exceed the cohesive strength of the sediment. strength
136
-

associated wjth the effective normal stress is diminished by
increased pore water pressure. Failure proceeds along a plane
a few centimetres above the top of the permafrost table.
Frictional resistance along this plane would be reduced by the
presence of lenses and layers of ice that are concentrated in
the aggradational ice zone. Thus, rather than precipitation
acting as a triggering mechanism, a period of Wêlrm
temperatures may actually precipitate the occurrence of active
layer slides. Failure appears to begin at the headwall, and
the entire failed mass moves downslope intact. This is
clearly reflected in the displaced material where a ridged or
corrugated appearance is common. Where the slide tunnels into
a narrow drainage channel it will accelerate and cause greater
deformation of the failed mass (ALS 1).
The slickenslide surface which characterizes slide
floors, and its often grooved appearance clearly suggest that
failure occurred in ei ther thawed or plastic rnaterial. Given
the possible saline fine-grained nature of the sediment, this
zone of failure may actually exist a few centimetres deeper
than the position of the aOc isotherm. The slickenslides
rarely exceed 1-2 cm in depth; thus, it is assumed that
failure occurs very close to the boundary between the
aggradational ice and underlying plastic sediment.
137

Terminoloqical Alternatives
The general term "active layer failure" has been adopted
by the Permafrost Subcornmi ttee (1988) to include all slope
failures which occur in arctic environrnents. The term "active
layer slide", which is frequently used in the permafrost
literature, describes movement of material along a failure
plane. Since sliding is the dominant genGtic process and the
failed mass is the active layer, the ~erm is properly used.
However, a problem arises with resp,~ct to use of the term
"retrogressive thaw slump", more specifically, use of the term
"slump" to describe this thermokarst landform. S ince
retrogressive thaw slumps are a distinctive form of
thermokarst involving thaw subsidence of ice-rich permafrost
through the backwearing of an exposed ice face, then the
dominant genetic processes are melting and thermal erosion of
exposed ice and icy sediments. Secondary processes include
small-scale slumping and block failure as surficial material
with low ice contents are undercut, and flow of supersaturated
sediments in the slump floor. Therefere, the use of the term
"slump" to define these features is geemorphically incorrect,
because slumping processes are not dominant. Furthermor',:,
morphome~ric indices developed for true slumps in
nonpermafrost areas (Crozier, 1973), although similar for
retrogressive thaw slumps, do not apply because retrogressive
thaw slumps ferm by very different precesses. Unfortunately,
the rnisuse of the term slump with reference to these forros is
138

perpetuated by the current literature (Permafrost
SUbcommittee, 1988) . It seems quite clear that the
termino1ogy referring to this process should be revised. A
new term shou1d have both c1ear genetic and morphologie
connotations. The terms "thermokarst basin" or "thermokarst
sink" may more readi 1y fulfi11 this requirement. The new term
could be supported by descriptive modifiers such as
retrogressive and/or polycyclic.
139

Chapter 7
Swmmary and Conc1usions
7.1 Introduction
Ground ice is an important component of permafrost
evolution of sediments and plays a
perigIacial landscapes.
maj or role in
Considerable
the
research has been
undertaken to investigate the nature and origin of ground ice,
as weIl as Iandforms associated wi th i ts occurrence. However,
in view of the predicted warming of arctic environments
associated with global climate change, the study of
thermokarst and thaw-induced processes and landforms will
become increasingly important.
This thesis sununarizes the investigation of retrogressive
thaw slumps and active layer slides on Herschel Island, Yukon
Territory. Over the course of this study it L~carne apparent
that these are two of the rnost dynamie landforrns modifying the
terrain in this part of the western Arctic. This study
focused on three aspects of retrogressive thaw slurnps and
active layer slides, including (1) morphology and setting, (2)
material properties and ground iee eharacteristies, and (3)
process.
7.2 Retrogressive Thaw Slumps
Most of the retrogressive thaw slurnps on Herschel Island,
including those studied for this researeh, are situated along
140

the shoreline. These areas are geomorphically very dynamic,
experiencing fluvial erosion, gully formation and coastal
retreat processes which are perpetuated by the mel ting of snow
and exposed ground ice during the thaw season. Furthermore,
ground ice is widespread on Herschel Island, and is mapped as
"massive ground ice" in ar'eas of retrogressive thaw slump
activity (Bouchard, 1974; Pollard, 1989). Thus, the potential
for retrogressive thaw slump occurrence is high since these
thermokarst landforms require ground ice and a disturbance
(e.g., fluvial erosion, thermal erosion of ice wedges) for
their initiation and growth.
Retrogressive thaw slump morphology is a result of
several interacting processes and cryostratigraphic
characteristics which vary within and between slumps. RTS 1
and 2 display the classic amphitheatre shape. This is a
result of relatively homogeneous ground ice conditions across
the slump headwall. However, the morphology of RTS 3 is
influenced by at least twenty-three ice wedges exposed in the
headwall. These ice wedges measured up to 10 m in depth and
2-3 m in width. Ice wedges melted slower than the enclosed
massive ground ice and ice-rlch sediment, resulting in
irregular rates of retreat across the slump headwall, and a
j agged or serrated headwall appearance. It is clear that
ground ice is needed for retrogressiv~ thaw slump occurrence;
however, slump growth is the result of five processes: (1)
detachment, followed by falling or sliding, of blocks of
141
" .

sediment from the active layer, (2) thaw of ice and ice-rich
material immediately below the active layer, (3) ablation and
thermal erosion of the ice face, (4) sloughing of material
off the ice face, and (5) mudflow within the slump floor.
Each process contributes to slump growth during the thaw
season. The most important process is ablation and
backwearing of the ice face.
7.3 Active Layer Slides
Active layer slides on Herschel Island are situated on
a variety of slopes displaying a range of aspects, slope
angles and material properties. Unlike retrogressive thaw
slumps, the active layer slides on the island are not limited
to the vicinity of the shoreline, but are widespread on the
island. However, many do occur along seepage l ines 1 and those
at ALS 1 are upslope from ephemeral drainage channels.
Active layer slides have a general appearance similar to
mudslides of the temperate environments, except that they are
shallow in nature. On Herschel Island active layer slide
headwalls reached maximum depths of 1.5 rn. The sites examined
differ in dimension and slope character istics; these
differences are best explained as a result of varying
topographic conditions. For exarnple, slides not restricted
by topographie conditions such as narrow channels or steep
ridges tend to cover an extensive area (e.g., ALS 4 covered
an area of 9,860 m2 as cornpared ta a slide scar at ALS 1 which
142
J

a
measured 275 m2).
sinee active layer slides are a form of rapid mass
movernent, it is very difficult to obtain proeess measurements.
However, based upon personal communication (Dr. Pattie,
Northern Alberta Institute of Technology), it is known that
the slides examined (ALS 1-4) occurred over a two week period
in August 1987. In July 1987, temperatures were 2-3°C warmer
than the average 11°C. These warm temperatures would have
caused a deeper than average active layer. As the active
layer reached depths of 70-80 cm a zone of aggradational ice
found at the top of permafrost rnelted, which, eombined with
rnaterial properties and the increased load of a deepening
active layer, caused failure along the zone of aggradational
ice.
7.4 Conclusion~
From the field studies undertaken at Herschel Island, and
laboratory analysis the following conclusions can be drawn:
(1) Retrogressive thaw slumps and active layers slides are
currently sorne of the most active degradational
geomorphic processes occurring on the island. In 1989,
an aerial survey of the northern part of the island
revealed slump and slide frequencies of 6-7 per km2 and
10 per km2, respectively. Furthermore headwall retreat
rates docurnented at Herschel Island are the highest for
this part of the Arctic.
143
,
(2) Five prlJcesses contribute, within a broad polygenetic
framework, to different stages in the development of
retrogressive thaw slumps. The most important process
is backweë::.ring of an exposed ice face. Retrogressive
thaw slumps are most active (e.g., block failure), and
have the highest retreat rates, late in the thaw season,
averaging up to 0.80 cm of retreat per day.
(3) Retrogressive thaw slump development is influenced
primarily by ground ice conditions. Firstly, thermal
erosion along icn wedges is a main triggering mechanism
in slump initiation at Herschel Island. Secondly, RTS
1 and 2 have the classic amphi theatre shape 1 which
reflects relatively homogeneous ground ice conditions
across the headwall. However, RTS 3 has varying ground
ice conditions. The ice wedges exposed in the headwall
melted slower than enclosing massive ice and ice rich
sediments. This resul ted in irregular ablation rates
across the headwall, which in turn influenced the overall
shape of the slump.
(4) Active layer slides appear related to warm temperatures
and not to precipitation events. Warm temperatures
result in deep active layer development and increased
pore water pressure associated with the melting of
aggradatjonal ice in marine sediments. This, combined
with the fa ct that slides occur along seepage lines and
have steep slopes at their point of detachment,
144
1
l

contributes to unstable slope conditions. Failure
results in the form of sliding along a planar surface at
the top of permafrost.
(5) The term retrogressive thaw slump is geornorphically
inaccurate because thermokarst is not a gravit y induced
process. On the basis of observations at Herschel Island
i t is proposed that the terrns "t:hermokarst basin" or
"thermokarst sink" be adopted.
(6) Based upon air photo analysis and helicopter
reconnaissance it can be concluded that retrogressive
thaw slumps and active layer slides are key degradational
landforms. There is evidence of a ] ong history of
thermokarst (e. g., the presence of numerous slump scars)
in this part of the arctic, hence, one should be careful
when attaching a global climatic significance to the
current trend in these phenomena. However, without a
doubt, areas of ice-rich permafrost will experience more
thermokarst if curre.1t annual air temperatures increase.
7.5 Recommendations for Future Research
During the course of this research it becarne apparent
that four avenues of research should be given further
consideration:
(l) During this study no one direct observation was obtained
to explain the polycyclic nature of retrogressive thaw
slumps. A long-term study may provide insight into the
145
, , ,
cyclic nature of retrogressive thaw ~lumps.
(2) Although logistical support was unavailable for a
detailed micrometeorological study it was observed that
the microclimate within a thaw slump is very different
from the local and regional climates. A detailed
microclimatic study could provide more information on ice
ablation, rates of headwall retreat, slump stabilization
and subsequent revegetation.
(3) To investigate further the ground ice petrography of
various ice types and its influence on ablation of the
ice face.
(4) A geotechnically oriented study on active layer slides
is needed focusing on the relationship between material
properties and thawing in order that slide occurrence may
be better understood.
146

q .. References
AIgus, M., 1986. The Development of Coastal Bluffs in a Permafrost Environment, Kivitoo Peninsula, Baffin Island, Canada. Ph.D. Thesis, McGi11 University, Montreal, Quebec, 300 pp.
Are, F. E., 1988. Thermal abrasion of sea coasts. Polar Geography and Geology, 1 and 2, 1-39.
Billings, W.D. and Peterson, R.M., 1980. Vegetational change and ice-wedge polygons through the thaw lake cycle in Arctic Alaska. Arctic and Alpine Research, 12, 413-432.
Black, R.F., 1969. Thaw depressions and thaw lakes: a review. Biuletyn Perglacjalny, 19, 131-150.
Bostock, H.S., 1948. Physiography of the Canadian Cordillera, with special reference to the area north of the fiftyfifth parallel. Geological Survey of Canada, Memoir 247, 106 pp.
Bouchard, M., 1974. Géologie des Dépôts d'île Herschel, Territoire du Yukon. M.Sc. Thesis, Montréal, Quebec, 70 pp.
Brown, R.J.E., 1963a. Relationship between mean annual air and ground temperatures in the permafrost region of Canada. In: proceedings, First International Conference on Permafrost. Lafayette, Indiana, National Academy of Science, 241-246.
Brown, R.J.E., 1963b. Influence of vegetation on permafrost. In: Proceedings, First International Conference on Permafrost. Lafayette, Indiana, National Academy of science, 20-24.
Brown, J., 1963c. Ice-wedge chemistry and related frozen ground processes, Barrow, Alaska. In: Proceedings, First International Conference on Permafrost. Lafayette, Indiana, National Academy of Science, 94-98.
Brown, R.J.E., 1970. Permafrost in Canada: Its Influence on Northern Development. University of Toronto Press, Toronto, 234 pp.
Brown, R.J.E., 1972. Permafrost irJ the Canadian Arctic Archipelago. z8itschrift fur Geomorphologie, Supplement Band 13, 102-130.
147
7

Brown, R.J. E., 1973. Influence of climatic and terrain factors on ground temperatures at three locations in the permafrost region of Canada. In: Proceedings, Second International Conference on Permafrost. Yakutsk, U.S.S.R., Nation~l Academy of Science, 27-34.
Brown, R.J.E., 1974. Ground ice as an initiator of landforms in permafrost regions. In: B.D. Fahey and R.D. Thompson (editors), Research in Polar and Alpine Geomorphology. proceedings - 3rd Guelph symposium on GeomorpholJgy. Geo Abstracts, Norwich, England, 25-42.
Brown, R . J • E. , Services.
1978. Permafrost. Plate 32.
Ministry of Supply and
Brown, R.J.E. and Kupsch, W.O., 1974. Permafrost Terminology. National Research Council of Canada, Technical Memorandum No. 111, 62 pp.
Burn, C.R. and Friele, P.A., 1989. Geomorphology, vegetation succession, soil characteristics and permafrost in retrogressive thaw sltimps near Mayo, Yukon Terri tory. Aretic, 42, 31-40.
Carson, M.A., 1975. Threshold and characteristic angles of straight slopes. In: E. Yatsu, A.J. Ward, and F. Adams (editors), Mass Wasting. proceedings - 4~ Guelph Symposium on Geomorphology. Geo Abstracts, Norwich, England, 19-33.
Carson, M.A. and Kirkby, M., 1972. Hillslope Form and Process. Cambridge University Press, London, 467 pp.
Chandler, R.J., 1972. Periglacial mudslides in West Spitzbergen and their bearing on the origin of fossil 'solifluction' shears in low angled clay slopes. Quarternary Journal of Engineering Geology, 5, 223-241.
Crozier, M.J., 1973. of landslips. 101.
Techniques for the morphometric analysis Zeitschrift fu~ Geomorphologie, 17, 78-
Czudek, T. and Demek, J., 1970. Thermokarst in Siberia and i ts influennce on the development of lowland rel ief. Quaternary Research, 1, 103-120.
Edlund, S.A., AIt Taylor, B. and Young, K.L., 1989. Interaction of climate, vegetation, and soil hydrology at Hot Weather Creek, Fosheim Peninsula, Ellesmere Island, N.W.T. Geological Survey of Canada, Paper 89-10, 125-133.
148

Ferrians, O. J ., Kachadoorian, R. and Greene, G. W. , 1969. Permafrost and related engineering problems in Alaska. United states Geological Survey, Professional Paper, 678, 37 pp.
Francis, D., 1984. Arctic Chase: A History of whaling in Canada 1 s North. A Breakwater book in the Arctic and Northern Life Series, Canada, 117 pp.
French, H.M., 1974. Active thermokarst processes, eastern Banks Island, Western Canadian Arctic. Canadian Journal of Earth Sciences, Il, 785-794.
French, H.M., 1975. Man-induced thermokarst, Sachs Harbour airstrip, Banks Island, N.W.T., Canada. Canadian Journal of Earth Science, 12, 132-144.
French, H.M., 1976. The periglacial Environment. Longman, London and New York, 309 pp.
French, H.M., 1979. Permafrost and ground ice. In: K.J. Gregory and D.E. Walling (editors), Man and Environmental Processes: A Physical Geography perspective. John Wiley and Sons, London, pp. 144-162.
French, H.M., 1986. Ground-ice investigations, Klondike District, Yukon Terri tory. Canadian Journal of Earth Sciences, 23, 550-560.
French, H.M. and Egginton, P.A., 1973. Thermokarst development, Banks Island, western Canadian Arctic. In: proceedings, Second International Conference on Permafrost. Yakutsk, U.S.S.R., National Academy of Science, 203-212.
Forbes, D.L., 1980. Late southern Beaufort Sea. Paper 80-1B, 75-87.
Quaternary sea levels in the Geological Survey of Canada,
Gold, L.W., 1967. temperature. 208.
Influence of surface conditions on ground Canadian Journal of Earth sciences, 4, 199-
Gold, L.W. and Lachenbruch, A.H., 1973. Thermal conditions in permafrost: a review of North American literature. In: Proceedings, Second International Conference on Permafrost. Yakutsk, U. S. S. R., National Academy of Sciences, 3-25.
Goodrich, L.E., 1982. The influence of snow coyer on the ground thermal regime. Canadian Geotechnical Journal, 19, 421-423.
149

Hallet, B., 1978. Solute redistribution in freezing ground. In: Proceedings, Third International Conference on Permafrost. Edmonton, Alberta, National Research Couneil, 185-l91.
Harris, C., 1973. Sorne factors affecting the rates and processes of periglacial mass movement. Geogra f iska Annaler, 55A, 24-28.
Harry, D.G. and French, H.M., 1983. The orientation and evolution of thaw lakes, southwest Banks Island, Canadian Arctic. In: proceedings, Fourth International Conference on Permafrost. Fairbanks, Alaska, National Research Council, 451-461.
Harry, D.G., French, H.M. and Clark, M.J., 1983. Coastal conditions and processes, Sachs Harbour, Banks Island, western Canadian Arctic. Zeitschrift fur Geomorphologie, Supplement Band, 47, 1-26.
Harry, D.G., French, H.M. and Pollard, W.H., 1985. Ice wedges and permafrost conditions near King Point, Beaufort Sea Coast, Yukon Terri tory. Geological Survey of Canada, Paper 85-1A, 111-116.
Harry, D.G., 1988. Ground Ice and Permafrost. In: M.J. Clark (editor), Advances in Periglacial Geomorphology. John Wiley and Sons, New York, pp. 113-141.
Hegginbottom, J.A., 1973. The effects of surface disturbance upon permafrost. Environmenta~-Social Committee Northern Pipelines, Task Force on Northern Oil Development, Report 7 J -16, 29 pp.
Hegginbottom, J.A., 1974. The effect of surface disturbanse on ground ice and distribution. Geological Survey of Canada, Paper 74-1A, 273.
Hill, P.R., Mudie, P.J., Moran, K. dnd Blasco, S.M., 1985. A sea-level C'lrve for the Canadian Beaufort Shelf. Canadian Journal of Earth Science, 22, 1383-1393.
Hughes, O.L., 1972. Surficial geology of the northern Yukon Territory and northern district cf Mackenzie, Northwest Territories, Canada. Geological Surv~y cf Canada, Paper 69-36, 11 pp.
Johnston, G.H. (editor), 1981. Permafrost: Engineering Design and Construction. John Wiley and Sons, Toronto, 540 pp.
150

Judge, A.S., 1973. Deep temperature observations in the Canadian North. In: Proceedings, Second International Conference on Permafrost. Yakutsk, U.S.S.R., National Academy of Science, 35-40.
Kerfoot, D.E., 1969. The Geomorphology and Permafrost Conditions of Garry Island, N.W.T. Ph.D Thesis, University of British Columbia, Vancouver, B.C., 306 pp.
Konrad, J. M. and Morgenstern, N. R., 1984. Frost heave prediction of chilled pipelines buried in unfrozen soils. Canadian Geotechnical Journal, 21, 100-115.
L~mb, W.T., 1951. Soil l'esting for Engineers. John Wiley and Sons, New York, 165 pp.
Lamonthe, C., and st. ange, D.A., 1961. A note on a periglacial erosional process in the Isachen area, N. W. T. Geographical Bulletin, 16, 104-113.
Lachenbruch, A.H., 1959. periodic heat flow in a stratified medium with application to permafrost problems. United States Geological Survey, BUlletin, 1083-A, 1-36.
Lachenbruch, A.H., 1962. Mechanics of thermal contraction cracks and ice-wedge polygons in permdfrost. Uni ted states Geological Survey, Special Report, 70, 69 pp.
Leffingwell, E., 1919. The Canning River R<3gion, Northern Alaska. United States Geologlcal Survey, Professional Paper, 109, 251 pp.
Levinson, A.A., Geochemistry. 612 pp.
1974. Introduction to Exploration Appl ied Publishing Ltd., Calgary, Alberta,
Lewellen, R.I., 1973. The occurrence and characteristics of nearshore permafrost, northern Alaska. In: proceedings, Second International Conference on Permafrost. Yakutsk, U.S.S.R., National Academy of science, 131-136.
Lewkowicz, A.G., 1988. Slope processes. In: M.J. (editor), Advances in periglacial Geomorphology. wiley 2nd Sons, New York, pp. 325-368.
Clark John
Linell, K.A. and Tedrow, J.C.F., 1981. Soil and permafrost surveys in the arctic. Oxford University Press, New York, 279 pp.
Mackay, J.R., 1959. Glacier ice-thrust features of the Yukon Coast. Geographical Bulletin, 13, 5-21.
151

Mackay, J.R., 1963. The Mackenzie Delta area, N.W.T. Canada Department of Mines and Technical Surveys, Geographical Branch, Memoir 8, 202 pp.
Mackay, J.R., 1966. Segregated and epigenetic ice and slumps in permafrost, Mackenzie Delta area, N.W.T. Geographical Bulletin, 8, 59-80.
Mackay, J.R., 1970. Disturbances to the tundra and forest tundra environment of the western Arctic. Canadian Geotecnical Journal, 7, 420-432.
Mackay, J.R., 1971a. Geomorphic processes, Mackenzie Valley, Arctic Coast, District of Mackenzie. Geological Survey of Canada, Paper 71-1A, 189-190.
Mackay, J .R., 1971b. The origin of massive icy beds in permafrost, western Arctic coast, Canada. Canadian Journal of Earth Sciences, 8, 397-422.
Mackay, J.R., 1972a. Offshore permafrost and ground ice, southern Beaufort Sea, Canada. Canadian Journal of Earth Sciences, 9, 1550-1561.
Mackay, J R., 1972b. The world of underground ice. Annals Associntion of American Geographers, 62, 1-22.
Mackay, J .R., 1973. Problems in the origin of massive icy beds, western Arctic, Canada. In: proceedings, Second International Conference on Permafrost. Yakutsk, U.S.S.R., National Academy of Science, 223-228.
Mackay, J .R., 1974a. The rapidity of tundra polygons and destruction, Tuktoyaktuk peninsula - Richard' s 1 sland area, N.W.T. Geological Survey of Canada, Paper 7~-lA, 391-392.
Mackay, J .R. , Northwest Sciences,
1974b. Ice-wedge cracks, Garry Island, Territories. Canadian Journal of Earth
Il, 1366-1383.
Mackay, J.R., 1975a. The stability of permafrost and recent climate change in the Mackenzie Valley, N.W.T. Geological Survey of Canada, Paper 75-1B, 173-176.
Mackay, J.R., 1975b. Relict ice wedges, Pelly Island, N.W.T. Geol)gical Survey of Canada, Paper 75-1A, 469-470.
Mackay, J. R., 1976a. Ice wedges as indicators of recent climate change, western Arctic coast. Geological Survey of Canada, Paper 76-1A, 233-234.
152
J

Mackay, J.R., 1976b. Ice segregation at depth in permafrost. Geological Survey of Canada, Paper 76-1A, 287.
Mackay, J.R., 1978. The surface tempe rature of an ice-rich melting permafrost exposure, Garry Island, N. W.T. Geological Survey of canada, Paper 78-1A, 521-522.
Mackay, J.R., 1980. Deformation of ice-wedge polygons, Garry Island, N.W.T., Canada. Geological Survey of Canada, Paper 80-1A, 287-291.
Mackay, J.R., 1984. The direction of ice-wedge cracking in permafrost: downward or upward? Canadian Journal of Earth Sciences, 21, 516-524.
Mackay, J.R., 1989. Massive ice: sorne field criteria for the identif ication of ice types. Geological Survey of Canada, Paper 89-1G, 5-11.
Mackay, J.R., Konishchev, V.N. and Popov, A.I., 1978. Geologic controls of the origin, characteristics and distribution of ground ice. In: proceedings, Third International Conference on Permafrost. Edmonton, Alberta, National Academy of Science, 1-18.
Mackay, J.R. and Mackay, O.K., 1972. Ground temperatures at Garry Island. In: D.E. Kerfoot (editor) , Mackenzie Delta Area Monograph. 22nd International Geographical Congress, Brock University, st. Catherines, Ontario, 107-114.
Mackay, J.R. and Mathews, W.H., 1964. The role of permafrost in ice-thrusting. Journal of Geology, 72, 378-380.
Mathews, W.H. and Mackay, J.R., 1960. Deformations of soils by glacier ice and the influence of pore pressures and permafrost. Royal Society of Canada Transactions, 54, 27-36.
McRoberts, G.C., 1973. stability of slopes in permafrost. Ph.D. Thesis, University of Alberta, Edmonton, Alberta, 370 pp.
McRoberts, G.e. and Morgenstern, N.R., 1974a. Stabilityof thawing slopes. Canadian Geotechnical Journal, 11, 447-469.
McRoberts, G.e. and Morgenstern, N.R., 1974b. Stabilityof slopes in frozen soil, Mackenzie, N.W.T. Canadian Geotechnical Journal, 11, 554-573.
Morgenstern, N.R. and Nixon, J.F., consol idation of thawing soils. Journal, 8, 558-565.
153
1971. One-dimensional Canadian Geotechnical

Muller, S.W., 1947. Permafrost or perennially frozen ground and related engineering problems. Edwards Bro...>., Ann Harbour, Michigan, 231 pp.
Naylor, D., Mclntyre, D.J. and Pleistocene deposits exposed Arctic, 25, 49-55.
McMillan, along the
N. F. , Yukon
1972. Coast.
Nicholson, F.H. and Granberg, H.B., 1973. Permafrost and snowcover relationships near Schefferville. In: Proceedings, Second International Conference on Permafrost. Yakutsk, U.S.S.R., National ACéldemy of science, 151-158.
D'Neil, J.J., 1924. Geology of the arctic coast of Canélda, west of the Kent Peninsula. In: Report of the Canadiéln -Arctic Expedition, 1913-1918, vol. xi, Geography and
Geology, Part A, ottawa, Canada, 10A-18A.
D'Sullivan, J.B., 1963. Geochemistry of Permafrost: Barrow, Alaska. In: proceedings, First International Conference on Permafrost. Lafayette, Indiana, National Academy of Science, 30-37.
Penner, E., 1972. Soil moisture redistr ibution by icc lens l ng in freezing soils. In: proceedings, 17 th Annual Meeting, Canadian Society of Soil Science, Lethbridge, Alberta, 44-62.
Permafrost Subcommittee on Geotechnical Research, 1988. Glossary of Permafrost and Related Ground Ice Terms. National Research Council of Canada. Ottawd, 1~6 pp.
Péwé, T.L., 1983. Alpine permafrost in the contiguous UnIted States. Arctic and Alpine Respalch, 15, 145-156.
Philainen, J.A. and Johnston, G.H., 1963. Guide to a Field Descriptlon of Permafrost. National Research Council of Canada, Ottawa, 23 pp.
Pellard, W.H., 1989. Buried snowbank ice in the central and northern Yukon Territory. In: Proceedlngs, Twenty-fifth Eastern Snow Conference, Quebec, 292-297.
The nature and origin of ground ice in Island area, northern Yukon. In:
Pellard, W.H., 1990. the Herschel Proceedings, Quebec, 23-30.
Fifth Canadian Permafrost Conference,
154

•
Pollard, W.H. and Dallimore, S.W., 1988. characteristics of massive ground ice, Plain, Canada. In: proceedings, Fifth Conference on Permafrost. Trondheim, Publishers, 224-229.
Petrographic Yukon Coastal International
Norway, Tapir
Pollard, W.H. and French, H.M., 1980. A first approximation of the volume of ground ice, Richards Island, Pleistocene Mackenzie Delta, N.W.T. Canadian Geotechnical Journal, 17, 509-516.
Pufall, O.E. and Morgenstern, at a landslide near proceedings, Workshop National Research Council 130, 31-39.
N. R., 1980a. The energy balance Fort simpson, N. W . T . In: on Permafrost Engineering. of Canada, Technical Memorandum
Pufall, O.E. and Morgenstern, N.R., 1980b. The energetics of an ablating headscarp. Canadian Geotechnical Journal, 17, 487-497.
Rampton, V.N., 1970. Surficial Geology, Herschel Island -Aklavik, Parts 107B, C, and D. Geological Survey of CanQda, Open File 25, Scale 1:250,000.
Rampton, V.N., 1971. Ground ice conditions, Yukon coastal plain and adjacent areas. Report of Activities, Part B, Geological Survey of Canada, 71-1B, 128-130.
Rampton, V.N., 1973. Surficial deposits of the Yukon Coastal Plain and adj acent areas, Parts 107B, 117A, C and D. Report of l.cti vi ties, Pùrt A, Geological Survey of Canada, 71-]A, 237-238.
Rampton, V. N., 1974. The influence of grc>und ice and thermokarst l1pon the geomorphology of the MackenzieBeaufort region. In: B.D. Fahey and R.D. Thompson (editors), Research in Polar and Alpine Geomorphology. proceedings, )rd Guelph Symposium on Geomorphology. Geo Abstracts, N0rwich, England, 4)-59.
Rampton, V.N., 1982. Quaternary Geology of the Yukon Coastal Plain. Gcological Survey of Canada, Bulletin 317, 48 pp.
Rampton, V.N. and Mackay, J.R., 1971. Massive ice and icy sediments throughout the Tu~toyaktuk Peninsula, Richards Island and nearby areas, District of Mackenzie. Geologlcal Survey of Canada, Paper 71-21, 16 pp.
Ram~con, V.N. and Bouchard, M., 1975. Surficial geology of Tuktoyaktuk, District of Mackenzie. Geological Survey of Canada, Paper 74-53, 17 pp.
155
1
~
Ritter, D.F., 1978. Process Geomorphology. Wm.C. Brown Publishers, Dubuque, Iowa, 579 pp.
Sellman, P.V., Brown, J., Lewellen, R.I., McKim, H., and Merry, C., 1975. The classification and geomorphic implications of thaw lakes on the arctic coastal plain, Alaska. United states Army, Cold Regions Research and Engineering Laboratory, Hanover, NH, Technical Pcport, 199 pp.
Shumski, P.A., 1964. Principles of structural Glaciology. The Petrography of Fresh Water Ice as a Method of Glaciological Investigation. Dover Publications, Inc., New York, 496 pp.
Sloane, H., 1728. An account of elephants .... eeth and bones found under the ground. Philosophical Transactions of the Royal Society, 35, 457-471.
Smith, C.A.S., Kennedy, C.E., Hargrave, A.E. and McKenna, K.M., 1990. Soil and vegetation survey of Herschel Island, Yukon Territory, 101 pp.
Strahler, A.N., 1950. Equilibrium theory of erosional slopcs approached by frequency distribution analysis. Amcrican Journal of Science, 248, 673-696 and 800-814.
Tsytovich, N.A., 1975. The Mechanics of Frozen Ground. New York, MeGraw-Hill, 426 pp.
van Everdingen, R.a., 1976. Geoeryologieal terminology. Canadian Journal of Earth sciences, 13, 862-867.
Varnes, D.J., 1958. Landslide types and proeesscs. In: E. Eckel (editor), Landslides and Engineering Praeticc. Washington, D. C. , Washington Highway Research Board, Special Report, 29 pp.
Varnes, D.J., 1978. Slope movement types and proccsscs. In: R. Schuster and R. Kriza': (editors), Landslips. Washington, D.C., Transportation Research Board, natIonal Acaderny of Science, pp. 12-33.
Vtyurin, B.I., 1973. Patterns and distribution and a quantitative estimate of the ground iee in the U.S.S.R. In: proceedings, Second International Conference on Permafrost. Yakutsk, U.S.S.R., National Acadcmy of Science, 12-19.
156

Yorga, B.W.D., 1980. Washout: A western Thule site on Herschel Island, Yukon Terri tory. National Museum of Man, Mercury Series, Archaeological Survey of Canada, ottawa, Paper 98, 219 pp.
Young, A., 1972. In: K.M. Clay ton (editor), Slopes. Longman, London and New York, 279 pp.
Young, F.G., 1975. Upper Cretaceous stratigraphy, Yukon Coastal Plain and northwestern Mackenzie Delta. Geological Survey of Canada, Bulletin 249, 83 pp.
Wahl, H. E., Fraser, D. B., Harvey, R. C. and Maxwell, J. B. , 1987. Climate of the Yukon. Climatological Studies, 40, Environment Canada, Atmospheric EnVlronment Service, 69-159.
Washburn, A.L., 1980. Geocryology: A Survey of Periglacial Processes and Environments (2nd edition). Edward Arnold, London, 320 pp.
Williams, P.J., 1979. Pipelines and Permafrost: Physical Geography and Development in the North. Longman, London and New York, 92 pp.
Wray, W.K., 1986. Measuring Engineering properties of Soils. Department of civil Engineering, Texas Technical University. Prentice-Hall International Series in civil Engineering and Engineering Mechanics. Prentice-Hall Inc., Englewood, N.J., 276 pp.
157
1
•