Embed Size (px)
Citation preview

FINANCING ECONOMIC DEVELOPMENT IN POST REDEVELOPMENT CALIFORNIA
A Thesis
Presented to the faculty of the Department of Public Policy and Administration
California State University, Sacramento
Submitted in partial satisfaction of
the requirements for the degree of
MASTER OF PUBLIC POLICY ADMINISTRATION
by
Andrew Joseph Sturmfels
SPRING
2012

ii
© 2012
Andrew Joseph Sturmfels
ALL RIGHTS RESERVED

iii
FINANCING ECONOMIC DEVELOPMENT IN POST REDEVELOPMENT CALIFORNIA
A Thesis
by
Andrew Joseph Sturmfels
Approved by:
__________________________________, Committee Chair Edward L. Lascher, Jr., Ph.D.
__________________________________, Second Reader
Peter M. Detwiler, M.A.
____________________________
Date

iv
Student: Andrew Joseph Sturmfels
I certify that this student has met the requirements for format contained in the University format
manual, and that this thesis is suitable for shelving in the Library and credit is to be awarded for
the thesis.
__________________________, Department Chair ___________________
Robert W. Wassmer, Ph.D. Date
Department of Public Policy and Administration

v
Abstract
of
FINANCING ECONOMIC DEVELOPMENT IN POST REDEVELOPMENT CALIFORNIA
by
Andrew Joseph Sturmfels
In February 2012, the legislature abolished the state’s redevelopment program.
Local redevelopment agencies had participated in a myriad of economic development
activities. Along with the dissolution of these entities, local officials lost the ability to use
tax increment financing to fund projects. In the aftermath of these actions, municipal
leaders are struggling to determine how they will finance future economic development
and infrastructure.
In this thesis, I provide an in-depth review of economic development activities once
financed by RDAs, as well as remaining financing techniques local governments have at
their disposal. I determine which financing mechanisms still exist that municipalities can
use to complete economic development activities, and how each tool fits into the myriad
of local economic development activities. Using a qualitative criteria alternatives matrix
analysis I provide a matrix of options that pairs funding mechanisms with economic
development activities. To evaluate each combination, I consider four criteria that need to
be present in order to achieve success.
This analysis underscored two important points. First, none of the current financing
mechanisms have the same flexibility that existed with TIF through RDA. Second,

vi
financing mechanisms existed for nearly all of the economic development activities
evaluated.
_______________________, Committee Chair Edward L. Lascher, Jr., Ph.D.
_______________________
Date

vii
DEDICATION
I would first like to thank my wife Nichole, who every day encourages and
challenges me to live life to the fullest and be the best I can possibly be. Her support,
encouragement, and sacrifices allowed me to succeed. Nichole, you are my best friend
and soul mate. You have my love always and all ways.
I would also like to give special thanks to Ted Lascher and Peter Detwiler. I am
thankful for Ted’s ability to clearly articulate concepts I thought only existed in my brain,
his willingness to share ideas, and his candid commentary. I am also thankful for Peter’s
willingness to share his technical expertise, his constant encouragement, and for helping
me write clearly and confidently. Both of you helped me write a thesis that I am proud of.
I have tremendous gratitude for the time and energy you invested in both this thesis and
me.
Finally, I would like to thank the rest of the faulty in the PPA Department. This
program has given me the tools to be successful in ways I could not have imagined.
Someone once said that it is not the place that make the people, but the people that make
the place. In the case of the PPA Department, the faculty and staff are truly what make
the program great. Thank you for your commitment to teaching.

viii
TABLE OF CONTENTS
Page
Dedication .............................................................................................................................. vii
List of Tables ........................................................................................................................... ix
Chapter
1. INTRODUCTION ...................... ……………………………………………………….. 1
The Beginning of Redevelopment ............................................................................... 2
Budget Crisis Forces Change ....................................................................................... 6
The Judicial Branch Weighs in .................................................................................... 7
Chaos Ensues ............................................................................................................... 9
2. LITERATURE AND METHODS .................................................................................... 11
Redevelopment Agency Supported Economic Development Activities ................... 13
Municipal Financing Mechanisms ............................................................................. 16
Methods and Criteria ................................................................................................. 20
Conclusion ................................................................................................................. 24
3. ANALYSIS ....................................................................................................................... 25
Results ........................................................................................................................ 27
Conclusion ................................................................................................................. 35
4. CONCLUSION .................................................................................................................. 38
Economic Development Can Continue ...................................................................... 39
Making Economic Development Less Squishy ......................................................... 41
Legislative Changes Could Have Significant Impacts ............................................... 43
Conclusion ................................................................................................................. 45
Work Cited .............................................................................................................................. 46
ix
LIST OF TABLES
Tables Page
1. Financing Mechanisms that Met all Criteria, Listed by Economic Development
Activity .......................................................... .………………………………. 25
2. Targeted Business Incentives………………….… ... …………………………28
3. Public Improvements…………… ………….…………………………………29
4. Infrastructure with Revenue Stream……….……… ………………………….31
5. Marketing and Tourism Promotion……….……… . ………………………….32
6. Affordable Housing Development……….……… .. ………………………….34
7. Summary Cam Analysis .......................................................................................... 37

1
Chapter 1
INTRODUCTION
Economic development in California used to be easy. Local redevelopment agencies
(RDA) were the engine that drove economic development activities in a majority of
California cities. The state’s Community Redevelopment Law (CRL) provided over 400
California cities and counties with a comprehensive program to rehabilitate blighted
areas, spur economic development, and build upon state housing policies (State
Controller, 2011). Armed with the power to make large investment decisions without
voter approval and a significant source of funding, RDA encouraged economic
development through direct support to businesses, indirect improvements to local
infrastructure, workforce development, and affordable housing.
On February 1, 2012, the state legislature abolished redevelopment agencies after 67
years of existence. In eliminating redevelopment agencies, the legislature neglected to
provide a legally defensible alternative for cities to accomplish economic development
goals. In the future, cities will have to decide how to structure, organize, and finance
local economic development strategies without redevelopment. This thesis will consider
which financial tools still exist that municipalities can use to complete economic
development activities, and how each tool fits into the myriad of local economic
development activities. I will provide cities with a matrix of options that pairs funding
mechanisms with economic development activities. To evaluate each combination, I will
consider four criteria that need to be present in order to achieve success. The resulting

2
product will be a tool for cities to use as they begin to determine how to continue current
economic development activities and achieve future economic goals.
This thesis as a whole will discuss why losing the CRL is a significant change for
cities, explain the methods used in determining matches between financial tools and
economic activities, present a matrix of solutions, and provide analysis and
recommendations for moving forward. The document is organized as follows. The
remainder of chapter one will explain the importance of this research by describing why
RDA were an important part of local economic development and how they were
eliminated. In chapter two, I will categorize various types of economic development
activities that cities may use to achieve their strategic goals. Then I will discuss the
current financing tools available to municipalities. Chapter two will conclude with a
discussion on analytical methods and summarize the four criteria used in the analysis.
In chapter three, I will provide a qualitative matrix that considers financing options
for each activity based upon the criteria. In chapter four, I will summarize the work
completed, draw upon recommendations for future research and discuss upcoming policy
issues that result from this analysis.
The Beginning of Redevelopment
In 1945, the state legislature established the California Community
Redevelopment Act (CCRA) in response to a national movement to remedy urban blight
plaguing many California cities. The legislature believed that providing local control and
flexibility would allow communities to better remedy blight. The original statute
provided cities and counties with a vehicle to create local redevelopment agencies that
3
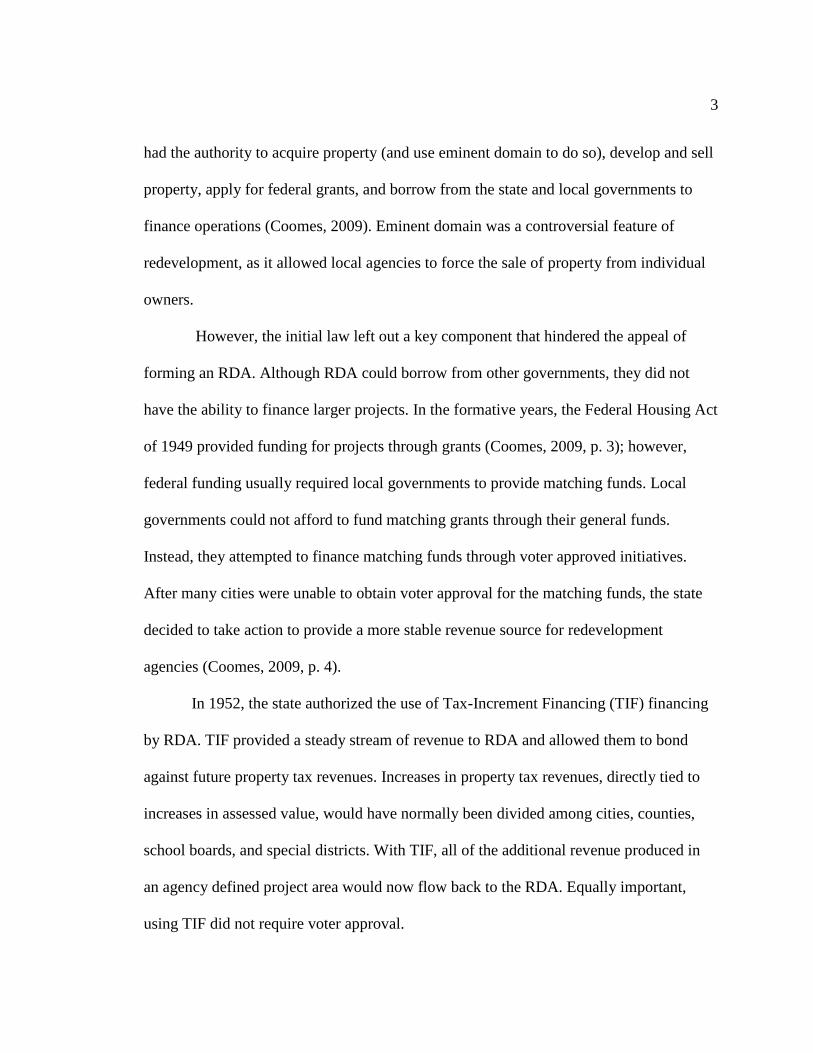
had the authority to acquire property (and use eminent domain to do so), develop and sell
property, apply for federal grants, and borrow from the state and local governments to
finance operations (Coomes, 2009). Eminent domain was a controversial feature of
redevelopment, as it allowed local agencies to force the sale of property from individual
owners.
However, the initial law left out a key component that hindered the appeal of
forming an RDA. Although RDA could borrow from other governments, they did not
have the ability to finance larger projects. In the formative years, the Federal Housing Act
of 1949 provided funding for projects through grants (Coomes, 2009, p. 3); however,
federal funding usually required local governments to provide matching funds. Local
governments could not afford to fund matching grants through their general funds.
Instead, they attempted to finance matching funds through voter approved initiatives.
After many cities were unable to obtain voter approval for the matching funds, the state
decided to take action to provide a more stable revenue source for redevelopment
agencies (Coomes, 2009, p. 4).
In 1952, the state authorized the use of Tax-Increment Financing (TIF) financing
by RDA. TIF provided a steady stream of revenue to RDA and allowed them to bond
against future property tax revenues. Increases in property tax revenues, directly tied to
increases in assessed value, would have normally been divided among cities, counties,
school boards, and special districts. With TIF, all of the additional revenue produced in
an agency defined project area would now flow back to the RDA. Equally important,
using TIF did not require voter approval.

4
In 1976, the state legislature added another layer to RDA responsibility requiring
RDA to set aside 20% of TIF generated revenues for development of affordable housing
(Schuk, 2011a). By 1976, redevelopment agencies had all the tools necessary to
successfully combat blight within California communities. They had the power to use
eminent domain, to buy and sell property, to undertake massive projects without voter
approval, and to finance any project based upon a guaranteed future revenue stream.
In 1979, California voters approved Proposition 13. Proposition 13 made
significant changes to California property tax law. Most significantly, Proposition 13
capped property taxes for homeowners at 1% of the purchase price, and imposed strict
limits on the assessed value of property. As a result, the pool of property tax money
available to cities, counties, schools, and other local agencies became much smaller.
RDA suddenly became a significant source of revenue for both cities and counties. The
battle over remaining property taxes began. In an effort to capture revenue, RDA popped
up in cities around the state. Between 1975 and 1984 RDA revenue increased by to two
and a half times the 1975 baseline (Coomes, 2009, p. 5). With every new agency and
project area developed, tax revenues that otherwise would have been allocated to other
entities now diverted to RDA bank accounts.
The growth of redevelopment agencies, coupled with the increased assessed value of
land in RDA project areas, has resulted in a significant revenue shift at the local level.
RDA, which 35 years ago received 2% of total property tax revenue, in the 2010-11 fiscal
year received almost 12%. In 2008, TIF generated over $5.7 billion in property tax
revenue statewide (LAO, 2011). RDA activities have enabled significant gains in

5
affordable housing units, job creation, and infrastructure improvements across the state.
From 2006-07, California redevelopment officials claimed to have generated $40.8
billion in economic activity in through the generation of goods and services (CRA
Factsheet, 2009). The State Controller’s Office published information provided by RDA
across California that suggesting they were responsible for creating over 310,000 jobs
between 2000 and 2010 (State Controller, 2011, p. 24).
However, RDA have not been a complete success. A 1998 report by the Public
Policy Institute of California determined that RDA were responsible for creating only
51% of the TIF revenue they received. Perhaps more importantly, in the eight RDA
project areas that saw the fastest growth, over half the land was vacant. The report
questioned whether RDA were fulfilling their purpose of redevelopment or merely
assisting in general development (Dardia, 1998). RDA have also received criticism for
the types of projects they funded. Sacramento’s RDA came under scrutiny in 2010 after
providing $5.9 million to subsidize the building of a dance club, pizza restaurant, and
mermaid bar downtown on dilapidated K Street (City of Sacramento, 2011).
The significant portion of revenue directed towards RDA, along with the
questionable actions and results of some local agencies projects, set the table for RDA
reform and eventually their demise. A gridlocked state legislature coupled with strong
lobbying efforts from the California Redevelopment Association made true reform
impossible. To make matters worse, the state was not properly managing its fiscal
responsibilities. Over the years, state legislators raided redevelopment agencies’ funds to
cover state general fund budget deficits. In 2010, the California Redevelopment

6
Association launched a successful initiative measure, Proposition 22, which made it
unconstitutional for the state to borrow from redevelopment funds. Just a year later, the
state found itself in another budget crisis, and with a new governor, RDAs suddenly
found themselves on the chopping block.
Budget Crisis Forces Change
California entered the 2010-11 fiscal year with a structural budget deficit of over
$26.6 billion (Governor’s Budget Summary, 2012). Governor Jerry Brown’s January
2011 budget proposal include realignment of many services, including public safety and
mental health. It also included a proposal to ask voters to temporarily extend the sale tax
and vehicle license fee increases that were set to expire in 2011. Finally, the last major
component was eliminating both RDA and local enterprise zones. By eliminating RDA,
tax revenues that previously went to the RDA would now go back to school districts,
cities, counties, and special districts, resulting in a significant funding shift from local
government to the state’s general fund. As a result the state would no longer have to
backfill lost revenue to these local agencies. To make up for the loss of RDA, the
Governor proposed lowering the vote threshold to 55% for local bonds (Misczynski,
2011).
Changing the voter threshold for local bonds and putting a vote to raise taxes on
the ballot would require a 2/3-vote in both houses of the legislature. As the budget
deadline came closer, it was clear that the Governor would not be able to get the
Republican support necessary to pass the measure (Goldmacher, 2011). The legislature
provided an alternative solution that garnered both revenues from redevelopment and
7
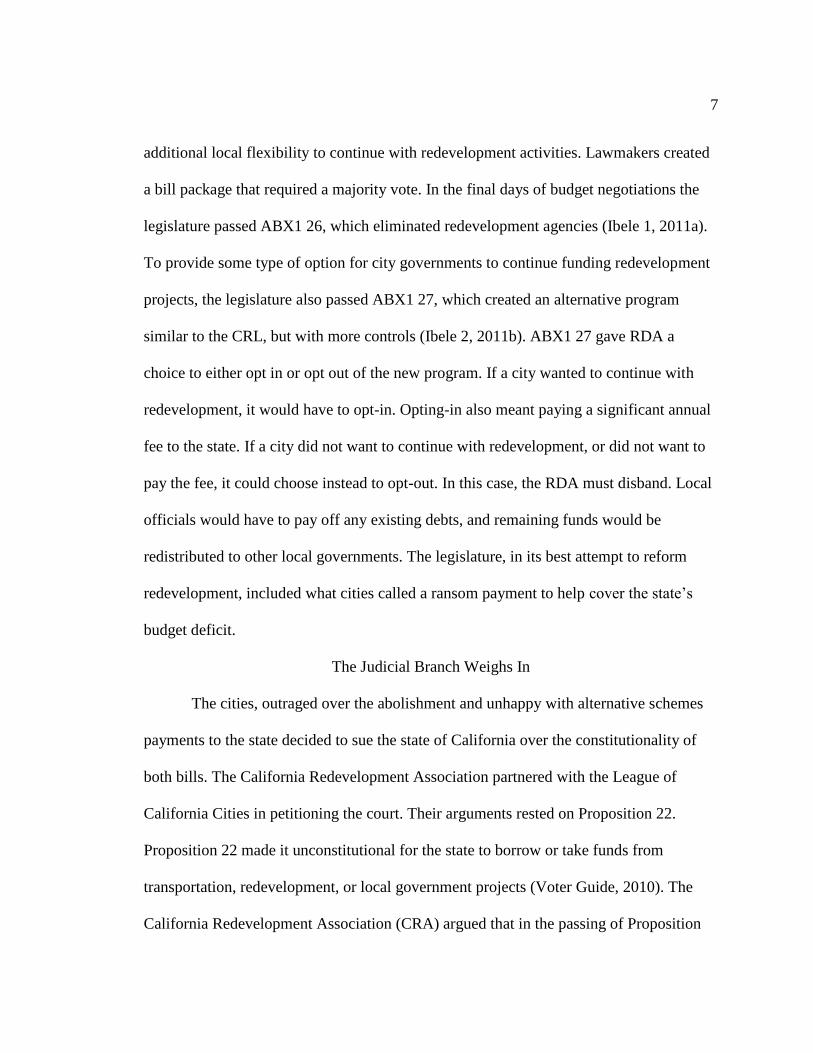
additional local flexibility to continue with redevelopment activities. Lawmakers created
a bill package that required a majority vote. In the final days of budget negotiations the
legislature passed ABX1 26, which eliminated redevelopment agencies (Ibele 1, 2011a).
To provide some type of option for city governments to continue funding redevelopment
projects, the legislature also passed ABX1 27, which created an alternative program
similar to the CRL, but with more controls (Ibele 2, 2011b). ABX1 27 gave RDA a
choice to either opt in or opt out of the new program. If a city wanted to continue with
redevelopment, it would have to opt-in. Opting-in also meant paying a significant annual
fee to the state. If a city did not want to continue with redevelopment, or did not want to
pay the fee, it could choose instead to opt-out. In this case, the RDA must disband. Local
officials would have to pay off any existing debts, and remaining funds would be
redistributed to other local governments. The legislature, in its best attempt to reform
redevelopment, included what cities called a ransom payment to help cover the state’s
budget deficit.
The Judicial Branch Weighs In
The cities, outraged over the abolishment and unhappy with alternative schemes
payments to the state decided to sue the state of California over the constitutionality of
both bills. The California Redevelopment Association partnered with the League of
California Cities in petitioning the court. Their arguments rested on Proposition 22.
Proposition 22 made it unconstitutional for the state to borrow or take funds from
transportation, redevelopment, or local government projects (Voter Guide, 2010). The
California Redevelopment Association (CRA) argued that in the passing of Proposition

8
22 the state lost the authority to take funding away from redevelopment agencies
(Supreme Court, 2012). The CRA believed this made it unconstitutional for the
legislature to abolish redevelopment, because in doing so the state took away
redevelopment funding. Secondly, the CRA argued that Proposition 22 also made it
unconstitutional to require a fee payment to the state to continue redevelopment
activities. The California Supreme Court agreed to hear the case.
On November 10, 2011, the court heard oral arguments from both parties. During oral
arguments, the plaintiff’s attorney Steven Mayer said that the worst possible outcome for
his clients (redevelopment agencies) would be for the courts to find ABX1 26
constitutional and ABX1 27 unconstitutional (Cal-Channel, 2011), as this result would
mean the end of redevelopment completely. Mayer believed that 90% of local
redevelopment agencies would rather share TIF revenue with the state then dissolve
(Dolan & Garrison, 2011). The voluntary program, although the cities did not like it, was
still a preferred option compared to having no redevelopment.
A month after hearing oral arguments, the Supreme Court rendered its decision.
Mayer’s worst fears came true. The court agreed that Proposition 22 did make it
unconstitutional for the state to take payments from cities through the voluntary program
provided by ABX1 27. The court did not agree, however, that Proposition 22 eliminated
the power of the legislature to end a program it created, and therefore validated the
constitutionality of ABX1 26 (Supreme Court, 2011). Redevelopment was dead.

9
Chaos Ensues
The Supreme Court decision was the worst possible outcome for California cities. By
suing the state over the fairness of the choice to opt-in or opt out, cities lost the ability to
have any type of redevelopment program. As a result, all redevelopment agencies
dissolved on February 1, 2012. Cities did not anticipate this result. Although they did not
like the “ransom” payment, they determined that losing redevelopment would be more
detrimental to their local community than having to pay the annual fee. As a result, many
cities had already publicly decided to opt in to the new voluntary program. San Diego’s
city council voted unanimously to pay over $69 million to participate in the program for
the first year (Showley, 2011). Los Angeles agreed to pay over $97 million to participate
in early August (Brasuell, 2011). Many other cities of various sizes followed suit.
In the aftermath of the Supreme Court Decision cities rushed to deal with the
legal ramifications to end their redevelopment agencies. Dissolving RDA meant cites had
to determine which organization should become the successor agency to the RDA, how to
disband the RDA’s assets, what to do with RDA staff, and how to manage the completion
of current projects. In focusing on these short-term decisions, cities have overlooked the
larger question; how are they going to continue to fund economic development? Tax
increment financing is no longer an option. There are other means to finance economic
development, but doing so requires a more piecemealed approach. Economic
development activities will need to match with specific projects. Financing tools often
overlooked because TIF via RDA provided an easier alternative will now have to be
considered.

10
Governor Jerry Brown has made it clear that he has no interest in delaying the
death of redevelopment (Van Oot, 2012). Senate President Pro Tem Darrel Steinberg has
stated that the goal is to focus on providing cities with new tools to fund economic
development (Van Oot, 2012). However, cities cannot expect a state legislative solution
in the immediate future. Any solution that does become available will not be nearly as
appealing as the previous CRL. In the meantime, cities are left to figure out how to
maintain the types of economic development activities that once rested within their local
RDA.
The rules to financing economic development have changed. Cities must now
reassess their approach. This thesis aims to assist in that process.

11
Chapter 2
LITERATURE AND METHODS
I present this chapter in three sections. First, I will define the term local economic
development and describe six categories of local economic development activities
previously performed by RDA. Then I will review eight financing methods local
governments currently have at their disposal. As previously mentioned, I could not find
academic research that focused on financing municipal economic development. As a
result, this thesis does not provide a traditional literature review. I will instead
incorporate specific examples of economic development activities previously performed
by RDA throughout the discussion on economic development activities. In describing
municipal financing methods, I will rely on legal code and other non-research sources to
build a basis for understanding.
In the final section of this chapter, I will explain the criteria alternatives matrix
methodology used and discuss why I chose this method over other methods of analysis. I
will also describe and define the criteria used to determine the applicability of each
financing method to each category of economic development activities.
Defining Economic Development
Economic development is the completion of activities that lead to job growth, job
development, or job stability (Blakely, 1989). Local economic development includes
strategies implemented by local governments in partnership with local organizations to
promote job growth and employment (CALED, 2012). While broad, both definitions
center around the ability of government to provide a climate that is conducive to

12
economic growth. Over the last 50 years, local government strategies for economic
development have shifted dramatically. Initially, local economic development activities
focused on providing monetary incentives to businesses, usually in the form of tax
incentives or subsidies (Greenwood and Holt, 2010). This singular method of economic
development is now just one of many economic development strategies used today.
The world has changed significantly since the early days of economic
development strategy. Globalization has changed the way the world does business.
Technology innovations provide instant and accurate information to businesses allowing
for more informed decision-making. While such innovations have led to new job
creation, they have also resulted in a global competition for securing jobs. As a result,
cities have broadened strategies used to encourage economic development within their
boundaries. Job training and affordable housing programs provide a qualified and stable
workforce. Infrastructure improvements and public space beautification efforts now help
lure businesses to communities that provide superior amenities and services. Cities not
only have to develop competitive advantages, but market those advantages effectively to
attract the type of investment needed to sustain economic growth. However, local
economic development is more of a movement than an established field (Blakely &
Bradshaw, 2002). There is no one theory or strategy for undertaking economic
development. Well-known methods of spurring economic development sometimes fail,
and discovery of new successful methods is common. Successful economic development
requires cities to develop a comprehensive strategy that considers their goals and unique

13
advantages. Cities then can choose from a plethora of economic development activities
based upon their strategy.
Redevelopment Agency Supported Economic Development Activities
Economic development activities varied greatly among California’s RDA. Each
agency developed an individual strategy for economic development based upon specific
community needs. While there is unlimited information available on specific economic
development activities initiated by RDA, I failed to locate any research categorizing these
activities into descriptive groupings. For simplicity, I have placed these activities into
five categories:
Targeted business incentives
Improvements to public lands
Infrastructure with revenue streams
Marketing and tourism promotion
Affordable housing development
Targeted business incentives provide direct financial incentives to businesses for
locating in a specific area and can take a variety of forms. RDA used their purchasing
power to buy-up unused or underutilized urban land. RDA could incentivize businesses
by selling land that the RDA owned below market value. Often this land also underwent
significant improvements or environmental hazard remediation between the time of
purchase by the RDA and the time of the sale. For example, the West Covina
Redevelopment Commission purchased a closed landfill site, partnered with the state to
properly remediate the site, then helped Big League Dreams ballpark company develop a

14
facility on the grounds (City of West Covina, 2012). RDA also assisted developers by
paying exaction and impact fees charged by the city and by offering grants for a variety
of purposes, from opening new businesses to façade improvements. The city of
Healdsburg offered incentives created to encourage restaurant and hotel businesses.
Incentives included a 75% reduction in water and sewer impact fees for restaurants and a
40% reduction for hotels that installed the latest water efficient fixtures (City of
Healdsburg, 2012).
RDA spent significant revenues on improving public space. Investment in
dilapidated public spaces helps lure potential businesses and improve property values in
the area Examples of public space investment include building sidewalks, repairing old
roads, streetscape enhancements, and open-space beautification. Richmond’s
redevelopment agency completed a streetscape project on 23rd
Street to improve
walkability, calm traffic, and promote a sense of identity that would help lure businesses
and encourage private investment (City of Richmond, 2012). RDA could also pay for
infrastructure improvements to undeveloped portions of a project area. Paying for the
development of water and sewer lines to new areas allowed for the creation of business
parks and new industrial centers that could occur without affecting customers’ rates.
West Sacramento recently financed a significant infrastructure improvement project in
the Bridge District. Using redevelopment funds, the city built roads, installed sewer,
water, and electrical lines, built sidewalks, installed street lighting, constructed a water
storage facility, and developed plans for a future park (West Sacramento, 2012)

15
RDA also developed projects that generated other revenue streams. By
collaborating with targeted businesses, RDA could finance certain types of public
buildings like convention centers and parking lots. Owned and operated by the RDA,
these facilities provided immediate benefits to hotels and surrounding retail businesses.
Profits from their operation would go back to the RDA to either fund future projects or
pay back the debt incurred from the project. Santa Clara’s redevelopment agency funded
the Santa Clara convention center, which led to the addition of a Hyatt hotel and other
businesses in the area (Schuk, 2011b).
Marketing and tourism promotion is a key component in business attraction for
many municipalities. RDA have participated in regional partnerships, paid for local
marketing efforts associated with attracting new businesses, and assisted in the promotion
of tourism. The Oceanside Redevelopment Agency worked to increase tourism in their
community by assisting in the building of the Oceanside Beachfront Resort Hotel, which
combined a boutique hotel, fractional timeshare units, and retail space on underused
property. The agency also used redevelopment funds to build new restroom facilities
along the beachfront (City of Oceanside, 2012).
Assisting in the creation of affordable housing was a key feature of the CRL.
Affordable housing creates a stable working class and helps diversify communities,
which then broadens the pool of businesses interested in the community. California’s
population grew 10% from 2000-2010 (Census 2010). To accommodate the growing
population, RDA played a significant role in housing development. In 2009, California

16
RDA constructed over 6,500 new housing units, renovated over 5,000 units, and provided
financial assistance to over 4,500 households (Campora, 2011).
Municipal Financing Mechanisms
There are a number of financing tools available to municipal governments as a
means of financing local economic development. Abbot, Detwiler, Jacobson, Sohagi,
and Steiner (2001) provide succinct descriptions of current municipal financing methods,
including:
General obligation bonds
Revenue bonds
Benefit assessment bonds
Mello-Roos community facilities district bonds
Limited obligation bonds
Infrastructure financing districts
Integrated financing districts
Certificates of participation
The next section will summarize the main components of each financing tool.
Bonds
There are many types of bonds available to municipalities. RDA dismantled, all
California bonds now require voter approval; however, the differences between each
bond are the level of voter approval required and the revenue source that supports the
bond. The source of bond revenue has significant implications on both the bond cost and
the likelihood that it will receive voter approval. There are many types of bonds

17
available, including general obligation bonds, revenue bonds, benefit assessment bonds,
Mello-Roos bonds, and limited obligation bonds.
General obligation bonds use revenue generated from an ad valorem property tax
rate that is in addition to the 1% property tax rate set by Proposition 13 on property
owners. Local governments may use general obligation bonds to construct, acquire, and
make improvements to real property including public buildings, roadways, school
facilities, and equipment (CDIAC, 2008). Because general obligation bonds require 2/3-
voter approval and because the revenue stream is tied to real property, they are the most
secure type of bond financing. A general obligation bond is backed by a guarantee to levy
ad valorem property taxes at a level sufficient enough to pay the interest and principal on
the bonds each year (CDIAC, 2006). As a result, general obligation bonds have lower
interest rates, lower overall costs, and higher bond ratings (Abbot, Detwiler, Jacobson,
Sohagi, Steiner, 2001).
Revenue bonds back public works projects, and rely on future revenues from
customers to pay for the bond. Revenue bonds require majority-voter approval. Cities,
counties, municipal or public corporations, or districts that are authorized to operate any
enterprise can administer them (California Government Code, 2012). Revenue bonds are
also used for financing stadiums, airports, parking garages, and other public facilities that
generate revenue.
Benefit assessment bonds use revenue generated by weighted charges on property
owners that receive the benefit of the project. The voting process also includes a
weighted ballot for approval based on who receives the benefit. Benefit assessments

18
allow for equitable distribution of costs based on who receives the benefit. Benefit
assessments occur within a defined area, called a benefit assessment district. The
financial markets that back revenue assessment bonds believe benefit assessment bonds
are riskier than other municipal bonds and do not rate or insure them. As a result, they
often come with higher interest rates and greater long-term costs (Senate Governance &
Finance Committee, 2011).
A local agency can issue a Mello-Roos Act bond for use within a created
Community Facilities District (CFD). Creation of a CFD occurs through a 2/3-vote of
landowners (if 12 or less) or a vote of all registered voters within the proposed district.
Creation of a CFD allows for collection of special tax imposed upon all property owners
within the district. Revenue from the special tax can be bonded against to finance public
infrastructure projects and acquisition. During the creation of a CFD, property owners or
registered voters within the district can also vote for a portion of the special tax to go
towards certain services, including policy, fire, and paramedic services, maintenance of
parks and open space, flood and storm protection services, and environmental cleanup
and remediation (Bort, 2006). Upon approval of registered voters only, revenue from the
CFD special tax can go towards recreation program services, library services, operation
and maintenance of museums and cultural facilities, and maintenance for elementary and
secondary schools (Bort, 2006).
Limited obligation bonds, which require 2/3-voter approval, require the city to
pledge future revenue from either property taxes or local sales taxes. Repayment of bond
funds comes from a specified source of municipal revenue. As a result, the issuing

19
agency is responsible for the debt, and the issuance of the debt directly effects the
agencies credit.(Abbot, Detwiler, Jacobson, Sohagi, Steiner, 2001). Limited obligation
bonds provide revenue for the same types of services as a general obligation bond does.
Financing Districts
There are two types of financing districts that cities may create. Infrastructure
Financing Districts are the only entity outside of RDA that allows for the use of TIF.
However, an Infrastructure Financing District is not allowed to divert TIF from schools, a
significant difference from RDA. Infrastructure financing districts bond against future
increment revenue to provide revenue for projects. There are two significant hurdles to
implementing an Infrastructure Financing District that deter from its use. First, the law
requires every local agency affected by the shift in property tax revenue from TIF to
agree to put their revenue to that purpose. This type of interagency agreement is difficult
to achieve, especially in areas with many overlapping agencies. If interagency parties
agree, then three votes of the citizens take place; a 2/3-voter approval to setup the district,
a two-thirds voter approval to approve the bond, and a majority vote to approve the
district’s appropriation limit (Senate Governance and Finance Committee, 2001).
Integrated Financing Districts allow private investors to loan money to a city or to
a developer to build the necessary infrastructure to get a new development project off the
ground. Integrated financing districts pay back the investor through a one-time
assessment placed upon the developments parcels that is contingent upon development
beginning (California Tax Data, 2002). Once revenues start flowing from the assessment,
the city repays the investor for the cost of infrastructure improvements. Integrated
20
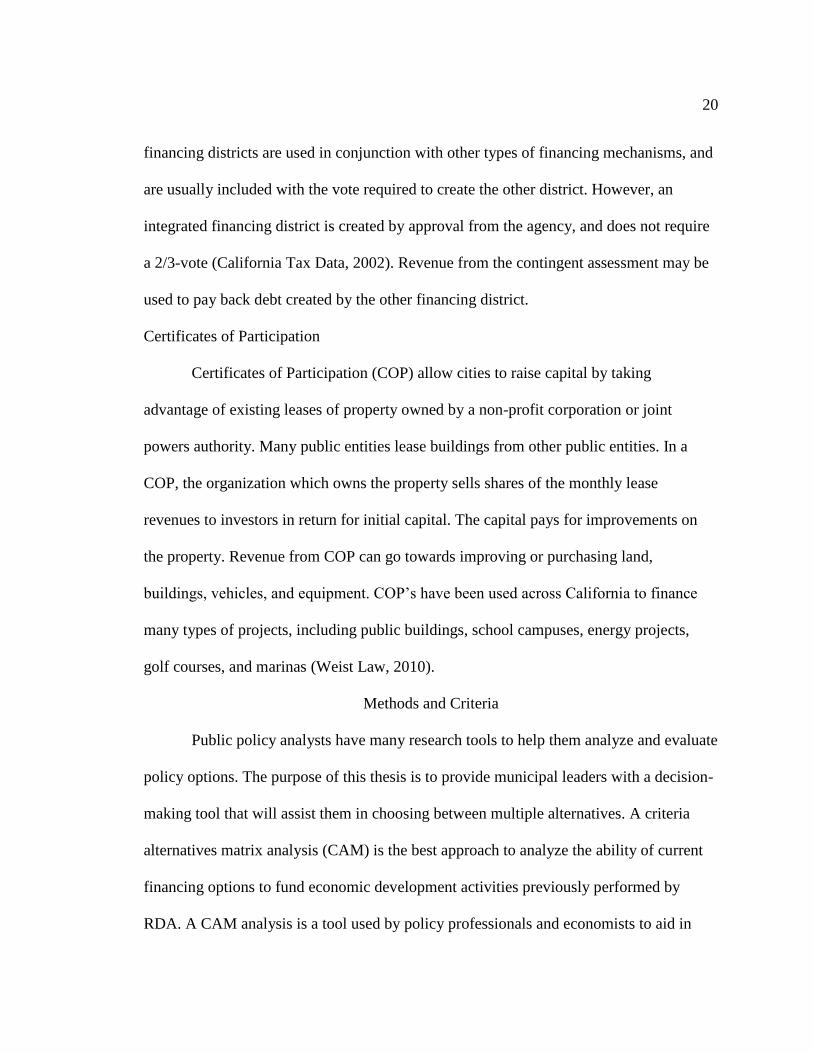
financing districts are used in conjunction with other types of financing mechanisms, and
are usually included with the vote required to create the other district. However, an
integrated financing district is created by approval from the agency, and does not require
a 2/3-vote (California Tax Data, 2002). Revenue from the contingent assessment may be
used to pay back debt created by the other financing district.
Certificates of Participation
Certificates of Participation (COP) allow cities to raise capital by taking
advantage of existing leases of property owned by a non-profit corporation or joint
powers authority. Many public entities lease buildings from other public entities. In a
COP, the organization which owns the property sells shares of the monthly lease
revenues to investors in return for initial capital. The capital pays for improvements on
the property. Revenue from COP can go towards improving or purchasing land,
buildings, vehicles, and equipment. COP’s have been used across California to finance
many types of projects, including public buildings, school campuses, energy projects,
golf courses, and marinas (Weist Law, 2010).
Methods and Criteria
Public policy analysts have many research tools to help them analyze and evaluate
policy options. The purpose of this thesis is to provide municipal leaders with a decision-
making tool that will assist them in choosing between multiple alternatives. A criteria
alternatives matrix analysis (CAM) is the best approach to analyze the ability of current
financing options to fund economic development activities previously performed by
RDA. A CAM analysis is a tool used by policy professionals and economists to aid in

21
decision-making. CAM analyses use predetermined criteria to measure the relative
performance of policy alternatives (Munger, 2000). Each alternative is evaluated based
on its ability to meet decided-upon criteria, thus providing decision-makers with a clear
picture of how each alternative meets their needs. Alternatives that meet the most criteria
are considered the more favorable option.
CAM analysis does not provide a singular best alternative. Rather, it
evaluates each alternative based upon criteria determined by the analyst. It is possible that
multiple alternatives are viable options. Additionally, the criteria may or may not be
weighted based upon its relative importance in the decision-making process. Because the
purpose of this thesis is to provide a baseline analysis of currently available financing
methods, each of the four criteria received equal weighting. Additionally, analysis can be
either qualitative or quantitative in its approach, depending on the criteria used and the
rationale for completing the analysis. This thesis will take a qualitative approach. Using
qualitative analysis best suits the criteria and provides greater applicability as it does not
constrain its findings to individual communities.
Earlier in this chapter, I identified five categories of economic development activities
previously funded by RDA. I also identified eight financing methods currently available
to municipalities. For each category of economic development activities, I will evaluate
the applicability of each of the eight financing methods. I will evaluate each financing
method on four criteria. The criteria are:
Statutory purpose
Political feasibility

22
Municipal cost avoidance
Functional capability
I will define each criterion, explain why it is important to consider, and describe how
I will measure it. I will judge criterion in the CAM analysis independently of one another.
Even if a project fails the statutory purpose test, I will still judge the other criterion based
upon their definition.
It is important to note that cities across California face unique challenges and
have unique advantages. The chosen criteria provide a baseline approach to considering
each financing tool. Individual municipalities should carefully consider their strengths
and weaknesses through the completion of a strategic economic development plan prior
to determining a course of action.
Statutory Purpose
Statutory requirements limit the use of each financing tools. To that end, I will
first evaluate whether the financing method is a legally viable option for each Economic
development activity. Economic development activities that are legally acceptable uses
for each financing tool will be marked with a check. If current statute for the financing
method does not allow for the use of the economic development activity, I will mark it
with an X.
Political Feasibility
Many local financing tools require voter approval for use. Political feasibility is
an important consideration when choosing a financing method for an economic
development activity. For the purposes of this study, I will consider voter approval

23
requirements as the indicator for political feasibility. Politically feasible financing
methods will require no voter approval or only a simple majority vote for approval.
Financing options that require a two-thirds vote or multiple votes are less politically
feasible. I will mark politically feasible financing methods with a check, and will mark
methods that are not feasible with an X. Because some financing mechanisms have
multiple options for voter approval, mechanisms with conflicting choices will be marked
with an equals sign.
Municipal Cost-Avoidance
Decision makers will favor financing methods that do not affect general fund
revenues. Cities are responsible for providing police, fire, library, park, public works, and
waste services to residents (ILG, 2009). After appropriating money to provide these
services, municipalities have little discretionary revenue left to spend on economic
development. To that end, I will define municipal cost-avoidance as projects that do not
require direct municipal investment. Financing methods that use special taxes,
assessments, and fees are more successful in achieving cost-avoidance than those that
require general fund revenues or take away from future general fund revenues. If the
financing method has no direct municipal costs, I will mark it with a check. If the
financing method has direct municipal costs, I will mark it with an X.
Flexibility
Flexibility is important in economic development. Not all financing mechanisms
allow for flexibility in use. I define flexibility as the extent to which a financing method
can complete multiple projects with a single implementation action, or can finance both

24
infrastructure and operational costs. Flexible financing methods will allow for multiple
projects to take place or for the financing to include both infrastructure and operational
costs. I will mark methods that meet this criterion with a check. Inflexible options will
only allow singular development projects to take place, and I will mark those with an X.
Conclusion
In this chapter, I have described six types of economic development activities
previously completed by RDA. I have also defined eight financing methods local
governments currently have available to them to pay for projects. I have outlined and
described the use of a qualitative CAM analysis to evaluate each financing methods
overall applicability to each economic development activity using four equally weighted
criteria. Chapter three will provide the completed CAM analysis and describe the results.
25
Chapter 3
ANALYSIS
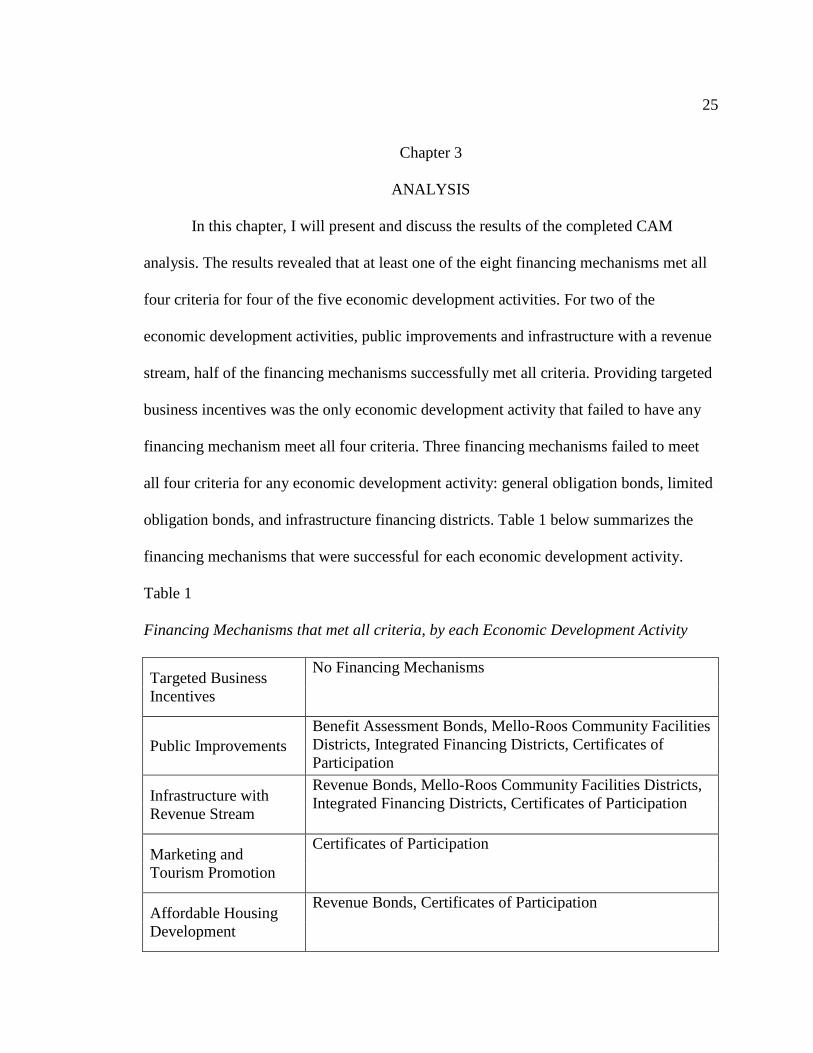
In this chapter, I will present and discuss the results of the completed CAM
analysis. The results revealed that at least one of the eight financing mechanisms met all
four criteria for four of the five economic development activities. For two of the
economic development activities, public improvements and infrastructure with a revenue
stream, half of the financing mechanisms successfully met all criteria. Providing targeted
business incentives was the only economic development activity that failed to have any
financing mechanism meet all four criteria. Three financing mechanisms failed to meet
all four criteria for any economic development activity: general obligation bonds, limited
obligation bonds, and infrastructure financing districts. Table 1 below summarizes the
financing mechanisms that were successful for each economic development activity.
Table 1
Financing Mechanisms that met all criteria, by each Economic Development Activity
Targeted Business
Incentives
No Financing Mechanisms
Public Improvements
Benefit Assessment Bonds, Mello-Roos Community Facilities
Districts, Integrated Financing Districts, Certificates of
Participation
Infrastructure with
Revenue Stream
Revenue Bonds, Mello-Roos Community Facilities Districts,
Integrated Financing Districts, Certificates of Participation
Marketing and
Tourism Promotion
Certificates of Participation
Affordable Housing
Development
Revenue Bonds, Certificates of Participation

26
Out of 40 individual tests between economic development activities and
individual financing mechanisms, 12 tests met all four criteria. Additionally, 17 tests
successfully met three of the four criteria. The two criteria least met were statutory fit and
political feasibility. Half of the individual tests (20) failed to meet the statutory fit
criteria, and 15 of the individual tests failed to meet the political feasibility test. Five of
40 matches failed to meet the municipal cost test (limited obligation bonds failed for all
five activities), and all of the criteria, based on the definition of flexibility, met the
flexibility criteria. I will begin this chapter by explaining the analysis. I will then
highlight successes, failures, and near successes for each economic development activity.
The CAM Analysis
To test the criteria against each financing mechanism, I developed a series of
tables for each economic development activity. Throughout the chapter, I provide
individual tables for each economic development activity with discussion on each. A
summary of all the results is at the end of the chapter. For each economic development
activity, I tested the four criteria against each financing mechanism. In each table, the
first column lists the financing mechanisms, and the top row lists the four criteria. When
a financing mechanism successfully met the criteria for a given economic activity, I
placed a check mark in the corresponding cell. When a financing mechanism failed to
meet the criteria for an economic development activity, I placed an “X” in the
corresponding cell. For some of the political feasibility tests, whether or not the financing
mechanism met the criteria, depended on the implementation of the mechanism. Because

27
the answer was dependent upon its implementation method, I placed an equal (=) sign in
the corresponding cell.
I tested each criterion independently of one another. For example, suppose a
financing mechanism did not meet the statutory fit criteria for an economic development
activity. This indeed was the case for half of the tests. Even though the economic
development activity was not a legal use for the financing mechanism, I considered the
other three criteria as if it were. By keeping the criteria independent of one another, the
tables provide a few of tests that were nearly successful. I consider the tests that were
nearly successful as areas of opportunity for leaders and decision makers at all levels of
government. Changes in state law would result in more financing options meeting all four
criteria.
Results
Targeted Business Incentives
Targeted business incentives were the only activity that did not meet all four
criteria for any financing mechanism. Current law does not allow for any of the financing
mechanisms considered to provide direct incentives for businesses building or relocating,
thus the statutory fit test failed for each mechanism. Financing mechanisms can only
provide capital for projects that directly affect public good. Municipal financing
mechanisms must provide a tangible benefit to the public. Promoting job creation through
direct incentives to businesses provides indirect benefits, but not all citizens benefit from
a new business locating within their city. Revenue bonds, benefit assessment bonds, and
Mello-Roos CFD met all criteria except the statutory fit test. The legislature could amend

28
the laws that govern these financing mechanisms to include targeted business incentives.
However, research shows these incentives do not provide long-term economic benefits.
Table 2 below shows the complete results for all targeted business incentive tests.
Table 2
Targeted Business Incentives
Targeted Business
Incentives
Fits
Statutory
Purpose?
Politically
Feasible?
Municipal
Cost
Avoidance?
Flexible in
Application?
General obligation bonds X X
Revenue bonds X
Benefit assessment bonds X
Mello-Roos Community
Facilities Districts X =
Limited obligation bonds X X X
Infrastructure financing
districts X X
Integrated financing
districts X =
Certificates of participation X
Public Improvements
Public improvement projects have four of the eight financing mechanisms that
met all four criteria. The financing mechanisms that met all four criteria are benefit
assessment bonds, Mello-Roos CFD, integrated financing districts, and certificates of
participation. The success of both the Mello-Roos CFD and the integrated financing
district depends upon their method of implementation. Both of these methods received an

29
equals sign for political feasibility, as the voting requirements are depend upon the
method of formation.
Three financing mechanisms successfully met three of the four criteria. General
obligation bonds and infrastructure financing districts only failed the political feasibility
test. Revenue bonds failed only the statutory purpose test. Revenue bonds are for projects
that have a direct revenue stream. Public improvements do not have a revenue stream.
Limited obligation bonds only met two of the four criteria. Table 3 below shows the
complete results for all public improvement tests.
Table 3
Public Improvements
Public
Improvements
Fits
Statutory
Purpose?
Politically
Feasible?
Municipal
Cost
Avoidance?
Flexible in
Application?
General obligation bonds X
Revenue bonds X
Benefit assessment bonds
Mello-Roos Community
Facilities Districts =
Limited obligation bonds X X
Infrastructure financing
districts X
Integrated financing
districts =
Certificates of participation

30
Infrastructure with Revenue Stream
Infrastructure projects that have a dedicated revenue stream found success with
multiple financing mechanisms. Revenue bonds, Mello Roos CFD, integrated financing
districts, and certificates of participation met all four criteria for this economic
development activity. Intuitively, revenue bonds are the most logical choice for any
project that results in a dedicated revenue stream. Revenue bonds are for projects that
have direct revenue streams. However, the other successful financing mechanisms
provide viable options as well.
General obligation bonds and infrastructure financing districts were nearly
successful, failing only to meet the political feasibility test. Both of these financing
mechanisms failed the political feasibility test because of the 2/3-voter approval
requirement. Benefit assessment bonds were also nearly successful, failing the statutory
fit test. Limited obligation bonds failed both the political feasibility test and the municipal
cost avoidance test. Table 4 below shows the complete results for all infrastructure with
revenue stream tests.

31
Table 4
Infrastructure with Revenue Stream
Infrastructure with
Revenue Stream
Fits
Statutory
Purpose?
Politically
Feasible?
Municipal
Cost
Avoidance?
Flexible in
Application?
General obligation bonds X
Revenue bonds
Benefit assessment bonds X
Mello-Roos Community
Facilities Districts =
Limited obligation bonds X X
Infrastructure financing
districts X
Integrated financing
districts =
Certificates of participation
Marketing and Tourism Promotion
A certificate of participation was the only financing mechanism that passed all
four criteria for marketing and tourism promotion. Funds from a certificate of
participation can purchase land, build facilities, and purchase equipment. Although funds
cannot pay for direct marketing initiatives, they can fund the building of facilities that
promote tourism within a community. For example, a city can expend funds from a
certificate of participation on the purchase of land, the building of a museum on that land,
and the purchase of the equipment needed to operate the facility. Certificate of
participation funds can also fund the building of a visitors’ center.

32
Five financing mechanisms met three of the four criteria for marketing and
tourism promotion. General obligation bonds and Mello-Roos CFD failed the political
feasibility test because of the 2/3-voter approval requirement. However, it is worth noting
that through the 2/3-voter approval process of creating a new CFD, operations and
maintenance costs of museums and cultural facilities may be included. Revenue bonds,
benefit assessment bonds, and integrated financing districts failed the statutory fit test.
The statutes governing these financing mechanisms do not allow for this type of
economic development. Limited obligation bonds failed all criteria except the flexibility
criteria. Table 5 below shows the complete results for all marketing and tourism
promotion tests.
Table 5
Marketing & Tourism Promotion
Marketing and
Tourism Promotion
Fits
Statutory
Purpose?
Politically
Feasible?
Municipal
Cost
Avoidance?
Flexible in
Application?
General obligation bonds X
Revenue bonds X
Benefit assessment bonds X
Mello-Roos Community
Facilities Districts X
Limited obligation bonds X X X
Infrastructure financing
districts X X
Integrated financing
districts X =
Certificates of participation

33
Affordable Housing
Affordable housing development was a key component of redevelopment. One of
the key concerns in the aftermath of the dissolution of RDA was how to finance
affordable housing. The results show two financing mechanisms allow for the
development of affordable housing. Both revenue bonds and certificates of participation
passed all four criteria for affordable housing. The rental revenues received from
affordable housing development support the revenue bond or certificate of participation.
A city may issue a public enterprise revenue bond to finance affordable housing. Only
majority voter-approval is required for revenue bonds, and no vote is required for use of
the certificate of participation.
Four of the eight financing mechanisms successfully met three of the four criteria.
General obligation bonds failed to meet the political feasibility test because of the 2/3-
voter approval needed. Benefit assessment districts, Mello-Roos CFD, and integrated
financing districts failed to meet the statutory fit test.
The other two financing mechanisms had multiple failures. Infrastructure
financing districts did not meet the statutory fit test or the political feasibility test.
Limited obligation bonds failed all tests except the flexibility test. Table 6 below shows
the complete results for all affordable housing tests.

34
Table 6
Affordable Housing Development
Affordable Housing
Development
Fits
Statutory
Purpose?
Politically
Feasible?
Municipal
Cost
Avoidance?
Flexible in
Application?
General obligation bonds X
Revenue bonds
Benefit assessment bonds X
Mello-Roos Community
Facilities Districts X =
Limited obligation bonds X X X
Infrastructure financing
districts X X
Integrated financing
districts X =
Certificates of participation
Near Successes for some Financing Mechanisms
Many of the financing mechanisms were successful in three out of the four
criteria. 17 of the 40 potential matches successfully achieved three of the four criteria
(including those with ‘=’). In each of these cases, failure was attributable to two criteria,
statutory fit or political feasibility. General obligation bonds met three of the four criteria
for all of the economic development activities, with the exception of targeted business
incentives. General obligation bonds failed to meet the political feasibility criteria for all
economic development activities because of the 2/3-voter requirement. Similarly,
infrastructure financing districts failed to successfully meet all four criteria for any

35
activity because they could not meet the political feasibility criteria. Benefit assessment
bonds could be a successful financing mechanism for all activities if they could meet the
statutory purpose criteria.
Meeting the political feasibility test was difficult. Revenue bonds, benefit
assessment districts, and certificates of participation were the only options that required
less than 2/3-voter approval. Integrated financing districts (although they do not require a
direct vote) are implemented in conjunction with other financing districts. As a result,
their implementation is dependent upon a successful 2/3-voter approval of the other
financing district.
Conclusion
In this chapter, I presented the CAM analysis. The results revealed that financing
mechanisms currently exist for all of the economic development activities previously
undertaken by redevelopment agencies with the exception of providing targeted business
incentives. 12 of the 40 potential matches between financing mechanisms and economic
development activities met all four criteria, and an additional 17 criteria met three of the
four criteria.
Before conducting the analysis, I predicted I that in addition to targeted business
incentives, marketing and tourism promotion and affordable housing development would
be difficult to finance; however, this was not the case. Both revenue bonds and
certificates of participation can finance the development of affordable housing. Future
funds from either the sale or rent of the affordable housing pay for the initial capital.
Similarly, funds collected within a Mello-Roos CFD may cover the operations and

36
maintenance costs of museums or cultural facilities, if specifically approved during a 2/3-
voter approval process. Certificates of participation can finance the building of such
facilities, as well as equipment used at these facilities.
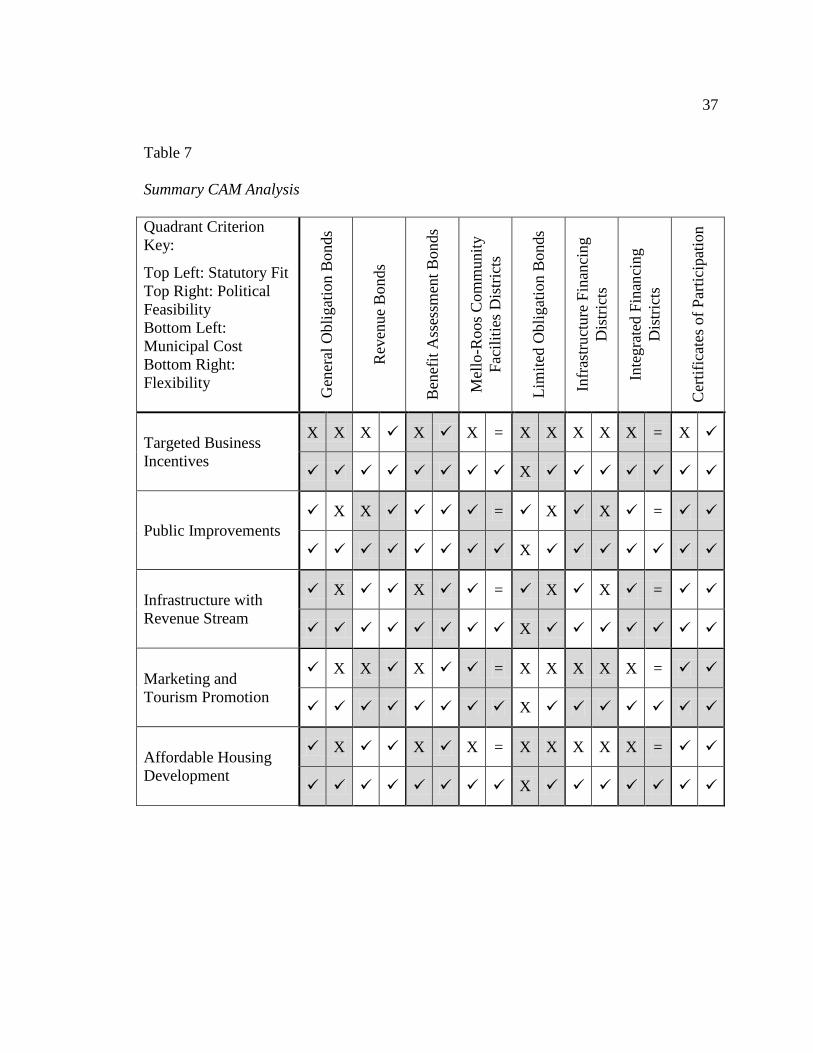
The summary analysis at the end of the chapter provides the complete test results
(See Table 7). The first column on the left lists the five economic development activities.
The top row lists each of the eight financing mechanisms. I split corresponding cells into
four quadrants, one for each criterion. Economic development activities and financing
mechanisms intersect at a cell that describes the relative fit to each criterion. This view
provides a complete picture of the overall match between all available financing
mechanisms and economic development activities previously undertaken by RDA. The
top left quadrant represents the first criteria, fit to statutory purpose. The top right
quadrant represents the second criteria, political feasibility. The bottom left quadrant
describes the third criteria, municipal cost. The bottom right quadrant represents the
forth criteria, flexibility. Criteria are marked the same as in the individual tables
presented previously.
The results suggest that municipal agencies already have the necessary tools to
continue financing economic development activities once financed through RDA by tax
increment financing. The next chapter will consider the truth in this assertion, and discuss
the implications of these results in the broader context of municipal economic
development.
37
Table 7
Summary CAM Analysis
Quadrant Criterion
Key:
Top Left: Statutory Fit
Top Right: Political
Feasibility
Bottom Left:
Municipal Cost
Bottom Right:
Flexibility
Gen
eral
Obli
gat
ion B
onds
Rev
enue
Bonds
Ben
efit
Ass
essm
ent
Bonds
Mel
lo-R
oos
Com
munit
y
Fac
ilit
ies
Dis
tric
ts
Lim
ited
Obli
gat
ion B
onds
Infr
astr
uct
ure
Fin
anci
ng
Dis
tric
ts
Inte
gra
ted F
inan
cing
Dis
tric
ts
Cer
tifi
cate
s of
Par
tici
pat
ion
Targeted Business
Incentives
X X X X X = X X X X X = X
X
Public Improvements
X X = X X =
X
Infrastructure with
Revenue Stream
X X = X X =
X
Marketing and
Tourism Promotion
X X X = X X X X X =
X
Affordable Housing
Development
X X X = X X X X X =
X
38
Chapter 4
CONCLUSION
The dissolution of RDA has hurt local officials’ ability to finance economic
development. The structure and powers of RDA made it easy to finance most economic
development activities within California cities. In California’s post RDA era, municipal
leaders will rely on financing tools that are limited in applicability and more difficult to
implement because of voting requirements. In this thesis, I used a CAM analysis to
evaluate the remaining financing mechanisms that local governments have in their
toolbox. I used criteria that would reveal which financing mechanisms were viable
alternatives to complete economic development activities once undertaken by RDA.
The results presented two important points. First, none of the current financing
mechanisms has the same flexibility that existed with TIF through RDA. Second,
financing mechanisms exist for nearly all of the economic development activities
evaluated. Providing targeted business incentives is the only economic development
activity that has no appropriate financing tool. However, even for some of the other tools
that did have matches (e.g., affordable housing development or marketing and tourism
promotion) the financing options available were limited to specific activities that focused
on the construction of real assets. There are no financing mechanisms to fund the
‘intangible’ activities of RDA including direct marketing, business attraction, and
development incentives.
Three themes surfaced during this research project. First, financing economic
development will require extensive planning by municipal governments. Second,

39
economic development is squishy, and limited resources will require future economic
development strategies to prove their value to a broader constituency. Third, changes in
state laws could greatly enhance select municipal financing tools. This chapter will
explore these three themes in the context of the results, suggest areas in which additional
research should focus, and make recommendations for policy makers at all levels of
government.
Economic Development Can Continue
The most obvious result of the CAM analysis is that financing mechanisms exist
for economic development activities and can produce tangible results. Cities are still able
to finance building roads, parks, sidewalks, city halls, sports arenas, and affordable
housing developments. Cities can no longer use financing to provide direct incentives to
businesses, engage in direct marketing, or attract businesses. Municipal leaders will have
to make difficult decisions to determine which intangible activities they want to continue
and why. For construction-based economic development activities, the challenge is not
finding a method to finance future economic development, but to find the time, effort,
and money needed to approve the financing. Municipal staff, community leaders, and
elected officials will have to invest more time planning for economic development to be
successful.
Seven of the eight financing mechanisms require some level of voter approval.
Achieving voter approval requires significant effort from the municipality.
Communication about project financing will need to be carefully developed, clearly
articulated, and well publicized. Cities that struggle to maintain citizen trust will face

40
unique challenges to obtain voter approval. In many cases, citizen trust will closely
correlate to the municipality’s record of fiscal management. Cities will need to address
current spending problems before looking forward to plan economic development
activities.
Planning will be paramount to economic development within municipalities.
Previously, TIF allowed an entire city area to undergo economic development projects.
None of the financing mechanisms reviewed provides the breadth of activity that TIF did
and none of these financing mechanisms are short term obligations. No city, regardless of
the level of citizen trust in government, would consider or approve a new tax or fee to
finance a project at every city election. Municipalities will have to make choices about
activities that are most important to engage in and finance. With limited choices,
municipal leaders will have a greater responsibility to ensure decisions match the needs
of the community.
Cities will have to design local economic development strategies with
involvement from municipal leaders, business leaders, and citizens. Collaboration and
increased public-private partnerships will be necessary to implement new strategies.
Municipal leaders will have to understand and accept that economic development will
occur more slowly than before. In developing local strategies, municipal leaders will have
to fully understand the landscape in which they operate. A more focused understanding of
community needs will have to take precedent over elected officials’ desires. If cities
increase institutional knowledge of their community and economic development strategy,
41
it’s likely they will make better decisions about economic development. One step to
increasing knowledge on economic development is to make it less squishy.
Making Economic Development Less Squishy
Economic development is inherently squishy. No existing formula of activities
guarantees successful economic growth within a community. One of the advantages of
TIF for municipalities was that it allowed them to engage in many different activities that
promote economic development within a project area. The major disadvantage was that
no research showed which strategies worked. Similar methods, such as providing targeted
incentives to business, were present in nearly all communities without any evidence that
proved such incentives had a positive impact.
During development of this thesis, the Legislative Analyst’s Office submitted a
report to the legislature that identified the need for more certainty in economic
development. The report concluded that there were tools to finance economic
development, but there was little evidence or consensus on which economic development
activities worked (LAO, 2012). The report cited concern for targeted incentives to
businesses, suggesting they are ineffective and unnecessary. As one of the first economic
development activities that municipalities engaged in, targeted business incentives appear
to be no more than bribes that result in expensive short-term gains to communities. The
problem with bribes is that they work, at least in the short term. As long as direct
incentives continue to lure businesses, municipal agencies will continue to use them.
The LAO report also focused on regulatory reform as an area that policy makers
should focus on to promote economic development. This recommendation is helpful for

42
state policy-makers, but does little to help municipal leaders responsible for
implementing local economic development strategies. There are two strategies not
mentioned by the LAO that are worth consideration by municipalities: (1) improving
service delivery and (2) improving local vision.
Cities are responsible for providing a number of services to businesses, including
permit review and approval, regulatory compliance, fee determinations, and utilities. In
the private sector, efficiency is incredibly important. In the post-RDA California, many
municipalities will not be able to offer direct business incentives. The only way to gain a
competitive advantage over other cities will be to offer a level of service that is superior
to others. Creating a culture of service within a municipal organization is hard. However,
cities that can create a culture of service and build positive relationships with potential
and existing businesses will likely achieve greater success than those who cannot.
To create a culture of service, a city must have a clear vision shared by municipal
staff and citizens. Having a community vision is different from having an economic
development plan. Simon Sinek (2009) suggests that people do not buy what you do, but
why you do it. Few cities have a clearly defined vision that is visible not only through
organization, but throughout the city as well. Cities’ websites offer plenty of information
about their economic development departments, but rarely explain why a city is different
from its neighboring communities. From a properly defined vision, a city can then
determine how it will work towards that vision and decide what specific action can be
taken. This vision should all be visible by visiting the city’s website to any business
looking to start, relocate, or expand.

43
Researchers and organizations that promote good government at the local level
have an important role to play. Future research should explore which economic
development strategies work. Additional research should also seek to clarify best
practices for public participation in economic development and successful public-private
partnerships. Non-profit organizations dedicated to this type of work should provide
resources and consultative services to local governments, and help disseminate best
practices.
Legislative Changes Could Have Significant Impacts
In my analysis, statutory fit was the criterion that failed most often. State
legislators could make changes to law that would improve local government financing
alternatives for economic development projects. Two areas are worth consideration. The
first is the voter threshold for some municipal bonds and infrastructure financing districts.
The 2/3-voter approval necessary is a difficult hurdle to overcome. In these cases, local
governments create bonds against future tax revenue. Currently, if a city wanted to take a
tax increase measure to the voters to enhance the general fund, only a majority vote is
required. However, if a city wanted voters to approve a special tax to fund a new
infrastructure project, it must achieve 2/3-voter approval.
Lowering the threshold to a simple majority may not be the best alternative, as the
average citizen is not aware of a city’s debt obligations. However, lowering the threshold
to a more reachable number somewhere in the middle could provide added flexibility to
cities without creating a debt-approving spree. Any changes to current voting
requirements tied to issuing debt would require 2/3-voter approval at a statewide election,

44
adding another layer of complexity. The legislature would need to achieve 2/3-voter
approval in both houses to put this measure on the ballot. Reaching this level of
consensus is highly unlikely with the current political division in the legislature. Special
interests groups could also put a measure on the ballot, but would likely face significant
opposition from supporters of the original measures that created the limits.
State legislators could also take other actions to help municipalities increase the
flexibility of existing financing mechanisms. Infrastructure financing districts would be
an appealing option for cities if they were not so difficult to create. Currently, they
require a vote to be created, a vote to approve debt issuance, and agreement among all
local entities affected by the creation. The level of coordination and collaboration is
difficult and time consuming.
Limited obligation bonds on dedicated revenues would be more appealing if they
did not negatively affect a city’s credit rating. Even when tied to a specific source of
revenue, limited obligation bonds are municipal debt obligations. Allowing other
organizations, such as non-profit corporations, to receive the tax and use the bond would
remove municipal liability. This change would also require legislative action.
Increasing the types of services that Mello-Roos taxes can pay for could include
tourism promotion operations and possibly benefit many coastal and rural towns. These
special taxes currently can pay for museums and cultural center operations with 2/3-voter
approval. Legislation could also allow for the building of these facilities in addition to the
operation of them. Incorporating even a few of these changes would go a long way for a
city’s ability to finance future economic development activities.

45
Conclusion
Financing economic development will be harder without redevelopment, but that
is not necessarily a bad thing. By forcing cities to improve planning, have a more clearly
defined vision, increase collaboration, and provide better service, the long-term economic
outlook for California’s communities may indeed be brighter than before. When cities
have to use general fund dollars to provide targeted business incentives, they will also
have to think about what other services that revenue could provide to its citizens.
The relationship between state and local governments in California has been
tumultuous for decades. If the state wants to provide cities with more options while still
protecting taxpayer dollars, changes to some of the financing mechanisms analyzed in
this thesis would give municipalities greater flexibility in financing economic
development. Additional research would help solidify economic development strategies,
and cities need more educational resources that help them learn how to plan, collaborate,
and promote participation in local economic development.

46
Work Cited
Abbott, W., Detwiler, P., Jacobson, M., Sohagi, M., and Steiner, H. (2001). Exactions
and Impact Fees in California. Point Arena: Solano Press
Blakely, Edward. (1989). Planning Local Economic Development: Theory and Practice.
Newbury Park: Sage Publications.
Bort, Daniel (2006). An Introduction to California Mello-Roos Community Facilities
Districts. Orrick, Herrington, & Sutcliffe.
Brasuell, James. (2011, August 10). LA Votes to Pay $97 Million, Keep Redevelopment
Agency Alive. Los Angeles Curbed. Retrieved February 7, 2012 from
http://la.curbed.com/archives/2011/08/la_votes_to_pay_97_million_keep_its_rede
velopment_agency_alive.php
California Association for Local Economic Development. (2012). What is Economic
Development? Retrieved February 5, 2012 from
http://www.caled.org/resources/what-economic-development
California Channel. (2011, November 10). California Supreme Court Oral Arguments,
California Redevelopment Association v. Matosantos. Retrieved November 10,
2011 from http://www.calchannel.com/channel/viewvideo/3137
California Debt and Investment Advisory Commission. (2006). California Debt Issuance
Primer Handbook. Retrieved February 28 2012 from
http://www.treasurer.ca.gov/cdiac/debtpubs/handbook.pdf

47
California Debt and Investment Advisory Commission. (2008). An Overview of Local
General Obligation Bond Issuance Trends 1985-2005. Retrieved February 28
2012 from http://www.treasurer.ca.gov/cdiac/publications/trends.pdf
California Legislative Analyst Office. (2012, March 7). Local Economic Development
Tools. Retrieved March 25, 2012 from
http://www.lao.ca.gov/handouts/state_admin/2012/Local_Economic_Developmen
t_3_7_12.pdf
California Legislative Analyst’s Office. (2011, February 8). Should California End
Redevelopment Agencies? Retrieved January 8, 2011 from
http://www.lao.ca.gov/analysis/2011/realignment/redevelopment_020911.aspx
California Codes. (2012). California Government Code Section 54300-54316. Retrieved
February 5, 2012 from http://www.leginfo.ca.gov/calaw.html
California Redevelopment Association. (2012). Frequently Asked Questions. Retrieved
January 8, 2012 from
http://www.calredevelop.org/tools/what_is_redevelopment.aspx
California Secretary of State’s Office. (2011). Analysis of Proposition 22. California
Voter Guide. Retrieved December 27, 2011 from
http://www.voterguide.sos.ca.gov/propositions/22/analysis.htm
California State Controller’s Office. (2011, November 2). Community Redevelopment
Agency Annual Report. Retrieved January 15, 2012 from
http://www.sco.ca.gov/Files-ARD-Local/LocRep/RDA_fy0910publication.pdf

48
California State Senate Governance and Finance Committee. (2001, November 30).
Infrastructure Finance Districts. Retrieved January 15, 2012 from
http://senweb03.senate.ca.gov/committee/standing/GOVERNANCE/IFDINFOR
MATION.HTM
California State Senate Governance and Finance Committee. (2011, September).
Assessing the Benefits of Benefit Assessments. Retrieved January 15, 2012 from
http://sgf.senate.ca.gov/sites/sgf.senate.ca.gov/files/Assessing%20the%20Benefits
%20of%20Benefit%20Assessments%20801-S.pdf
California Supreme Court. (2011, December 29). Opinion of the Supreme Court in the
matter of California Redevelopment Association v. Matosantos. Retrieved January
15, 2012 from http://www.courtinfo.ca.gov/opinions/documents/S194861.PDF
California Tax Data. (2002). Factsheet: Integrated Financing District. Retrieved
February 29, 2012 from
http://www.californiataxdata.com/pdf/IntegratedFinance.pdf
Campora, Glen. (2011, May 5). Annual Redevelopment Report on Housing Funds and
Housing Activities During Fiscal year 2009-2001. Retrieved February 5, 2012
from http://www.hcd.ca.gov/hpd/rda/09-10/exec_memo_fy09-10.pdf
City of Healdsburg. (2012). Economic Development: Business Development Incentive
Program. Retrieved February 23, 2012 from
http://www.ci.healdsburg.ca.us/index.aspx?page=538
City of Oceanside. (2012). Oceanside Redevelopment Agency. Retrieved February 5,
2012 from http://www.ci.oceanside.ca.us/gov/ecd/rda/projects/default.asp

49
City of Richmond. (2012). 23rd
Street Streetscape. Retrieved February 5, 2012 from
http://www.ci.richmond.ca.us/index.aspx?NID=1492
City of Sacramento. (2011). Development Projects: K Street Entertainment Venues.
Retrieved January 15, 2012 from:
http://www.cityofsacramento.org/econdev/development-projects/office.cfm
City of West Covina. (2012). BKK Landfill: Planned Post Closure Development.
Retrieved February 5, 2012 from
http://www.westcovina.org/cityhall/pw/environmental_services/bkk.asp
City of West Sacramento. (2012). Bridge District Infrastructure. Retrieved February 5,
2012 from
http://www.cityofwestsacramento.org/city/depts/pw/major_projects/bridge_distric
t_infrastructure.asp
Coomes, Joseph. (2009). Redevelopment in California. Point Arena: Solano Press Books
Dardia, Michael. (1998, January). Subsidizing Redevelopment in California. The Public
Policy Institute of California. Retrieved January 15, 2012 from
http://www.ppic.org/content/pubs/report/R_298MDR.pdf
Dolan, M. & Garrison, J. (2011, November 11). Court Leans Toward Allowing Abolition
of Redevelopment Agencies. The Los Angeles Times. Retrieved February 15,
2012 from http://articles.latimes.com/2011/nov/11/local/la-me-redevelopment-
20111111
50
Goldmacher, Shane. (2011, May 15). Gov. Jerry Brown Not Giving up on Tax Hikes to
Help California Budget. The Los Angeles Times. Retrieved January 15, 2012
from http://articles.latimes.com/2011/may/15/local/la-me-state-budget-20110516
Greenwood, D. & Holt, R. (2010). Local Economic Development in the 21st Century.
Armonk: M.E. Sharp
Ibele, Mark. (2011, June 15a). Senate Bill Analysis: ABX1 26. Senate Budget Committee.
Retrieved December 27, 2011 from http://www.leginfo.ca.gov/pub/11-
12/bill/asm/ab_0001-0050/abx1_26_cfa_20110615_154512_asm_floor.html
Ibele, Mark. (2011, June 15b). Senate Bill Analysis: ABX1 27. Senate Budget Committee.
Retrieved December 27, 2011 from http://www.leginfo.ca.gov/pub/11-
12/bill/asm/ab_0001-0050/abx1_27_cfa_20110615_154528_asm_floor.html
Institute for Local Government. (2009). Understanding the Basics of Local Agency
Decision Making. Retrieved February 29, 2012 from https://www.ca-
ilg.org/sites/ilgbackup.org/files/2009_-_LocalGovtDecMaking-w.pdf
Misczynski, Dean. (2011, April). Rethinking the State-Local Relationship: an Overview.
The Public Policy Institute of California. Retrieved January 15, 2012 from
http://www.ppic.org/content/pubs/report/R_411DMR.pdf
Munger, Michael. (2000). Analyzing Policy: Choices, Conflicts, and Practices. New
York: WW Norton
Office of the Governor of California. (2012, January 5). Governor’s Budget Summary
2012-2013. Retrieved January 8, 2012 from
http://www.ebudget.ca.gov/pdf/BudgetSummary/FullBudgetSummary.pdf
51
Schuk, Carolyn. (2011a). California Redevelopment Agencies 101. The Santa Clara
Weekly. Retrieved January 15, 2012 from
http://www.santaclaraweekly.com/2011/Issue-7/redevelopment.html
Schuk, Carolyn. (2011b). Overall State RDA Performance Unclear, But Santa Clara
Better than Many. The Santa Clara Weekly. Retrieved February 5, 2012 from
http://www.santaclaraweekly.com/2011/Issue-8/revised_rda.html
Showley, Roger. (2011, July 18). Cities Sue State over Redevelopment: San Diego Votes
to Pay. Union Tribune-San Diego. Retrieved February 7, 2012 from
http://www.utsandiego.com/news/2011/jul/18/cities-sue-state-over-
redevelopment/?page=1#article
Sinek, Simon. (2009). Start with Why. London: Penguin Books
United States Census Bureau. (2012). State and County Quick Facts: California.
Retrieved February 5, 2012 from
http://quickfacts.census.gov/qfd/states/06000.html
Van Oot, Torey. (2012, January 27). Extension for California Redevelopment Agencies
Stalls. The Sacramento Bee. Retrieved February 5, 2012 from
http://www.sacbee.com/2012/01/27/4218851/extension-for-california-
redevelopment.html
Weist Law Firm. (2010). Leases and Certificates of Participation. Retrieved March 2,
2012 from http://www.weistlaw.com/CM/OurExpertise/Leases-Certificates-of-
Participation.html