Embed Size (px)
Citation preview

A Tale of Two Steam Coal Industries
22-23 February 2011Bart Lucarelli, PhD
IBC Coal Markets Conference, Singapore1

Topics for Discussion
• Competitive Strengths & Weaknesses of Indonesia’s Steam Coalindustry
• Major Questions facing Indonesia as the World’s #1 Steam CoalExporter
– Can Indonesia’s Coal Industry meet expected growth in thedomestic and export sectors?
– How will the shift to low rank coals affect its steam coal exports?
– Are new Australian steam coals from Queensland a threat toIndonesia’s steam coal industry?
– Might the regulatory uncertainty surrounding Indonesia’s newMining Law seriously damage Indonesia’s reputation as a reliablecoal supplier?
22-23 February 2011Bart Lucarelli, PhD
IBC Coal Markets Conference, Singapore2

Competitive Strengths & Weaknesses of Indonesia, relative to
Australia, as a steam coal exporter
Strengths
• Highly Diversified Market
• Proximity to Major Coal
Demand Centers
• Flexible and Modular
Inland Transportation
Systems
• Low stripping ratios and
attractive conditions for
open-cut mining
Weaknesses
• Lower CV, Higher Moisture Coal
• Political Risk and Regulatory Uncertainty
• Non-transparent Resource & Reserve Estimates
• High Diesel Dependency
22-23 February 2011Bart Lucarelli, PhD
IBC Coal Markets Conference, Singapore3

Indonesia only started exporting steam coal in 1990 but by 2006 had become
the World’s largest steam coal exporter in raw tonnes.
22-23 February 2011Bart Lucarelli, PhD
IBC Coal Markets Conference, Singapore 4

Australia, however, exports a higher CV steam coal than Indonesia does and
also exports coking coal, making it the largest exporter of “black coal” in the
World
9
45
87 106 112 123 127
33
58
100
125 132
138 119
-
50.0
100.0
150.0
200.0
250.0
300.0
1980 1990 2000 2005 2007 2008 2009 (Prov.)
In M
illi
on
To
nn
es
STEAM COAL COKING COAL
22-23 February 2011Bart Lucarelli, PhD
IBC Coal Markets Conference, Singapore5

Market Diversity
22-23 February 2011Bart Lucarelli, PhD
IBC Coal Markets Conference, Singapore6

Indonesia’s 2009 coal exports were evenly spread across Asia while….
22-23 February 2011
Bart Lucarelli, PhD
IBC Coal Markets Conference, Singapore 7

.. Australia’s steam coal exports were heavily concentrated in East Asia.
22-23 February 2011Bart Lucarelli, PhD
IBC Coal Markets Conference, Singapore8
Comparison of Inland Transport and Coal
Loading Facilities
22-23 February 2011Bart Lucarelli, PhD
IBC Coal Markets Conference, Singapore9

(Photos courtesy of PT Adaro)
22-23 February 2011Bart Lucarelli, PhD
IBC Coal Markets Conference, Singapore10

Company
2009
Production
(million
tonnes)
2009
Exports
(million
tonnes)
Mine Site to
Barge Port
(km)
Remarks
KPC 38.2 35.3 13 (OLC) 1/9 (OLC) Load Port: TBCT
Adaro 40.6 31.6 79 (truck) 250/450 (Barge) Loading @Taboneo
anchorage or IBT
Kideco 24.7 18.4 39 (truck) 58 (Barge)
8-12 KT Barges loads
@ TMCT and then 28
KM to Floating Cranes
Arutmin 19.3 17.1 7 -18 (truck) 124/199 (Barge)
Barges @ Sauti &
Mulia travel 160 KM to
NPLCT; can load PMX
and Cape vessels
Berau 14.3 10.0 13 (truck) 74 (Barge) From Lati to Muara
Pantai
Indominco 12.4 13.8 35 (truck) 0/9 (OLC) From Port to Bontang
Coal Terminal
Inland transport arrangements for Indonesia’s 6 largest coal producers favor
truck & barge with some overland conveyors
22-23 February 2011Bart Lucarelli, PhD
IBC Coal Markets Conference, Singapore11
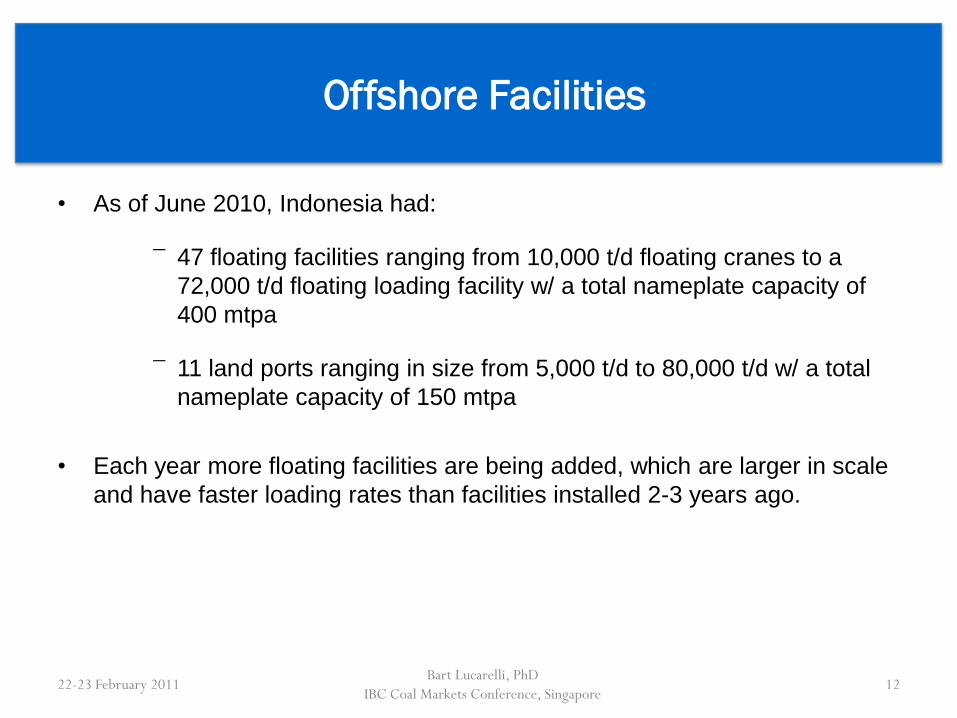
• As of June 2010, Indonesia had:
¯ 47 floating facilities ranging from 10,000 t/d floating cranes to a
72,000 t/d floating loading facility w/ a total nameplate capacity of
400 mtpa
¯ 11 land ports ranging in size from 5,000 t/d to 80,000 t/d w/ a total
nameplate capacity of 150 mtpa
• Each year more floating facilities are being added, which are larger in scale
and have faster loading rates than facilities installed 2-3 years ago.
22-23 February 2011Bart Lucarelli, PhD
IBC Coal Markets Conference, Singapore12
Offshore Facilities

Australia’s steam coal industry relies on fixed rail transport with each train
hauling 6,000 – 12,000 tonnes to transport coal from the mines to fixed ports
such as…….
22-23 February 2011Bart Lucarelli, PhD
IBC Coal Markets Conference, Singapore13

… the port of Gladstone with a 2009 nameplate capacity of 79 mtpa but with
plan to expand to 142 mtpa by 2020
22-23 February 2011Bart Lucarelli, PhD
IBC Coal Markets Conference, Singapore14

Abbott Pt
Hay Point
QueenslandGladstone
NSW Newcastle
22-23 February 2011Bart Lucarelli, PhD IBC
Coal Markets Conference, Singapore15

Coal Terminal Expansion Plans: NSW & Queensland, 2006 – 2020 (in mtpa)
22-23 February 2011Bart Lucarelli, PhD
IBC Coal Markets Conference, Singapore16
Newcastle NSW 2006 2008 2010 2012 2015 2020
1. Kooragang Coal Terminal 64.0 77.0 91.0 101.0 101.0 101.0
2. Carrington Coal Terminal 25.0 25.0 25.0 25.0 25.0 25.0
3. NCIG Coal Terminal (Planned) 0.0 0.0 30.0 45.0 66.0 66.0
Sub Total 89.0 102.0 146.0 171.0 192.0 192.0
Port Kembla NSW 16.0 16.0 16.0 16.0 16.0 16.0
NSW Total 105.0 118.0 162.0 187.0 208.0 208.0
Gladstone Queensland
1. RG Tanna Coal Terminal 51.0 72.0 72.0 72.0 72.0 72.0
2. Barney Point Coal Terminal 7.0 7.0 7.0 7.0 0.0 0.0
3. Wiggins Island (Planned) 0.0 0.0 0.0 0.0 25.0 70.0
Sub Total 58.0 79.0 79.0 79.0 97.0 142.0
Hay Point Queensland
1. Dalrymple Bay Coal Terminal 55.7 85.0 85.0 85.0 85.0 85.0
2. Hay Point Coal Terminal 40.0 44.0 44.0 55.0 55.0 55.0
Sub Total 95.7 129.0 129.0 140.0 140.0 140.0
Abbott Point Queensland 15.0 25.0 50.0 80.0 100.0 100.0
Brisbane Queensland 5.0 5.0 5.0 5.0 8.0 10.0
Queensland Total 173.7 238.0 263.0 304.0 345.0 392.0
TOTAL 278.7 356.0 425.0 491.0 553.0 600.0
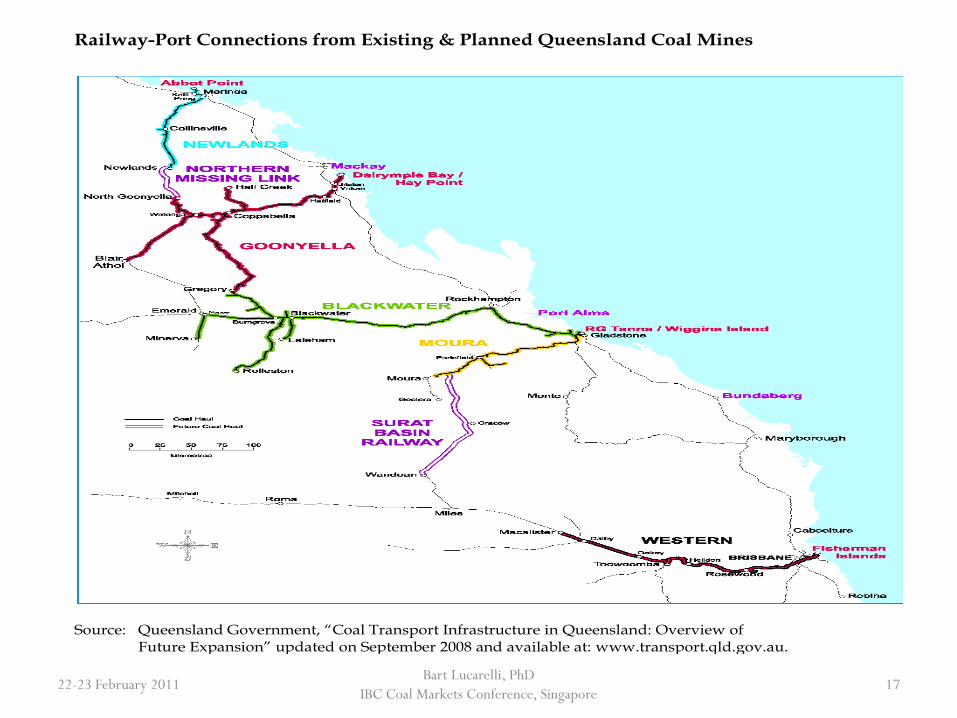
Railway-Port Connections from Existing & Planned Queensland Coal Mines
Source: Queensland Government, “Coal Transport Infrastructure in Queensland: Overview of Future Expansion” updated on September 2008 and available at: www.transport.qld.gov.au.
22-23 February 2011Bart Lucarelli, PhD
IBC Coal Markets Conference, Singapore17

Queensland NSW Kalimantan (barge) Sumatra
Rail/Barge 233 mtpa >100 mtpa 200 mtpa (Barito)
>100 mtpa (Mahakham)
n/a
Fixed Land
Ports
238 mtpa 118 mtpa 70 – 80 mtpa 10 -20 mtpa
Offshore
Facilities
n/a n/a 175 mtpa (80% of
nameplate capacity)
n/a
Anchorages n/a n/a Geared vessels (10 -20
mtpa extra?)
5-7
Queensland and NSW rely 100% on fixed rail and land port systems to export
coals while Kalimantan is increasing its dependence on floating facilities
and barges
22-23 February 2011Bart Lucarelli, PhD
IBC Coal Markets Conference, Singapore18

Transport Distance Differences
22-23 February 2011Bart Lucarelli, PhD
IBC Coal Markets Conference, Singapore19

Indonesia is closer to all major Asian markets than Australia, and has a
significant ly lower transport costs compared to Australia and South Africa to
most Asian discharge ports (RT distances in nautical miles)
22-23 February 2011Bart Lucarelli, PhD
IBC Coal Markets Conference, Singapore20
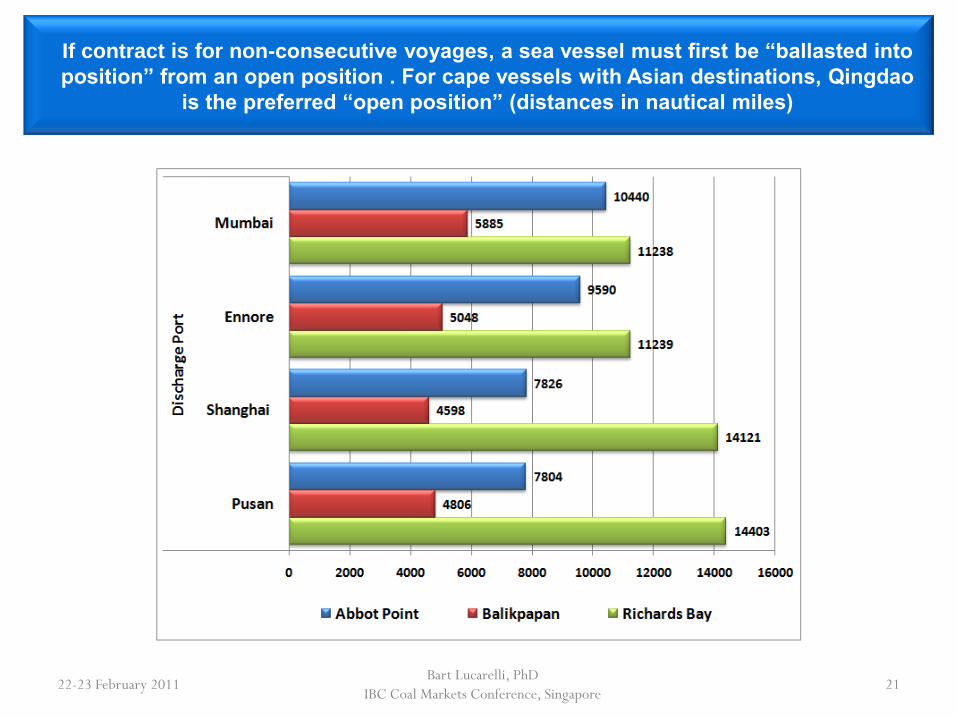
If contract is for non-consecutive voyages, a sea vessel must first be “ballasted into
position” from an open position . For cape vessels with Asian destinations, Qingdao
is the preferred “open position” (distances in nautical miles)
22-23 February 2011Bart Lucarelli, PhD
IBC Coal Markets Conference, Singapore21
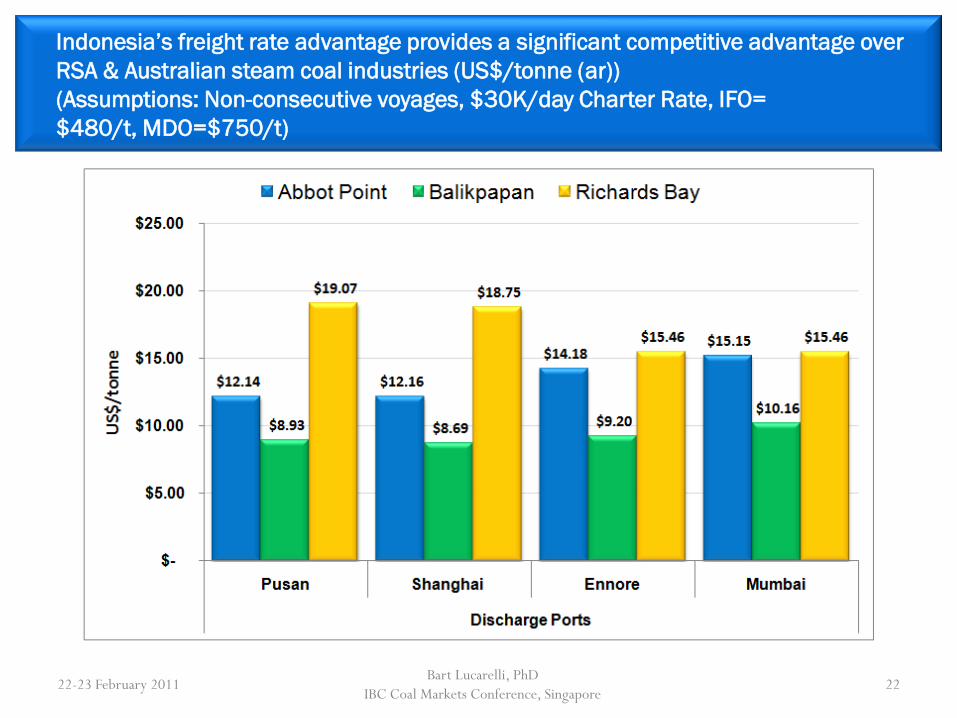
Indonesia’s freight rate advantage provides a significant competitive advantage over
RSA & Australian steam coal industries (US$/tonne (ar))
(Assumptions: Non-consecutive voyages, $30K/day Charter Rate, IFO=
$480/t, MDO=$750/t)
22-23 February 2011Bart Lucarelli, PhD
IBC Coal Markets Conference, Singapore22

22-23 February 2011Bart Lucarelli, PhD
IBC Coal Markets Conference, Singapore23

Comparison of Coal Resource &
Reserve Estimates
22-23 February 2011Bart Lucarelli, PhD
IBC Coal Markets Conference, Singapore24

52.44 B T
51.92 BT
0.014 B T
0.23 B T
0.002 B T 0.15 B T
TOTAL RESOURCES
104.76 BILLIONTONS
TOTAL RESERVES18.7 BILLION TONS
11.54 B T
7.17 B T
Note : Coal Resource Estimates for South Sumatra, East Kalimantan & SouthKalimantan are based on Joint NEDO – MEMR Study (2007 – 08)
MAP OF INDONESIA’S COAL RESERVES AND
RESOURCES, 2009
2522-23 February 2011Bart Lucarelli, PhD
IBC Coal Markets Conference, Singapore25

NEDO-MEMR Joint Study resulted in 2007 resources increasing by 54% over
2005 figures due to an increase in hypothetical sub-bit resources. MEMR
increased sub-bit resources by an additional 12% in 2009
22-23 February 2011Bart Lucarelli, PhD
IBC Coal Markets Conference, Singapore26

Indonesia’s Proven Coal Reserves remained largely unchanged from 2007 and 2009.
Small changes appear to be corrections of errors. Probable reserves , however,
shifted from sub-bit to lignites.
4,292
1,385
8,214
2,718
744
1,542
0
2,000
4,000
6,000
8,000
10,000
12,000
14,000
16,000
Probable Proven
Mil
lio
n T
on
ne
s
2007 Indonesian Probable and Proven Coal Reserves
Lignite Sub-bituminous Bituminous
22-23 February 2011Bart Lucarelli, PhD
IBC Coal Markets Conference, Singapore27
6,704
1,358
5,871
2,718
902
1,452
0
2,000
4,000
6,000
8,000
10,000
12,000
14,000
16,000
Probable Proven
Mill
ion
To
nn
es
2009 Indonesian Probable and Proven Coal Reserves
Lignite Sub-bituminous Bituminous

Location of Indonesia’s low rank coal resources
(2009 low rank resource estimate = 21.2 billion)
South Sumatra 81%
22-23 February 2011Bart Lucarelli, PhD
IBC Coal Markets Conference, Singapore28
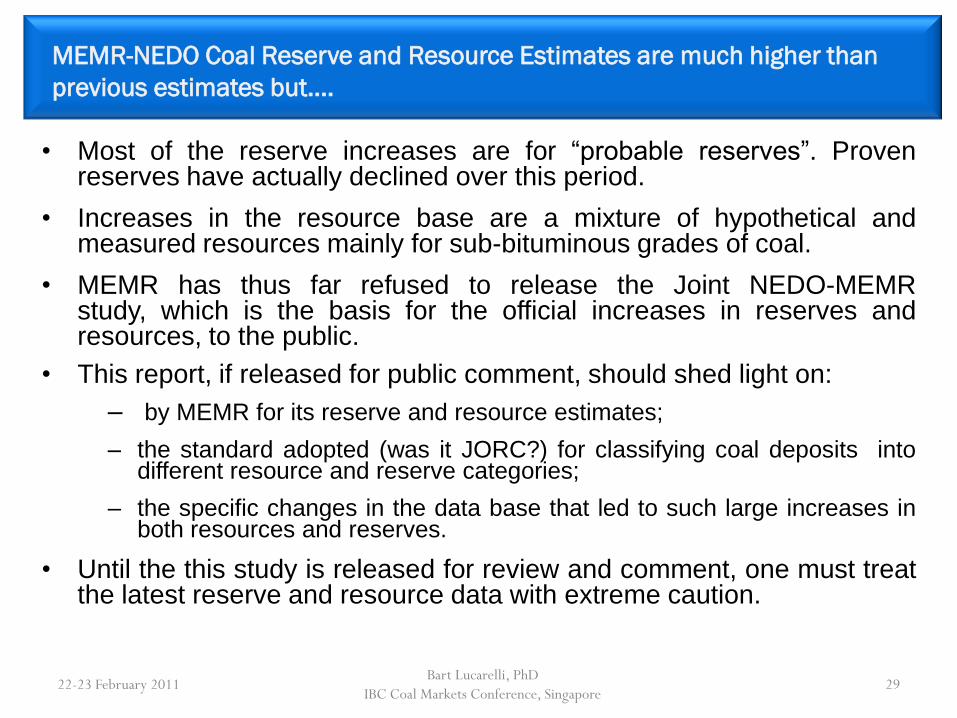
• Most of the reserve increases are for “probable reserves”. Provenreserves have actually declined over this period.
• Increases in the resource base are a mixture of hypothetical andmeasured resources mainly for sub-bituminous grades of coal.
• MEMR has thus far refused to release the Joint NEDO-MEMRstudy, which is the basis for the official increases in reserves andresources, to the public.
• This report, if released for public comment, should shed light on:
– by MEMR for its reserve and resource estimates;
– the standard adopted (was it JORC?) for classifying coal deposits intodifferent resource and reserve categories;
– the specific changes in the data base that led to such large increases inboth resources and reserves.
• Until the this study is released for review and comment, one must treatthe latest reserve and resource data with extreme caution.
22-23 February 2011Bart Lucarelli, PhD
IBC Coal Markets Conference, Singapore29
MEMR-NEDO Coal Reserve and Resource Estimates are much higher than
previous estimates but….

Australia’s Steam Coal Resources and Reserves
• The Australian Government through Geoscience Australia (GA) publishesofficial estimates of Australia’s black and brown coal resources and reserves inan annual report titled “AUSTRALIA’S IDENTIFIED MINERAL RESOURCES” (AIMR).
• GA has been publishing the AIMR since 1999. The most recent issue, which is dated December 2009, provides resource and reserve data as of December 2008
• GA expresses coal resources as Demonstrated Resources, which are separated into Economic and Sub-economic categories. Demonstrated Resources are reported on an as-received basis.
• The Economic Demonstrated Resources (EDR) represent those resources that GAconcludes have either near-term or long-term potential to be developedeconomically.
• EDR are substantially greater than the JORC Reserves reported annually bypublicly traded mining companies– roughly 3-4 times greater.
• This information is available to the public w/o charge through a single contactperson (Ron Sait) who answers questions promptly by email.
22-23 February 2011Bart Lucarelli, PhD
IBC Coal Markets Conference, Singapore30

This table shows GA’s December 2008 estimates of Australia’s black
coal EDR data ( billion tonnes, as-received)
Demonstrated Resources Company + Geoscience Estimates
Economic (EDR)
Accessible EDR (AEDR)
Sub-economic Inferred Resources
JORC Reserves (% of AEDR) Para-marginal Sub-marginal
Black Coal
in situ 56.2 n/a 3.0 10.3 106.0 n/a
recoverable 39.2 39.1 1.5 6.7 66.7 13.4 (34%)
Brown Coal
in situ 44.3 n/a 43.1 18.1 112.3 n/a
recoverable 39.2 32.2 38.8 16.3 101.1 4.8 (15%)
22-23 February 2011Bart Lucarelli, PhD
IBC Coal Markets Conference, Singapore31
Source: Geoscience Australia, “Australia’s Identified Mineral Resources, 2009”, Table 1

22-23 February 2011Bart Lucarelli, PhD
IBC Coal Markets Conference, Singapore32

Comparison of Qualities of Indonesian and
Australian Steam Coals
22-23 February 2011Bart Lucarelli, PhD
IBC Coal Markets Conference, Singapore33

Indonesian coals have an average CV of 5200 kcal/kg (gar) while Australian coals
are 6300 kcal/kg (gar). However, Indonesian coals have much lower S and Ash
contents making them excellent blending coals for Indian and Chinese power
plants.
22-23 February 2011Bart Lucarelli, PhD
IBC Coal Markets Conference, Singapore34

Indonesia’s coals have lower CV, higher moisture and lower AFT but, in many
cases, ultra low sulfur and ash when compared with……
22-23 February 2011Bart Lucarelli, PhD
IBC Coal Markets Conference, Singapore35
Coal Quality Parameter
Coal Bran d KPC Pinang
KPC Melawan
Adaro Envirocoal
Arut min
EcocoalKideco
Roto
Reporting Basis
GCV (Kcal/kg) GAD 6, 546 5,735 5 ,900 5 ,000 5,310
GCV (Kcal/kg) GAR 6,150 5,350 5 ,100 4 ,221 4,700
Moisture (%) AR 14.5 23.5 26.0 35 .0 2 6 .5
Moisture (%) AD 9 .0 18.0 14.5 23 .0 17.0
Ash (%) AD 5.5 3.0 1.5 3.9 3.0
VM (%) AD 40.0 38.0 43.0 38.0 41.5
TS (%) AD 0.70 0. 25 0.20 0.20 0. 24
AFT (C°) Initial Deform.Red. Atmos.
1150 1 130 1200 1150 1150
HGI (#) n/a 45 42 50 60 45

…… NSW export-grade steam coals
Source: www.australianminesatlas.com
Coal Quality Parameter
Coal Field Southern
Western Hunter Newcastle Gunnedah
Reporting Basis
GCV (Kcal/kg) GAD 6,750 6,600 6,810 6,760 7,050
GCV (Kcal/kg) GAR 6,390 6,220 6,360 6,330 6,515
Total Moisture (%)
AR 6.4 8.0 9.1 8.5 9.0
Inherent Moist. (%)
AD 1.1 2.6 2.7 2.3 1.5
Ash (%) AD 19.5 20.4 13.5 15.1 17.5
VM (%) AD 20.8 28.7 32.7 30.6 26.8
TS (%) AD 0.45 0.55 0.60 0.60 0.65
AFT (C°) Int. Deform. Red. Atmos.
1460 1460 1270 1380 1530
HGI (#) n/a 64 45 50 52 65
22-23 February 2011Bart Lucarelli, PhD
IBC Coal Markets Conference, Singapore36

Differences in CV and moisture levels will become even more pronounced
once Indonesia’s low rank coal are brought into the market
Indonesian Low Rank Coals Australian New Coals
Coal Quality Parameter
Coal Brand Adaro Wara
Kideco SM
Arutmin Ecocoal
Hancock (Alpha/ Galilee Basin)
Xstrata (Wandoan/Surat Basin)
Reporting Basis
GCV (Kcal/kg)
GAD
4,865
5,255
5,000
6,500
6,350
GCV (Kcal/kg)
GAR
4,000
4,100
4,221
6,040
5,975
Total
Moisture (%)
AR
40.0
36.0
35.0
15.0
15.0
Inherent
Moisture. (%)
AD
27.0
18.0
23.0
8.5
9.7
Ash (%)
AD
2.5
4.0
3.9
7.7
8.0
VM (%)
AD
37.0
43.0
38.0
34.4
41.5
TS (%)
AD
0.15
0.10
0.20
0.45
0.4
AFT (C°)
Initial Deform. Red. Atmos.
1300
1120
1150
1350
1340
HGI (#)
n/a
50
45
60
50 - 55
35
22-23 February 2011Bart Lucarelli, PhD
IBC Coal Markets Conference, Singapore37
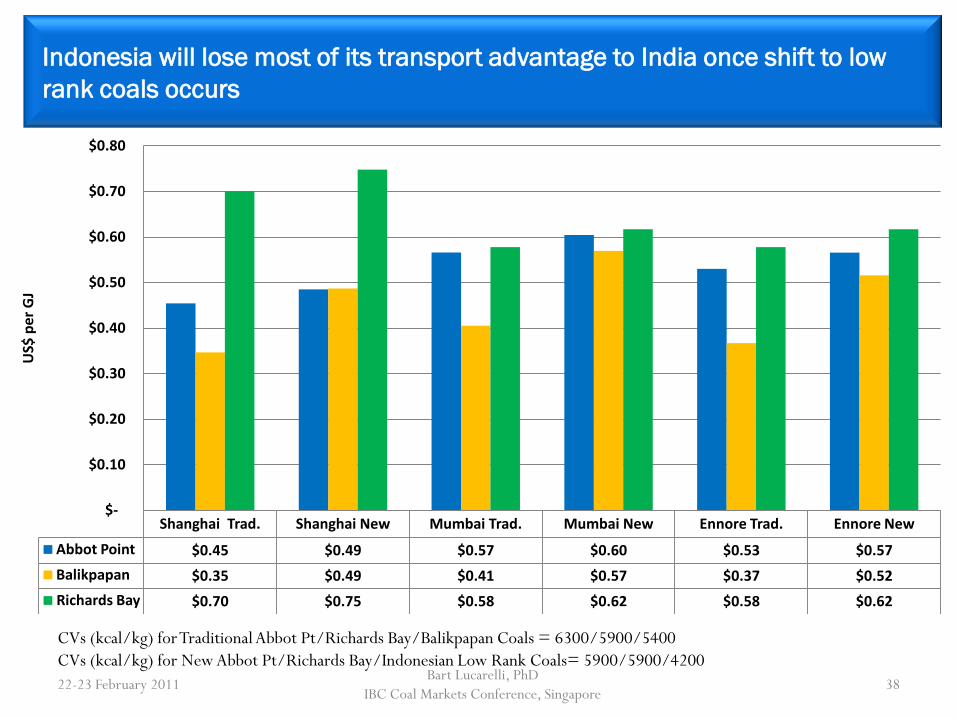
Indonesia will lose most of its transport advantage to India once shift to low
rank coals occurs
Shanghai Trad. Shanghai New Mumbai Trad. Mumbai New Ennore Trad. Ennore New
Abbot Point $0.45 $0.49 $0.57 $0.60 $0.53 $0.57
Balikpapan $0.35 $0.49 $0.41 $0.57 $0.37 $0.52
Richards Bay $0.70 $0.75 $0.58 $0.62 $0.58 $0.62
$-
$0.10
$0.20
$0.30
$0.40
$0.50
$0.60
$0.70
$0.80
US$
per
GJ
22-23 February 2011Bart Lucarelli, PhD
IBC Coal Markets Conference, Singapore38
CVs (kcal/kg) for Traditional Abbot Pt/Richards Bay/Balikpapan Coals = 6300/5900/5400
CVs (kcal/kg) for New Abbot Pt/Richards Bay/Indonesian Low Rank Coals= 5900/5900/4200

Comparison of Industry Concentration
22-23 February 2011Bart Lucarelli, PhD
IBC Coal Markets Conference, Singapore39

Source: Indonesian Coal Book, 2010/2011 for 2008 & 2009, Energy Publishing for years 2003-07
Indonesia's coal industry is highly concentrated but the level of concentration is declining:
In 2003, KPC, Adaro, Kideco, Arutmin & Indominco (incl. Jorong and Trubaindo)
accounted for 79% of Indonesia's coal exports.
In 2009, the “Big Five” accounted for 65% of total exports,.
69 81 86
109 117 111 124
18
24 31
38 47
50 67
-
50
100
150
200
250
2003 2004 2005 2006 2007 2008 2009
Mil
lio
n T
on
ne
s
Top Five Producers Other Producers
22-23 February 2011Bart Lucarelli, PhD
IBC Coal Markets Conference, Singapore40

Concentration of Australia’s Black Coal Industry
• Between 1986 and 1997, Australia’s black coal industry had a
more diversified ownership than it has today.
• 1997 saleable production shares:
– 38% by BMA, Rio Tinto, Anglo and Xstrata (the Big Four)
– 20 % by Shell, Arco, Exxon, MIM Holdings, Peabody Coal, and QCT
• Between 1997 and 2001, oil companies, MIM, Peabody and QCT
sold out their interests to the Big Four which increased their
share of total saleable production to 64 percent by 2002
22-23 February 2011Bart Lucarelli, PhD
IBC Coal Markets Conference, Singapore41

Concentration in Australia’s Black Coal Industry
• In 2008, the Big Four accounted for 61
percent of 2008 coal production.
• They also control most of Australia’s
recoverable reserves of hard and soft
coking coal.
– BMA controls 60 percent of the
hard coal coking reserves located
in the Bowen Basin of
Queensland.
– Xstrata, Rio Tinto, Anglo, and
Peabody control another 20%.
– Xstrata and Rio Tinto control 45
percent and 25 percent of NSW’s
recoverable soft coking coal
reserves.
• Steam coal less concentrated but will
become more so once Galilee and
Surat Basins enter into production
22-23 February 2011Bart Lucarelli, PhD
IBC Coal Markets Conference, Singapore42
Australia’s “Big Four” Coal Producers
Produced 74% percent of Australia’s
Black Coal in 2008
Can Indonesia Meet Both Domestic and Export
Requirements for Steam Coal?
22-23 February 2011Bart Lucarelli, PhD
IBC Coal Markets Conference, Singapore43
PLN’s Fast Track Coal-fired Power Plant Program
and
its Implications for Coal Export Markets

New Coal-fired Power Plants being built for PLN’s 1st Fast Track Program
On Java-Bali
No Project Total MW
US$ Portion(M)
Bank IDR
portion (B)
Bank Construction
Progress (%)
1 Labuan, Banten 630 289 BNI 1,189 BCA 95
2 Rembang, Jateng 630 262 CDB/Barclays 1,911 Mandiri 87
3 Indramayu, Jabar 990 592 CDB 1,273 BNI 78
4 Suralaya, Bantem 625 284 CEXIM 735 Mega 76
5 Pacitan, Jatim 630 293 Pending 1,046 Bukopin 72
6 Paiton, Jatim 660 331 CEXIM 601 Mega 59
7 Teluk Naga, Bantern
945 455 BOC 1,607 Bukopin 43
8 Pelabuhan Ratu, Jabar
1,050 482 CEXIM 1,874 Mega 39
9 Tanjung Awar Awar, Jatim
700 372 Pending 1,155 BNI 2
10 Adipala, Jateng 660 468 Pending 1,890 Pending 0
Total 7,520 3,827 13,282
Off Java-Bali
No Project Total MW
US$ portion (M)
Bank 1DR
portion (B)
Bank Construction
Progress (%)
1 Meulaboh, NAD 220 124 CEXIM 614 Asbanda 25
2 Pangkalan Susu, Sumut
400 209 Pending 781 Mega 25
3 Tarahan, Lampung
200 119 Pending
460 Mega 21
4 Susel, Barru 100 52 BRI 380 BRI 9
5 Kalteng 1, Pulang Pisau
120 62 Asbanda 414 Mega 2
6 Teluk Sirih, Sumbar
224 138 Pending 521 Asbanda 1
7 Kalsel, Asam-Asam
130 84 SRI 313 SRI 1
8 Katbar 1, Pant Baru (L0I)
100 62 Pending 111 Pending 0
9 Others (15 small plants <100MW)
469 n/a n/a n/a n/a n/a
Total 1,963 1,104 6,050
Source: “Indonesian Coal and Power Report” Issue 0141, Energy Publishing June 2009
22-23 February 2011
Bart Lucarelli, PhD
IBC Coal Markets Conference, Singapore44

- In 2009, Indonesia’s domestic coal requirements were 56.3 mt (21% of total sales)
- By 2013, domestic requirements are expected to reach 100 mt , which will account for 30%
of total sales.
- Exports + domestic sales are expected to grow from 254 mt in 2009 to 328 mtpa in
2013, largely due to PLN’s 10 GW fast track power plant program.
Domestic
21%
Export
79%
Domestic
30%
Export
70%
22-23 February 2011Bart Lucarelli, PhD
IBC Coal Markets Conference, Singapore45
2009 2013

Coal market 2009 2012 2013 2015
Power 33 55 60 70
Other Domestic 23 36 39 46
Total Domestic Demand 56 91 99 116
Exports 198 212 229 267
Total Demand 254 303 328 383
Source: Indonesian Coal Book, 2010/2011 for 2009 figures, LP Power estimates with inputs from UBS and James T. Booker
for other years
Between 2008 and 2015, domestic coal demand expected to increase by 14% per
year as new PLN-owned coal-fired power plants are brought into operation.
22-23 February 2011Bart Lucarelli, PhD
IBC Coal Markets Conference, Singapore46

Impact of 1st Crash Program Projects on Domestic Coal
Consumption
• Industry views range from
– “By 2012 all projects will be in operation” to
– “Hey this is PLN we are largely talking about and one should
expect further delays that will result in a more gradual increase
in domestic coal consumption than PLN is forecasting.”
• The cynics will be proven correct and Indonesia will
experience a more gradual increase in domestic coal demand
than PLN would like everyone to believe.
• But there seems to be a consensus that all projects will be in
operation and running close to their optimal capacity factors
by 2015.
22-23 February 2011Bart Lucarelli, PhD
IBC Coal Markets Conference, Singapore47

Can Indonesia meet new domestic demand + increased export demand?
My View: Yes, should not be a problem as long as government price and
non-price regulations do not cripple the industry.
• Indonesia will experience a more gradual increase in domestic coaldemand than PLN is forecasting.
• Indonesia’s coal producers have demonstrated the ability in therecent past to rapidly increase their production levels toaccommodate demand growth. No reason it cannot do so in thefuture .
• Indonesia’s Coal Reserves, if official figures are accurate, are morethan adequate to meet this forecasted demand into the foreseeablefuture.
• In any case, the new domestic demand is largely for LR coals whileexport demand is predominantly for sub-bituminous coals.
• Shortages , if they do occur, are likely to result from PLN’s refusal topay the market FOB price for Indonesian coal.
22-23 February 2011Bart Lucarelli, PhD
IBC Coal Markets Conference, Singapore48

What are the implications of Indonesia’s coming shift to low rank coals
Sub-bituminous coals
Resource Base (2009 est.)
– Measured: ~ 12 billion tonnes
– Indicated + Inferred: ~ 29.9 billion tonnes
– Hypothetical: 27.8 billion tonnes
Measured resources sufficient to last 55 years at current production rates
Reserves (2009): 8.6 billion tonnes
But a number of Indonesia’s major
coal suppliers claim that they are
already sold out of their sub -
bituminous coals
Typical Specification
• CV : 4500 – 5800 kcal/kg
• S : 0.2% – 0.6%
• Ash : 3.0% – 7.0%
• TM : 20.0% – 28.0%
Low rank coals
• Resource base (2009 est.)
– Measured: ~5.8 billion tonnes
– Indicated + Inferred: ~10.4 billion
tonnes
• Reserves: 8.1 billion tonnes
• Major producers are starting to shift
production to LR coals
• But creating a market for LR coals
will be a slow process – unless the
TM of LR Coal can be reduced to
levels of sub-bit coals
Typical Specification
• CV : 3900 – 4500 kcal/kg
• S : 0.2% – 0.6%
• Ash : 3.0% – 7.0%
• TM : 35.0% – 40.0%
•22-23 February 2011
Bart Lucarelli, PhD
IBC Coal Markets Conference, Singapore49

Source: Energy Publishing, “Indonesian Coal and Power Report” various issues from 2003 through April 2010.
69 81 86 109 117 125 121
18 24
31
38 47
79 73
-
50
100
150
200
250
2003 2004 2005 2006 2007 2008 2009
Mil
lio
n T
on
nes
Top Five Producers Other Producers
Indonesia's coal industry is highly concentrated but concentration is declining:
In 2002, Bumi (KPC + Arutmin), Adaro, Banpu (Indominco, Trubaindo &
Jorong), Kideco, Berau and PTBA accounted for 79% of Indonesia's coal exports .
In 2008, these same five producers accounted for 62% of total exports.
22-23 February 2011Bart Lucarelli, PhD
IBC Coal Markets Conference, Singapore50

The Big 6 accounted for most of Indonesia’s coal production between 2002
and 2009 with their share of total production ranging from a low of 65 percent
in 2008/209 to a high of 78 percent in 2002
2002 2003 2004 2005 2006 2007 2008 2009
Bumi Resources (KPC+Arutmin) 28.2 29.8 36.3 44.3 51.3 53.7 52.0 57.5
Adaro 20.8 22.4 24.3 26.6 33.5 36.1 38.5 40.6
Kideco 11.5 14.1 16.9 18.1 18.9 20.5 21.9 24.7
Berau 7.1 7.4 9.1 9.2 10.8 11.8 13.1 14.3
Banpu (Indo Tambangraya Megah
Tbk) (Indominco Mandiri, Jorong,
and Trubaindo.)
7.2 8.6 9.9 9.1 10.2 12.9 17.8 20.7
Bukit Asam (PTBA) 9.5 10.0 8.7 8.7 8.7 9.3 10.1 10.8
Subtotal 84.3 92.3 105.2 116.0 134.8 142.9 153.4 168.6
All Others 21.6 27.3 33.1 43.6 53.9 69.6 81.8 56.4
Total 105.9 119.6 138.3 159.6 188.7 212.5 235.2 257.7
Big 6 as % of total 80% 77% 76% 73% 71% 67% 65% 65%
CompanyCoal Production in (million tonnes)
Source: Indonesian Directorate of Minerals and Coal Enterprises for 2002-2006 data; Indonesian Coal Books 2008/2009 and 2010/2011
for 2007-2009 data
22-23 February 2011Bart Lucarelli, PhD
IBC Coal Markets Conference, Singapore51

The Big 6 accounted for most of Indonesia’s coal production between 2002 and 2009
with their share of total production ranging from a low of 67 percent in 2007 to a
high of 78 percent in 2002.
Company Coal Production (in million tonnes)
2002 2003 2004 2005 2006 2007 2008 2009
Bumi Resources (KPC+ Arutmin) 28.2 29.8 36.3 44.3 51.3 53.7 52.0 57.5
Adaro 20.8 22.4 24.3 26.6 33.5 36.1 38.5 40.6
Kideco 11.5 14.1 16.9 18.1 18.9 20.5 21.9 24.7
Berau 7.1 7.4 9.1 9.2 10.8 11.8 12.9 14.3
Banpu (Indo Tambangraya Megah Tbk) (Indominco Mandiri, Jorong, Trubaindo, and Kitadin)
7.2 8.6 9.9 9.1 10.2 12.9 11.9 13.2
Bukit Asam (PTBA) 9.5 10.0 8.7 8.7 8.7 9.3 11.0 10.8
Subtotal 84.3 92.3 105.2 116.0 134.8 142.9 147.1 160.3
All Others 21.6 27.3 33.1 43.6 53.9 69.6 57.4 56.4
Total 105.9 119.6 138.3 159.6 187.3 212.5 204.5 216.7
Big 6 as % of total 78% 75% 75% 72% 71% 67% 72% 74%
Source: Indonesian Directorate of Minerals and Coal Enterprises 2002-2006; Indonesian Coal Book, 2008/2009 for 2007 estimates; Energy Publishing, Indonesian Coal and Power Report, April 2010 for 2008 and 2009 estimates.
22-23 February 2011Bart Lucarelli, PhD
IBC Coal Markets Conference, Singapore52

Australia’s black coal industry is also highly concentrated
• Hard Coking Coal
– 92% of hard coking coal reserves are located in the Bowen Basin
– 60% of those reserves are controlled by BHP-B
– 25% by Xstrata, Rio Tinto, Anglo and Peabody
• Soft Coking Coal– All JORC Reserves of soft coking coal are located in NSW
– 45% managed by Xstrata
– 25% by Rio Tinto
• Thermal is much less concentrated but Xstrata owns Rolleston ( 8
mtpa), Anglo-American owns Callide (9 mtpa) and Rio Tinto owns Blair
Athol/Clermont (12 mtpa).
• New Mines in Galilee and Surat Basins will be world-scale and will likely
lead to greater concentration in thermal coal industry too.
22-23 February 2011Bart Lucarelli, PhD
IBC Coal Markets Conference, Singapore53
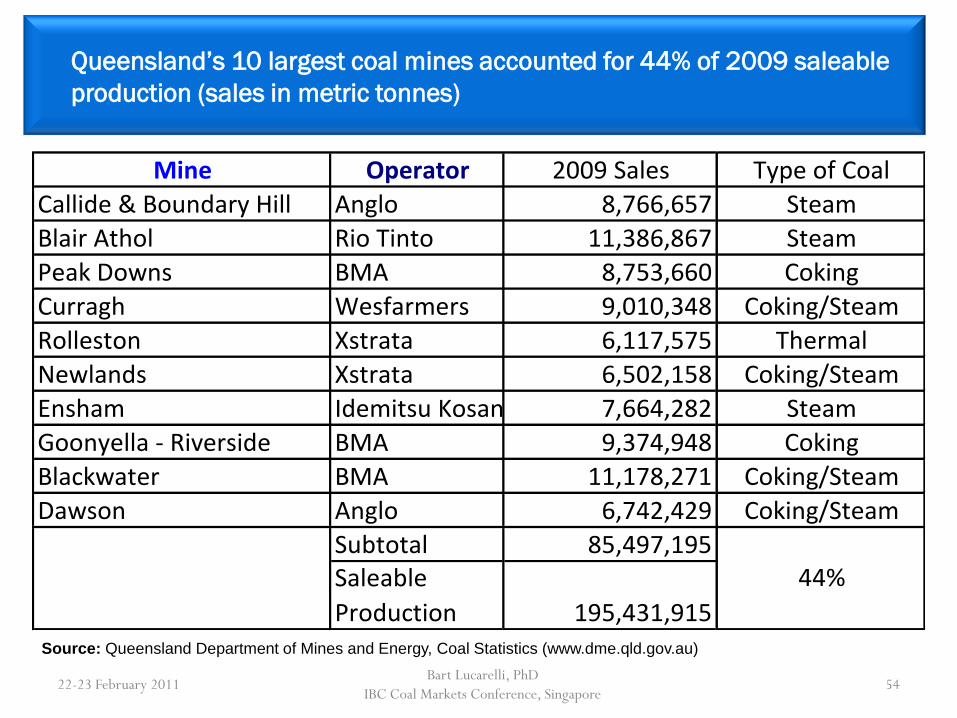
Queensland’s 10 largest coal mines accounted for 44% of 2009 saleable
production (sales in metric tonnes)
Mine Operator 2009 Sales Type of Coal
Callide & Boundary Hill Anglo 8,766,657 Steam
Blair Athol Rio Tinto 11,386,867 Steam
Peak Downs BMA 8,753,660 Coking
Curragh Wesfarmers 9,010,348 Coking/Steam
Rolleston Xstrata 6,117,575 Thermal
Newlands Xstrata 6,502,158 Coking/Steam
Ensham Idemitsu Kosan 7,664,282 Steam
Goonyella - Riverside BMA 9,374,948 Coking
Blackwater BMA 11,178,271 Coking/Steam
Dawson Anglo 6,742,429 Coking/Steam
Subtotal 85,497,195Saleable
Production 195,431,915
44%
22-23 February 2011Bart Lucarelli, PhD
IBC Coal Markets Conference, Singapore54
Source: Queensland Department of Mines and Energy, Coal Statistics (www.dme.qld.gov.au)
Are Competing Sources of New Supply from
Australia a threat to Indonesia’s steam coal
exports?
What if Australia gets its act
together?
22-23 February 2011Bart Lucarelli, PhD
IBC Coal Markets Conference, Singapore55

Abbott Pt
Hay Point
QueenslandGladstone
NSW Newcastle
22-23 February 2011Bart Lucarelli, PhD
IBC Coal Markets Conference, Singapore56

Australia Black Coal Industry – Quick Summar
Present
• NSW & Queensland account for 98%
of Australia’s black coal production and
100% of exports:
– coking coal (53%)
– steam coal (47%)
• In 2009,
– NSW mainly a steam coal exporter
(78% steam : 22% coking )
– Queensland exported mostly coking
coal (72% coking: 28% steam ).
– Queensland produced 82% of its
coal from O/C mines vs. 66% for
NSW.
• Transport is by fixed rail to fixed land
ports; new transport projects subject to
slow government approvals
Outlook
• New Queensland mines
– mostly O/C mines in the Suratand Gallilee Basins
– will produce steam coal.
• New NSW mines
– Underground mines in Hunter Valley + O/C mines in the Gunnedah Basin.
– Steam coal main coal product.
• New mines located in the Surat, Galilee and Gunnedah Basins will have significantly higher cash costs due to long distances from ports and need for new rail lines and coal terminals.
• CPRS and MRRT will increase mining costs.
22-23 February 2011Bart Lucarelli, PhD
IBC Coal Markets Conference, Singapore57

Australia’s coal exports are currently constrained by chronic
infrastructure shortages as well as a certain amount of regulatory
uncertainty
• Continued uncertainty about the schedule forexpanding ports and rail networks.
• Carbon Pollution Reduction Scheme – on hold but notdropped completely – worst of both worlds.
• Resource Super Profits Tax (RSPT) of 40%, known renamed the Mineral Resources Rent Tax (MRRT), may delay development of new mining projects and reduce foreign investment in mining sector.
22-23 February 2011Bart Lucarelli, PhD
IBC Coal Markets Conference, Singapore58

Mega-Mines under development in Queensland
22-23 February 2011Bart Lucarelli, PhD
IBC Coal Markets Conference, Singapore59
Developer Basin Deposit
2010
Resource
Estimate ?
(billion
tonnes)
First
Shipment
(years)
Export
Capacity
(MTPA)
Distance
to Port
(Km)
Total
Capital
(billion
AUS$)
Hancock Coal Galilee Alpha Coal 3.6 2013 30 495 7.5
Hancock Coal Galilee Kevin Comer 3.4 2013 30 495 9.0
Clive Palmer Galilee Waratah 4.3 2013 40 495 5.3
Xstrata Surat Wandoan 2.7 2015 22 380 n/a
Syntech Surat Cameby Downs 1.4 2010 12-15 430 n/a
* Hancock Coal and Wandoan resource estimates include Measured, Indicated and Inferred only;
Xstrata also estimated that it has 400 mt of Reserves (Proved and Probable)

Australia’s New Coal Supplies and Infrastructure Expansion Plans
New Coal Sources by 2015
Galilee Basin(Queensland)• Alpha A/Kevins Corner: 60 mtpa• Waratah : 40 mtpa• South Galilee : 20 mtpa
Surat Basin (Queensland)• Wandoan : 22 mtpa• Cameby Downs : 15 mtpa
Other Queensland/NSW : 50 mtpa
Total 207 mtpa
Infrastructure Expansion Plans
Rail Hauling Capacity
• From 333 mtpa in 2008 to over
600 mtpa in 2020
Usable Port Handling Capacity
• Total: from 320 mtpa in 2008 to
540 mtpa in 2020
• Steam coal: from 164 mtpa in
2008 to 253 mtpa in 2020
22-23 February 2011Bart Lucarelli, PhD
IBC Coal Markets Conference, Singapore60

Abbott Pt
Hay Point
QueenslandGladstone
NSW Newcastle
22-23 February 2011Bart Lucarelli, PhD
IBC Coal Markets Conference, Singapore61

Coal Terminal Expansion Plans: NSW & Queensland, 2006 – 2020 (in mtpa)
22-23 February 2011Bart Lucarelli, PhD
IBC Coal Markets Conference, Singapore62
Newcastle NSW 2006 2008 2010 2012 2015 2020
1. Kooragang Coal Terminal 64.0 77.0 91.0 101.0 101.0 101.0
2. Carrington Coal Terminal 25.0 25.0 25.0 25.0 25.0 25.0
3. NCIG Coal Terminal (Planned) 0.0 0.0 30.0 45.0 66.0 66.0
Sub Total 89.0 102.0 146.0 171.0 192.0 192.0
Port Kembla NSW 16.0 16.0 16.0 16.0 16.0 16.0
NSW Total 105.0 118.0 162.0 187.0 208.0 208.0
Gladstone Queensland
1. RG Tanna Coal Terminal 51.0 72.0 72.0 72.0 72.0 72.0
2. Barney Point Coal Terminal 7.0 7.0 7.0 7.0 0.0 0.0
3. Wiggins Island (Planned) 0.0 0.0 0.0 0.0 25.0 70.0
Sub Total 58.0 79.0 79.0 79.0 97.0 142.0
Hay Point Queensland
1. Dalrymple Bay Coal Terminal 55.7 85.0 85.0 85.0 85.0 85.0
2. Hay Point Coal Terminal 40.0 44.0 44.0 55.0 55.0 55.0
Sub Total 95.7 129.0 129.0 140.0 140.0 140.0
Abbott Point Queensland 15.0 25.0 50.0 80.0 100.0 100.0
Brisbane Queensland 5.0 5.0 5.0 5.0 8.0 10.0
Queensland Total 173.7 238.0 263.0 304.0 345.0 392.0
TOTAL 278.7 356.0 425.0 491.0 553.0 600.0
Regulatory Uncertainty Related to the new
Mining Law: Could it “kill the goose that lays
the golden egg”?
22-23 February 2011Bart Lucarelli, PhD
IBC Coal Markets Conference, Singapore63

Indonesian Political Risk
• Perennial concern for thermal coalbuyers and Indonesia’s coalproducers.
• Between 1998 and 2003, Centraland Provincial Governmentactions were destroying theinvestment climate in the coalindustry.
• Situation was so bad that the US embassy in Jakarta and industry analysts were predicting the demise of Indonesia’s coal industry.
• Then, in 2004, the GOI startedacting more reasonably.
• In 2008, pendulum swung in thedirection of greater political riskbut is now “balanced”precariously.
Specific Political Events
• Illegal Mining (1998 – 2005)
• Law on Regional Autonomy(22/99)
• Revision of VAT regulations
(GR 144/2000 & 65/2001
• Forestry Law 41/1999
• 5% Coal Export Tax (2005)
• Strikes/ Industrial Actions (on-going)
• Local government attempts to:
– impose onerous new taxes
– set unattractive fiscal termsfor new coal concessions
– nullify agreements and shutdown mining operations
22-23 February 2011Bart Lucarelli, PhD
IBC Coal Markets Conference, Singapore64

Indonesia is now operating under a new mining law that will
result in major changes to the industry’s structure.
Pre-2009 Contract Arrangements
Coal Contracts of Work (CCOWs)
– 1st Gen (1981-90)
– 2nd Gen (1994- 1998)
– 3rd Gen (2000 – 2008)
– Features of 1st Gen CCOWs:
• large concession areas (25K –
100K ha)
• fixed fiscal terms
• little government interference
– 110 3rd Gen CCOWs signed; only 50
were still valid in 2008
KPs
– Contracts let by Local Government
for small areas
Main changes under Mining Act of 2009
• Replacement of CCOWs and KPs with
system of mining licenses known as
IUPs.
• Signed CCOWs remain valid until end
of contract term; KPs converted to
IUPs this year.
• Maximum license area: 15,000 ha
• Greater regulation of all aspects of
mining, including selection of mining
contractors.
• MEMR regulation of domestic market
obligation (DMO) and mandatory coal
reference price (CRP)
22-23 February 2011Bart Lucarelli, PhD
IBC Coal Markets Conference, Singapore65
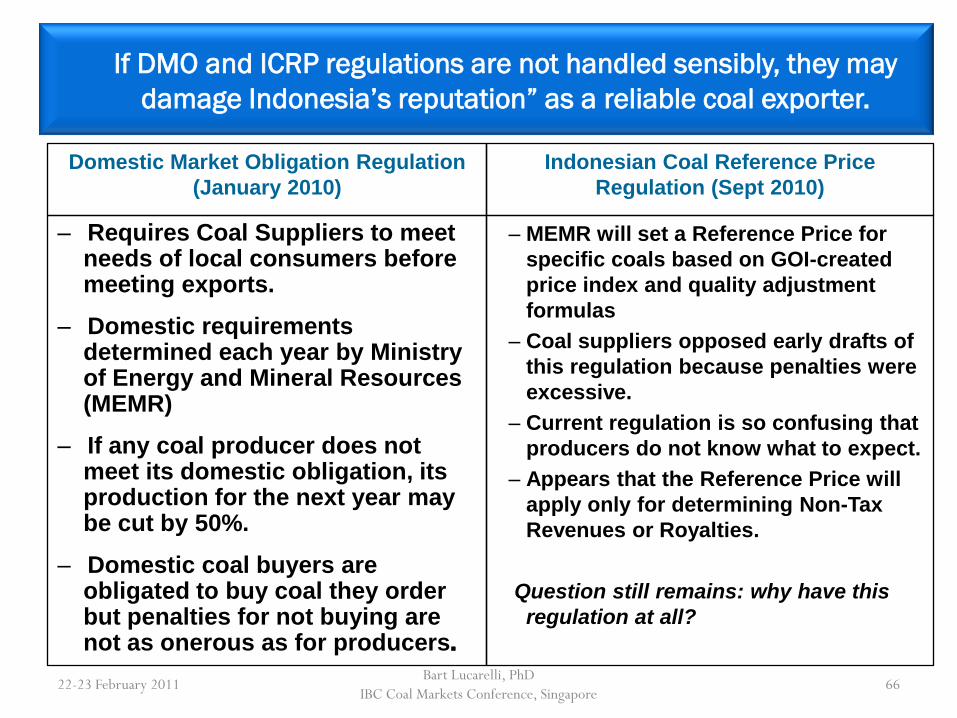
If DMO and ICRP regulations are not handled sensibly, they may
damage Indonesia’s reputation” as a reliable coal exporter.
Domestic Market Obligation Regulation
(January 2010)
– Requires Coal Suppliers to meet needs of local consumers before meeting exports.
– Domestic requirements determined each year by Ministry of Energy and Mineral Resources (MEMR)
– If any coal producer does not meet its domestic obligation, its production for the next year may be cut by 50%.
– Domestic coal buyers are obligated to buy coal they order but penalties for not buying are not as onerous as for producers.
Indonesian Coal Reference Price
Regulation (Sept 2010)
– MEMR will set a Reference Price for
specific coals based on GOI-created
price index and quality adjustment
formulas
– Coal suppliers opposed early drafts of
this regulation because penalties were
excessive.
– Current regulation is so confusing that
producers do not know what to expect.
– Appears that the Reference Price will
apply only for determining Non-Tax
Revenues or Royalties.
Question still remains: why have this
regulation at all?
22-23 February 2011Bart Lucarelli, PhD
IBC Coal Markets Conference, Singapore66

Australia is creating its own share of regulatory & political
uncertainty for coal miners
• Precedent exists for the Australian Commonwealth Government to create
serious damage to investor confidence in the mining sector. The Whitlam Labor
Government, which ruled from 1972 to 1975, damaged mining sector confidence
by:
– imposing price controls on coal exports
– threatening to rescind the licenses of foreign companies such as Utah
International
• The Rudd Government, until Rudd’s resignation in June 2010, tried to impose a
Carbon Pollution Reduction Scheme and a Resource Super Profits Tax of 40%.
• The Resource Super Profits Tax caused delays in the development of the
Gallilee and Surat Basin coal projects and other mining sector investments
22-23 February 2011Bart Lucarelli, PhD
IBC Coal Markets Conference, Singapore67
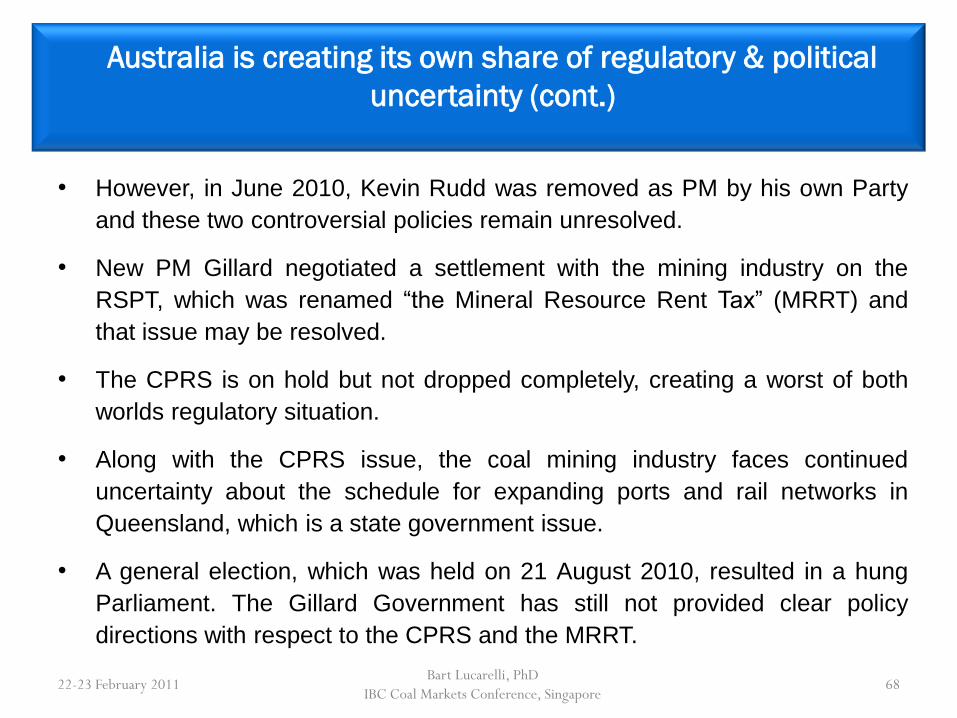
Australia is creating its own share of regulatory & political
uncertainty (cont.)
• However, in June 2010, Kevin Rudd was removed as PM by his own Party
and these two controversial policies remain unresolved.
• New PM Gillard negotiated a settlement with the mining industry on the
RSPT, which was renamed “the Mineral Resource Rent Tax” (MRRT) and
that issue may be resolved.
• The CPRS is on hold but not dropped completely, creating a worst of both
worlds regulatory situation.
• Along with the CPRS issue, the coal mining industry faces continued
uncertainty about the schedule for expanding ports and rail networks in
Queensland, which is a state government issue.
• A general election, which was held on 21 August 2010, resulted in a hung
Parliament. The Gillard Government has still not provided clear policy
directions with respect to the CPRS and the MRRT.
22-23 February 2011Bart Lucarelli, PhD
IBC Coal Markets Conference, Singapore68

Australia Regulatory Risk: What If CPRS is passed into Law?
• Medium Term Impact of CPRS on Australia’s steam coal exports:
– It will largely impact the domestic power market and especially thosepower plants dependent on brown coal. In 2007, domesticconsumption of steam coal was only 12% of total steam coal sales.
– Plants burning black coal may remain unaffected for a number of years.
– Alternatively, if affected adversely, the stranded domestic steam coalwill find its way into the export market.
• Long-term impacts of CPRS on Australia’s steam coal exports:
– May lead to Australia’s major customers (Japan, Korea and Taiwan) adopting similar legislation leading to downturn in demand for Australia’s steam coal exports.
– Reduced long term investments in steam coal mines.
22-23 February 2011Bart Lucarelli, PhD
IBC Coal Markets Conference, Singapore69

Australia Regulatory Risk (cont.)
• Impact of MRRT on Australia’s steam coal exports:
– Appear to be minimal based on responses from BHP-B, Rio Tinto and XSTRATA.
– In any case, the coal price and investment impacts will not be felt for 2-3 years.
– If the MMRT adversely impacts new mine and infrastructure investments, theregion is likely to experience higher steam coal prices due to:
slow growth in Australian steam coal supply resulting from reducedinvestments in Australia’s mining sector; and
higher costs of operation for producing companies.
• Full details concerning the MRRT are not known at this time. But theMRRT appears to address a number of industry concerns:
– The MRRT will only apply to coal and iron ore projects;
– Coal projects will not be taxed retrospectively;
– The threshold return before the MRRT kicks in has been set at 12% as opposed to 7% under the RSPT
– The tax rate has been reduced to 30% from 40%.
22-23 February 2011Bart Lucarelli, PhD
IBC Coal Markets Conference, Singapore70
Summary
• Kalimantan’s coal industry has experienced incredible growth in output and
market power over the past 20 years but its best quality reserves are rapidly
being depleted.
• Infrastructure constraints will not be a problem for the foreseeable future.
• Coal resources and reserves, based on official estimates, appear to be
adequate to meet reasonable forecasts of both domestic and export
requirements for the next two decades and beyond. But how much
confidence can one place in these official numbers while the MEMR denies
the coal industry access to the NEDO- MEMR Coal Resource and Reserve
study?
• The expected switch to low rank (LR) coals create the challenge for
Indonesian coal producers of developing new markets for LR coals, which
will result in a deterioration of Indonesia’s transport cost advantage.
• Moving to LR coals will require Indonesia’s coal producers to develop new
markets and invest in risky and unproven coal drying technologies.
22-23 February 2011Bart Lucarelli, PhD
IBC Coal Markets Conference, Singapore71

Summary
• Regulatory and political risks are, at this point in time, the biggest challenge to
Indonesia’s coal industry. Excessive regulation by the Government of Indonesia
(GOI) may hurt exports by creating uncertainty about amounts available for
export and the minimum price that Buyers must pay.
• Over the past decade, the GOI has implemented laws and regulations
(e.g., forestry law and regional autonomy law) that were well-intentioned, but
either badly structured or incompetently administered.
• Over that same period, the GOI corrected many of its regulatory missteps. The
coal industry, due to its scale and financial strength, was able to weather those
regulatory and political storms. But, for a time, the coal industry’s future was in
doubt.
• The new mining law is likely to turn into another instance of the GOI “muddlingthrough” the process of issuing administratively efficient and fair implementingrules for a well-intentioned law .
22-23 February 2011Bart Lucarelli, PhD
IBC Coal Markets Conference, Singapore72

Summary
• One always hopes that history will repeat itself and the MEMR, after
walking to the edge of the proverbial regulatory cliff, will recognize the
regulatory risks it is creating and start to issue regulations that
support the continued growth of the coal industry and to do so in a
more timely fashion .
• But history does not always repeat itself. If the MEMR chooses to
continue on its current path, it runs the risk of allowing new coal
producers in Queensland to take away existing and new export
markets from Indonesia.
22-23 February 2011Bart Lucarelli, PhD
IBC Coal Markets Conference, Singapore73

Summary
• Australia’s steam coal producers are currently trapped by chronic shortages of
port and rail capacity.
• The previous Australian Government under Rudd created significant regulatory
uncertainty for mining companies. The new Labour government is trying to
right some of these wrongs but it is still too early to say how and when issues
will be resolved.
• The stakes are huge. Massive, high quality steam coal resources remain to be
developed out of the Galilee, Surat and Gunnedah basins.
• Total cash costs will be higher than for Indonesian coals on a per gigajoule
basis but the quality differentials between new Australian and Indonesian LR
coals are so great that it is impossible to make a proper competitive analysis of
these new coals at this time.
• The outlook for both industries is for higher cash costs due to regulatory
changes and risks and the shift in coal types and locations.
22-23 February 2011Bart Lucarelli, PhD
IBC Coal Markets Conference, Singapore74

Appendix
22-23 February 2011Bart Lucarelli, PhD
IBC Coal Markets Conference, Singapore75

- 2005 Reserve Estimates did not include an estimate of “Probable Reserves”.
- Lignites represented a surprisingly large share of “Proven Reserves ”
22-23 February 2011Bart Lucarelli, PhD
IBC Coal Markets Conference, Singapore76
2005 Reserves (million tonnes)
(“ar” or “ad”?)
% of
totalCoal RankCalorific value (kcal/kg)
GAD GARProbable Proven Total
Lignite <5100 <4500 n/a 3,452 3,452 49%
Sub-
bituminous5100– 6100 4500 -5800 n/a 1,828 1,828 26%
Bituminous >6100 >5800 n/a 1,727 1,727 25%
Total n/a n/a n/a 7,007 7,007 100%
Source: Indonesian Coal Book, 2006/2007, ICMA, August 2006, except for CV (gar) estimates, which are from
LP Power.

Reserves (million tonnes)
(“ar or ad”?)
% of totalCoal Rank
Calorific value (kcal/kg)
GAD GARProbable Proven Total
Lignite <5100 <4500 4,292 1,105 5,397 29%
Sub-
bituminous5100– 6100 4500 -5800 8214 2,971 11,185 60%
Bituminous >6100 <5800 744 1,385 2,129 11%
Total n/a n/a 13,250 5,461 18,711 100%
• Reserve estimates in 2007 were 260% higher than the 2005 estimate due to
inclusion of “Probable Reserves”
• Lignites share of total reserves now much smaller than in 2005.
Source: Indonesian Coal Book, 2008/2009, ICMA, July 2008, except estimates of CV (gar), which are from LP Power.
22-23 February 2011Bart Lucarelli, PhD
IBC Coal Markets Conference, Singapore77

Reserves (million tonnes)
(“ar or ad”?)
% of totalCoal Rank
CV
(kcal/kg)
GAD GAR
Probable Proven Total
Lignite <5100 <4500 6,704 1,358 8,062 42%
Sub-
bituminous5100– 6100 4500 -5800 5,871 2,718 8,589 45%
Bituminous >6100 >5800 903 1,453 2,356 13%
Total n/a n/a 13,478 5,529 19,007 100%
Updated 2009 reserve estimates in 2009 remain unchanged from the 2007
estimates but greater share is now in low rank coal category
Source: Indonesian Coal Book, 2010/2011, ICMA, September 2010, except estimates of CV (gar)
and sub-bituminous reserves, which are from LP Power.
22-23 February 2011Bart Lucarelli, PhD
IBC Coal Markets Conference, Singapore78

2003 Coal Resource Estimates
(million tonnes) (unclear whether tonnes are on “ar” or “ad” basis)
% of
totalCoal Rank
Calorific value
(Kcal/kg, gar)Hypothetical Inferred Indicated Measured Total
Lignite <4500 0 1,512 9,581 4,021 15,114 26%
Sub-
bituminous4500 – 5800 476 17,463 10,255 4,997 33,191 57%
Bituminous >5800 57 5,341 697 3,448 9,543 17%
Total n/a 533 24,316 20,533 12,466 57,848 100%
In 2003, lignites were a small share of Indonesia’s coal resource base, due to
the lack of exploration activity directed at low rank coals and perhaps because
the figures were reported on an “air-dried” (ad) basis
Source: Indonesian Coal Book, 2006/2007, ICMA, August 2006
22-23 February 2011Bart Lucarelli, PhD
IBC Coal Markets Conference, Singapore79
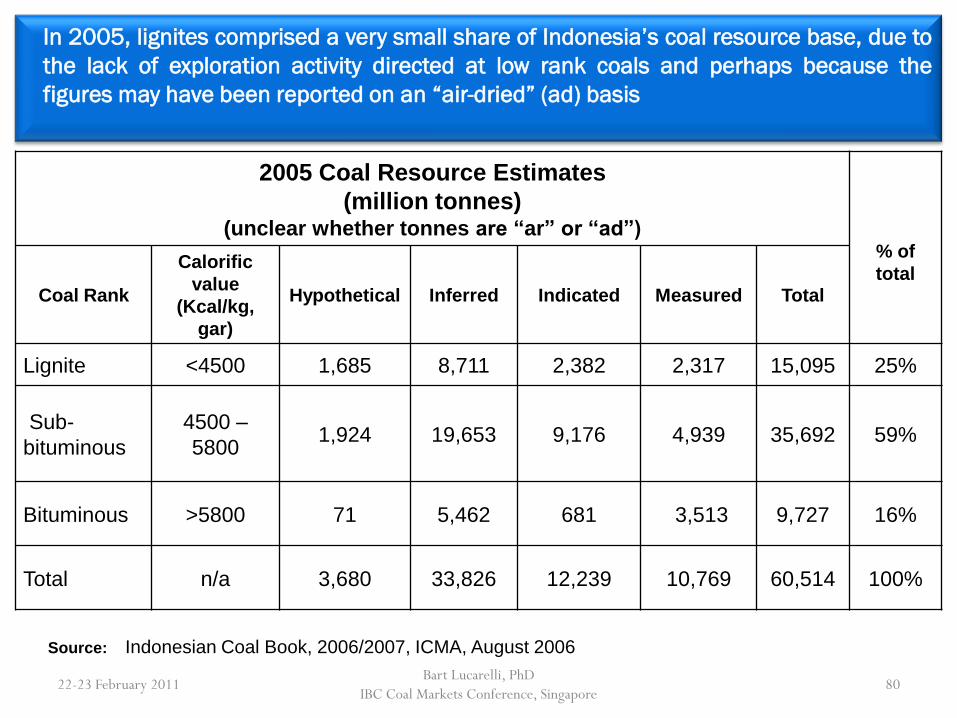
2005 Coal Resource Estimates
(million tonnes) (unclear whether tonnes are “ar” or “ad”)
% of
totalCoal Rank
Calorific
value
(Kcal/kg,
gar)
Hypothetical Inferred Indicated Measured Total
Lignite <4500 1,685 8,711 2,382 2,317 15,095 25%
Sub-
bituminous
4500 –
58001,924 19,653 9,176 4,939 35,692 59%
Bituminous >5800 71 5,462 681 3,513 9,727 16%
Total n/a 3,680 33,826 12,239 10,769 60,514 100%
In 2005, lignites comprised a very small share of Indonesia’s coal resource base, due to
the lack of exploration activity directed at low rank coals and perhaps because the
figures may have been reported on an “air-dried” (ad) basis
Source: Indonesian Coal Book, 2006/2007, ICMA, August 2006
22-23 February 2011Bart Lucarelli, PhD
IBC Coal Markets Conference, Singapore80

2007 Resources
(million tonnes)
(unclear whether tonnes are “ar” or “ad”)% of
totalCoal Rank
Calorific
value
(Kcal/kg, gar)
Hypothetical Inferred Indicated Measured Total
Lignite <4500 5,058 6,579 3,652 5,750 21,039 23%
Sub-
bituminous4500 – 5800 16,925 22,104 9,042 10,867 58,938 63%
Bituminous >5800 1,650 6,515 968 4,293 13,426 14%
Total n/a 23,633 35,198 13,662 20,910 93,403 100%
– 2007 Resource estimates reflect findings of a Joint NEDO/Badan Geologist study
– 54% increase over 2005 due to increase in hypothetical and measured resources.
– Lignites: relatively small share of Indonesia’s coal resources base due to a “air-dried”
reporting basis
Source: Indonesian Coal Book, 2008/2009, ICMA, July 2008
22-23 February 2011Bart Lucarelli, PhD
IBC Coal Markets Conference, Singapore81
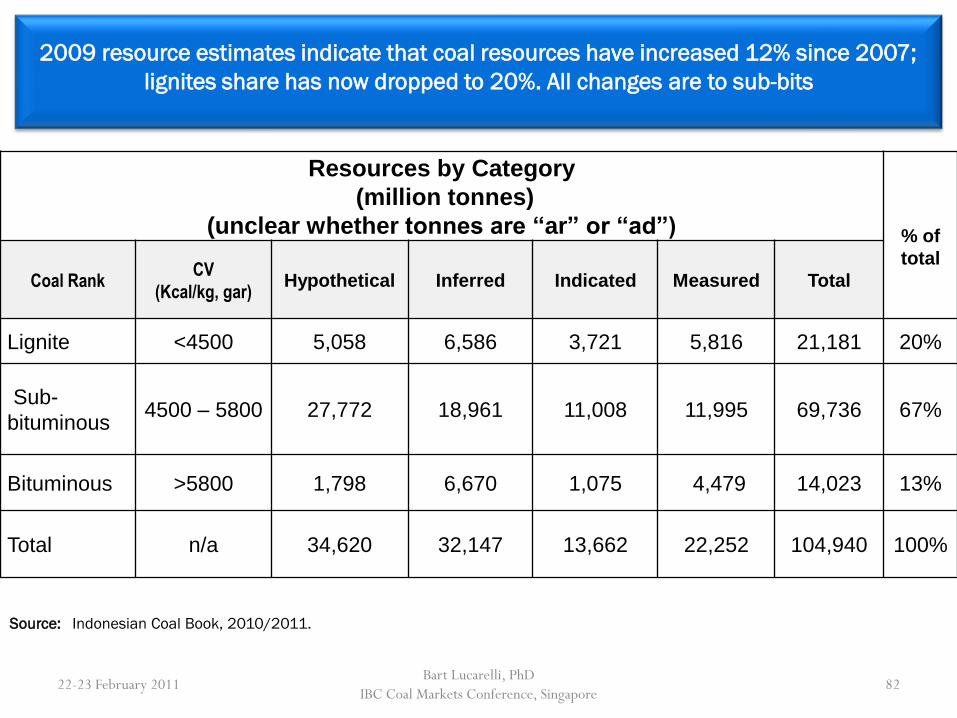
Resources by Category
(million tonnes)
(unclear whether tonnes are “ar” or “ad”) % of
total
Coal RankCV
(Kcal/kg, gar)Hypothetical Inferred Indicated Measured Total
Lignite <4500 5,058 6,586 3,721 5,816 21,181 20%
Sub-
bituminous4500 – 5800 27,772 18,961 11,008 11,995 69,736 67%
Bituminous >5800 1,798 6,670 1,075 4,479 14,023 13%
Total n/a 34,620 32,147 13,662 22,252 104,940 100%
2009 resource estimates indicate that coal resources have increased 12% since 2007;
lignites share has now dropped to 20%. All changes are to sub-bits
Source: Indonesian Coal Book, 2010/2011.
22-23 February 2011Bart Lucarelli, PhD
IBC Coal Markets Conference, Singapore82

2005 Resources by Category
(Million Tonnes)
(unclear whether tonnes are “ar” or “ad”)
Province Hypothetical Inferred Indicated Measured Total % of Total
Sumatra 1,862 12,932 11,675 928 27,397 45%
Kalimantan1,818 20,706 564 9,820 32,908 54%
Other0 188 1 21 210 1%
Total 3,680 33,826 12,240 10,769 60,515 100.0%
Sumatra and Kalimantan accounted for 99% of Indonesia’s Resources Base in
2005 with Kalimantan accounting for 54% of resources base.
Source: Indonesian Coal Book, 2006/2007, ICMA, August 2006
22-23 February 2011Bart Lucarelli, PhD
IBC Coal Markets Conference, Singapore83

2007 Resources by Category
(Million Tonnes)
(unclear whether tonnes are “ar” or “ad”)
Province Hypothetical Inferred Indicated Measured Total % of Total
Sumatra 20,148 13,949 10,735 7,699 52,532 56%
Kalimantan 3,389 21,029 2,894 13,156 40,468 43%
Other 96 220 33 55 403 1%
Total 23,633 35,198 13,662 20,910 93,403 100.0%
In 2007, Sumatra and Kalimantan continued to account for 99% of Indonesia’s
Resource Base. Today, Sumatra is now estimated to hold a larger share of total
resources with the bulk of those new resources being hypothetical resources.
Source: Indonesian Coal Book, 2008/2009, ICMA, July 2008
22-23 February 2011Bart Lucarelli, PhD
IBC Coal Markets Conference, Singapore84

Indonesia’s Coal Resources by Province, 2009
22-23 February 2011Bart Lucarelli, PhD
IBC Coal Markets Conference, Singapore85
Hypothetical Inferred Indicated Measured Total
Sumatra 20,154 13,949 10,634 7,699 52,437
Java 5 7 - 2 14
Kalimantan 14,378 18,051 5,137 14,536 52,101
Sulawesi - 147 33 53 233
Maluku 2 - - - 2
Papua 89 64 - - 153
TOTAL 34,628 32,218 15,804 22,290 104,940
ProvinceResource Category
Source: Indonesian Coal Book, 2010/2011