Embed Size (px)
Citation preview

“A Systems Engineering Approach For Balancing Powered Trailer Requirements”
Dana Peterson (CSEP Acq) [email protected]
(314) 553-4599
• Illustrate a sample of Systems Engineering tools used on the Powered Trailer project to:– Resolve requirement issues– Understand relationships between
requirements– Prioritize requirements– Get consensus on the best technology
options– Provide the best “balanced” overall
solution
Purpose of Presentation
2INCOSE BRIEF @ DRS Technologies

• Improve combined truck and trailer grade climbing and mobility in soft soil terrain conditions
• Provide cargo and health status reporting over the C4I network
• Provide limited trailer self-mobility for climbing aircraft/ship ramps under operator control
• Provide on-board DC/AC export power for powering shelters and other equipment
Powered Trailer Project Goals
Powered Trailer
Focus is on Trailer Drive Technologies
3INCOSE BRIEF @ DRS Technologies

• Requirements Traceability/ Rationale Matrix (RTRM)
• N2 Diagram• Analytic Hierarchy Process
(AHP)• Quality Function Deployment
(QFD)• Morphological Analysis (MA)• Architecture Views• Trade Study• Sensitivity Analysis
• Affinity Diagram• Tree Diagram• Fishbone Diagram• Digraph• Blueprinting• Arrow Diagram• Matrix Diagram• Relations Diagram• Process Decision Program Chart• Flow Diagram• Context Diagram• Pugh Matrix• Specification
Sample SE Tools
4INCOSE BRIEF @ DRS Technologies

Systems Engineering Approach
PerformanceSpec
UserRequirements
Requirements Traceability/Rationale Matrix (RTRM)
RequirementPrioritizationQFD HouseOf Quality
Power TrailerDesign Alternatives
Mobility Analysis
Trade Studies-Performance-Payload-C-130 Transport-R&M-Cost -Schedule
Technology Options
Sensitivity Analysis
PreferredSolution
AHP MA
LegendAHP = Analytical Hierarchy Process
QFD = Quality Function Deployment
MA = Morphological Analysis
An Iterative Hierarchical Process That Provides the Best Overall Requirements Balance
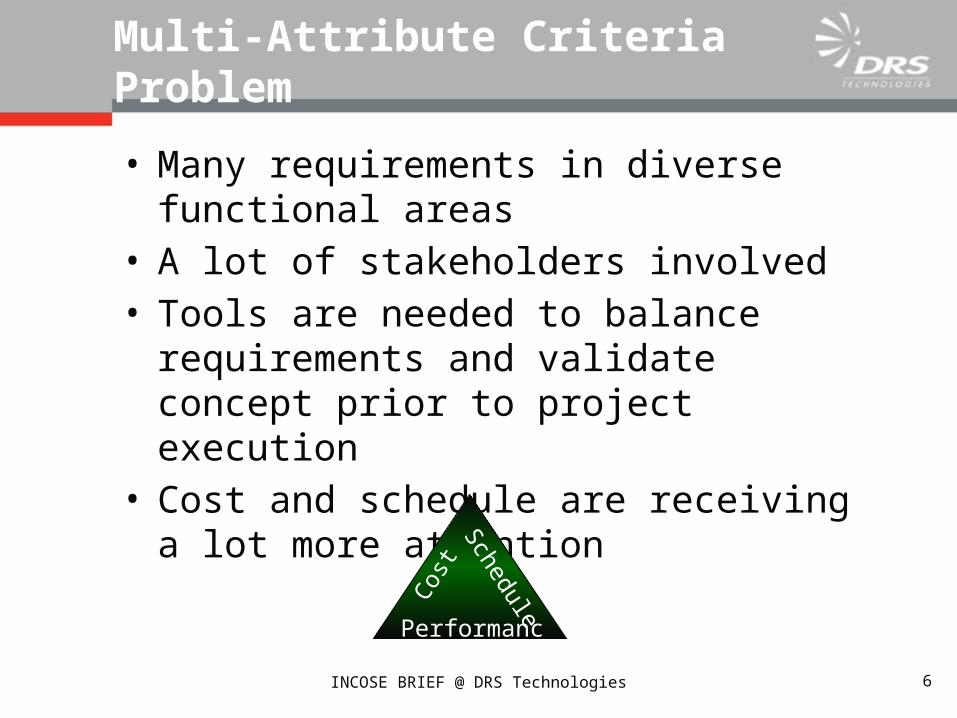
• Many requirements in diverse functional areas
• A lot of stakeholders involved• Tools are needed to balance requirements
and validate concept prior to project execution
• Cost and schedule are receiving a lot more attention
Multi-Attribute Criteria Problem
Performance
Cos
t
Schedule
6INCOSE BRIEF @ DRS Technologies

Solution Synthesis is Becoming More Challenging
Design for AdaptabilityDesign for Adaptability
Performance
Cos
t
Schedule
Design for Dynamic Value
Open Architecture
Modular Systems Approach Design To Cost
Spiral Development Rapid Response
Eco-Consciousness
People Resources
Company Mergers
Reorganization
Economic
Political
Cultural
Technology Advances
Part Obsolescence
Robust Design Techniques
Six Sigma
Agile DesignSecurity
7INCOSE BRIEF @ DRS Technologies

• Prioritizing Requirements:– Spiral 1, 2, 3 Evolution– Threshold Vs Objective– Key Performance Parameters Vs Key
System Attributes Vs Additional Attributes– Tier Levels 1, 2, 3, 4
• Asking:– What Is Possible?– What Can Be Done Within Program
Constraints and Current Technology?– What Are The Tradeoffs?
Customers Now:
Provide Me With The Best Balanced Solution!
8INCOSE BRIEF @ DRS Technologies
Item Reqmt/Short Description
Source Comments/Requirements Rationale Spiral 1
Spiral 2
Spiral 3 Prod
Draft Trailer Requirement based on FTTS ORD unless specified otherwise
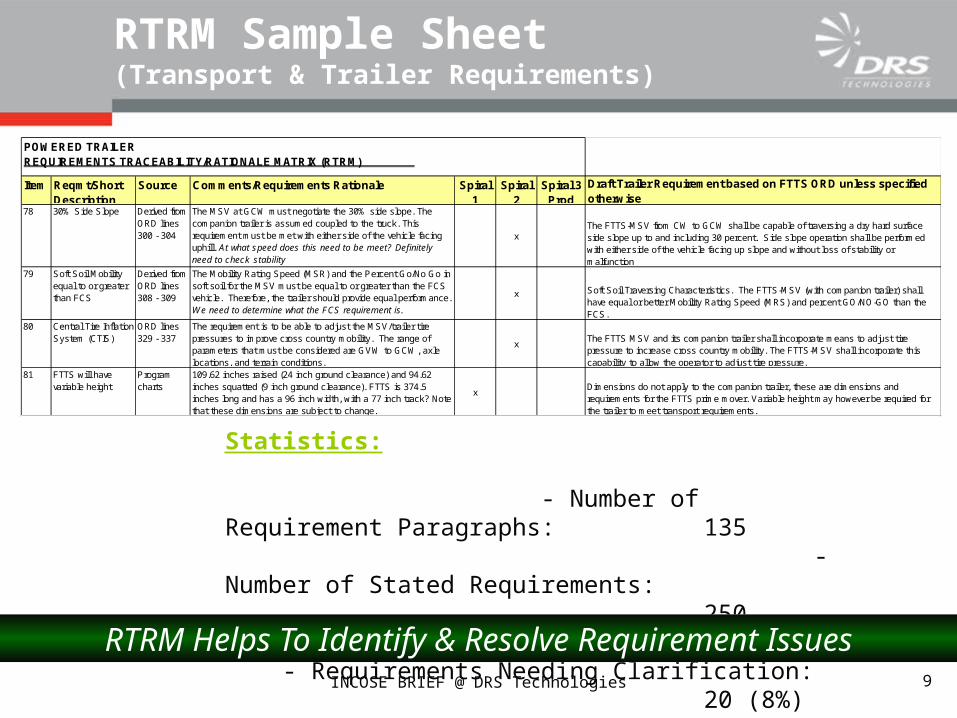
78 30% Side Slope Derived from ORD lines 300 - 304
The MSV at GCW must negotiate the 30% side slope. The companion trailer is assumed coupled to the truck. This requirement must be met with either side of the vehicle facing uphill. At what speed does this need to be meet? Definitely need to check stability
xThe FTTS-MSV from CW to GCW shall be capable of traversing a dry hard surface side slope up to and including 30 percent. Side slope operation shall be performed with either side of the vehicle facing up slope and without loss of stability or malfunction
79 Soft Soil Mobility equal to or greater than FCS
Derived from ORD lines 308 - 309
The Mobility Rating Speed (MSR) and the Percent Go/No Go in soft soil for the MSV must be equal to or greater than the FCS vehicle. Therefore, the trailer should provide equal performance. We need to determine what the FCS requirement is.
x Soft Soil Traversing Characteristics. The FTTS-MSV (with companion trailer) shall have equal or better Mobility Rating Speed (MRS) and percent GO/NO-GO than the FCS.
80 Central Tire Inflation System (CTIS)
ORD lines 329 - 337
The requirement is to be able to adjust the MSV/trailer tire pressures to improve cross country mobility. The range of parameters that must be considered are GVW to GCW, axle locations, and terrain conditions.
xThe FTTS MSV and its companion trailer shall incorporate means to adjust tire pressure to increase cross country mobility. The FTTS-MSV shall incorporate this capability to allow the operator to adjust tire pressure.
81 FTTS will have variable height
Program charts
109.62 inches raised (24 inch ground clearance) and 94.62 inches squatted (9 inch ground clearance). FTTS is 374.5 inches long and has a 96 inch width, with a 77 inch track? Note that these dimensions are subject to change.
xDimensions do not apply to the companion trailer, these are dimensions and requirements for the FTTS prime mover. Variable height may however be required for the trailer to meet transport requirements.
POWERED TRAILER REQUIREMENTS TRACEABILITY/RATIONALE MATRIX (RTRM)
RTRM Sample Sheet(Transport & Trailer Requirements)
Statistics: - Number of Requirement Paragraphs: 135 - Number of Stated Requirements: 250 - Requirements Needing Clarification: 20 (8%) - Number of Requirement Disconnects: 12 (5%) Total Requirement Issues: 32 (13%)
RTRM Helps To Identify & Resolve Requirement Issues9INCOSE BRIEF @ DRS Technologies

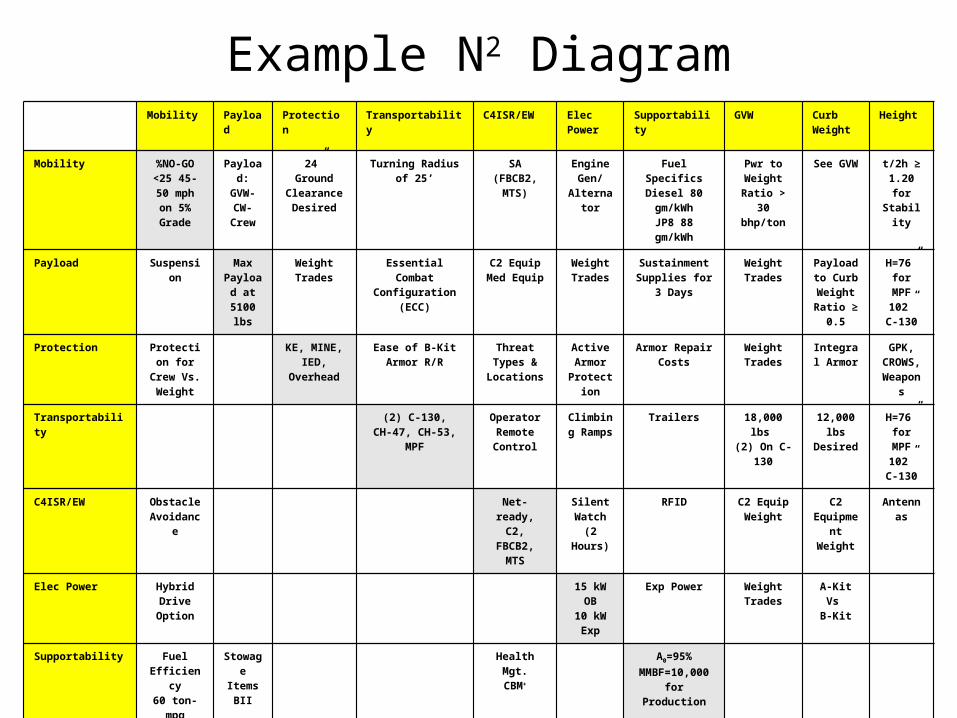
• The N2 diagram illustrates interfaces and relationships between system requirements, parameters, and metrics
• System functions or elements are listed in the diagonal boxes
• Interfaces and relationships are identified in the off-diagonal boxes. Data flows in a clockwise direction between functions or elements
The next example illustrates a modified form of N2 where requirements have been listed in the diagonal boxes
System N2 Diagram
Helps To Surface Interface IssuesN2 Helps To Identify Interface Issues
10INCOSE BRIEF @ DRS Technologies
Example N2 DiagramMobility Payload Protection Transportability C4ISR/EW Elec
PowerSupportability GVW Curb
WeightHeight
Mobility %NO-GO <25 45-50
mph on 5% Grade
Payload: GVW-CW-Crew
24” Ground Clearance Desired
Turning Radius of 25’ SA (FBCB2, MTS)
Engine Gen/
Alternator
Fuel SpecificsDiesel 80 gm/kWh
JP8 88 gm/kWh
Pwr to Weight Ratio
>30 bhp/ton
See GVW t/2h ≥ 1.20 for Stability
Payload Suspension Max Payload at 5100
lbs
Weight Trades Essential Combat Configuration (ECC)
C2 EquipMed Equip
Weight Trades
Sustainment Supplies for 3
Days
Weight Trades
Payload to Curb
Weight Ratio ≥
0.5
H=76” for MPF 102”
C-130
Protection Protection for Crew Vs.
Weight
KE, MINE, IED, Overhead
Ease of B-Kit Armor R/R
Threat Types & Locations
Active Armor
Protection
Armor Repair Costs
Weight Trades
Integral Armor
GPK, CROWS,
Weapons
Transportability (2) C-130,CH-47, CH-53, MPF
Operator Remote Control
Climbing Ramps
Trailers 18,000 lbs (2) On C-130
12,000 lbs Desired
H=76” for MPF 102”
C-130
C4ISR/EW Obstacle Avoidance
Net-ready, C2, FBCB2, MTS
Silent Watch
(2 Hours)
RFID C2 Equip Weight
C2 Equipment Weight
Antennas
Elec Power Hybrid Drive Option
15 kW OB10 kW Exp
Exp Power Weight Trades
A-Kit Vs B-Kit
Supportability Fuel Efficiency
60 ton-mpg400 mile
range
StowageItems
BII
Health Mgt.CBM+
A0=95%MMBF=10,000for Production
GVW Acceleration 13,000 lbs Max.Axel Loading
Not Specified
GVW: CW + Payload
+ Crew
Height Impacts Weight
Curb Weight Weight Trades
Weight Trades 13,000 lbs Max.Axel Loading
Not Specified
Height Impacts Weight
Height Suspension < 157.5” for Berne
Tunnel

• Proven, effective means to deal with complex decision making involving multiple criteria
• Captures both subjective and objective evaluation measures• A hierarchal decomposition of requirements or goals is
accomplished• Pair wise comparisons of requirement attributes are made and
relative scores computed for each leaf of the hierarchy• Scores are then synthesized yielding the relative weights at each
leaf as well as for the overall model• A coherent assessment is reached when Inconsistency Ratio < 0.1
(http://people.revoledu.com/kardi/tutorial/AHP/Consistency.htm)
Analytical Hierarchy Process (AHP)
AHP Helps to Determine Relative Importance
12INCOSE BRIEF @ DRS Technologies

ModelLevel 1
Mobility Transportability Survivability C4IRS/EWPower
ManagementSupportability Payload
ModelLevel 2
GVW Driver Vision Stability Speed HP/ton Operational
Range
CW Height 76in Axle Loading 30 min Ready
CREW2.1 SD Weapon CBRNE Signature Mgt Ballistics
Protection
C3 SA Net
Security Bus
Architect
Power Buses OB Power Export Power Electrical
Storage
RAM Health Mgt HFE O&S Cost Commonality
Flatrack (3,200 lb)
Cargo (22,000 lb)
ModelLevel 3
Fuel efficiency (ton-mpg)
Fuel Capacity Armor
Protection
LVOSS Visual
signature Thermal
signature EM signature Direct Fire IED Mine Anti-tank Blast
Protection Seats
Crush resistant roof
ModelLevel 4
Fuel Specifics
ECU Map
Legend: GWV =Gross Vehicle Weight, CW = Curb Weight, C3 = Command, Control, Communications, SD = Self-Defense, SA = Situational Awareness, OB = On-Board, DVE = Driver Vision Enhancer, CBRNE = Chemical, Biological, Radiological, Nuclear Effects, IED =Improvised Explosive Device, LVOSS = Light Vehicle Obscuration Smoke System, LCC = Life Cycle Cost, UPC = Unit Production Cost
Requirements Model Breakdown
13INCOSE BRIEF @ DRS Technologies
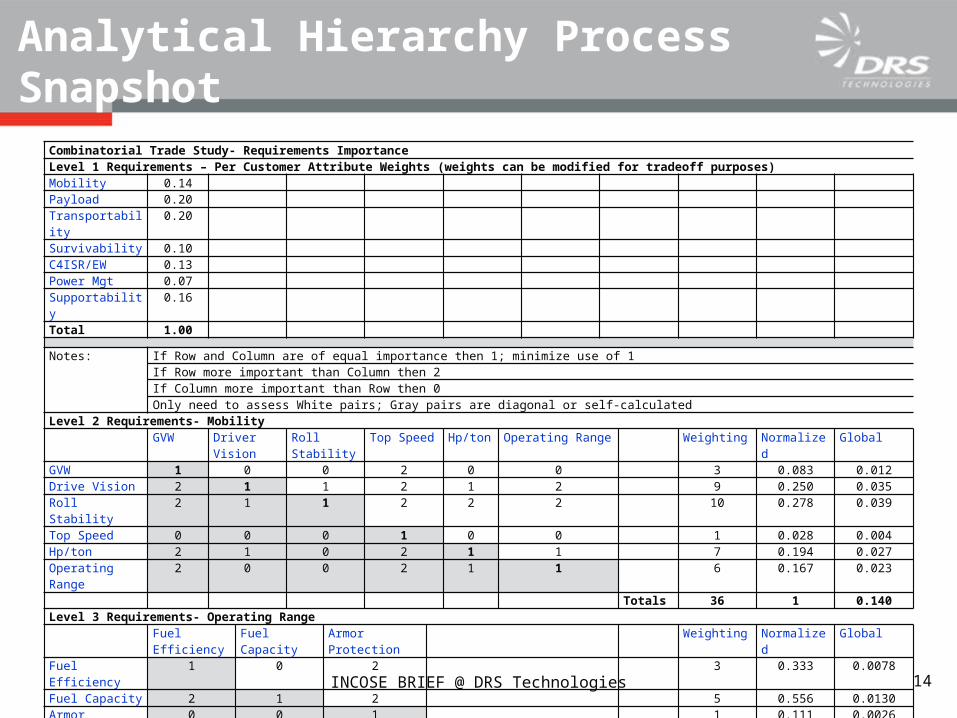
Combinatorial Trade Study- Requirements ImportanceLevel 1 Requirements – Per Customer Attribute Weights (weights can be modified for tradeoff purposes)Mobility 0.14Payload 0.20Transportability 0.20Survivability 0.10C4ISR/EW 0.13Power Mgt 0.07Supportability 0.16Total 1.00
Notes: If Row and Column are of equal importance then 1; minimize use of 1If Row more important than Column then 2If Column more important than Row then 0Only need to assess White pairs; Gray pairs are diagonal or self-calculated
Level 2 Requirements- MobilityGVW Driver Vision Roll Stability Top Speed Hp/ton Operating Range Weighting Normalized Global
GVW 1 0 0 2 0 0 3 0.083 0.012Drive Vision 2 1 1 2 1 2 9 0.250 0.035Roll Stability 2 1 1 2 2 2 10 0.278 0.039Top Speed 0 0 0 1 0 0 1 0.028 0.004Hp/ton 2 1 0 2 1 1 7 0.194 0.027Operating Range 2 0 0 2 1 1 6 0.167 0.023
Totals 36 1 0.140Level 3 Requirements- Operating Range
Fuel Efficiency Fuel Capacity Armor Protection Weighting Normalized GlobalFuel Efficiency 1 0 2 3 0.333 0.0078Fuel Capacity 2 1 2 5 0.556 0.0130Armor Protection 0 0 1 1 0.111 0.0026
Totals 9 1.000 0.023Level 4 Requirements- Fuel Efficiency
Fuel Specifics ECU Map Weighting Normalized GlobalFuel Specifics 1 2 3 0.750 0.0058ECU Map 0 1 1 0.250 0.0019
Totals 4 1 0.0078
Analytical Hierarchy Process Snapshot
14INCOSE BRIEF @ DRS Technologies
• There are many customers• There are stated and unstated requirements• QFD helps to prioritize requirements and their
tradeoffs• QFD makes invisible requirements and strategic
advantages visible• QFD helps to define which improvements provide
the most gain• QFD promotes Team Consensus• QFD provides a documented audit trail for decisions
Quality Function Deployment (QFD)
The “House of Quality” Captures the Voice of the Customer15INCOSE BRIEF @ DRS Technologies

“House of Quality”
Interrelationships between Technologies
Technologies (Voice of the Company)
Requirements/Desires (Voice of the Customer)
Planning Matrix -Requirements Importance -Percent Improvement Desired -Marketing Competition Assessment
Relationships between Requirements and Technologies
Prioritized Technologies
16INCOSE BRIEF @ DRS Technologies

• Two meetings were conducted with shareholders to get consensus on the Powered Trailer “House of Quality”
• Body of Matrix– Common definition/scope for each requirement and
technical attribute agreed to– Reinforced relationship values - by convention:
• (0-none, 1-weak, 3-moderate, 9-strong)– Recognized the most important associations– Segregated positive and negative correlations,
ensured they were mutually exclusive– Achieved Consensus, Consensus, Consensus
• QFD was finalized via (2) additional WebEx conferences
Powered Trailer QFD Analysis
17INCOSE BRIEF @ DRS Technologies

+-
+DIRECTION OF MOVEMENT ↑ ↓ ↑ - + ↑Technology Areas Propulsion Power Mgt & Control Remote Operations Suspension Axles Steering Braking Cargo Handling Survivability Storage Tech.Diagnostics/Prognostics PLANNING MATRIX
Trailer Cu
sto
mer
Im
po
rtan
ce
Non
e-to
wed
onl
y
Mec
hani
cal P
TO
Ele
ctric
PT
O
Hyb
rid P
ropu
lsio
n
ICE
onl
y
Con
tinuo
us
The
rmos
tat
Var
iabl
e
Wire
less
(R
F)
Um
bilic
al
Sus
pen
sion
Dua
l Vs
3 A
xles
Ste
erin
g
Bra
king
MIP
Adj
usta
ble
Hei
ght d
eck
Inte
llige
nt L
HS
Car
go T
agg
ing
Con
figue
d Lo
ad S
W
Sm
art t
ie d
own
App
lique
arm
our
Sig
natu
re m
gt.
Pow
er S
tora
ge
Aut
o ID
Tec
hnol
ogy
Sta
ndar
d s
eria
l bus
Sen
sors
Cu
sto
mer
Im
po
rtan
ce
Imp
rove
men
t F
acto
r
Ove
rall
Wei
gh
tin
g
Per
cen
tag
e o
f T
ota
l
Requirements PERFORMANCEMaximize payload 4 1 1 3 9 1 9 3 1 4 1.00 4 3.1Dash speed (deleted) 0 0.00 0 0Minimize turning radius 3 3 9 3 1.50 4.5 3.5Step up vertical obstacle 2 3 3 9 3 2 1.50 3 2.3Fording 4 1 1 3 4 1.15 4.6 3.6Cross trenches 3 3 3 9 9 3 1.30 3.9 360% longitudinal slope 4 9 9 9 4 1.25 5 3.930% side slope 4 9 9 4 1.00 4 3.1Transportability - via surface 5 3 3 5 1.50 7.5 5.8Transportability - via air 5 9 9 9 3 3 3 3 1 3 5 1.20 6 4.6No mobility degradation 5 9 9 9 9 9 1 9 9 3 5 2.00 10 7.7Range (fuel economy) 5 3 3 3 9 5 1.30 6.5 5Self-charging system 2 3 9 2 1.00 2 1.5Pwr & control from truck 3 1 1 3 3 9 9 3 9 3 3 1 3 1.25 3.8 2.9Trailer has own brakes 5 9 5 1.00 5 3.9Trailer provides export pwr 2 9 9 9 3 3 2 1.25 2.5 1.9Enhanced survivability 2 1 1 9 2 1.20 2.4 1.9Communicate with truck 5 9 9 9 9 9 5 1.30 6.5 5"FTTS" Prime Mover Interoperability5 9 3 9 9 3 3 3 3 3 3 3 3 1 1 3 9 5 1.00 5 3.9"Current" Prime Mover Interoperability3 9 3 3 1 3 1 1 1 3 1.10 3.3 2.6Interface with flatracks/cargo 5 9 9 9 9 5 1.25 6.3 4.8Auto self fuel 1 9 9 1 1.10 1.1 0.9O&S COST RELATEDMaintenance Ratio 0.025 5 9 3 3 1 1 1 1 9 1 9 3 3 9 9 1 1 1 5 1.40 7 5.4On-board fluid analysis 3 1 1 1 1 9 3 1.10 3.3 2.6Embedded diag/prognostics 5 1 1 1 9 9 9 5 1.20 6 4.6Fault isolation (deleted) 0 0.00 0 0Configuration Commonality 4 3 3 3 3 3 3 3 3 3 3 3 3 3 3 3 3 3 3 3 3 9 9 9 4 1.25 5 3.9Min.storage system maint. (deleted) 0 0.00 0 0Reliability 5 9 3 3 1 1 3 1 9 3 9 3 3 3 1 9 3 3 9 5 1.20 6 4.6ENVIRONMENTAL (Temp/EMI/Vib/Shock/Corrosion) 4 9 3 1 3 1 1 1 4 1.30 5.2 4
TECHNICAL DIFFICULTY(TD) 3 2 2 1 2 2 2 1 1 2 2 2 2 2 2 2 2 2 2 2 2 1 2 2 2 1 129 100TD Normalized 1.5 1.0 1.0 0.5 1.0 1.0 1.0 0.5 0.5 1.0 1.0 1.0 1.0 1.0 1.0 1.0 1.0 1.0 1.0 1.0 1.0 0.5 1.0 1.0 1.0 0.5COST FACTOR 3 2 2 1 2 2 2 2 1 2 2 1 2 2 2 1 1 2 2 2 1 2 3 2 2 1Cost Factor Normalized 1.5 1.0 1.0 0.5 1.0 1.0 1.0 1.0 0.5 1.0 1.0 0.5 1.0 1.0 1.0 0.5 0.5 1.0 1.0 1.0 0.5 1.0 1.5 1.0 1.0 0.5
TECHNOLOGY PRIORITIES 504 73 95 89 354 0 90 45 39 150 469 75 237 323 125 77 110 15 33 80 11 29 489 186 197 63 3959PERCENTAGE OF TOTAL 12.7 1.9 2.4 2.2 9.0 0.0 2.3 1.1 1.0 3.8 11.8 1.9 6.0 8.2 3.2 2.0 2.8 0.4 0.8 2.0 0.3 0.7 12.4 4.7 5.0 1.6 100
Powered Trailer “House of Quality”
Powered Trailer “House of Quality”
INCOSE BRIEF @ DRS Technologies 19
Trailer QFD

QFD Relative Ranking0
10
20
30
40
50
60
70
80
90
100 Suspension
ICE
Hybrid
Braking
Pwr Storage
Steering
Towed
LHS
Serial Bus
Auto ID
Adj. Deck
3 Axles
Umbilical
MIP
Elect PTO
Smart Tie
Mech PTO
Signature Mgt
Wireless
(Excludes Technical Difficulty and Cost Factors)
QFD Relative Ranking
20INCOSE BRIEF @ DRS Technologies
• Combining individual preferences to form a group utility function presents a problem
• The use of averaged group preference data in product design optimization can lead to erroneous results
• This problem may not always be self-evident in the analysis of complex systems and products
Arrow’s Impossibility Theorem (A Word of Caution!)
Provides a Hierarchical Model For Doing TradeoffsGroup Consensus Must Be Reached To Avoid This Problem
21INCOSE BRIEF @ DRS Technologies

• Designed for multi-dimensional, non-quantifiable problem complexes
• Explores boundary conditions• Investigates the total set of possible
relationships and “configuration” alternatives• Rules out alternatives that are inconsistent
or incompatible using cross-consistency assessment
Morphological Analysis
MA Ensures No Alternative is Overlooked
22INCOSE BRIEF @ DRS Technologies

Morphological Field Example:
75 cells or configurations (Zwicky, 1969, p. 118.)
3-Parameters: color, texture, size
Color: 5 discrete values: red, green, blue, yellow, brown
Texture: 5 discrete values: smooth, serrated, rough, grainy, bumpy
Size: 3 discrete values: large, medium, small
23INCOSE BRIEF @ DRS Technologies

MA-Trailer Drive AlternativesNo.
Vehicle Output
Energy Form
Trailer Drive Consistency? YES/NO
1 Mechanical Mechanical YES
2 Mechanical Electrical NO
3 Mechanical Hydraulic NO
4 Mechanical ICE NO
5 Electrical Mechanical NO
6 Electrical Electrical YES
7 Electrical Hydraulic NO
8 Electrical ICE NO
9 Hydraulic Mechanical NO
10 Hydraulic Electrical NO
11 Hydraulic Hydraulic NO
12 Hydraulic ICE NO
13 None Mechanical NO
14 None Electrical NO
15 None Hydraulic NO
16 None ICE YES
17 None Hybrid Electric YES
18 None Hybrid Hydraulic
YES
(5) Drive Alternatives Remain in Trade Space
Vehicle Output Energy Form
Trailer Drive Type
Mechanical Mechanical
Electrical Electrical
Hydraulic Hydraulic
None Internal Combustion Engine (ICE)
Hybrid Electric
Hybrid Hydraulic
24INCOSE BRIEF @ DRS Technologies
Number of Configurations or Alternatives 4 X 6 = 24
Ruled out Combinations of Output Energy and Hybrid 3 X 2 = 06
18 Alternatives to Investigate→

• ALT #1 Electric PTO -Electrical Power Take Off provided by the transport
• ALT #2 HEV -Series Hybrid Electric Vehicle with ICE, generator, and battery pack
• ALT #3 HHV -Hybrid Hydraulic Vehicle with hydraulic power provided by an ICE driven power pack
• ALT #4 Mechanical PTO -Mechanical Power Take Off provided by the transport
• ALT #5 ICE Drive -ICE (210 HP with 340 ft-lb torque) with conventional drive train
Powered Trailer Design Concepts
ICE = Internal Combustion Engine
25INCOSE BRIEF @ DRS Technologies
• 395/85 R20 XZL tires• Central Tire Inflation System (CTIS)• Pneumatic Anti-Lock Brake System (ABS)• Serial communications with transport
– Control of mobility assist and CTIS– Receipt of trailer health and cargo load
status• Independent Suspension• Trailer bed basic design
Features Common To All Concepts
26INCOSE BRIEF @ DRS Technologies

Transport
Battery Pack 36 kW-hr(25) 120 amp-hr batteries motor
motor
Control box/Inverter
Control box/InverterDisplay
TrailerS
tee
rin
ga
ctu
ato
r
System Controller DC-AC Inverter
Air
tan
ks
CT
IS
ABS
pump
radiator
Operator RemoteControl Unit
Export Power
Note: Brake and CTIS lines not shown for clarity
mechanical
200 Kw 300 vdc
12/24 vdcfor electronics,trailer lights, etc.
pneumatic
discrete
serial
ALT #1 Elect PTO
Transport
Battery Pack 36 kW-hr(25) 120 amp-hr batteries
motormotor Control box/Inverter
Control box/InverterDisplay
Trailer
Ste
erin
gac
tua
tor
System Controller DC-AC Inverter
Air
tank
s
CT
IS
ABS
pump
radiator
Operator RemoteControl Unit
Export Power
Note: Brake and CTIS lines not shown for clarity
mechanical
12/24 vdcfor electronics,trailer lights, etc.
pneumatic
discrete
serial GeneratorICE
fue
ltan
k
ALT #2 HEV
ALT #3 HHV
Display
Transport
Trailer
mechanical
12/24 vdc
pneumatic
discrete
serial
System Controller
Operator RemoteControl Unit
Display
for electronics,trailer lights,etc.
ABS
Note: Brake and CTISlines to wheels not shownfor clarity
Pump/motor
High pressure accumulator
Low pressurereservoir
hydraulic
ICE
ALT #4 Mech PTO
Display
Transport
Trailer
mechanical
12/24 vdc
pneumatic
discrete
serial
System Controller Display
for electronics,trailer lights,etc.
ABS
Note: Brake and CTISlines to wheels not shownfor clarity
PTO
ALT #5 ICE Drive
Display
Transport
Trailer
mechanical
12/24 vdc
pneumatic
discrete
serial
DC-AC Inverter
Export Power
System Controller
Operator RemoteControl Unit
Display
for electronics,trailer lights,etc.
ABS
Note: Brake and CTISlines to wheels not shownfor clarity
ICEGenerator CVT
FuelTank
Architectural Views for all Five Alternatives
Concepts
27INCOSE BRIEF @ DRS Technologies

ALT#1 Electric
PTO
ALT#2 HEV
ALT#3 HHV
ALT#4 Mech PTO
ALT#5 ICE drive
Wheel Drive 4 x 2 4 x 4 4 x 2 4 x 2 4 x 4
Suspension Double A-Arm Double A-Arm Trailing Arm Either Type Either Type
Length (in) Width (in) Deck Height (in) Ground Clearance (in)
280 96
51.5
18
328 96
51.5
18
285 96
51.5
18
280 96
51.5
18
328 96
51.5
18 Track (in) 81 81 79 81 81
Wheel Base (in) 192 192 201 192 192 Basic Bed (lbs)
5,745 5,745 5,745 5,745 5,745
Suspension & Power Drive (lbs)
6,625 9,800 5,155 4,875 7,570
Flat rack (lbs)
3,200 3,200 3,200 3,200 3,200
Cargo Load (lbs)
22,000 22,000 22,000 22,000 22,000
Total Weigh-lbs
37,570 18.8 ST
40,395 20.2 ST
36,100 18.1 ST
35,820 18 ST
38,515 19.3 ST
ST = Short Ton or 2,000 lbs
Physical Characteristics
28INCOSE BRIEF @ DRS Technologies

ALT #1 Elect PTO Components
Detail Needed for Credible Cost & Schedule Estimates29INCOSE BRIEF @ DRS Technologies

Cost Vs Key Requirements Met
$35K
$40K
$55K
$70K
$140K
$150K
0 10 20 30 40 50 60 70 80 90 100
Basic 45
Mech PTO 60
Elec PTO 75
ICE 85
HEV 95
HHV 85
Cost Vs Key Requirements Met
Percent of Key Requirements Met
Co
stp
er 1
000
Un
its
30INCOSE BRIEF @ DRS Technologies

Trade Parameters
Requirement
Weightings
Alt #1Elect PTO
Alt #2HEV
Alt #3HHV
Alt #4Mech PTO
Alt #5ICE
Drive
Mobility Assist 5 | 5 3 5 4 3 5
Self Mobility 3 | 3 0 5 4 0 4
Payload 4 | 4 5 4 4 5 4
Complexity (RAM)
2 | 4 4 2 2 5 3
Interoperability
4 | 4 3 4 1 2 4
Maturity 2 | 4 4 3 2 5 5
Commonality 3 | 2 4 4 1 1 2
Unit Prod Cost 4 | 4 4 1 1 5 3
Weighted Score
91 |103 98 |104 67 | 74 86 |105 103 |117
Normalized Score
1.36 |1.39 1.46 |1.41 1 | 1 1.28 |1.42 1.54 |1.58
Comparison of Alternatives
Weighting/Scoring 0-5 with 5 Best
31INCOSE BRIEF @ DRS Technologies

• Understanding requirements; their relationships, and relative importance:– Tools: RTRM, N2 Diagram, AHP
• Getting consensus on the best technology options for meeting customer needs:– Tools: QFD (House of Quality)
• Evaluating alternatives:– Tools: AHP, MA, Architectural Views
• Selecting the best alternative:– Tools: Trade Study, Sensitivity Analysis
SE Tool Usage Summary
32INCOSE BRIEF @ DRS Technologies

• SE Process Critical for Providing Best Balanced Solution
• SE Tools Assist in:– Understanding requirements and their relationships– Getting consensus on which technology options provide
the greatest benefits– Assuring no viable alternative is overlooked– Performing meaningful tradeoffs and sensitivity analysis– Making decisions involving multiple attribute criteria
Conclusions
Capturing the Results in the Requirements Set Reduces Program Execution Risks
Go to: www.incose.org for more information
33INCOSE BRIEF @ DRS Technologies

Questions ?
34INCOSE BRIEF @ DRS Technologies