Embed Size (px)
Citation preview

1 | G l o b a l B u r d e n o f a n e m i a
A systematic analysis of global anemia burden from 1990 to 2010
Authors: Nicholas J Kassebaum1, 2
(corresponding author)
Contact information: Institute for Health Metrics and Evaluation
2301 5th
Avenue, Suite 600 Seattle, WA 98105
[email protected] 206-897-2800 (office) 206-897-2899 (fax)
Other Authors: Rashmi Jasrasaria3; Mohsen Naghavi
1; Sarah K Wulf
1; Nicole Johns
1;
Rafael Lozano4; Mathilda Regan
5; David Weatherall
6; David P Chou
7;
Thomas P Eisele8; Seth R Flaxman
9; Rachel L Pullan
10;
Simon J Brooker10
; Christopher JL Murray1
Affiliations:
1 Institute for Health Metrics and Evaluation, University of Washington, Seattle, WA, USA
2 Department of Pediatric Anesthesiology & Pain Medicine, Seattle Children’s Hospital, Seattle, WA, USA
3 Stanford University School of Medicine, Stanford, CA, USA
4 Centro de Investigación en Sistemas de Salud, Instituto Nacional de Salud Publica, Cuernavaca,
Morelos, México
5 Northern California Institute for Research and Education, VA Medical Center, San Francisco, CA, USA
6 Weatherall Institute for Molecular Medicine, Oxford University, Oxford, UK
7 Columbia University College of Physicians and Surgeons, New York, NY, USA
8 School of Public Health and Tropical Medicine, Tulane University, New Orleans, LA, USA
9 School of Computer Science and Heinz College, Carnegie Mellon University, Pittsburgh, PA, USA
10 Department of Disease Control, London School of Hygiene and Tropical Medicine, London, UK
Blood First Edition Paper, prepublished online December 2, 2013; DOI 10.1182/blood-2013-06-508325
Copyright © 2013 American Society of Hematology
For personal use only.on April 14, 2019. by guest www.bloodjournal.orgFrom
2 | G l o b a l B u r d e n o f a n e m i a
Key Points
1. Anemia accounted for 8.8% of the total disability from all conditions in 2010. Children <5 years
and women still have the highest burden.
2. Though iron-deficiency anemia is the most common etiology globally, other leading causes of
anemia vary widely by geography, age and sex.
Abstract
Previous studies of anemia epidemiology have been geographically limited with little detail about
severity or etiology. Using publicly available data, we estimated mild, moderate and severe anemia from
1990 to 2010 for 187 countries, both sexes, and 20 age groups. We then performed cause-specific
attribution to 17 conditions using data and resources from the Global Burden of Diseases, Injuries and
Risk Factors (GBD) 2010 Study. Global anemia prevalence in 2010 was 32.9%, causing 68.36 (95% CI
40.98 – 107.54) million years lived with disability (8.8% of total for all conditions; 95% CI 6.3-11.7%).
Prevalence dropped for both sexes from 1990 to 2010, though more for males. Females’ prevalence was
higher in most regions and age groups. South Asia and central, west, and east sub-Saharan Africa had
the highest burden, while east, southeast, and south Asia saw the greatest reductions. Iron-deficiency
anemia was the top cause globally, though ten different conditions were among the top three in
regional rankings. Malaria, schistosomiasis, and chronic kidney disease-related anemia were the only
conditions to increase in prevalence. Hemoglobinopathies made significant contributions in most
populations. Burden was highest in children under 5 years old, the only age groups with negative trends
from 1990 to 2010.
Introduction
Anemia is characterized by a decreased quantity of red blood cells, often accompanied by diminished
hemoglobin levels or altered red blood cell morphology. Anemia is pathophysiologically diverse and
often multifactorial. Iron-deficiency anemia has been found to be correlated with decreased cognitive
For personal use only.on April 14, 2019. by guest www.bloodjournal.orgFrom
3 | G l o b a l B u r d e n o f a n e m i a
performance in many studies1,2
. Symptoms result from impaired tissue oxygen delivery and may include
weakness, fatigue, concentration difficulty, or poor work productivity3. Children may have issues with
mental and motor development4,5
. Iron-deficiency anemia, especially when severe, is correlated with
increased risk of preterm labor, low birth weight6, child and maternal mortality
7,8, and may predispose
to infection9 and heart failure
10. Though these studies have largely been of iron deficiency anemia, the
detrimental findings have been in excess of those with non-anemic iron deficiency, supporting a primary
role for anemia as a risk factor for poor outcomes.
Surveillance of anemia is challenging, requiring simultaneous understanding of the epidemiology
of its underlying causes. Focusing only on total anemia invites misinterpretation of trends as changes in
severity may therefore be missed11
. Estimates in high risk populations suggest that total anemia
prevalence may be as high as 50-80%, with as many as 10-20% having moderate to severe anemia12
.
Prevalence is consistently higher in those of low socioeconomic status, low body weight, and females
who have recently given birth13
. Global cause-specific analyses have tended to focus only on tracking
iron deficiency14,15
or on single countries or regions16–19
. Only Khambalia and colleagues have published
an international study of multiple causes, though their analysis was limited to 13 countries and focused
on indigenous populations20
. The World Health Organization (WHO) has been providing a majority of
worldwide anemia surveillance for the past decades, though most reports have focused on iron
deficiency and included at most four age groups with little delineation by severity or cause21
.
With the analysis presented here, we aimed to produce the first complete accounting of global
anemia burden. By taking advantage of the data, methods and analytical resources of the Global Burden
of Diseases, Injuries and Risk Factors (GBD) Study 2010, our estimates include total and by-severity
anemia prevalence and disability burden for 17 contributing causes in each of 187 countries, 20 age
groups and both sexes in 1990 and 2010.
For personal use only.on April 14, 2019. by guest www.bloodjournal.orgFrom

4 | G l o b a l B u r d e n o f a n e m i a
Methods
The starting point of our strategy was calculation of an anemia envelope – a determination of
mean hemoglobin as well as sum total of anemia prevalence by severity for each country, age group,
and both sexes for each year from 1980 through 2010. The envelope approach avoids double counting
while capturing potentially different disease profiles within each population group. We defined a
population group as a specific country, sex, age-group, and year. Cause-specific attribution was
performed on the anemia envelope at discrete time points (1990 and 2010) using information on cause-
specific prevalence and hemoglobin shift from the GBD 2010 Study. Figure 1 overviews the process and
detailed descriptions of each step are in Supplementary Methods.
We defined anemia using the same thresholds (listed in Table 1a) as employed by GBD 200022
.
These definitions are based on hemoglobin thresholds that vary by sex, age, and pregnancy status and
include five distinct groups: adult males, adult females (non-pregnant and pregnant), male children, and
female children23
. We used population-based surveys of hemoglobin concentration as the primary data
input for envelope calculations. These data were not only the most reliable and comparable measures of
anemia, coming from national and sub-national measurement surveys, but also spanned the most
countries and time-periods. A total of 409 separate datasets from 150 countries were used to inform the
envelope. Tables S1 and S2 tabulate these datasets by source. Inclusion, exclusion and diagnostic
criteria for other studies were similar and can be found in each study. Most used a HemoCue test and
excluded those with terminal or acute medical conditions or undergoing intensive treatment (e.g.
chemotherapy or dialysis).
After standardizing input data , we used prevalence of underweight children as a predictive
covariate for population groups where data were absent. It was the best performing of several
covariates tested. The country-year specific prevalence of underweight children was obtained from the
IHME causes of death database and had been previously calculated for every year between 1970 and
For personal use only.on April 14, 2019. by guest www.bloodjournal.orgFrom
5 | G l o b a l B u r d e n o f a n e m i a
2011 by using spatial-temporal regression of data from national and subnational measurement surveys.
We refined the envelope for each severity, adjusting also for estimated prevalence of pregnancy.
We finalized the anemia envelope by calculating years of life lived with disability (YLDs) for each
population group, multiplying prevalence times the disability weights (DWs) listed in Table 1. Disability
weights were derived from surveys administered to population-representative samples in five countries
(USA, Peru, Tanzania, Bangladesh, and Indonesia) and more than 31,000 respondents to an open
internet survey24
. Their empirical basis was thus derived from collective public judgment of health state
severity rather than expert opinion of researchers or health care professionals.
Table 1b lists the 17 causes of anemia we considered and Table S3 tabulates their
corresponding ICD codes. Ten causes had corresponding prevalence estimates from the GBD Study
2010. For malaria, we used Plasmodium falciparum parasite rate (Pfpr) to determine the at risk
population. Hemoglobinopathies each had several sub-models and included separate results for
heterozygous states. Our estimates of anemia from chronic kidney diseases were disaggregated into
diabetes mellitus, hypertension, and other or unspecified.
Total “hemoglobin shift” was taken as the difference between the normal and predicted mean
hemoglobin for each population group. We denoted the normal hemoglobin level as the global 95th
percentile of the distribution of mean-hemoglobin within each age-group, sex, and year. We then
determined a total shift for each country in the corresponding age-group, sex and year by finding the
difference between the global “normal” and the country-specific predicted mean hemoglobin. Our
model of attribution followed that, because the shift is a disease state experienced by 100% of the
population, then the sum of cause-specific hemoglobin shifts times the prevalence of each contributing
cause should add up to the total.
Cause specific hemoglobin shifts are listed in Table S4. We obtained them by performing
systematic literature reviews and meta-analyses of hemoglobin changes in those with each condition or,
For personal use only.on April 14, 2019. by guest www.bloodjournal.orgFrom
6 | G l o b a l B u r d e n o f a n e m i a
in the case of malaria, PfPR-based simulation. Shift times prevalence estimates from all causes were
summed, compared to the total predicted hemoglobin shift, and proportionally assigned.
We distributed the residual envelope among seven remaining causes. Of note, our IDA
estimates include acute and chronic hemorrhagic states for which supplementation may be helpful, but
poor nutritional intake is not the only underlying problem. A few causes in this category –hookworm,
schistosomiasis, upper gastrointestinal bleeding, and gynecologic diseases – were considered separately
from IDA because there was enough data from GBD 2010 to do so. Distribution of anemia burden to IDA
only after assignment to “known” causes avoided double counting of these cases. Most other causes of
anemia not specifically considered are included in the “other” categories.
Our ascription to iron deficiency anemia (IDA) was based on a recently published meta-analysis
of well-designed studies to determine the effect of iron fortification alone (without other
micronutrients)25
. Of note, the effect size from iron fortification was similar to other recent meta-
analyses of iron supplementation that did not specifically exclude other micronutrients26,27
. We paired
the observed hemoglobin shift with a calculated envelope residual from the matching country, age, sex
and year and determined approximately 80% of the residual could be ascribed to iron. The final
remainder was split amongst these final six cause categories in proportions listed in Table S5. Residual
distribution proportions by age, region and sex are shown in Figure S7.
For regional figures, we ordered the 21 GBD regions by mean age of death. Mean age of death
reflects both population age-structure and age-specific death rates and is a simple summary measure of
the demographic and epidemiological transition28
. We examined our results using several metrics:
prevalence and caseload for information on how common the condition is, YLDs and mean DW to
elucidate differential anemia severity between populations and overall magnitude of burden. To help
understand drivers of differences over time, we decomposed changes from 1990 to 2010 into growth in
For personal use only.on April 14, 2019. by guest www.bloodjournal.orgFrom

7 | G l o b a l B u r d e n o f a n e m i a
total population, change in population age- and sex-structure, and change in age- and sex-specific
disease rates as described previously29
.
Results
Anemia accounted for 65.5 million YLDs (95% CI: 39.9 – 102 million) in 1990 (11.2% of
worldwide YLDs from all causes; 95% CI: 8.2-14.7%) and 68.4 million YLDs (95% CI: 41.0 – 108 million) in
2010 (8.8% of all YLDs; 95% CI: 6.3-11.7%). Anemia prevalence over this time period decreased from
40.2% (95% CI: 35.8-46.0%) in 1990 to 32.9% (95% CI: 28.9-38.5%) in 2010. Figure 2 illustrates global
changes between 1990 and 2010. Figure S7 and Table S6 illustrate regional changes. Although total
anemia YLDs increased globally, prevalence was lower in both sexes in 2010 for all severities of anemia.
In males, the most substantial gains were in reduction of mild and moderate anemia prevalence
whereas females’ largest percentage reduction was in severe anemia prevalence. Such a large reduction
in severe anemia prevalence led to a decrease in mean DW (average severity of cases) of 4.9% for
females, while males’ mean DW increased by 1.5%. A decrease in the rate of disease was the primary
driver of decreased global burden in both sexes and for all severities of anemia.
Geographic and gender differences in anemia burden
South Asia accounted for 37.5% of the entire global anemia YLDs in 2010, down from 39.8% in
1990. It also had the highest anemia prevalence in 1990, but improved significantly by 2010 to become
fourth highest in males and third in females. Over the same time period, total YLDs in the lower income
regions of Sub-Saharan Africa increased from 16.4% to 23.9% of the worldwide total. Higher income
regions had the lowest prevalence estimates, all less than 25%.
Females had higher anemia prevalence than males in virtually all regions, especially Central Asia
(43.2 vs. 22.8%) and Asia Pacific, High Income (19.4% vs. 10%). Improvements in total anemia
prevalence were also more pronounced for males, meaning that the gender gap widened in every region
between 1990 and 2010. In all regions except Central and Eastern Europe, population growth alone
would have equated to a substantial increase in the number of anemia YLDs. In several regions,
For personal use only.on April 14, 2019. by guest www.bloodjournal.orgFrom

8 | G l o b a l B u r d e n o f a n e m i a
including all of Asia, age- and sex-specific rates of disease dropped so substantially as to cause a net
decrease in the total number of anemia YLDs. Central, East, and West Sub-Saharan Africa performed the
worst in this metric, with increased total anemia YLDs of 45.6 - 71.9%. Though population growth was
the primary contributor to the growth, these regions also lagged behind other low and middle income
regions in decreasing the rate of anemia. Changes in caseload were qualitatively similar to those in YLDs.
Cause-specific anemia burden and regional rankings
Figure 3 shows our cause-specific anemia estimates and Table 2 ranks all of the causes of
anemia by region compared to the overall global ranking for 2010. Ten different conditions were among
the top three in prevalence, depending on the region. Five of the top seven causes globally were among
females. The causes with highest prevalence in both sexes and all time periods were the same: iron-
deficiency anemia, hookworm, sickle cell disorders, thalassemias, schistosomiasis and malaria. Global
prevalence decreased for most causes between 1990 and 2010. Males’ largest gain was in reduction of
hookworm prevalence, while females largest percentage improvement was in maternal hemorrhage.
Malaria, schistosomiasis and CKD were the only causes of anemia that increased in prevalence, while
anemia due to all hemoglobinopathies was relatively flat. The result, coupled with aging and population
growth, was a dramatic increase in the number of cases for these conditions.
The lowest burden from iron deficiency was found in North America, High income (2.9% of
envelope), while several regions had a very high fraction of their burden caused by it, including Central
Asia (64.7%), South Asia (54.8%) and Andean Latin America (62.3%). High income regions tended to have
a higher proportion of their anemia burden attributable to hemoglobinopathies, CKD and
gastrointestinal hemorrhage. Malaria was a major cause of anemia in many regions, but none more so
than western Sub-Saharan Africa, where it accounted for 24.7% of the prevalence envelope for both
sexes combined.
For personal use only.on April 14, 2019. by guest www.bloodjournal.orgFrom
9 | G l o b a l B u r d e n o f a n e m i a
Anemia burden by age group
Figure 4 shows global anemia burden by age group and sex. The highest anemia prevalence was
in the post-neonatal (PNN) period, followed by ages 1-4. These youngest age groups also had the least
favorable changes from 1990 to 2010. Age group results by region are shown in Figure S8 and for
specific causes in Figure S9. Age patterns of anemia were qualitatively similar for all regions and most
causes. Notable exceptions were hookworm, chronic kidney diseases, and anemia related to gastric and
gynecologic conditions. In males, there was a marked increase in prevalence of anemia from hookworm
at ages 5-14, a rapid decline in adulthood, and another increase in older age groups. Anemia from
chronic kidney disease increased in an accelerating fashion with age for both sexes, culminating as the
most prevalent cause of anemia in the 80+ age group. Maternal hemorrhage peaked at age 25-29.
Anemia from uterine fibroids and other gynecological conditions peaked at young ages and decreased
steadily with age. Gastritis and peptic ulcer disease were only estimated to account for an appreciable
portion of anemia burden in adults until age 50-54.
By age 15 and continuing through adulthood, females consistently had more anemia than males.
Mean DW for females was also higher throughout most of adulthood. The gender gap was widest in the
Caribbean and Central and South Asia, though in percentage terms, it was greater in wealthy regions,
especially Australasia and Asia Pacific, High Income. Gender differences were most pronounced
between ages 20 and 34 and worsened between 1990 and 2010. Females had higher prevalence of all
causes except for other infectious disease, other neglected tropical diseases, other hemoglobinopathies
and peptic ulcer disease. Complete anemia burden figures by country, age group, year, and sex are
illustrated in Figure 5 (YLDs) and tabulated in Table S7 (prevalence).
Discussion
Despite significant prevalence decreases from 1990 to 2010, anemia was responsible for 68.3
million YLDs in 2010 (8.8% of global total), more than major depression (63.2 million, 8.18%), chronic
respiratory diseases (49.3 million, 6.33%), and the totality of injuries (47.2 million, 6.29%). Total anemia
For personal use only.on April 14, 2019. by guest www.bloodjournal.orgFrom

10 | G l o b a l B u r d e n o f a n e m i a
YLDs increased in all ages between 1990 and 2010. In young age groups, increased anemia YLDs were
driven by a combination of increased prevalence and population growth. During adulthood, some of the
increase can likewise be attributed to population growth, while a portion may also be due to enhanced
survival amongst those with chronic conditions known to cause anemia (e.g. hemoglobinopathies and
chronic kidney diseases). In older age groups, population aging is likely the primary driver of increased
total YLDs from anemia, as anemia prevalence in these ages decreased from all causes except malaria.
%). The health impact of anemia is likely even greater as our results included neither quantification of
anemia-related cognitive deficiencies, heart failure, or early mortality nor the disability from myriad
other health states associated with severe hemoglobinopathies.
Children under 5 years are known to be the age group most vulnerable to detrimental long-term
effects of anemia. Young children had the highest prevalence in all regions and the highest mean
severity in all low and middle-income regions. Alarmingly, these were the only age groups with
increased anemia prevalence from 1990 to 2010. We recommend this age group continue to be a high
priority for anemia control interventions. In accordance with recently published WHO guidelines30
,
optimizing nutrition, including targeted daily iron supplementation, should be considered a first-line
intervention in high risk or high prevalence groups. In endemic regions, empiric administration of anti-
helminthic medications may also be warranted. Efforts to target severe anemia should also be guided by
the disease profile of children in that country because, as reported in Malawi19
and Bangladesh31
, many
cases cannot be explained solely by iron-deficiency.
Gender differences in anemia burden were not unexpected, but what was most striking was the
magnitude of the gender gap and the finding that it has widened since 1990. Females had higher
prevalence and mean severity of anemia in virtually all regions and throughout adulthood. Male children
had higher anemia prevalence than females, a difference that appears to be almost entirely driven by
excess prevalence of mild anemia due to hookworm. As much of the excess anemia in females at other
For personal use only.on April 14, 2019. by guest www.bloodjournal.orgFrom
11 | G l o b a l B u r d e n o f a n e m i a
ages was related to iron-deficiency (including gynecologic conditions that often present as iron
deficiency), we recommend programs to focus both on iron supplementation and development of
mechanisms for identifying and treating underlying causes of chronic hemorrhage.
In older ages, chronic kidney disease and nutritional factors were the biggest contributors to
total anemia burden in both sexes. Their relative importance has grown both as a proportion of anemia
within these age groups and as a proportion of total global anemia burden. Public health measures to
both target older age groups for nutritional supplementation and reduce the risks associated with the
development of chronic kidney disease, namely control of diabetes and hypertension, may help slow the
growth of anemia burden in these age groups.
Regions with high anemia prevalence tended to have higher mean severity of anemia and a
higher proportion of their anemia burden due to infectious and iron-related etiologies. East, South and
Southeast Asia registered the greatest prevalence reductions, while East, West and Central Sub-Saharan
Africa fared the worst, owing largely to their population growth. High income regions had the lowest
anemia burden, but also the slowest progress. North America, High Income was the only region that did
not reduce disease rates. Some countries have implemented programs that have likely contributed to
the decreased prevalence certain types of anemia. The most notable example may be Cyprus, where a
newborn screening program for hemoglobinopathies is likely responsible for our finding a 7.63%
decrease (95% UI 5.68 – 11.6%) in the anemia burden to thalassemia in 1-4 year olds. Even then,
however, the age-standardized anemia prevalence rate only dropped 1.88% (95% UI 1.76 – 1.80%),
suggesting that for now the decreased anemia burden may be overshadowed by improved survival of
persons with these conditions. Differential levels of success in reducing anemia burden in different
regions and population groups suggest that non-health system related improvements in health, poverty,
and living conditions may be responsible for some of the improvements.
For personal use only.on April 14, 2019. by guest www.bloodjournal.orgFrom

12 | G l o b a l B u r d e n o f a n e m i a
The GBD Study 2010 estimates of anemia compare favorably with several recent studies32–34
.
Adobayire and colleagues, using their own modified anemia thresholds, found 46% of school-age
children in Côte d’Ivoire had anemia. Using the same thresholds as that study, our model predicted
35.1% (95% UI = 28.9-39.7%) anemia prevalence in 5-9 year olds. Cardoso and colleagues found that
among anemic rural Brazilian infants, 93.7 % (95% CI 92.4-95.1%) had evidence of iron deficiency, with a
significant proportion with positive laboratory tests for infection. Our model predicts 91.2% (95% UI =
90.0-92.4%) of anemia in this age group is related to iron deficiency and infectious causes. Pasricha and
colleagues detected anemia in 75.3% of rural Indian infants. Using the same thresholds, our model
estimated prevalence of anemia at 73.9% (95% UI = 73.0-74.3%). Finally, after completion of the GBD
Study 2010, we received a large volume of Turkish anemia survey microdata (not shown), the results of
which were within 2.2% of our estimates for both sexes.
As demonstrated above, it is important to be cognizant of the thresholds employed when
reviewing results of anemia analyses. We chose to use the same anemia thresholds as employed by the
WHO for GBD 200022
which included a singular cutoff of 120 g/L for all children. In addition to being
consistent with previous GBD efforts , we chose this to optimize the tradeoff between sensitivity and
specificity in identifying at-risk population groups in the youngest ages. While many different cutoffs
have been utilized, <110 g/L is the most common for children 6 months to 5 years. Using this threshold
would have lowered our 2010 prevalence estimates by an average 16.3% for males (range 0 - 49.7%)
and 18.1% for females (range 0 – 57.2%), similar to the threshold effect seen by Gera and colleagues26
.
Though our selection of these thresholds could have influenced magnitude of burden estimates, trends
in our analysis should not have been affected.
Our overarching goal was to provide estimates of anemia burden, with corresponding
uncertainty measures, for every population group. We used prevalence of underweight children to
predict in population groups where data were unavailable. We chose this single covariate, despite
For personal use only.on April 14, 2019. by guest www.bloodjournal.orgFrom
13 | G l o b a l B u r d e n o f a n e m i a
plausible relationships existing between anemia and other factors, because anemia and malnutrition
have been clearly linked, the association appears to be independent of other factors35,36
, and this
dataset was among our most complete. Other than the effects introduced by the prevalence
underweight covariate, our models assumed the age pattern of hemoglobin in those under 5 years of
age is similar globally. Hopefully as surveillance expands in the youngest age groups we will have enough
data to revisit this assumption. None of the global threshold recommendations account for potential
variability in populations or ethnicities and do not contain any definition for anemia in those younger
than 6 months. The appropriate cutoff under 6 months of age is unresolved, but should be higher,
probably between 150 g/L and 190 g/L37
. Also, though controversial, we found insufficient data at the
global level to support different thresholds for abnormal hemoglobin in different ethnicities38,39
.
Many more than 17 diseases can cause anemia. Most were assigned to our “other” categories,
due either to rarity of the condition or insufficient data for individual modeling. Examples include
anemia due to acute and chronic hemorrhage , anemia of chronic inflammation (ACI), and anemia
associated with non-terminal HIV and malignancy. Additionally, while many studies assign a significant
portion of the anemia burden in older age groups to “unknown causes,” this was inconsistent with our
effort to perform explicit causal attribution and was not included in this analysis. Most hemorrhage-
related anemia is currently included in iron deficiency, but the others are missing from the GBD Study
2010 cause list. Due to exclusion of those with known chronic disease from data sources that informed
envelope calculations, we suspect a majority of the global ACI and AIDS-associated anemia burden was
not captured. Global prevalence of ACI is unknown, but country level studies have suggested its
contribution is non-trivial, especially in older adults40
. Conversely, a majority of anemia associated with
early malignancy and HIV was reflected in our anemia envelope calculations, but we did not have
sufficient data to parse out which proportion was caused by the disease, its sequelae, or treatment41
.
This anemia burden was likely distributed amongst the residual attribution categories.
For personal use only.on April 14, 2019. by guest www.bloodjournal.orgFrom

14 | G l o b a l B u r d e n o f a n e m i a
Targeted anemia surveillance and intervention should be a greater priority in high risk
populations, especially young children and females42
. Despite causing so much disability, anemia does
not receive its requisite attention in many public health spheres. Such inattention may be partly due to
anemia being thought of as a by-product of other disease processes rather than a target for intervention
in and of itself. It is somewhat ironic, then, that etiology-specific epidemiologic detail is so essential to
development of appropriate intervention frameworks. We hope our analysis helps health specialists,
donors and policymakers see clearly through this dichotomy by distilling the heterogeneity of anemia
into a single entity while retaining enough information about individual conditions to facilitate
formulation of strategies to further reduce anemia burden.
For personal use only.on April 14, 2019. by guest www.bloodjournal.orgFrom

15 | G l o b a l B u r d e n o f a n e m i a
Funding and Acknowledgements
Funding for the GBD 2010 Study was provided by the Bill & Melinda Gates Foundation. TE was
additionally supported by the US Fund for UNICEF from the Bill & Melinda Gates Foundation (grant
43386). We thank all the individuals who contributed to the GBD 2010 Study. At IHME, we thank Greg
Freedman and Ryan Barber for their assistance with coding and preparation of figures. We thank those
who helped with identification of data sources and data extraction, including Gretchen Stevens, Juan
Pablo Pena-Rosas, Francesco Branca, Luz Maria De Regil (all from World Health Organization), and
Ramiro Guerrero (PROESA). We also thank those at the London School for Hygiene and Tropical
Medicine for their assistance with analysis of anemia due to maternal hemorrhage including Karen
Wagner, Carine Ronsmans, Sara Thomas, Clara Calvert and Veronique Filippi.
Author Contributions
NJK wrote the first draft of the manuscript and made edits recommended by other authors. NJK,
RJ, MN, and CJLM developed and implemented the analytic strategy for calculating the anemia envelope
and its attribution. NJK, SKW, MJ, RL, MR, DW, DPC, TPE, SRF, RP and SB all contributed data, performed
analysis of individual etiologies of anemia, and performed systematic literature reviews to inform
etiologic attribution of the anemia envelope.
Disclosure of Conflicts of Interest
None of the authors have any financial conflicts of interest to declare.
For personal use only.on April 14, 2019. by guest www.bloodjournal.orgFrom
16 | G l o b a l B u r d e n o f a n e m i a
References
1. Sachdev H, Gera T, Nestel P. Effect of iron supplementation on mental and motor development in
children: systematic review of randomised controlled trials. Public Health Nutr. 2005;8(2):117–132.
2. Glazer Y, Bilenko N. [Effect of iron deficiency and iron deficiency anemia in the first two years of life
on cognitive and mental development during childhood]. Harefuah. 2010;149(5):309–314, 335.
3. Haas JD, Fairchild MW. Summary and conclusions of the International Conference on Iron Deficiency
and Behavioral Development, October 10-12, 1988. Am J Clin Nutr. 1989;50(3):703–705.
4. McCann JC, Ames BN. An overview of evidence for a causal relation between iron deficiency during
development and deficits in cognitive or behavioral function. Am J Clin Nutr. 2007;85(4):931–945.
5. Beard JL, Connor JR. Iron status and neural functioning. Annu. Rev. Nutr. 2003;23:41–58.
6. Rasmussen KM. Is There a Causal Relationship between Iron Deficiency or Iron-Deficiency Anemia
and Weight at Birth, Length of Gestation and Perinatal Mortality? J. Nutr. 2001;131(2):590S–603S.
7. Brabin BJ, Hakimi M, Pelletier D. An Analysis of Anemia and Pregnancy-Related Maternal Mortality.
J. Nutr. 2001;131(2):604S–615S.
8. Brabin BJ, Premji Z, Verhoeff F. An Analysis of Anemia and Child Mortality. J. Nutr. 2001; 131(2):
636S–648S.
9. Dunne JR, Malone D, Tracy JK, Gannon C, Napolitano LM. Perioperative Anemia: An Independent
Risk Factor for Infection, Mortality, and Resource Utilization in Surgery. Journal of Surgical Research.
2002;102(2):237–244.
10. Anand IS. Anemia and Chronic Heart FailureImplications and Treatment Options. J Am Coll Cardiol.
2008;52(7):501–511.
11. Stoltzfus RJ. Rethinking anaemia surveillance. The Lancet. 1997;349(9067):1764–1766.
12. WHO | The prevalence of anaemia in women: a tabulation of available information. Geneva: 1992.
13. Bentley ME, Griffiths PL. The burden of anemia among women in India. Eur J Clin Nutr. 2003; 57(1):
52–60.
14. WHO | Assessing the iron status of populations. Geneva: World; 2001.
15. Stoltzfus RJ. Iron deficiency: global prevalence and consequences. Food Nutr Bull. 2003;24(4 Suppl):
S99–103.
16. Kim JM, Labrique A, West KP, et al. Maternal morbidity in early pregnancy in rural northern
Bangladesh. Int J Gynaecol Obstet. 2012;
17. Ezechi OC, Kalejaiye OO, Gab-Okafor CV, et al. The burden of anaemia and associated factors in HIV
positive Nigerian women. Arch. Gynecol. Obstet. 2012;
18. Suchdev PS, Ruth LJ, Earley M, Macharia A, Williams TN. The burden and consequences of inherited
blood disorders among young children in western Kenya. Matern Child Nutr. 2012;
19. Calis JCJ, Phiri KS, Faragher EB, et al. Severe anemia in Malawian children. N. Engl. J. Med. 2008;
358(9): 888–899.
20. Khambalia AZ, Aimone AM, Zlotkin SH. Burden of anemia among indigenous populations. Nutr. Rev.
2011;69(12):693–719.
21. WHO | Worldwide prevalence of anaemia 1993-2005. Geneva: World Health Organization; 2008.
22. Colin Mathers, Tanuja Rastogi. WHO | Global burden of Iron Deficiency Anaemia in the year 2000.
Geneva: World Health Organization; 2002.
23. WHO | Iron deficiency anaemia: assessment, prevention, and control. A guide for programme
managers. Geneva: World Health Organization; 2001.
24. Salomon JA, Vos T, Hogan DR, et al. Common values in assessing health outcomes from disease and
injury: disability weights measurement study for the Global Burden of Disease Study 2010. The
Lancet. 2012;380(9859):2129–2143.
For personal use only.on April 14, 2019. by guest www.bloodjournal.orgFrom

17 | G l o b a l B u r d e n o f a n e m i a
25. Kawsari Abdullah, Tahmeed Ahmed, A.M. Shamsir Ahmed, Mustafa Mahfuz, Stacy Grau, Alejandro
Cravioto, and David Sack. Multiple Micronutrient Fortification. Nutrition Interventions for Maternal
and Child Health and Survival. 2011;
26. Gera T, Sachdev HS, Boy E. Effect of iron-fortified foods on hematologic and biological outcomes:
systematic review of randomized controlled trials. Am J Clin Nutr. 2012;96(2):309–324.
27. Casgrain A, Collings R, Harvey LJ, Hooper L, Fairweather-Tait SJ. Effect of iron intake on iron status: a
systematic review and meta-analysis of randomized controlled trials. Am J Clin Nutr. 2012; 96(4):
768–780.
28. Wang H, Dwyer-Lindgren L, Lofgren KT, et al. Age-specific and sex-specific mortality in 187
countries, 1970–2010: a systematic analysis for the Global Burden of Disease Study 2010. The
Lancet. 2012;380(9859):2071–2094.
29. Lozano R, Naghavi M, Foreman K, et al. Global and regional mortality from 235 causes of death for
20 age groups in 1990 and 2010: a systematic analysis for the Global Burden of Disease Study 2010.
The Lancet. 2012;380(9859):2095–2128.
30. WHO | Essential Nutrition Actions: improving maternal, newborn, infant and young child health and
nutrition. WHO. .
31. Jamil KM, Rahman AS, Bardhan PK, et al. Micronutrients and Anaemia. J Health Popul Nutr.
2008;26(3):340–355.
32. Asobayire FS, Adou P, Davidsson L, Cook JD, Hurrell RF. Prevalence of iron deficiency with and
without concurrent anemia in population groups with high prevalences of malaria and other
infections: a study in Côte d‘Ivoire. Am J Clin Nutr. 2001;74(6):776–782.
33. Cardoso MA, Scopel KKG, Muniz PT, Villamor E, Ferreira MU. Underlying factors associated with
anemia in Amazonian children: a population-based, cross-sectional study. PLoS ONE.
2012;7(5):e36341.
34. Pasricha S-R, Black J, Muthayya S, et al. Determinants of anemia among young children in rural
India. Pediatrics. 2010;126(1):e140–149.
35. Awasthi S, Das R, Verma T, Vir S. Anemia and undernutrition among preschool children in Uttar
Pradesh, India. Indian Pediatr. 2003;40(10):985–990.
36. Siegel EH, Stoltzfus RJ, Khatry SK, et al. Epidemiology of anemia among 4- to 17-month-old children
living in south central Nepal. European Journal of Clinical Nutrition. 2006;60(2):228–235.
37. Kates EH, Kates JS. Anemia and polycythemia in the newborn. Pediatr Rev. 2007;28(1):33–34.
38. Beutler E, Waalen J. The definition of anemia: what is the lower limit of normal of the blood
hemoglobin concentration? Blood. 2006;107(5):1747–1750.
39. Atkinson MA, Pierce CB, Zack RM, et al. Hemoglobin Differences by Race in Children With CKD.
American Journal of Kidney Diseases. 2010;55(6):1009–1017.
40. Weiss G. Pathogenesis and treatment of anaemia of chronic disease. Blood Rev. 2002;16(2):87–96.
41. Shet A, Arumugam K, Rajagopalan N, et al. The prevalence and etiology of anemia among HIV-
infected children in India. Eur J Pediatr. 2012;171(3):531–540.
42. Pullan RL, Gitonga C, Mwandawiro C, Snow RW, Brooker SJ. Estimating the relative contribution of
parasitic infections and nutrition for anaemia among school-aged children in Kenya: a subnational
geostatistical analysis. BMJ Open. 2013;3(2):
For personal use only.on April 14, 2019. by guest www.bloodjournal.orgFrom
18 | G l o b a l B u r d e n o f a n e m i a
Table Legends
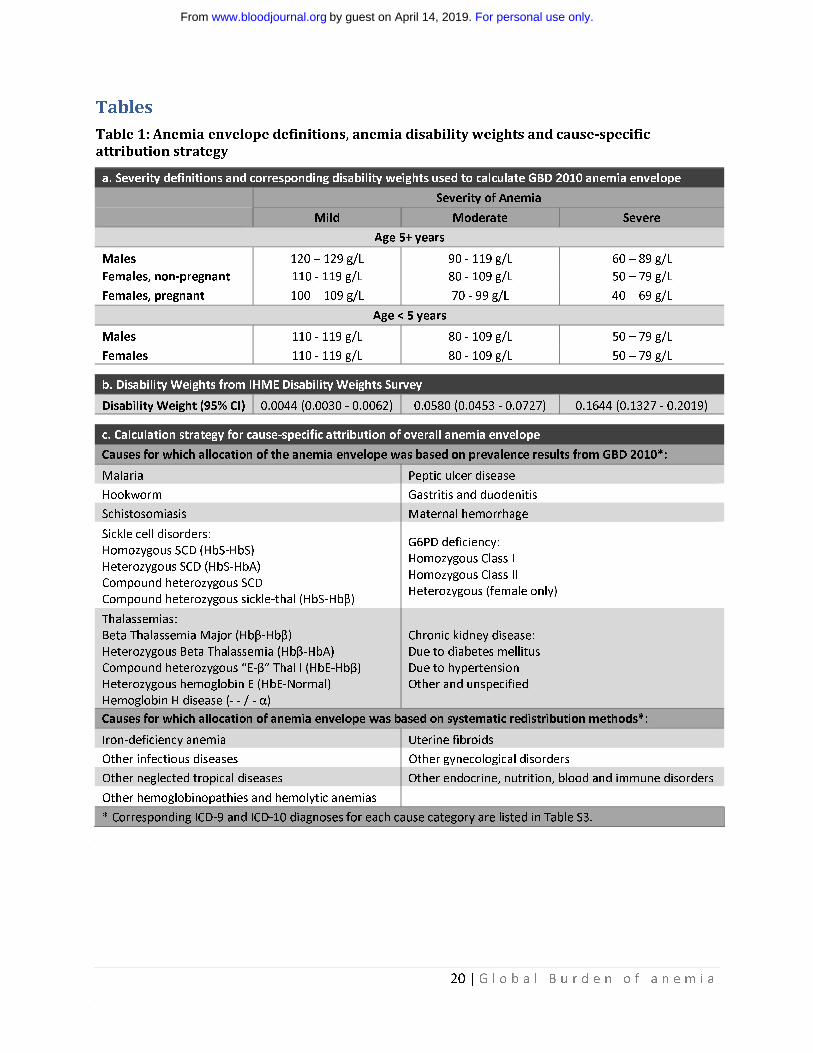
Table 1: Anemia envelope definitions and cause-specific attribution strategy
We calculated anemia as a total “envelope” and hierarchically divided the envelope among contributing
etiologies in mutually exclusive fashion for each country, age-group, sex and year. (a) Hemoglobin
thresholds for five different groups were the same as employed in GBD 2000 and adapted from WHO
guideline definitions of anemia21,22
. (b) Disability weights with confidence intervals for each severity of
anemia were obtained via the IHME Disability Weights Survey24
. (c) Distribution of the anemia envelope
was completed by finding the proportion of total hemoglobin shift attributable to each condition in each
population group. For 10 of 17 underlying etiologies, we multiplied prevalence results from GBD 2010 by
cause-specific hemoglobin shifts determined via systematic literature review and/ or simulation.
Attribution to the other seven causes was performed via systematic redistribution methods. The
conditions included in each of the “other” categories are listed in Table S3 of the Supplementary
Material. Abbreviations: SCD = Sickle cell disease, Thal = Thalassemia, Hb = Hemoglobin.
Table 2: Total anemia prevalence regional ranking for all causes of anemia in 2010 ordered
by overall global ranking
To highlight higher anemia burden among females, both sexes were ranked together. Iron deficiency
was the top ranking cause of anemia globally, though its importance varied by region. Ten different
conditions were among the top three in prevalence, depending on the region. Five of the top seven
causes globally were among females. The causes with highest global prevalence in both sexes and all
time periods were the same: iron-deficiency anemia, hookworm, sickle cell disorders, thalassemias,
schistosomiasis and malaria. High income regions tended to have a higher proportion of their anemia
burden attributable to hemoglobinopathies, chronic kidney disease and gastrointestinal hemorrhage.
Lower income regions top causes of anemia tended to be infectious and iron-related etiologies. Some
regions did not have any anemia due to schistosomiasis, malaria, and/ or hookworm. Abbreviations: AP=
Asia Pacific, HI= High Income, NA= North America, Eurp = Europe, LA= Latin America, SE= Southeast,
For personal use only.on April 14, 2019. by guest www.bloodjournal.orgFrom
19 | G l o b a l B u r d e n o f a n e m i a
NA/ME=North Africa/Middle East, SSA= Sub-Saharan Africa, CKD = Chronic kidney disease, G6PD =
Glucose-6-phosphate dehydrogenase
For personal use only.on April 14, 2019. by guest www.bloodjournal.orgFrom
20 | G l o b a l B u r d e n o f a n e m i a
Tables
Table 1: Anemia envelope definitions, anemia disability weights and cause-specific
attribution strategy
a. Severity definitions and corresponding disability weights used to calculate GBD 2010 anemia envelope
Severity of Anemia
Mild Moderate Severe
Age 5+ years
Males 120 – 129 g/L 90 - 119 g/L 60 – 89 g/L
Females, non-pregnant 110 - 119 g/L 80 - 109 g/L 50 – 79 g/L
Females, pregnant 100 – 109 g/L 70 - 99 g/L 40 – 69 g/L
Age < 5 years
Males 110 - 119 g/L 80 - 109 g/L 50 – 79 g/L
Females 110 - 119 g/L 80 - 109 g/L 50 – 79 g/L
b. Disability Weights from IHME Disability Weights Survey
Disability Weight (95% CI) 0.0044 (0.0030 - 0.0062) 0.0580 (0.0453 - 0.0727) 0.1644 (0.1327 - 0.2019)
c. Calculation strategy for cause-specific attribution of overall anemia envelope
Causes for which allocation of the anemia envelope was based on prevalence results from GBD 2010*:
Malaria Peptic ulcer disease
Hookworm Gastritis and duodenitis
Schistosomiasis Maternal hemorrhage
Sickle cell disorders:
Homozygous SCD (HbS-HbS)
Heterozygous SCD (HbS-HbA)
Compound heterozygous SCD
Compound heterozygous sickle-thal (HbS-Hbβ)
G6PD deficiency:
Homozygous Class I
Homozygous Class II
Heterozygous (female only)
Thalassemias:
Beta Thalassemia Major (Hbβ-Hbβ)
Heterozygous Beta Thalassemia (Hbβ-HbA)
Compound heterozygous “E-β” Thal l (HbE-Hbβ)
Heterozygous hemoglobin E (HbE-Normal)
Hemoglobin H disease (- - / - α)
Chronic kidney disease:
Due to diabetes mellitus
Due to hypertension
Other and unspecified
Causes for which allocation of anemia envelope was based on systematic redistribution methods*:
Iron-deficiency anemia Uterine fibroids
Other infectious diseases Other gynecological disorders
Other neglected tropical diseases Other endocrine, nutrition, blood and immune disorders
Other hemoglobinopathies and hemolytic anemias
* Corresponding ICD-9 and ICD-10 diagnoses for each cause category are listed in Table S3.
For personal use only.on April 14, 2019. by guest www.bloodjournal.orgFrom

21 | G l o b a l B u r d e n o f a n e m i a
Table 2: Total anemia prevalence regional ranking for all causes of anemia in 2010 ordered
by overall global ranking
Sex Cause
Global
AP HI
Eurp Western
Australasia
NA HI
Eurp Central
LA Southern
Eurp Eastern
Asia East
LA Tropical
LA Central
Asia SE
Asia Central
LA Andean
NA/ME
Caribbean
Asia South
Oceania
SSA Southern
SSA East
SSA Central
SSA West
Females Iron-deficiency anemia 1 1 8 1 11 1 1 1 2 2 2 1 1 1 1 1 1 2 1 2 2 1
Males Iron-deficiency anemia 2 2 4 2 13 2 2 2 3 1 1 2 2 2 2 2 2 4 2 1 1 2
Males Hookworm disease 3 30 7 1 5 3 3 31 4 20 6 4 1 4 7 10 10
Females Hookworm disease 4 28 4 4 3 5 4 29 3 18 5 3 3 3 8 9 9
Females Sickle cell disorders 5 6 1 7 2 7 6 14 28 4 4 31 14 7 4 3 5 24 21 9 6 7
Females Thalassemias 6 5 5 3 5 3 5 3 6 8 12 5 3 10 3 14 6 8 7 15 20 19
Males Sickle cell disorders 7 3 2 8 1 13 19 21 15 6 7 28 20 13 6 4 7 22 22 10 7 8
Females Malaria 8 35 27 29 7 32 27 26 23 10 6 17 5 3 3
Males Thalassemias 9 8 10 5 9 6 9 5 5 12 16 6 4 17 5 19 8 7 10 18 21 20
Males Malaria 10 33 31 31 8 33 28 25 25 11 5 20 6 4 4
Females CKD (unspecified) 11 4 3 4 4 4 3 4 7 7 6 11 6 11 14 10 21 18 19 24 24 22
Females Schistosomiasis 12 32 13 34 35 7 22 5 3 5 5
Females Uterine fibroids 13 13 21 14 17 12 15 6 9 18 23 10 5 6 9 7 9 10 9 17 15 13
Males Schistosomiasis 14 23 22 35 34 8 26 6 4 8 6
Males Other tropical diseases 15 17 14 11 20 11 8 9 14 9 9 9 8 5 10 8 12 11 8 11 11 11
Females Other tropical diseases 16 18 22 12 23 16 11 10 10 17 15 12 7 8 11 9 13 9 11 14 14 12
Males Other infectious diseases 17 21 16 16 22 15 13 15 22 10 13 13 11 9 12 12 14 14 12 12 12 14
Males CKD (unspecified) 18 10 6 6 8 9 10 8 8 19 11 16 19 22 22 24 23 23 25 25 26 24
Males Other hemoglobinopathies 19 20 17 21 29 14 20 17 26 11 14 14 15 12 13 11 15 19 13 13 13 15
Females Other endocrine 20 16 24 18 24 19 18 11 16 21 24 17 9 16 16 13 16 13 16 20 18 18
Males Other endocrine 21 23 18 19 27 17 17 19 25 16 17 15 16 14 15 16 18 17 14 16 16 17
Females Other infectious diseases 22 22 23 17 28 21 16 16 17 20 20 18 10 15 17 15 17 12 15 19 17 16
Females CKD (due to diabetes) 23 7 7 9 3 8 14 13 11 14 10 20 18 20 23 21 24 25 24 26 27 25
Females Other hemoglobinopathies 24 15 26 20 26 20 21 12 19 23 26 19 12 19 19 17 19 15 18 21 19 21
Females CKD (due to hypertension) 25 9 9 10 6 5 12 7 12 15 8 22 17 21 24 20 25 26 26 28 28 26
Females Other gynecological diseases 26 19 27 22 25 22 26 18 24 30 28 21 13 23 21 18 20 21 23 22 22 23
Males CKD (due to hypertension) 27 14 12 15 12 10 23 20 13 24 19 24 22 24 27 27 28 29 29 30 31 29
Males CKD (due to diabetes) 28 12 13 13 7 18 25 23 18 25 21 23 25 26 28 28 30 30 30 32 34 30
Females Gastritis and duodenitis 29 24 15 24 14 23 24 22 20 26 22 25 21 18 30 29 26 16 27 23 23 27
Females G6PD deficiency 30 11 11 23 10 24 22 24 27 28 18 29 23 30 29 31 27 31 31 31 29 31
Females Maternal hemorrhage 31 27 20 25 21 25 29 28 31 34 27 26 27 29 31 32 22 32 32 27 32 28
Males Gastritis and duodenitis 32 29 19 27 15 26 27 25 21 29 25 27 24 25 33 30 29 20 28 29 25 32
Males G6PD deficiency 33 31 25 29 18 28 31 29 29 33 33 33 30 33 34 35 31 33 35 33 33 34
Males Peptic ulcer disease 34 26 28 26 16 27 30 26 30 32 30 30 26 32 32 33 33 28 33 35 30 33
Females Peptic ulcer disease 35 25 29 28 19 29 28 27 34 35 32 32 28 31 35 34 32 27 34 34 35 35
Ranking Legend
1-6 7-14 15-22 23-29 30-35 Blank cells indicate
GBD estimate = 0
For personal use only.on April 14, 2019. by guest www.bloodjournal.orgFrom
22 | G l o b a l B u r d e n o f a n e m i a
Figure Legends
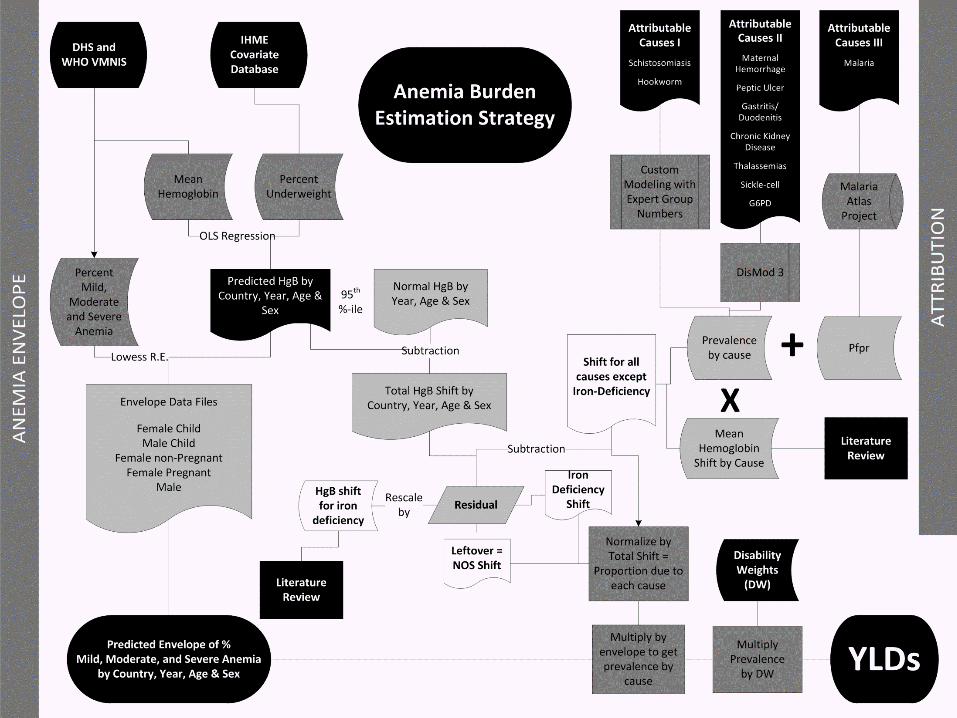
Figure 1: Flowchart of modeling process for calculating anemia burden
This figure illustrates the process we used for first calculating the total amount of anemia present in
each country, age, sex and year (the anemia “envelope”), then apportioning it to individual causes of
anemia in a hierarchical, mutually exclusive, and evidence-based approach. Abbreviations: DHS =
Demographic and Health Surveys, WHO VMNIS = World Health Organization Vitamin & Mineral
Nutrition Information System, IHME = Institute for Health Metrics and Evaluation, HgB = Hemoglobin,
OLS = Ordinary least squares, NOS = not otherwise specified, PfPR = Plasmodium falciparum parasite
rate, DW = disability weight, YLD = years of life lived with disability
Figure 2: Global anemia prevalence, total YLDs, and mean disability weight, by severity, from
1990 to 2010
Global anemia burden was calculated for each year from 1980 through 2010 (1980-1990 not shown).
Prevalence rates decreased from 40.2% to 32.9% from 1990 to 2010. Roughly two thirds of this decrease
can be attributed to decreased sex- and cause-specific rates of diseases that lead to anemia. The other
third of the decrease was associated with population aging. Total anemia burden, as measured in years
lived with disability (YLDs) increased from 65.5 to 68.3 million YLDs (8.8% of global total from all
conditions) from 1990 to 2010. Without dramatic decreases in age-, sex- and cause-specific disease
rates, population growth would have led to a much greater increase in total anemia YLDs. Mean severity
of anemia cases, as measured by mean disability weight (DW), decreased for females from 1990 to
2010, but not for males.
Figure 3: Global and regional cause-specific anemia prevalence for 1990 and 2010
Prevalence of anemia for both males and females decreased from 1990 to 2010. Males’ largest
improvements were in anemia due to hookworm and iron deficiency, while females’ largest percentage
gains were in iron deficiency and maternal hemorrhage. Regional differences in proportion of cases due
to specific causes varied widely. Malaria was a major cause of anemia in many regions, but none more
For personal use only.on April 14, 2019. by guest www.bloodjournal.orgFrom

23 | G l o b a l B u r d e n o f a n e m i a
so than western Sub-Saharan Africa, where it accounted for 24.7% of all prevalent anemia. South and
East Asia, despite being among those regions with the greatest reductions in anemia, had over half of
the world’s anemia cases. Anemia prevalence in 2010 generally increased with decreasing regional mean
age of death. Prevalence was highest in East, Central and West Sub-Saharan Africa. These regions also
saw the least improvement among all low and middle income regions between 1990 and 2010.
Abbreviations: AP = Asia Pacific, HI = High Income; NA = North America, Eur = Europe, Cent = Central, LA
= Latin America, South = Southern, SE = Southeast; NA/ME = North Africa/ Middle East; SSA = Sub-
Saharan Africa
Figure 4: Global burden of anemia by age
These plots demonstrate anemia burden by age for (a) prevalence and (b) total years of life lived with
disability (YLDs). Those under age 5 had the highest prevalence and total YLDs from anemia. These age
groups also had the least favorable changes between 1990 and 2010. Females had higher prevalence
and total YLDs than males at all ages. While females’ anemia prevalence decreased steadily with age,
anemia prevalence increased in older age groups among males. As demonstrated by steady decreases in
total YLDs, however, those prevalent cases among males tended to be less severe. Males’ improvements
in anemia prevalence and total YLDs between 1990 and 2010 were more substantial than females,
though not statistically significant.
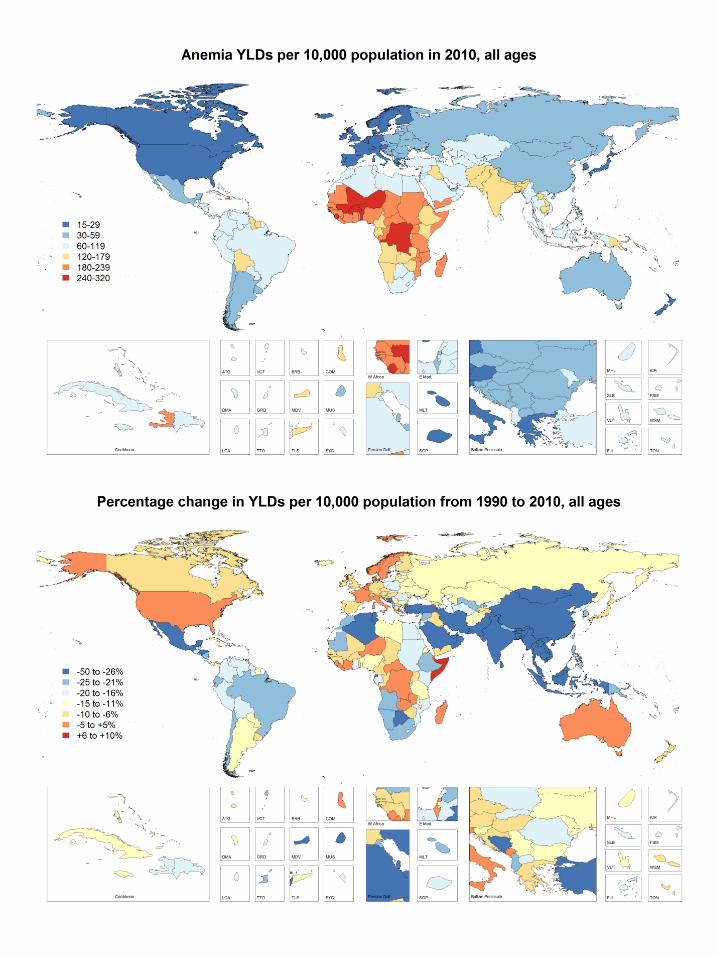
Figure 5: Total years of life lived with disability due to all causes of anemia by country.
Total years of life lived with disability (YLDs) due to all causes of anemia are presented year as per capita
results for 1990 (top panel) and 2010 (middle panel). The percentage change in anemia burden between
1990 and 2010 by country is shown in the bottom panel. West and central sub-saharan Africa along with
South Asia the had the highest rates of anemia-related disability in 1990. Many African countries still
had very high rates of anemia YLDs in 2010 and made comparatively little progress in reducing anemia in
For personal use only.on April 14, 2019. by guest www.bloodjournal.orgFrom

24 | G l o b a l B u r d e n o f a n e m i a
the intervening two decades. Many countries did make significant progress, however, including all
countries in East and South Asia, much of the Middle East as well as parts of central Latin America.
For personal use only.on April 14, 2019. by guest www.bloodjournal.orgFrom
For personal use only.on April 14, 2019. by guest www.bloodjournal.orgFrom

c. Decomposition of global changes in anemia prevalence and total YLDs by severity and mean disability weight
Method of Estimate
Adjustment
Prevalence (proportion) Total YLDs (in millions) Mean DW of Cases
Mild Moderate Severe Total Mild Moderate Severe Total Males Females
1990 Actual 0.219 0.170 0.013 0.402 5.21 49.88 10.38 65.47 0.0294 0.0320
Isolated Population Growth 0.219 0.170 0.013 0.402 6.77 64.82 13.49 85.09 0.0294 0.0320
Isolated Population Aging 0.210 0.155 0.012 0.377 6.50 59.01 12.42 77.93 0.0286 0.0312
2010 Actual 0.184 0.135 0.011 0.329 5.70 51.37 11.27 68.34 0.0299 0.0304
% Δ Due to Pop Growth 0.0% 0.0% 0.0% 0.0% 30.0% 30.0% 30.0% 30.0% 0.0% 0.0%
% Δ Due to Aging -4.1% -8.6% -7.6% -6.2% -5.3% -11.6% -10.4% -10.9% -2.8% -2.3%
% Δ Due to Δ Rates -12.1% -12.0% -9.0% -12.0% -15.3% -15.3% -11.0% -14.6% 4.3% -2.6%
% Δ Actual -16.3% -20.6% -16.6% -18.1% 9.4% 3.0% 8.6% 4.4% 1.5% -4.9%
For personal use only.on April 14, 2019. by guest www.bloodjournal.orgFrom

For personal use only.on April 14, 2019. by guest www.bloodjournal.orgFrom

For personal use only.
on April 14, 2019.
by guest
ww
w.bloodjournal.org
From
For personal use only.
on April 14, 2019.
by guest
ww
w.bloodjournal.org
From

doi:10.1182/blood-2013-06-508325Prepublished online December 2, 2013;
L. Pullan, Simon J. Brooker and Christopher J.L. MurrayLozano, Mathilda Regan, David Weatherall, David P. Chou, Thomas P. Eisele, Seth R. Flaxman, Rachel Nicholas J. Kassebaum, Rashmi Jasrasaria, Mohsen Naghavi, Sarah K. Wulf, Nicole Johns, Rafael A systematic analysis of global anemia burden from 1990 to 2010
http://www.bloodjournal.org/site/misc/rights.xhtml#repub_requestsInformation about reproducing this article in parts or in its entirety may be found online at:
http://www.bloodjournal.org/site/misc/rights.xhtml#reprintsInformation about ordering reprints may be found online at:
http://www.bloodjournal.org/site/subscriptions/index.xhtmlInformation about subscriptions and ASH membership may be found online at:
digital object identifier (DOIs) and date of initial publication. indexed by PubMed from initial publication. Citations to Advance online articles must include final publication). Advance online articles are citable and establish publication priority; they areappeared in the paper journal (edited, typeset versions may be posted when available prior to Advance online articles have been peer reviewed and accepted for publication but have not yet
Copyright 2011 by The American Society of Hematology; all rights reserved.Hematology, 2021 L St, NW, Suite 900, Washington DC 20036.Blood (print ISSN 0006-4971, online ISSN 1528-0020), is published weekly by the American Society of
For personal use only.on April 14, 2019. by guest www.bloodjournal.orgFrom


![ResearchArticle Parthenium hysterophorus: A Probable ...€¦ · ofwounds,ulceratedsores,fever,anemia,andhearttroubles [23]. The review of literature indicates that no systematic](https://img.dokumen.tips/doc/110x75/60664c3aec8ea86dbd133053/researcharticle-parthenium-hysterophorus-a-probable-ofwoundsulceratedsoresfeveranemiaandhearttroubles.jpg)


![[PPT]PEMERIKSAAN LABORATORIUM PADA ANEMIA … · Web viewPEMERIKSAAN LABORATORIUM PADA ANEMIA HEMOLITIK ELLYZA NASRUL Anemia hemolitik - Klasifikasi anemia berdasarkan morfologi anemia](https://img.dokumen.tips/doc/110x75/5c85338309d3f279718c7183/pptpemeriksaan-laboratorium-pada-anemia-web-viewpemeriksaan-laboratorium-pada.jpg)