Embed Size (px)
Citation preview

University of Central Florida University of Central Florida
STARS STARS
Electronic Theses and Dissertations, 2004-2019
2013
A System Dynamics Model For Manpower And Technology A System Dynamics Model For Manpower And Technology
Implementation Trade-off And Cost Estimation Implementation Trade-off And Cost Estimation
Hong Jiang University of Central Florida
Part of the Engineering Commons
Find similar works at: https://stars.library.ucf.edu/etd
University of Central Florida Libraries http://library.ucf.edu
This Doctoral Dissertation (Open Access) is brought to you for free and open access by STARS. It has been accepted
for inclusion in Electronic Theses and Dissertations, 2004-2019 by an authorized administrator of STARS. For more
information, please contact [email protected].
STARS Citation STARS Citation Jiang, Hong, "A System Dynamics Model For Manpower And Technology Implementation Trade-off And Cost Estimation" (2013). Electronic Theses and Dissertations, 2004-2019. 2644. https://stars.library.ucf.edu/etd/2644

A SYSTEM DYNAMICS MODEL FOR MANPOWER AND TECHNOLOGY
IMPLEMENTATION TRADE-OFF AND COST ESTIMATION
by
HONG JIANG
B.S. Nanchang Aeronautical University, 1993
MBA in Aviation Embry Riddle Aeronautical University, 2008
M.S. University of Central Florida, 2012
A dissertation submitted in partial fulfillment of the requirements
for the degree of Doctor of Philosophy
in the Department of Industrial Engineering and Management Systems
in the College of Engineering and Computer Science
at the University of Central Florida
Orlando, Florida
Summer Term
2013
Major Professor: Waldemar Karwowski

ii
ABSTRACT
The U.S. Navy has been confronted with budget cuts and constraints during recent years. This
reduction in budget compels the U.S. Navy to limit the number of manpower and personnel to
control costs. Reducing the total ownership cost (TOC) has become a major topic of interest for
the Navy as plans are made for current and future fleets. According to the U.S. Government
Accountability Office (GAO, 2003), manpower is the most influential component of determining
the life cycle cost of a ship. The vast majority of the TOC is comprised of operating and support
(O&S) costs which account for approximately 65 percent of the TOC. Manpower and personnel
costs account for approximately 50 percent of O&S costs.
This research focused on tradeoff analysis and cost estimation between manpower and new
technology implementation. Utilizing concepts from System Dynamics Modeling (SDM),
System Dynamics Causal Loop diagrams (CLD) were built to identify major factors when
implementing new technology, and then stocks and flows diagrams were developed to estimate
manpower cost associated with new technology implementation. The SDM base model reflected
an 18 months period for technology implementation, and then compared different technology
implementation for different scenarios. This model had been tested by the public data from
Department of the Navy (DoN) Budget estimates.
The objective of this research was to develop a SDM to estimate manpower cost and technology
tradeoff analysis associated with different technology implementations. This research will assist
Navy decision makers and program managers when objectively considering the impacts of

iii
technology selection on manpower and associated TOC, and will provide managers with a better
understanding of hidden costs associated with new technology adoption.
Recommendations were made for future study in manpower cost estimation of ship systems. In
future studies, one particular type of data should be located to test the model for a specific
manpower configuration.
KEYWORDS
Total ownership cost (TOC), Manpower Cost Estimation, Manpower requirement, Manpower
technology trade-off, System Dynamics Modeling (SMD).

iv
ACKNOWLEDGMENTS
This dissertation would not happen without academic, professional and personal supporters.
I would like to express my extraordinary appreciation to my dissertation advisors, Dr. Waldemar
Karwowski, and my committee members, Dr. Peter Kincaid, Dr. Lauren Reinerman Jones, and
Dr. Tareq Ahram for their expertise and time. I also would like to thank Dr. Serge Sala-Diakanda
for his time and effort and guidance in this research. I could not have finished my dissertation
without their help and guidance.
I would also like to thank Mr. Kevin Muhs, a Navy expert, also provided valuable feedback for
this dissertation. I appreciate both his time and effort.
Most importantly, I would like to thank my family, who provided me with love and mental
support during this journey. Many thanks need to go to my husband Frank Reneke, who provided
his encouragement and support and helped me out during the difficult times. And thanks to my
sister-in-law Kori Reneke who provided help to me many times during the review process. My
son also, helped out a lot by taking care of me and cooking dinner on those nights I was working
so hard to finish my dissertation. And lastly to my mom and dad, who are very proud of me since
I am the first PhD in our family.

v
TABLE OF CONTENTS
LIST OF FIGURES ........................................................................................................................ x
LIST OF TABLES ........................................................................................................................ xv
CHAPTER ONE: INTRODUCTION ............................................................................................. 1
1.1 Background ..................................................................................................................... 1
1.2 Research Question .......................................................................................................... 4
1.3 Research Objectives ........................................................................................................ 4
1.4 Expected Research Results ............................................................................................. 6
1.5 Organization of this research .......................................................................................... 6
CHAPTER TWO: MANPOWER COST METHODS REVIEW ................................................... 8
2.1 Introduction ..................................................................................................................... 8
2.2 Manpower Definition and Cost Components ............................................................... 11
2.2.1 Definition and History .............................................................................................. 11
2.2.2 Differences and Relation with Personnel .................................................................. 12
2.2.3 Importance of Manpower cost .................................................................................. 12
2.3 Manpower Requirements .............................................................................................. 14
2.3.1 Manpower Components ............................................................................................ 15
2.3.2 Manpower Requirement Determination Factors ....................................................... 15
2.3.3 Manpower Cost Model Components ........................................................................ 16
2.3.4 Workload Categories for Manpower Requirement ................................................... 18
2.4 Manpower Cost Methods .............................................................................................. 20

vi
2.4.1 Human System Integration (HSI) Trade-Off ............................................................ 21
2.4.2 Cost-Benefit Analysis (CBA) ................................................................................... 33
2.4.3 Cost-Effectiveness Analysis (CEA) and Cost-Effectiveness of Training (CEAT) .. 35
2.4.4 Econometric approach .............................................................................................. 37
2.4.5 Linear Regression method ........................................................................................ 38
2.4.6 Simulation method .................................................................................................... 39
CHAPTER THREE: SYSTEM DYNAMICS MODELING LITERATURE REVIEW .............. 42
3.1 Introduction ................................................................................................................... 42
3.2 System Thinking and System Dynamics Method ......................................................... 43
3.3 Applications of System Dynamics ................................................................................ 43
3.3.1 Overall Applications ................................................................................................. 43
3.3.2 Improvement in System or Organization Behavior .................................................. 44
3.3.3 System Dynamics in Human Performance (Human Reliability) .............................. 48
3.3.4 System Dynamics in Human Factors ........................................................................ 51
3.3.5 System Dynamics in Human Resource Management ............................................... 55
3.3.6 System Dynamics in Human System Integration ..................................................... 64
3.4 System Dynamics Software .......................................................................................... 67
3.5 System Dynamics Modeling Process ............................................................................ 68
3.6 System Dynamics Model Behaviors ............................................................................. 71
3.7 Conclusion .................................................................................................................... 73
3.8 Research Gap ................................................................................................................ 74
CHAPTER FOUR: METHODOLOGY ....................................................................................... 78
vii
4.1 Proposed Methodology ................................................................................................. 78
4.2 Sector Map .................................................................................................................... 80
4.3 Causal Loop diagram .................................................................................................... 82
4.4 Model structure ............................................................................................................. 83
4.5 Defining technology...................................................................................................... 85
4.5.1 New Technology affect Manpower ............................................................................. 86
4.5.2 Data Source and Model Guidelines ............................................................................. 86
4.6 Trade-off Space ............................................................................................................. 87
CHAPTER FIVE: MODEL DEVELOPMENT............................................................................ 89
5.1 Problem Articulation ..................................................................................................... 89
5.1.1 Purpose of the Model ................................................................................................ 90
5.1.2 Assumptions of the model ........................................................................................ 90
5.1.3 Key Variables............................................................................................................ 91
5.1.4 Reference Modes ...................................................................................................... 93
5.1.5 Time Horizon ............................................................................................................ 93
5.2 Formulation of Dynamic Behaviors.............................................................................. 94
5.2.1 Mapping System Structure ........................................................................................ 94
5.2.2 Subsystem Diagram .................................................................................................. 96
5.3 A Simulation Model Formulation ................................................................................. 97
5.4 Causal Loop Diagrams .................................................................................................. 97
5.4.1 Human System Integration (HSI) in the model ........................................................ 97
5.5 Model Description ...................................................................................................... 101

viii
5.6 Stocks and Flows ........................................................................................................ 108
5.6.1 Model setting for Base Model................................................................................. 109
5.6.2 Technology Implementation ................................................................................... 111
5.6.3 System Capacity...................................................................................................... 113
5.6.4 Paygrade and Skill levels ........................................................................................ 115
5.6.5 Crew Size ................................................................................................................ 119
5.6.6 Manpower cost ........................................................................................................ 120
5.6.7 Training cost ........................................................................................................... 125
5.6.8 Maintenance workload ............................................................................................ 128
CHAPTER SIX: RESULTS, TESTING OF MODELS ............................................................. 132
6.1 Simulation Run and Results ........................................................................................ 132
6.1.1 Manpower cost ........................................................................................................... 132
6.1.2 Training Cost ............................................................................................................. 135
6.1.3 Maintenance Workload .............................................................................................. 136
6.2 Sensitivity analysis...................................................................................................... 137
6.3 Model Testing ............................................................................................................. 140
6.3.1 Causal loop logic testing ............................................................................................ 140
6.3.2 Integration Error test .................................................................................................. 140
6.3.3 Extreme condition test ............................................................................................... 141
6.3.4 Hypothesis Test .......................................................................................................... 143
6.4 Verification and Validation ............................................................................................... 144
6.4.1 Manpower cost calibration ...................................................................................... 145

ix
6.4.2 Training Cost validating ......................................................................................... 147
CHAPTER SEVEN: CONCLUSIONS AND FUTURE STUDY .............................................. 149
APPENDIX A: SAMPLE PUBLIC DOMAIN DATA FROM DEPARTMENT OF THE NAVY
..................................................................................................................................................... 155
APPENDIX B: CAUSAL LOOPS DIAGRAM ......................................................................... 157
APPENDIX C: STOCKS AND FLOWS EQUATIONS............................................................ 159
REFERENCES ........................................................................................................................... 177

x
LIST OF FIGURES
Figure 1: Life Cycle Breakdown (adapted from “Operating and Support Cost-Estimating Guide,”
by Gilmore & Valaika, 1992) ......................................................................................................... 2
Figure 2: DoN Budget data from 1998 to 2012 (adapted from “Department of the Navy Fiscal
Year Budget Estimates,” 2012) ....................................................................................................... 9
Figure 3: Active Personnel Reduction of FY 2012 to FY2017 .................................................... 10
Figure 4: Manpower as a Cost Driver (adapted from “Contracting for Assured Support to the
Warfighter,” Phillips, 2001) .......................................................................................................... 13
Figure 5: Total Ownership Cost Element (adapted from “Total Ownership Cost: An Exercise in
Discipline. DTIC Document,” Boudreau and Naegle, 2004) ....................................................... 14
Figure 6: AMCOS Scope (adapted from “Army Manpower Cost System,” Black et al., 1992) .. 17
Figure 7: Personnel calculation by numbers of workload (adapted from Mannie and Risser, 1984)
....................................................................................................................................................... 19
Figure 8: Life Cycle Cost (adapted from “Handbook of human systems integration,” Booher,
2003) ............................................................................................................................................. 23
Figure 9: LHX: automation versus no automation (adapted from “Human Factors Integration:
Cost and Performance Benefits on Army Systems,” Booher, 1997) ............................................ 24
Figure 10: Optimal manning curve (adapted from “Optimized surface ship manning,” Spindel et
al., 2000) ....................................................................................................................................... 26
Figure 11: Manning module Block Diagram (adapted from “Manning and automation model for
naval ship analysis and optimization,” Scofield, 2006) ................................................................ 29

xi
Figure 12: Effects of paradigm shifts on LCS Sea frame manning (adapted from “Littoral combat
ship (LCS) manpower requirements analysis,” Douangaphaivong, 2004) ................................... 30
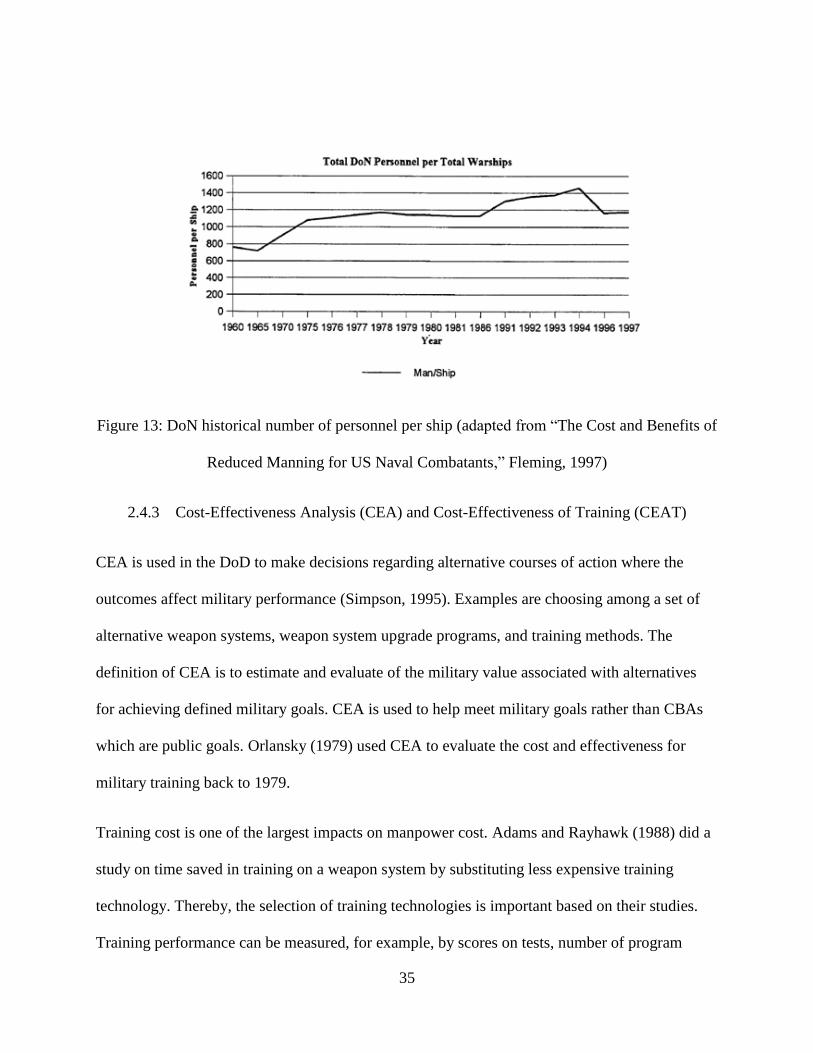
Figure 13: DoN historical number of personnel per ship (adapted from “The Cost and Benefits of
Reduced Manning for US Naval Combatants,” Fleming, 1997) .................................................. 35
Figure 14: Training effectiveness ratio equation (adapted from Adams and Rayhawk, 1988) .... 36
Figure 15: Labor Determination (adapted from McCue, 1997) .................................................... 40
Figure 16: GE’s human resource model (adapted from Yang et al., 2010) .................................. 41
Figure 17: A model of process improvement (adapted from Repenning and Sterman, 2002) ..... 45
Figure 18: Causal loop of the Machine downtime (adapted from Prasertrungruang and
Hadikusumo, 2008) ....................................................................................................................... 46
Figure 19: Organization Performance (adapted from Bajracharya et al., 2000) ........................... 47
Figure 20: Process of Performance Adjustment (adapted from Wang and Tu, 2012) .................. 50
Figure 21: Nuclear Power plant performance loop (adapted from Yu et al., 2004) ..................... 51
Figure 22: A causal Loop diagram for stress (adapted from Morris, Ross and Ulieru, 2010) ..... 52
Figure 23: Attrition Causal Loop (adapted from Herweg and Pilon, 2001) ................................. 53
Figure 24: Fatigue and workload loop (adapted from Trost, 2002) .............................................. 54
Figure 25: Construction productivity and quality factors loop (adapted from Johnson et al., 2009)
....................................................................................................................................................... 55
Figure 26: Stock and Flow Diagram of Human Resource Management (adapted from Gu and
Chen, 2010) ................................................................................................................................... 56
Figure 27: Workforce Skill Advancement Model (adapted from Herweg and Pilon, 2001) ........ 57
Figure 28: Workforce Planning Modeling (adapted from Han, 1997) ......................................... 57

xii
Figure 29: Actions of meeting project schedule (adapted from Lyneis and Ford, 2001) ............. 58
Figure 30: Human Performance with Workforce (adapted from Lyneis and Ford, 2001) ........... 59
Figure 31: Project Dynamics with workforce, productivity, and rework (adapted from Cooper
and Lee, 2009) .............................................................................................................................. 60
Figure 32: Labor Determination for Shipbuilding Industry (adapted from McCue, 1997) .......... 61
Figure 33: Workforce and Project Management (adapted from An and Ren, 2007) .................... 62
Figure 34: Project Staff modeling (adapted from MacInnis, 2004) .............................................. 63
Figure 35: Human resource modeling for GE Company (adapted from Yang et al., 2010) ......... 64
Figure 36: Causal Loop diagram of technology integration (adapted from Damle, 2003)........... 65
Figure 37: Engineering and Design Effort Structure (adapted from Damle, 2003) ...................... 66
Figure 38: Performance loop (adapted Damle, 2003) ................................................................... 66
Figure 39: Manpower effort simulation (adapted from Madachy, 1994) ..................................... 67
Figure 40: Reference mode of human performance ..................................................................... 69
Figure 41: Negative Causal Loop: Training Time and Human Performance ............................... 70
Figure 42: System Dynamics Modeling Steps (adapted from Richardson and Anderson, 1980) 71
Figure 43: Exponential Growth (adapted from Sterman, 2000) ................................................... 72
Figure 44: Goal Seeking (adapted from Sterman, 2000) .............................................................. 72
Figure 45: Oscillation (adapted from Sterman, 2000) .................................................................. 73
Figure 46: Major variables for manpower cost estimation ........................................................... 79
Figure 47: Sector map ................................................................................................................... 80
Figure 48: Training for filling up the Manpower requirement gap .............................................. 83
Figure 49: Four sections in the Casual Loop diagram .................................................................. 84
xiii
Figure 50: Reference Mode .......................................................................................................... 93
Figure 51: Subsystem Diagram ..................................................................................................... 96
Figure 52: B1 Loop ..................................................................................................................... 102
Figure 53: B2 loop ...................................................................................................................... 103
Figure 54: B3 loop ...................................................................................................................... 104
Figure 55: B4 and B5 loops ........................................................................................................ 106
Figure 56: R1 and B6 loops ........................................................................................................ 107
Figure 57: Base model sections .................................................................................................. 108
Figure 58: Stock and Flow of Technology Implementation ....................................................... 111
Figure 59: Numbers of technology implemented ....................................................................... 112
Figure 60: Ship Performance capability ..................................................................................... 114
Figure 61: Paygrade Matrix (source: Data adapted from Navy Manpower Analysis Center, 2007)
..................................................................................................................................................... 115
Figure 62: Stock and flow diagram of paygrade levels .............................................................. 116
Figure 63: Manpower cost architecture (scope).......................................................................... 120
Figure 64: DoN Data of Enlisted personnel from 2003 to 2013 (source: Data adapted from DoN
Budget Estimates) ....................................................................................................................... 123
Figure 65: Stock and flow diagram of the Manpower cost and Crew size ................................ 124
Figure 66: Stock and Flow diagram for Training Cost ............................................................... 125
Figure 67: DoN Data of monthly training cost (source: DoN Budget Estimates, 2003-2012) ... 128
Figure 68: Stock and Flow diagram for Maintenance Workload ............................................... 129
Figure 69: Model running for the next ten year from 2013 ........................................................ 133

xiv
Figure 70: Manpower cost calibration and forecasting............................................................... 134
Figure 71: Monthly training cost calibration and forecasting ..................................................... 135
Figure 72: Maintenance workload onboard ................................................................................ 136
Figure 73: Maintenance workload ashore ................................................................................... 137
Figure 74: Automation levels of three scenarios ........................................................................ 138
Figure 75: Manpower cost of three scenarios ............................................................................. 139
Figure 76: Training cost of three scenarios ................................................................................. 139
Figure 77: Simulation results for Different Time Steps .............................................................. 141
Figure 78: Extreme condition test for ship performance capability ........................................... 142
Figure 79: Extreme condition test for Crew size ........................................................................ 142
Figure 80: Reference mode ......................................................................................................... 143
Figure 81: Observed behavior ..................................................................................................... 144
Figure 82: Average monthly manpower cost—simulation and historical data ........................... 145
Figure 83: Calibration of manpower cost ................................................................................... 146
Figure 84: Ship Operation support and training cost .................................................................. 147

xv
LIST OF TABLES
Table 1 Cost Methodologies (adapted from “Cost Estimating and assessment Guide,” GAO,
2003) ............................................................................................................................................. 21
Table 2 Top-down requirement analysis task and Northrop Grumman approach (adapted from
“Human Systems Integration/Manning Reduction forLHD-Type Ships,” Johnson et al, 2005) .. 32
Table 3 Example of CBA method (adapted from “Cost-Benefit Analysis Applied to
Personnel/Human Resource Management Decisions,” Boudreau, 1990) ..................................... 34
Table 4 Distribution of Training Load (adapted from DoD report, 1997) .................................... 37
Table 5 Performance shape factors (PSFs) lists (adapted from Chu, 2010) ................................. 49
Table 6 Research gap .................................................................................................................... 75
Table 7 Effects in the four sections ............................................................................................... 81
Table 8 Technology Defining by Key Variables .......................................................................... 85
Table 9 Assessment of Different Trade-off Scenarios .................................................................. 88
Table 10 Definitions of Major Variables ...................................................................................... 91
Table 11 Model Boundary ............................................................................................................ 95
Table 12 Causal Loops Diagrams in details ................................................................................. 98
Table 13 Model Parameters value (source: Data modified from Navy Manpower Analysis Center
and DDG-51) .............................................................................................................................. 109
Table 14 Enlisted years of experience (data source: Williamson, 1999) .................................... 110
Table 15 Manpower skill levels description (source: Manual of Navy Enlisted Manpower and
Personnel Standard, 2011) .......................................................................................................... 117
xvi
Table 16 Numbers of Skillsets (source: Data adapted from Navy Manpower Analysis Center,
2007) ........................................................................................................................................... 118
Table 17 Paygrade for 300 Enlisted Personnel (source: Data adapted from DoN Budget estimate
2003-2012) .................................................................................................................................. 119
Table 18 Operation and Support training data (source: Data adapted from DoN Budget Estimates)
..................................................................................................................................................... 127
Table 19 Monthly average manpower cost forecasting (model result)....................................... 133
Table 20 Manpower cost between DoN and modeling running result ....................................... 134
Table 21 Monthly training cost forecasting ................................................................................ 135
Table 22 Enlisted paygrade data between DoN and model running ........................................... 145
Table 23 Regression analysis for manpower cost ....................................................................... 147
Table 24 Regression analysis for training cost ........................................................................... 148

1
CHAPTER ONE: INTRODUCTION
1.1 Background
The U.S. Navy has been confronted with budget cuts and constraints during recent years. This
reduction in budget compels the U.S. Navy to limit the number of manpower and personnel.
Reducing the total ownership cost (TOC) has become a major topic of interest for the Navy as
plans are made for current and future fleets. According to the U.S. Government Accountability
Office (GAO, 2003), manpower is the most influential component of determining the life cycle
cost of a ship. The vast majority of the TOC is comprised of operating and support (O&S) costs
which account for approximately 65 percent of the TOC. Manpower and personnel costs account
for approximately 50 percent of O&S costs.
The Government Accountability Office (GAO) claims that “the cost of the ship’s crew is the largest
expense incurred over the ship’s lifetime” (GAO, 2003). Because of this reason, the Navy has made
a lot of efforts to reduce crew size on board. The future ship classes will be operated by
significantly smaller crew. New technologies are being introduced into the United States military
system in order to empower enhanced performance with fewer personnel.
Figure 1 depicts a historical breakdown of the life cycle cost (LCC) for a typical major weapon
system. System TOC equates with LCC which includes research and development cost,
investment cost, operation and support cost and disposal cost (Gilmore & Valaika, 1992). Operation
and support cost accounts for approximately 60 percent of LCC.

2
Figure 1: Life Cycle Breakdown (adapted from “Operating and Support Cost-Estimating Guide,”
by Gilmore & Valaika, 1992)
According to Gilmore & Valaika (1992), these four phases in LCC can be described as follows:
Phase 1 Research and Development (R&D): R&D includes development and design costs for
system engineering and design, test and evaluation, and other costs for system design features. It
also includes costs for development, design, startup, initial vehicles, software, test and
evaluation.
Phase 2 Procurement and Investment (P&I): P&I include total production and deployment costs
of the system and its related support equipment and facilities. It also includes any related
equipment and material furnished by the government, initial spare and repair parts, interim
contractor support, and other efforts.

3
Phase 3 Operation and Support (O&S): O&S include those costs associated with using
manpower, fuel, maintenance, and support through the entire life cycle.
Phase 4 Disposal: It includes the costs of disposing the equipment after its useful lifecycle.
Currently, the increasing sophistication of weapon systems and new technologies has increased
requirements for Navy manpower. New technologies also require the Navy to coordinate
manpower and technology decisions. It is critical for the Navy to determine its manpower needs
for a ship readiness. Too few crews or too many members are not good ideas for optimizing
source allocation (Moore et al., 2002). In order to achieve desired system performance within
approved cost and other constrains, the Navy has applied Human System Integration (HSI) and
advanced technologies within the total ship systems engineering process, such as DDG-51
reduced manning study (Bost and Galdorisi, 2004). The pressure to reduce manpower on Navy
ships in order to reduce the ship’s TOC has become a major topic for the Navy for more than a
decade (Carreno et al., 2010).
According to the Department of the Army (2001), manpower includes the number of personnel
of operating, maintaining, supporting and training for a system. Manpower requirements have a
significant impact on system performance, such as system reliability and system maintainability
(Clarke, 1990). System reliability and system maintainability have impacts on manpower in
terms of number of personnel and skill levels. For example, reliability of a system determines the
number of corrective maintenance actions, so does numbers and skills of maintenance personnel.

4
Manpower requirements are a key factor for determining manpower cost. Fully understanding
manpower requirements and other cost drivers enable program managers and decision makers to
make the right choice for future weapon systems launchings. It also enables the Department of
Defense (DoD) to improve cost estimation and improve resource allocation. To become more
efficient, the U. S. Navy must fully understand TOC cost drivers for ship systems. However,
currently the U. S. Navy has not totally understood all the major TOC cost drivers.
1.2 Research Question
Based on the current issues and problems, my research questions are:
1. How can we help the program managers fully understand major TOC cost drivers?
2. How can we help decision makers fully understand manpower cost drivers associated
with new technology implementation by using SDM approach?
1.3 Research Objectives
The objectives of this research are:
1) To identify major factors that impact Navy manpower cost associated with different
technology implementation periods.
2) To develop a SDM to estimate manpower cost and conduct a technology tradeoff
analysis.

5
3) To assist decision makers and program managers when considering the impacts of
technology selection on manpower cost.
4) To provide managers with a better understanding of the hidden costs associated with new
technology adoption.
This research focuses on tradeoff analysis and cost estimation between manpower and
technology implementation in the phase of O&S. Utilizing concepts from SDM, system
dynamics causal loop diagrams (CLD) were built to identify major factors when implementing
new technology, and then stocks and flows diagrams were built to estimate manpower cost
associated with new technology implementation. The system dynamics base model reflects an 18
month period for technology implementation, and then the result was compared with different
technology implementation periods for different scenarios.
Introducing state-of-the-art technology, such as Multi-Model Watchstation (MMWS), has
potential effects on required skill levels, training requirements and system performance
capability. For example, additional training is needed to improve manpower skill levels due to
the complexity of state-of-the-art technology. The additional training requirements increase
sailors’ skill levels as well as manpower cost. As a consequence, TOC increases due to the
increased manpower cost after introducing this new technology.
In order to accomplish this research, articles and journal papers were reviewed to gain a broad
understanding of the complex issues involving manpower cost reduction and manpower
technology trade-offs. Using Human System Integration (HSI) concepts, critical variables such
as manpower and manpower-technology trade-off were involved in this research. By comparing

6
the tradeoff results, this study sought to assist program managers when considering the impacts
of technology selection on manpower cost.
1.4 Expected Research Results
Expected research results are as follows:
Identify the major factors which impact Navy manpower cost associated with new
technology implementation
Build a SDM for facilitating Navy manpower cost and training cost
Provide information to investigate manpower cost and conduct a technology trade-off
analysis so that decision makers and program managers can make better decisions
Examine training cost for different training technologies and changing numbers of instructors
1.5 Organization of this research
This research has been organized into seven chapters as follows:
Chapter One contains the introduction of this research
Chapter Two and Three contain literature reviews which include manpower cost and
system dynamics applications in manpower related research
Chapter Four contains the research methodology
Chapter Five contains the modeling development details
Chapter Six contains the discussion of research results

7
Chapter Seven contains a conclusion and future study areas

8
CHAPTER TWO: MANPOWER COST METHODS REVIEW
2.1 Introduction
Since the U.S. Navy has been confronted budget cuts and constraints during recent years, it is
critical for the Navy to do workforce/manpower planning in the early stages of projects. Decision
makers need to consider and forecast human related factors for different purposes in order to
decrease manpower cost. According to Scofield (2006), the cost of a ship crew is the largest
expense for any ship system.
The following figure depicts the Department of the Navy (DoN) budget from 1998 to 2012. The
yellow bars represent the amount of the Budget Authority. The Budget number was 180.32
billion in 2010. However, it dropped to 175.79 billion in 2011 and continually dropped to 161.10
billion in 2012. That is an approximately 8.4 percent reduction between the FY 2011 and
FY2012. Currently the Navy is forecasting additional reductions for the FY 2013 which could be
severely affected by sequestration for the FY 2014 budget.
As mentioned in Chapter One, manpower cost is the most influential component of determining
the life cycle cost of a ship. Therefore, the Navy must strive to effectively reduce the costs
associated with manpower in order to compensate for a decreasing budget. According to the
international council on system engineering (INCOSE, 2007), human related costs usually
account for approximately 67% of TOC.

9
Figure 2: DoN Budget data from 1998 to 2012 (adapted from “Department of the Navy Fiscal
Year Budget Estimates,” 2012)
In addition, the Navy needs to match personnel to the right tasks or positions when considering
increasing technology complexity. The GAO claims that “the cost of the ship’s crew is the largest
expense incurred over the ship’s lifetime” (GAO, 2003). Because of this reason, the Navy has made
a lot of efforts to reduce crew size on board. The future ship classes will be operated by
significantly smaller crew. New technologies are being introduced into the United States military
system in order to empower enhanced performance with fewer personnel. Reduced personnel levels
can result in significant financial savings for the Navy, as well as enhanced quality of life for
sailors, thus helping meet the Navy’s challenges of more missions, less overall cost, and

10
increased competition for qualified people (Spindel et al., 2000). Therefore, clearly identifying
the components of manpower cost is very critical for Navy decision makers.
Figure 3: Active Personnel Reduction of FY 2012 to FY2017
(adapted from “Department of the Navy Fiscal Year Budget Estimates,” 2012)
Figure 3 shows the active personnel reduction trend based on DoN Budget data. Civilian
manpower also will drop for the upcoming fiscal years according to the DoN Budget documents.
The following review section starts with the definition of Manpower and relationship with
personnel, followed by components of the manpower life cycle cost and manpower requirement
components, and then focuses on different manpower cost methods from previous research
efforts.
11
2.2 Manpower Definition and Cost Components
2.2.1 Definition and History
According to the Department of Army (2001), Manpower includes the number of personnel of
operating, maintaining, supporting and training for a system. Manpower cost analysis is an
analytical approach, using different tools and techniques to develop personnel costs for various
Navy systems.
According to the Human System Integration (HSI) Handbook (Booher, 2003), manpower
includes determination of the number of personnel to maintain and support a new system. It also
includes calculations of whether more personnel are needed than it is required by the new
system.
According to Lockman (1985), manpower includes requirements for human related factors to
achieve organizational goals. Manpower requirements are concerned with the numbers and skills
needed to operate the Navy.
The Ship Manpower Document (SMD) is an important document for the Navy in establishing a
reliable numbers for ship personnel, and in managing ship readiness. The Navy Manpower
Analysis Center (NAVMAC) has a responsibility to create documents for the mission
requirements of the billets when a class of ships is under development.
12
Currently, the increasing sophistication of weapon systems and new technology has increased the
requirement for Navy Manpower. New technology also requires the Navy to have qualified
personnel on board to accomplish missions.
2.2.2 Differences and Relation with Personnel
According to the MANPRINT Handbook (2005), Manpower and personnel are closely related.
Manpower focuses on the number of persons, however, personnel focus on the cognitive and
physical characteristics that need to operate, maintain, and sustain different systems. Personnel
characteristics of enlisted personnel can be measured by the Armed Forces Qualification Test
(AFQT) and the Aptitude Area scores determined by the Career Management Fields (CMFs).
Manpower looks not only at what types of personnel but also at how many personnel are needed
to operate, sustain, and maintain a particular system.
2.2.3 Importance of Manpower cost
As we know, manpower cost comprises over 50 percent of O&S cost. O&S cost is a major
component of total ownership cost. Therefore, it is critical to understand manpower cost in order
to reduce the total ownership cost. Research has been done in an effort in to reduce manpower
cost during the last decade.

13
Masiello (2002) conducted research in the area of identifying factors that reduce the Total
Ownership Cost. Figure 4 lists these cost drivers that have the potential of reducing O&S cost.
Manpower is one of the major drivers for reducing TOC in this research.
Figure 4: Manpower as a Cost Driver (adapted from “Contracting for Assured Support to the
Warfighter,” Phillips, 2001)
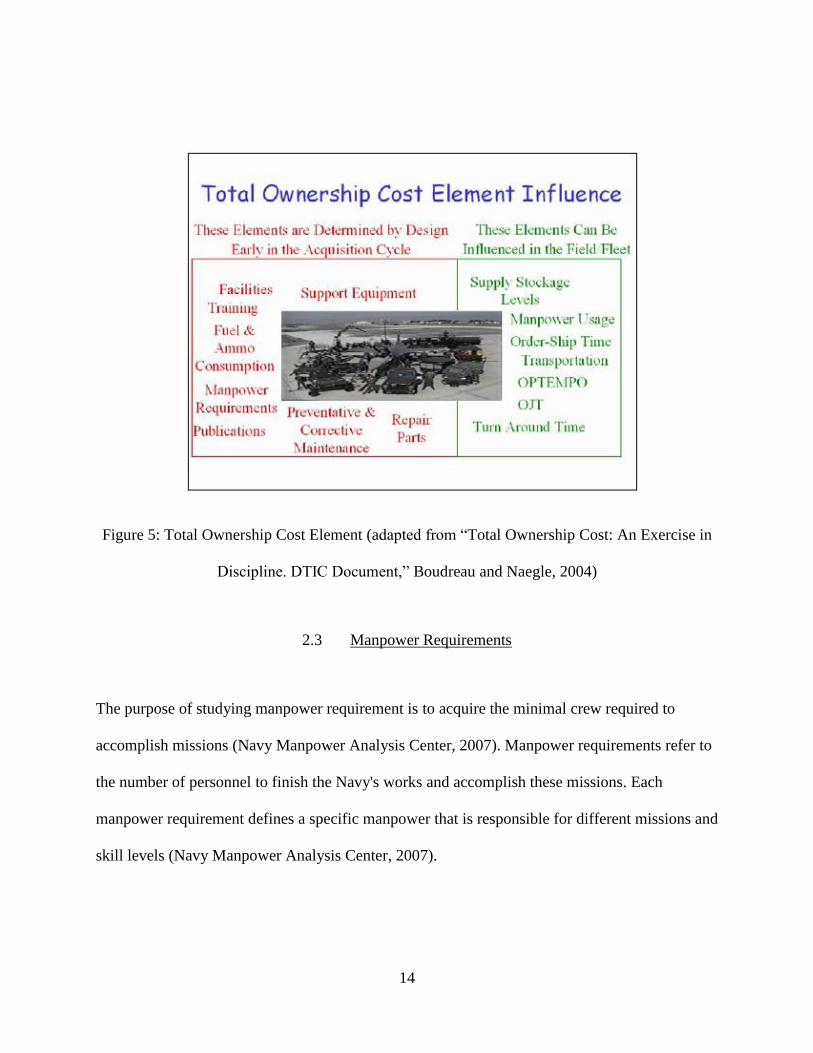
According to Boudreau and Naegle (2004), manpower requirements are one of the cost elements
which have a largest impact on TOC. The following figure shows the manpower requirements
and manpower usage as they relates to TOC element influence.
14
Figure 5: Total Ownership Cost Element (adapted from “Total Ownership Cost: An Exercise in
Discipline. DTIC Document,” Boudreau and Naegle, 2004)
2.3 Manpower Requirements
The purpose of studying manpower requirement is to acquire the minimal crew required to
accomplish missions (Navy Manpower Analysis Center, 2007). Manpower requirements refer to
the number of personnel to finish the Navy's works and accomplish these missions. Each
manpower requirement defines a specific manpower that is responsible for different missions and
skill levels (Navy Manpower Analysis Center, 2007).

15
It is critical for the Navy to determine its manpower needs for a ship readiness. Too few crews or
too many crew are not good ideas for optimizing source allocation (Moore et al., 2002). Today’s
new technologies have different requirements for Navy manpower drivers and cost analysis. The
Navy has made a lot of efforts to reduce crew size on board for more than a decade. The future
ship classes will be operated by significantly smaller crew. Therefore, it is imperative to determine
manpower requirements so that the Navy has the ability to establish the minimal crew size but
meanwhile to achieve mission readiness. Manpower requirements also change over time as the
mission changes or technology improves (Thie, 2008).
2.3.1 Manpower Components
Broadly, there are two types of components related to manpower cost. Manpower requirements
happen at the early stage of the Navy acquisition cycle. It has to be clarified based on the
workload and ship design. However, Manpower cost components provide manpower life cycle
cost consideration such as basic pay, cost of training, etc. This cost has a big impact on the O&S
cost.
2.3.2 Manpower Requirement Determination Factors
The following elements determine manpower requirements:
(1) Required operational capability and projected operational environment (ROC/POE)
(2) Directed manpower requirements
(3) Watch stations

16
(4) Preventive, corrective, and facilities maintenance
(5) Workload requirements
ROC/POE is the most critical element to estimate manpower requirements. The ROC defines the
system’s mission requirements, and the POE specifies operating environment in which the unit is
expected to operate (DoN, 2007). Workload factor is another key element used to calculate
manpower requirements.
2.3.3 Manpower Cost Model Components
The AMCOS (Army Manpower Cost System) module provides components of the manpower
life cycle cost. These components as follows:
1) Military compensation (Basic Pay and Allowances)
2) Civilian base salary
3) Officer acquisition
4) Recruiting
5) Training
6) Reenlistment bonuses
7) Retirement costs
8) Selective reenlistment Bonus
9) Other benefits
10) Special or premium Pay

17
11) Medical benefits
Fully understanding manpower cost drivers will allow policy makers to make appropriate
decisions on future weapon systems launching. It also enables the Army to improve cost
estimates and improve resource allocation. Black et al., (1992) described the model of the Army
manpower cost in the diagram below.
Figure 6 showed the scope of this model. The AMCOS was designed to provide the budgetary
cost of manpower requirements by skill categories, grade, cost element (e.g. compensation,
retirement benefits), and congressional appropriation. The model describes the scope of
estimating the cost of current and future manpower requirements for the Army including
components of the active, reserve, and civilian.
Figure 6: AMCOS Scope (adapted from “Army Manpower Cost System,” Black et al., 1992)

18
2.3.4 Workload Categories for Manpower Requirement
It is important to clarify workload categories in order to understand manpower requirements for
the Navy. The MANPRINT Handbook (2005) establishes guidance for decision makers
regarding the type of workers required to achieve different missions.
According to the Navy document, operational manning (OM), own-unit support (OUS),
preventive maintenance (PM), corrective maintenance (CM), and facilities maintenance (FM) are
major categories to determine manpower requirement. These categories affect different types of
primary workloads.
According to Moore et al (2002), the Navy manpower cost analysts interpret the workload
onboard by interviewing with crew members. Crewmember workload was distinguished based
on their knowledge, skills and abilities (KSA). Operational manning was the largest workload for
crew members (Correno et al., 2010). Among these factors, OM make up 38% percent of
workload and OUS account for another 22% of the workload. Training comprises approximately
10% of the workload.
There are some options for the Navy to reduce manpower requirements. Moore et al. (2002)
described three choices reduce crew sizes including (1) technology in reducing workload (2)
more reliable and experienced crew members, and (3) more efficient people to reduce redundant
work.
19
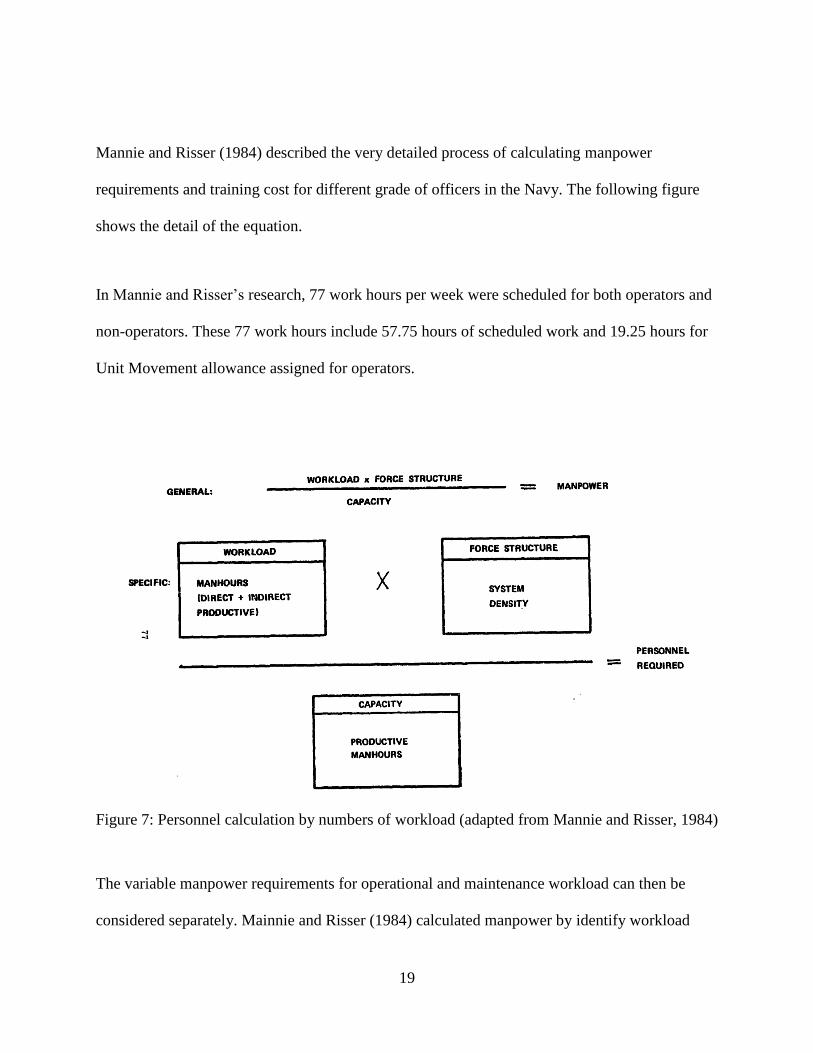
Mannie and Risser (1984) described the very detailed process of calculating manpower
requirements and training cost for different grade of officers in the Navy. The following figure
shows the detail of the equation.
In Mannie and Risser’s research, 77 work hours per week were scheduled for both operators and
non-operators. These 77 work hours include 57.75 hours of scheduled work and 19.25 hours for
Unit Movement allowance assigned for operators.
Figure 7: Personnel calculation by numbers of workload (adapted from Mannie and Risser, 1984)
The variable manpower requirements for operational and maintenance workload can then be
considered separately. Mainnie and Risser (1984) calculated manpower by identify workload

20
amount divided by the total work hours per week. OM, SM, UM and PMCS represent
operational manning, scheduled maintenance, unscheduled maintenance, and preventive
maintenance checks and services respectively.
2.4 Manpower Cost Methods
Leonard (2009) summarized four common types of cost estimating methods for different
applications. These commonly used methods for estimating costs include analogy, Engineering
bottom-up, parametric and the expert opinion approach. An Analogy uses the cost of similar
programs to estimate the new program and adjusts it for differences. The Engineering Bottom-up
method develops the cost estimation from the lowest level of the system, and then summarizes
all levels. The parametric method relates cost to one or more program parameters by using a
statistical relationship. Expert opinion uses the subjective matter experts to develop estimates.
Table 1 compares the first three methods summarized by GAO document.

21
Table 1 Cost Methodologies (adapted from “Cost Estimating and assessment Guide,” GAO,
2003)
The following section summarized different methods related with manpower cost for different
manpower research projects. These methods comprise HSI trade-offs, cost-benefit analysis, cost-
effectiveness analysis, econometric approach, linear regression method, and simulation methods.
2.4.1 Human System Integration (HSI) Trade-Off
The goal of Human System Integration (HSI) is to reduce TOC and improve system performance
by involving human –related areas. According to DoD instruction 5000.02 (US DoD, 2008),
there are seven domains of HSI which include manpower, personnel, training, human factors
engineering, survivability, habitability, and safety & occupational health. HSI is used to
minimize TOC and optimize manpower at the same time. This method takes into consideration

22
human capabilities and limitations during the phase of system designing. The U.S. Army initially
started to develop HSI tool and used the tool to support quantitative trade-offs (Booher, 2003).
By considering different stakeholders’ interests, HSI can improve system performance and
minimize TOC (Landsburg et al., 2008). Early HSI analyses decreased cost by making the job
easier and the people more effective. In order to minimize TOC and also to optimize total system
performance, the DoD has directed program managers to consider HSI in the early stage of the
acquisition process (DoD, 2008). The reason is that HSI considers improving system
performance and reducing TOC at the same time. For example, The Canadian Defense
Technology Center conducted research from 2000 to 2004 on the application of HSI during 31
Defense acquisition programs. The research led to a savings of $3.33M overall. Sindall (2010)
asserted that it is important to incorporate HSI analyses into system performance since it has a
significant impact on life-cycle costs. Currently, reducing ship crews using HSI tools and
concepts has become a Navy priority.
The goal of HSI analyses is to satisfy system requirements without scarifying TOC, system
performance, and delivery schedule (Shattuck et al., 2011). Using the HSI method, research
completed to reduce manpower include using automation to replace personnel, designing
systems that have lower maintenance requirements, and reducing maintenance requirements on
the ship’s crew by using more shore based maintenance. Cross-training crewmembers to perform
the work of other crewmembers is another suggestion that may help eliminate underutilized
shipboard personnel (Scofield, 2006).

23
HSI has been applied in many ways for military applications. The U.S. Air force has
demonstrated cost can be decreased by using HSI technology. Lizza et al (2008) did study of the
F-22 Raptor associated with manpower, personnel and training and led to a $700M cost
avoidance, and subsequent approximately $3B lifecycle savings.
HSI mainly takes into consideration human capabilities and limitations during the phase of
system designing. The phased of system designing happens in the early stage of the LCC. The
following figure shows these phases of LCC.
Figure 8: Life Cycle Cost (adapted from “Handbook of human systems integration,” Booher,
2003)

24
The successful stories by using HSI can be traced back to the 1990s. The Military started a
program called MANPRINT (the Army’s manpower and personnel integration). MANPRINT
focuses on considering human-related domains into the system acquisition process. It started the
recognition of each human component of the total system. One of goals for MANPRINT is to
reduce TOC (MPT Handbook, 2005). MANPRINT is recognized as being very successful at
reducing costs and improving safety and performance in technology acquisition. For example,
Comanche helicopter applied MANPRINT in design and development and achieved $3.29
billion cost avoidance in human related cost.
Another successful story applied HSI is the Light helicopter. In Booher’s (1997) paper, workload
and automation trade-off were specified in the flowing figure. The design of adopting a two-seat
was a choice for satisfying mission performance. However, 12% more maintenance support
would be required than the single-seat design because of the additional manpower requirement.
Figure 9: LHX: automation versus no automation (adapted from “Human Factors Integration:
Cost and Performance Benefits on Army Systems,” Booher, 1997)

25
Bost and Galdorisi (2004) specified the process that aims to reduce the workload and improve
system performance by applying HSI trade-off analysis. HSI trade-off analysis include different
areas. HSI trade-off attempts to use different technology, automation, and training technology to
reduce manpower cost and improve system performance. Booher (2003, ch11) listed trade-off
areas for manpower, training , and aptitude. Lower personnel aptitude increases training
requirements.
The Air Force HSI handbook (Force, 2008) also listed tradeoffs and the relationships within and
between manpower, personnel, and training domains. These tradeoffs deal with associated LCCs
that apply to the proposed operations and sustainment concepts of the system.
Scofiled (2006) demonstrated that there are many possible options available to ship designers to
reduce the number of crewmembers onboard ship. These possible options include improving in
automation, maintenance workload, training, and system capabilities. Nugent and white (2000)
also described some options for the best crew manning strategy including minimizing the
number of different jobs, minimizing workload and new jobs to determine overall affordability in
terms of system development, training and personnel costs. In order to reduce TOC, researchers
tried to develop new methods for optimizing manpower. Spindel et al (2000) attempted to find
the relationship among TOC, manpower level, and ship capability. The relationship among these
three variables is depicted in the figure below.

26
Figure 10: Optimal manning curve (adapted from “Optimized surface ship manning,” Spindel et
al., 2000)
Figure 10 illustrates the tradeoffs among three variables including TOC, manpower, and
capability. Finding the optimized manpower level under the constraint of TOC and keeping good
war fighting capability is the key for the Navy. Simply minimizing the number of personnel on a
ship does not constitute an optimal crew.
2.4.1.1 Technology tradeoffs
Since this research particularly specified manpower and technology tradeoffs, the following
section focuses on a review of HSI in technology tradeoffs.
In 1995, the Smart Ship program demonstrated the success in reducing manpower, maintain ship
capability and improve shipboard quality of life by implementing new technology. The USS
Yorktown (CG 48) was chosen to exercise this program.

27
Eventually the Smart Ship program achieved workload reductions in three major areass
(Koopeman and Golding, 1999). These areas include:
Policy and procedure : only core watchstation are operated all the time
Technology: applied more automated functions in navigation, machinary control, and
other systems
Maintenance methods: used more relaible maintenance methods to reduce the PM
workload
Those methods combined to reduce the weekly workload about 30 percent or a 12 person
reduction for the USS Yorktown.
Although the smart ship program was tested by the legacy ship USS Yorktown, it also
demonstrated new, more automated systems that can apply for this program. For both new
construction and existing ships, the Navy tries to improve human and system performance by
integrating HSI and other technologies. For example, a study had been conducted to determine
methods to reduce manpower requirements on the Arleigh Burke class destroyers (Osga and
Galdorisi, 2003). Their research also mentioned the Navy launched the Sea Power 21
transformation plan in 2003 which included three support processes for manpower and
technology. With the new technology installed, the system should work cooperatively with
human supervision.
Koopeman and Golding (1999) and Osga (1999) described the detail of Multi-Modal Watch
station (MMWS) technology development in order to increase automation and reduce workload
for Navy platforms. MMWS is an improved workstation that aims to reduce manpower

28
requirements by applying advanced displays and embedded intelligence. Correno et al (2010)
described a method of developing improved human computer integration (HCI) to allow one
operator to control more than one unmanned vehicles. The HCI achieves this by reducing
cognitive and visual workloads on each vehicle. Thereby, it also achieves a substantial
manpower savings.
Thie (2008) summerized options for DoD in trade workforce. These options include:
(1) Trade one workforce for another. Under some circumstances, replacing the highest-cost
workforce into a cheaper one.
(2) Trade non-experienced sailors for experienced sailors. It can be achieved by using a
smaller but more-experience workforce.
(3) Reduce manpower investement in a long run. It can be achieved by increasing short-term
material acquisition cost for technology to reduce the long-term manpower cost.
Among these three options, the third option is the trade-off between technology and manpower.
Bost and Galdorisi (2004) also studied this using HSI to reduce manning. In their study, they
leveraged HSI in existing ship systems like the DDG-51 ship. They identified workload levels by
analyzing of the tasks of sailors.
Scofiled (2006) studied manpower and automation tradeoffs. In his paper, he listed the different
levels of automation and defined them in a very detailed way. He also illustrated that automation
is the largest factor having impact on the crew size. His model uses ship length, level of

29
automation, level of maintenance as inputs. The output is the crew size in his model. Figure 11
depicts this information:
Figure 11: Manning module Block Diagram (adapted from “Manning and automation model for
naval ship analysis and optimization,” Scofield, 2006)
Douangaphaivong (2004) did a study on manpower reduction for the Littoral Combat Ship
(LCS).In his research, technology leverage and workload transfer methods are discussed.
Technology Leverage applies the Smart Ship technologies to reduce the manpower requirements.
Workload Transfer seeks to reduce workload onboard. The following figure shows the workload
transferring illustration to reduce manning initiatives onboard for the study of LCS.
Obviously, it is a good way for the Navy to reduce manpower by implementing new technology.
Many researches had been conducted to develop platforms to reduce manpower for future Navla
systems. HSI initiatives have been implemented into Naval system design and development in
order to achieve manpower reduction.

30
Figure 12: Effects of paradigm shifts on LCS Sea frame manning (adapted from “Littoral combat
ship (LCS) manpower requirements analysis,” Douangaphaivong, 2004)
2.4.1.2 Top-down Requirements Analysis
The top down requirements process has been outlined in the research of Malone and Carson
(2001). First, the HSI high drivers and lessons learned from comparable legacy systems are
identified. Next, mission requirements are identified for different scenarios. Following this, an
iterative process is identified to reduce workload and increase human performance. Human
performance and workload are assessed via modeling and simulation and then tasks and task
performance requirements are analyzed. The affordability and risk of each contemplated
improvement is also assessed. Finally, the requirements of manpower, human performance,
health and safety complete after all processes are complete (Lockett and Duma, 2009).
Malone and Carson (2003) described the method of reducing manpower requirements form 47 to
12 by using this Top-down analysis.
31
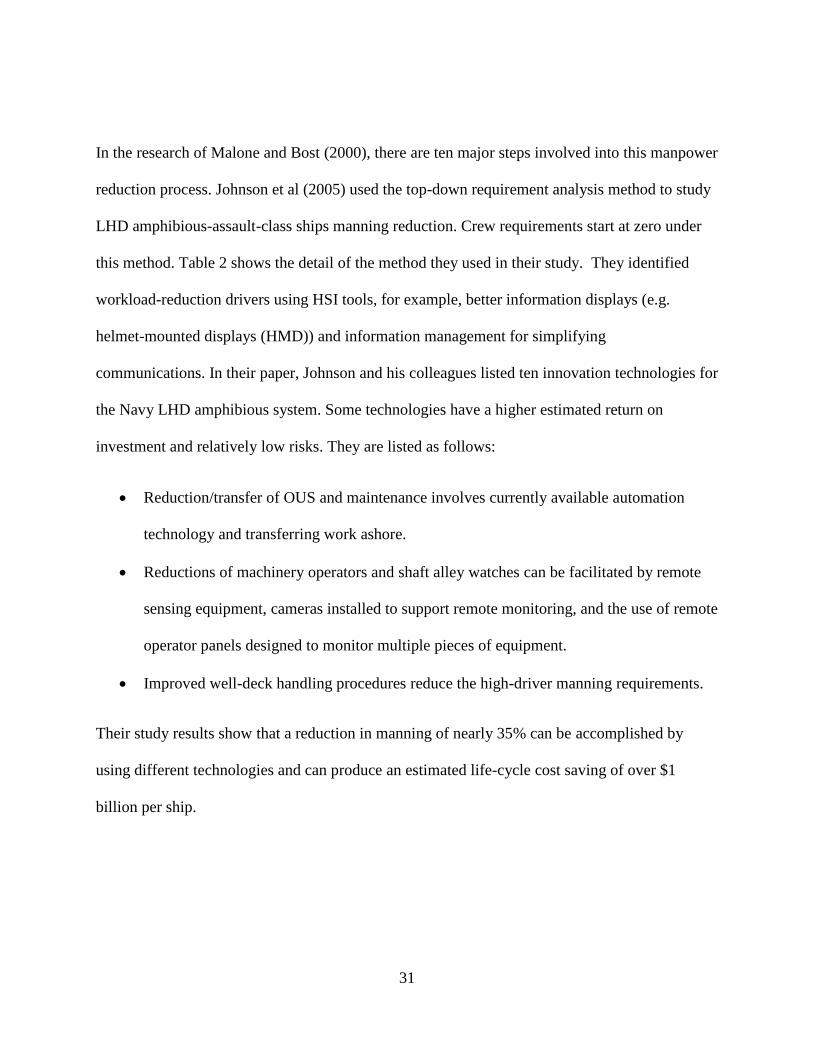
In the research of Malone and Bost (2000), there are ten major steps involved into this manpower
reduction process. Johnson et al (2005) used the top-down requirement analysis method to study
LHD amphibious-assault-class ships manning reduction. Crew requirements start at zero under
this method. Table 2 shows the detail of the method they used in their study. They identified
workload-reduction drivers using HSI tools, for example, better information displays (e.g.
helmet-mounted displays (HMD)) and information management for simplifying
communications. In their paper, Johnson and his colleagues listed ten innovation technologies for
the Navy LHD amphibious system. Some technologies have a higher estimated return on
investment and relatively low risks. They are listed as follows:
Reduction/transfer of OUS and maintenance involves currently available automation
technology and transferring work ashore.
Reductions of machinery operators and shaft alley watches can be facilitated by remote
sensing equipment, cameras installed to support remote monitoring, and the use of remote
operator panels designed to monitor multiple pieces of equipment.
Improved well-deck handling procedures reduce the high-driver manning requirements.
Their study results show that a reduction in manning of nearly 35% can be accomplished by
using different technologies and can produce an estimated life-cycle cost saving of over $1
billion per ship.

32
Table 2 Top-down requirement analysis task and Northrop Grumman approach (adapted from
“Human Systems Integration/Manning Reduction forLHD-Type Ships,” Johnson et al, 2005)
2.4.1.3 Personnel and training trade-off
Booher (2003) expressed that the trade-off space in training associated with time, quality, and
cost. Especially the trade-off is between cost and time due to the system performance standards.
For example, managers may raise the instructor-to-student ratio in order to make the training
time shorter. However, this action will increase cost for paying instructors. Another alternative is
to reduce the training time in order to decrease training cost.

33
2.4.2 Cost-Benefit Analysis (CBA)
Cost-Benefit Analysis (CBA) is a technique for decision makers to determine how much cost
spent comparing with amount of benefits. CBA has many applications for decision makers such
as finance, economy, and marketing decisions that can be interpreted in terms of dollars. Three
basic types of benefits include cost savings, cost avoidance, and productivity improvements
(Department of the Army, 2001). Most researchers agree with Swope (1976) that a CBA process
should include the following steps:
• Formulate Assumptions
• Determine Alternatives
• Determine Costs and Benefits
• Compare and Select Alternatives
• Conduct Sensitivity Analysis
In Boudreau (1990)’s paper, he used the CBA method to do the personnel and human resource
analysis. Boudreau believed that it was vital to compare the money spent on human factors work
and the money obtained from benefits in the current economic climate. One of the CBA
methods addresses the money value of investing some resources (e.g. technology) to improve the
performance of system or manpower. CBA gives decision makers different options in
maximizing benefits.

34
Table 3 Example of CBA method (adapted from “Cost-Benefit Analysis Applied to
Personnel/Human Resource Management Decisions,” Boudreau, 1990)
The table above gives us examples of two options and major cost factors for these two options
and then compares how much benefit (e.g. Skills earned) for each alternative. Finally decision
makers make the decision based on the calculation of two options. This method also calculates
the Break-Even (BE) points for each alternative. If benefits obtained are less than the BE points,
then the alternative does not need to be considered part of the final outcome.
Fleming (1997) studied the cost and benefits for Smart Ship technology. Smart ship was
mentioned as a technology for manpower reduction in his research. The project aimed to reduce
cost in shipboard operation and control. It used common sense approaches, along with “off the
shelf” technology to reduce manpower requirements for watch stations. In the conclusion of his
paper, Fleming asserted that the Smart Ship technology can achieve a maximum saving of 0.54
percent of the toal budge for the DoN using FY 1996 dollars. Figure 13 reflects personnel to ship
ratio changing over time.
35
Figure 13: DoN historical number of personnel per ship (adapted from “The Cost and Benefits of
Reduced Manning for US Naval Combatants,” Fleming, 1997)
2.4.3 Cost-Effectiveness Analysis (CEA) and Cost-Effectiveness of Training (CEAT)
CEA is used in the DoD to make decisions regarding alternative courses of action where the
outcomes affect military performance (Simpson, 1995). Examples are choosing among a set of
alternative weapon systems, weapon system upgrade programs, and training methods. The
definition of CEA is to estimate and evaluate of the military value associated with alternatives
for achieving defined military goals. CEA is used to help meet military goals rather than CBAs
which are public goals. Orlansky (1979) used CEA to evaluate the cost and effectiveness for
military training back to 1979.
Training cost is one of the largest impacts on manpower cost. Adams and Rayhawk (1988) did a
study on time saved in training on a weapon system by substituting less expensive training
technology. Thereby, the selection of training technologies is important based on their studies.
Training performance can be measured, for example, by scores on tests, number of program

36
graduates, or measures of on-job-performance. In his research, training costs play an important
role in Cost-Benefit analysis along with training effectiveness. The determination of these costs
is a multidisciplinary process which should involve psychologists and training developers. Cost
estimation should take into account several economic factors such as fixed and variable costs,
Time value of money, Opportunity cost, suck cost, discount rates, constant and current dollars.
Opportunity cost and sunk costs are related with training cost. In their research, training
effectiveness ratio (TER) can be expressed by time. By comparing new training technology in
time saving, decision makers can determine whether the new training technology is better than
the alternatives.
Figure 14: Training effectiveness ratio equation (adapted from Adams and Rayhawk, 1988)
This method is heavily used for evaluating training effectiveness. DoD invests heavily in training
every year for manpower readiness. In Simpson’s (1995) research, he pointed out that the
Military Manpower Training Report indicated that the cost of individual training of military
students for FY94 accounts for approximately 5.6% of the DoD budget ($14.2 B). DoN’s budget
will continually decrease the spending on training and education, for example, the training and
education budget decrease approximately $0.2 billion for the budget year of 2013.

37
Table 4 lists six categories of training. Among these training categories, specialized skill training
is the largest training category according to DoD.
Table 4 Distribution of Training Load (adapted from DoD report, 1997)
CEAT is the specific form of CEA used in the DoD to make decisions associated with alternative
courses of action for training. Effectiveness from training can be measured by shortening task
completion time. The formula was presented by Simpson (1995) in the following form:
(1)
Yc: time for a control group
Yx: corresponding time for an experimental group
X : the time
2.4.4 Econometric approach
Economists make evaluations based on supply and demand. Warner (1981) did a study
regarding Navy Manpower research and reviewed the Navy manpower system market in terms

38
of supply and demand. He used an economic framework for analyzing Navy Manpower
problems. Manpower was measured by quality, skill or experience level, sex, etc.
In his research, supply determinants include higher military pay, higher unemployment, more
recruiters, and more advertising. The Navy determines its manpower demand(requirements) for
most ships and aircraft squadrons by combining a statement of the required operating capability,
staffing criteria established using management engineering techniques, and the Navy standard
work week.
Warner’s research studied an overall review of Navy labor supply and demand.
2.4.5 Linear Regression method
Ting (1993) built a mathematical relationship for the Navy Manpower Operation and Support
system based on the data of 652 ships of acquisition cost in 1992 dollars. He grouped 652 ships
into 11 groups and calculated the average annual pay of both officers and enlistees. He assigned
manpower as the dependent variable, the number of officers (OFFNAVY) and enlistees
(ENLNAVY) were the independent variables for each ship. The coefficients of these variables
represent the average annual pay for officers and enlistees respectively. The following equation
shows the relationship of variables. The number of personnel on board a ship is proxy for ship
size and ship equipment.
(2)

39
Wang (2012) described workforce planning as a way to estimate numbers of qualified personnel
at the minimal cost. Wang (2005) also used the Linear Programming (LP) to determine
workforce numbers.
2.4.6 Simulation method
2.4.6.1 Agent-based modeling
Trifonov et al (2005) used Agent-based modeling in developing the manpower and personnel
system for the Navy. The model captured the dynamics of sailor recruitment, training, retention
and their performance during missions as well. By describing an agent’s properties (e.g. sailor,
recruitment, training, retention, ship, watch station) in their model, the model tried to improve
the understanding of existing policies and potentialities to design new policies for the Navy.
2.4.6.2 System Dynamics modeling
McCue (1997) developed system dynamics models for the labor determination of ship building.
This workforce is reduced by normal attrition and layoffs. It is increased by newly trained
workers after a certain training time. Attrition is set at approximately 10% per year. In his
model, the available workforce contributed to the number of project labor and planned work
remaining for the decided desired labor force.

40
Figure 15: Labor Determination (adapted from McCue, 1997)
Yang et al. (2010) constructed a system dynamics modeling approach for human resources for
the GE Company. Figure 16 showed these variables in this GE human resource model. These
major variables include hiring rate, job loading, and investment in human resource, employee
fear, and employee pressure.

41
Figure 16: GE’s human resource model (adapted from Yang et al., 2010)
An and Ren (2007) used the system dynamics modeling approach to capture behaviors of
workforce planning. The goal of the workforce planning is to estimate numbers of qualified
personnel at the minimal cost to accomplish organizational performance.
The following chapter provides additional details of System Dynamics Modeling methods for
manpower cost.
42
CHAPTER THREE: SYSTEM DYNAMICS MODELING LITERATURE
REVIEW
3.1 Introduction
This chapter discusses system dynamics modeling and various applications related to the human
factor, human performance and human system integration related fields. System dynamics
modeling was developed at MIT in 1956 and deals with how things change through time
(Forrester, 1996). It was developed to understand how policy changes impact the dynamics of
corporations by managers or policy makers (Sterman, 2000). System dynamics also has the
ability to help managers and decision makers better understand various dynamic behaviors and to
make better decisions by testing different scenarios. The strategy of system dynamics modeling
is to interpret system structure by using Causal Loops and Stocks and Flows over a period of
time (Sterman, 2000).
System dynamics has various applications that include business aspects such as organizational
performance, financial, cost estimation, marketing and supply chain. However, System
Dynamics has been increasingly used in psychology and human factors such as human reliability
in nuclear power plant (Chu, 2006) and safety and risk management (Dulac, 2005). Winch
(2001) studied the challenges in management related to experienced staff.
This chapter described the system thinking method first which originally system dynamics
developed from, and then emphasized the system dynamics applications in many fields focusing
on human performance, human factors and human system integration. In the last part of the

43
chapter then briefly summarized several major system dynamics software in the current system
dynamics simulation community.
3.2 System Thinking and System Dynamics Method
System thinking allows us to see how things interrelate with others (Senge, 2000). System
dynamics modeling was developed from system thinking ideas. It started from the work of Jay
Forrester, who uses it to study the behavior of various components interrelated each other in the
system (Forrester, 1961). A system dynamics model describes the dynamic behavior for a system
regarding a particular problem. Currently this method is widely used to analyze and understand
complex behaviors of systems. In the system thinking, mental models are used by managers and
decision makers. Decision makers use these models in their daily decision making processes.
In system dynamics, mental model addresses our beliefs and describes how a system operates,
behaves, and the time horizon in the model (Sterman, 1994).
3.3 Applications of System Dynamics
3.3.1 Overall Applications
The System dynamics model has many applications in social science and engineering fields.
System dynamics has also been used in modeling business and manufacturing industry behaviors
(Goncalves, 2007). These applications are as diverse as project management (Lyneis and Ford,
2007), Supply Chain Management (Killingsworth et al., 2011;An and Ramachandran, 2005),

44
supply chain in army repair system (Fan et al., 2010), process improvement (Morrison, 2007),
conflict management (Choucri et al., 2005), solid waste forecasting (Dyson and Chang, 2005),
and many Civil engineering applications, such as effects of project personnel changes, rework,
conflict management (Ng et al., 2007), and road maintenance budgeting (Bjornsson et al., 2000).
It has also been used for the U.S. space program (Dulac et al, 2005), mining industry (Cooke,
2003), aviation systems (Hustache et al., 2001), and energy power systems (Kadoya et al., 2005).
In addition, managers use it as a decision making method to focus on measuring project
performance such as target schedule, quality, and progress (Lyneis and Ford, 2007). These
applications seek to find solutions of assuring that projects meet their performance metrics (Ford
and Sterman, 1998).
This chapter emphasizes the system dynamics modeling in system or organizational behaviors,
human performance, and human system integration. The following sections demonstrate these
applications.
3.3.2 Improvement in System or Organization Behavior
System dynamics has also been used in modeling system or organizational behaviors. There are
several examples here which can be listed:
1. System dynamics is widely used in improving organizational performance. Morrison (2007)
used System Dynamics modeling to simulate accumulated experience in order to improve
productivity for an organization. In his paper, a learning curve is simulated for learners who
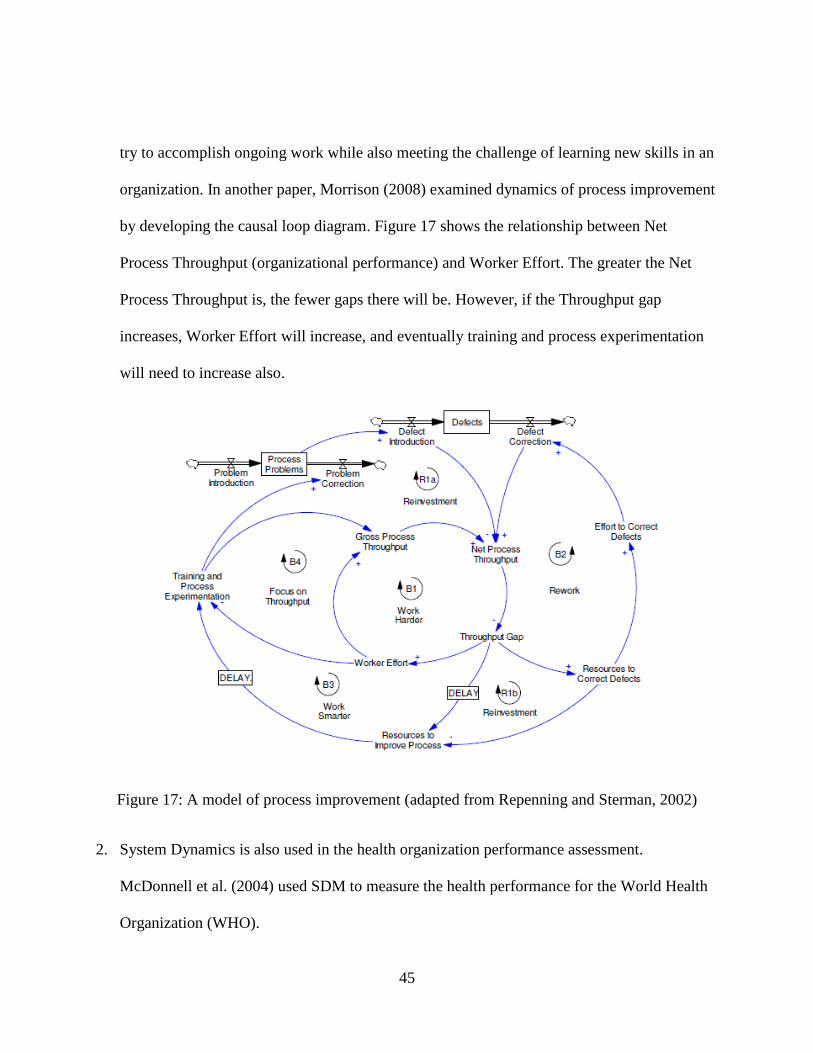
45
try to accomplish ongoing work while also meeting the challenge of learning new skills in an
organization. In another paper, Morrison (2008) examined dynamics of process improvement
by developing the causal loop diagram. Figure 17 shows the relationship between Net
Process Throughput (organizational performance) and Worker Effort. The greater the Net
Process Throughput is, the fewer gaps there will be. However, if the Throughput gap
increases, Worker Effort will increase, and eventually training and process experimentation
will need to increase also.
Figure 17: A model of process improvement (adapted from Repenning and Sterman, 2002)
2. System Dynamics is also used in the health organization performance assessment.
McDonnell et al. (2004) used SDM to measure the health performance for the World Health
Organization (WHO).

46
3. Prasertrungruang and Hadikusumo (2008) used Causal Loops diagrams to build relationship
among the equipment, operators, and system performance. In their paper, system
performance can be measured by productivity, machine availability, reliability and
efficiency. A number of factors influence machine productivity, such as operator schedule
pressure, fatigue, supervision, experience, machine defects and machine reliability. Figure 18
shows the details of the cause and effect of the system performance measurement.
Figure 18: Causal loop of the Machine downtime (adapted from Prasertrungruang and
Hadikusumo, 2008)

47
4. Organizational performance
Figure 19: Organization Performance (adapted from Bajracharya et al., 2000)
Bajracharya et al (2000) described that increased motivation levels and opportunity decrease
apathy and increase job satisfaction. Organization performance can be achieved through effective
training and learning behaviors in the research.
In addition, System Dynamics Modeling is increasingly used is military and defense systems.
The subjects areas include weapon system planning (Fan et al., 2010), military operation

48
planning (Morrison, 2007), and preparedness and training (Coyle et al., 1999; Linard et al., 1998;
McLucas and Linard, 2000).
3.3.3 System Dynamics in Human Performance (Human Reliability)
Modeling human performance and human factors are difficult work to accomplish. In order to
accomplish it, researchers have used different methods to conquer this difficulty. System
Dynamics Modeling is used to measure human performance in many ways, the following
describes the different ways that system dynamics has been used in applications.
1. Human Reliability analysis started during WWII when it was used to increase system
safety and availability analysis in military weapon system development. In Chu’s thesis (2010),
he used System Dynamics modeling to measure human error probability (HEP) and used it as a
human performance measurement linked to Nuclear Power Plants. HEP is studied in the field of
human reliability analysis (HRA) as well as in probabilistic risk analysis (PRA) (Chu, 2010).
Chu studied human actions and how these actions impact system performance and reliability. In
his paper, Chu (2010) listed the factors which have an impact on human performance. Table 5
lists the details of these factors.
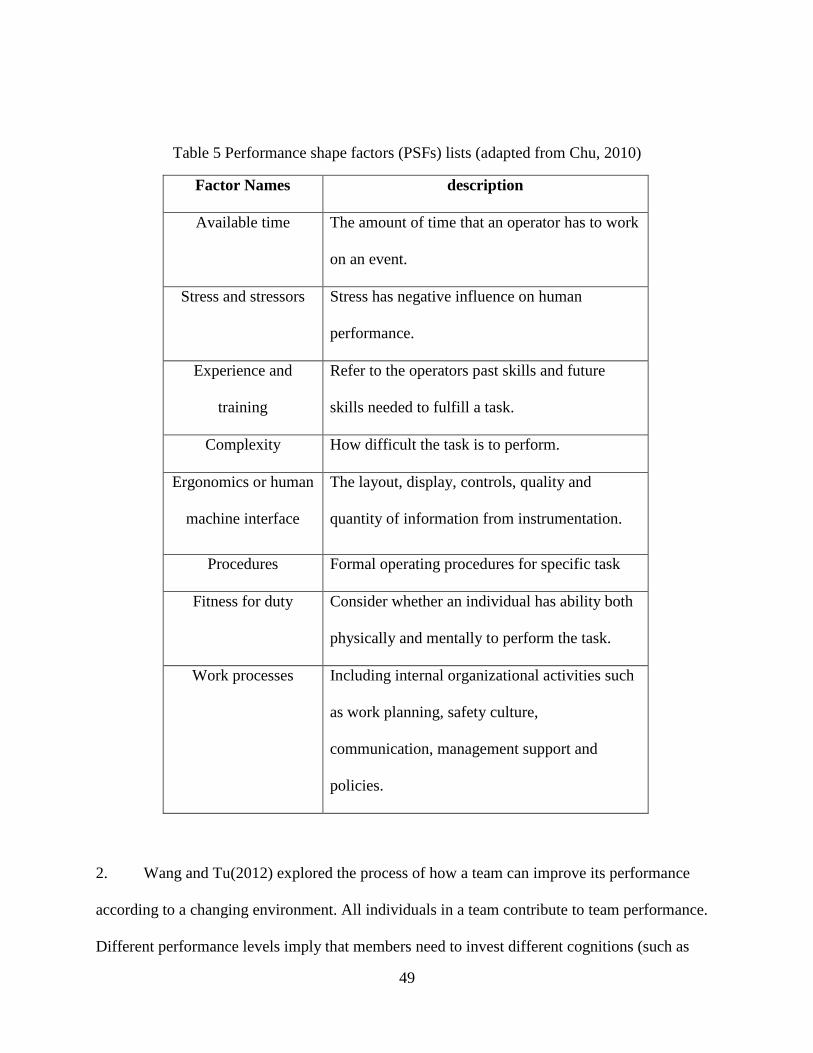
49
Table 5 Performance shape factors (PSFs) lists (adapted from Chu, 2010)
Factor Names description
Available time The amount of time that an operator has to work
on an event.
Stress and stressors Stress has negative influence on human
performance.
Experience and
training
Refer to the operators past skills and future
skills needed to fulfill a task.
Complexity How difficult the task is to perform.
Ergonomics or human
machine interface
The layout, display, controls, quality and
quantity of information from instrumentation.
Procedures Formal operating procedures for specific task
Fitness for duty Consider whether an individual has ability both
physically and mentally to perform the task.
Work processes Including internal organizational activities such
as work planning, safety culture,
communication, management support and
policies.
2. Wang and Tu(2012) explored the process of how a team can improve its performance
according to a changing environment. All individuals in a team contribute to team performance.
Different performance levels imply that members need to invest different cognitions (such as

50
memory, information processing, and attention, etc). High work performance will require the
team to invest more cognitive resources. However, the resources of coginition is equvalent to
increasing the cognitive load . The higher the performance difference, the more cognitive
resources are needed to be invested. Team performance will increase through increasing the
cognitve load. Figure 20 shows the relationship between cognitive load, performance gap and
cognition resource allocation.
Figure 20: Process of Performance Adjustment (adapted from Wang and Tu, 2012)
3. Yu et al. (2004) developed a model of assessing nuclear safety by considering human
factors in a nuclear power plant. Those variables include morale, attitude, training, employees,
and workload. In their paper, they sought to identify organizational factors and measure how
these factors affect human performance.

51
Figure 21: Nuclear Power plant performance loop (adapted from Yu et al., 2004)
3.3.4 System Dynamics in Human Factors
3.3.4.1 Measuring Stress
Human Factors can be described of observing people at workplace. It studies the intersection
between people, technology and work (Woods and Dekker, 2000). Human Factors can also be
described how technology and organizational change transforms work into systems.
Morris, Ross and Ulieru (2010) measure stress levels via Emotional Stability, Perception, Locus
of Control, Coping, Cognitive, and Biological level in their paper. For example, they correlated
stress and emotional stability: as cortisol level increases, anxiety increases, and then emotional

52
stability decreases immediately. Finally cognitive stability decreases along with emotional
stability.
Figure 22: A causal Loop diagram for stress (adapted from Morris, Ross and Ulieru, 2010)
The figure 22 showed the relationship between these factors as they relate to stress. Stress is
measured by the perceived demand and perceived resources according to this paper’s theory. If
perceived demand is higher than perceived resources, the Stress level increases. Otherwise, the
Stress level decreases.
3.3.4.2 Measuring Fatigue and Work Errors
1. Herweg and Pilon (2001) used System Dynamics to measure workforce, work errors and
fatigue. Figure 23 described the details of the cause and effect in a produce design process.

53
Attrition is predominantly the result of fatigue due to increased workloads. As the work-to-do
increases, the workforce required increases. The new-hires who enter into the workforce are
often inexperienced and produce more errors in their work as they learn while doing. The
increased work errors lead to an increase of rework. Finally continued fatigue leads to
attrition and an overall reduction in the workforce.
Figure 23: Attrition Causal Loop (adapted from Herweg and Pilon, 2001)
2. Trost (2002) measured fatigue when workload increases. Increased level of fatigue and
schedule pressure both decrease the output of quality work. Meanwhile, training improves
the worker’s expertise and increases output quality of work. Sterman (2000) clarified that the
fatigue, overtime, schedule pressure and rework loops are traditional system dynamics
process elements. Figure 24 shows the detail of the loops among these factors.

54
Figure 24: Fatigue and workload loop (adapted from Trost, 2002)
3. Johnson et al. (2009) also used System Dynamics modeling to build relationship for quality
and productivity by using workforce morale, workforce experience, and schedule pressure.

55
Figure 25: Construction productivity and quality factors loop (adapted from Johnson et al., 2009)
3.3.5 System Dynamics in Human Resource Management
The Military is always attempting to achieve the goal of having appropriate number of the
qualified personnel at the minimum cost. As the result, the Military has a long history of
workforce planning to achieve this goal.
1. Gu and Chen (2010) used System Dynamics modeling to measure actual capacity level
and number of employees who finished training. The principle of their model was to train
employees in order to meet company specific goals of each mission. Figure 26 showed that

56
training is needed to fill in the capacity gap and measure the number employees who are to be
trained.
Figure 26: Stock and Flow Diagram of Human Resource Management (adapted from Gu and
Chen, 2010)
2. Herweg and Pilon (2001) explored manpower planning in a project. They divided
workers into three types of skill levels including novice, intermediate, and expert. Each phase
within the project lifecycle utilizes a different combination of workers at these three skill levels.
Figure 27 shows the number for these three types of workers can be adjusted by hiring, retiring,
and attrition. Han (1997) also published research on workforce planning. Project managers take
control of allocating project resources, such as manpower, facilitates, and equipment. In order to
accomplish those tasks, they decide who to hire, who to train, and how to motivate employees to
get the maximum effective work week. Figure 28 shows the relevant variables related to the
number of employees in a project.
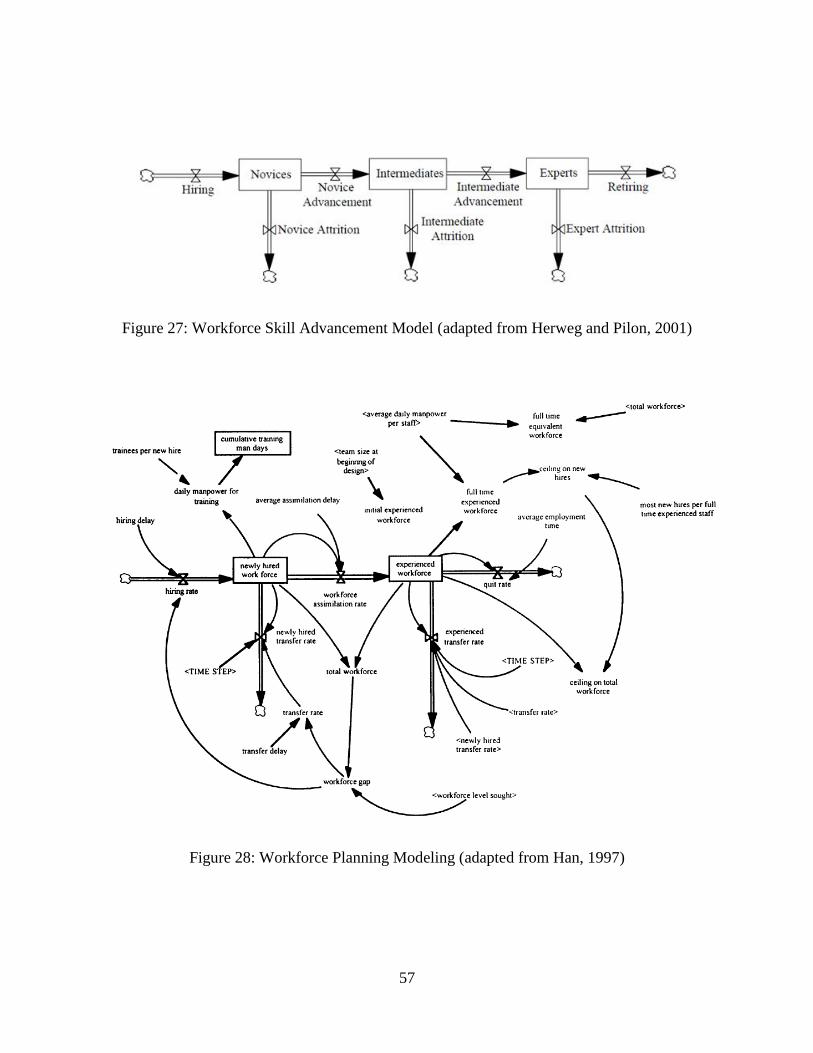
57
Figure 27: Workforce Skill Advancement Model (adapted from Herweg and Pilon, 2001)
Figure 28: Workforce Planning Modeling (adapted from Han, 1997)

58
3. Lyneis and Ford (2001) published a study on project management using system dynamics
modeling. One of the most successful applications is in the field of project management. The aim
of project management is to find the qualified personnel at the minimum cost. Many have
completed research projects in management related to human resources management. Figure 29
illustrates these three managerial actions which include add more people, work more and work
faster in order to meet with the required project schedule. These loops include “Add People”,
“Work More”, and “Work Faster/Slack Off” separately.
Figure 29: Actions of meeting project schedule (adapted from Lyneis and Ford, 2001)
In the same paper, Lyneis and Ford (2001) also illustrated that fatigue occurs when working
overtime and leads to decreased productivity. Overtime has the potential of increasing errors and

59
reducing productivity. The amount of work remaining can be achieved by productivity and
rework. Figure 30 shows the relationships between overtime and human performance factors.
Figure 30: Human Performance with Workforce (adapted from Lyneis and Ford, 2001)
4. Cooper and Lee (2009) also illustrated System Dynamics modeling to aid project
management at Fluor Corporation. Productivity reduction occurs when people become fatigued
from working overtime and new employees who have less experience (Cooper and Lee, 2009).
They measured project performance through project changes, rework, schedule pressure and
workforce planning management. Many aspects of the project management structure affect the

60
productivity and quality as well as the hiring and turnover dynamics that affect the project’s
performance. Figure 31 reflected the perceived process has been considered to be lagging actual
progress due to the rework cycle and the impact of hiring and overtime policies.
Figure 31: Project Dynamics with workforce, productivity, and rework (adapted from Cooper
and Lee, 2009)
5. McCue (1997) accomplished research regarding project management in the shipbuilding
industry. In his thesis, McCue (1997) used the SDM method to better understand the project’s
problems from hiring and firing policy cost estimating and overtime work. Figure 32 reflects the
detail of the important variables which include the available workforce, project labor, planning
work remaining and desired labor.

61
Figure 32: Labor Determination for Shipbuilding Industry (adapted from McCue, 1997)
6. An et al. (2007) published a workforce study by using System Dynamics modeling. One
portion of the model includes a demand side which calculates how many workers the specific
project needs. Another portion of the model includes a supply side which calculates how many
skills in the labor market are needed to support the project. By simplifying workforce planning
into supply chain management, workforce planning can be modeled more straightforwardly.

62
Figure 33: Workforce and Project Management (adapted from An and Ren, 2007)
7. MacInnis (2004) developed a system dynamics modeling for new product development.
Figure 34 depicted more details of his model.

63
Figure 34: Project Staff modeling (adapted from MacInnis, 2004)
8. Yang et al. (2010) developed a SDM for General Electric (GE). Figure 35 provides a
view into the human resource levers operated in the GE. It also shows that factors of increasing
the company’s service quality and profit.

64
Figure 35: Human resource modeling for GE Company (adapted from Yang et al., 2010)
3.3.6 System Dynamics in Human System Integration
System dynamics modeling has the ability to model the performance and process of human
system integration. Many researches have been made by using system dynamics modeling in
human system integration application. The following section showed one example of applying
technology to a new system.
3.3.6.1 Human System Integration application
Technology is a very important variable in a new system. SDM can be used to predict changes in
performance when new technology is applied in systems.
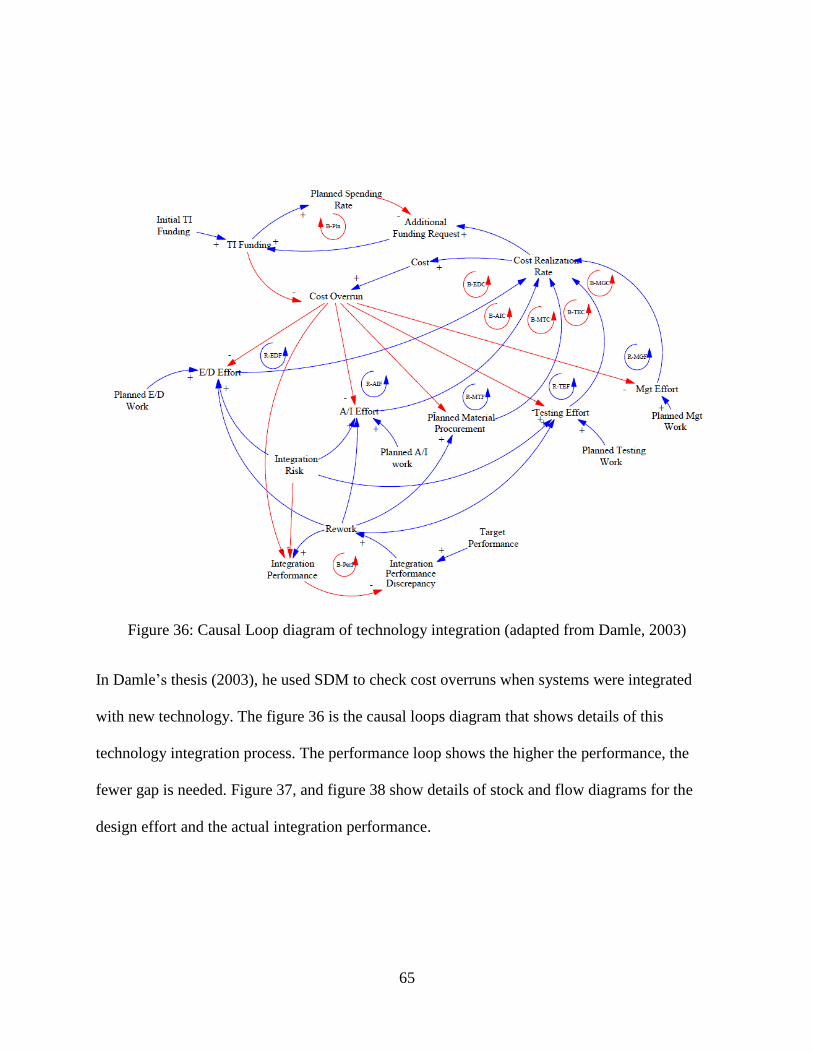
65
Figure 36: Causal Loop diagram of technology integration (adapted from Damle, 2003)
In Damle’s thesis (2003), he used SDM to check cost overruns when systems were integrated
with new technology. The figure 36 is the causal loops diagram that shows details of this
technology integration process. The performance loop shows the higher the performance, the
fewer gap is needed. Figure 37, and figure 38 show details of stock and flow diagrams for the
design effort and the actual integration performance.

66
Figure 37: Engineering and Design Effort Structure (adapted from Damle, 2003)
Figure 38: Performance loop (adapted Damle, 2003)

67
Madachy (1994) used ITHINK System dynamics modeling to complete analysis of manpower
effort and rework relationship effort with cost software project development. He divided
different manpower efforts and rework error effort during a software development process.
Figure 39: Manpower effort simulation (adapted from Madachy, 1994)
3.4 System Dynamics Software
There are four major software programs which have been developed for System Dynamics
models. In addition, AnyLogic also supports applications in SDM. Eberlein’s (2007) summarized
that software as follows:

68
DYNAMO: Dynamic Model was originally developed by Massachusetts Institute of
Technology (MIT). It is considered as the first SDM language.
Powersim (www.powersim.com): It was developed by the Norwegian government in the
mid-1980s. It was also facilitated in interactive games or learning environments.
Vensim (www.vensim.com): It was initiated in the mid-1980s and was commercially
available in 1992. Currently it is widely used in the project development and analysis.
iThink /STELLA (Structural Thinking Experimental Learning Laboratory with
Animation) (www.iseesystems.com): It provided a graphical user interface for
developing the SDM. It also widely used in the System Thinking and project
development.
AnyLogic: It provides supports various simulations such as discrete event simulation,
system dynamics, and agent-based modeling.
Simgua (http://simgua.com): Built to simulate and model complex systems. Simgua
attempts to manage complexity of systems (Simgua website, 2012).
3.5 System Dynamics Modeling Process
Sterman (2000) described SDM processes and steps when dealing with the system dynamics
modeling.
1. Define the problem---it is critical to define the system problem as clearly as possible to
clarify important factors. Various important variables should be identified in this stage. A

69
system dynamics begins to consider a subsystem which is able to provide enough insight
of a larger problem.
Figure 40: Reference mode of human performance
2. Determining the important variables: ---- a reference mode shows how the important
variables are expected to change over time. Figure 40 depicts that the expected behaviors
for human performance. The important variables are the key variables whose
performance the model seeks to improve. These selected variables should capture the
important dynamics of the model while also demonstrating other important inherent
behaviors (Bakkila, 1996).
3. Developing a dynamic hypothesis----- as the figure shows above, the underlying
hypothesis is as more training time is invested, better human performance will be earned.
4. Developing a causal loop diagram---- a causal loop diagram (CLD) is used to map the
cause-effect relationship between different variables within the system. The two variables

70
are linked with an arrow with one of the two states of polarity, positive (+) or negative (-
). For example, as the training time increases, human performance also increases.
Figure 41: Negative Causal Loop: Training Time and Human Performance
5. Testing and validation --- model should be tested for robustness. Extreme conditions need
to apply in the model to robust model behaviors.
Andersen and Richardson (1980) described six steps in SDM process. The “conceptual” steps
include Problem Recognition, System Conceptualization, and Model Representation. The
“technical” steps include Model Behavior, Model Evaluation, and Model Use. They are
described in Figure 42 below:

71
Figure 42: System Dynamics Modeling Steps (adapted from Richardson and Anderson, 1980)
3.6 System Dynamics Model Behaviors
There are three different fundamental behaviors in the SDM. The dynamic behaviors are
generated due to different feedbacks within the system. Exponential growth, goal seeking, and
oscillation are the fundamental behaviors (Sterman, 2000). These are defined below:
Exponential Growth: It is defined as when the change in one quantity within the system causes
a change in the positive direction of the other. This self-reinforcing feedback occurs due to
positive behavior. In other words, a change in the first quantity causes a positive effect that
reinforces the positive effect in the other.

72
Figure 43: Exponential Growth (adapted from Sterman, 2000)
Goal Seeking: It is defined as by a self-balancing loop. When this occurs corrective actions take
place when the discrepancies increase. Goal seeking occurs when the system moves toward the
overall desired state and corrective action is taken toward the goal.
Figure 44: Goal Seeking (adapted from Sterman, 2000)
Oscillation: It is occurred when there is a delay in the negative feedback loop and the system
over shoots the goal and then corrects in the opposite direction. Oscillation is similar to goal
seeking except for the delay and the fact that the system does not reach the goal as quickly. This
is caused by the fact that the negative feedback loop must move the system over and over as each
correction results in overshooting the goal again and again.

73
Figure 45: Oscillation (adapted from Sterman, 2000)
3.7 Conclusion
System Dynamics has been used in many fields since it was developed in the 1950s. It has been
applied in applications such as business performance, organizational performance, financial, cost
reduction, marketing development, and supply chain management. This chapter gave us an
overall review of the System Dynamics modeling application and then focuses on applications
focusing on the System performance, human performance, human factors and human system
integration.
System or organizational performance can be achieved by each worker’s effort within a team.
System performance cannot be separated from operators or workers’ effort and contribution in an
organization. Human performance can be measured by human liability, stress, fatigue, cognitive
load and work load based on the previous research. In addition, this chapter also reviewed
System dynamics modeling applications in human system integration. The fields of human factor

74
engineering, personnel and training are included in human system integration. For many years
human system integration and system dynamics modeling have been used together to understand
the complex processes and changes introduced by new technology in systems.
3.8 Research Gap
Based on two literature reviews, a research gap had been discovered. The following table shows
the detail of the research gap.

75
Table 6 Research gap
Study
Aspect
System/Organization
performance
Human
performance
Stress,
workload
and
Fatigue
Human
Resource
Management
Human System Integration
Technology Manpower
effort
Tradeoffs Training
Morrision ( 2007); Repenning and
Sterman (2002);Prasertrungruang
and Hadikusumo
(2008);Bajracharya et al, (2000)
x
x x
x
Chu, 2010 ;Wang and Tu(2012) ;
Yu et al. (2004) ;
x x
x
x
Woods and Dekker (2000); Morris,
Ross and Ulieru (2010) ; Herweg
and Pilon (2001) ; Trost
(2002) ;Johnson et al., (2009)
x x x
x

76
Study
Aspect
System/Organization
performance
Human
performance
Stress,
workload
and
Fatigue
Human
Resource
Management
Human System Integration
Technology Manpower
effort
Tradeoffs Training
Damle (2003) x
x x
x x
Madachy (1994) x x x
Lizza et al(2008) ; Booher (1997,
2003);Bost and Galdorisi
(2004) ;Scofiled (2006) ;Spindel et
al (2000) ;
x x
x
x
Koopeman and Golding
(1999) ;Osga and Galdorisi (2003);
Correno et al (2010) ;Thie
(2008);Bost and Galdorisi (2004)
x x
x
x

77
Study
Aspect
System/Organization
performance
Human
performance
Stress,
workload
and
Fatigue
Human
Resource
Management
Human System Integration
Technology Manpower
effort
Tradeoffs Training
Scofiled (2006) ;Douangaphaivong
(2004)
x x x x
Booher (2003) x x x x
Simpson (1995) x x x
Jiang (2013) x x x x x x x x

78
CHAPTER FOUR: METHODOLOGY
4.1 Proposed Methodology
Based on the research questions and objectives, a methodology was constructed in order to build
a system dynamics model. The methodology for this particular research was directed by a
System Dynamics Modeling (SDM) approach. Chapter Three summarized SDM applications
which had been used to describe, generate and test a series of hypotheses about the behavior of
complex systems. Major steps in this research processes are as follows:
Step 1: Review the current budget issue of the Navy
Step2: Literature review of manpower cost methods
Step 3: Literature review of System Dynamics Modeling approach in human related factors
Step 4: Define new technology by key terms: as new technologies are introduced to the system,
key variables need to be defined to describe these new technologies. Table 7 defines technology
by these key variables
Step 5: Build causal loop diagrams and discuss with Subject Matter Experts (SME) from the
Navy. In order to generate the dynamics observed in the literature a process is created that
explains how the variables interact. The key causalities come from literatures and recent
publications. The causalities were reviewed by SMEs who understand operations of the naval
combatant ships

79
Step 6: Build Stocks and Flows diagrams to estimate manpower cost associated with new
technology implementation. This process includes sensitivity analysis and What-if analysis for
different cases
Step 7: Compare different technology implementation and evaluate the difference of the
manpower cost associated with different implementation periods
The following figure shows the model architecture by defining major variables.
Figure 46: Major variables for manpower cost estimation

80
4.2 Sector Map
Figure 47: Sector map
There are four sectors in this model. Each sector has different key variables to define the model:
System: includes system capability
Manpower: includes manning skill level and Crew size
Training: includes training cost and training technology
Technology: includes technology implementation and technology complexity
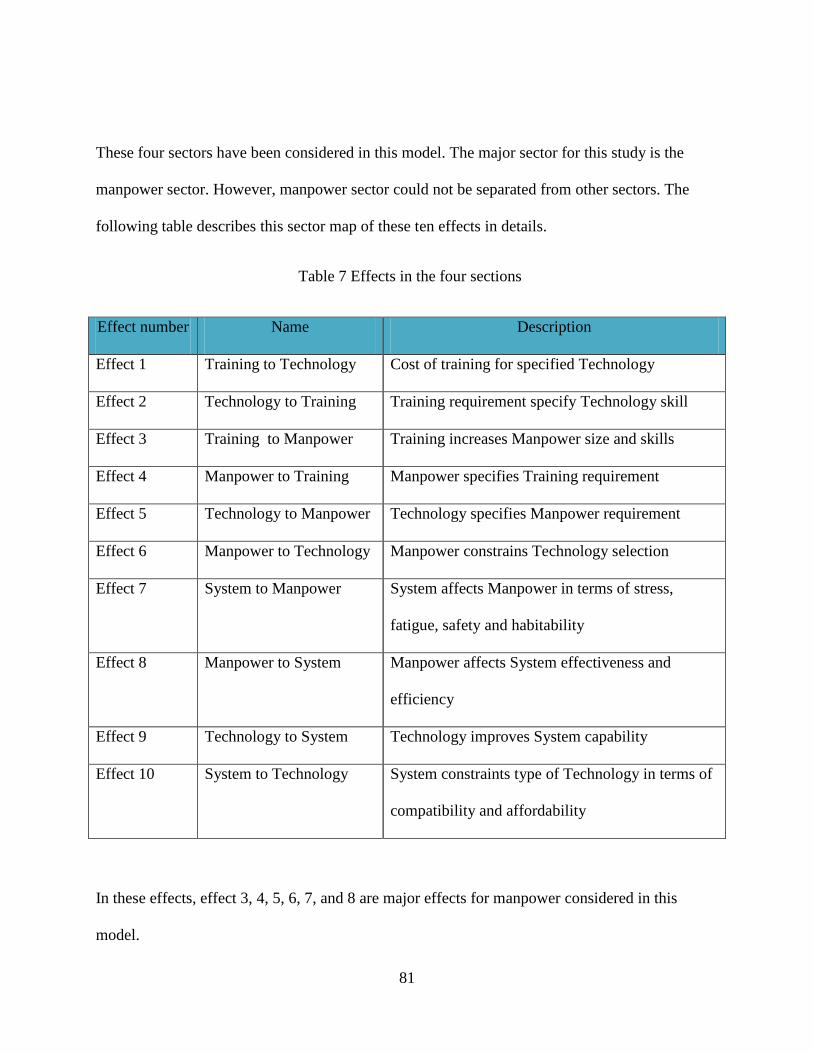
81
These four sectors have been considered in this model. The major sector for this study is the
manpower sector. However, manpower sector could not be separated from other sectors. The
following table describes this sector map of these ten effects in details.
Table 7 Effects in the four sections
Effect number Name Description
Effect 1 Training to Technology Cost of training for specified Technology
Effect 2 Technology to Training Training requirement specify Technology skill
Effect 3 Training to Manpower Training increases Manpower size and skills
Effect 4 Manpower to Training Manpower specifies Training requirement
Effect 5 Technology to Manpower Technology specifies Manpower requirement
Effect 6 Manpower to Technology Manpower constrains Technology selection
Effect 7 System to Manpower System affects Manpower in terms of stress,
fatigue, safety and habitability
Effect 8 Manpower to System Manpower affects System effectiveness and
efficiency
Effect 9 Technology to System Technology improves System capability
Effect 10 System to Technology System constraints type of Technology in terms of
compatibility and affordability
In these effects, effect 3, 4, 5, 6, 7, and 8 are major effects for manpower considered in this
model.

82
4.3 Causal Loop diagram
Building Causal Loop diagrams (CLD) is one of major steps in this research. The goal of
building CLD is to create a comprehensive understanding of how the variables interact with
manpower cost in order to generate the dynamics observed in the literature.
Since this research specifies the trade-off space between manpower and technology
implementation. Figure 48 describes that manpower gap will generate between manpower supply
and manpower demand when implementing new technology. However, training has the ability to
fill this gap. When training is administered to sailors, it helps decrease the gaps required for
manpower skill. The pressure increases for program managers when the training cost is increased
because of the increased training duration. Therefore, choosing efficient training technology is
imperative for program managers. The following figure describes when new technology is
implemented into the system, extra training is needed to fill up the manpower gap.

83
Figure 48: Training for filling up the Manpower requirement gap
4.4 Model structure
The goal of model structure is to illustrate key sections of the SDM. In this model, there are four
sub-systems including manpower, technology, training and system. Each subsystem comprises
various variables, which is constructed to their corresponding relationship in the model.

84
Figure 49: Four sections in the Casual Loop diagram
Figure 49 depicts the CLD in four sections including system, technology, manpower and
training. This diagram was also listed in the Appendix A. Chapter Five describes this diagram in
details.

85
4.5 Defining technology
Since technology is the input for the SDM, it is important to define technology. Technologies
can be defined by the following key variables.
Table 8 Technology Defining by Key Variables
Key Factors Defining
Level of complexity How complex the new technology is
Implementation rate
How often to implement the state-of-
the-art technology
Automation level
The level of automation in the system
Reliability
The ability of technology to
consistently perform its intended
function
Upgradability How easily be upgraded into a system
Lifespan
The period of technology keeps its
functions
Maturity Degree of fully developed
Safety
Condition level unlikely to cause
danger, risk or injury to sailors
Compatibility Capable of performing in harmonious
with other system
Affordability
Able to afford specific type of
technology within the DoN budget

86
In this research, the level of complexity, automation level, and technology implementation rate
were considered in the model. Future study needs to consider the rest of key variables of
technology for modeling process.
4.5.1 New Technology affect Manpower
The Navy continues to implement new technologies for existing and new ship system. Electric
drive technology is a good example of implementing new technology which has the effect on
manpower and ship system.
Electric drive technology has many benefits in reducing cost, noise and maintenance requirement
(Doerry, 2010). This type of technology will open immense opportunities of manpower reduction
and improvement of shipboard life.
4.5.2 Data Source and Model Guidelines
In this research, specific data are needed to test model. The following data base and guidelines
were used in the model processes and model testing.
Department of the Navy Budget Materials
Government Accountability Office (GAO)
The Navy Manpower Analysis Center (NAVMAC)
The Navy Manpower Requirement System (NMRS)
Ship Manpower Document (SMD)

87
Army Manpower Cost System (AMCOS)
The Navy Center for Cost Analysis
Department of Defense instructions and publications
With the data sources and guidelines, model can also be calibrated and validated. Chapter Six
discusses the model testing and validation in details.
4.6 Trade-off Space
Trade-off spaces include manpower and technology implementation, manpower and system
capability, and manpower requirement and training cost. The Stocks and Flows diagrams in
Chapter Five show the details of trade-off analysis between manpower and technology
implementation.
Trade-off space between manpower and system capability is important when considering
manpower impact on system capability. Risk and reliability need to be considered in the system
capability. System performance such as reliability and maintainability also needs to be
considered in the trade-off analysis. Reliability and maintainability are the most significant cost
drivers for operating and supporting the Navy ship system (Clarke, 1990). These factors have
impact on the manpower number and skill levels as well. For example, the system reliability
determines the number of corrective maintenance, so does the number and skills of maintenance
personnel.
The following table contrasts the two issues of system capability (e.g. readiness, reliability) and
manpower cost. Decision makers make their choices by comparing different scenarios.
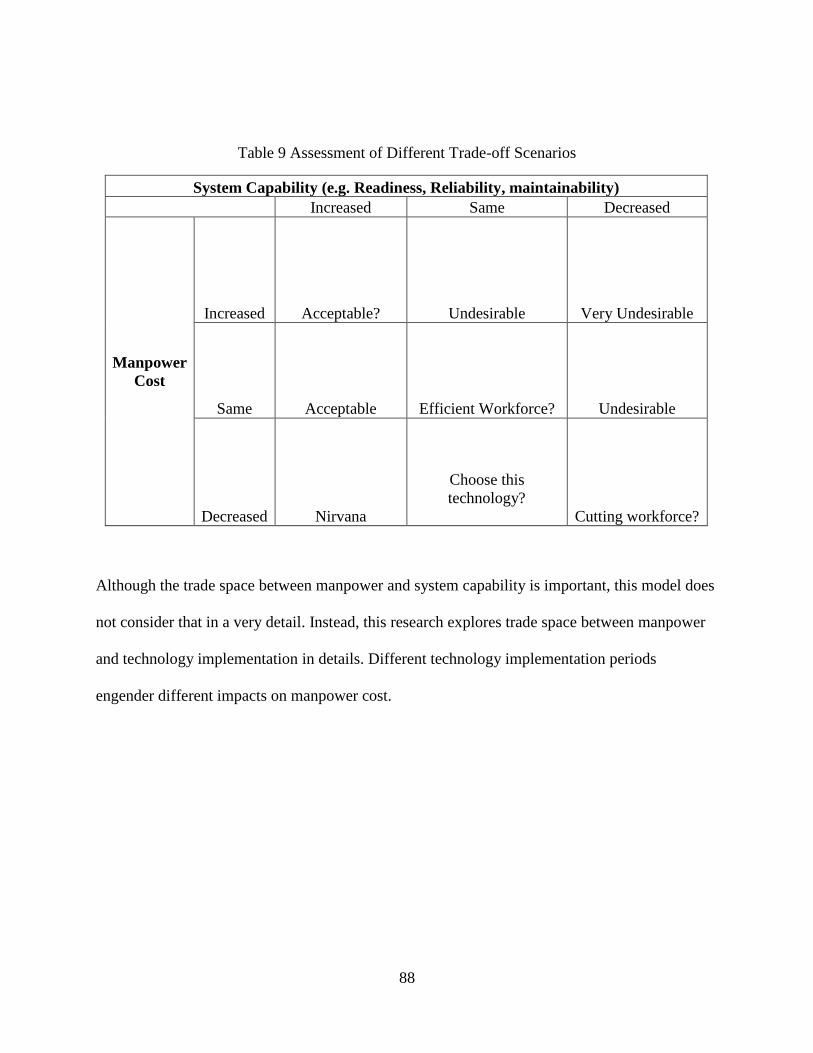
88
Table 9 Assessment of Different Trade-off Scenarios
System Capability (e.g. Readiness, Reliability, maintainability)
Increased Same Decreased
Manpower
Cost
Increased Acceptable? Undesirable Very Undesirable
Same Acceptable Efficient Workforce? Undesirable
Decreased Nirvana
Choose this
technology?
Cutting workforce?
Although the trade space between manpower and system capability is important, this model does
not consider that in a very detail. Instead, this research explores trade space between manpower
and technology implementation in details. Different technology implementation periods
engender different impacts on manpower cost.

89
CHAPTER FIVE: MODEL DEVELOPMENT
According to Sterman (2000), an effective model should follow mainly four steps:
1. Problem Articulation
2. Formulation of Dynamics Behaviors
3. A Simulation Model Formulation
4. Validation
5.1 Problem Articulation
It is important to clarify the purpose of the model. A clear purpose can prevent that modeling
process from moving off track.
As defined in the objectives of this research, the System Dynamic Model (SDM) mainly
captures:
1. Identify major factors which impact the Navy manpower cost within new technology
implementation
2. Facilitate Navy manpower cost to better understand the impact for TOC
3. Provide the necessary information to investigate manpower cost and technology trade-off
analysis
4. Examine different scenarios of HSI major factors (e.g. training, human factors
engineering) effect on manpower cost drivers

90
5.1.1 Purpose of the Model
The purpose of the model can be summarized as follows:
1. To estimate manpower cost and technology tradeoff associated with different technology
implementation
2. To assess crew size and manpower skill levels for a ship system
3. To estimate training cost for different training technologies and numbers of instructors
5.1.2 Assumptions of the model
In order to avoid modeling complexity, the assumptions need to be made.
1. System performance capability increases when implementing new technology.
2. New technology implementation can be substituted for crew. After implementing new
technology in the system, automation level increases in the entire system.
3. Increased manpower cost saving pressure increases the pressure to adopt the state-of-the-
art technology. Decision makers want to decrease manpower cost by adopting more
advanced technologies.
4. The more complex a technology, the higher is the anticipated automation level of the
system.

91
5. The higher the skill level gap of sailors, the higher requirement for training. Increased
training requirement increases numbers of experienced sailors.
6. Increased state-of-the-art training technologies decrease training time.
7. Higher numbers of experienced sailors serving as instructors has a positive effect on
decreasing training time.
8. The model considered the DDG-51 Arleigh Burke Class for its prototype and the base
model parameters were built based on DDG-51 Class public data. For example, there are
300 enlisted sailors currently onboard.
5.1.3 Key Variables
There are several key variables in the model which also describe four sectors mentioned in the
Chapter Four. These variables are defined in the following table.
Table 10 Definitions of Major Variables
Variables Description Unit
Manpower cost
saving pressure
Saving pressure due to the Navy budgeting cut.
Manpower cost is approximately 50 percent of TOC
Dimensionless
Need to Adopt state-
of-the-art Technology
Potential to implement state-of-the-art Technology as
manpower cost saving pressure increases
Dimensionless
State-of-the-art
Technology
Implemented
Advanced level for the state-of-the-art Technology Dimensionless

92
Variables Description Unit
Average skill level
required
Average skill level to operate system under the new
technology
Dimensionless
Actual average skill
level
Actual skill level of the entire manpower Dimensionless
Training Requirement Training needs to involve to improve average skill
level of manpower
Dimensionless
Experienced sailors
serving as Instructors
Numbers of experienced sailors severs as training
instructors
Person
Crew size Numbers of crew in the system Person
Complexity of
technology
How complex of the state-of-the-art technology level
in the system
Dimensionless
Automation Level Level of automation after implemented State-of-the-art
Technology. Range from level 1 to level 4.
Dimensionless
Pressure to adopt
Training technology
Increased training cost causes pressure changing on
adopting new training technology
Dimensionless
Manpower cost Crew size increase manpower cost when other
variables have no change
dollar

93
5.1.4 Reference Modes
Figure 50: Reference Mode
The initial characteristics of the problem can be described by graphs for the modes of behavior
along with changed time. The reference modes have abilities of describing these behaviors. By
looking at the reference mode, stakeholders can get a clear picture format. Since manpower cost
is the one of my major variables in the model, figure 50 depicts the model behavior over a
certain time for the manpower cost estimation.
5.1.5 Time Horizon
The time horizon is an important factor in the model development (Sterman 2000). A suitable time
horizon enables delay structures and other dynamic behaviors in the model. It should not too long or

94
too short. In this model, a 10 years (120 months) time horizon is used since the technology is
upgraded about every 18 months.
5.2 Formulation of Dynamic Behaviors
Formulation of dynamic behaviors is to develop a theory about the defined problem. It
characterizes system behavior over the given time period.
Based on the literature review and model discussion with my committees, the following
hypotheses were identified:
1. Increased implementation of numbers of advanced technologies decreases manpower
cost.
2. Increased implementation of numbers of advanced technologies increases skill level
required.
5.2.1 Mapping System Structure
5.2.1.1 Model Boundary
A model boundary lists key variables and summarizes scope of the model including endogenous
variables and exogenous variables in the model (Sterman, 2000). To illustrate, the following
table shows a model boundary diagram for manpower cost drivers.

95
Table 11 Model Boundary
Endogenous Description Exogenous Description
Skill level Described by novice,
intermediate, expert
levels
Automation Level Different levels of
automation in a ship
system
Crew Size The number of
personnel
accommodations on
the ship (Enlisted) in
terms of a
Head-count.
Training
requirement
Requirement to
improve manpower
skills and to increase
skilled numbers of
personnel
Experienced
sailors
Described by the
number of E5 to E9
Complexity of
Technology to adopt
How complex of a
new technology
Workload Specified by
Intermediate
Maintenance workload
Ship performance
capability
Increased by the new
technology
implemented
Automation level will be determined by the decision makers measuring from level 1(very limited
use of automation) to level 4 (very high use of automation). Optimizing the automation level is
difficult for decision makers. On one hand, the automation would reduce workload and increase
effectiveness for the sailors. On the other hand, higher levels of automation also increase the cost
and risk of a system design.

96
5.2.2 Subsystem Diagram
Figure 51 depicts the detailed subsystem diagram. The purpose of this model is to explore
manpower skill levels and crew size for a ship system. The ultimate goal is to estimate
manpower cost associating with different technology implementation.
Figure 51: Subsystem Diagram
Manpower
Skill levels Crew size
Technology
Implementation
Training
Requirement
Experienced
Sailors Cost

97
5.3 A Simulation Model Formulation
System Dynamics Modeling processes includes two important stages: (1) causal loop diagrams
development and (2) the Stocks and Flows diagrams development. Causal loop diagrams identify
key variables and capture relationship with other variables in the system. Stocks and Flows
diagrams capture the mathematical functions of these variables. The following sections describe
the causal loop and Stocks and Flows diagrams when implementing the state-of-the-art
technology.
5.4 Causal Loop Diagrams
The key relationships in the model are shown in the following table and figures.
5.4.1 Human System Integration (HSI) in the model
According to DoD instruction 5000.02 (US DoD, 2008), HSI is used to minimize TOC and
optimize manpower at the same time. This method takes into consideration human capabilities
and limitations during the phase of system designing. In this model, four parts are considered for
HSI including manpower, personnel, training, and human factor engineering. As mentioned
before, manpower considers the number and mix of personnel to operate and support system.
Personnel focus on the cognitive and physical characteristics that need to operate, maintain, and
sustain different systems. Training provides personnel with required skill, knowledge and ability

98
to meet requirements. Human factors engineering focuses on minimizing manpower but
providing effective training to maintain system performance.
The purpose of HSI in military is to optimize manpower and workload without sacrificing
system performance and system safety (Malone, 2003).
Table 12 Causal Loops Diagrams in details
Loops Name
Section Describe Remark References
B1 Technology
affects System
Capability
Capture
sailors’
skill level
and
numbers.
Manpowe
r cost
Need to Adopt State-of-the-Art
Technology(+)State-of-the-art
Technology Implemented(+)System
Performance Capability(-)System
Performance Gap(+)Need to Adopt
State-of-the-Art Technology
Balancing
loop
Booher &Wiley
(2003);
Bost &
Galdorisi(2004)
;
Carreno,
Galdorisi&
Lemon (2010);
Fleming (1997)
B2 Training
increases Skill
levels
Skill level Gap(+)Training
Requirement(+)Experienced
Sailors(+)Actual average skill
level(-)Skill level Gap
Balancing
loop
Adams &
Rayhawk
(1988);Bajracha
rya,Ogunlana&
Bach (2000);

99
Loops Name
Section Describe Remark References
B3 Automation
level reduces
crew size
Manpower cost saving pressure
(+)Need to Adopt State-of-the-Art
Technology(+)State-of-the-art
Technology
Implemented(+)Complexity of
technology(+)Automation level
(+)Pressure to reduce crew size(-
)Crew Size(+)Manpower
Cost(+)Manpower cost saving
pressure
Balancing
loop
Booher &Wiley
(2003);
Douangaphaivo
ng (2004);
Damle (2003);
Scofield (2006);
Personnel
(2003);
Malone & Bost
(2000);
MANPRINT
Handbook
(2005);
B4 Less training
time decreases
training cost
Training cost (+)Pressure to adopt
Training technology(-)Time to
training all the trainees(+)Training
cost
Balancing
loop
Navy
Manpower
Analysis Center
(2007);
Orlansky &
String (1979);

100
Loops Name
Section Describe Remark References
B5 Training
Efficiency
decreases cost
Training cost(+)Pressure to adopt
Training technology(+)Numbers of
State-of-the-art training technology
Implemented(+)Training
efficiency(-)training cost
Balancing
loop
Simpson
(1995);
Orlansky &
String (1979);
Lockett-
Reynolds &
Duma (2009);
B6 Ashore
support
decreases
workload
onboard
Workload
(Human
factors
Engineer)
Average Maintenance
workload(+)Pressure to transfer
workload ashore(+)Workload
Transferred ashore(-)Maintenance
Workload onboard(+)Average
Maintenance workload
Balancing
loop
Scofield (2006);
Runnerstrom
(2003);
Moore et al.
(2002);
R1 Productivity
increases
maintenance
workload
completion
Maintenance Completion rate(-
)Working overtime(+)Fatigue(-
)Productivity(+)Maintenance
Completion rate
Reinforcin
g loop
Runnerstrom
(2003);
Osga &
Galdorisi
(2003)
Remark: (+) means the two variables between links moving in the same direction, (-) means the
two variables between links moving in the opposite direction.

101
5.5 Model Description
The entire model serves the purpose of developing a model of describing the causes of
problematic behavior and identifying major points. The following section describes seven loops
in details.
B1: Technology affects System Capability
Need to Adopt state-of-the-Art TechnologyState-of-the-art Technology ImplementedSystem
Performance CapabilitySystem Performance GapNeed to Adopt State-of-the-Art
Technology
As Manpower cost saving pressure increases (Exogenous variable in this loop), so does the
Need to Adopt State-of-the-Art Technology. The higher is the Need to Adopt State-of-the-
Art Technology, the higher the number of Technology needs to be implemented. Once more
Technology is implemented in the system, the System Performance Capability will increase.
Higher System Performance Capability decreases the System Performance Gap. The less
System Performance Gap is, the less is the Need to Adopt State-of-the-Art Technology in the
system.

102
Figure 52: B1 Loop
B2: Training increases skill levels
Skill level GapTraining RequirementExperienced SailorsActual average skill level
required Skill level Gap
As more State-of-the-art Technology is implemented in the system, it requires higher Average
skill level for Sailors. The higher Average skill level is required, the higher the Skill level Gap,
which increases Training Requirement. The higher Training Requirement will increase the
number of Experienced Sailors after certain time of delay. Then as more Experienced Sailors

103
are added in the system, the Actual average skill level for the entire Ship system will increase.
The higher Actual average skill level is, the lower the Skill level gap.
Figure 53: B2 loop
B3: Automation level has potentiality to reduce crew size
Manpower cost saving pressure Need to Adopt State-of-the-Art TechnologyState-of-the-art
Technology ImplementedComplexity of technologyAutomation level Pressure to reduce
crew sizeCrew SizeManpower CostManpower cost saving pressure

104
As Manpower cost saving pressure increases, so does the Need to Adopt Technology. The
higher Need to Adopt State-of-the-Art Technology is, the higher numbers of State-of-the-art
Technology be Implemented. Increased Technology Implemented leads to increased
Complexity of technology. Then automation level of system will increase. Higher automation
levels bring more Pressure to reduce crew size. Crew Size will be decreased by decision
makers after certain times of delay. The decreased Crew Size will decrease Manpower cost if
other variables have not caused any changes. Once Manpower cost decreases, Manpower cost
saving pressure decreases too.
Figure 54: B3 loop

105
B4: Experienced Sailors reduced training time
Training costPressure to reduce training timeExperienced Sailors serving as
InstructorsTime DurationTraining cost
As training cost increases, the Pressure to reduce training time increases also. The higher
Pressure to reduce training time is, the less Time to training all personnel. The less time for
training, the less is the Training cost.
B5: Training technologies decreases training cost
Training costPressure to adopt Training technologyNumbers of State-of-the-art training
technology ImplementedTraining Durationtraining cost
As training cost increases, the Pressure to adopt Training technology increases also. The
higher pressure to adopt Training technology, the more training technology is implemented.
The more training technology Implemented decreases the Training time. Decreased training
time decreases the training cost.

106
Figure 55: B4 and B5 loops
R1: Productivity increases Maintenance Workload Completion
The higher Maintenance Completion rate decreases opportunities for Working overtime,
leading to less Fatigue. Lower Fatigue brings higher Productivity. Higher Productivity will
increase Maintenance Completion rate.
B6: Ashore Support decreases Workload Onboard
Average Maintenance workloadPressure to transfer workload ashoreWorkload Transferred
ashoreMaintenance Workload onboardAverage Maintenance workload
As Average Maintenance Workload increases, higher Pressure to transfer workload ashore
in order to decrease onboard workload burdens. The more Pressure to transfer workload

107
ashore is, the more is the Workload Transferred to ashore. The more workload is transferred,
the less is the overall Maintenance Workload onboard. Eventually the Average Maintenance
workload will decrease under the same numbers of crew size.
Figure 56: R1 and B6 loops

108
5.6 Stocks and Flows
Figure 57: Base model sections

109
Figure 57 presents the Stocks and Flows diagram which includes four sections: system
capability, technology implementation, skill levels and manpower cost. The key equations in the
based model are discussed later.
5.6.1 Model setting for Base Model
The base model parameters are shown in Table 13.
Table 13 Model Parameters value (source: Data modified from Navy Manpower Analysis Center
and DDG-51)
Variables Values
Initial Crew size 300 people
Experienced sailors (E5 to E7) 100 people
Initial E2 to E4 190 people
Initial E8 and E9 10 people
Time to Promotion 1 48 months
Time to Promotion 2 120 months
The base model specifies initial parameter values for different crew’s skill levels. There are a
total of 300 crew members at the beginning of the model which include 190 Enlisted level 2 to
level 4, 100 Enlisted level 5 to level 7, and 10 Enlisted level 8 and level 9. The initial crew
numbers are derived from crew members in the DDG-51 Arleigh Burke Class. Time to
promotion from the novice to the intermediate is 48 months and Time to promotion from the

110
intermediate to the expert is 120 month. These data were modified from the Navy document data
about years of experience for enlisted personnel.
The table 14 shows years of experience for Navy enlisted personnel. For example, normally it
takes 4 years to 8 years to become an E-5 and take more than 15 years to become an E-9.
Table 14 Enlisted years of experience (data source: Williamson, 1999)
Rank/Paygrades Year of Experience
E-1 1 year
E-2 1-3 year
E-3 2-4 year
E-4 3-7 year
E-5 4-8 year
E-6 8-20 year
E-7 12-20 year
E-8 >15 year
E-9 >15 year
Based on the information from this table above, the model initial settings for the promotion time
are 4 years and 10 years for novice to intermediate and intermediate to expert respectively.

111
5.6.2 Technology Implementation
The base model shows a reference situation of the historical behavior from 2003 to 2012.
Technology insertion such as the Smart Ship program is able to achieve in reducing manning
and maintain ship capability. Currently, the Navy continually implements a significant number of
new technologies into ship systems. For example, DDG-1000 implements advanced technologies
for reduced detectability, an integrated propulsion system, and automation technologies enabling
a reduced-sized crew (O’Rourke, 2009). These technologies enable the ship system to operate in
an advanced platform.
Figure 58: Stock and Flow of Technology Implementation
Figure 58 exhibits ship performance capability is impacted by numbers of technology
implementation. The mathematic equation is listed in the following page.

112
Figure 59: Numbers of technology implemented
From the opinion of the Subject Matter Expert (SME), the Navy implements new technologies
every 18 month. Therefore, the base model used 18 month as the implementation rate of a new
technology.
(2)
∫
(3)
TI: Technology Implementation

113
The figure 59 describes that every 18 months a new technology is implemented. Therefore, the
number of technologies increases every 18 months. The number of technologies jumped to 7
after 10 years. Here the model made assumptions that there is only one new technology
implemented in the system at the beginning of model running.
5.6.3 System Capacity
(4)
∫
(5)
SPC: Ship performance capability
Ship performance capability changes from 1 to 10. The model assigned 1 is the lowest number
and 10 is the highest number for ship capability.

114
Figure 60: Ship Performance capability
Formula 4 and 5 showed that ship capability is determined by ship capability performance gap,
new technology implemented, and the effect of the number of technologies implemented. Ship
capability performance gap is one of factors determining ship performance capability. In
addition, as more advanced technology is implemented into the system, ship performance
capability increases. The model assumes that ship capability will improve when more and more
technologies are implemented in the system.

115
5.6.4 Paygrade and Skill levels
5.6.4.1 Paygrade
The Navy manpower requirement system calculates different paygrade numbers by using
staffing table. Figure 61 describes the paygrade matrix. For example, E-5 is the only one person
assigned to the billet if only one personnel is needed. If more personnel are needed, E-3 to E-6
will be assigned to the billet. E-1 is given to a new high school graduate recruited. The
subsequent trainings will be provided either by the Navy or by a civilian institution to enable
sailors move up to the higher levels.
Figure 61: Paygrade Matrix (source: Data adapted from Navy Manpower Analysis Center, 2007)

116
Figure 62: Stock and flow diagram of paygrade levels
Figure 62 showed three major categories of enlisted paygrade levels in the model.
5.6.4.2 Skill levels
Paygrades E1 to E9 reflect levels of training, experience, knowledge, skill, and responsibility.
According to the Navy Budget documents, Pay and allowance of Enlisted include different pay
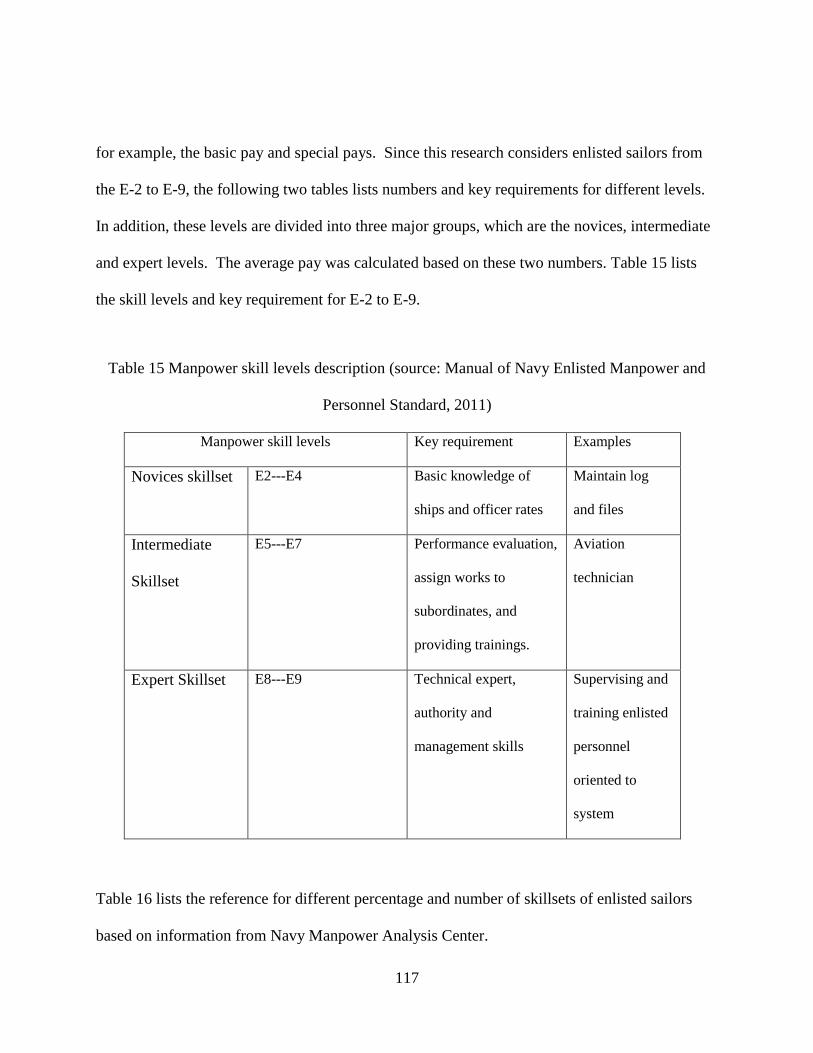
117
for example, the basic pay and special pays. Since this research considers enlisted sailors from
the E-2 to E-9, the following two tables lists numbers and key requirements for different levels.
In addition, these levels are divided into three major groups, which are the novices, intermediate
and expert levels. The average pay was calculated based on these two numbers. Table 15 lists
the skill levels and key requirement for E-2 to E-9.
Table 15 Manpower skill levels description (source: Manual of Navy Enlisted Manpower and
Personnel Standard, 2011)
Manpower skill levels Key requirement Examples
Novices skillset E2---E4 Basic knowledge of
ships and officer rates
Maintain log
and files
Intermediate
Skillset
E5---E7 Performance evaluation,
assign works to
subordinates, and
providing trainings.
Aviation
technician
Expert Skillset E8---E9 Technical expert,
authority and
management skills
Supervising and
training enlisted
personnel
oriented to
system
Table 16 lists the reference for different percentage and number of skillsets of enlisted sailors
based on information from Navy Manpower Analysis Center.

118
Table 16 Numbers of Skillsets (source: Data adapted from Navy Manpower Analysis Center,
2007)
E-1 E-2 E-3 E-4 E-5 E-6 E-7 E-8&E-9 Total
Percentage 1% 25% 7% 31% 16% 11% 7% 2% 100%
300 sailors 3 75 21 93 48 33 21 6 300
Number
by skill
levels
3 189(63%) 102(34%) 6(2%)
Based on the table above, calculations can be completed for different paygrade levels. The E2 to
E4 is 189, E5 to E7 is 102 and E8 to E9 is 6. The calculation is based on 300 onboard for the
DDG-51 class. Therefore, the model settings of initial numbers are round up from the numbers
of the table above.
Furthermore, crew cost data are needed to acquire in order to do model testing. The public data
from DoN Budget estimate do not provide that type of data. The following table shows details of
paygrade for 300 enlisted sailors from 2003 to 2012.

119
Table 17 Paygrade for 300 Enlisted Personnel (source: Data adapted from DoN Budget estimate
2003-2012)
(1)
(2) (3) (4) (5)
DoN data (in
thousands)
Enlisted
personnel
Average pay per
year per sailor ($)
According to
300 crews
300 crew cost
per month($/12)
2003 16,035,569 320457 50039.69019 15,011,907 1,250,992
2004 15,937,469 312249 51040.89685 15,312,269 1,276,022
2005 16,777,226 302820 55403.29569 16,620,989 1,385,082
2006 14,965,766 289450 51704.14925 15,511,245 1,292,604
2007 15,019,960 278193 53991.15003 16,197,345 1,349,779
2008 15,418,559 275963 55871.83427 16,761,550 1,396,796
2009 16,807,552 273448 61465.25848 18,439,578 1,536,631
2010 17,165,910 270715 63409.52662 19,022,858 1,585,238
2011 17,559,370 265187 66215.04825 19,864,514 1,655,376
2012 17,696,433 259876 68095.68025 20,428,704 1,702,392
In this table, column (1), (2), and (3) are the data from the DoN website. Column (4) was
calculated based on the 300 crew members on the DDG-51 onboard. Column (5) is a monthly
data calculated from the column (4).
5.6.5 Crew Size
The goal of manpower requirements is to determine the minimal crew size but meanwhile to
maintain a desired system capability (Navy Manpower Analysis Center, 2001).
In this model, the equation of crew size is as follows:

120
(6)
The equation expressed the effort of minimizing the number of crew size onboard to decrease
manpower cost. As we know, the higher automation levels require less crew size. The equation
attempted to express the effect of different levels of automation for reducing the number of crew
sizes. Automation levels improve when implementing new technology. This equation could
provide decision makers the information for frequency to implement new technologies.
5.6.6 Manpower cost
Figure 63: Manpower cost architecture (scope)
Figure 63 displays manpower model’s scope specified by skill level, number, and paygrade.
Manpower cost architecture describes components of manpower cost. Manpower cost includes
cost for officers and enlisted personnel. Skill level and number of personnel are embedded into

121
the cost of officers and enlisted personnel. Officers and enlisted personnel also have different
paygrade levels.
Although manpower cost components include compensations for both Officers and Enlisted,
officer compensation is only approximately 17% of the manpower cost of a ship system. Enlisted
manpower cost accounts for 83% of the cost. This research used enlisted skill levels to estimate
manpower cost. Future study needs to involve Officers’ cost in the model.
Based on the information from the Navy, three major categories are identified for formulations
of this model. There are three skill levels for different skillsets including novices, intermediates,
and experts. Novices have the basic knowledge of the ship and report to their supervisors.
Intermediates provide training, evaluate their subordinates and assign works to them. Experts
have more responsibilities for supervising and training enlisted personnel.
Ting (1993) built a mathematical relationship for the Navy manpower operation and support
system based on the data of 652 ships. He grouped 652 ships into 11 groups and calculated the
average annual pay of both officers and enlistees. He assigned manpower as the dependent
variable, the number of officers (OFFNAVY) and enlistees (ENLNAVY) were the independent
variables for each ship.
Based on Ting’s model, manpower cost can be expressed by the following equations:
(7)

122
Compensation for different paygrade includes basic pay, allowance, entitlement, bonus, and
Retirement items. The following equations express the relationship of paygrade for officers and
enlisted personnel.
Officer
(8)
Enlisted
(9)
In this research, only the enlisted sailors were considered in the model. Therefore, the equation
for the manpower is revised as follows:
(10)
(11)
The data for the enlisted personnel can be acquired from the DoN Budget materials website. The
website includes data for personnel, operation& maintenance, construction, procurement, R&D
and overseas operations.
From the data acquired from the website, the average number of personnel Enlisted per ship had
been steadily decreasing. Figure 64 shows the behavior of enlisted personnel. Advanced

123
technologies will require not more sailors but more skilled sailors. In recent years, the Navy hires
higher grade levels of sailors to maintain high productivity.
Figure 64: DoN Data of Enlisted personnel from 2003 to 2013 (source: Data adapted from DoN
Budget Estimates)
Figure 65 depicts the diagram for manpower cost and crew size. As automation level increases, it
decreases crew size in the system. The varying of manpower cost depends on crew size and
average pay for enlisted personnel.
(12)
Equation 12 also specified the relationship for manpower cost. It changes along with changing
crew size and changing the average pay for enlisted personnel.
0
50000
100000
150000
200000
250000
300000
350000
2003 2004 2005 2006 2007 2008 2009 2010 2011 2012

124
Figure 65: Stock and flow diagram of the Manpower cost and Crew size

125
5.6.7 Training cost
Figure 66: Stock and Flow diagram for Training Cost
5.6.7.1 Factors affecting training cost
In the training cost model, training requirements and training duration are two factors that have
impacts on training cost. Training requirements increase in conjunction with increased skill level
gaps. Increased training duration also increases training cost. However, more training
technologies such as simulation can reduce training time, eventually decrease training cost. In
addition, more experienced sailors serving as instructors also decreases training duration. The
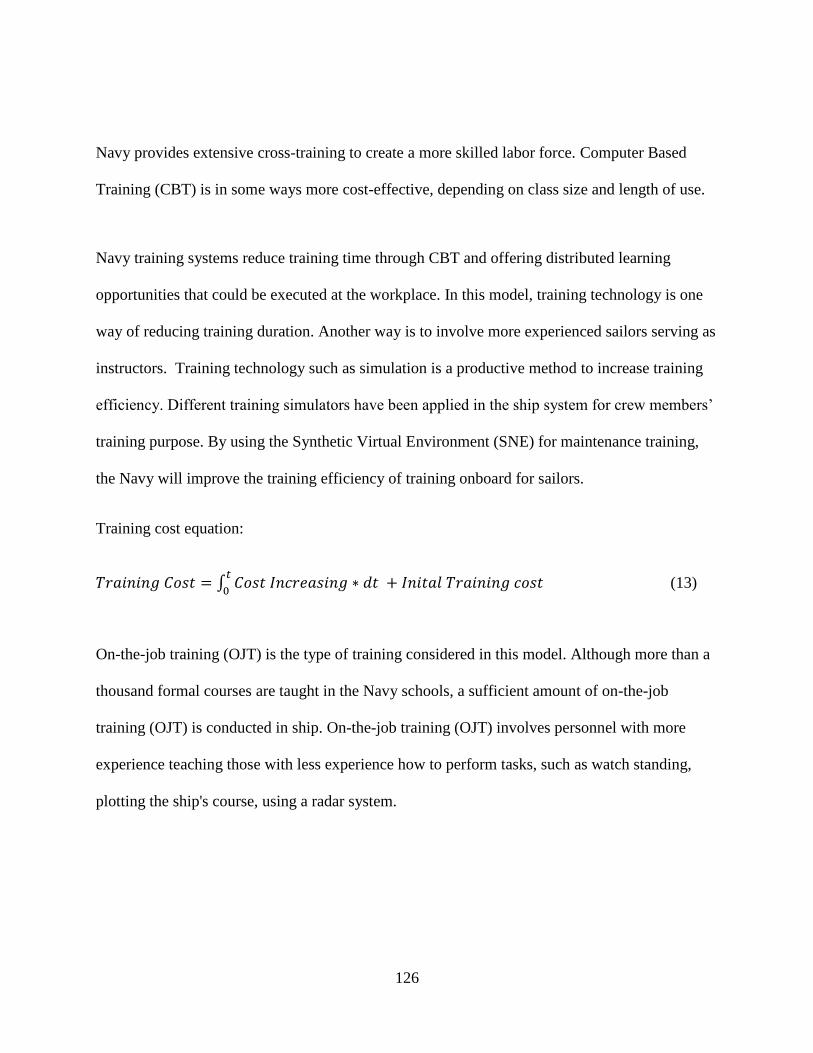
126
Navy provides extensive cross-training to create a more skilled labor force. Computer Based
Training (CBT) is in some ways more cost-effective, depending on class size and length of use.
Navy training systems reduce training time through CBT and offering distributed learning
opportunities that could be executed at the workplace. In this model, training technology is one
way of reducing training duration. Another way is to involve more experienced sailors serving as
instructors. Training technology such as simulation is a productive method to increase training
efficiency. Different training simulators have been applied in the ship system for crew members’
training purpose. By using the Synthetic Virtual Environment (SNE) for maintenance training,
the Navy will improve the training efficiency of training onboard for sailors.
Training cost equation:
∫
(13)
On-the-job training (OJT) is the type of training considered in this model. Although more than a
thousand formal courses are taught in the Navy schools, a sufficient amount of on-the-job
training (OJT) is conducted in ship. On-the-job training (OJT) involves personnel with more
experience teaching those with less experience how to perform tasks, such as watch standing,
plotting the ship's course, using a radar system.

127
5.6.7.2 Ship Operational Support and Training data
Training elements of DoN Budget reports from FYs 2003 to 2012 were analyzed to determine
the amount of money spent on training each year through these years. Ship Operational Support
and Training data were used in this model development process.
According to the Navy, Ship Operational Support and Training provides factors necessary to
ensure that ships and their crews operate at high levels of readiness. Surface support is one
example of Ship Operational Support and Training.
Table 18 Operation and Support training data (source: Data adapted from DoN Budget Estimates)
Data 2003 2004 2005 2006 2007 2008 2009 2010 2011 2012
DoN data
(in
thousands) 634,02
8
641,47
0
616,5
49
620,76
2
631,93
6
709,48
0
683,20
3
709,38
7
810,20
5
736,51
2
Number of
ships 297 292 282 281 278 282 285 288 285 283
Annually
Average($) 2,134,7
74
2,196,
815
2,186,
344
2,209,1
17
2,273,1
51
2,515,
887
2,397,
204
2,463,1
49
2,842,
825
2,602,5
16
Monthly
Average($) 177,89
8
183,06
8
182,1
95
184,09
3
189,42
9
209,65
7
199,76
7
205,26
2
236,90
2
216,87
6
Table 18 showed data from DoN Budget Estimates for Operations and Maintenance (O&M)
reports from FYs 2003 to 2012. The data from Ship Operation and support training was used in
the model for estimating training cost and testing the model. Figure 67 showed the monthly
average numbers of the training cost for each ship. These data were calculated from annually
DoN Data.

128
Figure 67: DoN Data of monthly training cost (source: DoN Budget Estimates, 2003-2012)
All budget reports included 3 years of budget data. For instance, the FY2005 report included
budget data for FYs 2003, 2004, and 2005. The numbers contained in the report represent the
Total Obligation Authority (TOA) for the given FY in the last year it was reported.
5.6.8 Maintenance workload
It is important to clarify workload categories in order to understand manpower requirements for
the Navy. Manpower requirements are determined by different workloads and should be
calculated to accomplish mission readiness at the minimum levels.
In this model, maintenance workload is considered since it is one factors of defining manpower
requirements. Currently it is not possible to obtain maintenance workload data from a public
0
50,000
100,000
150,000
200,000
250,000
2003 2004 2005 2006 2007 2008 2009 2010 2011 2012

129
domain for a specific type of a ship system. However, it is necessary to check the logic and do
mathematical analysis for maintenance workload for the future study.
Figure 68: Stock and Flow diagram for Maintenance Workload
Figure 68 presents the logic for maintenance workload transferring. One way to reduce
maintenance workload onboard is to transfer onboard maintenance workload to ashore.
Workload transferring sought to reduce the workload onboard. The ultimate goal is to reduce the
average maintenance workload onboard and improve habitability for crew members.
Transferring workload to ashore enables crew members’ habitability and reduces fatigue level.
The following equations are used to assess the dynamic behavior of maintenance workload
onboard and ashore in the model.
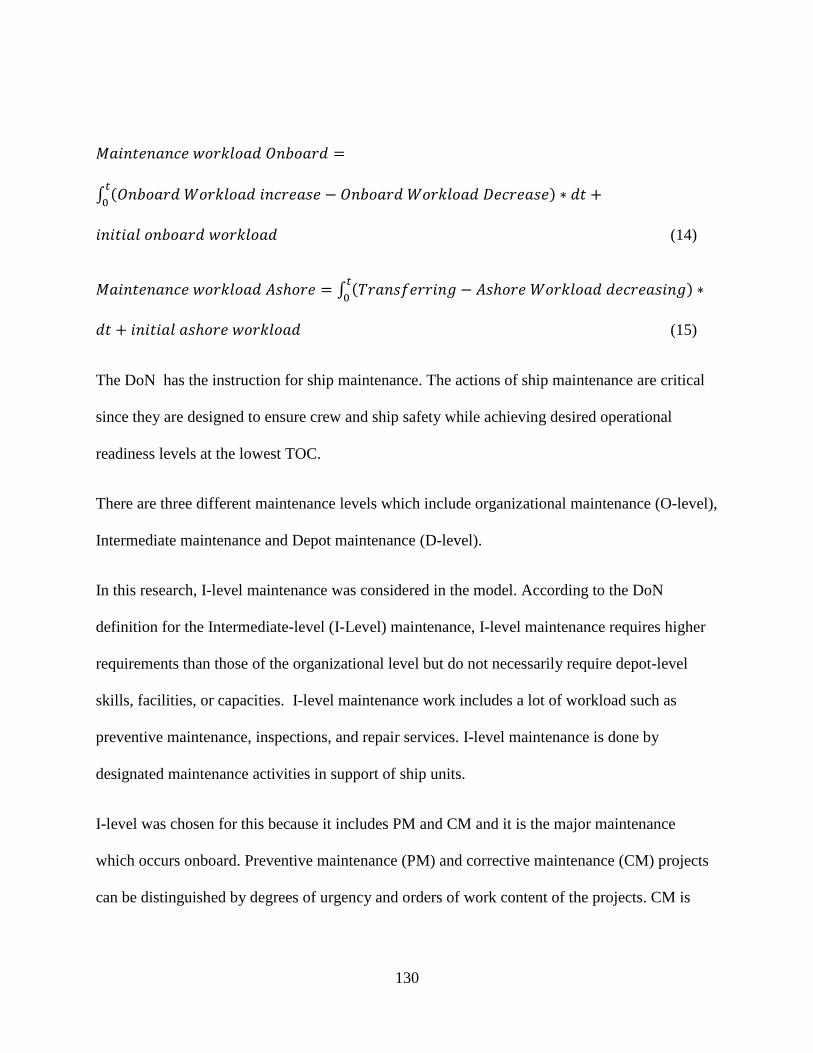
130
∫
(14)
∫
(15)
The DoN has the instruction for ship maintenance. The actions of ship maintenance are critical
since they are designed to ensure crew and ship safety while achieving desired operational
readiness levels at the lowest TOC.
There are three different maintenance levels which include organizational maintenance (O-level),
Intermediate maintenance and Depot maintenance (D-level).
In this research, I-level maintenance was considered in the model. According to the DoN
definition for the Intermediate-level (I-Level) maintenance, I-level maintenance requires higher
requirements than those of the organizational level but do not necessarily require depot-level
skills, facilities, or capacities. I-level maintenance work includes a lot of workload such as
preventive maintenance, inspections, and repair services. I-level maintenance is done by
designated maintenance activities in support of ship units.
I-level was chosen for this because it includes PM and CM and it is the major maintenance
which occurs onboard. Preventive maintenance (PM) and corrective maintenance (CM) projects
can be distinguished by degrees of urgency and orders of work content of the projects. CM is

131
assigned to crew members once a system fails (Keizers et al., 2003). In addition, CM has
absolute priority over PM, which can seriously interrupt any process of the PM projects.

132
CHAPTER SIX: RESULTS, TESTING OF MODELS
The model is validated by two types of data. One is manpower cost and another one is Operation
and Support training cost. The data was acquired from the public domains of the Department of
the Navy (DoN).
The simulation confirmed the prior theory and initial hypothesis, which increased implementing
of the numbers of the state-of-the-art technologies decreases manpower cost.
6.1 Simulation Run and Results
6.1.1 Manpower cost
The input of the simulation is the technology implementation. The output variables include crew
size, manpower cost, and training cost. These match with the objectives of this research. Figure
69 exhibits the behavior of manpower cost for a ship system in the next ten year. The model was
validated by the average annual data for a ship system. In addition, manpower cost showed here
is the average monthly data after calculation.

133
Figure 69: Model running for the next ten year from 2013
Figure 69 and table 19 describes the forecasting data for the next ten years. Manpower cost will
increase in the first three years and then drop in the next few years. Eventually it will steadily
increase for the rest of years.
Table 19 Monthly average manpower cost forecasting (model result)
2013 2014 2015 2016 2017 2018 2019 2020 2021 2022
1773723 1824635 1863162 1735348 1676874 1711758 1818558 1885529 1952387 1971439
Table 20 describes comparison between the DoN Data and model running result.

134
Table 20 Manpower cost between DoN and modeling running result
2003 2004 2005 2006 2007 2008 2009 2010 2011 2012
DoN data
1,250,992
1,276,022
1,385,082
1,292,604
1,349,779
1,396,796
1,536,631
1,585,238
1,655,376
1,702,392
Modeling Running
1,234,597
1,298,914
1,340,478
1,253,419
1,284,227
1,383,246
1,517,347
1,603,318
1,691,382
1,723,127
Figure 70: Manpower cost calibration and forecasting
Figure 70 exhibited the model validation by using historical data and model forecasting of the
next ten years. Manpower cost increases steadily in the next ten years. It increases 14 percent in
comparison to the data of 2012. The historical timeframe was selected for model testing from
2003 to 2012. The figure showed the average monthly manpower cost.
0
500000
1000000
1500000
2000000
2500000
2003 2004 2005 2006 2007 2008 2009 2010 2011 2012 2013 2014 2015 2016 2017 2018 2019 2020 2021 2022
Average Monthly Manpower Cost
Model result Historical Data

135
6.1.2 Training Cost
Figure 71 describes the model validation by using historical data and model forecasting for the
training cost. In the next ten years, training cost increases steadily. It will increase 6.5 percent
compared to the data of 2012.
Figure 71: Monthly training cost calibration and forecasting
Table 21 lists the model result for the next ten years starting from 2013 to 2022. Onboard
training cost will steadily increase 6.5 percent in 2022 compared with the number in 2013.
Table 21 Monthly training cost forecasting
2013 2014 2015 2016 2017 2018 2019 2020 2021 2022
$216,12
7
$216,51
0
$217,19
3
$218,24
9
$219,64
4
$221,34
5
$223,32
0
$225,54
3
$228,01
6
$230,75
8
0
50,000
100,000
150,000
200,000
250,000
Monthly Training Cost
DoN Model Running

136
6.1.3 Maintenance Workload
The maintenance workload sub-model is used to check the logic and do mathematic analysis for
maintenance workload for the future study. Figure 72 showed the result of maintenance
workload onboard. In the first seven years, onboard maintenance workload increases evenly, and
then it increases steeply for the following three years.
Figure 72: Maintenance workload onboard

137
Figure 73: Maintenance workload ashore
Figure 73 described the result of workload transferred to ashore. In the first four years, workload
transferred more and then reached to the limit in the rest of model running years. The model
assumed that 225 man-hours is the maximum workload which maintenance can handle in the
shore.
6.2 Sensitivity analysis
This analysis is used to robust model behaviors. By changing the input value of the model, a
sensitivity analysis is carried out. The following figure exhibits three scenarios for different
technology implementation rates, which are 0, every 18 months and every 26 months.

138
Figure 74: Automation levels of three scenarios
Figure 74 showed these three scenarios when technology implementation is 0, 18 month and 26
months. Automation level is at the lowest level when no technology implements. However,
automation level is at the highest when implementing technology every 18 month. Automation
level has a range from 1 to 4.
Figure 75 showed these three scenarios when technology implementation is 0, 18 month and 26
months. Manpower cost is at the highest level when no technology implements. This makes
sense because the automation level is very low when no technology is implemented. As we
know, more personnel are needed when automation is lower. Automation is the replacement of
manpower in some way. The model told us that manpower cost is the lowest when implementing
technology every 18 months.

139
Figure 75: Manpower cost of three scenarios
Figure 76: Training cost of three scenarios

140
Figure 76 showed these three scenarios when technology implementation is 0, 18 month and 26
months. It is observed that training cost is the lowest when no technology implements. This also
makes sense because training requirements are very low when no new technology is
implemented. Nevertheless, training cost does not change much when technology implements
periods are 18 month and 26 months.
6.3 Model Testing
6.3.1 Causal loop logic testing
Logic testing started consulting with the Navy SME and experienced modeler. The details of the
causal loop diagram are listed in Appendix A.
6.3.2 Integration Error test
This test is to evaluate the software’s ability for consistent results for different time steps. The
simulation results should not make any change for the different time steps. The following figure
shows that there is not much difference when changing time steps in the model. Therefore, the
model has no integration errors.

141
Figure 77: Simulation results for Different Time Steps
Figure 77 showed that the result when changing time steps from 1 to 0.5. As the result, the model
has no integration errors.
6.3.3 Extreme condition test
It is necessary to robust the model by testing the model in extreme conditions. The following
figure showed the Ship performance capability results with and without technology
implementation. This figure reflects that ship capability increases very little without any
technology implemented. This result coops with the logic of the real world.

142
Figure 78: Extreme condition test for ship performance capability
Figure 79: Extreme condition test for Crew size

143
Crew size will not change without implementing any new technology. However, crew size
decreases as more technologies are implemented. Crew size does not change if no technology is
implemented in the system. This copes with the real logic. The model result was showed in the
figure 79.
6.3.4 Hypothesis Test
The goal of a hypothesis test is to reproduce the behavior of manpower cost. As described
before, the reference mode of manpower cost is depicted as follows in the Figure 80.
Figure 80: Reference mode
Based on the reference mode, manpower cost is forecasted to steadily increase in the next ten
years. The observed output for manpower cost is shown in the Figure 81:

144
Figure 81: Observed behavior
From the observed model behaviors, the model results tested the anticipated behaviors and
dynamics hypothesis result.
6.4 Verification and Validation
Although Sterman (2000) says that there is no model can be verified and validated because of
many assumptions made in the model.
Several methods are curretnly used to validate system dynamics models (Forrester, 1961). The
model used histrical data from the DoN to test the model. The historical timeframe selected for
model testing is from 2003 to 2012.

145
Figure 82: Average monthly manpower cost—simulation and historical data
6.4.1 Manpower cost calibration
Skill based pay means paygrade levels are based on different skill levels. The higher the skill
level is, the higher is the paygrade level.
Table 22 Enlisted paygrade data between DoN and model running
0
500000
1000000
1500000
2000000
2500000
Average Monthly Manpower Cost
Model result Historical Data
2003 2004 2005 2006 2007 2008 2009 2010 2011 2012
DoN data 1,250,992 1,276,022 1,385,082 1,292,604 1,349,779 1,396,796 1,536,631 1,585,238 1,655,376 1,702,392
Modeling
Running 1,234,597 1,298,914 1,340,478 1,253,419 1,284,227 1,383,246 1,517,347 1,603,318 1,691,382 1,723,127

146
Figure 83: Calibration of manpower cost
Figure 83 showed the comparison of average monthly numbers between DoN Data and the
model running result from 2003 to 2012. As mentioned previously, the model used ten years (120
months) for its time horizon. This figure showed the monthly average for 120 manpower cost data.
From this figure, the model running result matches with DoN historical data. The figure also
described that manpower cost steadily increasing in the next ten years. This scenario is plausible
not only because it is able to generate a close replicate of the hypothetical trend, it is also able to
forecast the future behavior of manpower cost. The difference between two data can be
calculated by regression analysis. Table 23 showed regression results between these two data.
0
200,000
400,000
600,000
800,000
1,000,000
1,200,000
1,400,000
1,600,000
1,800,000
2,000,000
2003 2004 2005 2006 2007 2008 2009 2010 2011 2012
Manpower Cost Running Result
DoN data Modeling Running

147
Table 23 Regression analysis for manpower cost
Multiple R 0.988801
R Square 0.977728
Adjusted R
Square
-1.25
Standard Error 26006.41
“Goodness of Fit” R2
equates 0.978 which is close to 1. These two data match pretty well.
6.4.2 Training Cost validating
Figure 84: Ship Operation support and training cost
0
50,000
100,000
150,000
200,000
250,000
2003 2004 2005 2006 2007 2008 2009 2010 2011 2012
Calibration of Training cost Average per ship
DoN Model Running

148
Figure 84 displayed the training cost onboard for ship operation support from 2003 to 2012. The
blue color represented the data from the DoN, the red color represented the model running result.
The figure showed the model testing of the manpower cost from 2003 to 2012. From the figure,
model running matches the data.
The difference between two data can be calculated by regression analysis. Table 24 showed
regression results between these two data.
Table 24 Regression analysis for training cost
Multiple R 0.880432
R Square 0.775161
Adjusted R Square -1.25
Standard Error 6810.031
“Goodness of Fit” R2
equates 0.775 which is close to 1. This number represents that two data
match well.

149
CHAPTER SEVEN: CONCLUSIONs AND FUTURE STUDY
Conclusion
This research focused on tradeoff analysis and cost estimation between manpower and new
technology implementation. Utilizing concepts from SDM, a causal loop diagram was built to
identify major factors when implementing new technology, and then stocks and flows diagrams
were been built to estimate the manpower cost associated with new technology implementation.
The model had been tested using data from Department of the Navy. The time horizon is ten
years in this model.
As mentioned in the Chapter One, the expected research results were as follows:
1) Identify the major factors which impact Navy manpower cost associated with new
technology implementation.
2) Build a system dynamic model for facilitating Navy manpower cost and training cost.
3) Provide information to investigate manpower cost and conduct a technology trade-off
analysis so that decision makers and program managers can make better decisions.
4) Examine training cost for different training technologies by changing numbers of instructors.
In this research, major factors were identified that impact the Navy manpower cost when
implementing new technology. Enlisted pay grades were considered for the manpower cost that
included basic pay, allowance, entitlement, bonus, and retirement items for different paygrade
levels. Although manpower cost components include compensations for both officers and
enlisted, officer compensation is only approximately 17% of the manpower cost of a ship system.

150
Enlisted manpower cost accounts for 83% of the cost. This research used enlisted skill levels to
estimate manpower cost. Future study needs to involve officers’ cost in the model.
This research provided information to investigate manpower cost and technology trade-off
associated with different technology implementation periods for decision makers and program
managers. This information included skill levels, training requirement, experienced crew
members, and automation levels that can be used to estimate manpower cost.
A SDM had been built for facilitating manpower cost and training cost. In addition, different
scenarios of training were examined in this research. In this model, four parts of HSI were
considered including manpower, personnel, training, and human factor engineering. Training
provides personnel with required skill, knowledge and ability to meet requirements. Different
training technologies and total numbers of instructors have different impacts on training cost,
which had been examined in this research.
The modeling process is continuous and complex (Sterman, 2000). A good model needs to
continuously involve with modelers and decision makers who use the model for decision making
process. The strengths of this research include:
1) Identified major factors of manpower cost when implementing new technology.
2) Provided necessary information of manpower cost estimation by using system thinking
for decision makers and program managers.

151
However, this research also has limitations since it did not include officers in the manpower cost
estimation process. This caused a bias of manpower cost estimation for a ship system.
Significance of the study
Significance of the study is as follows:
1) Major factors were identified that impact Navy manpower cost when implementing new
technology.
2) A SDM had been built for facilitating manpower cost for the Navy.
3) Information had been provided to investigate manpower cost and new technology
implementation trade-off and cost estimation.
Contributions to Literature
I had developed a system dynamic model. This model allowed us to:
1) Identify manpower cost factors.
2) Provide necessary information for a better understanding of manpower cost drivers when
implementing new technologies.
3) Estimate manpower cost for a Navy system.
4) Conduct a trade-off analysis for manpower cost and state-of-the-art technology
implementation.

152
Research results
In summary, this research coped with my expected research results. These results include that
identified major factors impact Navy manpower cost associated with new technology
implementation, built a system dynamic model for facilitating Navy manpower cost and training
cost, provided information to investigate manpower cost and technology trade-off analysis for
decision makers, and estimated training cost for different training technologies and numbers of
instructors. This research also can be applied to industrial applications such as health care,
Nuclear power plant, and aviation company associated with manpower cost when implementing
new technology.
This research specified manpower cost by sailors’ skill categories, grade, and cost element.
Among these categories, skill levels can be expressed by different grade and compensation for
Navy enlisted sailors. As new technologies are implemented into today’s Navy ship systems, the
Navy must develop different manpower requirements for specifying manpower drivers and cost.
One of the major goals of this research is to assist Navy decision makers and program managers
when considering the impacts of technology selection on manpower cost. Additionally, this
research provides them with a better understanding of the hidden costs associated with new
technology adoption.
Future study
The modeling process is by its very nature always a work in progress. Future studies should
work closely with the relevant Subject Matter Experts (SME) to find a better solution for the

153
model application areas so that the model can be improved overall. The following list is the areas
recommended for future study:
1. This research used Navy public domain budget data from 2003 to 2012 for the model
validation and testing, which is not ideal. The reason is that the Navy data specifies whole
ship systems and therefore is not a good fit for a specific type of system. In a future study, it
is recommended that a specific type of ship data be used to validate the model. Ultimately the
goal for this model will be to generate generic manpower costs for any ship system
associated with a new technology implementation. Therefore, using more specific data is
very important for the long term validation of the model. Recommended sources would
include data from the Naval Visibility and Management of Operating and Support Costs
(VAMSOC).
2. Future study should include the number of officers in the model. In this research, only
numbers of enlisted sailors were considered. Therefore, future study should consider officers
to make the model more realistic.
3. Future study should also consider different grade levels of sailors, which will provide more
details of the sailors’ skill levels for decision makers. In this model, sailors’ skill levels were
divided into three different levels. Future study should consider adding more detail.
4. Although this study covered training, future study should expand on the training domain.
Training has changed gradually from Instructor-based Training to Computer Based Training
(CBT) since 2003 in the Navy. Future studies should compare different scenarios between
Instructor-based training and CBT onboard and the overall effects to manpower.

154
5. Additional studies should also consider maintenance workload effects. For example,
workload transfer in the model show how the system capability can be affected by the
amount of workload transferred to the shore. This is also critical for manpower requirements
since maintenance workload is one factor of determining crew size. Therefore, it is important
to determine how much workloads can be transferred to the shore in order to minimize crew
size onboard and not affect ship performance.
6. In this research it was assumed that new technology was implemented for every 18 months.
Future research should examine actual implementation timelines for technologies. It is
reasonable that some technologies might be adoptable faster than other.
7. Lastly, in this research, the level of complexity, automation, and technology implementation
periods for technology were considered in the model. Future study should combine other
variables for technology consideration such as reliability, maturity, compatibility, and
affordability.

155
APPENDIX A: SAMPLE PUBLIC DOMAIN DATA FROM
DEPARTMENT OF THE NAVY

156

157
APPENDIX B: CAUSAL LOOPS DIAGRAM

158

159
APPENDIX C: STOCKS AND FLOWS EQUATIONS

160
(01) Actual Average Skill Level= INTEG (Increasing skill level, 5)
Units: Dmnl
The actual skill level for the experienced sailors
(02) Advanced Technology on Complexity (
[(0,0)-(1,10)],(0.03976,2.67544),(0.2,5.78947),(0.4,7.58772),(0.5,8.20175
),(0.6,9.21053),(0.7,9.51754),(0.8,10))
Units: Dmnl
The current status of technology implementation
(03) Ashore Workload decreasing=
Maintenance workload Ashore/Time to complete 2
Units: manhour/Month
(04) Attrition= Attrition rate
Units: Person/Month
(05) Attrition rate= 0.1
Units: Person/Month
Experience sailor attrition rate per month
(06) Automation Level= INTEG (Increasing Automation level, 1)
Units: Dmnl

161
(07) Average Maintenance Workload onboard= 30*(Maintenance workload Onboard/Crew
size)
Units: manhour/Person
Average amount of works need to do by one sailor in one hour onboard.
(08) Average skill level req= INTEG (increasing 1, 15)
It is determined by Technology implementation rate on skill level requirement and
Normal skill level changing. Normal skill level changes by self-learning and organizational
learning.
(09) Capability increase fraction=
0.005
Units: Dmnl/Month
(10) Change in system capability=
capability increase fraction*Ship capability Performance Gap *State of the art
Technology Implemented *effect of tech numbers(Technologies Implemented)
Units: Dmnl/Month
(11) Complexity of Technology= EXP (State of the art Technology Implemented)
Units: Dmnl
How complex of the state-of-the-art technology----complexity between state-of-the-art
technology compared with the current technology
(12) Cost increasing=
0.1*Training requirement*(Training cost/Training duration)
Units: dollar/Month
It varies by Training requirement and time to train all the trainees.

162
(13) Crew size=
Min(Effect of Automation Level on Crew Size(Automation Level), (E5 to E7+
E2 to E4+E8 and E9))
Units: Person
The maximum number between automation level on crew size and total Experienced
Sailors and Inexperienced Sailors
(14) Desired capability= 10
Units: Dmnl
Desired ship capability from policy makers
(15) E2 to E4= INTEG (hiring-Promotion1, 190)
Units: Person
Numbers of Inexperienced sailors
(16) E5 to E7= INTEG (Promotion1-Promotion 2, 100)
Units: Person
Sailors have required experience.
(17) E8 and E9= INTEG (Promotion 2-attrition, 10)
Units: Person
(18) Effect of Automation Level on Crew Size (
[(0,0)-(4,300)],(0,300),(0.5,300),(1,300),(1.5,300),(2,300),(2.5,270),(3,
265), (3.5,260),(4,250))

163
Units: Person
Higher automation is, less numbers of crew size are
(19) effect of Experienced sailors on Skill level(
[(120,0)-(145,1)],(120,0.1),(125,0.2),(130,0.35),(140,0.4),(145,0.5))
Units: Dmnl/Person/Month
Experienced sailors on skill levels
(20) Fatigue level on productivity (
[(0.1,0.1)-(4.0,1.0)],(0,1),(1.03529,0.932384),(2,0.854093),(3,0.7),(3.5,0.6),(4,
0.5))
Units: Dmnl
Lookup table
(21) Pressure on workload transferred (
[(0,0)-(10,10)],(0.117647,0.355872),(1.34118,1.17438),(2.82353,1.88612),(
3.64706,2.34875),(5.03529,3.52313),(5.43529,5.48043),(6.11765,7.43772),(6.94118
,8.11388),(7.81176,8.71886),(9,9),(10,9))
Units: Dmnl
(22) effect of tech numbers(
[(0,0)-(12,10)],(0,2),(1,2),(5,5),(8,8),(10,10),(12,10))
Units: Dmnl
(23) Effect of Technology implementation on Skill level required=

164
Effect of Technology implementation on Skill level Table (State of the art
Technology Implemented
)
Units: Dmnl
The effect of the Technology implementation rate on Sailors' skill level requirement
(24) Effect of Technology implementation on Skill level Table (
[(0.1,0.1)-(1.0,1.5)],(0.1,0.5),(0.2,0.6),(0.4,0.8),(0.6,1),(0.9,1.1),(0.95,1.2),
(1.0,1.5))
Units: Dmnl
How technology implementation rate affects on skill level
(25) effect of time on fatigue = WITH LOOKUP (Work overtime fraction,
([(0.1,0.1)-
(3,2)],(0.1,0.1),(0.434251,0.0964912),(0.856269,0.280702),(1,0.6),(1.33333
,0.837719),(1.54128,0.951754),(2,1),(3,1.5) ))
(26) effect of workload on pressure(
[(0,0)-(150,10)],(0,0),(40,3),(50,5),(60,6),(80,7),(100,8),(149.294,10))
Units: Dmnl
(27) ES for time decreasing = 1
Units: hour/Month
[(170,0)-(300,40)],(170,0),(200,10),(210,20),(220,30),(230,35),(2
40,35),(280,35) One experienced sailor can decrease one hour.

165
(28) Experienced Sailors serving as Instructors=
Min ((E5 to E7+E8 and E9), E5 to E7*Pressure to reduce training time onboard
)
Units: Person
How many Experienced Sailors serves as training instructors
(29) Fatigue Level= INTEG (Getting fatigue, 1)
Units: Dmnl
Levels change from 1 to 10. 1 is the minimum and 10 is the maximum fatigue levels
(30) FINAL TIME = 120
(31) fraction= 0.1
(32) Fraction of Ashore to Onboard=
Maintenance workload Ashore/Maintenance workload Onboard
Units: Dmnl
The ration between Ashore maintenance and onboard maintenance.
(33) Getting fatigue=
Fraction *effect of time on fatigue*IF THEN ELSE(effect of time on fatigue
>1, ABS (New Fatigue level)/Time to get fatigue
, ABS (Initial Fatigue level
+Fatigue Level)/Time to get fatigue)
Units: Dmnl/Month

166
(34) Implementation rate=
1*(PULSE(18, 1 )+PULSE(36, 1 )+PULSE(54, 1 )+PULSE(72, 1
)+PULSE(90,1)+PULSE
(108,1))
Units: Technology/Month
(35) Implemented time= 9
Units: Month
Time to implement of a new training technology
(36) increasing 1= 0.1*Effect of Technology implementation on Skill level required
(37) Increasing Automation level= 0.5*ABS (indicated level-Automation Level)/Time to
increase
Units: Dmnl/Month
Comparison of indicated Automation level and actual automation level according with
the time
(38) Increasing skill level=
0.1*effect of Experienced sailors on Skill level (E5 to E7+E8 and E9)
Units: Dmnl/Month
The increasing skill level rate for the total sailors
(39) indicated Experienced sailors= 130
Units: Person
Desired numbers of experienced sailors

167
(40) indicated level=
IF THEN ELSE (Complexity of Technology< 2.5 : AND: Complexity of
Technology> 0, Initial Level , New Automation level
)
Units: Dmnl
(41) Indicated Training Technology Implemented=
IF THEN ELSE (Pressure to adopt Training technology< 1.2 : AND : Pressure to
adopt Training technology
>0, Initial Training Tech
, New Training Tech)
Units: Technology
(42) Initial Fatigue level= 1
Units: Dmnl
Initial level of Fatigue
(43) Initial Level= 2
(44) INITIAL TIME = 0
(45) Initial Training Tech= 2
Units: Technology
Initial level of Training technology
(46) Maintenance workload Ashore= INTEG (

168
Transfering-Ashore Workload decreasing,
0.1)
Units: manhour
here we are talking about Intermediate Maintenance.
(47) Maintenance workload Onboard= INTEG (
Onboard Workload increase-Onboard Workload Decrease,
100)
Units: manhour
It represents that workload performed onboard to maintain ship capability. It changes by
Workload Completion rate deducts Workload increasing
(48) Manpower budget=
1.2e+006
Units: dollar
Money be distributed for the manpower cost in one ship PER MONTH
(49) Manpower cost= average pay for enlisted*Crew size
Units: dollar
Manpower cost consists of compensation cost per month for all enlisted.
(50) Manpower Cost Saving Pressure=
Manpower cost/Manpower budget
Units: Dmnl
Varies by actual manpower cost and budget from government. the
higher budget the lower pressure

169
(51) Need to Adopt State of the art Technology = WITH LOOKUP (
Manpower Cost Saving Pressure*Ship capability Performance Gap,
([(0,0)-(12,1)],(0,0),(2,0.2),(4,0.4),(5.65749,0.77193),(8.10398,0.899123
),(10,0.91),(11,0.95),(12,1) ))
Units: Dmnl
Changing by cost saving pressure and system capability performance gap.
(52) New Automation level= 4
(53) New Fatigue level= 5
Units: Dmnl
Highest fatigue level
(54) New Training Tech= 5
Units: Technology
Higher level of the Training technology be implemented
(55) Normal completion rate= 50
Units: manhour/Month
Normal completion rate without any interruption
(56) Numbers of State of the art training Technology Implemented= INTEG (
Training technology numbers changing,
2)
Units: Technology

170
Numbers of new training technology be implemented into the system
(57) Onboard Workload Decrease=
Min (ZIDZ( (Maintenance workload Onboard-Maintenance workload Ashore) ,
Time to complete
), Crew size*Productivity)
Units: manhour/Month
Minimum number to decrease onboard workload between remains of
Workloads after transferring to ashore and crew's finishing rate
(58) Onboard Workload increase=
MAINTENANCE REQUIRED*2
Units: manhour/Month
Workload increases according to Maintenance requiement
(59) One tech decreases time= 2
Units: hour/Month
How much one training technology can decrease training time per sailor per month
(60) Pressure to adopt Training technology=
Training cost effect on technology adoption (Training cost)
Units: Dmnl
Cost pressure on adopting training technology
(61) Pressure to reduce training time onboard=
Training cost/Threshold of training cost
171
Units: Dmnl
Pressure increases when training time onboard increases
(62) Pressure to transfer workload ashore=
Fatigue Level*effect of workload on pressure (Average Maintenance Workload
onboard
)
Units: Dmnl
Pressure increases by increased average maintenance workload
(63) Productivity=
Effect of fatigue level on productivity (Fatigue Level)
Units: manhour/Person/Month
The effect of the fatigue level on sailors' productivity
(64) Promotion 2=
E8 and E9/time to promote2
Units: Person/Month
(65) Promotion1=
0.7*Training requirement*((indicated Experienced sailors-E5 to E7)/time to
promote1
)
Units: Person/Month
Changing by the difference between Desired Experience number and
actual Experience Sailors times Training requirement 0.6*ABS(
Training requirement*(Desired Experienced sailors-E5 to E7)/time

172
to promote1 )
(66) SAVEPER =
TIME STEP
(67) Ship capability Performance Gap=
Desired capability-Ship Performance capability
Units: Dmnl
Gap between desired ship capability and actual ship capability
(68) Ship Performance capability= INTEG (change in system capability, 2)
Units: Dmnl
Ship performance capability increases by technology and skill levels
(69) Skill Level Gap=
IF THEN ELSE ( (Average skill level required -Actual average skill level)>0 ,
Average skill level req
-Actual Average Skill Level
, 0)
Units: Dmnl
The gap between required skill level and the actual skill level
(70) standard training time= training time per sailor
Units: hour/Month
7 hours per week for one sailor. Therefore standard time per month is 28

173
(71) State of the art Technology Implemented = WITH LOOKUP (
Need to Adopt State of the art Technology,
([(0.1,0.1)-
(1,1)],(0.1,0.1),(0.195719,0.109649),(0.409786,0.236842),(0.501529,0.504386
),(0.614679,0.894737),(0.764526,0.973684),(1,1) ))
Units: Dmnl
how advanced level of technologies be implemented in the system.
(72) Technologies Implemented= INTEG (Implementation rate, 1)
Units: Technology
Numbers of technologies to be implemented
(73) Threshold of training cost= 1.85e+006
Units: dollar
Threshold of Training cost for all trainees in one month (budget consideration)
(74) TIME STEP = 1
(75) Time to complete= 4
Units: Month
Average time to complete a significant workload assignment
(76) Time to complete 2= 2.5
(77) Time to get fatigue= 10
Units: hour

174
Number of working hours to getting fatigue
(78) Time to increase= 36
Units: Month
Actual time to increase automation level. It takes 3 years for policy makers to make the
decision for increasing automation level
(79) time to promote1= 48
Units: Month
How many months are needed to acquire experienced sailors
(80) time to promote2= 120
Units: Month
How many months are needed to acquire experienced sailors
(81) Training cost= INTEG (Cost increasing, 216000)
Units: dollar
Training cost for all trainees in one month. OJT training
(82) Training cost effect on technology adoption(
[(100000,0)-(185000,2)],(100000,0.4),(170000,0.5),(172000,0.6),(177000,0.7
),(178000,0.8),(179000,0.9),(180000,1),(185000,1.47331))
Units: Dmnl
Lookup table
(83) Training duration=

175
(Standard training time-ES for time decreasing*Experienced Sailors serving as
Instructors
-Numbers of State of the art training Technology Implemented
*One tech decreases time)*E2 to E4
Units: hour/Month
Total time for ES to train all the trainees
(84) Training requirement = WITH LOOKUP (
Skill Level Gap,
([(0,0)-
(30,5)],(0,0),(6.56471,1),(12.2824,2),(14.5412,3),(18.5321,4),(23.5765
,4.5),(30,5) ))
Units: Dmnl
Changing by Skill level Gap. The higher skill level gap is, the
higher Training is required.
(85) Training technology numbers changing=
(Indicated Training Technology Implemented-Numbers of State of the art training
Technology Implemented
)/Implemented time
Units: Technology/Month
It changes by indicated training technologies and actual numbers
of training technologies (Indicated Training Technology
Implemented-Numbers of State of the art training Technology
Implemented)/Implemented time
(86) training time per sailor= 28

176
Units: hour/Month
Training time per sailor per month. Data from Navy manpower requirement. 10% for
training.
(87) Transferring=
Workload transfer to ashore*10
Units: manhour/Month
(88) Work overtime fraction=
ZIDZ(Onboard Workload Decrease, Normal completion rate )
Units: Dmnl
Percentage between normal completion rate and actual workload completion rate
(89) Workload transfer to ashore=
effect of pressure on workload transferred(Pressure to transfer workload ashore
)
Units: manhour/Month
Workloads need to transfer to ashore in order to decrease onboard burdens

177
REFERENCES
Adams, A. V., & Rayhawk, M. L. (1988). Training Effectiveness and Cost Iterative Technique
(TECIT). Volume 2. Cost Effectiveness Analysis. DTIC Document.
An, L., & Ramachandran, B. (2005). System dynamics model to understand demand
conditioning dynamics in supply chain. The 23rd International Conference of the System
Dynamics Society.
An, L., Jeng, J. J., Lee, Y. M., & Ren, C. (2007). Effective workforce lifecycle management via
system dynamics modeling and simulation. Simulation Conference, 2007 Winter (pp.
2187–2195).
Andersen, D. F., & Richardson, G. P. (1980). Toward a pedagogy of system dynamics. TIMS
Studies in the Management Sciences, 14, 91–106.
Bakkila, M. V. (1996). A system dynamics analysis of the interaction between the U. S.
government and the defense aerospace industry. Massachusetts Institute of Technology,
Dept. of Aeronautics and Astronautics.
Bjornsson, H. C., de la Garza, J. M., and Nasir, M. J. (2000). "A Decision Support System for
Road Maintenance Budget Allocation." Computing in Civil and Building Engineering;
Proceedings of the Eighth International Conference, Palo Alto, CA, 702 - 709.
Black, M., Rose, D., Smith, A., Eichers, D., Hogan, P., Hunter, R., & Tinney, R. (1992). Army
Manpower Cost System: Final Report. Retrieved from
http://www.dtic.mil/dtic/tr/fulltext/u2/a259274.pdf
Booher, H. R. (1997). Human Factors Integration: Cost and Performance Benefits on Army
Systems. DTIC Document. Retrieved from
http://oai.dtic.mil/oai/oai?verb=getRecord&metadataPrefix=html&identifier=ADA33077
6
Booher, H. R., & Wiley, J. (2003). Handbook of human systems integration. Wiley Online
Library. Retrieved from
http://onlinelibrary.wiley.com/doi/10.1002/0471721174.fmatter/summary
Bortolami, S., Duda, K., & Borer, N., (2010), “ Markov analysis of human-in-the-loop system
performance,” Proceeding in IEEE Conference on Aerospace, 1-9.
Bost, J. R., & Galdorisi, G. (2004). Transforming Coalition Naval Operations by Using Human
Systems Integration to Reduce Warship Manning: Lessons Learned from the United
States Navy DDG-51 Class Warship Reduced Manning Study. DTIC Document.

178
Boudreau, M. W., & Naegle, B. R. (2004). Total Ownership Cost: An Exercise in Discipline.
DTIC Document. Retrieved from
http://oai.dtic.mil/oai/oai?verb=getRecord&metadataPrefix=html&identifier=ADA49896
8
Boudreau, J. W. (1990). “ Cost-Benefit” Analysis Applied to Personnel/Human Resource
Management Decisions. CAHRS Working Paper Series, 383.
Carreno, J., Galdorisi, G., & Lemon, A. (2010). The Penultimate C4ISR Challenge: Reducing
Military Manpower and Total Operating Costs. DTIC Document.
Choucri, N., Madnick, S. E., Moulton, A., Siegel, M. D., and Zhu, H. (2005). "Linkage Between
Preand Post-Conflict: Exploiting Information Integration and System Dynamics." MIT
Sloan Working Paper No. 4521-05, MIT Sloan School of Management, Cambridge, MA.
Chu, X., (2006), “System Dynamics Modeling for Human Performance in Nuclear Power Plant
Operation,” Ph.D. dissertation, Massachusetts Institute of Technology.
Clark, J. D. (1990). Life Cycle Cost: An Examination of Its Application in the United States, and
Potential for Use in the Australian Defense Forces. DTIC Document. Retrieved from
http://oai.dtic.mil/oai/oai?verb=getRecord&metadataPrefix=html&identifier=ADA23683
4
Cooke, D. L. (2003). A system dynamics analysis of the Westray mine disaster. System
Dynamics Review, 19(2), 139–166.
Cooper, K., & Lee, G. (2009). Managing the Dynamics of Projects and Changes at Fluor.
Proceedings of the International System Dynamics Conference. Albuquerque 2009.
Coyle, J. M., Exelby, D., and Holt, J. (1999). "System Dynamics in Defense Analysis: Some
Case Studies." Journal of the Operational Research Society, 50(4), 372 - 382.
Crane, W. E. (2009). A System Dynamics Framework for Assessing Nation-Building in the
Democratic Republic of the Congo. DTIC Document.
Damle, P. (2003). A system dynamics model of the integration of new technologies for ship
systems. Virginia Polytechnic Institute and State University.
Department of the Navy (2007). Manual of Navy Total Force Manpower Policies and
Procedures, OPNAVINST 1000.16J, 17
Department of the Navy (2012). “Fiscal Year Budget Estimates “2003-2012”, Retrieved from
http://www.finance.hq.navy.mil/fmb/12pres/books.htm.

179
Department of the Army (2001). “ Economic Analysis Manual”. U.S. Army Cost and Economic
Analysis Center February 2001.
Douangaphaivong, T. N. (2004). Littoral combat ship (LCS) manpower requirements analysis.
DTIC Document. Retrieved from
http://oai.dtic.mil/oai/oai?verb=getRecord&metadataPrefix=html&identifier=ADA42978
9
Dulac, N., Leveson, N., Zipkin, D., Friedenthal, S., Cutcher-Gershenfeld, J., Carroll, J., and
Barrett, B. (2005). "Using System Dynamics for Safety and Risk Management in
Complex Engineering Systems." Winter Simulation Conference, Orlando, FL, 1311 -
1320.
Dyson, B., & Chang, N. B. (2005). Forecasting municipal solid waste generation in a fast-
growing urban region with system dynamics modeling. Waste Management, 25(7), 669–
679.
Eberlein, B., (2007). System dynamics software info [online]. Available from :
http://www.vensim.com/sdmail/sdsoft.html [Accessed 06 March 2012].
Fan, C. Y., Fan, P. S., & Chang, P. C. (2010). A system dynamics modeling approach for a
military weapon maintenance supply system. International Journal of Production
Economics, 128(2), 457–469.
Fleming, M. G. (1997). The Cost and Benefits of Reduced Manning for US Naval Combatants.
DTIC Document.
Force, U. S. A. (2008). Air Force Human Systems Integration Handbook. Air Force 711 Human
Performance Wing, Directorate of Human Performance Integration, Human
Performance Optimization Division.
Ford, D.N, Sterman J.D.(1998). Dynamic modeling of product development processes. System
Dynamics Review 14(1): 31–68.
Forrester, J. W. (1961). Industrial Dynamics, Wiley, New York.
Forrester, J. W. (1996). System dynamics and K-12 teachers. Retrieved August, 8, 2008.
GAO (2003). Navy Actions Needed to Optimize Ship Crew Size and Reduce Total Ownership
Costs. GAO Report To Congress 2003. GAO-03-520.
GAO (2009). Estimating, G. C., & Guide, A. Best practices for developing and managing capital
program costs. dated 03-02-09.

180
Gilmore, L., & Valaika, J. (1992). Operating and Support Cost-Estimating Guide. OFFICE OF
THE SECRETARY OF DEFENSE WASHINGTON DC DIRECTOR PROGRAM
ANALYSIS AND EVALUATION.
Gonçalves, P. (2007). Business Cycle Entrainment: A System Dynamics Approach.
Gu, L., & Chen, S. (2010). A System Dynamics Approach to Human Resource Management.
Management and Service Science (MASS), 2010 International Conference on (pp. 1–4).
Han, J.C.W.(1997). Using System Dynamics in Business Simulation Training Games.
Herweg, G., & Pilon, K. (2001). System Dynamics Modeling for the Exploration of Manpower
Project Staffing Decisions in the Context of a Multi-Project Enterprise. Cambridge, MA:
System Design and Management Program, Massachusetts Institute of Technology.
Hustache, J. C., Gibellini, M., & De Matos, P. L. (2001). A System Dynamics Tool for
Economic Performance Assessment in Air Traffic Management. 4th USA/Europe Air
Traffic Management R&D Seminar.
INCOSE (2007). Definition of Human System Integration (HIS). Publications in the INCOSE
website. http://www.incose.org/
Johnson, D. C., Drakeley, G. M., Plante, T. N., Dalton, W. J., & Trost, C. S. (2009). Managing
Change on Complex Programs: VIRGINIA Class Cost Reduction. Naval Engineers
Journal, 121(4), 79–94.
Johnson J.A., Osborn D.B., Previc, F.H.,Prevost G.L.(2005) “Human Systems
Integration/Manning Reduction forLHD-Type Ships.” Technology Review Journal •
Fall/Winter 2005.
Kadoya, T., Sasaki, T., Ihara, S., Larose, E., Sanford, M., Graham, A. K., Stephens, C. A., and
Eubanks, C. K. (2005). "Utilizing System Dynamics Modeling to Examine Impact of
Deregulation on Generation Capacity Growth." Proceedings of the IEEE, 93(11), 2060 -
2069.
Keizers, j. M., bertrand, J., & Wessels, J. (2003). Diagnosing order planning performance at a
navy maintenance and repair organization, using logistic regression. Production and
Operations Management, 12(4), 445–463.
Killingsworth, W. R., Speciale, S. M., & Martin, N. T. (2011). Using System Dynamics to
Estimate Reductions in Life-Cycle Costs Arising From Investments in Improved
Reliability.
Koopman, M. E., & Golding, H. L. (1999). Optimal Manning and Technological Change. DTIC

181
Document. Retrieved from
http://oai.dtic.mil/oai/oai?verb=getRecord&metadataPrefix=html&identifier=ADA37942
9
Landsburg, A. C., Avery, L., Beaton, R., Bost, J. R., Comperatore, C., Khandpur, R., Malone, T.
B., et al. (2008).
Leonard, B. (2009). GAO Cost Estimating and Assessment Guide: Best Practices for Developing
and Managing Capital Program Costs. DIANE Publishing.
Linard, K., Sloper, P., and Paterson, D. (1998). "Defense Preparedness and Economic
Rationalists: A System Dynamics Framework for Resource Allocation." The 16th
International Conference
Lizza, G., Lockett, et al(2008) “Human Systems integration: Synergy Across the united states
military serives.” INCOSE INSIGHT 11(2):28-30
Lockett-Reynolds, J., & Duma, K. M. (2009). TDRA: Human Systems Integration (HSI) in
Modeling and Simulation. Retrieved from
http://navalengineers.net/Proceedings/HSIS2009/Papers/Lockett-
Reynolds_Malone_Wilson_Muse-Duma.pdfThe art of successfully applying human
systems integration. Naval Engineers Journal, 120(1), 77–107.
Lockman, R. F. (1985). Trends and Issues in US Navy Manpower. DTIC Document.
Lyneis JM., Ford DN. (2007). System dynamics applied to project management: a survey,
assessment, and directions for future research. System Dynamics Review 23(2/3): 157–
189.
MacInnis, D. V. (2004). Development of a System Dynamics Based Management Flight
Simulator for New Product Development. Massachusetts Institute of Technology, System
Design & Management Program.
Madachy, R. J. (1994). A software project dynamics model for process cost, schedule and risk
assessment. University of Southern California
Malone T.B. and Bost J.R. (2000), “HSI Top-Down Requirements Analysis for Ship Manpower
Reduction,” in SPIE Proc. 4126, Bellingham, WA: SPIE—The International Society for
Optical Engineering, 2000, http://spiedl.aip.org/dbt/dbt.jsp?KEY=
PSISDG&Volume=4126&Issue=1&bproc=volrange&scode=4100+-+4199
Malone, T. B., & Carson, F. (2003). HSI top down requirements analysis. Naval engineers
journal, 115(2), 37–48.

182
Mannie Jr, T. E., & Risser, D. T. (1984). Estimating Manpower, Personnel, and Training
Requirements Early in the Weapon System Acquisition Process: An Application of the
HARDMAN Methodology to the Army’s Division Support Weapon System. DTIC
Document. Retrieved from
http://oai.dtic.mil/oai/oai?verb=getRecord&metadataPrefix=html&identifier=ADA14445
3
MANPRINT Handbook. Washington, D.C., June 2002.Directorate, M. (2005). Manpower and
personnel integration MANPRINT handbook. Retrieved July, 02, 2012.
Manual, S. P. (1984). Department of the Army. US Army Corps of Engineers.
Masiello, G. L. (2002). Reliability the life cycle driver: an examination of reliability
management culture and practices. DTIC Document. Retrieved from
http://oai.dtic.mil/oai/oai?verb=getRecord&metadataPrefix=html&identifier=ADA40275
3
McCue, T. (1997). The Dynamics of Naval Shipbuilding: A System Approach to Project
Management Assessment. MIT Thesis.
McDonnell, G., Heffernan, M., & Faulkner, A. (2004). Using system dynamics to analyses
health system performance within the WHO framework. 22nd International Conference
of the System Dynamics Society (pp. 25–29).
McLucas, A. C., and Linard, K. T. (2000). "System Dynamics Practice in a Non-Ideal World:
Modeling Defense Preparedness." Sustainability in the Third Millennium: The 18th
International Conference of The System Dynamics Society, Bergen, Norway
Moore, C. S., Hattiangadi, A. U., Sicilia, G. T., & Gasch, J. L. (2002). Inside the black box:
Assessing the navy’s manpower requirements process. DTIC Document.
Morris, A., Ross, W., & Ulieru, M. (2010). A system dynamics view of stress: Towards human-
factor modeling with computer agents. Conference Proceedings-IEEE International
Conference on Systems, Man and Cybernetics.
Morrison, J. B. (2007). Insights from Modeling the Dynamics of Process Improvement.
Morrison, J. B., (2008), “Putting the learning curve in context,” Journal of Business Research,
61, 1182-1190.
Navy Manpower Analysis Center, Ship Manpower Requirements Training, OPNAVINST
l000.16K (2007). can be accessed from
http://www.public.navy.mil/BUPERSNPC/ORGANIZATION/NAVMAC/MANPOWER
PROGRAMS/Pages/default2.aspx
183
Navy, U. S. (2011). Manual of Navy Enlisted Manpower and Personnel Classifications and
Occupational Standards. Vol. I. Washington DC.
Ng, H. S., Pena-Mora, F., and Tamaki, T. (2007). "Dynamic Conflict Management in Large-
Scale Design and Construction Projects." Journal of Management in Engineering, 23(2),
52 - 66.
Nugent, W. A., & White, D. (2000). Manpower Modeling and Human-centered Design for 21st
Century Naval Platforms. Proceedings of the Human Factors and Ergonomics Society
Annual Meeting (Vol. 44, pp. 525–528). Retrieved from
http://pro.sagepub.com/content/44/36/525.short
Orlansky, J., & String, J. (1979). Cost-effectiveness of computer-based instruction in military
training. DTIC Document. Retrieved from
http://oai.dtic.mil/oai/oai?verb=getRecord&metadataPrefix=html&identifier=ADA07340
0
O’Rourke, R. (2009). Navy DDG-51 and DDG-1000 Destroyer Programs: Background and
Issues for Congress. Retrieved from
http://oai.dtic.mil/oai/oai?verb=getRecord&metadataPrefix=html&identifier=ADA51353
0
Osga, G. (1999). The Task-Centric Watchstation. Surface Warfare Magazine, Vol 24, No. 4, pp.
16-19.
Osga, G., & Galdorisi, G. (2003). Human Factors Engineering: An Enabler for Military
Transformation Through Effective Integration of Technology and Personnel. DTIC
Document. Retrieved from
http://oai.dtic.mil/oai/oai?verb=getRecord&metadataPrefix=html&identifier=ADA46738
1
Phillips, John F., “Contracting for Assured Support to the Warfighter,” Briefing for Navy
Acquisition Conference, 03 May 2001. )
[http://www.abm.rda.hq.navy.mil/searchpage.cfm])
Prasertrungruang, T., & Hadikusumo, B. H. W. (2008). System dynamics modeling of machine
downtime for small to medium highway contractors. Engineering, Construction and
Architectural Management, 15(6), 540–561.
Repenning, N. P., & Sterman, J. D. (2002). Capability traps and self-confirming attribution
errors in the dynamics of process improvement. Administrative Science Quarterly, 47(2),
265–295.
184
Senge, P (2000). The fifth discipline. The Art & Practice of Learning Organization. Doupleday
Currence, New York.
Scofield, T. (2006). Manning and automation model for naval ship analysis and optimization.
Virginia Polytechnic Institute and State University. Retrieved from
http://scholar.lib.vt.edu/theses/available/etd-04282006-113459/
Sharma, D., Sahay, B. S., & Sachan, A., (2004), “ Modelling distributor performance index using
system dynamics approach,” Asia Pacific Journal of Marketing and Logistics, 16(3), 37-
67.
Shattuck, N. L. (2011). Human Systems Integration Tradeoff Analyses: Lessons Learned in
Support of Naval Surface Acquisitions. Proceedings of the Human Factors and
Ergonomics Society, 55(1), 2040–2043.
Simgua. http://simgua.com/index.php . Data retrieved on the April 13, 2012
Simpson, H. (1995). Cost-Effectiveness Analysis of Training in the Department of Defense.
DTIC Document.
Sindall, D. A. (2010). Development of a Cost Estimation Process for Human Systems Integration
Practitioners During the Analysis of Alternatives. DTIC Document.
Smith, R. (2002). "Counter Terrorism Simulation: A New Breed of Federation." Simulation
Interoperability Workshop - Fall 2002, Orlando, FL.
Spindel, R. C., Laska, S., Cannon-Bowers, J. A., Cooper, D. L., Hegmann, K. C., Hogan, R. J.,
Hubbard, J. E., et al. (2000). Optimized surface ship manning. DTIC Document.
Retrieved from
http://oai.dtic.mil/oai/oai?verb=getRecord&metadataPrefix=html&identifier=ADA45405
5
Sterman, J. D. (1994). Learning in and about complex systems. System Dynamics Review, 10(2-
3), 291–330.
Sterman, J.D. (2000). Business Dynamics: Systems Thinking and Modeling for a Complex
World. Chicago, IL: Irwin/McGraw Hill.
Swope, W.M. (1976). A primer on economic analysis for naval training systems. TAEG Report
No. 31. Orlando, FL: Training Analysis and Evaluation Group.
Thie, H. (2008). Fiscally informed total force manpower (Vol. 606). Rand Corp.
Ting, C. (1993). Estimating operating and support cost models for US naval ships. DTIC

185
Document.
Trifonov, I., Bandte, O., Bonabeau, E., & Gaudiano, P. (2005). Agent-Based Modeling as a Tool
for Manpower and Personnel Management. DTIC Document. Retrieved from
http://oai.dtic.mil/oai/oai?verb=getRecord&metadataPrefix=html&identifier=ADA46509
1
Trost, C. S. (2002). A dynamic model of work quality in a government oversight organization.
System Dynamics Review, 18(4), 473–495.
U.S. Department of Defense (2008), “Operation of the Defense Acquisition System”,
Department of Defense Instruction 5000.02, Washington, DC: Government Printing
Office.
Wang, W., & Tu, Y. (2012). A simulation model for organizational evolution.
Warner, J. T., & GROUP, C. F. N. A. A. V. N. S. (1981). Issues in Navy Manpower Research
and Policy: An Economist’s Perspective. Naval Studies Group, Center for Naval
Analyses. Retrieved from http://www.cna.org/sites/default/files/research/5500032200.pdf
Weldon, W., Gale, P., Adair, R., Adamiak, M., Allen, C., Ashton, R., … Gully, J. (2002).
Roadmap to an Electric Naval Force. DTIC Document. Retrieved from
http://oai.dtic.mil/oai/oai?verb=getRecord&metadataPrefix=html&identifier=ADA45251
9
Williamson, S. (1999). A description of US enlisted personnel promotion systems. DTIC
Document. Retrieved from
http://oai.dtic.mil/oai/oai?verb=getRecord&metadataPrefix=html&identifier=ADA36567
2
Winch, G. W., (2001), “Management of the "skills inventory" in times of major change,”
System Dynamics Review, 17(2), 151-159.
Yang, M., Young, S., & Li, S. J. (2010). Using System Dynamics to Investigate How Belief
Systems Influence the Process of Organization Change. Proceedings of the 28th
International Conference of the System Dynamics Society. Retrieved from
http://www.systemdynamics.org/conferences/2010/proceed/papers/P1060.pdf
Yu, J., Ahn, N., & Jae, M. (2004). A quantitative assessment of organizational factors affecting
safety using system dynamics model. JOURNAL-KOREAN NUCLEAR SOCIETY,
36(1), 64–72.