Embed Size (px)
Citation preview
A Survey on Soft Drinks Intake Behaviour among University Going
Students
A thesis report submitted to the Department of Pharmacy, East West University, Bangladesh,
in partial fulfillment of the requirements for the Degree of Bachelor of Pharmacy.
Submitted by:
Md. Nazmul Haque
ID: 2013-3-70-072
Research Supervisor:
M. Saleh Yunus
Lecturer
Department of Pharmacy
EAST WEST UNIVERSITY
January 2018
Declaration by the Research Candidate
I, Md. Nazmul Haque, hereby declare that the dissertation entitled “A Survey on Soft
Drinks Intake Behaviour among University Going Students” is submitted by me to the
Department of Pharmacy, East West University, in the partial fulfillment for the award of the
degree of Bachelor of Pharmacy, is a record of original research work conducted by me
under the supervision of M. Saleh Yunus, Lecturer, Department of Pharmacy, East West
University and it has not formed on the basis for the award of any other
Degree/Diploma/fellowship or other similar title to any candidate to any University.
_____________________
Md. Nazmul Haque
ID: 2013-3-70-072
Department of Pharmacy
East West University
Certification by the Supervisor
This is to certify that the dissertation entitled “A Survey on Soft Drinks Intake Behaviour
among University Going Students” is a research work done by Md. Nazmul Haque
(ID:2013-3-70-072), in partial fulfillment of the requirement for the degree of Bachelor of
Pharmacy under my supervision.
_______________________
M. Saleh Yunus
Lecturer
Department of Pharmacy
East West University

Certified by the Chairperson
This is to certify that the dissertation entitled “A Survey on Soft Drinks Intake Behaviour
among University Going Students” is a genuine research work carried out by Md. Nazmul
Haque, ID: 2013-3-70-072, under the supervision of M. Saleh Yunus (Lecturer, Department
of Pharmacy, East West University) in partial fulfillment of the requirements for the Degree
of Bachelor of Pharmacy. I further certify that no part of the thesis has been submitted for
any other degree and all the resources of the information under this connection are duly
acknowledged.
______________________________
Dr. Chowdhury Faiz Hossain
Professor and Chairperson
Department of Pharmacy
East West University
Acknowledgement
At first, I would like to thank Almighty Allah for enabling me to successfully complete my
research work soundly and orderly.
I would like to express my deepest gratitude to my supervisor, M. Saleh Yunus, Lecturer,
Department of Pharmacy, East West University, for his cordial support throughout this
research project. His generous advice, constant supervision, intense support and enthusiastic
encouragements during the research work helped me to shape this research in a better way.
His motivation, support, patience and advices have made it possible for me to complete this
research.
I put forward my sincere regards and profound gratitude to Chairperson Dr. Chowdhury
Faiz Hossain, Department of Pharmacy, East West University.
I want to express my sincere thankfulness to my mother Nasima Haque for her support and
guidance all through my life, including that for my research project.
I also express my sincere gratitude to my younger brother Sohanur Rahman Sohag for his
support throughout this research project.
I want to give special thanks to my dear friends Nahida Akter, Md Kamrul Hassan Joy,
Nasib Rahman Arafat and Samiul Islam for their support and guidance throughout this
research project.
I would like to express my sincere gratitude to all of my friends for their kind cooperation
and support to complete my study including my research project.
I would like to thank all the students who have shown their interest and support during data
collection for my research project.

Dedication This Research Paper is dedicated to
My beloved parents, Who are my biggest inspirations…
Abstract
OBJECTIVE: The research was carried out to find out soft drinks intake behavior among the
university going students.
METHOD: The study included finding out information regarding soft drinks intake behavior
and the amount of soft drinks consumption in daily life of students.
DESIGN: A standardized questionnaire introduced to student to collect their response.
SETTING: East West University, Dhaka.
SUBJECTS: 445 students of the university. Among them 298 were male and 147 were
female.
INTERVENTIONS: A Survey, questionnaire composed of soft drinks intake related
questions, amount of soft drinks consumption related questions, health concerns because of
consuming soft drinks related questions etc.
RESULTS: Among 445 students 23% students consumed soft drinks randomly, 18% few
times a week, 14% once a day, 13% after taking junk food, 13% after taking rich food, 12%
more than once a day, 6% after doing any kind of sports and only 1% students never
consumed soft drinks. 36% students consumed 125-250 ml soft drinks at a time, 35%
consumed less than 125 ml, 25% consumed 250-500 ml and 4% consumed more than 250
ml. 47% students did not think diet drinks are better than normal drinks 35% students felt
addicted to soft drinks.
CONCLUSION: During this study it has been observed that majority of the university
students consume different type of soft drinks at different intervals. Though majority of them
know about the complications that occur by consuming soft drinks, they spend a good
amount of pocket money on soft drinks. Approximately half of them think diet drinks is not
better than normal soft drinks. A few of them felt addicted to soft drinks. Healthy eating
messages for adolescents need to be developed and incorporated into existing and future
campaigns to reinforce the perception that there are other healthier drinks that quench thirst
and that taste good as well.

1 Soft Drinks Intake Behaviour among University Going Students.
Contents
Chapter 1: Introduction
1.1 Soft Drink ........................................................................................................................ 8
1.2 History of Soft Drinks ..................................................................................................... 8
1.3 Origin of The Name of Soft Drinks .............................................................................. 10
1.4 Ingredients of Soft Drinks ............................................................................................. 11
1.4.1 Acids: ......................................................................................................................... 11
1.4.2 Carbon dioxide (CO2): ............................................................................................... 11
1.4.3 Colours: ...................................................................................................................... 11
1.4.3.1 Natural colours: ....................................................................................................... 11
1.4.3.2 Artificial colours: .................................................................................................... 12
1.4.4 Caramel ...................................................................................................................... 12
1.4.5 Flavourings ................................................................................................................. 12
1.4.6 Intense sweeteners ...................................................................................................... 12
1.4.6 Preservatives .............................................................................................................. 13
1.4.7 Sugars (sucrose, glucose and fructose) ...................................................................... 13
1.4.8 Water .......................................................................................................................... 13
1.5 Statistical Data on Consumption of Soft Drinks ........................................................... 14
1.6 Different Types of Soft Drinks ..................................................................................... 17
1.6.1 Pasteurizing noncarbonated beverages ...................................................................... 17
1.6.2 Powdered soft drinks .................................................................................................. 17
1.6.3 Iced soft drinks ........................................................................................................... 17
1.7 Reasons Why People Drink Soft Drink ........................................................................ 17
1.7.1 Soft drinks are very tasty............................................................................................ 17
2 Soft Drinks Intake Behaviour among University Going Students.
1.7.2 Soft drinks are available everywhere ......................................................................... 17
1.7.3 Soft drinks are more convenience .............................................................................. 18
1.7.4 Promotion and Advertising ........................................................................................ 18
1.7.5 Habit of consuming soft drinks .................................................................................. 18
1.7.6 It Is Cheap .................................................................................................................. 18
1.7.7 Thirst .......................................................................................................................... 18
1.7.8 Caffeine Addiction ..................................................................................................... 19
1.8 Complication of Consuming Soft Drinks & Reasons to Stop Drinking Soft Drinks .... 19
1.8.1 Soda Is Useless ........................................................................................................... 19
1.8.2 Weight Gain & Obesity .............................................................................................. 19
1.8.3 Diabetes ...................................................................................................................... 20
1.8.4 Weakened Bones and Risk of Osteoporosis ............................................................... 21
1.8.5 Soft drinks and heart disease ...................................................................................... 21
1.8.6 Dental Caries and Erosion .......................................................................................... 22
1.8.7 Kidney Damage .......................................................................................................... 22
1.8.8 Increased Blood Pressure ........................................................................................... 22
1.8.9 Metabolic Syndrome Risk Factor ............................................................................... 23
1.8.10 Harmful Effects on Liver ......................................................................................... 23
1.8.11. Impaired Digestive System ..................................................................................... 23
1.8.12 Dehydration .............................................................................................................. 23
1.8.13 High Caffeine Content ............................................................................................. 24
1.8.14 Toxins - Aspartame .................................................................................................. 24
1.8.15 Cell Damage ............................................................................................................. 24
1.8.16 Other Harmful Effects .............................................................................................. 24

3 Soft Drinks Intake Behaviour among University Going Students.
Chapter 2: Literature Review
2.1 Soft drinks and 'desire to drink' in preschoolers ........................................................... 26
2.2 Understanding soft drink consumption among female adolescents using the Theory of
Planned Behavior. ............................................................................................................... 26
2.3 Effects of Soft Drink Consumption on Nutrition and Health: A Systematic Review and
Meta-Analysis ..................................................................................................................... 27
2.4 Intake of sugar-sweetened beverages and weight gain: a systematic review1, 2, 3 ...... 28
2.5 Soft Drink Consumption and Risk of Developing Cardiometabolic Risk Factors and the
Metabolic Syndrome in Middle-Aged Adults in the Community. ...................................... 28
2.6 Factors associated with soft drink consumption in school-aged children. .................... 29
2.7 Carbonated Soft Drink Consumption and Bone Mineral Density in Adolescence: The
Northern Ireland Young Hearts Project. ............................................................................. 30
2.8 Soft Drink Consumption Linked with Fatty Liver in the Absence of Traditional Risk
Factors. ................................................................................................................................ 31
2.9 Relationship of Soft Drink Consumption to Global Overweight, Obesity, and Diabetes:
A Cross-National Analysis of 75 Countries. ....................................................................... 32
2.10 Sugary drink consumption and dental caries in New South Wales teenagers. ........... 33
2.11 Soft drink consumption and urinary stone recurrence: A randomized prevention trial.
............................................................................................................................................. 33
2.12 Patterns of soft drink consumption and primary tooth extractions in Queensland
children. ............................................................................................................................... 34
2.13 Risk Indicators for Tooth Loss due to Caries and Periodontal Disease in Recipients of
Free Dental Treatment in an Adult Population in Bangladesh. .......................................... 34
2.14 Soft Drink Consumption among US Children and Adolescents. ................................ 35
2.15 Determinants and patterns of soft drink consumption in young adults: a qualitative
analysis. ............................................................................................................................... 36
2.16 Soft drinks, fructose consumption, and the risk of gout in men: prospective cohort
study. ................................................................................................................................... 37
2.17 Enamel Erosion by Some Soft Drinks and Orange Juices Relative to Their pH,
Buffering Effect and Contents of Calcium Phosphate. ....................................................... 37

4 Soft Drinks Intake Behaviour among University Going Students.
2.18 Dietary Sugars Intake and Cardiovascular Health: A Scientific Statement From the
American Heart Association ............................................................................................... 38
2.19 Intake of sugar-sweetened beverages and weight gain: a systematic review. ............. 39
2.20 Consumption of Sweetened Beverages and Intakes of Fructose and Glucose Predict
Type 2 Diabetes Occurrence. .............................................................................................. 40
Chapter 3: Materials & Method
3.1 Type of the Study .......................................................................................................... 42
3.2 Materials ........................................................................................................................ 42
3.3 Study Area ..................................................................................................................... 42
3.4.1 Inclusion Criteria ........................................................................................................ 42
3.4.2 Exclusion Criteria ....................................................................................................... 42
3.5 Study Population ........................................................................................................... 42
3.6 Development of the Questionnaire ................................................................................ 43
3.7 Sampling Technique ...................................................................................................... 43
3.8 Data Collection Method ................................................................................................ 43
3.9 Data Analysis ................................................................................................................ 43
3.10 BMI Parameter ............................................................................................................ 43
3.11 Procedure ..................................................................................................................... 44
Chapter 5: Result & Analysis
Result & Analysis……………………………………………………………………………………46
Chapter 5: Discussion
Discussion ........................................................................................................................... 67
Chapter 6: Conclusion
Conclusion........................................................................................................................... 69
Chapter 7: References
References ........................................................................................................................... 71

5 Soft Drinks Intake Behaviour among University Going Students.
List of Figures
Fig 1.1: Various soft drinks in a supermarket…………………………………..………………………………………….8
Fig 1.2: Soft Drinks……………………………………………………………………………………………………………………….9
Fig 1.3: Advertisement of Soft drinks………………………………………………………………………………………….10
Fig 1.4: Consumption of soft drinks per year……………………………………………………………………………...15
Fig 1.5: Demand of soft drinks per brand…………………………………………………………………………………….16
Fig 1.6: Relative risk of Type 2 diabetes per soft drinks consumption……………..…….20
Fig 3.1: Procedure ............................................................................................................... 44
Fig 4.1: Proportion of students (gender wise). .................................................................... 46
Fig 4.2: BMI status of students. .......................................................................................... 47
Fig 4.3: Percentage of Underweight Students. .................................................................... 48
Fig 4.4: Percentage of Healthy Weight Students. ............................................................... 48
Fig 4.5: Percentage of overweight students. ....................................................................... 49
Fig 4.6: Percentage of obese students. ................................................................................ 49
Fig 4.7: Residential Status of the Students.......................................................................... 50
Fig 4.8: Percentage of Students Consuming Soft Drinks According to Flavor .................. 51
Fig 4.9: Students Preferred Soft Drinks Container ............................................................. 52
Fig 4.10: Proportion of pocket money spent on purchasing soft drinks ............................. 53
Fig 4.11: Percentage of often consuming soft drinks among students ................................ 54
Fig 4.12: Percentage of amount of soft drinks consumed by students at a time ................. 55
Fig 4.13: Soft Drinks Consumption of Students Living with Family ................................. 56
Fig 4.14: Soft Drinks Consumption of Students Living with Relatives ............................. 57
Fig 4.15: Soft Drinks Consumption of Students Living with Friends ................................ 58
Fig 4.16: Soft Drinks Consumption of Students Living at Other Places ............................ 59
Fig 4.17: Knowledge of Students Regarding Soft Drinks Ingredients................................ 60

6 Soft Drinks Intake Behaviour among University Going Students.
Fig 4.18: Diet Drinks Are Better than Normal Drinks ........................................................ 61
Fig 4.19: Knowledge of Disease Caused by Consuming Soft Drinks ................................ 62
Fig 4.20: Student to Soft Drinks ......................................................................................... 63
Fig 4.21: Proportion of Pocket Money Spent by Students Who Felt Addicted to Soft Drinks
............................................................................................................................................. 64
Fig 4.22: Residential Status of Students Who Felt Addicted to Soft Drinks ...................... 65

7 Soft Drinks Intake Behaviour among University Going Students.
CHAPTER-1
INTRODUCTION
8 Soft Drinks Intake Behaviour among University Going Students.
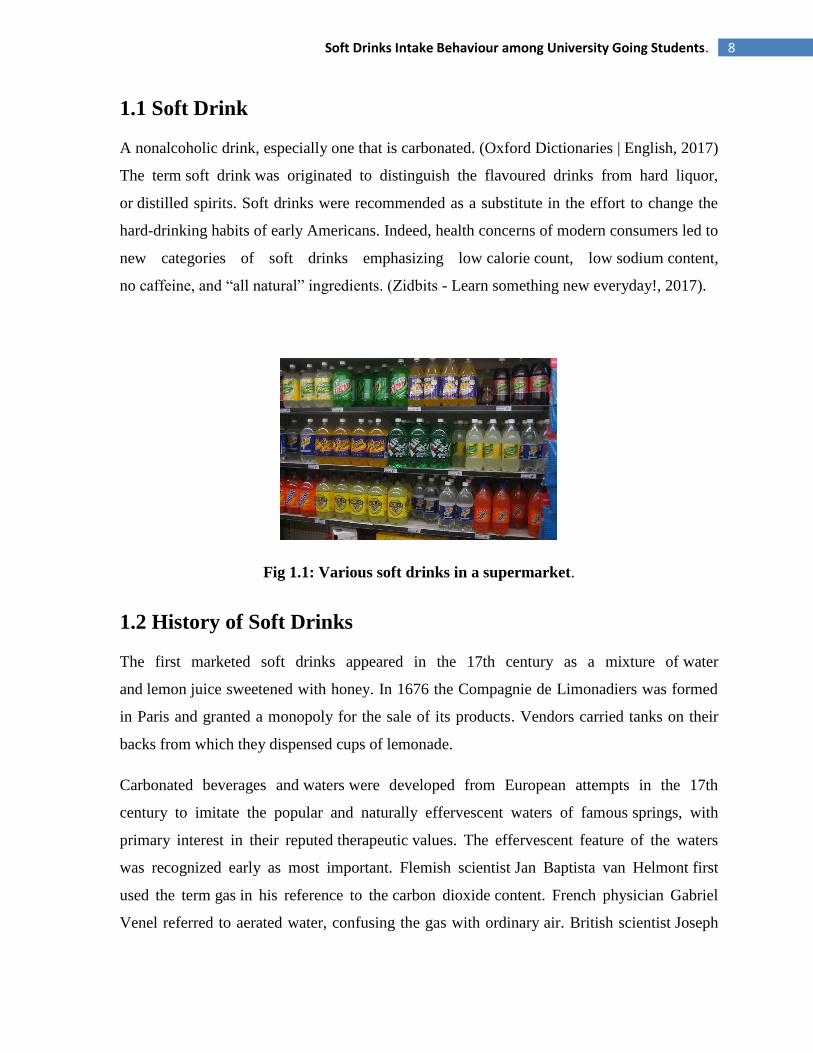
1.1 Soft Drink
A nonalcoholic drink, especially one that is carbonated. (Oxford Dictionaries | English, 2017)
The term soft drink was originated to distinguish the flavoured drinks from hard liquor,
or distilled spirits. Soft drinks were recommended as a substitute in the effort to change the
hard-drinking habits of early Americans. Indeed, health concerns of modern consumers led to
new categories of soft drinks emphasizing low calorie count, low sodium content,
no caffeine, and ―all natural‖ ingredients. (Zidbits - Learn something new everyday!, 2017).
Fig 1.1: Various soft drinks in a supermarket.
1.2 History of Soft Drinks
The first marketed soft drinks appeared in the 17th century as a mixture of water
and lemon juice sweetened with honey. In 1676 the Compagnie de Limonadiers was formed
in Paris and granted a monopoly for the sale of its products. Vendors carried tanks on their
backs from which they dispensed cups of lemonade.
Carbonated beverages and waters were developed from European attempts in the 17th
century to imitate the popular and naturally effervescent waters of famous springs, with
primary interest in their reputed therapeutic values. The effervescent feature of the waters
was recognized early as most important. Flemish scientist Jan Baptista van Helmont first
used the term gas in his reference to the carbon dioxide content. French physician Gabriel
Venel referred to aerated water, confusing the gas with ordinary air. British scientist Joseph

9 Soft Drinks Intake Behaviour among University Going Students.
Black named the gaseous constituent fixed air. Robert Boyle, an Anglo-Irish philosopher and
scientist who helped found modern chemistry, published his Short Memoirs for the Natural
Experimental History of Mineral Waters in 1685. It included sections on examining mineral
springs, on the properties of the water, on its effects upon the human body, and, lastly, ―of
the imitation of natural medicinal waters by chemical and other artificial ways.‖
Numerous reports of experiments and investigations were included in the Philosophical
Transactions of the Royal Society of London in the late 1700s, including the studies
of Stephen Hales, Joseph Black, David Macbride, William Brownrigg, Henry Cavendish, and
Thomas Lane.
Fig 1.2: Soft Drinks
English clergyman and scientist Joseph Priestley is nicknamed ―the father of the soft drinks
industry‖ for his experiments on gas obtained from the fermenting vats of a brewery. In 1772
he demonstrated a small carbonating apparatus to the College of Physicians in London,
suggesting that, with the aid of a pump, water might be more highly impregnated with fixed
air. French chemist Antoine-Laurent Lavoisier made the same suggestion in 1773.
To Thomas Henry, an apothecary in Manchester, England, is attributed the first production of
carbonated water, which he made in 12-gallon barrels using an apparatus based on Priestley‘s
design. Swiss jeweler Jacob Schweppe read the papers of Priestley and Lavoisier and
determined to make a similar device. By 1794 he was selling his highly carbonated
artificial mineral waters to his friends in Geneva; later he started a business in London.

10 Soft Drinks Intake Behaviour among University Going Students.
Fig 1.3: Advertisement of Soft drinks
At first, bottled waters were used medicinally, as evidenced in a letter written by English
industrialist Matthew Boulton to philosopher Erasmus Darwin in 1794. J. Schweppe prepares
his mineral waters of three sorts. No. 1 is for common drinking with your dinner. No. 2 is for
nephritick patients and No. 3 contains the most alkali given only in more violent cases‖. By
about 1820, improvements in manufacturing processes allowed a much greater output, and
bottled water became popular. Mineral salts and flavours were added—ginger about 1820,
lemon in the 1830s, tonic in 1858. In 1886 John Pemberton, a pharmacist in Atlanta, Georgia,
invented Coca-Cola, the first cola drink. (Encyclopedia Britannica, 2017)
1.3 Origin of the Name of Soft Drinks
The word ‗soft drink‘ owes its origin to simple advertising. The makers of artificial (and
natural) flavored carbonated beverages were having a difficult time marketing their product
nationally thanks to the fact that the name for these beverages varied from region to region
and even city to city. For instance, in different parts of the United States and Canada,
flavored carbonated beverages can be referred to as pop, and in other parts, soda, in yet other
parts there are other names. Internationally, it‘s even more difficult. For example, in England
soft drinks are called ―fizzy drinks‖ in Ireland they were called ―minerals‖. So because they
couldn‘t refer to their product in the generic sense on national (or international)
advertisements, the manufactures chose the term ―soft drink‖ to be more or less a universal
term for their non-alcoholic carbonated beverages. However, according to study carried out
in 2006, research showed that most carbonated soft drinks actually do contain trace amounts
of alcohol. (Zidbits - Learn something new everyday!, 2017)

11 Soft Drinks Intake Behaviour among University Going Students.
1.4 Ingredients of Soft Drinks
1.4.1 Acids:
Acids are used in soft drinks for two main reasons. To slow the growth of micro-organisms
(yeasts, moulds and bacteria).To improve the taste of a drink by balancing the sweetness. The
three most commonly used acids are:
Citric Acid (E330) - the natural acid in citrus fruits
Malic Acid (E296) - the natural acid in apple
Phosphoric acid (E338) – traditionally used in colas
1.4.2 Carbon dioxide (CO2):
Carbon dioxide is used to put the fizziness in soft drinks. It is a non-toxic, inert, virtually
tasteless gas. The amount of carbon dioxide added is dependent upon the type of soft drink.
Lightly carbonated drinks are usually fruity, lemonade and colas have medium carbonation
and mixers, like tonic water, are highly carbonated. Carbon dioxide can occur naturally and
some bottled waters are naturally sparkling.
1.4.3 Colours:
Colours are used in soft drinks to make the product more aesthetically appealing and help
preserve the identity or character by which drinks are recognized. There are three basic
categories of colourings. Natural colours, artificial colours and caramels.
1.4.3.1 Natural colours:
These can be extracted from plants, fruits and vegetables and can also be manufactured
synthetically. There are two main categories:
1. Carotenoids – which give a range of yellow to orange colours
12 Soft Drinks Intake Behaviour among University Going Students.
2. Anthocyanins – which give a range of bright red to purple colours
1.4.3.2 Artificial colours:
A full range of colours can be obtained, blue, green, red, yellow etc. All permitted artificial
colours used in soft drinks have been thoroughly tested and approved as safe. However, due
to increasing consumer preference for natural colours, the trend in the UK market in recent
years has been for manufacturers and retailers to reduce the use of artificial colours in their
products.
1.4.4 Caramel
Caramels are one of the oldest and most widely used colours. They are used in cola and
ginger ale drinks and can also be used in beer and shandies.
1.4.5 Flavourings
Flavours are present in virtually every soft drink. They may be obtained from natural or
artificial sources and are used to respond to increasing consumer demands for a wide
spectrum of different tasting foods and drinks. Natural flavours are derived from a wide
range of fruits, vegetables, nuts, bark, leaves, herbs, spices and oils. Artificial flavours are
manufactured synthetically.
1.4.6 Intense sweeteners
Intense sweeteners are non-sugar substances that can be added to food and drink products
instead of sugar. They are many times sweeter than sugar which means that much lower
quantities are needed to give a product the desired sweet taste. The development in use of
intense sweeteners dates back to the First World War when the supply of sugar was limited.
Manufacturers have found that blending different intense sweeteners, sometimes with sugar,
can lead to better product taste profiles. For this reason, many manufacturers use blends of
sweeteners rather than one single intense sweetener in their drinks. The most commonly used
intense sweeteners in UK soft drinks are:
Acesulfame-K (E950)

13 Soft Drinks Intake Behaviour among University Going Students.
Aspartame (E951)
Saccharin (E954)
Steviol Glycosides (E960)
Sucralose (E955)
1.4.6 Preservatives
Preservatives allow products to have a longer shelf life by slowing or stopping the growth of
micro-organisms (yeasts, moulds and bacteria). Not all soft drinks contain preservatives; the
need for a preservative depends on the type of product and the processing used. Soft drinks
containing fruit juice and sugar typically need preservative to prevent microbiological
spoilage. There are four permitted preservative for soft drinks. Benzoates (E210-E213),
Sorbates (E200-E203), Suphite (E220-E228), Dimethyldicarbonate (E242).
1.4.7 Sugars (sucrose, glucose and fructose)
Sweetness in soft drinks has traditionally been provided by sugar (sucrose) extracted from
beet or cane. In the presence of acid, as in soft drinks, sucrose (a disaccharide of glucose and
fructose) will hydrolyses to form an equal mixture of the mono saccharide glucose and
fructose. Therefore in soft drinks, you will find a mixture of the three sugars. This also
happens to the sucrose in fruit juices. Glucose and fructose syrups may also be used to give
sweetness. All sugars have the same calorific content approx. 4kcals/g but have different
levels of sweetness, e.g. fructose is slightly sweeter than sucrose and glucose is less sweet
than sucrose.
1.4.8 Water
Water is the main ingredient in all drinks; for carbonates it is around 90% of a regular
product and 98% of a low calorie product. The majority of the water used in soft drinks
production comes from mains water. However, spring water or natural mineral water may be
used and this is indicated on the product label. If mains water is used it must undergo further
treatment before it can be used for production. This is because the water in a soft drink acts
14 Soft Drinks Intake Behaviour among University Going Students.
as the solvent for all the other ingredients; therefore its quality is of prime importance. Each
soft drink company will have its own treated water requirements covering physical, chemical
and microbiological and taste characteristics. (Britishsoftdrinks.com, 2017)
1.5 Statistical Data on Consumption of Soft Drinks
Soft drinks can be part of a healthy and balanced lifestyle because they are important
contributors to hydration and light beverages can be an integral part of weight loss plans.
Soft drinks are available in a wide variety of flavours, formats and packaging to suit every
drinking occasion. No- and low-calorie drinks now account for up to 30% of sales in many
European markets and enable people to refresh themselves without any sugar or calories.
Published data shows that soft drinks contribute just 3% of calories to the daily diet of the
average European and recent studies demonstrate the efficacy of no-calorie soft drinks in
achieving weight loss as part of a calorie controlled diet. Soft drinks play an essential role in
hydration. Keeping the body well hydrated is important in ensuring optimum mental and
physical functioning in humans. It is recommended that we consume 2-3 litres of fluid each
day, comprising both drinks and foods such as fruit and vegetables. (Unesda, 2017)
The non-alcoholic beverages industry encompasses liquid refreshment beverages (LRB) such
as bottled water, carbonated soft drinks, energy drinks, fruit beverages, ready-to-drink coffee
and tea, sports beverages and value-added water. The dollar sales of this category amounted
to 1,079.2 billion U.S. dollars worldwide in 2014. Within the segment, carbonated soft
drinks were responsible for the lion's share of global sales. A comparison of the world
regions revealed, that the consumption patterns of full calorie and diet soft drinks strongly
differ among the nations. In North America, for example, 69 percent of all soft drinks are
consumed as the full calorie version. (www.statista.com, 2017)
Statistic depicts the per capita consumption of soft drinks in the United States from 2010 to
2015. In 2015, some 40.7 gallons of soft drinks were consumed per capita, down from 45.5
gallons per capita in 2010. In 2016, energy drinks accounted for a market share of about 10.2
percent of the U.S. soft drink segment. (Statista, 2017)
15 Soft Drinks Intake Behaviour among University Going Students.
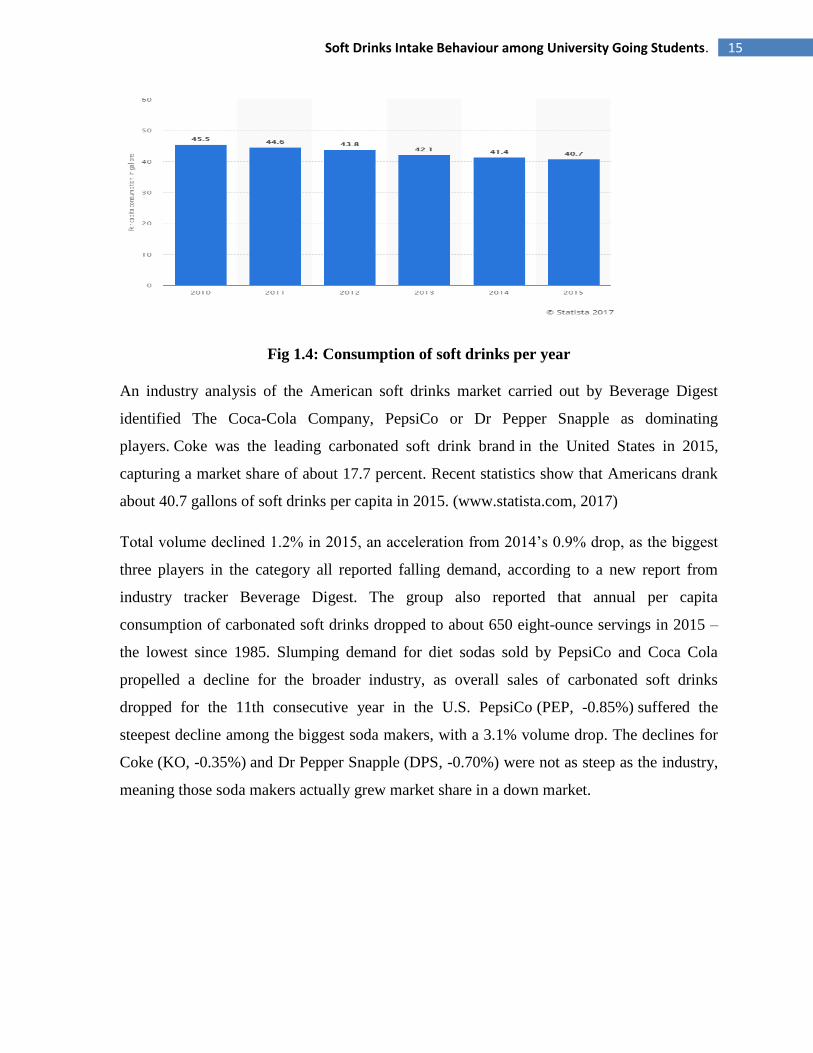
Fig 1.4: Consumption of soft drinks per year
An industry analysis of the American soft drinks market carried out by Beverage Digest
identified The Coca-Cola Company, PepsiCo or Dr Pepper Snapple as dominating
players. Coke was the leading carbonated soft drink brand in the United States in 2015,
capturing a market share of about 17.7 percent. Recent statistics show that Americans drank
about 40.7 gallons of soft drinks per capita in 2015. (www.statista.com, 2017)
Total volume declined 1.2% in 2015, an acceleration from 2014‘s 0.9% drop, as the biggest
three players in the category all reported falling demand, according to a new report from
industry tracker Beverage Digest. The group also reported that annual per capita
consumption of carbonated soft drinks dropped to about 650 eight-ounce servings in 2015 –
the lowest since 1985. Slumping demand for diet sodas sold by PepsiCo and Coca Cola
propelled a decline for the broader industry, as overall sales of carbonated soft drinks
dropped for the 11th consecutive year in the U.S. PepsiCo (PEP, -0.85%) suffered the
steepest decline among the biggest soda makers, with a 3.1% volume drop. The declines for
Coke (KO, -0.35%) and Dr Pepper Snapple (DPS, -0.70%) were not as steep as the industry,
meaning those soda makers actually grew market share in a down market.
16 Soft Drinks Intake Behaviour among University Going Students.
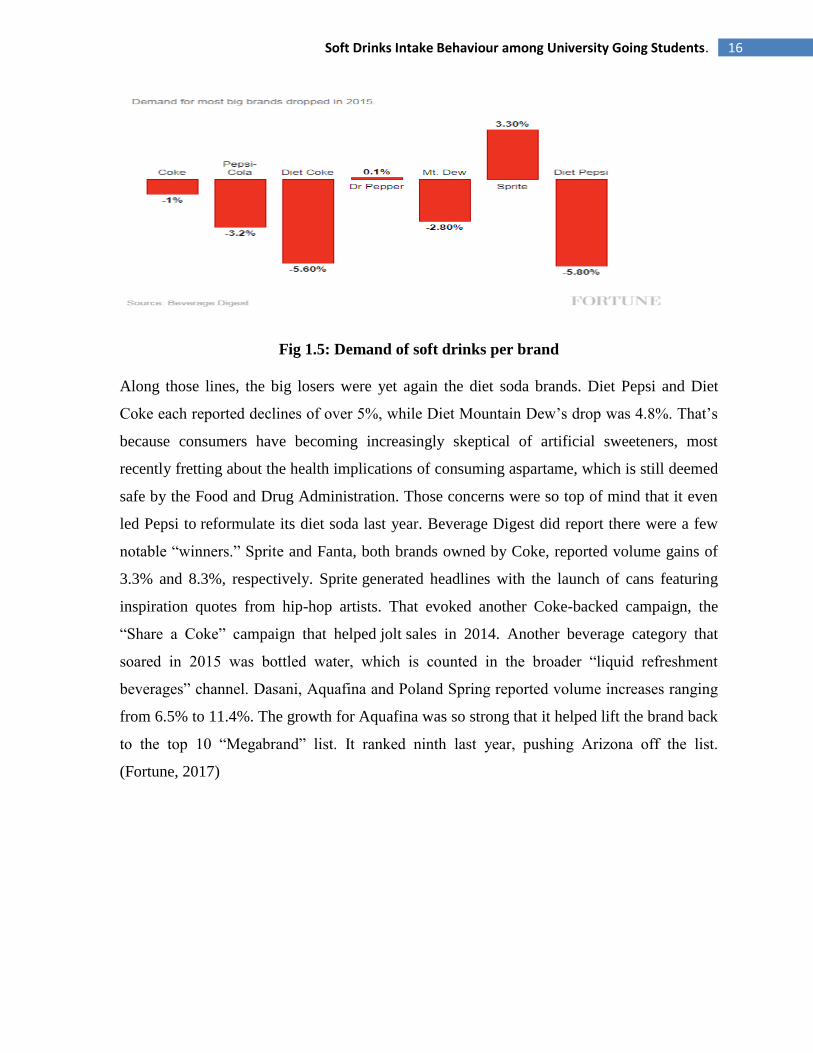
Fig 1.5: Demand of soft drinks per brand
Along those lines, the big losers were yet again the diet soda brands. Diet Pepsi and Diet
Coke each reported declines of over 5%, while Diet Mountain Dew‘s drop was 4.8%. That‘s
because consumers have becoming increasingly skeptical of artificial sweeteners, most
recently fretting about the health implications of consuming aspartame, which is still deemed
safe by the Food and Drug Administration. Those concerns were so top of mind that it even
led Pepsi to reformulate its diet soda last year. Beverage Digest did report there were a few
notable ―winners.‖ Sprite and Fanta, both brands owned by Coke, reported volume gains of
3.3% and 8.3%, respectively. Sprite generated headlines with the launch of cans featuring
inspiration quotes from hip-hop artists. That evoked another Coke-backed campaign, the
―Share a Coke‖ campaign that helped jolt sales in 2014. Another beverage category that
soared in 2015 was bottled water, which is counted in the broader ―liquid refreshment
beverages‖ channel. Dasani, Aquafina and Poland Spring reported volume increases ranging
from 6.5% to 11.4%. The growth for Aquafina was so strong that it helped lift the brand back
to the top 10 ―Megabrand‖ list. It ranked ninth last year, pushing Arizona off the list.
(Fortune, 2017)
17 Soft Drinks Intake Behaviour among University Going Students.
1.6 Different Types of Soft Drinks
1.6.1 Pasteurizing noncarbonated beverages
Noncarbonated beverages require ingredients and techniques similar to those for carbonated
beverages. However, since they lack the protection against spoilage afforded by carbonation,
these are usually pasteurized, either in bulk, by continuous flash pasteurization prior to
filling, or in the bottle.
1.6.2 Powdered soft drinks
These are made by blending the flavouring material with dry acids, gums, artificial colour,
etc. If the sweetener has been included, the consumer need only add the proper amount of
plain or carbonated water.
1.6.3 Iced soft drinks
The first iced soft drink consisted of a cup of ice covered with a flavoured syrup.
Sophisticated dispensing machines now blend measured quantities of syrup with carbonated
or plain water to make the finished beverage. To obtain the soft ice, or slush, the machine
reduces the beverage temperature to between −5 and −2 °C (22 and 28 °F). (Encyclopedia
Britannica, 2017)
1.7 Reasons Why People Drink Soft Drink
1.7.1 Soft drinks are very tasty
The taste could be the thing that gets people addicted to drinking soft drinks because it is
delicious. In fact, soda is so good, that many people drink it with every meal!
(Emedexpert.com, 2017)
1.7.2 Soft drinks are available everywhere
Even if you wanted to drink something else, you would be hard-pressed to find it as
prominently displayed in vending machines, at fast-food chains, and supermarket checkouts.

18 Soft Drinks Intake Behaviour among University Going Students.
You might not realize how ubiquitous Coke, Pepsi, and the like are in our society until you
try to stop drinking soda. (Emedexpert.com, 2017)
1.7.3 Soft drinks are more convenience
The other addictive thing about soda is the convenience. If you are in rush hour most of us
almost always are - it is so easy to grab a can and convenient to drink. (Emedexpert.com,
2017)
1.7.4 Promotion and Advertising
Soft drinks are heavily consumed in part because they are vigorously promoted - Billions of
dollars are spend on advertising sodas and market them everywhere - in stores, restaurants,
gas stations, museums, and even schools. (Emedexpert.com, 2017)
1.7.5 Habit of consuming soft drinks
For some people, drinking several sodas a day is a force of habit. You know drinking soda is
a habit when you find yourself going to the grocery store at 10 p.m. because your refrigerator
is tapped out. (Emedexpert.com, 2017)
1.7.6 It Is Cheap
Soda may be pretty inexpensive when compared with fruit juice and milk. With combo
meals, a large soda is only an extra dollar, and you get fries! (Emedexpert.com, 2017)
1.7.7 Thirst
Often people drink soda to quench the thirst. However, this is probably the worst time to
drink soda, because when you are very thirsty or dehydrated you have low levels of saliva.
And saliva helps to neutralize acids (soda is the most acidic beverage you can buy, actually)
and wash your teeth clean. (Emedexpert.com, 2017)

19 Soft Drinks Intake Behaviour among University Going Students.
1.7.8 Caffeine Addiction
Many soft drinks contain caffeine which is mildly addictive. This fact is part of the reason
why soda is such a hard habit to break. If you're addicted to the caffeine in soda, you're really
having two habits - the soda habit and the caffeine habit. (Emedexpert.com, 2017)
1.8 Complication of Consuming Soft Drinks & Reasons to Stop
Drinking Soft Drinks
1.8.1 Soda Is Useless
First of all, there are no nutritionally beneficial components in soft drinks. They mostly
consist of filtered water and refined sugars. Yet the average American drinks about 41
gallons of soft drinks each year. (Emedexpert.com, 2017)
1.8.2 Weight Gain & Obesity
Many people either forget or don't realize how many extra calories they consume in what
they drink. Drinking a single 330 ml can a day of sugary drinks translates to more than 1lb of
weight gain every month. (Emedexpert.com, 2017)
Dr. Frank Hu, Professor of Nutrition and Epidemiology at Harvard School of Public Health,
recently made a strong case that there is sufficient scientific evidence that decreasing sugar-
sweetened beverage consumption will reduce the prevalence of obesity and obesity-related
diseases. (The Nutrition Source, 2017)
Several scientific studies have provided experimental evidence that soft drinks are directly
related to weight gain. The relationship between soft drink consumption and body weight is
so strong that researchers calculate that for each additional soda consumed, the risk of
obesity increases 1.6 times. And not only that, intake of sugar-sweetened beverages is
strongly associated with accumulation of fat around the abdominal area. On the other hand,
according to the results of high quality study, reducing consumption of sugar-sweetened
beverages helped reduce body mass index in the heaviest teenagers. (Emedexpert.com, 2017)
20 Soft Drinks Intake Behaviour among University Going Students.
1.8.3 Diabetes
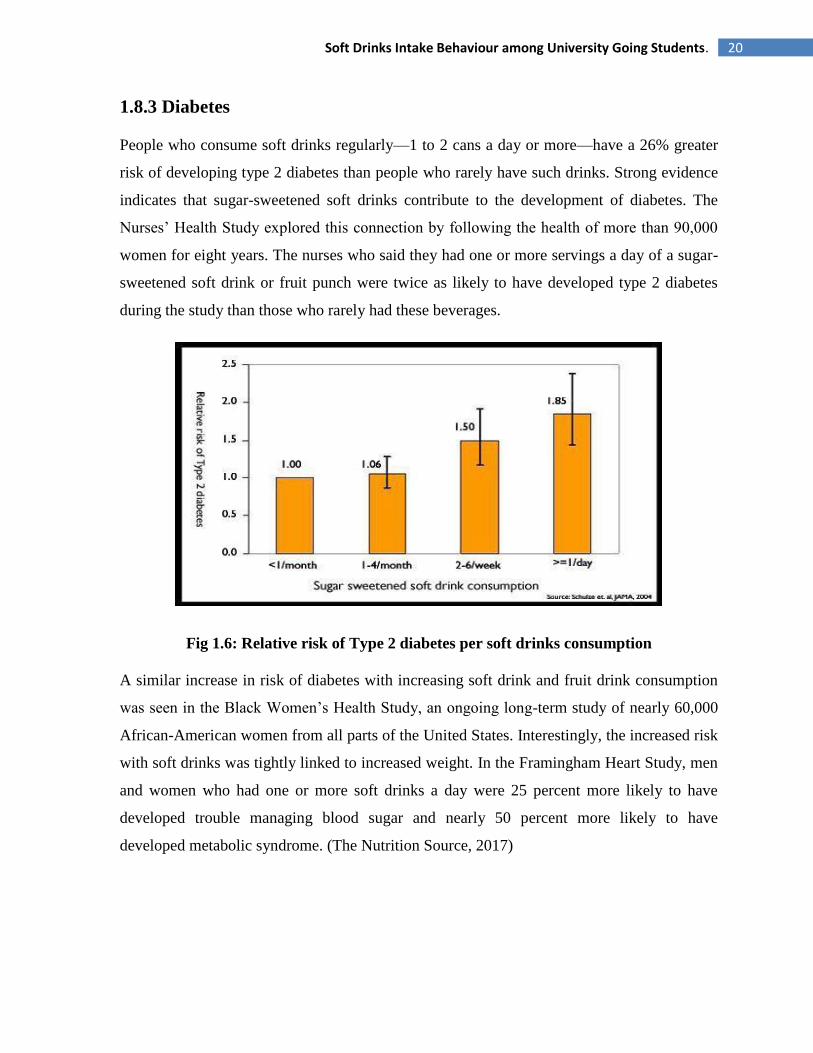
People who consume soft drinks regularly—1 to 2 cans a day or more—have a 26% greater
risk of developing type 2 diabetes than people who rarely have such drinks. Strong evidence
indicates that sugar-sweetened soft drinks contribute to the development of diabetes. The
Nurses‘ Health Study explored this connection by following the health of more than 90,000
women for eight years. The nurses who said they had one or more servings a day of a sugar-
sweetened soft drink or fruit punch were twice as likely to have developed type 2 diabetes
during the study than those who rarely had these beverages.
Fig 1.6: Relative risk of Type 2 diabetes per soft drinks consumption
A similar increase in risk of diabetes with increasing soft drink and fruit drink consumption
was seen in the Black Women‘s Health Study, an ongoing long-term study of nearly 60,000
African-American women from all parts of the United States. Interestingly, the increased risk
with soft drinks was tightly linked to increased weight. In the Framingham Heart Study, men
and women who had one or more soft drinks a day were 25 percent more likely to have
developed trouble managing blood sugar and nearly 50 percent more likely to have
developed metabolic syndrome. (The Nutrition Source, 2017)

21 Soft Drinks Intake Behaviour among University Going Students.
1.8.4 Weakened Bones and Risk of Osteoporosis
Frequent consumption of soft drinks may also increase the risk of osteoporosis, especially in
people who substitute calcium-rich milk with soft drinks. High soft drinks consumption
(particularly cola) in children poses a significant risk factor for impaired calcification of
growing bones. In the 1950s, children drank 3 cups of milk for every 1 cup of sugary drinks.
Today that ratio is reversed: 3 cups of sugary drinks for every cup of milk. Tellingly,
osteoporosis is a major health threat for 44 million Americans. Most experts now say that the
real culprit is soda's displacement of milk in the diet, though some scientists believe that the
acidity of colas may be weakening bones by promoting the loss of calcium.
(Emedexpert.com, 2017)
1.8.5 Soft drinks and heart disease
A study that followed 40,000 men for two decades found that those who averaged one can of
a sugary beverage per day had a 20% higher risk of having a heart attack or dying from a
heart attack than men who rarely consumed sugary drinks. A related study in women found a
similar sugary beverage–heart disease link. The Nurses‘ Health Study, which tracked the
health of nearly 90,000 women over two decades, found that women who drank more than
two servings of sugary beverage each day had a 40 percent higher risk of heart attacks or
death from heart disease than women who rarely drank sugary beverages. People who drink a
lot of sugary drinks often tend to weigh more—and eat less healthfully—than people who
don‘t drink sugary drinks, and the volunteers in the Nurses‘ Health Study were no exception.
But researchers accounted for differences in diet quality, energy intake, and weight among
the study volunteers. They found that having an otherwise healthy diet, or being at a healthy
weight, only slightly diminished the risk associated with drinking sugary beverages.
This suggests that weighing too much, or simply eating too many calories, may only partly
explain the relationship between sugary drinks and heart disease. Some risk may also be
attributed to the metabolic effects of fructose from the sugar or HFCS used to sweeten these
beverages.
22 Soft Drinks Intake Behaviour among University Going Students.
The adverse effects of the high glycemic load from these beverages on blood glucose,
cholesterol fractions, and inflammatory factors probably also contribute to the higher risk of
heart disease. Read more about blood sugar and glycemic load. (The Nutrition Source, 2017)
1.8.6 Dental Caries and Erosion
Soft drinks eat up and dissolve the tooth enamel. Researchers say that soft drinks are
responsible for doubling or tripling the incidence of tooth decay. The acidity can dissolve the
mineral content of the enamel, making the teeth weaker, more sensitive, and more susceptible
to decay. Soft drinks acidity makes it even worse for teeth than the solid sugar found in
candy. Dental experts continue to urge that people drink less soda pop, especially between
meals, to prevent tooth decay and dental erosion. (Emedexpert.com, 2017)
1.8.7 Kidney Damage
There is good evidence that specifically cola beverages can increase the risk of kidney
problems, more so than non-cola sodas. Researches clearly demonstrated that large quantities
of cola result in enhanced kidney stone formation. If you're wondering exactly how soft
drinks cause kidney stones, it's because of their acidity and radical mineral imbalances. Your
body must buffer the acidity of soft drinks with calcium from your own bones. As this
calcium is eliminated through your urine, it slowly forms kidney stones. In a study published
in the Epidemiology journal, the team compared the dietary habits of 465 people with
chronic kidney disease and 467 healthy people. After controlling for various factors, the team
found that drinking two or more colas a day (no matter if it was artificially sweetened or
regular) was linked to a twofold risk of chronic kidney disease. (Emedexpert.com, 2017)
1.8.8 Increased Blood Pressure
Experts have reasons to believe that overconsumption of fructose, particularly in the form of
soft drinks, leads to an increase in blood pressure. (Emedexpert.com, 2017)

23 Soft Drinks Intake Behaviour among University Going Students.
1.8.9 Metabolic Syndrome Risk Factor
Soft drink regular drinking is a significant risk factor for developing of metabolic syndrome,
a combination of the symptoms such as high blood pressure, obesity, high cholesterol, and
insulin resistance. (Emedexpert.com, 2017)
1.8.10 Harmful Effects on Liver
There is evidence that consumption of too many soft drinks puts you under increased risk for
liver cirrhosis - similar to what chronic alcoholics have. (Emedexpert.com, 2017)
1.8.11. Impaired Digestive System
Soft drinks are extremely acidic beverage, with a pH of about 2.5, about the same as vinegar,
but the sugar content disguises the acidity. Throughout the digestive system, that starts from
the mouth and ends up at the anus only the stomach can resist an acidic environment up to
pH 2.0. But before the acidity of soft drink reaches the stomach it passes through the other
organs that precede stomach in the digestive system thus causing an abnormal acidic
environment. The linings of the mouth, pharynx and esophagus are highly sensitive to acids.
The phosphoric acid (H3PO4) present in soft drink competes with the hydrochloric acid (HCl)
of the stomach and affects its functions. When the stomach becomes ineffective, food
remains undigested causing indigestion, gassiness or bloating (swelling of stomach).
(Emedexpert.com, 2017)
1.8.12 Dehydration
The next problem with soft drinks is that they act as dehydrating diuretics. Both caffeine and
sugar cause dehydration. Caffeine is a diuretic and causes an increase in urine volume. And
high concentration of sugar is drawing off water as well because your kidneys try to expel the
excess sugar out of the blood. When you drink a caffeinated soda to quench your thirst, you
will actually become even thirstier. (Emedexpert.com, 2017)
24 Soft Drinks Intake Behaviour among University Going Students.
1.8.13 High Caffeine Content
Avoiding soft drinks will also avoid the unnecessary caffeine. Soft drinks are a major source
of caffeine in the American diet. High doses of caffeine can cause, among others, irritability,
restlessness, tension, insomnia, high blood pressure, gastrointestinal disturbance, excessive
urination, and irregular heartbeat. (Emedexpert.com, 2017)
1.8.14 Toxins - Aspartame
The poison in diet soda is an artificial sweetener aspartame. Aspartame is made up of three
chemicals: aspartic acid, phenylalanine, and methanol. It is used because it's about 200 times
sweeter than table sugar. Despite US FDA approval as a "safe" food additive, aspartame is
one of the most dangerous substances added to foods. After drinking an aspartame-sweetened
product, aspartame breaks down into its starting components: phenylalanine, aspartic acid,
and methanol (that further converts to formaldehyde and formic acid, which are known
carcinogens.). There are over 92 different health side effects associated with aspartame
consumption. (Emedexpert.com, 2017)
1.8.15 Cell Damage
A new health scare erupted over soft drinks recently amid evidence that they may cause
serious cell damage and accelerate cell aging. Research from a British university suggests a
common preservative E211, known as sodium benzoate, found in drinks such as Fanta and
Pepsi Max has the ability to switch off vital parts of DNA. Sodium benzoate occurs in small
amounts naturally in berries, but is used in large quantities to prevent mould in soft drinks.
(Emedexpert.com, 2017)
1.8.16 Other Harmful Effects
Consumption of soft drinks leads to increased risk of asthma and lung disease. Caffeinated
and artificially sweetened soft drinks may increase the risk of early menarche, a risk factor of
several diseases and elevation of uric acid levels, Risk of developing hypertension, mental
health problems. (Emedexpert.com, 2017)

25 Soft Drinks Intake Behaviour among University Going Students.
CHAPTER-2
LITERATURE
REVIEW
26 Soft Drinks Intake Behaviour among University Going Students.
2.1 Soft drinks and 'desire to drink' in preschoolers
Interest in soft drink consumption has increased following a dramatic rise in intake over
recent years. Research to date has focused primarily on general trends in consumption or on
understanding the mechanism by which soft drink consumption may be linked to weight
gain. It is clear however that there is considerable individual variability in the extent to which
soft drinks are consumed and factors potentially influencing intake have received little
attention. This study examines how the Child Eating Behaviour Questionnaire (CEBQ)
construct 'Desire to Drink' (DD) relates to drink consumption, preferences and BMI-SDS.
Three hundred and forty six same-sex twin children (mean age 11.2 years; s.d. 0.54; 56%
female; 53% dizygotic) were weighed, measured and reported their liking for milk, water,
fruit juice, fruit squash and sweetened soft drinks. Mothers reported on their child's drink
consumption and completed the CEBQ. Scores on the CEBQ DD subscale were not
significantly related to child BMI-SDS in this sample. Children scoring higher on DD had
higher preferences for sugar-sweetened soft drinks (p = 0.016), fruit squash (p = 0.042) and
milk (p = 0.020) than children scoring lower on the scale. DD was also positively related to
more frequent consumption of sugar-sweetened soft drinks (p = 0.017) and low calorie soft
drinks (p = 0.003). No relationship was observed between DD scores and liking for or intake
of water or 100% fruit juice. These findings suggest that the construct desire to drink in
children is related to a liking for consuming sweetened drinks, and does not appear to simply
denote greater thirst or hunger. This may have important implications for the ongoing
development of dietary patterns and weight status in the longer term through an increased
preference for sweet things in the mouth and a failure to compensate for calories provided by
drinks. (Sweetman, Wardle and Cooke, 2017)
2.2 Understanding soft drink consumption among female
adolescents using the Theory of Planned Behavior.
This study identified factors that influence regular soda consumption among 707 female
students, aged 13–18 years, attending North Los Angeles County public high schools.
Participants completed a group-administered Theory of Planned Behavior-based

27 Soft Drinks Intake Behaviour among University Going Students.
questionnaire. Almost all of the participants, 96.3%, reported that they currently drink soda;
50.1% reported drinking 2 glasses of soda or more per day during the past year. Students
reported drinking regular soda more than diet soda and reported drinking phosphoric acid-
containing soda more than non-phosphoric acid-containing soda. Attitude, subjective norm
and perceived behavioral control had statistically significant positive associations with
intention, and were each significant predictors of intention to drink regular soda and together
explained 64% of its variance. The strongest predictor was attitude, followed by perceived
behavioral control and subjective norm. Our results suggest that efforts to reduce soda
consumption among female adolescents should include parents and friends. It is also
important that soda should not be excessively available at home or widely accessible to
teenagers at schools. Healthy eating messages for adolescents need to be developed and
incorporated into existing and future campaigns to reinforce the perception that there are
other healthier drinks that quench thirst and that taste good as well. (Nada O. Kassem and
Jerry W. Lee, 2017)
2.3 Effects of Soft Drink Consumption on Nutrition and Health:
A Systematic Review and Meta-Analysis
In a meta-analysis of 88 studies, we examined the association between soft drink
consumption and nutrition and health outcomes. We found clear associations of soft drink
intake with increased energy intake and body weight. Soft drink intake also was associated
with lower intakes of milk, calcium, and other nutrients and with an increased risk of several
medical problems (e.g., diabetes). Study design significantly influenced results: larger effect
sizes were observed in studies with stronger methods (longitudinal and experimental vs.
cross-sectional studies). Several other factors also moderated effect sizes (e.g., gender, age,
beverage type). Finally, studies funded by the food industry reported significantly smaller
effects than did non–industry-funded studies. Recommendations to reduce population soft
drink consumption are strongly supported by the available science. (Lenny R. Vartanian,
,Marlene B. Schwartz and Kelly D. Brownell, 2017)
28 Soft Drinks Intake Behaviour among University Going Students.
2.4 Intake of sugar-sweetened beverages and weight gain: a
systematic review1, 2, 3
Consumption of sugar-sweetened beverages (SSBs), particularly carbonated soft drinks, may
be a key contributor to the epidemic of overweight and obesity, by virtue of these beverages'
high added sugar content, low satiety, and incomplete compensation for total energy.
Whether an association exists between SSB intake and weight gain is unclear. We searched
English-language MEDLINE publications from 1966 through May 2005 for cross-sectional,
prospective cohort and experimental studies of the relation between SSBs and the risk of
weight gain (i.e., overweight, obesity, or both). Thirty publications (15 cross-sectional, 10
prospective, and 5 experimental) were selected on the basis of relevance and quality of
design and methods. Findings from large cross-sectional studies, in conjunction with those
from well-powered prospective cohort studies with long periods of follow-up, show a
positive association between greater intakes of SSBs and weight gain and obesity in both
children and adults. Findings from short-term feeding trials in adults also support an
induction of positive energy balance and weight gain by intake of sugar-sweetened sodas, but
these trials are few. A school-based intervention found significantly less soft-drink
consumption and prevalence of obese and overweight children in the intervention group than
in control subjects after 12 month and a recent 25-week randomized controlled trial in
adolescents found further evidence linking SSB intake to body weight. The weight of
epidemiologic and experimental evidence indicates that a greater consumption of SSBs is
associated with weight gain and obesity. Although more research is needed, sufficient
evidence exists for public health strategies to discourage consumption of sugary drinks as
part of a healthy lifestyle. (Vasanti S Malik, Matthias B Schulze and Frank B Hu, 2017)
2.5 Soft Drink Consumption and Risk of Developing
Cardiometabolic Risk Factors and the Metabolic Syndrome in
Middle-Aged Adults in the Community.
Consumption of soft drinks has been linked to obesity in children and adolescents, but it is
unclear whether it increases metabolic risk in middle-aged individuals. We related the
29 Soft Drinks Intake Behaviour among University Going Students.
incidence of metabolic syndrome and its components to soft drink consumption in
participants in the Framingham Heart Study (6039 person-observations, 3470 in women;
mean age 52.9 years) who were free of baseline metabolic syndrome. Metabolic syndrome
was defined as the presence of ≥3 of the following: waist circumference ≥35 inches (women)
or ≥40 inches (men); fasting blood glucose ≥100 mg/dL; serum triglycerides ≥150 mg/dL;
blood pressure ≥135/85 mm Hg; and high-density lipoprotein cholesterol <40 mg/dL (men)
or <50 mg/dL (women). Multivariable models included adjustments for age, sex, physical
activity, smoking, dietary intake of saturated fat, trans fat, fiber, magnesium, total calories,
and glycemic index. Cross-sectionally, individuals consuming ≥1 soft drink per day had a
higher prevalence of metabolic syndrome (odds ratio [OR], 1.48; 95% CI, 1.30 to 1.69) than
those consuming <1 drink per day. On follow-up (mean of 4 years), new-onset metabolic
syndrome developed in 765 (18.7%) of 4095 participants consuming <1 drink per day and in
474 (22.6%) of 2059 persons consuming ≥1 soft drink per day. Consumption of ≥1 soft drink
per day was associated with increased odds of developing metabolic syndrome (OR, 1.44;
95% CI, 1.20 to 1.74), obesity (OR, 1.31; 95% CI, 1.02 to 1.68), increased waist
circumference (OR, 1.30; 95% CI, 1.09 to 1.56), impaired fasting glucose (OR, 1.25; 95%
CI, 1.05 to 1.48), higher blood pressure (OR, 1.18; 95% CI, 0.96 to 1.44),
hypertriglyceridemia (OR, 1.25; 95% CI, 1.04 to 1.51), and low high-density lipoprotein
cholesterol (OR, 1.32; 95% CI 1.06 to 1.64). In middle-aged adults, soft drink consumption is
associated with a higher prevalence and incidence of multiple metabolic risk factors.
(Dhingra, Sullivan and Jacques, 2017)
2.6 Factors associated with soft drink consumption in school-aged
children.
To identify factors associated with nonalcoholic carbonated beverage (soft drink)
consumption in children. Mail-in surveys collected by Dragonfly, a children‘s educational
magazine distributed nationally to elementary and middle schools, were analyzed. The
survey included questions about frequency of soft drink consumption and factors related to
soft drink consumption. The sample consisted of 560 children, 8 to 13 years old, who
completed and mailed in the survey. There was an equal distribution of boys and girls (51%
and 49%, respectively). Preference for the taste of soft drinks was the strongest predictor in

30 Soft Drinks Intake Behaviour among University Going Students.
the analysis, with those who reported the strongest taste preference 4.50 times more likely
(95% confidence interval=2.89–7.04) to consume soft drinks five or more times per week
than those with a lower taste preference. Youth whose parents regularly drank soft drinks
were 2.88 times more likely (95% confidence interval=1.76–4.72) to consume soft drinks
five or more times per week compared with those whose parents did not regularly drink soft
drinks. Results suggest that several factors may be associated with soft drink intake in
school-aged children, most notably taste preferences, soft drink consumption habits of
parents and friends, soft drink availability in the home and school, and television viewing.
Additional research is needed to verify these findings in a representative sample of children.
(Grimm, Harnack and Story, 2017)
2.7 Carbonated Soft Drink Consumption and Bone Mineral
Density in Adolescence: The Northern Ireland Young Hearts
Project.
In an observational study of 1335 boys and girls aged 12 and 15 years, higher intakes of
carbonated soft drinks (CSDs) were significantly associated with lower bone mineral density
at the heel, but only in girls. Owing to the upward trend in CSD intake in adolescence, this
finding may be of concern. High consumption of carbonated soft drinks (CSD) during
adolescence may reduce bone mineral accrual and increase fracture risk. The aim of this
study was to examine the relationship between CSD consumption and bone mineral density
(BMD) in a representative sample of adolescents. This was a cross-sectional observational
study in 36 post primary schools in Northern Ireland. Participants included 591 boys and 744
girls either 12 or 15 years old. BMD was measured by DXA, and usual beverage
consumption was assessed by the diet history method. Adjusted regression modeling was
used to investigate the influence of CSD on BMD. A significant inverse relationship between
total CSD intake and BMD was observed in girls at the dominant heel (β, −0.099; 95% CI,
−0.173 to −0.025). Non-cola consumption was inversely associated with dominant heel BMD
in girls (β, −0.121; 95% CI, −0.194 to −0.048), and diet drinks were also inversely associated
with heel BMD in girls (β, −0.087; 95% CI, −0.158 to −0.016). However, no consistent
relationships were observed between CSD intake and BMD in boys. Cola consumption and
31 Soft Drinks Intake Behaviour among University Going Students.
nondiet drinks were not significantly related to BMD in either sex. CSD consumption seems
to be inversely related to BMD at the dominant heel in girls. It is possible that the apparent
association results from the displacement of more nutritious beverages from the diet.
Although the inverse association observed between CSD consumption and BMD is modest
and confined to girls, this finding may have important public health implications given the
widespread use and current upward trend in CSD consumption in Western populations.
(McGartland et al., 2017)
2.8 Soft Drink Consumption Linked with Fatty Liver in the
Absence of Traditional Risk Factors.
Little is known about dietary habits and their relationships with liver disease in nonalcoholic
fatty liver disease (NAFLD) patients, particularly in the absence of obesity, diabetes or
hyperlipidemia. To assess the association between soft drink consumption and the presence
of fatty liver in NAFLD patients who do not have classic risk factors. Three hundred ten
patients with NAFLD diagnosed by ultrasound were assessed for 36 months in a cross-
sectional manner. Thirty-one patients (10%) who had NAFLD without classic risk factors
were compared with 30 healthy controls. Physical activity was assessed during the preceding
week and year, and every six months for 36 months. Data on daily dietary intake of food and
soft drink, and the source of added sugar were collected during two seven-day periods, at the
beginning of the study, and within two weeks after the metabolic tests by using a validated
food questionnaire given by a trained dietician. Insulin resistance and lipid peroxidation were
assessed by homeostasis model assessment-insulin resistance index (HOMA-IRI) and
malondialdehyde (MDA) levels, respectively. Eighty per cent of patients (25 of 31)
consumed an excessive amount of soft drink beverages (more than 50 g/day of added sugar)
for 36 months, compared with 20% in healthy controls (P<0.001). Twenty per cent of
patients consumed one drink per day, 40% consumed two to three drinks per day, and 40%
consumed more than four drinks per day for most days during 36 months. The most common
soft drinks consumed were regular Coca-Cola (40% of patients), Diet Coke (40%) and
flavoured fruit juices (20%). Ultrasound findings revealed mild fatty liver in 44% of cases
(n=14), moderate fatty liver in 38% (n=12), and severe fatty liver in 18% (n=5). HOMA-IRI

32 Soft Drinks Intake Behaviour among University Going Students.
and MDA levels were significantly higher in patients with NAFLD than in healthy controls
(HOMA-IRI, 3.7 versus 1.7, P<0.001; and MDA, 420±300 μmol/mL versus 200±100
μmol/mL; P<0.001). When controlled for other factors, including dietary composition and
physical activity, soft drink beverage consumption was the only independent variable that
was able to predict the presence of fatty liver in 82.5% of cases with a sensitivity of 100%, a
specificity of 76%, a positive predictive value of 57% and a negative predictive value of
100%.The present study may add important insight into the role of sugar-sweetened beverage
consumption as a cause of fatty liver in patients without risk factors. Patients are encouraged
to change their long-standing drinking behaviour. (Assy et al., 2017)
2.9 Relationship of Soft Drink Consumption to Global
Overweight, Obesity, and Diabetes: A Cross-National Analysis of
75 Countries.
We estimated the relationship between soft drink consumption and obesity and diabetes
worldwide. We used multivariate linear regression to estimate the association between soft
drink consumption and overweight, obesity, and diabetes prevalence in 75 countries,
controlling for other foods (cereals, meats, fruits and vegetables, oils, and total calories),
income, urbanization, and aging. Data were obtained from the Euromonitor Global Market
Information Database, the World Health Organization, and the International Diabetes
Federation. Bottled water consumption, which increased with per-capita income in parallel to
soft drink consumption, served as a natural control group. Soft drink consumption increased
globally from 9.5 gallons per person per year in 1997 to 11.4 gallons in 2010. A 1% rise in
soft drink consumption was associated with an additional 4.8 overweight adults per 100
(adjusted B; 95% confidence interval [CI] = 3.1, 6.5), 2.3 obese adults per 100 (95% CI = 1.1,
3.5), and 0.3 adults with diabetes per 100 (95% CI = 0.1, 0.8). These findings remained
robust in low- and middle-income countries. Soft drink consumption is significantly linked to
overweight, obesity, and diabetes worldwide, including in low- and middle-income countries.
(Sanjay Basu, Martin McKee and Gauden Galea, 2017)
33 Soft Drinks Intake Behaviour among University Going Students.
2.10 Sugary drink consumption and dental caries in New South
Wales teenagers.
The consumption of water, milk and various sugary drinks and their relationship with the
caries experience of a random sample of teenagers aged 14 to 15 years living in New South
Wales, Australia was investigated. Data were obtained from both clinical and questionnaire
components of the NSW Teen Dental Survey, 2010. The analyses allowed for various
demographic and behavioural risk factors using caries experience (DMFT >0) and mean
DMFT as the key outcome variables. Males were more likely than females to consume large
volumes of sugary drinks. Consuming two or more glasses of sugary drinks per day led to
significantly increased caries experience amongst this sample of 14 and 15 year olds. Factors
found to be associated with elevated sugary drink consumption included family income,
gender, and mother's education level. There is a strong correlation between increased caries
experience of NSW teenagers and high levels of consumption of sugary drinks. (Skinner,
Byun and Blinkhorn, 2017)
2.11 Soft drink consumption and urinary stone recurrence: A
randomized prevention trial.
The object of this study was to determine if a strong association between soft drink (soda)
consumption and recurrence of urinary stone disease, found in an earlier case-control study
of adult males, had a causal component. The study sample consisted of 1009 male subjects,
who completed an episode of urinary stone disease, who were aged 18–75 at that time, and
who reported consuming at least 160 ml per day of soft drinks. Half of the subjects were
randomized to refrain from consuming soft drinks, while the remaining subjects served as
controls. The intervention group had an observed 6.4% advantage in actuarial 3 yr freedom
from recurrence (p = 0.023 one-sided) over the control group. One important secondary
finding was that for those who reported at the time of the index stone that their most
consumed drink was acidified by phosphoric acid but not citric acid, the experimental group
had a 15% higher 3 yr recurrence-free rate than the controls, p = 0.002, while for those who
reported at the time of the index stone that their most consumed drink was acidified by citric

34 Soft Drinks Intake Behaviour among University Going Students.
acid with or without phosphoric acid, the experimental group had a similar 3 yr recurrence-
free rate to the controls, p = 0.55. This interaction was significant, p = 0.019. (SHUSTER and
Logan, 2017)
2.12 Patterns of soft drink consumption and primary tooth
extractions in Queensland children.
The authors examined the association of patterns of soft drink consumption and primary
tooth extractions in Queensland children aged 12 years or less. Data were gathered through
the Child Health Surveys conducted by Queensland Health in 2003 and 2008. The analysis
allowed for various demographic characteristics using logistic regression analysis. The data
in both surveys showed an increased risk of tooth extraction in children who had a greater
frequency and amount of soft drink consumption, and those that consumed soft drink
between meals. In 2008, the percentage of children that had soft drink daily or several times a
week had decreased, with an increase in those that never had soft drink. To reduce the risk of
primary tooth extraction due to decay, this paper recommends the continuing moderation of
soft drink consumption frequency and the consumption of soft drinks with, rather than
between, meals. (Slater et al., 2017)
2.13 Risk Indicators for Tooth Loss due to Caries and
Periodontal Disease in Recipients of Free Dental Treatment in an
Adult Population in Bangladesh.
The aims of this study were first to identify the risk indicators for permanent tooth extraction
in patients who were receiving free dental treatment, and second to determine whether or not
the reasons for tooth extraction are related to socio-demographic factors. Materials and
Methods: Bangladeshi adults who visited Dhaka Dental College Hospital participated in this
study. For each extraction, the clinician recorded age, sex, educational status, type of tooth
extracted, dietary habits, oral hygiene, history of smoking and betel quid chewing and
reasons for tooth extraction. A series of bivariate analyses and logistic regression analyses
were carried out to assess the effects of major variables. Results: A total of 868 teeth were
extracted from 582 patients. Among them, 586 (67.5%) of the teeth were extracted due to
35 Soft Drinks Intake Behaviour among University Going Students.
caries and its sequelae, 161 (18.5%) and 121 (13.9%) were extracted for periodontal and
other reasons. Logistic regression analysis revealed that tooth extraction due to caries had
significant associations with age (P = 0.0001), tooth type (P = 0.013), consumption of sweets,
snacks and soft drinks (P = 0.0001 and P = 0.0001, respectively), frequency of teeth cleaning
(P = 0.007) and dental attendance pattern (P = 0.004). For tooth extraction due to periodontal
disease, associations with age (P = 0.001), educational level (P = 0.018), tooth type (P =
0.024), betel quid chewing (P = 0.0001), smoking habit (P = 0.032), method of teeth cleaning
(P = 0.001) and the use of dentifrices (P = 0.024) were statistically significant. In this group
of patients, caries and its sequelae were the most common reasons for extraction of teeth,
followed by periodontal disease. Betel quid chewing, smoking and dietary and oral hygiene
habits were also significant predictors of tooth loss. (Nur Mohammad Monsur, 2017)
2.14 Soft Drink Consumption among US Children and
Adolescents.
To determine whether carbonated soft drink consumption is associated with consumption of
milk, fruit juice, and the nutrients concentrated in these beverages.Data collected as part of
the 1994 Continuing Survey of Food Intakes by Individuals were analyzed. Information on
food and nutrient intake was derived from 2 days of dietary recall data collected via an in-
person interview. Nationally representative sample of people of all ages residing in the
United States (response rate=76.2%). Analyses were restricted to children aged 2 to 18 years
(N=l,810).Statistical analyses performed Logistic regression analyses were conducted to
predict the odds of low milk and juice consumption by soft drink consumption level. To
determine whether intake of select nutrients varied by soft drink consumption, multiple linear
regression modeling was conducted. Analyses were conducted using sample weights and
software appropriate for the survey design. Energy intake was positively associated with
consumption of nondiet soft drinks. For example, mean adjusted energy intake was
1,830 kcal/day for school-aged children who were nonconsumers of soft drinks compared
with 2,018 kcal/day for children in this age group who consumed an average of 9 oz of soda
or more per day. Those in the highest soft drink consumption category consumed less milk
and fruit juice compared with those in the lowest consumption category
36 Soft Drinks Intake Behaviour among University Going Students.
(nonconsumers).Nutrition education messages targeted to children and/or their parents should
encourage limited consumption of soft drinks. Policies that limit children's access to soft
drinks at day care centers and schools should be promoted. (Harnack, Stang and Story, 2017)
2.15 Determinants and patterns of soft drink consumption in
young adults: a qualitative analysis.
To explore knowledge, attitudes and behaviours regarding caloric soft drinks in a group of
young adults attending university and to identify opportunities for a health promotion
intervention aimed at reducing consumption. In-depth, semi-structured focus groups
segmented by gender. Undergraduate University of Sydney students aged 18–30 years
(n 35).Social and environmental cues, intrinsic qualities of beverages and personal health
beliefs were identified as important influences on consumption. Social cues included settings
in which alcohol is usually consumed, socializing with friends, and family influences.
Environmental cues included purchasing of fast foods, and ready availability, preferential
pricing and promotion of caloric beverages. Reinforcing intrinsic qualities of caloric soft
drinks included taste, sugar and caffeine content, and their association with treats and
rewards. Major gender differences as well as variations in individual readiness for behaviour
change were observed. Raising awareness of the sugar content of various beverages and the
potential health impacts associated with their consumption was considered important.The
findings provide new insights with important implications for policy and practice, and
suggest that there is considerable scope for promoting awareness in this group. Carefully
designed social marketing campaigns highlighting the health issues and addressing social and
environmental cues relating to caloric soft drink consumption are required. There is a need
for gender-differentiated intervention programmers which are both informational and
appealing to young adults. Further research is warranted, particularly to investigate beverage
consumption relating to fast-food meal deals and young adults‘ consumption patterns in more
depth. (Hattersley et al., 2017)

37 Soft Drinks Intake Behaviour among University Going Students.
2.16 Soft drinks, fructose consumption, and the risk of gout in
men: prospective cohort study.
To examine the relation between intakes of sugar sweetened soft drinks and fructose and the
risk of incident gout in men. Design Prospective cohort over 12 years. Setting health
professionals follow-up study. 46 393 men with no history of gout at baseline who provided
information on intake of soft drinks and fructose through validated food frequency
questionnaires. Main outcome measure Incident cases of gout meeting the American College
of Rheumatology survey criteria for gout. During the 12 years of follow-up 755 confirmed
incident cases of gout were reported. Increasing intake of sugar sweetened soft drinks was
associated with an increasing risk of gout. Compared with consumption of less than one
serving of sugar sweetened soft drinks a month the multivariate relative risk of gout for 5-6
servings a week was 1.29 (95% confidence interval 1.00 to 1.68), for one serving a day was
1.45 (1.02 to 2.08), and for two or more servings a day was 1.85 (1.08 to 3.16; P for
trend=0.002). Diet soft drinks were not associated with risk of gout (P for trend=0.99). The
multivariate relative risk of gout according to increasing fifths of fructose intake were 1.00,
1.29, 1.41, 1.84, and 2.02 (1.49 to 2.75; P for trend <0.001). Other major contributors to
fructose intake such as total fruit juice or fructose rich fruits (apples and oranges) were also
associated with a higher risk of gout (P values for trend <0.05). Prospective data suggest that
consumption of sugar sweetened soft drinks and fructose is strongly associated with an
increased risk of gout in men. Furthermore, fructose rich fruits and fruit juices may also
increase the risk. Diet soft drinks were not associated with the risk of gout. (Choi and
Curhan, 2017)
2.17 Enamel Erosion by Some Soft Drinks and Orange Juices
Relative to Their pH, Buffering Effect and Contents of Calcium
Phosphate.
The capability of a soft drink or a juice to erode dental enamel depends not only on the pH of
the drink, but also on its buffering effect. As the latter is the ability of the drink to resist a
change of pH it may add to the effects of the actual pH. The aim of the present study was to
compare the pH and the buffering effect of various soft drinks with their erosive effects and
the solubility of apatite. In 18 soft drinks, mineral waters and juices available on the Danish
38 Soft Drinks Intake Behaviour among University Going Students.
market, pH and the concentrations of calcium, phosphate and fluoride were determined. The
buffering effect was determined by titration with NaOH. Human teeth (n = 54) covered with
nail varnish except for 3×4–mm windows were exposed to 1.5 liters of the drink for either 7
days or 24 h under constant agitation. The depth of the erosions was assessed in longitudinal
sections. The depth was found to vary greatly from 3 mm eroded by the most acidic drinks
and fresh orange juice to only slightly affected surfaces by most of the mineral waters. The
dissolution of enamel increased logarithmically inversely with the pH of the drink and
parallel with the solubility of enamel apatite. Orange juice, pH 4.0, supplemented with 40
mmol/l calcium and 30 mmol/l phosphate did not erode the enamel as the calcium and
phosphate saturated the drink with respect to apatite. Generally, the lower the pH the more
NaOH was necessary to bring the pH to neutrality. In particular the buffering effect of the
juice was high. For all drinks, no effect of their low fluoride concentrations was observed.
(Larsen and Nyvad, 2017)
2.18 Dietary Sugars Intake and Cardiovascular Health: A
Scientific Statement From the American Heart Association
High intakes of dietary sugars in the setting of a worldwide pandemic of obesity and
cardiovascular disease have heightened concerns about the adverse effects of excessive
consumption of sugars. In 2001 to 2004, the usual intake of added sugars for Americans was
22.2 teaspoons per day (355 calories per day). Between 1970 and 2005, average annual
availability of sugars/added sugars increased by 19%, which added 76 calories to Americans‘
average daily energy intake. Soft drinks and other sugar-sweetened beverages are the primary
source of added sugars in Americans‘ diets. Excessive consumption of sugars has been linked
with several metabolic abnormalities and adverse health conditions, as well as shortfalls of
essential nutrients. Although trial data are limited, evidence from observational studies
indicates that a higher intake of soft drinks is associated with greater energy intake, higher
body weight, and lower intake of essential nutrients. National survey data also indicate that
excessive consumption of added sugars is contributing to overconsumption of discretionary
calories by Americans. On the basis of the 2005 US Dietary Guidelines, intake of added
sugars greatly exceeds discretionary calorie allowances, regardless of energy needs. In view

39 Soft Drinks Intake Behaviour among University Going Students.
of these considerations, the American Heart Association recommends reductions in the intake
of added sugars. A prudent upper limit of intake is half of the discretionary calorie
allowance, which for most American women is no more than 100 calories per day and for
most American men is no more than 150 calories per day from added sugars. (Johnson,
Appel and Brands, 2017)
2.19 Intake of sugar-sweetened beverages and weight gain: a
systematic review.
Consumption of sugar-sweetened beverages (SSBs), particularly carbonated soft drinks, may
be a key contributor to the epidemic of overweight and obesity, by virtue of these beverages'
high added sugar content, low satiety, and incomplete compensation for total energy.
Whether an association exists between SSB intake and weight gain is unclear. We searched
English-language MEDLINE publications from 1966 through May 2005 for cross-sectional,
prospective cohort, and experimental studies of the relation between SSBs and the risk of
weight gain (ie, overweight, obesity, or both). Thirty publications (15 cross-sectional, 10
prospective, and 5 experimental) were selected on the basis of relevance and quality of
design and methods. Findings from large cross-sectional studies, in conjunction with those
from well-powered prospective cohort studies with long periods of follow-up, show a
positive association between greater intakes of SSBs and weight gain and obesity in both
children and adults. Findings from short-term feeding trials in adults also support an
induction of positive energy balance and weight gain by intake of sugar-sweetened sodas, but
these trials are few. A school-based intervention found significantly less soft-drink
consumption and prevalence of obese and overweight children in the intervention group than
in control subjects after 12 mo, and a recent 25-week randomized controlled trial in
adolescents found further evidence linking SSB intake to body weight. The weight of
epidemiologic and experimental evidence indicates that a greater consumption of SSBs is
associated with weight gain and obesity. Although more research is needed, sufficient
evidence exists for public health strategies to discourage consumption of sugary drinks as
part of a healthy lifestyle. (Malik, Schulze and Hu, 2017)

40 Soft Drinks Intake Behaviour among University Going Students.
2.20 Consumption of Sweetened Beverages and Intakes of
Fructose and Glucose Predict Type 2 Diabetes Occurrence.
The role of intakes of different sugars in the development of type 2 diabetes was studied in a
cohort of 4,304 men and women aged 40–60 y and initially free of diabetes at baseline in
1967–1972. Food consumption data were collected using a dietary history interview covering
the habitual diet during the previous year. The intakes of different sugars were calculated and
divided in quartiles. During a 12-y follow-up, 177 incidents of type 2 diabetes cases were
identified from a nationwide register. Combined intake of fructose and glucose was
associated with the risk of type 2 diabetes but no significant association was observed for
intakes of sucrose, lactose, or maltose. The relative risk between the highest and lowest
quartiles of combined fructose and glucose intake was 1.87 (95% [CI] = 1.19, 2.93; P =
0.003). The corresponding relative risks between the extreme quartiles of consumption of
food items contributing to sugar intakes were 1.69 (95% [CI] = 1.17, 2.43; P < 0.001) for
sweetened berry juice and 1.67 (95% [CI] = 0.98, 2.87; P= 0.01) for soft drinks. Our findings
support the view that higher intake of fructose and glucose and sweetened beverages may
increase type 2 diabetes risk. (Montonen, Järvinen and Knekt, 2017)
41 Soft Drinks Intake Behaviour among University Going Students.
CHAPTER-3
MATERIALS
AND METHOD

42 Soft Drinks Intake Behaviour among University Going Students.
3.1 Type of the Study
It was a survey-based study.
3.2 Materials
Survey questionnaire
Response from the respondents
BMI Calculator
3.3 Study Area
The survey was conducted on students of different departments of East West University.
3.4.1 Inclusion Criteria
Both males and females
Anyone who was a student of East west University
3.4.2 Exclusion Criteria
Person unwilling to do the study
Anyone who was not student
3.5 Study Population
In this study, both male and female were the study population. This inquiry was carried out
on 445 students of East West University.
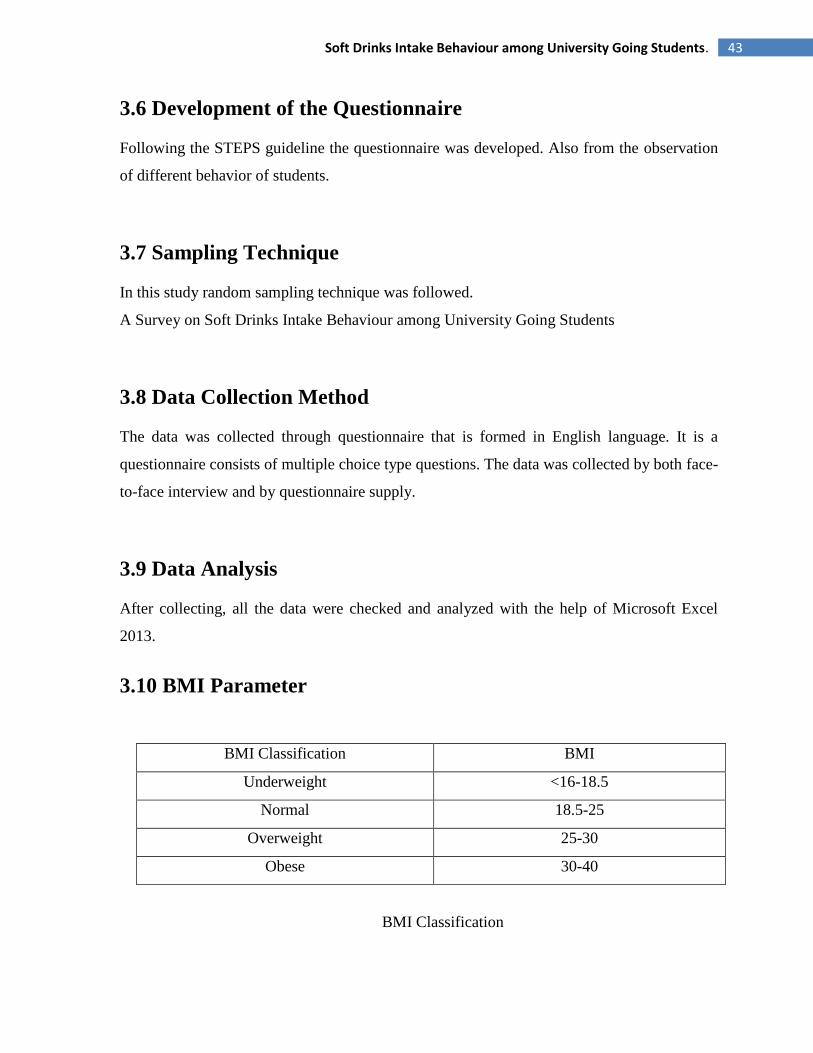
43 Soft Drinks Intake Behaviour among University Going Students.
3.6 Development of the Questionnaire
Following the STEPS guideline the questionnaire was developed. Also from the observation
of different behavior of students.
3.7 Sampling Technique
In this study random sampling technique was followed.
A Survey on Soft Drinks Intake Behaviour among University Going Students
3.8 Data Collection Method
The data was collected through questionnaire that is formed in English language. It is a
questionnaire consists of multiple choice type questions. The data was collected by both face-
to-face interview and by questionnaire supply.
3.9 Data Analysis
After collecting, all the data were checked and analyzed with the help of Microsoft Excel
2013.
3.10 BMI Parameter
BMI Classification BMI
Underweight <16-18.5
Normal 18.5-25
Overweight 25-30
Obese 30-40
BMI Classification
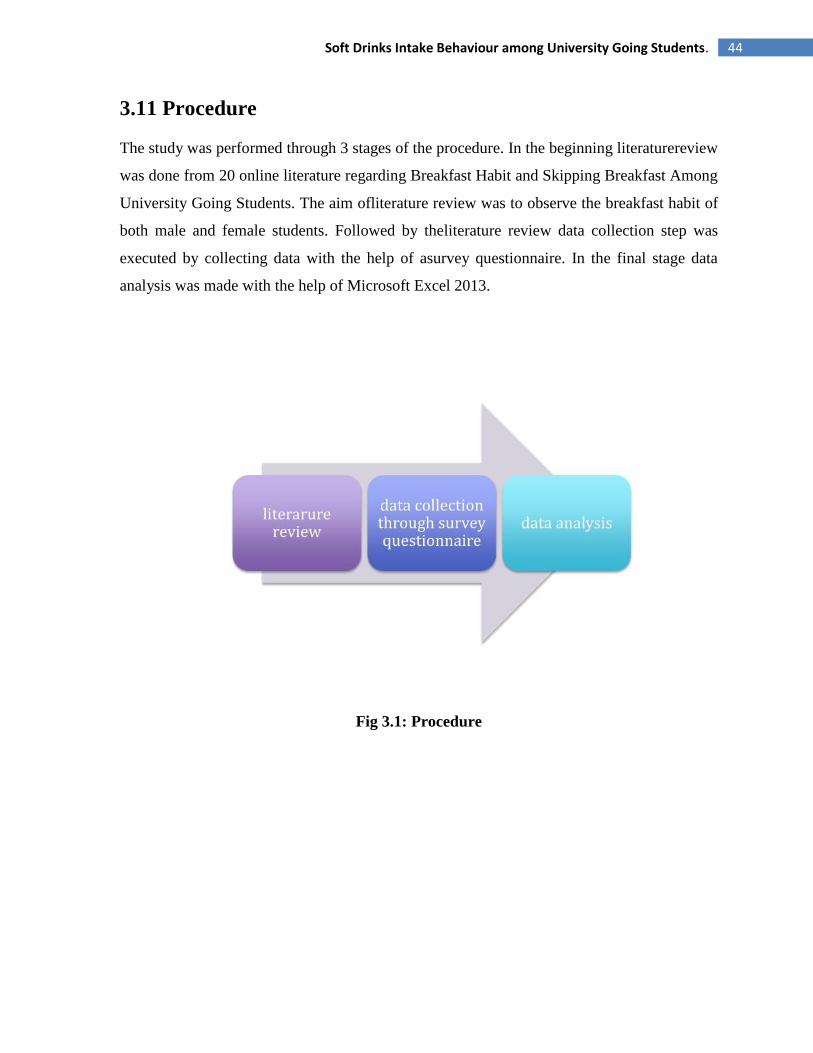
44 Soft Drinks Intake Behaviour among University Going Students.
3.11 Procedure
The study was performed through 3 stages of the procedure. In the beginning literaturereview
was done from 20 online literature regarding Breakfast Habit and Skipping Breakfast Among
University Going Students. The aim ofliterature review was to observe the breakfast habit of
both male and female students. Followed by theliterature review data collection step was
executed by collecting data with the help of asurvey questionnaire. In the final stage data
analysis was made with the help of Microsoft Excel 2013.
Fig 3.1: Procedure

45 Soft Drinks Intake Behaviour among University Going Students.
CHAPTER-4
RESULT &
ANALYSIS

46 Soft Drinks Intake Behaviour among University Going Students.
Fig 4.1: Proportion of students (gender wise).
The survey was conducted on 445 students. Among them 33% were female and 67% were
male.
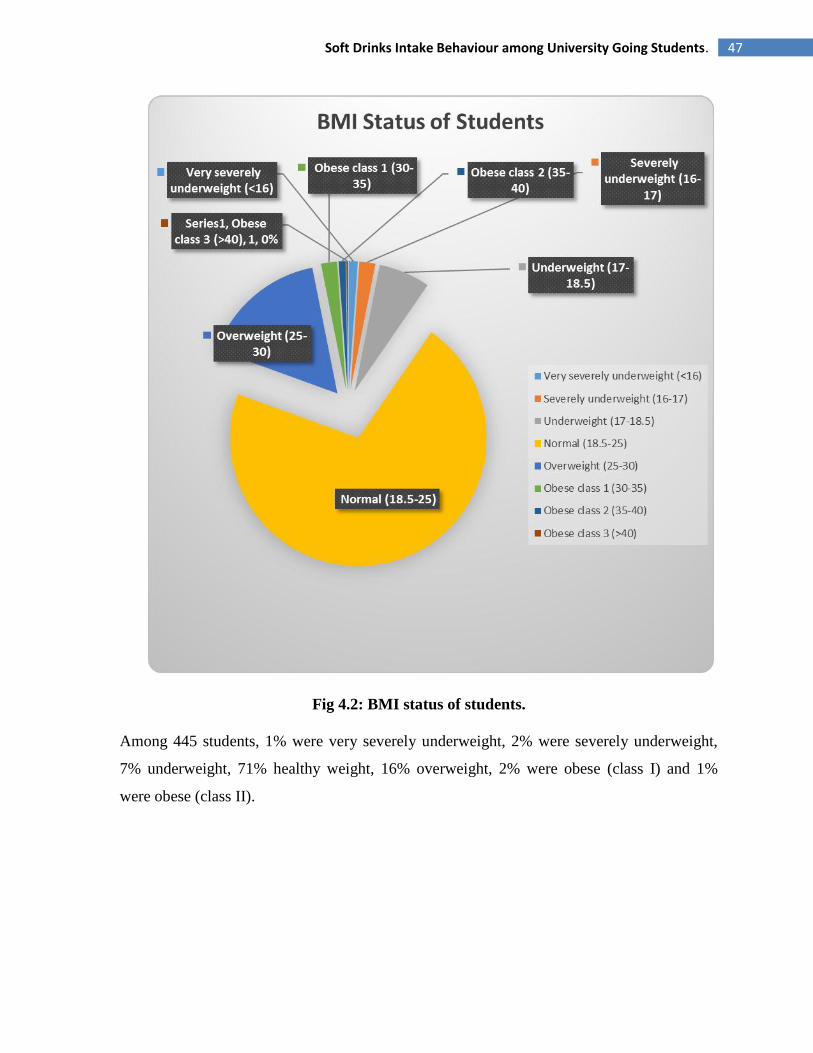
47 Soft Drinks Intake Behaviour among University Going Students.
Fig 4.2: BMI status of students.
Among 445 students, 1% were very severely underweight, 2% were severely underweight,
7% underweight, 71% healthy weight, 16% overweight, 2% were obese (class I) and 1%
were obese (class II).

48 Soft Drinks Intake Behaviour among University Going Students.
Fig 4.3: Percentage of Underweight Students.
In this study some severely underweight underweight students were found. Among them
64% were female and 36% were male.
Fig 4.4: Percentage of Healthy Weight Students.

49 Soft Drinks Intake Behaviour among University Going Students.
In this study 289 very severely underweight students were found. Among of them 30% were
female and 70% were male.
Fig 4.5: Percentage of overweight students.
In this study 49 overweight students were found. Among of them 44% were female and 56%
were male.
Fig 4.6: Percentage of obese students.
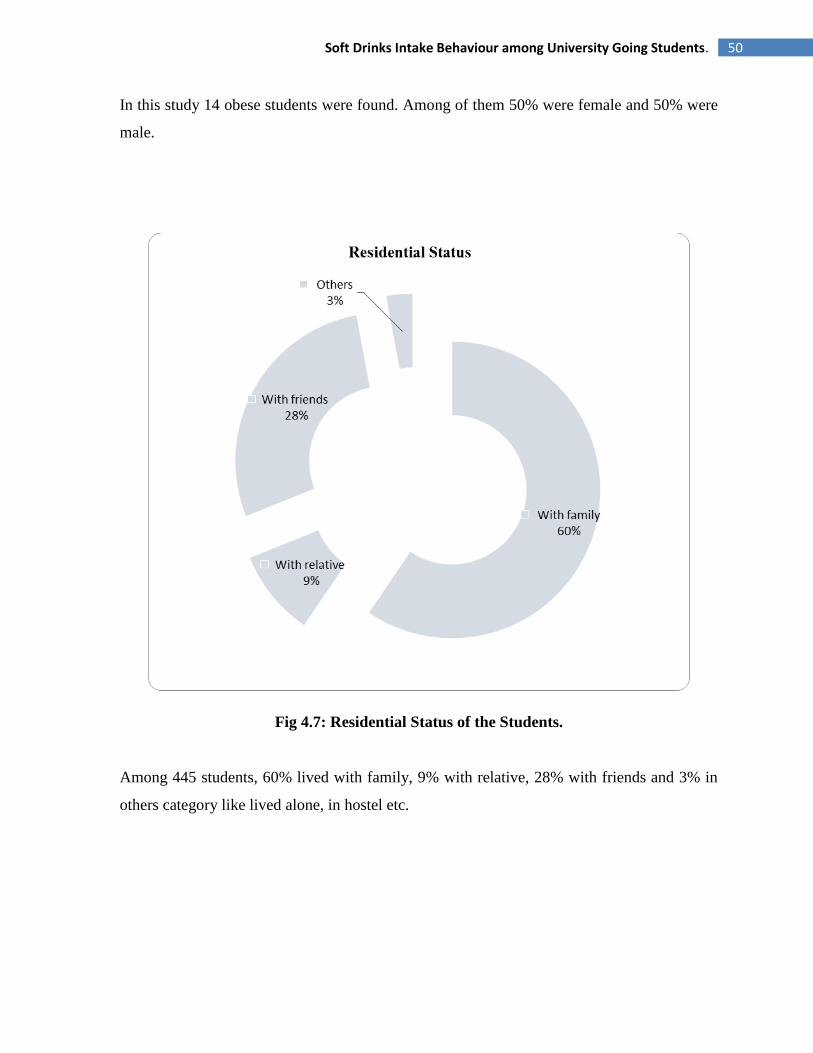
50 Soft Drinks Intake Behaviour among University Going Students.
In this study 14 obese students were found. Among of them 50% were female and 50% were
male.
Fig 4.7: Residential Status of the Students.
Among 445 students, 60% lived with family, 9% with relative, 28% with friends and 3% in
others category like lived alone, in hostel etc.
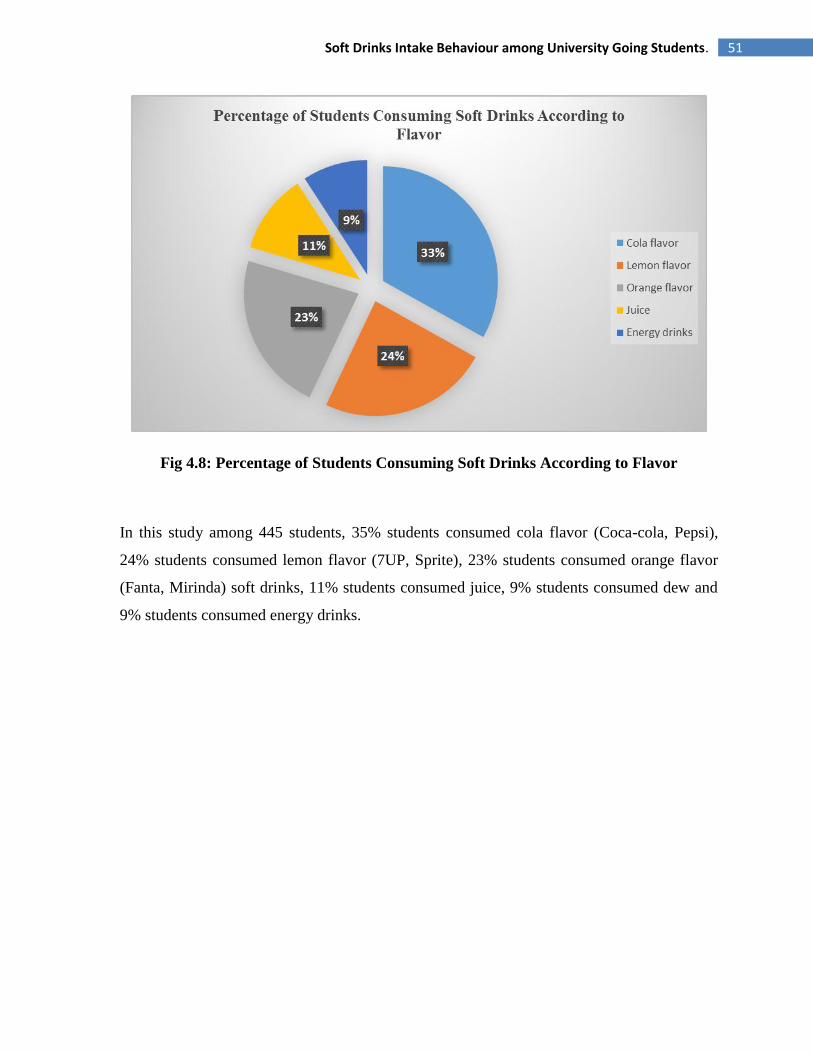
51 Soft Drinks Intake Behaviour among University Going Students.
Fig 4.8: Percentage of Students Consuming Soft Drinks According to Flavor
In this study among 445 students, 35% students consumed cola flavor (Coca-cola, Pepsi),
24% students consumed lemon flavor (7UP, Sprite), 23% students consumed orange flavor
(Fanta, Mirinda) soft drinks, 11% students consumed juice, 9% students consumed dew and
9% students consumed energy drinks.
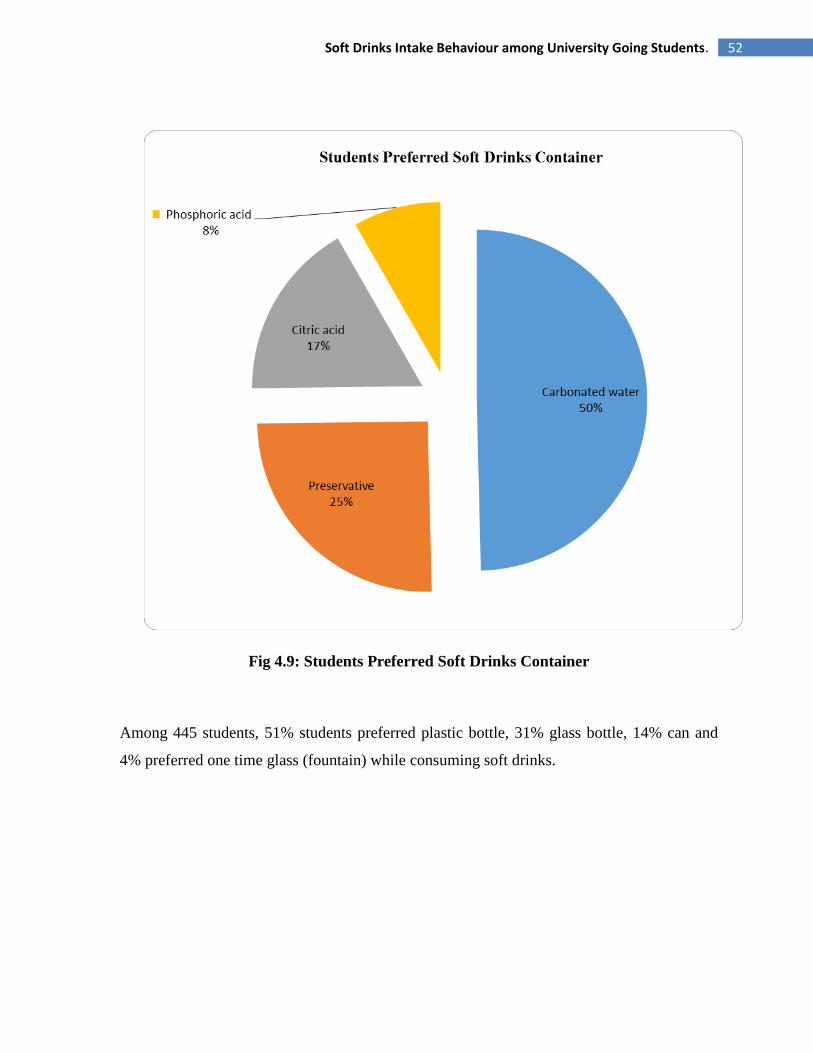
52 Soft Drinks Intake Behaviour among University Going Students.
Fig 4.9: Students Preferred Soft Drinks Container
Among 445 students, 51% students preferred plastic bottle, 31% glass bottle, 14% can and
4% preferred one time glass (fountain) while consuming soft drinks.

53 Soft Drinks Intake Behaviour among University Going Students.
Fig 4.10: Proportion of pocket money spent on purchasing soft drinks
Among 445 students, 44% students spent less than 5% of their pocket money on purchasing
soft drinks, 33% spent 5-10% of pocket money, 16% spent 10-15% of pocket money, 7%
spent more than 15% of pocket money.
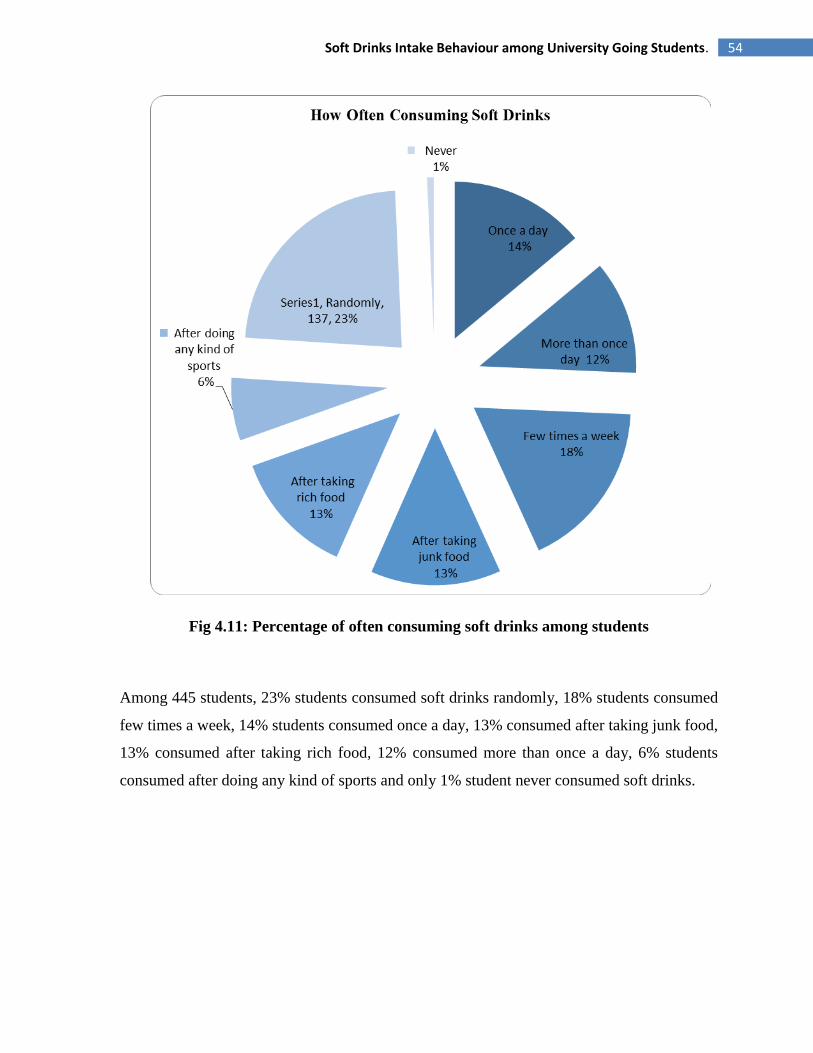
54 Soft Drinks Intake Behaviour among University Going Students.
Fig 4.11: Percentage of often consuming soft drinks among students
Among 445 students, 23% students consumed soft drinks randomly, 18% students consumed
few times a week, 14% students consumed once a day, 13% consumed after taking junk food,
13% consumed after taking rich food, 12% consumed more than once a day, 6% students
consumed after doing any kind of sports and only 1% student never consumed soft drinks.
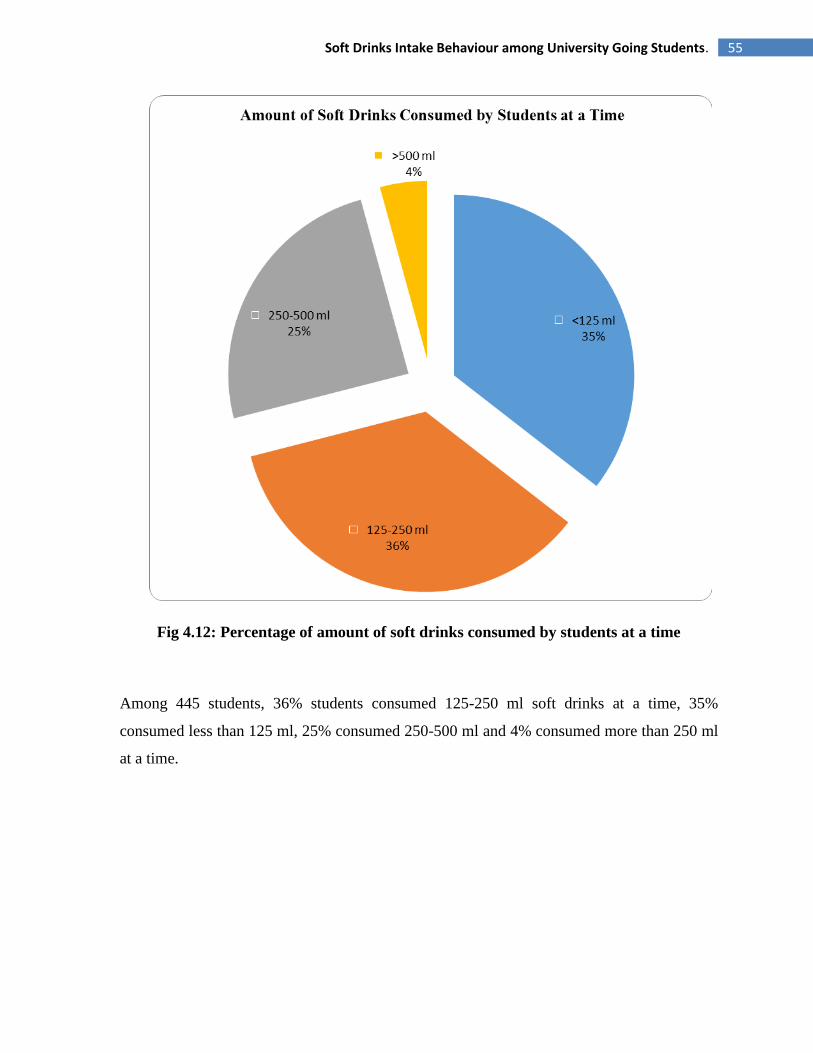
55 Soft Drinks Intake Behaviour among University Going Students.
Fig 4.12: Percentage of amount of soft drinks consumed by students at a time
Among 445 students, 36% students consumed 125-250 ml soft drinks at a time, 35%
consumed less than 125 ml, 25% consumed 250-500 ml and 4% consumed more than 250 ml
at a time.
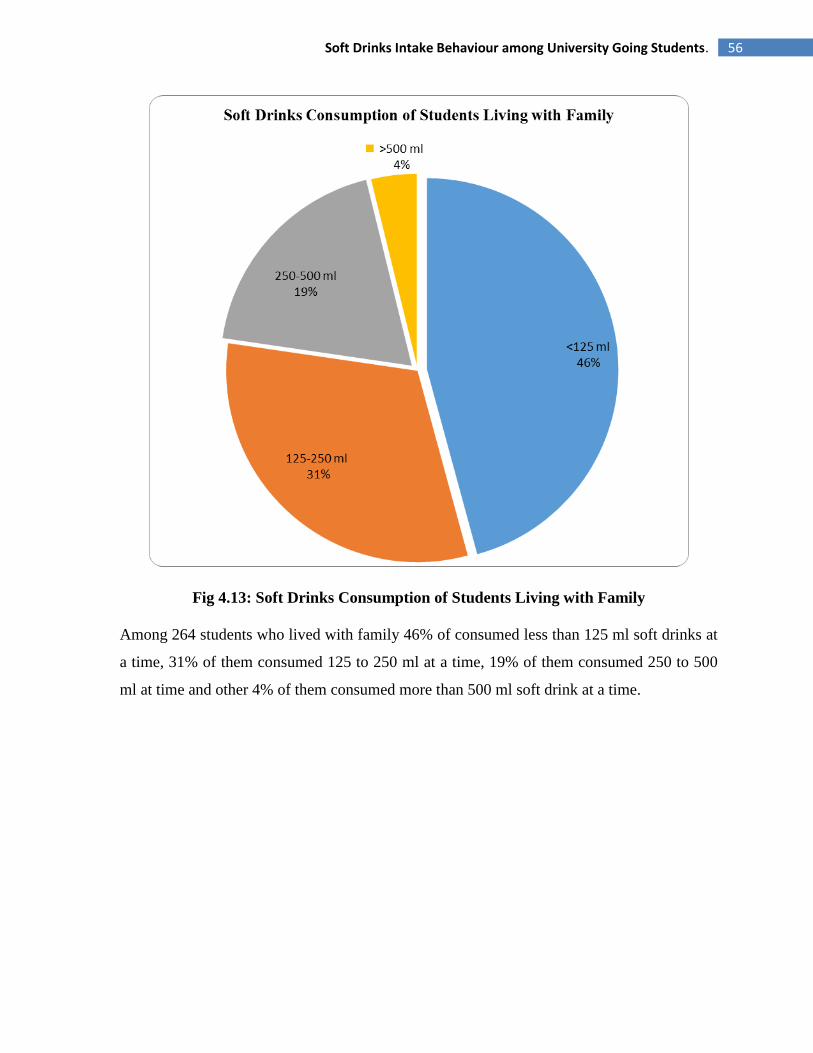
56 Soft Drinks Intake Behaviour among University Going Students.
Fig 4.13: Soft Drinks Consumption of Students Living with Family
Among 264 students who lived with family 46% of consumed less than 125 ml soft drinks at
a time, 31% of them consumed 125 to 250 ml at a time, 19% of them consumed 250 to 500
ml at time and other 4% of them consumed more than 500 ml soft drink at a time.
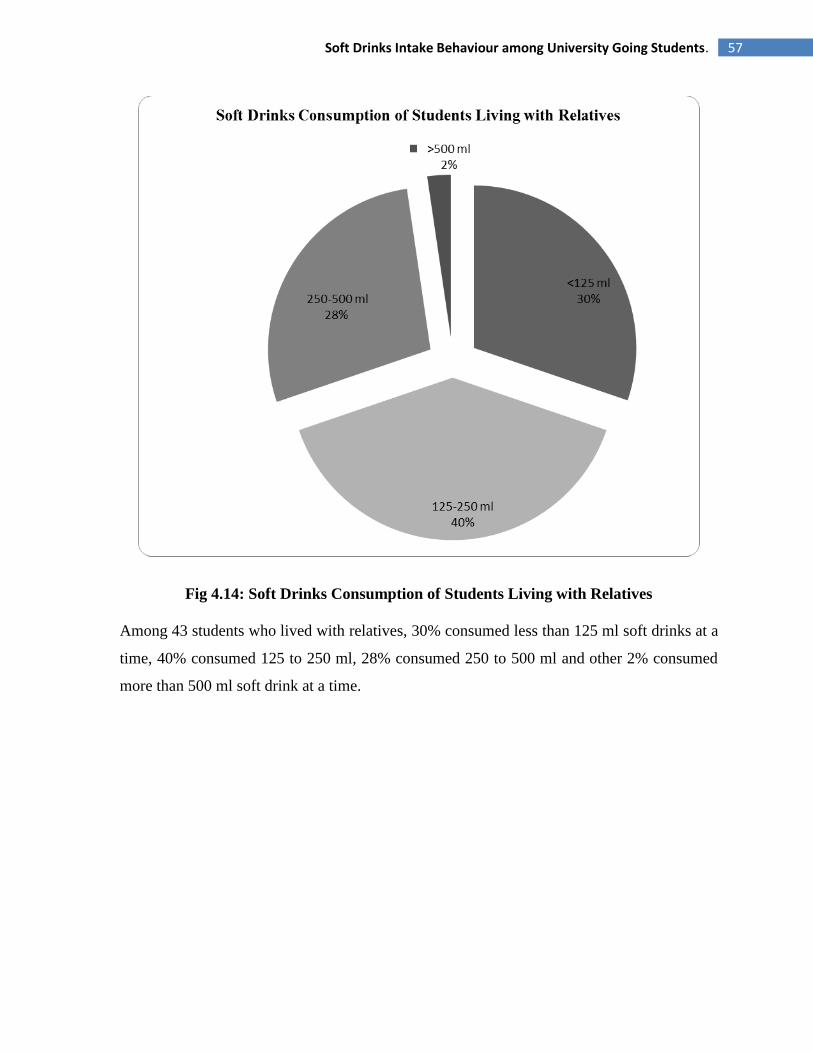
57 Soft Drinks Intake Behaviour among University Going Students.
Fig 4.14: Soft Drinks Consumption of Students Living with Relatives
Among 43 students who lived with relatives, 30% consumed less than 125 ml soft drinks at a
time, 40% consumed 125 to 250 ml, 28% consumed 250 to 500 ml and other 2% consumed
more than 500 ml soft drink at a time.
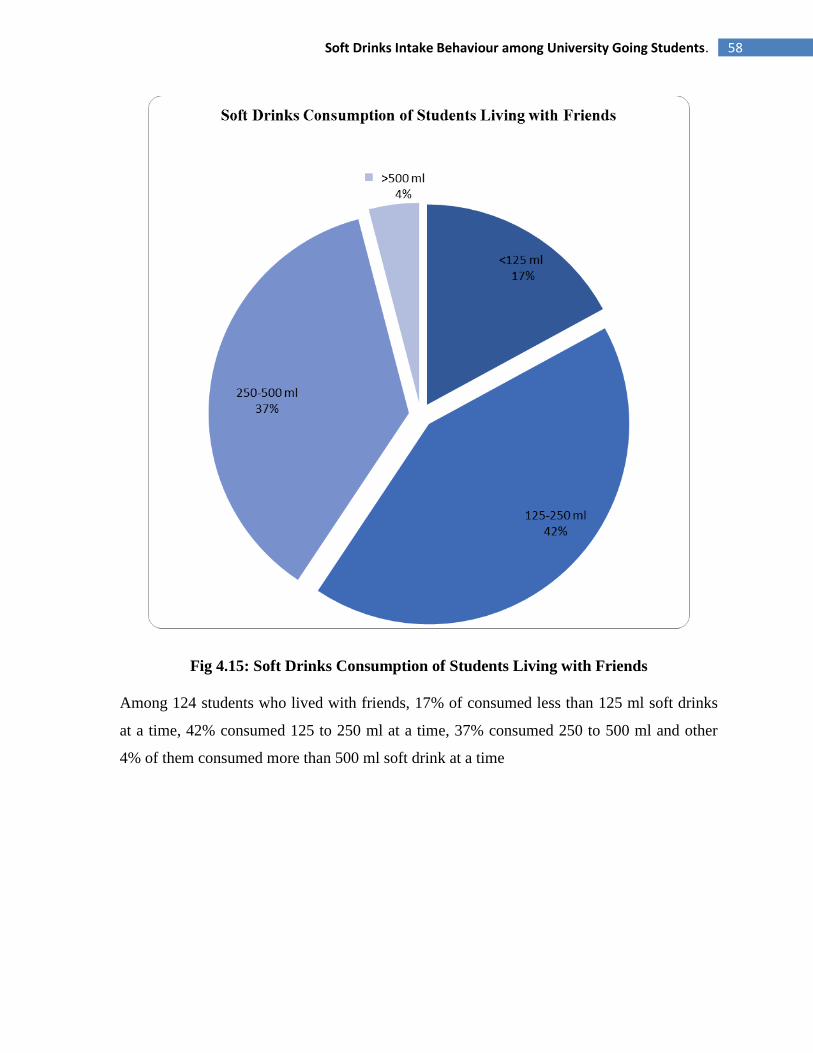
58 Soft Drinks Intake Behaviour among University Going Students.
Fig 4.15: Soft Drinks Consumption of Students Living with Friends
Among 124 students who lived with friends, 17% of consumed less than 125 ml soft drinks
at a time, 42% consumed 125 to 250 ml at a time, 37% consumed 250 to 500 ml and other
4% of them consumed more than 500 ml soft drink at a time
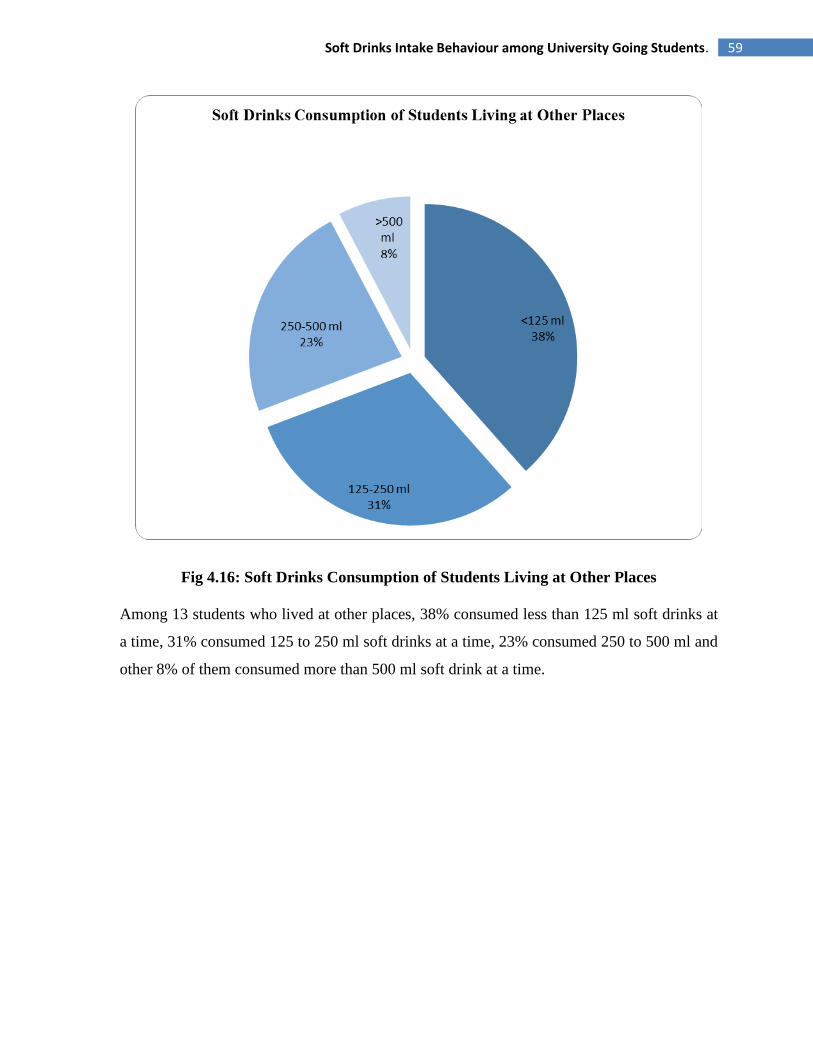
59 Soft Drinks Intake Behaviour among University Going Students.
Fig 4.16: Soft Drinks Consumption of Students Living at Other Places
Among 13 students who lived at other places, 38% consumed less than 125 ml soft drinks at
a time, 31% consumed 125 to 250 ml soft drinks at a time, 23% consumed 250 to 500 ml and
other 8% of them consumed more than 500 ml soft drink at a time.
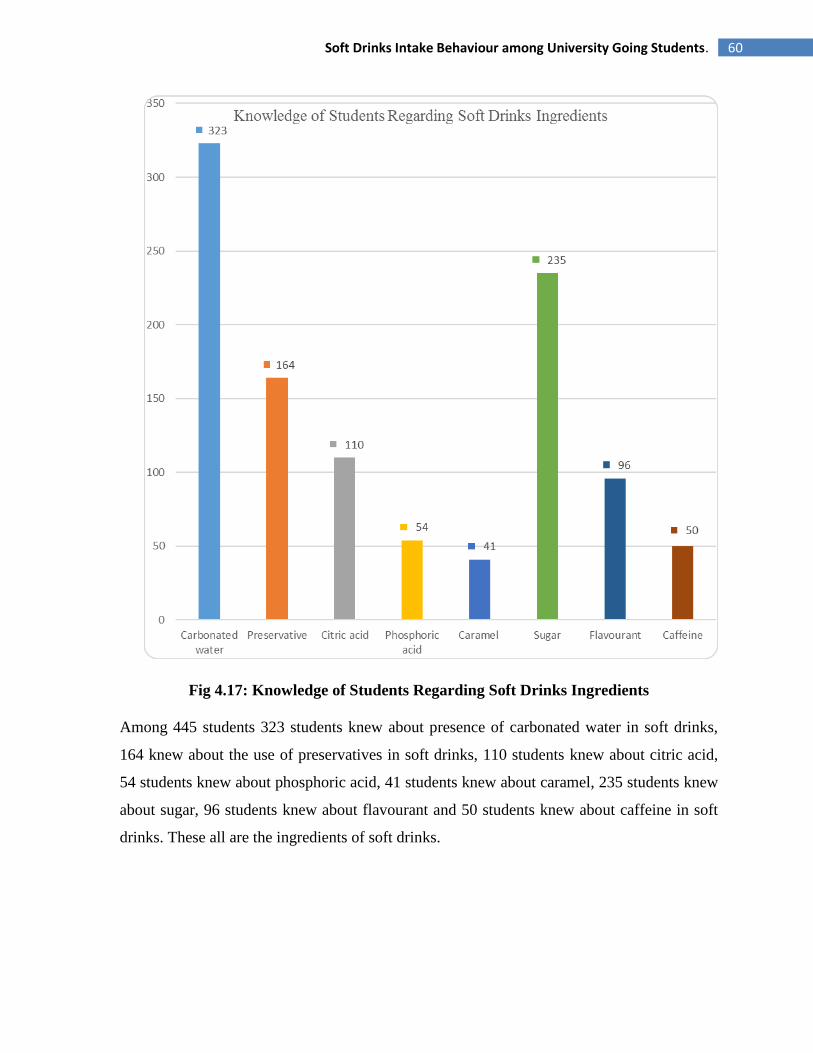
60 Soft Drinks Intake Behaviour among University Going Students.
Fig 4.17: Knowledge of Students Regarding Soft Drinks Ingredients
Among 445 students 323 students knew about presence of carbonated water in soft drinks,
164 knew about the use of preservatives in soft drinks, 110 students knew about citric acid,
54 students knew about phosphoric acid, 41 students knew about caramel, 235 students knew
about sugar, 96 students knew about flavourant and 50 students knew about caffeine in soft
drinks. These all are the ingredients of soft drinks.

61 Soft Drinks Intake Behaviour among University Going Students.
Fig 4.18: Diet Drinks Are Better than Normal Drinks
Among 445 students 53% students thought diet drinks is better than normal drinks and 47%
students did not thinks diet drinks was better than normal drinks.
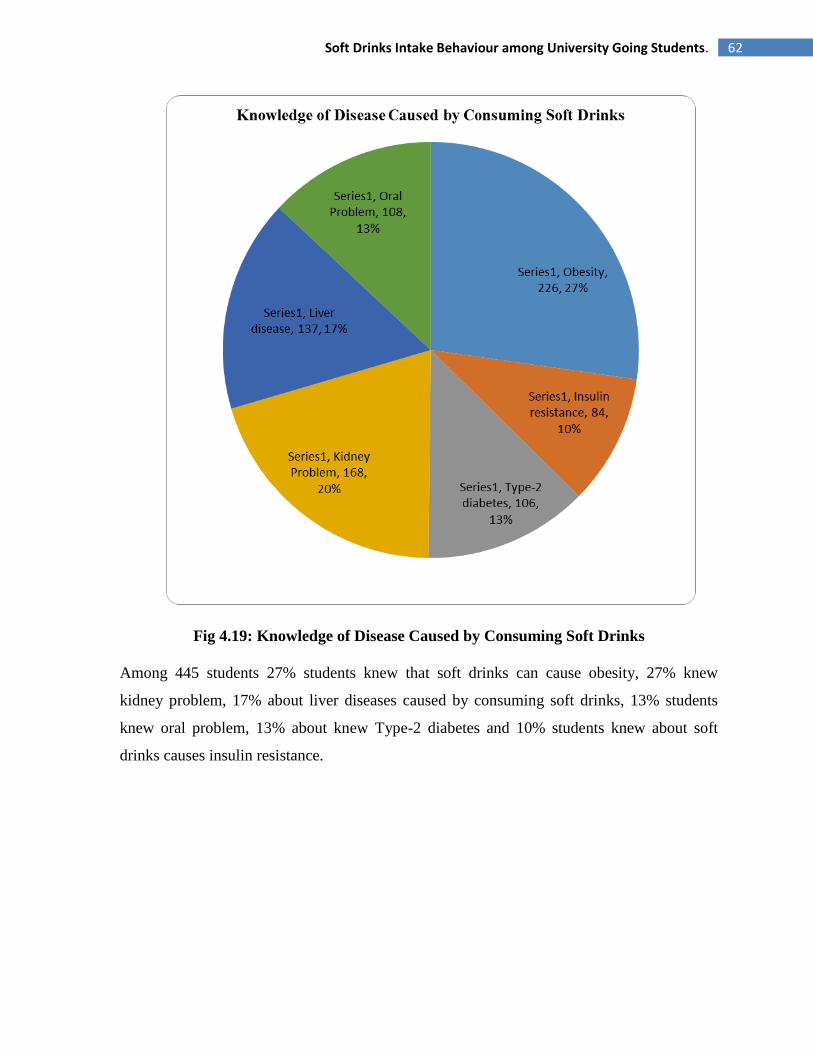
62 Soft Drinks Intake Behaviour among University Going Students.
Fig 4.19: Knowledge of Disease Caused by Consuming Soft Drinks
Among 445 students 27% students knew that soft drinks can cause obesity, 27% knew
kidney problem, 17% about liver diseases caused by consuming soft drinks, 13% students
knew oral problem, 13% about knew Type-2 diabetes and 10% students knew about soft
drinks causes insulin resistance.

63 Soft Drinks Intake Behaviour among University Going Students.
Fig 4.20: Student to Soft Drinks
Among 445 students, 35% students felt addicted to soft drinks with 65% students did not
addicted to soft drinks.
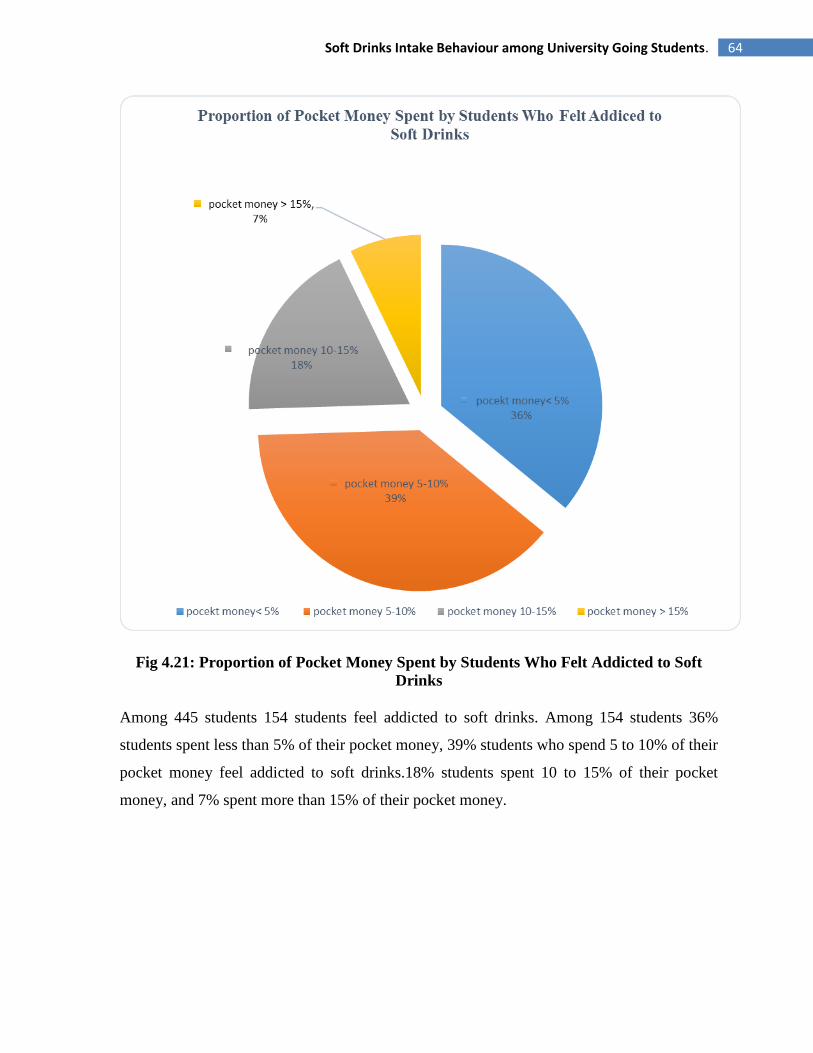
64 Soft Drinks Intake Behaviour among University Going Students.
Fig 4.21: Proportion of Pocket Money Spent by Students Who Felt Addicted to Soft
Drinks
Among 445 students 154 students feel addicted to soft drinks. Among 154 students 36%
students spent less than 5% of their pocket money, 39% students who spend 5 to 10% of their
pocket money feel addicted to soft drinks.18% students spent 10 to 15% of their pocket
money, and 7% spent more than 15% of their pocket money.
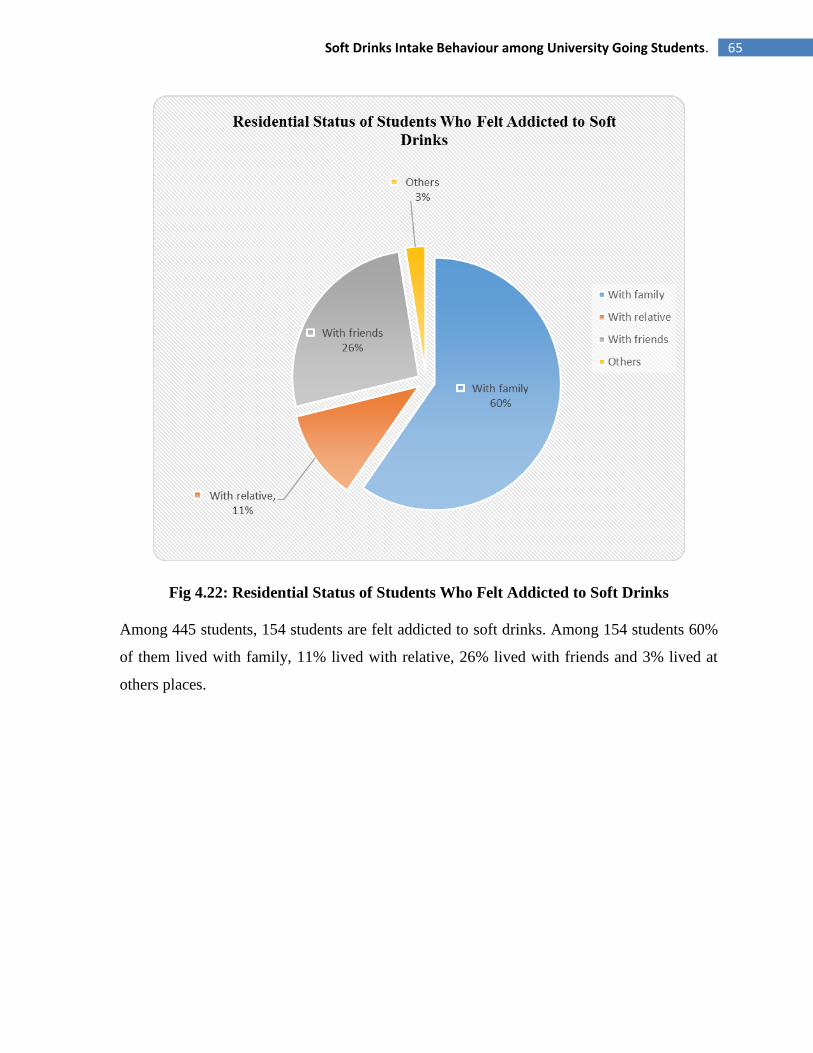
65 Soft Drinks Intake Behaviour among University Going Students.
Fig 4.22: Residential Status of Students Who Felt Addicted to Soft Drinks
Among 445 students, 154 students are felt addicted to soft drinks. Among 154 students 60%
of them lived with family, 11% lived with relative, 26% lived with friends and 3% lived at
others places.
66 Soft Drinks Intake Behaviour among University Going Students.
CHAPTER-5
DISCUSSION

67 Soft Drinks Intake Behaviour among University Going Students.
Discussion
The survey included questions about frequency of soft drink consumption and factors related
to soft drink consumption. The sample consisted of 560 children, 8 to 13 years old, who
completed and mailed in the survey. There was an equal distribution of boys and girls (51%
and 49%, respectively). Preference for the taste of soft drinks was the strongest predictor in
the analysis, with those who reported the strongest taste preference 4.50 times more likely
(95% confidence interval=2.89–7.04) to consume soft drinks five or more times per week
than those with a lower taste preference. Youth whose parents regularly drank soft drinks
were 2.88 times more likely (95% confidence interval=1.76–4.72) to consume soft drinks
five or more times per week compared with those whose parents did not regularly drink soft
drinks. Results suggest that several factors may be associated with soft drink intake in
school-aged children, most notably taste preferences, soft drink consumption habits of
parents and friends, soft drink availability in the home and school, and television viewing.
(Grimm, Harnack and Story, 2017)
This survey included questions about soft drinks intake behaviour among university going
students. Our survey was conducted on students of East West University and the sample
consisted of 445 students, with BMI range 16 to 40, who completed questionnaires in the
survey. Among of the students 67% were male and 33% were female. In this study among
445 students 32% students consumed cola flavor (Coca-cola, Pepsi), 24% students consumed
lemon flavor (7UP, Sprite),21% students consumed orange flavor (Fanta, Mirinda) soft
drinks, 11% students consumed juice,9% students consumed dew and 3% students consumed
energy drinks. 264 of 445 students lived with family 46% of them consumed less than 125 ml
soft drinks at a time, 31% of them consumed 125 to 250 ml at a time, 19% of them consumed
250 to 500 ml soft drinks ad 4% consumed more than 500 ml soft drink at a time. Among
445, 23% students consumed soft drinks randomly, 18% few times a week, 14% students
consumed soft drinks once a day, 13% drinks after taking junk food, 13% after taking rich
food, 12% more than once a day, 6% after doing any kind of sports only 1% student never
consumed soft drinks. 65% students not felt addicted to soft drinks.
68 Soft Drinks Intake Behaviour among University Going Students.
CHAPTER-6
CONCLUSION

69 Soft Drinks Intake Behaviour among University Going Students.
Conclusion
A soft drink (also referred to as soda, coke, pop, soda pop, or fizzy drink) is a non-alcoholic
beverage that usually contains carbonated water, a sweetener, and flavoring. The sweetener is
typically sugar, high-fructose corn syrup, or a sugar substitute (as is the case in diet soft
drinks). Soft drinks can also contain fruit juice or caffeine. (Zidbits - Learn something new
everyday!, 2017). Soft drinks can be part of a healthy and balanced lifestyle because they are
important contributors to hydration and light beverages can be an integral part of weight loss
plans. (Unesda, 2017). Despite having few health benefit consumption of soft drinks have
more complications. Ingredients of soft drinks cause many health complication and chronic
health problem. Many of the students were aware about the ingredient of soft drinks and
damage that occur by consumption of soft drinks. Many complications like obesity, type-2
diabetes, insulin resistance, kidney problem, liver disease, oral Problem can raise by
consuming soft drinks on a daily basis. During this study it has been observed that majority
of the university students of East West University, Dhaka consume different type of soft
drinks regularly. Although majority of them know about the complications caused by
consuming soft drinks. They spend a good amount of their pocket money for purchasing soft
drinks. Many of them intake considerable amount of soft drinks per day. A significant
amount of students also felt addicted to soft drinks. Public awareness should be needed to
increase awareness regarding consumption of soft drinks as a part of a healthy life style. This
study was done only on the students of East West University so it only represents the fitness
status of this university student. The data would be effective if more data were collected from
different university students. Doing survey on different students on different part of
Bangladesh can expand the study. The expanded study will represent statistical data about the
consumption of soft drinks among students of whole Bangladesh.

70 Soft Drinks Intake Behaviour among University Going Students.
CHAPTER-7
REFERENCES
71 Soft Drinks Intake Behaviour among University Going Students.
References
Assy, N., Nasser, G., Kamayse, I. and Nseir, W. (2017). Soft Drink Consumption Linked
with Fatty Liver in the Absence of Traditional Risk Factors. Available at:
https://www.ncbi.nlm.nih.gov/pubmed/18925303 [Accessed 25 Oct. 2017].
Britishsoftdrinks.com. (2017). Ingredients. [online] Available at:
http://www.britishsoftdrinks.com/Ingredients [Accessed 25 Oct. 2017].
Choi, H. and Curhan, G. (2017). Soft drinks, fructose consumption, and the risk of gout in
men: prospective cohort study. Available at: http://www.bmj.com/content/336/7639/309
[Accessed 25 Oct. 2017].
Dhingra, R., Sullivan, L. and Jacques, P. (2017). Soft Drink Consumption and Risk of
Developing Cardiometabolic Risk Factors and the Metabolic Syndrome in Middle-Aged
Adults in the Community. Available at: https://www.ncbi.nlm.nih.gov/pubmed/17646581
[Accessed 25 Oct. 2017].
Emedexpert.com. (2017). Reasons Why People Drink Soda & Why To Stop Its Drinking.
[online] Available at: http://www.emedexpert.com/tips/soft-drinks.shtml [Accessed 25 Oct.
2017].
Encyclopedia Britannica. (2017). soft drink | beverage. [online] Available at:
https://www.britannica.com/topic/soft-drink [Accessed 25 Oct. 2017].
Fortune. (2017). Soda Consumption Falls to 30-Year Low In The U.S.. [online] Available at:
http://fortune.com/2016/03/29/soda-sales-drop-11th-year [Accessed 25 Oct.
2017].Grimm, G., Harnack, L. and Story, M. (2017). Factors associated with soft drink
consumption in school-aged children. Available at:
https://www.ncbi.nlm.nih.gov/pubmed/15281041 [Accessed 25 Oct. 2017].
Harnack, L., Stang, J. and Story, M. (2017). Soft Drink Consumption Among US Children
and Adolescents. Available at: https://www.ncbi.nlm.nih.gov/pubmed/10207395 [Accessed
25 Oct. 2017].

72 Soft Drinks Intake Behaviour among University Going Students.
Hattersley, L., Irwin, M., King, L. and Allman-Farinelli, M. (2017). Determinants and
patterns of soft drink consumption in young adults: a qualitative analysis. Available at:
https://www.ncbi.nlm.nih.gov/pubmed/19195421 [Accessed 25 Oct. 2017].
Johnson, R., Appel, L. and Brands, M. (2017). Dietary Sugars Intake and Cardiovascular
Health: A Scientific Statement From the American Heart Association. Available at:
https://www.ncbi.nlm.nih.gov/pubmed/19704096 [Accessed 25 Oct. 2017].
Larsen, M. and Nyvad, B. (2017). Enamel Erosion by Some Soft Drinks and Orange Juices
Relative to Their pH, Buffering Effect and Contents of Calcium Phosphate. Available at:
https://www.ncbi.nlm.nih.gov/pubmed/9831784 [Accessed 6 Nov. 2017].
Lenny R. Vartanian, e., ,Marlene B. Schwartz and Kelly D. Brownell (2017). Effects of Soft
Drink Consumption on Nutrition and Health: A Systematic Review and Meta-Analysis |
AJPH | Vol. 97 Issue 4. [online] Ajph.aphapublications.org. Available at:
http://ajph.aphapublications.org/doi/abs/10.2105/AJPH.2005.083782 [Accessed 6 Nov.
2017].
Malik, V., Schulze, M. and Hu, F. (2017). Intake of sugar-sweetened beverages and weight
gain: a systematic review. [online] Ajcn.nutrition.org. Available at:
http://ajcn.nutrition.org/content/84/2/274.short [Accessed 9 Nov. 2017].
McGartland, C., Robson, P., Murray, L. and Cran, G. (2017). Carbonated Soft Drink
Consumption and Bone Mineral Density in Adolescence: The Northern Ireland Young Hearts
Project. Available at: https://www.ncbi.nlm.nih.gov/pubmed/12968664 [Accessed 9 Nov.
2017].
Montonen, J., Järvinen, R. and Knekt, P. (2017). Consumption of Sweetened Beverages and
Intakes of Fructose and Glucose Predict Type 2 Diabetes Occurrence. [online]
Jn.nutrition.org. Available at: http://jn.nutrition.org/content/137/6/1447.short [Accessed 9
Nov. 2017].
73 Soft Drinks Intake Behaviour among University Going Students.
Nada O. Kassem, e. and Jerry W. Lee (2017). Understanding soft drink consumption among
female adolescents using the Theory of Planned Behavior. Available at:
https://www.ncbi.nlm.nih.gov/pubmed/12828230 [Accessed 6 Nov. 2017].
Nur Mohammad Monsur, e. (2017). EBSCOhost | 35835928 | Risk Indicators for Tooth Loss
due to Caries and Periodontal Disease in Recipients of Free Dental Treatment in an Adult
Population in Bangladesh. [online] Eds.a.ebscohost.com. Available at:
http://eds.a.ebscohost.com/abstract?site=eds&scope=site&jrnl=16021622&AN=35835928&h
=gKnALLGLlZQX1b5a86f6uR8%2bA0K2BqAMX2EA34PDjt0liGdYJ4VPuQRv%2fvLTq
bUr87DtOawuatm8PIyIrqMUOg%3d%3d&crl=c&resultLocal=ErrCrlNoResults&resultNs=
Ehost&crlhashurl=login.aspx%3fdirect%3dtrue%26profile%3dehost%26scope%3dsite%26a
uthtype%3dcrawler%26jrnl%3d16021622%26AN%3d35835928 [Accessed 6 Nov. 2017].
Oxford Dictionaries | English. (2017). soft drink | Definition of soft drink in US English by
Oxford Dictionaries. [online] Available at:
https://en.oxforddictionaries.com/definition/us/soft_drink [Accessed 25 Oct. 2017].
Sanjay Basu, e., Martin McKee and Gauden Galea (2017). Relationship of Soft Drink
Consumption to Global Overweight, Obesity, and Diabetes: A Cross-National Analysis of 75
Countries | AJPH | Vol. 103 Issue 11. [online] Ajph.aphapublications.org. Available at:
http://ajph.aphapublications.org/doi/abs/10.2105/AJPH.2012.300974 [Accessed 6 Nov.
2017].
Shuster, e. and Logan, c. (2017). Soft drink consumption and urinary stone recurrence: A
randomized prevention trial. Available at: https://www.ncbi.nlm.nih.gov/pubmed/1624973
[Accessed 25 Oct. 2017].
Skinner, J., Byun, R. and Blinkhorn, A. (2017). Sugary drink consumption and dental caries
in New South Wales teenagers. Available at:
https://www.ncbi.nlm.nih.gov/pubmed/25988969 [Accessed 25 Oct. 2017].
Slater, P., Gkolia, P., Johnson, H. and Thomas, A. (2017). Patterns of soft drink consumption
and primary tooth extractions in Queensland children. Available at:
https://www.ncbi.nlm.nih.gov/pubmed/21133943 [Accessed 25 Oct. 2017].
74 Soft Drinks Intake Behaviour among University Going Students.
Statista. (2017). U.S. per capita consumption of soft drinks, 2015 | Statistic. [online]
Available at: https://www.statista.com/statistics/306836/us-per-capita-consumption-of-soft-
drinks/ [Accessed 25 Oct. 2017].
Sweetman, C., Wardle, J. and Cooke, L. (2017). Soft drinks and 'desire to drink' in
preschoolers.
The Nutrition Source. (2017). Soft Drinks and Disease. [online] Available at:
https://www.hsph.harvard.edu/nutritionsource/healthy-drinks/soft-drinks-and-disease/
[Accessed 25 Oct. 2017].
Unesda. (2017). Consumption - Unesda. [online] Available at:
http://www.unesda.eu/products-ingredients/consumption/ [Accessed 25 Oct. 2017].
Vasanti S Malik, e., Matthias B Schulze and Frank B Hu (2017). Intake of sugar-sweetened
beverages and weight gain: a systematic review1,2,3. [online] Available at:
http://ajcn.nutrition.org/content/84/2/274.short [Accessed 6 Nov. 2017].
www.statista.com. (2017). Topic: Non-alcoholic Beverages and Soft Drinks. [online]
Available at: https://www.statista.com/topics/1662/non-alcoholic-beverages-and-soft-drinks-
in-the-us/ [Accessed 25 Oct. 2017].
Zidbits - Learn something new everyday!. (2017). Why Are Carbonated Beverages Called
Soft Drinks?. [online] Available at: https://zidbits.com/2011/07/why-are-carbonated-
beverages-called-soft-drinks/ [Accessed 25 Oct. 2017].