Embed Size (px)
Citation preview

A Survey of the Lower Limb Amputee
Population in Scotland 2010
SPARG Scottish Physiotherapy Amputee
Research Group
National Centre for Prosthetics
and Orthotics
University of Strathclyde
Curran Building
131 St Jamesrsquo Road
Glasgow G4 0LS
Westmarc
Southern General Hospital
1345 Govan Road
Glasgow G51 4TF
November 2012
Authors
Ms H Scott SPARG Chairman
Dr R Patel Data Analyst
Ms J Hebenton SPARG Data Management Group
1
Contents
Tables and Figures 3
1 Acknowledgements 5
2 Executive Summary 6
3 Results Demographic Profiles 9
31 Introduction 9
32 Amputee Details 9 321 Age and Sex Distribution 9 322 Diabetic Amputees 9 323 Aetiology of Amputation 10 324 Level of Amputation10 325 Patients Fitted with a Prosthesis 11 326 Prosthetic Rehabilitation Abandoned 12 327 Mortality 12 328 Final Outcome Summary 12 329 Bilateral Amputations in Same Episode of Care 13 3210 Unilateral and Bilateral Amputees 13 3211 Revisions and Re-amputations 14 3212 Functional Co-morbidities Index 14
33 Physiotherapy and Rehabilitation 15 331 Compression Therapy 15 332 Early Walking Aids 15 333 Mobility Outcomes Locomotor Capabilities Index 5 (LCI 5) 16
4 Milestone Data 17
41 Statistics Presented 17
42 Days to Casting 18
43 Casting to Delivery 18
44 Days to Inpatient Discharge Fitted with a Prosthesis 19
45 Days to Inpatient Discharge Not Fitted with a Prosthesis 19
46 Days from Inpatient Discharge to Outpatient Discharge 20
5 Trends in Compression Therapy and Early Walking Aids (EWAs) 21
51 Statistics Presented 21
52 Trends in Compression Therapy 21
53 Trends in Early Walking Aids 22
6 Individual Hospital Summaries for 2010 ndash Key Performance Indicators 23
61 Final Outcome (all) 23
62 Milestones (Unilateral trans-tibial amputees) 25
2
References 26
Appendix A Project Work 27
Appendix B List of SPARG Database reporting facilities 28
Appendix C SPARG Hospitals and Physiotherapists 30
Appendix D Aetiology Mapping 34
Appendix E Locomotor Capabilities Index 5 35
Appendix F Functional Co-morbidities Index 36
Appendix G Data Cleaning Steps 37
3
Tables and Figures
Table 1 Percentage of amputees who were limb fitted in each of the amputating centre (gt 5 amputees) 7
Table 321 Age and sex of amputee population 2002 - 2010 9
Table 322 Diabetic amputees age and sex 2009 amp 2010 9
Table 323 Aetiology of amputation 2005 - 2010 10
Table 324 Level of amputation 2005 - 2010 10
Table 3251 Patients fitted with a prosthesis 2002 - 2010 11
Table 3252 Patients fitted with a prosthesis by level 2002 - 2010 11
Table 3253 Patients fitted with a prosthesis bilateral 2002 - 2010 11
Table 3254 Sex and limbfitting outcome 2010 11
Table 326 Prosthetic rehabilitation abandoned 2005 - 2010 12
Table 327 Mortality 2007 - 2010 12
Table 328 Outcome summary 2007 - 2010 12
Table 329 Bilateral amputations 2002-2010 13
Table 32101 Unilateral and bilateral amputees 2005 ndash 2010 13
Table 32102 Bilateral amputees 2005 - 2010 13
Table 32111 Revisions and re-amputations 2005-2010 14
Table 32112 Transtibial to transfemoral re-amputations 2005-2010 14
Table 32121 Functional Co-morbidities Score 2010 14
Table 331 Type of compression therapy used 2005-2010 15
Table 332 Type of EWA used 2005-2010 15
Table 333 Locomotor Capabilities Index by level 2008 to 2010 16
Table 421 Days to casting milestone descriptive statistics 2010 18
Figure 422 Median days to casting milestone 1997-2010 (2001 ndash 2010 ndash Unilateral Only) 18
Table 431 Casting to delivery milestone descriptive statistics 2010 18
Table 432 Median casting to delivery milestone 1997-2010 (2001 ndash 2010 ndash Unilateral Only) 18
Table 441 Days to inpatient discharge patients fitted with a prosthesis descriptive statistics 2010 19
Table 442 Median days to inpatient discharge patients fitted with a prosthesis 1997-2010 (2001 ndash 2010 ndash Unilateral Only) 19
Table 451 Days to inpatient discharge patients not fitted with a prosthesis descriptive statistics 2010 19
Table 452 Median days to inpatient discharge patients not fitted with a prosthesis 1997-2010 (2001 ndash 2010ndash Unilateral Only) 19
Table 461 Days from inpatient discharge to outpatient discharge all amputees 2010 20
4
Table 462 Days from inpatient discharge to outpatient discharge limb-fitted amputees 2010 20
Table 463 Days from inpatient discharge to outpatient discharge limb-fitted amputees 2006 - 2010 20
Table 464 Days from inpatient discharge to outpatient discharge non limb-fitted amputees 2010 20
Table 521 Patients receiving compression therapy within 10 days of amputation () 1994 ndash 2010 21
Figure 522 Percentage of transtibial and transfemoral amputees receiving compression therapy within 10 days of amputation surgery 1993 - 2010 21
Table 531 Patients using EWAs within 10 days of amputation () 1994 - 2010 22
Figure 532 Percentage of transtibial and transfemoral amputees using EWAs within 10 days of amputation surgery 1993 -- 2010 22
Table 61 The number of amputees at each hospital the data completeness and FCI 2010 23
Table 62 Key Performance Indicators by Amputating hospital 2010 24
Table 63 Key Performance Indicators by Amputating hospital 2010 25
5
1 Acknowledgements
We wish to thank all physiotherapists colleagues and amputees who are involved in the work of SPARG and without whose loyal tireless and determined support this work would not have been accomplished
6
2 Executive Summary
Introduction
This is the 18th Annual Report of data collected from lower limb amputees in Scotland by the Scottish Physiotherapy Amputee Research Group (SPARG) All major amputations carried out in 2010 are included that is ankle disarticulation (AD) trans-tibial (TT) knee disarticulation (KD) trans-femoral (TF) hip disarticulation (HD) and trans-pelvic Patients having partial foot amputations and amputation of the toes are excluded
All data are entered locally onto the SPARG web-based database The data base has reporting facilities which allow for local data checking and analysis (see Appendix A for list of available reports)
National and individual hospital data are presented in this report Individual hospital data are summarised to facilitate comparison of outcomes and the benchmarking of services The data items or key performance indicators for each hospital were identified by a previous national multidisciplinary benchmarking exercise (Scott and Patel 2009)
Once again the national data are broadly consistent with these from previous years significant changes and trends of note are reported in this summary Where possible comparisons are given in the body of the report for at least the 5 years 2005-2010
Results
In 2010 there were 740 amputees and 763 amputations some patients having a re-amputation to a higher level or a bilateral amputation during the same episode of care Numbers have remained the same for the past three years
The quality management ldquodata checkingrdquo system introduced in 2003 continues to be highly successful The percentage of records which are complete in every respect is 931
Demographic data remain similar over 5 years The mean age at amputation is 685 years in 2010 and peripheral arterial disease with or without diabetes accounted for 865 of all amputations The percentage of amputations due to diabetes has risen slightly to 45 In this group males outnumber females by 261 and the mean age at amputation is four years less than the group with peripheral arterial disease without diabetes
The percentage of amputations carried out at a TT level in 2010 was 50 reduced from a peak of 60 in 2007 When individual hospital data are examined the differences are large varying from 80 to 38
43 of all amputees are fitted with a prosthesis When examined by level 70 of TT and 32 of TF amputees are fitted There is still discrepancy between males and females fitted with a prosthesis with significantly more men being fitted than women (TT MF=7559) (TF MF=4020) When individual hospital data are examined the differences in percentage of amputees being successfully fitted are large varying from 58 to 29
7
Table 1 Percentage of amputees who were limb fitted in each of the amputating centres (gt 5 amputees)
For the fifth year the figures for prosthetic rehabilitation being abandoned are reported These are unilateral TT= 14 unilateral TF=102 and bilateral 51
Discussion and Conclusions
New local audit research and development projects
The SPARG data set has been central to several additional pieces of work as follows (see Appendix A for further details) -
An MSc project analysing SPARG data for patients having undergone a TT or TF amputation for peripheral arterial disease (PAD) with or without diabetes in the years 2007 to 2009 has revealed that in this cohort proportionally half as many women were successfully fitted with a prosthesis as their male counterparts (Smith 2012)
A collaborative project linking SPARG data to vascular surgery data to investigate factors affecting survival following major lower limb amputation for PAD with or without Diabetes indicates that those people not successfully fitted with a prosthesis have a significantly poorer long term survival rate compared with those who are fitted (Stuart 2012)
SPARG data was used to answer the question lsquoHas centralisation of the Vascular Service in Glasgow been successful A physiotherapists perspectiversquo This local audit revealed that in Glasgow the length of stay of non-limb fitted amputees transferred from the specialist amputating service to non-specialist wards had a significantly increased their mean length of stay by 28 days (Hebenton 2012)
The evidence based practice guideline lsquoExercise Intervention for the Treatment of Patients with Intermittent Claudicationrsquo was published this year (McNaughton et al 2012)
8
Changes in practice Prompted by the increased number of TF amputees abandoning prosthetic use SPARG developed a physical assessment tool to aid pre-prosthetic assessment of these patients the Trans-femoral Predictor (TFP) (Condie et al 2011) The TFP is now in use in several amputating centres and prosthetic services in the UK ensuring a more standardised and explicit physiotherapy assessment for TF amputee patients whose potential to use a prosthesis is uncertain Key messages from 2010 SPARG data-
1 The number of amputees and amputations has remained the same for the past 3 years
2 Outcomes vary significantly between hospitals most noticeably the proportion of amputations carried out at TT level and proportion limb fitted
3 Significantly fewer women are limb fitted compared to men 4 Fewer TF amputees are limb fitted and more abandon use of their prosthesis within
the rehabilitation period compared to TT amputees 5 Fewer patients are using early walking aid therapy for example PPAM aid within 10
days of surgery 6 Time from surgery to casting for first prosthesis has increased by 10 days for
transtibial amputees and 10 days for transfemoral amputees since 1997 Points for action -
SPARG physiotherapists require to investigate why there appears to be a trend for fewer amputees to be treated with EWAs prior to 10 days after surgery A critical literature review (Smith et al 2003) and Evidence Based Practice Guidelines (Dawson et al 2008 Bouch et al 2012) indicate that early use of these devices is associated with improved wound healing reduced post-operative oedema and earlier prosthetic fitting
The large variation in the proportion of amputees successfully limb fitted between centres warrants investigation by the local multidisciplinary teams as being more mobile after lower limb amputation not only improves quality of life (Pell et al 1993) but being fitted with a prosthesis is now linked to improved long term survival rates
Can outcomes for women after amputation be improved
Can long term survival rates of patients not fitted with a prosthesis be improved
Ms H Scott
Team Leader Physiotherapist and SPARG Chairman
Westmarc
Southern General Hospital
1345 Govan Road
Glasgow G51 4TF
helenscottggcscotnhsuk
9
3 Results Demographic Profiles
31 Introduction
National survey data are presented in this section Where possible comparisons are shown for 2002-2010
The total number of amputees for 2010 is 740 Data is available for 731 of these amputees therefore included in the analysis
32 Amputee Details
321 Age and Sex Distribution
The 2010 survey contains data from 731 amputees The distribution of age and sex for the years 2002-2010 are shown in table 321
2002 2003 2004 2005 2006 2007 2008 2009 2010
No of amputees 831 823 831 732 704 699 741 746 740
No of amputee with data 716 690 678 702 729 731
Age minimum 10 8 12 17 0 3 2 0 11
Age lower quartile 62 61 62 62 61 60 61 61 61
Age median 71 71 71 70 69 69 70 70 70
Age upper quartile 79 78 78 78 78 77 79 77 78
Age maximum 100 101 104 95 97 93 99 97 97
Mean age 69 6815 6876 6848 6749 6678 6814 6747 6850
Males 6412 6615 6510 6634 6749 6416 6209 6450 6703
Females 3588 3385 3490 3366 3251 3584 3791 3550 3297
Table 321 Age and sex of amputee population 2002 - 2010
not reported
322 Diabetic Amputees
The following table summarises the age and sex of amputees with an aetiology of PAD with Diabetes
2009 2010
Diabetes
PAD Without Diabetes
Unknown Aetiology
Diabetes PAD
Without Diabetes
Unknown Aetiology
Number of Amputees 284 323 7 332 306 4
Number with age available 280 319 0 328 302 3
Age Min 32 36 0 31 23 73
Age Lower Quartile 62 66 0 60 65 0
Age Median 70 73 0 69 73 0
Age Upper Quartile 76 80 0 77 80 0
Age Max 94 97 0 96 97 85
Age Mean 6829 7206 000 6795 7199 000
N Male 188 201 0 240 188 0
N Female 96 120 0 92 117 0
Male 6620 6262 000 7229 6164 000
Female 3380 3738 000 2771 3836 000
Table 322 Diabetic amputees age and sex 2009 amp 2010
10
323 Aetiology of Amputation
The incidence of each aetiology recorded is shown in table 323
2005 2006 2007 2008 2009 2010
N N N N N N
Peripheral arterial disease ndash without diabetes 343 4791 291 4217 280 4006 339 4593 323 4431 306 4186
Diabetes 277 3869 285 4130 289 4134 284 3848 284 3896 332 4542
Trauma or Burns 22 307 15 217 19 272 17 230 16 219 11 150
Tumour 8 112 14 203 13 186 10 136 18 247 9 123
Congenital deformity 3 042 6 087 1 014 4 054 11 151 2 027
Drug abuse 4 056 4 058 6 086 6 081 12 165 5 068
Venous disease 7 098 7 101 5 072 7 095 2 027 10 137
Orthopaedic 29 405 33 478 31 443 33 447 33 453 28 383
Blood-borne infection 4 056 4 058 9 129 10 136 2 027 5 068
Renal Failure 3 042 4 058 1 014 6 081 5 069 5 068
Other 15 209 18 261 17 243 19 257 16 219 14 192
Not recorded 1 014 9 130 28 401 3 041 7 096 4 055
Total 716 10000 690 10000 699 10000 738 10000 729 10000 731 10000
Table 323 Aetiology of amputation 2005 - 2010
324 Level of Amputation
Table 324 shows the incidence of six levels of amputation for the years 2005-2010 For amputees who had bilateral amputations in the reported period both amputations are included in the data The number of levels recorded will therefore be greater than the number of amputees for any given year The level indicates the final level of the amputation following any further surgery within the same period of hospital admission
Table 324 Level of amputation 2005 - 2010
2005 2006 2007 2008 2009 2010
N N N N N N
Transtibial 378 4948 382 5162 444 6041 432 5475 410 5304 383 5020
Transfemoral 367 4804 344 4649 268 3646 337 4271 321 4153 348 4561
Transpelvic 7 092 4 054 1 014 0 000 0 000 2 026
Hip Disarticulation 10 131 5 068 3 041 5 063 10 129 11 144
Knee Disarticulation 0 000 4 054 7 095 11 139 30 388 19 249
Ankle Disarticulation 1 013 0 000 1 014 2 025 2 026 0 000
Other 0 000 1 014 0 000 0 000 0 000 0 000
Not recorded 1 013 0 000 11 150 2 025 0 000 0 000
Total 764 10000 740 10000 735 10000 789 10000 773 10000 763 10000
11
325 Patients Fitted with a Prosthesis
The number of patients fitted with a prosthesis at final discharge is shown in table 3251 Limb-fitting by level of amputation is shown in table 3252 Since 2002 data on bilateral patients has been reported separately Table 3252 shows unilateral patients only for 2002-2010 and the bilateral patients for those years are shown in table 3253 Table 3254 shows the proportion of males and females who were fitted with a prosthesis Those patients who have abandoned limb-fitting are not included in this limb-fitted patient group
2002 2003 2004 2005 2006 2007 2008 2009 2010
Number of amputees 831 823 831 716 690 678 702 729 731
Number fitted 360 359 302 268 289 312 297 301 315
Percentage fitted () 4332 4362 3634 3743 4188 4464 4231 4129 4309
Table 3251 Patients fitted with a prosthesis 2002 - 2010
2002 2003 2004 2005 2006 2007 2008 2009 2010
Transtibial () 6256 6657 6035 5563 6463 6311 6818 6769 6967
Transfemoral () 2608 3138 2071 2590 2617 2927 2480 2414 3199
Other () 2500 5000 4375 588 4167 6154 2353 1714 1154
Table 3252 Patients fitted with a prosthesis by level 2002 - 2010
2002 2003 2004 2005 2006 2007 2008 2009 2010
Bilateral any level() 3293 2695 2083 2288 2213 2824 2336 2374 2977
Table 3253 Patients fitted with a prosthesis bilateral 2002 - 2010
Table 3254 Sex and limbfitting outcome 2010
Transtibial Unilateral
Transfemoral Unilateral
Bilateral
Total Males 216 166 90
Total Females 85 108 39
Males Limbfitted 162 66 32
Females Limbfitted 50 22 5
of Males Limbfitted 7500 3976 3556
of Females Limbfitted 5882 2037 1282
12
326 Prosthetic Rehabilitation Abandoned
There are a number of patients each year who are initially fitted with a prosthesis but for whom prosthetic treatment is abandoned prior to their final discharge For the purposes of this report these patients are included in the ldquonot limb-fittedrdquo group as this is their final outcome on discharge
2005 2006 2007 2008 2009 2010
n of init fitted
n of init fitted
n of init fitted
n of init fitted
n of init fitted
n of init fitted
All patients 20 694 29 912 29 850 20 595 24 738 15 425
Unilateral TTA 7 402 8 404 10 411 11 475 6 293 3 142
TFA 9 1111 12 1509 14 1892 7 1045 13 1711 10 1031
Other 0 000 0 000 2 2000 0 000 0 000 0 000
Bilateral 4 1250 9 2500 3 750 2 588 5 1316 2 488
Table 326 Prosthetic rehabilitation abandoned 2005 - 2010
327 Mortality
Table 327 gives the inpatient mortality rates for 2010 This is the proportion of amputees who died within 30 days of their respective amputation (see also 328 for overall)
2007 2008 2009 2010
Number of amputees 678 702 729 731
Deaths within 30 days of amputation surgery 41 43 44 54
30 day mortality () 605 613 604 739
Table 327 Mortality 2007 - 2010
328 Final Outcome Summary
Table 328 gives a summary of gross outcomes for all amputees at the time of final discharge from physiotherapy whether at in patient discharge or after a period of out patient treatment in 2009
2007 2008 2009 2010
N of all
amputees N
of all amputees
N of all
amputees N
of all amputees
Limb-fitted 325 4794 297 4231 301 4129 315 4309
Not Limb-fitted 232 3422 291 4145 306 4198 274 3748
Of which abandoned (29) (428) (20) (285) (24) (329) (15) (205)
Deceased (inpatient or outpatient) 93 1372 125 1781 104 1427 134 1833
Unknown 28 413 25 356 18 247 8 109
Table 328 Outcome summary 2007 - 2010
13
329 Bilateral Amputations in Same Episode of Care
The number and levels of bilateral amputations carried out in the same episode of care are shown in table 329 below for 2002-2010
2002 2003 2004 2005 2006 2007 2008 2009 2010
Transtibial x 2 19 24 13 9 14 23 16 14 13
Transfemoral x 2 16 13 20 11 13 6 12 13 12
Transfemoral amp Transtibial 7 4 6 1 9 8 2 4 5
Other 2 1 3 0 0 0 3 4 1
Total 44 42 42 21 36 37 33 35 31
Table 329 Bilateral amputations 2002-2010
3210 Unilateral and Bilateral Amputees
The table 32101 shows the number of unilateral and bilateral amputees for the years 2005-2010 In this table bilateral amputees includes all amputees who were bilateral in the reported year
The bilateral amputees are defined in more detail in table 32102 where there are 2 groups shown those amputees who had a prior amputation and those who were not previously amputees that is underwent bilateral amputations in the same episode of care
2005 2006 2007 2008 2009 2010
N N N N N N
Number of amputees 716 10000 690 10000 678 10000 738 10000 729 10000 731 10000
Unilateral amputees 598 8370 568 8232 546 8053 601 8144 590 8093 610 8254
Bilateral amputees 118 1630 122 1768 131 1932 137 1856 139 1907 129 1746
Unknown 0 0 0 000 0 000 0 000 0 000 0 000
Table 32101 Unilateral and bilateral amputees 2005 ndash 2010
Table 32102 Bilateral amputees 2005 - 2010
Note - here show proportion of all bilateral amputees in each group
2005 2006 2007 2008 2009 2010
N N N N N N
Bilateral Total 117 10000 122 1000 131 10000 137 10000 139 10000 129 10000
Bilateral ndash prior amputation(s)
97 7083 86 7049 94 7176 104 6861 104 7482 98 7597
Bilateral ndash both in same episode
21 2917 36 2951 37 2824 33 2701 35 2518 31 2403
14
3211 Revisions and Re-amputations
The number of amputees having revision or re-amputation surgery is shown in table 32111 A revision is defined as further primary stump surgery which may involve bone but does not change the level of amputation A re-amputation is defined as further surgery of the primary stump which changes the level of amputation Each revision and re-amputation is counted therefore amputees who had a revision then a re-amputation would be included in both counts
Re-amputations from the transtibial to the transfemoral level for 2005-2010 are shown in table 32112
2005 2006 2007 2008 2009 2010
N N N N N N
Amputations 716 10000 735 10000 732 10000 790 10000 783 10000 763 10000
Revisions 22 307 23 313 21 287 17 215 22 281 21 275
Re-amputations 31 433 37 503 36 492 36 456 48 613 49 642
Total revisions + re-amputations
53 740 60 816 57 779 53 671 70 894 70 917
Table 32111 Revisions and re-amputations 2005-2010
2005 2006 2007 2008 2009 2010
N N N N N N
Initial transtibial amputations 407 10000 424 10000 443 10000 433 10000 410 10000 425 10000
Re-amputated to transfemoral 29 713 41 967 36 813 33 762 40 976 40 941
Table 32112 Transtibial to transfemoral re-amputations 2005-2010
3212 Functional Co-morbidities Index
The Functional Co-morbidities Index (FCI) was incorporated into the data set from 2008 in an effort to account for the relatively high incidence of co-morbid disease in the lower limb amputee population (see Appendix E) It is reported for the first time in this report
The FCI is completed by scoring 1 if a disease is present that is diagnosed and recorded in the medical notes of a patient and 0 if not A score of 0 indicates no co-morbid disease and a score of 18 the highest number of co-morbid illnesses
Number Min
Lower
Quartile Median
Upper
Quartile Max Mean
All Patients 731 0 2 3 4 10 307
Unilateral TTA 300 0 2 3 4 10 317
Unilateral TFA 272 0 2 3 4 8 294
Other 28 0 2 3 4 6 288
Bilateral 131 0 2 3 4 8 336
Diabetic 332 0 2 35 5 9 374
PAD without Diabetes 306 0 2 3 4 10 282
Other 14 0 1 2 3 4 207
Table 32121 Functional Co-morbidities Score 2010
15
33 Physiotherapy and Rehabilitation
331 Compression Therapy
Compression therapy of the stump is widely used and figures for 2005-2010 are presented in table 333 These figures relate to the number of modalities used if a single amputee received more than one type of therapy these would both appear in the table Patients who died while registered as inpatients are excluded
As of the 2004 report Crepe Bandage has been removed from this section as it is not considered to be a form of compression therapy rather a post-operative dressing and will no longer be reported Patients using the PPAM aid and sleeve as compression therapy ie without the frame and non-weight bearing are also recorded from 2007
2005 2006 2007 2008 2009 2010
N N N N N N
Elset S bandage 37 747 24 484 12 227 16 266 10 128 5 087
Flowtron 2 040 3 060 13 246 8 133 27 345 12 209
Plaster cast 78 1576 62 1250 82 1550 98 1628 127 1624 89 1551
Shrinker sock 371 7495 378 7621 379 7164 425 7060 519 6637 392 6829
Silicone Sleeve 3 061 0 000 9 170 21 349 7 090 8 139
Other 4 081 10 202 6 113 1 017 7 090 1 017
PPAM - - - - 28 529 33 548 85 1087 67 1167
Total 157 10000 496 10000 529 10000 602 100 782 10000 574 10000
Table 331 Type of compression therapy used 2005-2010
332 Early Walking Aids
The types of Early Walking Aids (EWA) used in 2004-2009 are shown in table 334 Note that these figures relate to the number of devices used if a single amputee used more than one type of EWA both would appear in the table Patients who died while registered as inpatients are excluded
Table 332 Type of EWA used 2005-2010
2005 2006 2007 2008 2009 2010
N N N N N N
AMA 0 000 3 083 6 157 6 152 8 156 3 076
Femurett 42 1243 54 1496 46 1201 51 1288 71 1387 47 1190
PPAM 295 8728 304 8421 323 8433 339 8561 433 8457 342 8658
Other 1 030 0 000 8 209 0 000 0 000 3 076
Total 338 10000 361 10000 383 10000 396 10000 512 10000 395 10000
16
333 Mobility Outcomes Locomotor Capabilities Index 5 (LCI 5)
The LCI is a widely used and validated self report tool that measures a lower limb amputeersquos locomotor capabilities with their prosthesis during and after rehabilitation (Condie et al 2006)
It was developed and validated as part of the Prosthetic Profile of the Amputee Questionnaire and can be used in isolation (Gauthier-Gagnon and Grise 2001) It consists of 14 items divided into 2 subscales basic and advanced (see Appendix C) Each item is scored on a 4 point ordinal scale giving a total maximum score of 42 with sub-scores of 21 for the basic and advanced activities
The LCI5 is an amended version of the LCI in which the upper ordinal level is split into 2 according to the use or non use of walking aids to give maximum sub-scores of 28 and total score of 56 (Franchignoni et al 2007) The LCI 5 has been found to reduce the ceiling effect associated with the LCI by 50 (Franchignoni et al 2004 Franchignoni et al 2007)
The higher the score of the LCI 5 the greater the capabilities of the amputee The LCI5 is completed retrospectively for the amputee patientrsquos mobility six months prior to their amputation and prospectively on final discharge The difference between these two scores is calculated for each patient to give a score for their change in mobility A positive score indicates an improvement in mobility and a negative score deterioration All Basic and Advanced values in the tables below are the mean values
Table 333 Locomotor Capabilities Index by level 2008 to 2010
2008 612 Pre-amp Final Outcome
Basic Adv Total Basic Adv Total Change N
Transtibial 24 20 44 21 16 37 -7 213
Transfemoral 25 22 47 20 13 33 -14 51
Bilateral 24 22 46 22 15 37 -9 8
2009 612 Pre-amp Final Outcome
Basic Adv Total Basic Adv Total Change N
Transtibial 24 21 45 21 16 37 -8 208
Transfemoral 23 20 43 16 11 27 -16 60
Bilateral 20 16 36 16 11 27 -9 28
2010 612 Pre-amp Final Outcome
Basic Adv Total Basic Adv Total Change N
Transtibial 24 20 44 20 15 35 -9 221
Transfemoral 24 21 45 18 13 31 -14 63
Bilateral 23 17 40 17 9 26 -14 26
17
4 Milestone Data
41 Statistics Presented
This section of the report deals with the statistical analysis of the rehabilitation milestones The three rehabilitation milestones are shown in the table below-
Milestones Names by which milestones are
referred to in this report
Number of days from primary amputation to casting for prosthesis lsquodays to castingrsquo
Number of days from casting to delivery of prosthesis where delivery is defined as the date at which the patient begins gait
training with the prosthesis ndash finished or unfinished lsquocasting to deliveryrsquo
Number of days from primary amputation to inpatient discharge lsquodays to inpatient dischargersquo
For each milestone the following descriptive statistics are presented the number of amputees included in the analysis minimum lower quartile median upper quartile maximum days
Only patients who were limb-fitted by inpatient or outpatient discharge are included in days to casting and casting to delivery
Where patients have undergone revisions or re-amputations the latest date of surgery is used as the date of amputation The final level in the case of re-amputations to higher levels is used to group the patients for this milestone
Days to inpatient discharge is the length of stay in hospital for each amputee calculated in days from the date of amputation The length of stay for bilaterals amputated in same hospital admission is calculated from the date of first surgery
The length of hospital stay for patients re-amputated to a higher level will be calculated from the date of their final amputation
For all milestones patients who died as inpatients or as outpatients are excluded
Groups with results prepared for all milestones
Additional groups for days to inpatient discharge
Transtibial Unilateral Fitted Transtibial Unilateral Not Fitted
Transfemoral Unilateral Fitted Transfemoral Unilateral Not Fitted
Bilateral Fitted Bilateral Not Fitted
Bilateral includes all those who underwent one amputation in the report period having had a prior amputation(s) and those who underwent bilateral amputations in the report period having had no prior amputations
For each milestone and each group the statistics represent available data In addition median days are shown for 1996-2010 with 1996-2000 including bilateral patients and 2001-2010 unilateral only
Additionally for 2010 table 46 shows the days from inpatient discharge to outpatient discharge for transtibial unilateral transfemoral unilateral and bilateral patients
18
42 Days to Casting
Transtibial Unilateral
Transfemoral Unilateral
Bilateral
Number Included 206 79 39
Minimum 10 15 20
Lower Quartile 31 33 39
Median 46 49 67
Upper Quartile 6475 835 127
Maximum 319 289 262
Table 421 Days to casting milestone descriptive statistics 2010
0
10
20
30
40
50
60
Med
ian
days t
o c
asti
ng
Transtibial 35 36 38 40 415 395 40 39 40 43 40 49 43 47
Transfemoral 40 34 41 37 34 41 415 415 46 43 45 47 50 50
1997 1998 1999 2000 2001 2002 2003 2004 2005 2006 2007 2008 2009 2010
Figure 422 Median days to casting milestone 1997-2010 (2001 ndash 2010 ndash Unilateral Only)
43 Casting to Delivery
Transtibial Unilateral
Transfemoral Unilateral
Bilateral
Number Included 206 82 40
Minimum 1 2 2
Lower Quartile 7 13 7
Median 10 15 125
Upper Quartile 14 21 1725
Maximum 126 71 38
Table 431 Casting to delivery milestone descriptive statistics 2010
Table 432 Median casting to delivery milestone 1997-2010 (2001 ndash 2010 ndash Unilateral Only)
1997 1998 1999 2000 2001 2002 2003 2004 2005 2006 2007 2008 2009 2010
Transtibial 12 20 20 16 14 14 14 14 14 14 13 14 13 10
Transfemoral 16 21 20 21 22 155 14 14 14 155 14 15 15 15
19
44 Days to Inpatient Discharge Fitted with a Prosthesis
Transtibial Unilateral
Transfemoral Unilateral
Bilateral
Number Included 203 77 34
Minimum 5 7 6
Lower Quartile 335 34 325
Median 59 58 68
Upper Quartile 865 113 1575
Maximum 331 524 288
Table 441 Days to inpatient discharge patients fitted with a prosthesis descriptive statistics 2010
1997 1998 1999 2000 2001 2002 2003 2004 2005 2006 2007 2008 2009 2010
Transtibial 59 63 60 62 57 61 53 55 54 56 55 55 55 59
Transfemoral 66 66 60 54 655 71 69 555 635 57 58 675 53 59
Table 442 Median days to inpatient discharge patients fitted with a prosthesis 1997-2010 (2001 ndash 2010 ndash Unilateral Only)
45 Days to Inpatient Discharge Not Fitted with a Prosthesis
Transtibial Unilateral
Transfemoral Unilateral
Bilateral
Number Included 57 128 72
Minimum 0 1 5
Lower Quartile 21 20 15
Median 55 435 28
Upper Quartile 101 75 58
Maximum 323 524 310
Table 451 Days to inpatient discharge patients not fitted with a prosthesis descriptive statistics 2010
1997 1998 1999 2000 2001 2002 2003 2004 2005 2006 2007 2008 2009 2010
Transtibial 61 46 61 47 43 50 37 52 515 66 605 62 61 45
Transfemoral 36 36 45 40 425 48 41 42 47 52 46 47 51 41
Table 452 Median days to inpatient discharge patients not fitted with a prosthesis 1997-2010 (2001 ndash 2010ndash Unilateral Only)
20
46 Days from Inpatient Discharge to Outpatient Discharge
The following tables describe outpatient treatment length however this does not take into account the frequency or type of rehabilitation treatment which will vary from hospital to hospital The 3 tables show respectively all amputees limb-fitted and not limb-fitted
Transtibial Unilateral
Transfemoral Unilateral
Bilateral
Number Included 177 106 34
Minimum 2 9 3
Lower Quartile 40 3225 415
Median 91 82 95
Upper Quartile 174 19325 166
Maximum 577 502 509
Table 461 Days from inpatient discharge to outpatient discharge all amputees 2010
Table 462 Days from inpatient discharge to outpatient discharge limb-fitted amputees 2010
Table 463 Days from inpatient discharge to outpatient discharge limb fitted amputees 2006 ndash 2010
Transtibial Unilateral
Transfemoral Unilateral
Bilateral
Number Included 13 36 9
Minimum 2 10 3
Lower Quartile 20 29 46
Median 34 435 74
Upper Quartile 98 86 132
Maximum 241 329 160
Table 464 Days from inpatient discharge to outpatient discharge non limb-fitted amputees 2010
Transtibial Unilateral
Transfemoral Unilateral
Bilateral
Number Included 164 70 25
Minimum 4 9 21
Lower Quartile 4275 5425 34
Median 95 1285 111
Upper Quartile 17625 24575 176
Maximum 577 502 509
2006 2007 2008 2009 2010
N Median n Median n Median n Median n Median
Unilateral TTA 91 148 160 84 153 103 152 935 164 95
TFA 35 160 51 122 50 885 57 133 70 1285
Bilateral 13 209 29 71 24 66 25 66 25 111
21
5 Trends in Compression Therapy and Early Walking Aids (EWAs)
51 Statistics Presented
This chapter looks at trends in the use of compression therapy and Early Walking Aids (EWAs) All patients receiving compression therapy or EWA therapy are included in each analysis
52 Trends in Compression Therapy
Of the patients receiving compression therapy the percentage who received it within 10 days of amputation is shown in table 521 for 1993-2009 A line chart representing this data is shown in figure 522
94 95 96 97 98 99 00 01 02 03 04 05 06 07 08 09 10
TT 285 406 528 527 498 507 613 698 662 678 655 544 475 528 557 511 553
TF 329 351 472 495 456 584 581 537 493 638 553 495 436 416 452 402 391
Table 521 Patients receiving compression therapy within 10 days of amputation () 1994 ndash 2010
Figure 522 Percentage of transtibial and transfemoral amputees receiving compression therapy within 10 days of
amputation surgery 1993 - 2010
22
53 Trends in Early Walking Aids
Of the patients receiving EWA therapy the percentage who received it within 10 days of amputation is shown in table 531 for 1994-2010 A line chart representing this data is shown in figures 532
94 95 96 97 98 99 00 01 02 03 04 05 06 07 08 09 10
TT 242 343 232 251 251 291 288 359 271 233 259 239 183 215 176 149 160
TF 246 179 258 271 269 309 245 262 267 212 212 149 133 156 235 121 154
Table 531 Patients using EWAs within 10 days of amputation () 1994 - 2010
Figure 532 Percentage of transtibial and transfemoral amputees using EWAs within 10 days of amputation surgery 1993 -
- 2010
23
6 Individual Hospital Summaries for 2010 ndash Key Performance Indicators
61 Final Outcome (all)
This section presents the national data broken down by amputating hospital
The number of amputees at each hospital the data completeness and Functional Comorbidities Index (see Appendix E) are shown in table 61
Table 61 The number of amputees at each hospital the data completeness and FCI 2010
Key -
Hospital Hospital Name
Total Number Total number of amputees ie SPARG forms issued
Number returned Number of amputees that have SPARG form retrieved
returned Percentage of retrieved SPARG forms
Number incomplete Number of retrieved forms with missing data
FCI Median Functional Co-morbidities Score (Appendix E)
Hospital Total number
Number returned
Returned
Number incomplete FCI
Aberdeen Royal Infirmary 81 81 10000 2 40
The Ayr Hospital 44 44 10000 1 30
Balfour Hospital 2 2 10000 0 45
Borders Unknown 0 0 na unknown
Dumfries amp Galloway Royal Infirmary
37 37 10000 23 20
Gartnavel General Hospital 33 33 10000 0 30
Gilbert Bain Hospital 2 2 10000 0 15
Glasgow Royal Infirmary 55 55 10000 0 30
Hairmyres Hospital 59 58 9831 2 30
Inverclyde Royal Hospital 17 17 10000 4 30
Ninewells Hospital 111 111 10000 0 30
Queen Margaret Hospital 23 23 10000 0 30
Raigmore Hospital 42 40 9524 1 30
Ross Hall Hospital 1 1 10000 0 20
Royal Alexandria Hospital 7 6 8571 3 20
Royal Infirmary of Edinburgh 102 101 9902 0 30
Southern General Hospital 36 34 9444 3 30
St Johns Hospital At Howden 1 1 10000 0 10
Stirling Royal Infirmary 30 28 9000 0 30
Victoria Infirmary 5 5 10000 0 30
Western Infirmary 34 34 10000 1 30
Wishaw General Hospital 10 10 10000 0 35
Woodend General Hospital 5 5 10000 0 10
Yorkhill Hospital 3 3 10000 2 00
Total 740 731 9878 42 30
24
Outcomes for each amputating centre are shown in table 62
Table 62 Key Performance Indicators by Amputating hospital 2010
Key
TTA Percentage of transtibial amputees
LF Percentage of amputees who were limb fitted
Mortality Percentage of amputees who died within 30 days of amputation
Abandoned Percentage of amputees who abandoned limb fitting in rehabilitation period
Re-admissions Percentage of amputees who were readmitted after initial inpatient discharge
Wound Infection Percentage of amputees with wound infection within rehabilitation period that is amputee demonstrates symptoms of infection (localised erythema pain heat cellulitis oedema andor a positive wound swab and is commenced on antibiotics andor a topical treatment)
Number data available
TTA
LF
Mortality
Abandoned
Readmissions WI
Aberdeen Royal Infirmary 81 4568 4198 1481 247 247 4074
The Ayr Hospital 44 6136 5682 909 227 1818 2955
Balfour Hospital 2 000 000 000 000 000 000
Dumfries amp Galloway Royal Infirmary 37 4865 4324 1081 000 811 1892
Gartnavel General Hospital 33 5152 5758 303 303 909 3636
Gilbert Bain Hospital 2 5000 5000 000 000 5000 000
Glasgow Royal Infirmary 55 3818 3455 1273 909 545 3455
Hairmyres Hospital 58 3898 3390 339 508 1525 2542
Inverclyde Royal Hospital 17 5882 3529 588 000 000 2353
Ninewells Hospital 111 4505 4685 541 090 991 3333
Queen Margaret Hospital 23 4783 5217 000 000 1739 4783
Raigmore Hospital 40 6429 3810 714 000 714 2619
Ross Hall Hospital 1 10000 10000 000 000 000 000
Royal Alexandria Hospital 6 4286 2857 2857 1429 000 2857
Royal Infirmary of Edinburgh 101 4706 3431 784 098 588 2941
Southern General Hospital 34 5278 5278 278 000 833 1944
St Johns Hospital At Howden 1 000 000 000 000 000 10000
Stirling Royal Infirmary 28 7000 4333 333 000 333 3000
Victoria Infirmary 5 8000 10000 000 000 2000 4000
Western Infirmary 34 6765 3824 294 000 1471 3529
Wishaw General Hospital 10 4000 3000 1000 000 1000 6000
Woodend General Hospital 5 4000 8000 000 000 000 2000
Yorkhill Hospital 3 3333 6667 000 000 000 000
Total 731 4973 4284 730 203 865 3135
25
62 Milestones (Unilateral trans-tibial amputees)
The number of and milestones data for unilateral transtibial amputees are presented for each hospital
in Table 63
Number
Days to Compression Therapy
Days to EWA
Days to Casting
Days Casting to Delivery
Length of Hospital Stay
Aberdeen Royal Infirmary 32 115 14 32 8 74
The Ayr Hospital 22 29 36 63 14 33
Dumfries amp Galloway Royal Infirmary 14 155 33 73 14 59
Gartnavel General Hospital 16 35 11 465 15 32
Gilbert Bain Hospital 1 0 - - - 42
Glasgow Royal Infirmary 17 11 12 41 14 365
Hairmyres Hospital 17 12 17 84 14 25
Inverclyde Royal Hospital 6 0 165 53 265 575
Ninewells Hospital 42 8 13 345 7 59
Queen Margaret Hospital 8 0 18 48 7 685
Raigmore Hospital 23 0 17 325 1 50
Ross Hall Hospital 1 7 14 39 10 21
Royal Alexandria Hospital 3 43 95 62 9 61
Royal Infirmary of Edinburgh 39 13 22 61 10 106
Southern General Hospital 16 0 14 32 12 415
Stirling Royal Infirmary 18 7 42 54 22 785
Victoria Infirmary 4 8 115 305 10 455
Western Infirmary 15 8 10 53 17 33
Wishaw General Hospital 4 18 14 - 7 85
Woodend General Hospital 2 2 345 535 55 565
Yorkhill Hospital 1 0 - 26 8 -
Total 301 10 17 46 10 57
Table 63 Key Performance Indicators (milestones) by Amputating hospital 2010
Key -
Number Number of unilateral trans-tibial amputees
Days to CompTherapy Median days from final surgery to start of compression therapy
Days to EWA Median days from final surgery to start of early walking aid therapy eg PPAM aid
Days to casting Median days from final surgery to casting for prosthesis
Days casting to delivery Median days from casting to delivery of prosthesis
Length of hospital stay Median days from amputation to final inpatient discharge
26
References
Bouch E Burns K Geer E Fuller M and Rose A (2012) Guidance for the multidisciplinary team on the management of post-operative oedema in lower limb amputeesrsquo BACPAR University of Bradford (httpbacparcsporgukpublications)
Condie ME Jones D Treweek S (1996) lsquoA one year national survey of patients having lower limb amputationrsquo Physiotherapy 22 14-20
Condie E Scott H and Treweek S (2006) ndash Lower Limb Prosthetic Outcome Measures A Review of the Literature 1995 to 2005 Journal of prosthetics and Orthotics 181S13-30
Condie ME TreweekSP Whitehead L McFadyen AK (2011) The transfemoral fitting predictor (TPF) ndash A
functional measure to predict prosthetic fitting in transfemoral amputees validity and reliability Arch Phys Med Rehabil 92 (8) 1293 ndash 1297
Dawson I Divers C Furniss D (2008) lsquoPPPAM-aid Clinical Guidelines for Physiotherapistsrsquo Scottish Physiotherapy Amputee Research Group Glasgow (httpwwwknowledgescotnhsukspargaspx)
Gaultier-Gagnon C Grise M-C (2006) Tools to Measure Outcome of People with a Lower Limb Amputation Update on the PPA and LCI Journal of Prosthetics and Orthotics 181S61-67
Franchignoni F Orlandini D Ferriero G Moscato TA (2004) Reliability Validity and Responsiveness of the Locomotor Capabilities Index in Adults With Lower-Limb Amputation Undergoing Prosthetic Training Archives of Physical Medicine and Rehabilitation 85743-748
Franchignoni F Giordano A Ferriero G Munoz S Orlandini D Amoresano A (2007) Rasch analysis of the Locomotor Capabilities Index ndash 5 in people with lower limb amputation Prosthetics and Orthotics International 314394-404 Groll DL To T Bombardier C and Wright JG (2005) lsquoThe development of a co-morbidity index with physical function as an outcomersquo Journal of Clinical Epidemiology 58 595-602
JP Pell PT Donnan FGR Fowkes CV Ruckley (1993) lsquoQuality of life following lower limb amputation for peripheral arterial diseasersquo European Journal of Vascular Surgery 7 (4) 448ndash451
Scott HM and Patel R (2009) lsquoBenchmarking Primary Lower Limb Amputee Services for Years 2004 2005 and 2006rsquo ScotRET Prosthetics Service Group
Smith DG McFarland LV Sangeorzan BJ Reiber GE Czernieki JM (2003) lsquoPostoperative dressing and management strategies for transtibial amputation a critical reviewrsquo J of Rehabil Res and Devel 40(3)213
The lsquoMUSTrsquo Explanatory Booklet A guide to the lsquoMalnutrition Universal Screening Toolrsquo (lsquoMUSTrsquo) Produced by Malnutrition Advisory Group A standing committee of BAPEN httpwwwbapenorgukpdfsmustmust_explanpdf
27
Appendix A Project work
Completed projects -
Smith F Kennon B Paul L and Nichols N (2012) ldquoWhat are the key characteristics of an amputee population in relation to outcomerdquo MSc Dissertation Glasgow Caledonian University (publication pending) Further information available from Ms Fiona Smith Specialist Physiotherapist Western Infirmary Glasgow (Fionasmith6ggcscotnhsuk)
Stuart W Hussey K Ross P and Smith F (2012) lsquoIndicators of poor outcome following major amputationrsquo (publication pending) Further information available from Mr Wesley Stuart Consultant vascular Surgeon Western Infirmary Glasgow (wesleystuartggcscotnhsuk )
Hebenton J (2012) lsquoHas centralisation of the Vascular Service in Glasgow been successful A physiotherapists perspectiversquo Local audit Western Infirmary Glasgow Further information available from Mrs Joanne Hebenton Specialist Physiotherapist Western Infirmary Glasgow (joannehebentonggcscotnhsuk)
McNaughton M Robertson F Ross M Smith F Smith S and Whitehead L (2012) lsquoExercise Intervention for the Treatment of Patients with Intermittent Claudicationrsquo Scottish Physiotherapy Amputee Research Group Glasgow
(httpwwwknowledgescotnhsukspargaspx)
Ongoing projects -
Data linkage and longitudinal follow up of dysvascular amputees with and without diabetes examining in more detail their pre amputation morbidities amputee level and limb salvaging surgery with discharge destination and outcome Detailed analysis of their diabetic status and true mortality rates are also examined according to level and aetiology Further information available from Mr Wesley Stuart Consultant vascular Surgeon or Ms Fiona Smith Specialist Physiotherapist Western Infirmary Glasgow (Fionasmith6ggcscotnhsuk)
28
Appendix B List of SPARG Database reporting facilities
30 days mortality
Amputees fitted with a prosthesis and abandoned - by level (bilateral)
Amputees fitted with a prosthesis and abandoned - by level (unilateral only)
Amputees fitted with prosthesis for transfers only (bilateral)
Amputees fitted with prosthesis for transfers only (unilateral only)
Bilateral amputation surgery - by level
Check final outcome
Check important dates
Cognitive status - by aetiology
Cognitive status - by level
Compression therapy - by type
Days from casting to delivery
Days from final surgery to casting
Days from final surgery to compression therapy - by aetiology
Days from final surgery to compression therapy - by level (bilateral)
Days from final surgery to compression therapy - by level (unilateral only)
Days from final surgery to EWA - by aetiology
Days from final surgery to EWA - by level (bilateral)
Days from final surgery to EWA - by level (unilateral only)
Days from in-patient discharge to out-patient discharge - by aetiology
Days from in-patient discharge to out-patient discharge - by level (bilateral)
Days from in-patient discharge to out-patient discharge - by level (unilateral only)
Delayed healing - by aetiology
Delayed healing - by level (bilateral)
Delayed healing - by level (unilateral only)
Delayed in-patient discharge
EWAs - by type
Falls
Final outcome summary
Final outcome summary - by aetiology
Final outcome summary - by level (bilateral)
Final outcome summary - by level (unilateral only)
Functional co-morbidities index - by aetiology
Functional co-morbidities index - by level (bilateral)
Functional co-morbidities index - by level (unilateral only)
Gender and mean age
Gender and mean age - by aetiology
29
Gender and mean age - by level (bilateral)
Gender and mean age - by level (unilateral only)
Healthcare acquired infection (other)
Heamodialysis
Home circumstances
Interim discharge
Length of stay (days from final surgery to in-patient discharge) - limb fitted amputees by aetiology
Length of Stay (days from final surgery to in-patient discharge) - limb fitted amputees by level
Length of stay (days from final surgery to in-patient discharge) - non limb fitted amputees by aetiology
Length of Stay (days from final surgery to in-patient discharge) - non limb fitted amputees by level
Limb fitting - timing
Locomotor capabilities index 5 - by aetiology
Locomotor capabilities index 5 - by level
Overall summary - by aetiology
Overall summary - by level (bilateral)
Overall summary - by level (unilateral only)
Revisions and re-amputations in same episode
Wound infection - by aetiology
Wound infection - by level (bilateral)
30
Appendix C SPARG Hospitals and Physiotherapists
Glasgow Physiotherapy Dept
Drumchapel Hospital
129 Drumchapel Road
Glasgow G15 6PX
Ian MacFarlane Team leader
Ianmacfarlaneggcscotnhsuk
0141 211 6019
Physiotherapy Dept
Gartnavel General Hospital
1055 Great Western Road
Glasgow G12 OYN
Fiona Smith
Fionasmith6ggcscotnhsuk
0141 211 1814
Physiotherapy Dept
Glasgow Royal Infirmary
Queen Elizabeth Building
16 Alexandra Parade
Glasgow G31 2ER
Huda Saed
hsaedggcscotnhsuk
0141 211 1814
Royal Alexandra Hospital
Corsebar Road
Paisley PA2 9JH
Emma Kelly Senior Physiotherapist
emmakellyggcscotnhsuk
0141 887 9111
page 6643
Glasgow
Physiotherapy Dept
D Floor (old gastro unit)
Victoria Infirmary
Langside Road
Glasgow G42 9TY
Helen Scott
helenscottggcscotnhsuk
Physiotherapy Dept
WestMARC
Southern General Hospital
1345 Govan Road
Glasgow G51 4TF
Helen Scott
helenscottggcscotnhsuk
Ian Dawson
iandawsonggcscotnhsuk
Joanne Hebenton
joannehebentonggcscotnhsuk
0141 201 2636
or
0141 201 2639
Physiotherapy Dept
Royal Hospital for Sick Children
Yorkhill Quay
Glasgow
Caroline Grant
Carolinegrantggcscotnhsuk
0141 201 0063
Physiotherapy Dept
Western Infirmary
Dumbarton Road
Glasgow G11 6NT
Fiona Smith
Fionasmith6ggcscotnhsuk
Joanne Hebenton
joannehebentonggcscotnhsuk
0141 211 1814
or
0141 211 3000
bleep 4636
31
West amp Central
West amp Central
Physiotherapy Dept
Ayr Hospital
Dalmellington Road
Ayr KA6 6DX
Mary Kelso
Marykelsoaaahtscotnhsuk
Susan Geddes
Susangeddesaaahtscotnhsuk
01292 610 555
ext 4237
bleep 6314
fax 01292 614 585
Physiotherapy Dept
Hairmyres Hospital
East Kilbride
G75 8RD
Sally Smith
Sallysmithlanarkshirescotnhsuk
Abi Mackreill
Abigailmackriellanarkshirescotnhsuk
Physiotherapy Dept
Monklands Hospital Monkscourt Avenue
Airdrie ML6 OJS
Lorraine Senior
Lorraineseniorlanarkshirescotnhsnet
01236 748 748
page 129
Physiotherapy Dept
Wishaw Hospital
50 Netherton Sreet
Wishaw ML2 0DP
Angela McCusker
AngelaMccuskerlanarkshirescotnhsuk
01698 361 100
bleep 246
Physiotherapy Dept
Forth Valley Royal Hospital
Larbert
Carol Grant
carolgrant2nhsnet
Caroline Meadley
01324 566000
Carol
Pg 1599
Caroline
pg 1577
Physiotherapy Dept
St Johnrsquos Hospital
Howden Road West
Livingston
West Lothian EH54 6PP
Kerry Lawrie
KerryLawriewltscotnhsuk
01506 419 666
or
01506 523 000
bleep 694
Physiotherapy Dept
Vale of Leven Hospital
Alexandria G83 0UA
Morna Millar (Surgical)
Mornamillarvolscotnhsuk
01389 754 121
page 53096
01389 754 121
ext 27532
Physiotherapy Dept
Inverclyde Royal Infirmary
Larkfield Road
Greenock PA16 OX
Gerry Coffield
gerrycoffieldggcscotnhsuk
01475 633 777
or
01475 504 468
bleep 1132
32
Aberdeen Physiotherapy Dept
Aberdeen Royal Infirmary
Foresterhill Road
Aberdeen AB25 2ZN
Karen Duncan
kduncannhsnet
Dept 01224 553 409
Fax 01224 553 916
ARI 08454 566 000 ext 53409
bleep 3353
Physiotherapy Dept
Woodend Hospital
MARS
Eday Road
Aberdeen AB15 6LS
Caroline Hird
chird2nhsnet
01224 556 015
Borders Physiotherapy Dept
Borders General Hospital
Melrose
Roxburghshire TD6 9AL
Nicky Wheal
Nickywhealbordersscotnhsuk
01896 826 000
bleep 1603
Dumfries Physiotherapy Dept
Dumfries amp Galloway Royal Infirmary
Bankend Road
Dumfries DG1 4AP
Manoj Kumar
Manojkumarnhsnet
01387 241 452
ext 33826
Dundee Ninewells Hospital
Amputee Therapy Dept
Level5
Dundee DD1 9SY
Louise Whitehead
lwhiteheadnhsnet
01382 660 111
ext 36149
Bleep 4069
Physiotherapy Dept
Victoria Hospital
Hayfield Road
Kircaldy
KY2 5AH
Suzanne Howie
suzannehowienhsnet
01592 643355
ext 21779
Edinburgh
Physiotherapy Dept
Edinburgh Royal Infirmary
Ward 105
Little France
Edinburgh EH16 4SU
Lesley Buchanan
LesleyBuchananluhtscotnhsuk
0131 242 1907
or
0131 536 1000
bleep 6637
Physiotherapy Dept
Astley Ainslie Hospital
Grange Loan
Edinburgh
EH9 2HL
Catriona Mawdsley
Catrionamawdsleynhslothianscotnhsuk
Jennifer Macdonald
Jennifermacdonaldnhslothianscotnhsuk
0131 537 9166
33
Physiotherapy Dept
Royal Hospital for Sick Children
9 Sciennes Road
Edinburgh EH9 1LF
Ailsa White
0131 536 0000
bleep 9116
Inverness Physiotherapy Dept
Raigmore Hospital
Old Perth Road
Inverness
IV2 3UJ
Mairi Ross
mairiross2nhsnet
01463 704 000
ext 5580 or
bleep 2003
Oban Physiotherapy Dept
Lorne amp Islands District General Hospital
Glengallan Road
Oban
PA34 4HH
Derek Laidler
dereklaidlernhsnet
01631 567 500
Physiotherapy Dept
Mid Argyll Hospital
Blarbuie Road
Lochgilphead
PA31 8JZ
Gillian Rennie
GillianRennienhsnet
01546 602 323
Stornaway Physiotherapy Dept
Western Isles Hospital
Mccauley Road
Stornaway
Isle of Lewis
HS21 2AP
Sheila Nicolson
sheilanicolsonnhsnet
01851 548 704
34
Appendix D Aetiology Mapping
The list of aetiologies used in this report was revised and reduced in 2004 in order to improve accuracy of recording and relevance of categories The following shows the mapping of the previous list of aetiologies to the current list
Previous category New category
PAD ndash Arteriosclerosis Unchanged
PAD ndash Diabetes Unchanged
Trauma Trauma or Burns
Burns
Tumour Unchanged
Congenital deformity Unchanged
Drug abuse Unchanged
Venous Problems Venous disease
Non-union of fracture
Orthopaedic Failed joint replacement
Acquired deformity
Septicaemia Blood-borne infection
Renal Problems Renal Failure
Other Other
Local Infection
Not recorded Unchanged
35
Appendix E Locomotor Capabilities Index 5
Only fill this in for amputees who are using their prosthesis to WALK
Please note this assessment must be completed with the amputee present or on the telephone and the amputee must be asked how they think they can manage each activity It is how the patient perceives their own performance that is being measured
Put 0123 or 4 in the appropriate boxes where -
0 = No 1 = Yes if someone helps 2 = Yes if someone is near 3 = Yes alone with walking aid(s) 4 = Yes alone without walking aid
Activity 6 months pre-admission
Final Discharge
Basic Activities
Get up from a chair
Walk indoors
Walk outside on even ground
Go up the stairs with a hand-rail
Go down the stairs with a hand-rail
Step up a kerb
Step down a kerb
TOTAL
Advanced activities
Pick up an object from the floor when standing
Get up from the floor (eg after a fall)
Walk outside on uneven ground (eg grass gravel slope)
Walk outside in bad weather (eg rain wind snow)
Go up a few steps without a hand-rail
Walk down without a hand-rail
Walk while carrying an object
TOTAL
OVERALL TOTAL
CHANGE of overall total from 6 months preadmission to final discharge
36
Appendix F Functional Co-morbidities Index
Lower limb amputees are a predominantly elderly group with a relatively high incidence of co-morbid disease This has not been previously accounted for in the SPARG data collection and analysis The Functional Co-morbidities Index (FCI) was incorporated into the data set from 2008
The FCI was developed and validated with physical function as the outcome (Groll et al 2005) The more commonly used indices predict mortality or administrative outcomes such as
hospital length of stay These indices tend to include conditions that are asymptomatic and impact on life expectancy but not physical function (for example hypertension) and have been found not to correlate strongly with physical disability
The FCI was developed using 2 different samples of adults 1 group n= 9423 random Canadian adults 2nd group n = 28349 US adults seeking treatment for spinal ailments using the physical subscale of the SF36 as the outcome
The FCI is completed by scoring a 1 if a disease is present and 0 if it is not A score of 0 indicates no co-morbid illness and a score of 18 indicates the highest number of co-morbid illnesses The disease is only scored as present if it is diagnosed and documented in medical notes
The BMI is calculated for each patient by dividing the patientrsquos weight by their height in metres squared (weight height 2 ) If neither height nor weight can not be measured or obtained BMI can be estimated using the mid upper arm circumference (MUAC) (lsquoMustrsquo Explanatory Booklet) If MUAC is more than 320cm BMI is likely to be more than 30kgm2 ie patient is likely to be obese
Functional Co-morbidities Index
Arthritis (rheumatoid and osteoarthritis) Yes No
Osteoporosis Yes No
Asthma Yes No
Chronic Obstructive Pulmonary Disease Acquired Respiratory Distress Syndrome Emphysema
Yes No
Angina Yes No
Congestive Heart Failure (or heart disease) Yes No
Heart Attack (myocardial infarction) Yes No
Neurological disease eg Multiple Sclerosis or Parkinsonrsquos Yes No
CVA or TIA Yes No
Peripheral Arterial Disease Yes No
Diabetes Type I and II Yes No
Upper gastrointestinal disease (ulcer hernia reflux) Yes No
Depression Yes No
Anxiety or panic disorders Yes No
Visual impairment (cataracts glaucoma macular degeneration) Yes No
Hearing impairment (very hard of hearing even with hearing aids) Yes No
Degenerative disc disease including back disease spinal stenosis or severe chronic back pain
Yes No
Obesity andor BMI gt 30 (Pre-op weight in Kgheight in metres 2)
Weight helliphelliphellip (Kg)
Height helliphellip (metres) BMI = helliphelliphelliphellip
Yes No
Please see Guidance Notes Score (Yes = 1 No = 0) 18
37
Appendix G Data Cleaning Steps
Remove records which are marked as missing
Checked flagged and fixed DOBs in current year and age gt100
Check flagged and fix date of amputation
Check Amputees with right and left amputations are marked as bilaterals
Check milestones are calculated from final surgery
Check if LF then final outcome is LF (1) or Abandoned (3)
Where DOB date of amputation etc are left blank then these are flagged and marked
as Missing

10
323 Aetiology of Amputation
The incidence of each aetiology recorded is shown in table 323
2005 2006 2007 2008 2009 2010
N N N N N N
Peripheral arterial disease ndash without diabetes 343 4791 291 4217 280 4006 339 4593 323 4431 306 4186
Diabetes 277 3869 285 4130 289 4134 284 3848 284 3896 332 4542
Trauma or Burns 22 307 15 217 19 272 17 230 16 219 11 150
Tumour 8 112 14 203 13 186 10 136 18 247 9 123
Congenital deformity 3 042 6 087 1 014 4 054 11 151 2 027
Drug abuse 4 056 4 058 6 086 6 081 12 165 5 068
Venous disease 7 098 7 101 5 072 7 095 2 027 10 137
Orthopaedic 29 405 33 478 31 443 33 447 33 453 28 383
Blood-borne infection 4 056 4 058 9 129 10 136 2 027 5 068
Renal Failure 3 042 4 058 1 014 6 081 5 069 5 068
Other 15 209 18 261 17 243 19 257 16 219 14 192
Not recorded 1 014 9 130 28 401 3 041 7 096 4 055
Total 716 10000 690 10000 699 10000 738 10000 729 10000 731 10000
Table 323 Aetiology of amputation 2005 - 2010
324 Level of Amputation
Table 324 shows the incidence of six levels of amputation for the years 2005-2010 For amputees who had bilateral amputations in the reported period both amputations are included in the data The number of levels recorded will therefore be greater than the number of amputees for any given year The level indicates the final level of the amputation following any further surgery within the same period of hospital admission
Table 324 Level of amputation 2005 - 2010
2005 2006 2007 2008 2009 2010
N N N N N N
Transtibial 378 4948 382 5162 444 6041 432 5475 410 5304 383 5020
Transfemoral 367 4804 344 4649 268 3646 337 4271 321 4153 348 4561
Transpelvic 7 092 4 054 1 014 0 000 0 000 2 026
Hip Disarticulation 10 131 5 068 3 041 5 063 10 129 11 144
Knee Disarticulation 0 000 4 054 7 095 11 139 30 388 19 249
Ankle Disarticulation 1 013 0 000 1 014 2 025 2 026 0 000
Other 0 000 1 014 0 000 0 000 0 000 0 000
Not recorded 1 013 0 000 11 150 2 025 0 000 0 000
Total 764 10000 740 10000 735 10000 789 10000 773 10000 763 10000
11
325 Patients Fitted with a Prosthesis
The number of patients fitted with a prosthesis at final discharge is shown in table 3251 Limb-fitting by level of amputation is shown in table 3252 Since 2002 data on bilateral patients has been reported separately Table 3252 shows unilateral patients only for 2002-2010 and the bilateral patients for those years are shown in table 3253 Table 3254 shows the proportion of males and females who were fitted with a prosthesis Those patients who have abandoned limb-fitting are not included in this limb-fitted patient group
2002 2003 2004 2005 2006 2007 2008 2009 2010
Number of amputees 831 823 831 716 690 678 702 729 731
Number fitted 360 359 302 268 289 312 297 301 315
Percentage fitted () 4332 4362 3634 3743 4188 4464 4231 4129 4309
Table 3251 Patients fitted with a prosthesis 2002 - 2010
2002 2003 2004 2005 2006 2007 2008 2009 2010
Transtibial () 6256 6657 6035 5563 6463 6311 6818 6769 6967
Transfemoral () 2608 3138 2071 2590 2617 2927 2480 2414 3199
Other () 2500 5000 4375 588 4167 6154 2353 1714 1154
Table 3252 Patients fitted with a prosthesis by level 2002 - 2010
2002 2003 2004 2005 2006 2007 2008 2009 2010
Bilateral any level() 3293 2695 2083 2288 2213 2824 2336 2374 2977
Table 3253 Patients fitted with a prosthesis bilateral 2002 - 2010
Table 3254 Sex and limbfitting outcome 2010
Transtibial Unilateral
Transfemoral Unilateral
Bilateral
Total Males 216 166 90
Total Females 85 108 39
Males Limbfitted 162 66 32
Females Limbfitted 50 22 5
of Males Limbfitted 7500 3976 3556
of Females Limbfitted 5882 2037 1282
12
326 Prosthetic Rehabilitation Abandoned
There are a number of patients each year who are initially fitted with a prosthesis but for whom prosthetic treatment is abandoned prior to their final discharge For the purposes of this report these patients are included in the ldquonot limb-fittedrdquo group as this is their final outcome on discharge
2005 2006 2007 2008 2009 2010
n of init fitted
n of init fitted
n of init fitted
n of init fitted
n of init fitted
n of init fitted
All patients 20 694 29 912 29 850 20 595 24 738 15 425
Unilateral TTA 7 402 8 404 10 411 11 475 6 293 3 142
TFA 9 1111 12 1509 14 1892 7 1045 13 1711 10 1031
Other 0 000 0 000 2 2000 0 000 0 000 0 000
Bilateral 4 1250 9 2500 3 750 2 588 5 1316 2 488
Table 326 Prosthetic rehabilitation abandoned 2005 - 2010
327 Mortality
Table 327 gives the inpatient mortality rates for 2010 This is the proportion of amputees who died within 30 days of their respective amputation (see also 328 for overall)
2007 2008 2009 2010
Number of amputees 678 702 729 731
Deaths within 30 days of amputation surgery 41 43 44 54
30 day mortality () 605 613 604 739
Table 327 Mortality 2007 - 2010
328 Final Outcome Summary
Table 328 gives a summary of gross outcomes for all amputees at the time of final discharge from physiotherapy whether at in patient discharge or after a period of out patient treatment in 2009
2007 2008 2009 2010
N of all
amputees N
of all amputees
N of all
amputees N
of all amputees
Limb-fitted 325 4794 297 4231 301 4129 315 4309
Not Limb-fitted 232 3422 291 4145 306 4198 274 3748
Of which abandoned (29) (428) (20) (285) (24) (329) (15) (205)
Deceased (inpatient or outpatient) 93 1372 125 1781 104 1427 134 1833
Unknown 28 413 25 356 18 247 8 109
Table 328 Outcome summary 2007 - 2010
13
329 Bilateral Amputations in Same Episode of Care
The number and levels of bilateral amputations carried out in the same episode of care are shown in table 329 below for 2002-2010
2002 2003 2004 2005 2006 2007 2008 2009 2010
Transtibial x 2 19 24 13 9 14 23 16 14 13
Transfemoral x 2 16 13 20 11 13 6 12 13 12
Transfemoral amp Transtibial 7 4 6 1 9 8 2 4 5
Other 2 1 3 0 0 0 3 4 1
Total 44 42 42 21 36 37 33 35 31
Table 329 Bilateral amputations 2002-2010
3210 Unilateral and Bilateral Amputees
The table 32101 shows the number of unilateral and bilateral amputees for the years 2005-2010 In this table bilateral amputees includes all amputees who were bilateral in the reported year
The bilateral amputees are defined in more detail in table 32102 where there are 2 groups shown those amputees who had a prior amputation and those who were not previously amputees that is underwent bilateral amputations in the same episode of care
2005 2006 2007 2008 2009 2010
N N N N N N
Number of amputees 716 10000 690 10000 678 10000 738 10000 729 10000 731 10000
Unilateral amputees 598 8370 568 8232 546 8053 601 8144 590 8093 610 8254
Bilateral amputees 118 1630 122 1768 131 1932 137 1856 139 1907 129 1746
Unknown 0 0 0 000 0 000 0 000 0 000 0 000
Table 32101 Unilateral and bilateral amputees 2005 ndash 2010
Table 32102 Bilateral amputees 2005 - 2010
Note - here show proportion of all bilateral amputees in each group
2005 2006 2007 2008 2009 2010
N N N N N N
Bilateral Total 117 10000 122 1000 131 10000 137 10000 139 10000 129 10000
Bilateral ndash prior amputation(s)
97 7083 86 7049 94 7176 104 6861 104 7482 98 7597
Bilateral ndash both in same episode
21 2917 36 2951 37 2824 33 2701 35 2518 31 2403
14
3211 Revisions and Re-amputations
The number of amputees having revision or re-amputation surgery is shown in table 32111 A revision is defined as further primary stump surgery which may involve bone but does not change the level of amputation A re-amputation is defined as further surgery of the primary stump which changes the level of amputation Each revision and re-amputation is counted therefore amputees who had a revision then a re-amputation would be included in both counts
Re-amputations from the transtibial to the transfemoral level for 2005-2010 are shown in table 32112
2005 2006 2007 2008 2009 2010
N N N N N N
Amputations 716 10000 735 10000 732 10000 790 10000 783 10000 763 10000
Revisions 22 307 23 313 21 287 17 215 22 281 21 275
Re-amputations 31 433 37 503 36 492 36 456 48 613 49 642
Total revisions + re-amputations
53 740 60 816 57 779 53 671 70 894 70 917
Table 32111 Revisions and re-amputations 2005-2010
2005 2006 2007 2008 2009 2010
N N N N N N
Initial transtibial amputations 407 10000 424 10000 443 10000 433 10000 410 10000 425 10000
Re-amputated to transfemoral 29 713 41 967 36 813 33 762 40 976 40 941
Table 32112 Transtibial to transfemoral re-amputations 2005-2010
3212 Functional Co-morbidities Index
The Functional Co-morbidities Index (FCI) was incorporated into the data set from 2008 in an effort to account for the relatively high incidence of co-morbid disease in the lower limb amputee population (see Appendix E) It is reported for the first time in this report
The FCI is completed by scoring 1 if a disease is present that is diagnosed and recorded in the medical notes of a patient and 0 if not A score of 0 indicates no co-morbid disease and a score of 18 the highest number of co-morbid illnesses
Number Min
Lower
Quartile Median
Upper
Quartile Max Mean
All Patients 731 0 2 3 4 10 307
Unilateral TTA 300 0 2 3 4 10 317
Unilateral TFA 272 0 2 3 4 8 294
Other 28 0 2 3 4 6 288
Bilateral 131 0 2 3 4 8 336
Diabetic 332 0 2 35 5 9 374
PAD without Diabetes 306 0 2 3 4 10 282
Other 14 0 1 2 3 4 207
Table 32121 Functional Co-morbidities Score 2010
15
33 Physiotherapy and Rehabilitation
331 Compression Therapy
Compression therapy of the stump is widely used and figures for 2005-2010 are presented in table 333 These figures relate to the number of modalities used if a single amputee received more than one type of therapy these would both appear in the table Patients who died while registered as inpatients are excluded
As of the 2004 report Crepe Bandage has been removed from this section as it is not considered to be a form of compression therapy rather a post-operative dressing and will no longer be reported Patients using the PPAM aid and sleeve as compression therapy ie without the frame and non-weight bearing are also recorded from 2007
2005 2006 2007 2008 2009 2010
N N N N N N
Elset S bandage 37 747 24 484 12 227 16 266 10 128 5 087
Flowtron 2 040 3 060 13 246 8 133 27 345 12 209
Plaster cast 78 1576 62 1250 82 1550 98 1628 127 1624 89 1551
Shrinker sock 371 7495 378 7621 379 7164 425 7060 519 6637 392 6829
Silicone Sleeve 3 061 0 000 9 170 21 349 7 090 8 139
Other 4 081 10 202 6 113 1 017 7 090 1 017
PPAM - - - - 28 529 33 548 85 1087 67 1167
Total 157 10000 496 10000 529 10000 602 100 782 10000 574 10000
Table 331 Type of compression therapy used 2005-2010
332 Early Walking Aids
The types of Early Walking Aids (EWA) used in 2004-2009 are shown in table 334 Note that these figures relate to the number of devices used if a single amputee used more than one type of EWA both would appear in the table Patients who died while registered as inpatients are excluded
Table 332 Type of EWA used 2005-2010
2005 2006 2007 2008 2009 2010
N N N N N N
AMA 0 000 3 083 6 157 6 152 8 156 3 076
Femurett 42 1243 54 1496 46 1201 51 1288 71 1387 47 1190
PPAM 295 8728 304 8421 323 8433 339 8561 433 8457 342 8658
Other 1 030 0 000 8 209 0 000 0 000 3 076
Total 338 10000 361 10000 383 10000 396 10000 512 10000 395 10000
16
333 Mobility Outcomes Locomotor Capabilities Index 5 (LCI 5)
The LCI is a widely used and validated self report tool that measures a lower limb amputeersquos locomotor capabilities with their prosthesis during and after rehabilitation (Condie et al 2006)
It was developed and validated as part of the Prosthetic Profile of the Amputee Questionnaire and can be used in isolation (Gauthier-Gagnon and Grise 2001) It consists of 14 items divided into 2 subscales basic and advanced (see Appendix C) Each item is scored on a 4 point ordinal scale giving a total maximum score of 42 with sub-scores of 21 for the basic and advanced activities
The LCI5 is an amended version of the LCI in which the upper ordinal level is split into 2 according to the use or non use of walking aids to give maximum sub-scores of 28 and total score of 56 (Franchignoni et al 2007) The LCI 5 has been found to reduce the ceiling effect associated with the LCI by 50 (Franchignoni et al 2004 Franchignoni et al 2007)
The higher the score of the LCI 5 the greater the capabilities of the amputee The LCI5 is completed retrospectively for the amputee patientrsquos mobility six months prior to their amputation and prospectively on final discharge The difference between these two scores is calculated for each patient to give a score for their change in mobility A positive score indicates an improvement in mobility and a negative score deterioration All Basic and Advanced values in the tables below are the mean values
Table 333 Locomotor Capabilities Index by level 2008 to 2010
2008 612 Pre-amp Final Outcome
Basic Adv Total Basic Adv Total Change N
Transtibial 24 20 44 21 16 37 -7 213
Transfemoral 25 22 47 20 13 33 -14 51
Bilateral 24 22 46 22 15 37 -9 8
2009 612 Pre-amp Final Outcome
Basic Adv Total Basic Adv Total Change N
Transtibial 24 21 45 21 16 37 -8 208
Transfemoral 23 20 43 16 11 27 -16 60
Bilateral 20 16 36 16 11 27 -9 28
2010 612 Pre-amp Final Outcome
Basic Adv Total Basic Adv Total Change N
Transtibial 24 20 44 20 15 35 -9 221
Transfemoral 24 21 45 18 13 31 -14 63
Bilateral 23 17 40 17 9 26 -14 26
17
4 Milestone Data
41 Statistics Presented
This section of the report deals with the statistical analysis of the rehabilitation milestones The three rehabilitation milestones are shown in the table below-
Milestones Names by which milestones are
referred to in this report
Number of days from primary amputation to casting for prosthesis lsquodays to castingrsquo
Number of days from casting to delivery of prosthesis where delivery is defined as the date at which the patient begins gait
training with the prosthesis ndash finished or unfinished lsquocasting to deliveryrsquo
Number of days from primary amputation to inpatient discharge lsquodays to inpatient dischargersquo
For each milestone the following descriptive statistics are presented the number of amputees included in the analysis minimum lower quartile median upper quartile maximum days
Only patients who were limb-fitted by inpatient or outpatient discharge are included in days to casting and casting to delivery
Where patients have undergone revisions or re-amputations the latest date of surgery is used as the date of amputation The final level in the case of re-amputations to higher levels is used to group the patients for this milestone
Days to inpatient discharge is the length of stay in hospital for each amputee calculated in days from the date of amputation The length of stay for bilaterals amputated in same hospital admission is calculated from the date of first surgery
The length of hospital stay for patients re-amputated to a higher level will be calculated from the date of their final amputation
For all milestones patients who died as inpatients or as outpatients are excluded
Groups with results prepared for all milestones
Additional groups for days to inpatient discharge
Transtibial Unilateral Fitted Transtibial Unilateral Not Fitted
Transfemoral Unilateral Fitted Transfemoral Unilateral Not Fitted
Bilateral Fitted Bilateral Not Fitted
Bilateral includes all those who underwent one amputation in the report period having had a prior amputation(s) and those who underwent bilateral amputations in the report period having had no prior amputations
For each milestone and each group the statistics represent available data In addition median days are shown for 1996-2010 with 1996-2000 including bilateral patients and 2001-2010 unilateral only
Additionally for 2010 table 46 shows the days from inpatient discharge to outpatient discharge for transtibial unilateral transfemoral unilateral and bilateral patients
18
42 Days to Casting
Transtibial Unilateral
Transfemoral Unilateral
Bilateral
Number Included 206 79 39
Minimum 10 15 20
Lower Quartile 31 33 39
Median 46 49 67
Upper Quartile 6475 835 127
Maximum 319 289 262
Table 421 Days to casting milestone descriptive statistics 2010
0
10
20
30
40
50
60
Med
ian
days t
o c
asti
ng
Transtibial 35 36 38 40 415 395 40 39 40 43 40 49 43 47
Transfemoral 40 34 41 37 34 41 415 415 46 43 45 47 50 50
1997 1998 1999 2000 2001 2002 2003 2004 2005 2006 2007 2008 2009 2010
Figure 422 Median days to casting milestone 1997-2010 (2001 ndash 2010 ndash Unilateral Only)
43 Casting to Delivery
Transtibial Unilateral
Transfemoral Unilateral
Bilateral
Number Included 206 82 40
Minimum 1 2 2
Lower Quartile 7 13 7
Median 10 15 125
Upper Quartile 14 21 1725
Maximum 126 71 38
Table 431 Casting to delivery milestone descriptive statistics 2010
Table 432 Median casting to delivery milestone 1997-2010 (2001 ndash 2010 ndash Unilateral Only)
1997 1998 1999 2000 2001 2002 2003 2004 2005 2006 2007 2008 2009 2010
Transtibial 12 20 20 16 14 14 14 14 14 14 13 14 13 10
Transfemoral 16 21 20 21 22 155 14 14 14 155 14 15 15 15
19
44 Days to Inpatient Discharge Fitted with a Prosthesis
Transtibial Unilateral
Transfemoral Unilateral
Bilateral
Number Included 203 77 34
Minimum 5 7 6
Lower Quartile 335 34 325
Median 59 58 68
Upper Quartile 865 113 1575
Maximum 331 524 288
Table 441 Days to inpatient discharge patients fitted with a prosthesis descriptive statistics 2010
1997 1998 1999 2000 2001 2002 2003 2004 2005 2006 2007 2008 2009 2010
Transtibial 59 63 60 62 57 61 53 55 54 56 55 55 55 59
Transfemoral 66 66 60 54 655 71 69 555 635 57 58 675 53 59
Table 442 Median days to inpatient discharge patients fitted with a prosthesis 1997-2010 (2001 ndash 2010 ndash Unilateral Only)
45 Days to Inpatient Discharge Not Fitted with a Prosthesis
Transtibial Unilateral
Transfemoral Unilateral
Bilateral
Number Included 57 128 72
Minimum 0 1 5
Lower Quartile 21 20 15
Median 55 435 28
Upper Quartile 101 75 58
Maximum 323 524 310
Table 451 Days to inpatient discharge patients not fitted with a prosthesis descriptive statistics 2010
1997 1998 1999 2000 2001 2002 2003 2004 2005 2006 2007 2008 2009 2010
Transtibial 61 46 61 47 43 50 37 52 515 66 605 62 61 45
Transfemoral 36 36 45 40 425 48 41 42 47 52 46 47 51 41
Table 452 Median days to inpatient discharge patients not fitted with a prosthesis 1997-2010 (2001 ndash 2010ndash Unilateral Only)
20
46 Days from Inpatient Discharge to Outpatient Discharge
The following tables describe outpatient treatment length however this does not take into account the frequency or type of rehabilitation treatment which will vary from hospital to hospital The 3 tables show respectively all amputees limb-fitted and not limb-fitted
Transtibial Unilateral
Transfemoral Unilateral
Bilateral
Number Included 177 106 34
Minimum 2 9 3
Lower Quartile 40 3225 415
Median 91 82 95
Upper Quartile 174 19325 166
Maximum 577 502 509
Table 461 Days from inpatient discharge to outpatient discharge all amputees 2010
Table 462 Days from inpatient discharge to outpatient discharge limb-fitted amputees 2010
Table 463 Days from inpatient discharge to outpatient discharge limb fitted amputees 2006 ndash 2010
Transtibial Unilateral
Transfemoral Unilateral
Bilateral
Number Included 13 36 9
Minimum 2 10 3
Lower Quartile 20 29 46
Median 34 435 74
Upper Quartile 98 86 132
Maximum 241 329 160
Table 464 Days from inpatient discharge to outpatient discharge non limb-fitted amputees 2010
Transtibial Unilateral
Transfemoral Unilateral
Bilateral
Number Included 164 70 25
Minimum 4 9 21
Lower Quartile 4275 5425 34
Median 95 1285 111
Upper Quartile 17625 24575 176
Maximum 577 502 509
2006 2007 2008 2009 2010
N Median n Median n Median n Median n Median
Unilateral TTA 91 148 160 84 153 103 152 935 164 95
TFA 35 160 51 122 50 885 57 133 70 1285
Bilateral 13 209 29 71 24 66 25 66 25 111
21
5 Trends in Compression Therapy and Early Walking Aids (EWAs)
51 Statistics Presented
This chapter looks at trends in the use of compression therapy and Early Walking Aids (EWAs) All patients receiving compression therapy or EWA therapy are included in each analysis
52 Trends in Compression Therapy
Of the patients receiving compression therapy the percentage who received it within 10 days of amputation is shown in table 521 for 1993-2009 A line chart representing this data is shown in figure 522
94 95 96 97 98 99 00 01 02 03 04 05 06 07 08 09 10
TT 285 406 528 527 498 507 613 698 662 678 655 544 475 528 557 511 553
TF 329 351 472 495 456 584 581 537 493 638 553 495 436 416 452 402 391
Table 521 Patients receiving compression therapy within 10 days of amputation () 1994 ndash 2010
Figure 522 Percentage of transtibial and transfemoral amputees receiving compression therapy within 10 days of
amputation surgery 1993 - 2010
22
53 Trends in Early Walking Aids
Of the patients receiving EWA therapy the percentage who received it within 10 days of amputation is shown in table 531 for 1994-2010 A line chart representing this data is shown in figures 532
94 95 96 97 98 99 00 01 02 03 04 05 06 07 08 09 10
TT 242 343 232 251 251 291 288 359 271 233 259 239 183 215 176 149 160
TF 246 179 258 271 269 309 245 262 267 212 212 149 133 156 235 121 154
Table 531 Patients using EWAs within 10 days of amputation () 1994 - 2010
Figure 532 Percentage of transtibial and transfemoral amputees using EWAs within 10 days of amputation surgery 1993 -
- 2010
23
6 Individual Hospital Summaries for 2010 ndash Key Performance Indicators
61 Final Outcome (all)
This section presents the national data broken down by amputating hospital
The number of amputees at each hospital the data completeness and Functional Comorbidities Index (see Appendix E) are shown in table 61
Table 61 The number of amputees at each hospital the data completeness and FCI 2010
Key -
Hospital Hospital Name
Total Number Total number of amputees ie SPARG forms issued
Number returned Number of amputees that have SPARG form retrieved
returned Percentage of retrieved SPARG forms
Number incomplete Number of retrieved forms with missing data
FCI Median Functional Co-morbidities Score (Appendix E)
Hospital Total number
Number returned
Returned
Number incomplete FCI
Aberdeen Royal Infirmary 81 81 10000 2 40
The Ayr Hospital 44 44 10000 1 30
Balfour Hospital 2 2 10000 0 45
Borders Unknown 0 0 na unknown
Dumfries amp Galloway Royal Infirmary
37 37 10000 23 20
Gartnavel General Hospital 33 33 10000 0 30
Gilbert Bain Hospital 2 2 10000 0 15
Glasgow Royal Infirmary 55 55 10000 0 30
Hairmyres Hospital 59 58 9831 2 30
Inverclyde Royal Hospital 17 17 10000 4 30
Ninewells Hospital 111 111 10000 0 30
Queen Margaret Hospital 23 23 10000 0 30
Raigmore Hospital 42 40 9524 1 30
Ross Hall Hospital 1 1 10000 0 20
Royal Alexandria Hospital 7 6 8571 3 20
Royal Infirmary of Edinburgh 102 101 9902 0 30
Southern General Hospital 36 34 9444 3 30
St Johns Hospital At Howden 1 1 10000 0 10
Stirling Royal Infirmary 30 28 9000 0 30
Victoria Infirmary 5 5 10000 0 30
Western Infirmary 34 34 10000 1 30
Wishaw General Hospital 10 10 10000 0 35
Woodend General Hospital 5 5 10000 0 10
Yorkhill Hospital 3 3 10000 2 00
Total 740 731 9878 42 30
24
Outcomes for each amputating centre are shown in table 62
Table 62 Key Performance Indicators by Amputating hospital 2010
Key
TTA Percentage of transtibial amputees
LF Percentage of amputees who were limb fitted
Mortality Percentage of amputees who died within 30 days of amputation
Abandoned Percentage of amputees who abandoned limb fitting in rehabilitation period
Re-admissions Percentage of amputees who were readmitted after initial inpatient discharge
Wound Infection Percentage of amputees with wound infection within rehabilitation period that is amputee demonstrates symptoms of infection (localised erythema pain heat cellulitis oedema andor a positive wound swab and is commenced on antibiotics andor a topical treatment)
Number data available
TTA
LF
Mortality
Abandoned
Readmissions WI
Aberdeen Royal Infirmary 81 4568 4198 1481 247 247 4074
The Ayr Hospital 44 6136 5682 909 227 1818 2955
Balfour Hospital 2 000 000 000 000 000 000
Dumfries amp Galloway Royal Infirmary 37 4865 4324 1081 000 811 1892
Gartnavel General Hospital 33 5152 5758 303 303 909 3636
Gilbert Bain Hospital 2 5000 5000 000 000 5000 000
Glasgow Royal Infirmary 55 3818 3455 1273 909 545 3455
Hairmyres Hospital 58 3898 3390 339 508 1525 2542
Inverclyde Royal Hospital 17 5882 3529 588 000 000 2353
Ninewells Hospital 111 4505 4685 541 090 991 3333
Queen Margaret Hospital 23 4783 5217 000 000 1739 4783
Raigmore Hospital 40 6429 3810 714 000 714 2619
Ross Hall Hospital 1 10000 10000 000 000 000 000
Royal Alexandria Hospital 6 4286 2857 2857 1429 000 2857
Royal Infirmary of Edinburgh 101 4706 3431 784 098 588 2941
Southern General Hospital 34 5278 5278 278 000 833 1944
St Johns Hospital At Howden 1 000 000 000 000 000 10000
Stirling Royal Infirmary 28 7000 4333 333 000 333 3000
Victoria Infirmary 5 8000 10000 000 000 2000 4000
Western Infirmary 34 6765 3824 294 000 1471 3529
Wishaw General Hospital 10 4000 3000 1000 000 1000 6000
Woodend General Hospital 5 4000 8000 000 000 000 2000
Yorkhill Hospital 3 3333 6667 000 000 000 000
Total 731 4973 4284 730 203 865 3135
25
62 Milestones (Unilateral trans-tibial amputees)
The number of and milestones data for unilateral transtibial amputees are presented for each hospital
in Table 63
Number
Days to Compression Therapy
Days to EWA
Days to Casting
Days Casting to Delivery
Length of Hospital Stay
Aberdeen Royal Infirmary 32 115 14 32 8 74
The Ayr Hospital 22 29 36 63 14 33
Dumfries amp Galloway Royal Infirmary 14 155 33 73 14 59
Gartnavel General Hospital 16 35 11 465 15 32
Gilbert Bain Hospital 1 0 - - - 42
Glasgow Royal Infirmary 17 11 12 41 14 365
Hairmyres Hospital 17 12 17 84 14 25
Inverclyde Royal Hospital 6 0 165 53 265 575
Ninewells Hospital 42 8 13 345 7 59
Queen Margaret Hospital 8 0 18 48 7 685
Raigmore Hospital 23 0 17 325 1 50
Ross Hall Hospital 1 7 14 39 10 21
Royal Alexandria Hospital 3 43 95 62 9 61
Royal Infirmary of Edinburgh 39 13 22 61 10 106
Southern General Hospital 16 0 14 32 12 415
Stirling Royal Infirmary 18 7 42 54 22 785
Victoria Infirmary 4 8 115 305 10 455
Western Infirmary 15 8 10 53 17 33
Wishaw General Hospital 4 18 14 - 7 85
Woodend General Hospital 2 2 345 535 55 565
Yorkhill Hospital 1 0 - 26 8 -
Total 301 10 17 46 10 57
Table 63 Key Performance Indicators (milestones) by Amputating hospital 2010
Key -
Number Number of unilateral trans-tibial amputees
Days to CompTherapy Median days from final surgery to start of compression therapy
Days to EWA Median days from final surgery to start of early walking aid therapy eg PPAM aid
Days to casting Median days from final surgery to casting for prosthesis
Days casting to delivery Median days from casting to delivery of prosthesis
Length of hospital stay Median days from amputation to final inpatient discharge
26
References
Bouch E Burns K Geer E Fuller M and Rose A (2012) Guidance for the multidisciplinary team on the management of post-operative oedema in lower limb amputeesrsquo BACPAR University of Bradford (httpbacparcsporgukpublications)
Condie ME Jones D Treweek S (1996) lsquoA one year national survey of patients having lower limb amputationrsquo Physiotherapy 22 14-20
Condie E Scott H and Treweek S (2006) ndash Lower Limb Prosthetic Outcome Measures A Review of the Literature 1995 to 2005 Journal of prosthetics and Orthotics 181S13-30
Condie ME TreweekSP Whitehead L McFadyen AK (2011) The transfemoral fitting predictor (TPF) ndash A
functional measure to predict prosthetic fitting in transfemoral amputees validity and reliability Arch Phys Med Rehabil 92 (8) 1293 ndash 1297
Dawson I Divers C Furniss D (2008) lsquoPPPAM-aid Clinical Guidelines for Physiotherapistsrsquo Scottish Physiotherapy Amputee Research Group Glasgow (httpwwwknowledgescotnhsukspargaspx)
Gaultier-Gagnon C Grise M-C (2006) Tools to Measure Outcome of People with a Lower Limb Amputation Update on the PPA and LCI Journal of Prosthetics and Orthotics 181S61-67
Franchignoni F Orlandini D Ferriero G Moscato TA (2004) Reliability Validity and Responsiveness of the Locomotor Capabilities Index in Adults With Lower-Limb Amputation Undergoing Prosthetic Training Archives of Physical Medicine and Rehabilitation 85743-748
Franchignoni F Giordano A Ferriero G Munoz S Orlandini D Amoresano A (2007) Rasch analysis of the Locomotor Capabilities Index ndash 5 in people with lower limb amputation Prosthetics and Orthotics International 314394-404 Groll DL To T Bombardier C and Wright JG (2005) lsquoThe development of a co-morbidity index with physical function as an outcomersquo Journal of Clinical Epidemiology 58 595-602
JP Pell PT Donnan FGR Fowkes CV Ruckley (1993) lsquoQuality of life following lower limb amputation for peripheral arterial diseasersquo European Journal of Vascular Surgery 7 (4) 448ndash451
Scott HM and Patel R (2009) lsquoBenchmarking Primary Lower Limb Amputee Services for Years 2004 2005 and 2006rsquo ScotRET Prosthetics Service Group
Smith DG McFarland LV Sangeorzan BJ Reiber GE Czernieki JM (2003) lsquoPostoperative dressing and management strategies for transtibial amputation a critical reviewrsquo J of Rehabil Res and Devel 40(3)213
The lsquoMUSTrsquo Explanatory Booklet A guide to the lsquoMalnutrition Universal Screening Toolrsquo (lsquoMUSTrsquo) Produced by Malnutrition Advisory Group A standing committee of BAPEN httpwwwbapenorgukpdfsmustmust_explanpdf
27
Appendix A Project work
Completed projects -
Smith F Kennon B Paul L and Nichols N (2012) ldquoWhat are the key characteristics of an amputee population in relation to outcomerdquo MSc Dissertation Glasgow Caledonian University (publication pending) Further information available from Ms Fiona Smith Specialist Physiotherapist Western Infirmary Glasgow (Fionasmith6ggcscotnhsuk)
Stuart W Hussey K Ross P and Smith F (2012) lsquoIndicators of poor outcome following major amputationrsquo (publication pending) Further information available from Mr Wesley Stuart Consultant vascular Surgeon Western Infirmary Glasgow (wesleystuartggcscotnhsuk )
Hebenton J (2012) lsquoHas centralisation of the Vascular Service in Glasgow been successful A physiotherapists perspectiversquo Local audit Western Infirmary Glasgow Further information available from Mrs Joanne Hebenton Specialist Physiotherapist Western Infirmary Glasgow (joannehebentonggcscotnhsuk)
McNaughton M Robertson F Ross M Smith F Smith S and Whitehead L (2012) lsquoExercise Intervention for the Treatment of Patients with Intermittent Claudicationrsquo Scottish Physiotherapy Amputee Research Group Glasgow
(httpwwwknowledgescotnhsukspargaspx)
Ongoing projects -
Data linkage and longitudinal follow up of dysvascular amputees with and without diabetes examining in more detail their pre amputation morbidities amputee level and limb salvaging surgery with discharge destination and outcome Detailed analysis of their diabetic status and true mortality rates are also examined according to level and aetiology Further information available from Mr Wesley Stuart Consultant vascular Surgeon or Ms Fiona Smith Specialist Physiotherapist Western Infirmary Glasgow (Fionasmith6ggcscotnhsuk)
28
Appendix B List of SPARG Database reporting facilities
30 days mortality
Amputees fitted with a prosthesis and abandoned - by level (bilateral)
Amputees fitted with a prosthesis and abandoned - by level (unilateral only)
Amputees fitted with prosthesis for transfers only (bilateral)
Amputees fitted with prosthesis for transfers only (unilateral only)
Bilateral amputation surgery - by level
Check final outcome
Check important dates
Cognitive status - by aetiology
Cognitive status - by level
Compression therapy - by type
Days from casting to delivery
Days from final surgery to casting
Days from final surgery to compression therapy - by aetiology
Days from final surgery to compression therapy - by level (bilateral)
Days from final surgery to compression therapy - by level (unilateral only)
Days from final surgery to EWA - by aetiology
Days from final surgery to EWA - by level (bilateral)
Days from final surgery to EWA - by level (unilateral only)
Days from in-patient discharge to out-patient discharge - by aetiology
Days from in-patient discharge to out-patient discharge - by level (bilateral)
Days from in-patient discharge to out-patient discharge - by level (unilateral only)
Delayed healing - by aetiology
Delayed healing - by level (bilateral)
Delayed healing - by level (unilateral only)
Delayed in-patient discharge
EWAs - by type
Falls
Final outcome summary
Final outcome summary - by aetiology
Final outcome summary - by level (bilateral)
Final outcome summary - by level (unilateral only)
Functional co-morbidities index - by aetiology
Functional co-morbidities index - by level (bilateral)
Functional co-morbidities index - by level (unilateral only)
Gender and mean age
Gender and mean age - by aetiology
29
Gender and mean age - by level (bilateral)
Gender and mean age - by level (unilateral only)
Healthcare acquired infection (other)
Heamodialysis
Home circumstances
Interim discharge
Length of stay (days from final surgery to in-patient discharge) - limb fitted amputees by aetiology
Length of Stay (days from final surgery to in-patient discharge) - limb fitted amputees by level
Length of stay (days from final surgery to in-patient discharge) - non limb fitted amputees by aetiology
Length of Stay (days from final surgery to in-patient discharge) - non limb fitted amputees by level
Limb fitting - timing
Locomotor capabilities index 5 - by aetiology
Locomotor capabilities index 5 - by level
Overall summary - by aetiology
Overall summary - by level (bilateral)
Overall summary - by level (unilateral only)
Revisions and re-amputations in same episode
Wound infection - by aetiology
Wound infection - by level (bilateral)
30
Appendix C SPARG Hospitals and Physiotherapists
Glasgow Physiotherapy Dept
Drumchapel Hospital
129 Drumchapel Road
Glasgow G15 6PX
Ian MacFarlane Team leader
Ianmacfarlaneggcscotnhsuk
0141 211 6019
Physiotherapy Dept
Gartnavel General Hospital
1055 Great Western Road
Glasgow G12 OYN
Fiona Smith
Fionasmith6ggcscotnhsuk
0141 211 1814
Physiotherapy Dept
Glasgow Royal Infirmary
Queen Elizabeth Building
16 Alexandra Parade
Glasgow G31 2ER
Huda Saed
hsaedggcscotnhsuk
0141 211 1814
Royal Alexandra Hospital
Corsebar Road
Paisley PA2 9JH
Emma Kelly Senior Physiotherapist
emmakellyggcscotnhsuk
0141 887 9111
page 6643
Glasgow
Physiotherapy Dept
D Floor (old gastro unit)
Victoria Infirmary
Langside Road
Glasgow G42 9TY
Helen Scott
helenscottggcscotnhsuk
Physiotherapy Dept
WestMARC
Southern General Hospital
1345 Govan Road
Glasgow G51 4TF
Helen Scott
helenscottggcscotnhsuk
Ian Dawson
iandawsonggcscotnhsuk
Joanne Hebenton
joannehebentonggcscotnhsuk
0141 201 2636
or
0141 201 2639
Physiotherapy Dept
Royal Hospital for Sick Children
Yorkhill Quay
Glasgow
Caroline Grant
Carolinegrantggcscotnhsuk
0141 201 0063
Physiotherapy Dept
Western Infirmary
Dumbarton Road
Glasgow G11 6NT
Fiona Smith
Fionasmith6ggcscotnhsuk
Joanne Hebenton
joannehebentonggcscotnhsuk
0141 211 1814
or
0141 211 3000
bleep 4636
31
West amp Central
West amp Central
Physiotherapy Dept
Ayr Hospital
Dalmellington Road
Ayr KA6 6DX
Mary Kelso
Marykelsoaaahtscotnhsuk
Susan Geddes
Susangeddesaaahtscotnhsuk
01292 610 555
ext 4237
bleep 6314
fax 01292 614 585
Physiotherapy Dept
Hairmyres Hospital
East Kilbride
G75 8RD
Sally Smith
Sallysmithlanarkshirescotnhsuk
Abi Mackreill
Abigailmackriellanarkshirescotnhsuk
Physiotherapy Dept
Monklands Hospital Monkscourt Avenue
Airdrie ML6 OJS
Lorraine Senior
Lorraineseniorlanarkshirescotnhsnet
01236 748 748
page 129
Physiotherapy Dept
Wishaw Hospital
50 Netherton Sreet
Wishaw ML2 0DP
Angela McCusker
AngelaMccuskerlanarkshirescotnhsuk
01698 361 100
bleep 246
Physiotherapy Dept
Forth Valley Royal Hospital
Larbert
Carol Grant
carolgrant2nhsnet
Caroline Meadley
01324 566000
Carol
Pg 1599
Caroline
pg 1577
Physiotherapy Dept
St Johnrsquos Hospital
Howden Road West
Livingston
West Lothian EH54 6PP
Kerry Lawrie
KerryLawriewltscotnhsuk
01506 419 666
or
01506 523 000
bleep 694
Physiotherapy Dept
Vale of Leven Hospital
Alexandria G83 0UA
Morna Millar (Surgical)
Mornamillarvolscotnhsuk
01389 754 121
page 53096
01389 754 121
ext 27532
Physiotherapy Dept
Inverclyde Royal Infirmary
Larkfield Road
Greenock PA16 OX
Gerry Coffield
gerrycoffieldggcscotnhsuk
01475 633 777
or
01475 504 468
bleep 1132
32
Aberdeen Physiotherapy Dept
Aberdeen Royal Infirmary
Foresterhill Road
Aberdeen AB25 2ZN
Karen Duncan
kduncannhsnet
Dept 01224 553 409
Fax 01224 553 916
ARI 08454 566 000 ext 53409
bleep 3353
Physiotherapy Dept
Woodend Hospital
MARS
Eday Road
Aberdeen AB15 6LS
Caroline Hird
chird2nhsnet
01224 556 015
Borders Physiotherapy Dept
Borders General Hospital
Melrose
Roxburghshire TD6 9AL
Nicky Wheal
Nickywhealbordersscotnhsuk
01896 826 000
bleep 1603
Dumfries Physiotherapy Dept
Dumfries amp Galloway Royal Infirmary
Bankend Road
Dumfries DG1 4AP
Manoj Kumar
Manojkumarnhsnet
01387 241 452
ext 33826
Dundee Ninewells Hospital
Amputee Therapy Dept
Level5
Dundee DD1 9SY
Louise Whitehead
lwhiteheadnhsnet
01382 660 111
ext 36149
Bleep 4069
Physiotherapy Dept
Victoria Hospital
Hayfield Road
Kircaldy
KY2 5AH
Suzanne Howie
suzannehowienhsnet
01592 643355
ext 21779
Edinburgh
Physiotherapy Dept
Edinburgh Royal Infirmary
Ward 105
Little France
Edinburgh EH16 4SU
Lesley Buchanan
LesleyBuchananluhtscotnhsuk
0131 242 1907
or
0131 536 1000
bleep 6637
Physiotherapy Dept
Astley Ainslie Hospital
Grange Loan
Edinburgh
EH9 2HL
Catriona Mawdsley
Catrionamawdsleynhslothianscotnhsuk
Jennifer Macdonald
Jennifermacdonaldnhslothianscotnhsuk
0131 537 9166
33
Physiotherapy Dept
Royal Hospital for Sick Children
9 Sciennes Road
Edinburgh EH9 1LF
Ailsa White
0131 536 0000
bleep 9116
Inverness Physiotherapy Dept
Raigmore Hospital
Old Perth Road
Inverness
IV2 3UJ
Mairi Ross
mairiross2nhsnet
01463 704 000
ext 5580 or
bleep 2003
Oban Physiotherapy Dept
Lorne amp Islands District General Hospital
Glengallan Road
Oban
PA34 4HH
Derek Laidler
dereklaidlernhsnet
01631 567 500
Physiotherapy Dept
Mid Argyll Hospital
Blarbuie Road
Lochgilphead
PA31 8JZ
Gillian Rennie
GillianRennienhsnet
01546 602 323
Stornaway Physiotherapy Dept
Western Isles Hospital
Mccauley Road
Stornaway
Isle of Lewis
HS21 2AP
Sheila Nicolson
sheilanicolsonnhsnet
01851 548 704
34
Appendix D Aetiology Mapping
The list of aetiologies used in this report was revised and reduced in 2004 in order to improve accuracy of recording and relevance of categories The following shows the mapping of the previous list of aetiologies to the current list
Previous category New category
PAD ndash Arteriosclerosis Unchanged
PAD ndash Diabetes Unchanged
Trauma Trauma or Burns
Burns
Tumour Unchanged
Congenital deformity Unchanged
Drug abuse Unchanged
Venous Problems Venous disease
Non-union of fracture
Orthopaedic Failed joint replacement
Acquired deformity
Septicaemia Blood-borne infection
Renal Problems Renal Failure
Other Other
Local Infection
Not recorded Unchanged
35
Appendix E Locomotor Capabilities Index 5
Only fill this in for amputees who are using their prosthesis to WALK
Please note this assessment must be completed with the amputee present or on the telephone and the amputee must be asked how they think they can manage each activity It is how the patient perceives their own performance that is being measured
Put 0123 or 4 in the appropriate boxes where -
0 = No 1 = Yes if someone helps 2 = Yes if someone is near 3 = Yes alone with walking aid(s) 4 = Yes alone without walking aid
Activity 6 months pre-admission
Final Discharge
Basic Activities
Get up from a chair
Walk indoors
Walk outside on even ground
Go up the stairs with a hand-rail
Go down the stairs with a hand-rail
Step up a kerb
Step down a kerb
TOTAL
Advanced activities
Pick up an object from the floor when standing
Get up from the floor (eg after a fall)
Walk outside on uneven ground (eg grass gravel slope)
Walk outside in bad weather (eg rain wind snow)
Go up a few steps without a hand-rail
Walk down without a hand-rail
Walk while carrying an object
TOTAL
OVERALL TOTAL
CHANGE of overall total from 6 months preadmission to final discharge
36
Appendix F Functional Co-morbidities Index
Lower limb amputees are a predominantly elderly group with a relatively high incidence of co-morbid disease This has not been previously accounted for in the SPARG data collection and analysis The Functional Co-morbidities Index (FCI) was incorporated into the data set from 2008
The FCI was developed and validated with physical function as the outcome (Groll et al 2005) The more commonly used indices predict mortality or administrative outcomes such as
hospital length of stay These indices tend to include conditions that are asymptomatic and impact on life expectancy but not physical function (for example hypertension) and have been found not to correlate strongly with physical disability
The FCI was developed using 2 different samples of adults 1 group n= 9423 random Canadian adults 2nd group n = 28349 US adults seeking treatment for spinal ailments using the physical subscale of the SF36 as the outcome
The FCI is completed by scoring a 1 if a disease is present and 0 if it is not A score of 0 indicates no co-morbid illness and a score of 18 indicates the highest number of co-morbid illnesses The disease is only scored as present if it is diagnosed and documented in medical notes
The BMI is calculated for each patient by dividing the patientrsquos weight by their height in metres squared (weight height 2 ) If neither height nor weight can not be measured or obtained BMI can be estimated using the mid upper arm circumference (MUAC) (lsquoMustrsquo Explanatory Booklet) If MUAC is more than 320cm BMI is likely to be more than 30kgm2 ie patient is likely to be obese
Functional Co-morbidities Index
Arthritis (rheumatoid and osteoarthritis) Yes No
Osteoporosis Yes No
Asthma Yes No
Chronic Obstructive Pulmonary Disease Acquired Respiratory Distress Syndrome Emphysema
Yes No
Angina Yes No
Congestive Heart Failure (or heart disease) Yes No
Heart Attack (myocardial infarction) Yes No
Neurological disease eg Multiple Sclerosis or Parkinsonrsquos Yes No
CVA or TIA Yes No
Peripheral Arterial Disease Yes No
Diabetes Type I and II Yes No
Upper gastrointestinal disease (ulcer hernia reflux) Yes No
Depression Yes No
Anxiety or panic disorders Yes No
Visual impairment (cataracts glaucoma macular degeneration) Yes No
Hearing impairment (very hard of hearing even with hearing aids) Yes No
Degenerative disc disease including back disease spinal stenosis or severe chronic back pain
Yes No
Obesity andor BMI gt 30 (Pre-op weight in Kgheight in metres 2)
Weight helliphelliphellip (Kg)
Height helliphellip (metres) BMI = helliphelliphelliphellip
Yes No
Please see Guidance Notes Score (Yes = 1 No = 0) 18
37
Appendix G Data Cleaning Steps
Remove records which are marked as missing
Checked flagged and fixed DOBs in current year and age gt100
Check flagged and fix date of amputation
Check Amputees with right and left amputations are marked as bilaterals
Check milestones are calculated from final surgery
Check if LF then final outcome is LF (1) or Abandoned (3)
Where DOB date of amputation etc are left blank then these are flagged and marked
as Missing
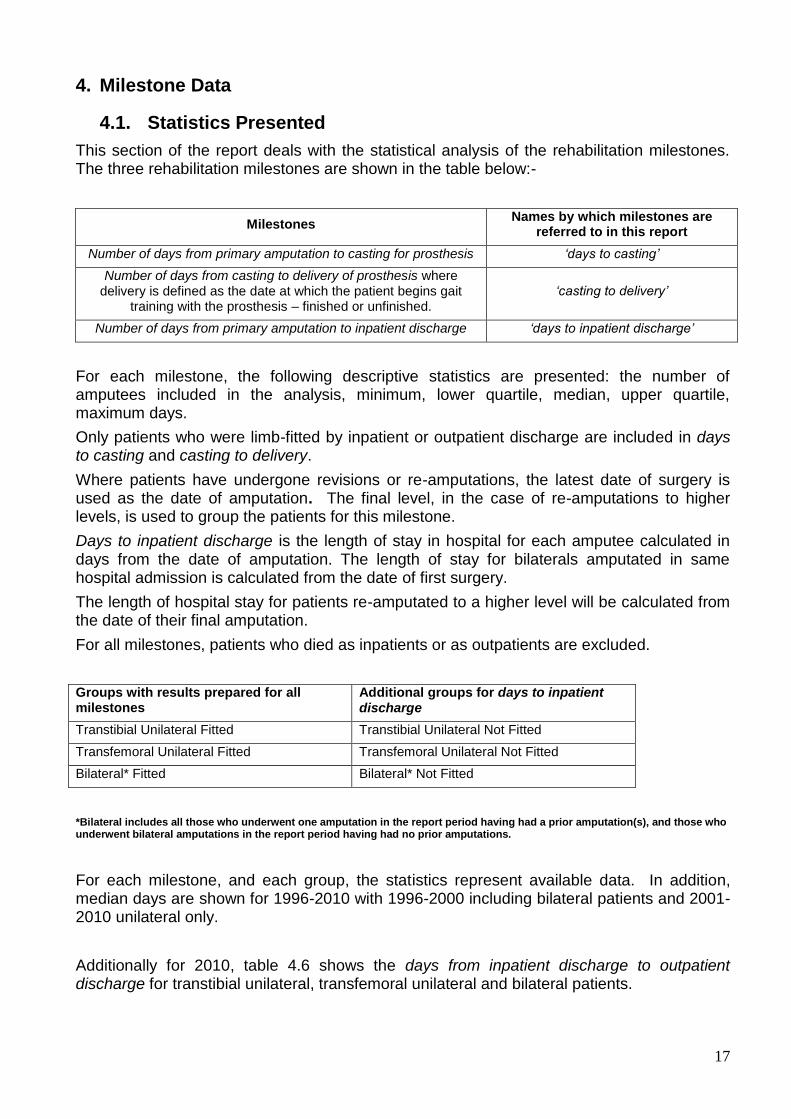
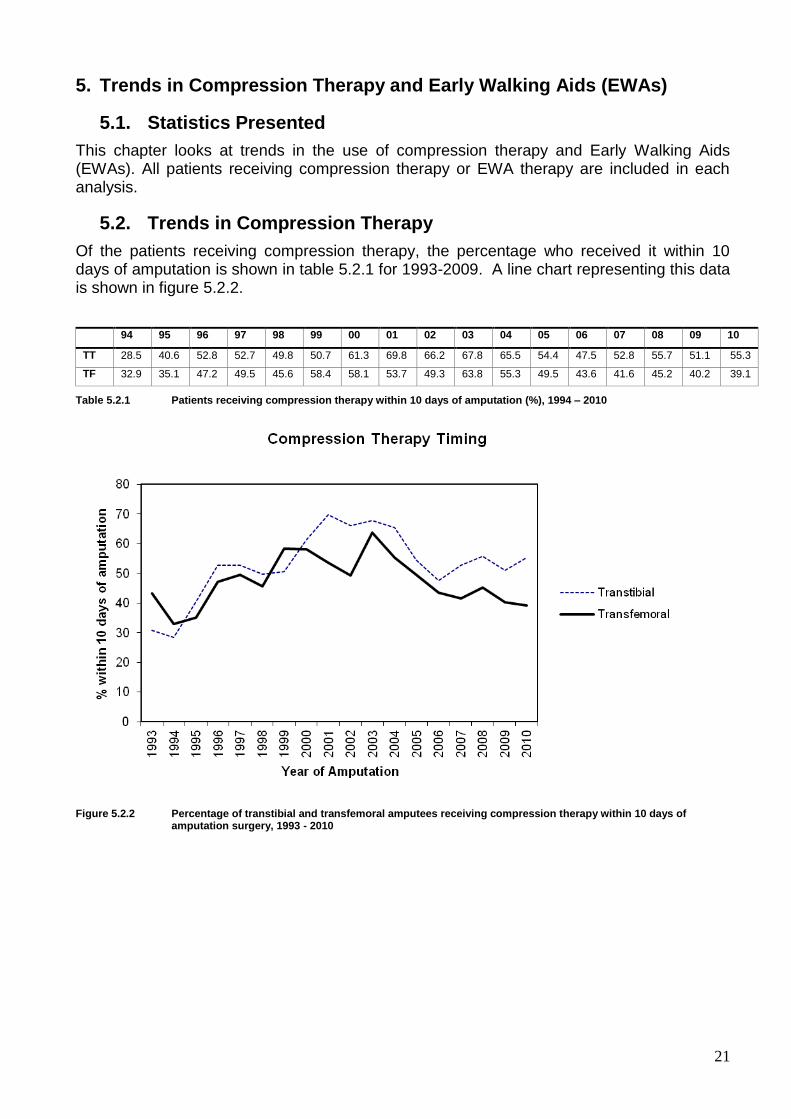