Embed Size (px)
Citation preview

2003 Manx Shearwaters om Rum 89
A SURVEY OF MANX SHEARWATERS PUFFI�US
PUFFI�US ON RUM, INNER HEBRIDES IN 2001
S. MURRAY¹, M. C. SHEWRY², G. P. MUDGE³ & S. SPRAY³
Murray S., Shewry M.C., Mudge G.P. & Spray S. 2003. A survey of Manx
Shearwaters Puffinus puffinus on Rum, Inner Hebrides in 2001. Atlantic Seabirds
5(3): 89-100. A sample survey of breeding numbers of Manx Shearwaters Puffinus
puffinus was carried out on Rum in 2001, based on 658 circular quadrats randomly positioned throughout the colony. All burrows in the quadrats were checked for occupancy during the late incubation period by playing a tape of a male shearwater call at burrow entrances and recording any response. In order to account for non-responding occupants,
the estimate of the total number of responding burrows was multiplied by a correction factor of 2.16, derived from a calibration study carried out in 2003. A total population estimate of 76,310 occupied burrows (61,160 - 95,740, 95% CL) resulted. Burrows were also checked
visually for signs of occupancy and this suggested a higher total of 119,950 occupied burrows (106,730 - 133,550, 95% CL ). Further study of the response rate at this colony is advisable in order to understand the discrepancy between these findings. The estimate based on visual signs of occupancy is comparable with earlier studies, and little evidence exists to
indicate that the colony is decreasing, as was suggested in the 1990s.
¹Easter Craigie Dhu, Dunkeld PH8 OEY, Scotland, U.K.; ²Scottish Natural Heritage, Battleby, Redgorton, Perth PH1 3EW, Scotland, U.K.; ³Scottish Natural
Heritage, The Governor’s House, The Parade, Fort William PH33 6BA, Scotland,
U.K.
INTRODUCTION
As a breeding species the nominate form of the Manx Shearwater Puffinus
puffinus is confined mainly to north-western Europe, from Iceland to the
Azores, with very small numbers breeding in Canada and the USA. Prior to
recent surveys, the total population was estimated at between 260,000-330,000
pairs, with more than 90% being in Britain and Ireland (Lloyd et al. 1991). The
largest breeding concentration is on the islands of Skomer, Skokholm and
Middleholm in Wales, with a combined estimated total of 151,000 pairs in 1998
(Smith et al. 2001).
The island of Rum in the Inner Hebrides has been known as a breeding
site of the Manx Shearwater since the 17th
century (Martin 1716) but the first
attempt to assess the size of the colony was made only in the 1960s (Wormell
1976). In contrast to the low-lying Welsh colonies, shearwaters on Rum breed in
mountains, mainly above 457m and as high as 800m. The co lonies are often

90 S.MURRAY ET AL. Atlantic Seabirds 5(3)
Figure 1. Main breeding areas of Manx Shearwaters on Rum, Inner Hebrides.
Figuur 1. Belangrijkste broedgebieden van �oordse Pijlstormvogel op Rum, Hebriden.

2003 Manx Shearwaters om Rum 91
visually obvious as 'shearwater greens' due to the manuring effect of the birds
droppings enriching the surrounding vegetation. The total extent of these greens
was estimated by both Wormell (1976 ) and Earthwatch (in Furness 1990 ) to be
c. 30 hectares. Wormell (1976) drew greens on overlays of aerial photographs,
transferred the traces to a 1:10560 scale grid and measured their extent with a
planimeter; he considered the resulting estimate of colony size to be very
approximate. The Earthwatch teams attempted to locate greens by ground
survey, but produced only a “crude map of doubtful accuracy” (Furness 1990).
Population estimates were made between 1965 and 1969 (Wormell 1976), in
1978-1979 based on Wormell's map of the greens (Thompson & Thompson
1980) and in 1982, also based on Wormell's map (Philips 1982). Furness (1990,
1997) based his surveys on the greens as mapped by Earthwatch.
In 2000, we attempted to re-assess the size of the colony using new
maps commissioned by Scottish Natural Heritage. However, once the field
study began it became obvious that the maps were inadequate and that any
sampling frame based on them would be flawed. Consequently, a different
method was used in 2001, with all potentially suitable ground above the 457m
contour defined as the colony. This paper reports on the survey work undertaken
in 2000, a complete survey in 2001 (which avoided the need to pre-determine
green locations) and fieldwork carried out in 2003 to calibrate population
estimates based on responses to tape playback.
METHODS
In 2000 and 2001, two methods were used to estimate the numbers of
shearwater burrows: visual estimation of 'apparently occupied burrows' (AOBs),
and tape playback at burrow entrances.
Although AOBs are usually sufficiently deep to conceal an incubating
bird, occupation may be indicated in several ways. There may be signs of recent
digging activity, disturbed or recently flattened soil and vegetation, droppings,
feathers or the smell of shearwaters. The number of AOBs were counted within
circular 20m² quadrats to allow fo r comparison with previous surveys. In
addition, a taped call of a male (Rum) shearwater was played at the entrance of
every burrow within the quadrat, whether or not there were signs of occupancy,
and any responses noted (Walsh et al. 1995). AOBs could not be defined in the
few quadrats that were covered with boulders, but the tape was played
systematically across the quadrat and again responses noted. We assumed that
males always respond to the taped call of another male and females do not
(Brooke 1978; Walsh et al. 1995).
Herein, the term burrow is used solely for an apparently occupied
burrow. There were no other burrowing birds or mammals in the shearwater

92 S.MURRAY ET AL. Atlantic Seabirds 5(3)
breeding areas, which prevented misidentification of burrows. Burrows with
double entrances are not uncommon, so every burrow entrance within all
quadrats was carefully checked to avoid double counting.
Survey work on Rum in 2000 In 2000, a map derived from aerial photography
that attempted to differentiate greens and boulder fields was compiled, but it
became clear from field survey that these features could not be distinguished
accurately. However, data were obtained from 276 quadrats on greens that
informed the sampling regime applied in the 2001 survey.
Boulder fields varied widely in area, composition and stability, with
only small areas apparently suitable for breeding shearwaters. Typically,
shearwater occupancy of these was low compared with greens; of a total of 159
quadrats sampled only 13 responses to the tape were obtained, so most of these
areas were excluded from the 2001 survey.
Survey work on Rum in 2001 In 2001, we randomly placed quadrats
throughout all ground in the main shearwater breed ing areas. Most fieldwork
was undertaken from 20 May-12 June, coinciding with the latter half of the
incubation period and maximum diurnal burrow occupancy (Thompson 1987).
Quadrats were located using a hand held global positioning system,
pre-programmed with 10 figure National Grid references. Over most of the
colony, positioning was accurate to within 5 m, but where signals were poor,
such as under cliff faces, readings could vary by up to 30 m. Such positional
errors are unlikely to be systematically b iased.
Previous surveys have indicated the potential for bias if sampling is
based only on attempts to map shearwater greens. We used our field experience
from the 2000 survey to draw boundaries that encompassed all the main
shearwater breeding areas, which were above 457m. On each of the three main
peaks Hallival, Askival and Trollaval, the ground within the boundaries was
divided into a 'core' area of relatively high density (49.7 ha ), surrounded by a
'fringe' area o f low density (98.0 ha ), a total breed ing area of 148 ha. (Fig. 1).
The core areas included most of the greens mapped on each mountain in
previous studies (Wormell 1976; Furness 1990). Areas where burrow densities
were so low that a disproportionate number of quadrats would have been
required to obtain sufficient data to allow robust estimates to be calculated were
excluded; such areas were Ainshval, Barkeval, west Trollaval, all ground
between 366 m and 457 m, and hazardous cliff terraces on Askival and Clough's
Crag (Fig. 1).
Data from tape playback in 2000 were used to determine the number of
quadrats required to achieve a given level of precision for the 2001 population
estimates for each habitat stratum. These data derived from a random sample of

2003 Manx Shearwaters om Rum 93
the greens mapped in 2000; we assumed, therefore, a similar random sample
pertained in 2001.
As no data were availab le on the area of unsuitable ground within
strata, we estimated the proportion of quadrats likely to be on such ground.
However, the expected precision of the population estimates is not particularly
sensitive to variation in the proportion of unsuitable ground, so we assumed that
responses would not be elicited in 50% of quadrats in the core areas or in 80%
of the fringe areas. An appropriate number of zero counts was then added to
each stratum's 'green' data from 2000 in o rder to simulate a random sample. This
was used to determine the 'optimal' number of quadrats in each strata in order to
minimise sampling error for a g iven sample size. On this basis, 400 quadrats
were selected to give an expected coefficient of variat ion (CV) of 10%.
Additional quadrats were generated, giving a total o f 658 quadrats with an
expected CV of about 8%. A disadvantage of this approach is that only a
proportion of the defined area will contain burrows and many quadrats would be
located in unsuitable ground; a balance was achieved that minimized the risk of
excluding ground that may have contained significant numbers of shearwaters,
and at the same time did not include too much unoccupied ground.
The total surface area of each stratum was estimated from a 10 m
resolution contour digital terrain model (DTM) in ERDAS Imagine software.
The use of surface area was justified as the DTM resolution is of the same order
of magnitude as the size of a quadrat (5 m d iameter).
Estimates for each stratum were calcu lated by computing the average
number of responses and AOBs/m2, mult iplied by the area of the stratum.
Estimates from the six strata were then summed to give an overall population
estimate. Confidence intervals for the total number of burrows were calculated
using bootstrapping (Efron 1979); 1000 bootstrapped estimates were generated,
each estimate being calculated from a d ifferent sample of each stratum.
Calibration factor calculation in 2003 Population estimates based on
responses to tape playback must be corrected for non-responding birds, mainly
females and possibly non-breeders. In 2001, a calibration factor of 1.98 (see
Walsh et al. 1995) was applied. However, it is advisable that a colony-specific
correction factor be applied, ideally derived at the time of the survey (I.P.
Mitchell pers comm.). We obtained such a correction factor for Rum between 21
and 31 May 2003. Th is period is late enough to include the peak of egg laying
(Thompson 1987), and early enough to exclude most non-breeding birds, some
of which may occupy burrows and respond to taped calls (Smith et al. 2001).
This study was carried out in the core area on Hallival using the 2001 survey
criteria for selecting AOBs, chosen as randomly as possible. The tape was
played at each burrow entrance, and sufficient burrows were included to obtain

94 S.MURRAY ET AL. Atlantic Seabirds 5(3)
Table 1. �umbers of quadrats (each 20m²), with Manx Shearwater burrows, and
number of burrows from which responses were obtained to tape playback in
core and fringe areas on Rum in 2001. Tebel 1. Aantal plots (elk 20m²), met holen van �oordse Pijlstormvogel en het aantal
holen waaruit positief werd gereageerd op het afspelen van de roep in het
kerngebied en aan de randen van de kolonie.
Stratum Site Area (ha) Total no.
quadrats
No. quadrats with
burrows (%)
No. burrows with
response (%)
Core Hallival 26.1 162 94 (58) 64 (40) Askival 15.9 70 54 (77) 33 (47) Trollaval 7.7 46 29 (63) 21 (46) All core 49.7 278 177 (64) 118 (42) Fringe Hallival 31.1 159 45 (28) 25 (16) Askival 36.3 111 35 (32) 21 (19) Trollaval 30.6 110 37 (34) 27 (25) All fringe 98.0 380 117 (31) 73 (19) All 147.7 658 294 (45) 191 (29)
a minimum of 30 responses on the first day. The 85 selected burrows were
marked with numbered flags, although one burrow later found to have a double
entrance reduced the number checked to 84.
The correction factor was calculated as the mean response rate over 10
days for the 84 burrows. Bootstrapped estimates for the response data, from the
2001 survey, were generated in the same way as those for AOBs and then
combined with bootstrapped correction factors generated from the 84 burrows to
calculate confidence intervals for the corrected estimates.
RESULTS
All 658 quadrats were visited. In the core area, 36% of quadrats held no
burrows, but in the fringe area 69% held none (Table 1); average burrow density
in the former area was 0.140 AOB/m², and in the latter area 0.051 AOB/m²
(Table 2). In the core area, no responses were elicited from 58% of quadrats,
and in the fringe area none were elicited from 81%, close to the 50% and 80%
predicted values (Table 1).

2003 Manx Shearwaters om Rum 95
Table 2. Estimates and confidence limits for the number of apparently occupied
burrows in the main Manx Shearwater colonies on Rum in 2001. Tabel 2. Schattingen en betrouwbaarheidsintervallen van het aantal bezette holen van
�oordse Pijlstormvogel in de belangrijskte kolonies op Rum in 2001.
Stratum Site Mean
AOBs/m²
Estimated no.
of AOBs
95% confidence
limits
Core Hallival 0.141 36,760 29,960-44,480
Askival 0.144 22,980 18,420-27,970
Trollaval 0.129 9900 7,040-13,320
All core 0.140 69,640 60,070-78,870
Fringe Hallival 0.037 11,650 7,930-15,660
Askival 0.059 21,260 14,400-28,050
Trollaval 0.057 17,400 11,970-23,950
All fringe 0.051 50,310 40,850-60,420
All 0.081 119,950 106,730-133,550
Table 3. Estimates and confidence limits for the number of Manx Shearwater burrows
based on responses to taped calls in the main colonies on Rum in 2001.
Tabel 3. Schattingen en betrouwbaarheidsintervallen van het aantal holen van �oordse
Pijlstormvogel in de belangrijskte kolonies op Rum in 2001.
Stratum Site Mean
responses/m²
Estimated no.
of burrows
95% confidence
limits
Core Hallival 0.075 21,370 16,230-26,950
Askival 0.081 14,250 10,190-19,180
Trollaval 0.079 6,650 4,140-9,470
All core 0.077 42,270 34,690-50,700
Fringe Hallival 0.018 6,130 3,600-8,760
Askival 0.036 13,780 7,770-21,050
Trollaval 0.042 14,130 8,570-21,030
All fringe 0.032 34,040 25,100-43,690
All 0.048 76,310 61,160-95,740 A correction factor of 2.16 (calculated from 2003 data) has been applied to the estimates. Confidence limits take account of uncertainty in the true value of the correction factor.

96 S.MURRAY ET AL. Atlantic Seabirds 5(3)
From the area of each stratum and the respective burrow densities, a
total of c. 70,000 burrows (60,000-79,000, 95% CL) resulted for the core area,
and c. 50,000 (41,000-60,000, 95% CL) for the fringe area, a colony total of c.
120,000 burrows (107,000-134,000, 95% CL; Table 2). Shearwaters also bred at
low density outwith the mapped areas, but no attempt was made to assess
numbers. However, based on the approximate area of available habitat
elsewhere and applying the density measurement obtained in the fringe area, it
is likely that 3,000-6,000 pairs bred elsewhere on Rum.
Population estimates and confidence limits for the number of burrows
based on response to tape playback are presented in Table 3. The 2003
calibrat ion study resulted in a correction factor for non-responding occupants of
2.16. The total coefficient of variation for the number of responses was 7.8%,
close to the 8% predicted from the 2000 survey data. The estimated total
number of burrows where a male responded to the tape was 35,000 (28,000-
44,000, 95% CL). Application of the correction factor resulted in an estimate of
c. 76,000 burrows.
DISCUSSION
Our survey suggested that there were about 120,000 (107,000-134,000, 95%
CL) occupied Manx Shearwater burrows on Rum in 2001. However, the total
number of burrows based on response rates was 76,000 (61,000-96,000, 95%
CL), considerably fewer than the AOB estimate. Th is difference might be
attributable to the presence of non-breeders prospecting burrows and who did
not respond to tape playback. However, Smith et al. (2001) reported that
unoccupied burrows on Skomer were visited only occasionally by responding,
presumably non-breeding, birds; only 1% of responses were made by non-
breeders. If a similar situation prevailed on Rum, and the survey period predated
the expected arrival date of most non-breeders (James 1985), then non-breeders
alone cannot account for non-responding burrows.
The colony-specific calibrat ion factor, calculated in 2003, did not
greatly reduced the discrepancy between the population estimates resulting from
the two different methods; it is also unlikely that the numbers of non-breeders
represent as much as 30-40% of the total population. A discrepancy between
estimates obtained from responses to tape and the AOB method was also found
on St Kilda, where a response was elicited from 36% of apparently occupied
burrows (PI Mitchell pers comm.), and on Bardsey (30.5%; Leaper et al. in
prep.). These figures are very similar to that on Rum (29%).
The reasons for the discrepancies are unknown. It might appear that the
two methods measure different population parameters. Perhaps calibrat ion
factors vary not only between colonies but also interannually. Furthermore,

2003 Manx Shearwaters om Rum 97
View of the breeding areas on Rum. Uitzicht op de broedgebieden op Rum. (Steve
Geelhoed)

98 S.MURRAY ET AL. Atlantic Seabirds 5(3)
there are several ways in which data from the calib ration can be analysed, each
resulting in a slightly different value for the correction factor.
Given the uncertainty associated with response rates, we advise that
where there are no other burrowing species present, counts of apparently
occupied burrows should be undertaken in tandem with a tape playback survey
and concurrent calibration study. Possible improvements to the design of the
calibrat ion study include ensuring wide spatial coverage, and using an
endoscope to determine occupancy.
It is difficu lt comparing the results of our study with previous surveys
given the differences in field methods, sampling strategies and timing in relat ion
to non-breeder activity. However; the core area in 2001 (49.7 ha) broadly
coincides with the mapped greens in previous studies (30-33 ha) and here the
burrow counts (69,900) are within 12% of Philips (1982) estimate of 79,000 in
1982, and 10% of Furness (1997) estimate of 62,800 in 1995. Wormell's (1976)
estimate of 116,000 in 1976 (32-46% h igher than the later counts), and
Thompson and Thompson's (1980) estimate in 1978-1979 of 124,000-146,000
pairs (at burrow densities 21% h igher than in any other study), might appear
anomalous. However, the degree to which surveys focus on the most densely
populated greens probably greatly affects population estimates. Furness (1990)
noted that the large variation in all areas rendered it difficu lt to demonstrate
statistically significant changes over time; however, he considered that there
may have been a slow decline in burrow densities from the 1960s through to
1990.
It appears to be widely accepted that the Rum shearwater colony is in
slow decline (e.g. Smith et al. 2001), but the evidence for this rests main ly on
the analysis by Furness (1997) of his fixed quadrat data from 1985, 1990 and
1995. A re-examination of Furness (1997) suggests that population decline
between 1985 and 1995 had not been clearly established. Although the decline
in used burrows within 105 permanent quadrats, grouped into larger plots in
some major greens, was greater than that which could be attributed to observer
error, the estimated decline remains subject to sampling error. If we assume that
the quadrats, although non-random, are representative of change, then an
appropriate statistical test may be used to examine whether the data indicate that
actual population change has occurred. A paired t-test was applied by Furness
(1997), but this provided no evidence for a statistically significant decline in
used burrow density (Furness 1997) and we consider there is no compelling
evidence of any substantial change in the size o f the Rum shearwater colony
since at least the 1980s, if not earlier.
The present population on Rum is somewhere between 61,000 (Table
3) and 134,000 pairs (Table 2), depending on the method used, compared with c.
102,000 pairs on Skomer (based on tape playback; Smith et al. 2001). Skomer,

2003 Manx Shearwaters om Rum 99
therefore, is the world's largest single colony of Manx Shearwaters; Rum is
certainly of a similar size.
ACKNOWLEDGEMENTS
We thank G. Johnson and P. Vigano for selecting quadrats, calculating stratum areas by
orthorectification and preparing maps. We also thank Dr P.I. Mitchell for advice and unpublished data, E. Ashworth, M. Mouthaan, A. Stronach, and A.R. Thomas for assistance with fieldwork, D.A. Elston for valuable advice on statistical methods, A.D.K. Ramsay for recordings of shearwater calls,
and Professor M.P. Harris for constructive comments on earlier drafts of the ms.
INVENTARISATIE VAN NOORDSE PIJLSTORMVOGELS OP RUM,
HEBRIDEN, IN 2001
Op het eiland Rum werd in 2001 een steekproefsgewijze inventarisatie van
broedende Noordse Pijlstormvogels uitgevoerd met behulp van 658 p lots die at
random verdeeld waren over de kolonie. Ieder hol in de plots werd laat in het
broedseizoen gecontroleerd op de aanwezigheid van vogels door de roep van
een mannetje af te spelen bij de ingang en de reactie te registreren. Om te
corrigeren voor niet-roepende vogels werd het geschatte totaal vermenigvuldigd
met een correctiefactor van 2,16, die in 2003 was verkregen tijdens een
calibrat iestudie op Rum. Het resultaat was een populatieschatting van 76.310
(95%-betrouwbaarheidsinterval 61.160-95.740, tabel 3). Een v isuele controle
van de holen leverde een hogere populatieschatting op, nl. 119.950 (95%:
106.730-133.550, tabel 2) schijnbaar bezette holen (AOB). Verder onderzoek
naar de response rate in deze kolonie is nodig om het verschil tussen beide
schattingen te begrijpen. De visuele schatting is vergelijkbaar met eerder
behaalde resultaten. Er zijn geen aanwijzingen voor een afname, zoals in de
jaren negentig werd gesuggereerd.
REFERENCES
Brooke M. de L. 1978. Sexual differences in the voice and individual vocal recognition in the Manx
Shearwater Puffinus puffinus. Animal Behaviour 26: 622-629.
Efron B. 1979. Bootstrap methods: another look at the jackknife. Annals of Statistics 7: 1-26. Furness R.W. 1990. Numbers and population trends of Manx Shearwaters on Rum. Nature
Conservancy Council CSD Report No. 1168. Nature Conservancy Council, Peterborough. Furness R.W. 1997. Survey of the Rum Manx Shearwater population. S.N.H. Research, Survey and
Monitoring Report No 73. Scottish Natural Heritage, Perth. James P.C. 1985. The vocal behaviour of the Manx Shearwater. Zeitschrift für Tierpsychologie 67
:269-283. Leaper G., Stansfield S. & Mitchell P.I. Census of the breeding population of Manx Shearwaters P.
puffinus on Ynys Enlii (Bardsey Island), Wales, 2001. Joint Nature Conservation Committee Report (in preparation).

100 S.MURRAY ET AL. Atlantic Seabirds 5(3) Lloyd C., Tasker M.L. & Partridge K. 1991. The Status of Seabirds in Britain and Ireland. T . & A.
D. Poyser, London. Martin M. 1716. A description of the Western Isles of Scotland. Facsimile edition, James Thin,
Edinburgh. Philips B.N. 1982. The Status of the Manx Shearwater Puffinus puffinus on the Isle of Rum.
Unpublished MSc thesis, University College, London. Smith S., Thompson G. & Perrins C.M. 2001. A Census of the Manx Shearwater Puffinus puffinus
on Skomer, Skokholm and Middleholm, west Wales. Bird Study 48: 330-340. Thompson D.B.A. & Thompson P.S. 1980. Breeding Manx Shearwaters Puffinus puffinus on Rhum.
Hebridean Naturalist 4: 54-65. Thompson K.R. 1987. The Ecology of the Manx Shearwater Puffinus puffinus on Rhum, West
Scotland. Unpublished PhD thesis, University of Glasgow, Scotland. Walsh P.M., Halley D.J., Harris M.P., del Nevo A., Sim I.M.W & Tasker M.L. 1995. Seabird
monitoring handbook for Britain and Ireland. JNCC/RSPB/ITE?Seabird Group, Peterborough.
Wormell P. 1976. The Manx Shearwaters of Rhum. Scottish Birds 9: 103-118.

2003 Atlantic Puffins in the Firth of Forth 101
COUNTS OF ATLANTIC PUFFINS FRATERCULA
ARCTICA IN THE FIRTH OF FORTH, SOUTH-EAST SCOTLAND IN 2003
MICHAEL P. HARRIS
1, SARAH WANLESS
1, STUART MURRAY
2,
ALAN LEITCH3 & LINDA J. WILSON
1
Harris M.P., Wanless S., Murray S., Leitch A. & Wilson. L.J. 2003. Counts of
Atlantic Puffins Fratercula arctica in the Firth of Forth, south-east Scotland in
2003. Atlantic Seabirds 5(3): 101-110 The numbers of Atlantic Puffins Fratercula arctica breeding at three colonies in the Firth of Forth were estimated in 2003. The Isle of May held 69,300 occupied burrows, making it the largest single colony in Britain and Ireland. This population increased at an average rate of 10.9% per annum between 1970 and 2003. Similarly, numbers on Fidra (1466) increased by an average of 9.5% per annum
over the period 1976-2003. In contrast, the count of occupied burrows on Craigleith (12,100) was less than half of the 1999 estimate. This decline appeared to be due to the rapid spread of an alien plant, the tree mallow Lavatera arborea. The geographically distinct
population of Atlantic Puffins in east Britain between the Moray Firth and Flamborough Head was estimated at 130,000 occupied burrows in 2003, representing an average rate of increase of 6% per annum over the previous 30 years.
1NERC Centre for Ecology and Hydrology, Hill of Brathens, Banchory, Aberdeenshire AB31 4BW. Scotland, U.K. E-mail: [email protected]; 2Easter
Craigie Dhu, Cardney, Dunkeld, Perthshire PH8 0EY, Scotland, U.K. 3 Scottish
Natural Heritage, Laundry House, Dalkeith Country Park, Dalkeith, Midlothian
EH22 2NA, Scotland, U.K.
INTRODUCTION
In Britain, the Atlantic Puffin Fratercula arctica has usually been considered a
bird of the north and west with the largest colonies on isolated and spectacular
islands such as St Kilda, North Rona and Sule Skerry (Cramp et al. 1974).
However, over the last 40-50 years numbers of Atlantic Puffins nesting on the
small, flat islands off the east coast of Scotland and England have increased
substantially and several new colonies have established (Smith 1966, 1974;
Harris et al. 1987). The expansion has been most marked in the Firth of Forth
(Fig. 1); this paper reports on counts of burrows made at three colonies in this
area (Isle of May, Fidra, Craig leith) in 2003 and assesses the rates of change in
numbers in east Britain over the last 30 years.

102 M.P. HARRIS ET AL. Atlantic Seabirds 5(3)
Figure 1. Colonies of Atlantic Puffin in the Firth of Forth, south-east Scotland: Isle of
May (May), Craigleith (Cr), Bass Rock (Ba), the Lamb (La), Fidra (Fi), Inchkeith (Ik), Inchmickery (Im) and Inchcolm (Ic). The locations of the large colonies in
north-east England and the limits of the local population (triangles) are also
shown.
Figuur 1. Papegaaiduikerkolonies in de Firth of Forth, Zuidoost-Schotland: het eiland
May (May), Craigleith (Cr), Bass Rock (Ba), the Lamb (La), Fidra (Fi), Inchkeith (Ik), Inchmickery (Im) en Inchcolm (Ic). De ligging van de grote kolonies in
9oordoost-Engeland en de grenzen van de lokale populatie (driehoek) zijn
eveneens aangegeven.

2003 Atlantic Puffins in the Firth of Forth 103
METHODS
The counting unit employed was the ‘apparently occupied burrow’, defined as a
burrow showing signs of use by Atlantic Puffins such as fresh digging,
droppings or regular wear. Where both Atlantic Puffins and rabbits Oryctolagus
cuniculus occur (as on the Isle of May), there is potential for confusion between
the burrows of the two species. However, a rabbit burrow tends to be larger, has
more signs of digging, and has characteristic ‘pellet’ droppings in the entrance.
None of the three islands studied has any other species of burrowing bird. For
convenience, we use the terms ‘burrow’ instead of ‘occupied puffin burrow’.
Additional details of the counts and changes in numbers are given in Wanless et
al. (2003).
Isle of May Puffins burrow predominantly in the flatter parts of the 55 ha island
wherever there is sufficient soil. The count was undertaken by six people
between 24 and 27 April 2003 when about half of the burrows contained eggs.
The island was divided into 11 areas, each sub-divided into strips 25 m wide
with the boundaries marked with bamboo canes. Each observer searched a strip
about 5 m wide by zigzagging slowly across and along it. Where there was
potential for overlooking burrows or counting them twice, a cane was used to
mark the earth in the entrance of each burrow as it was counted.
In order to quantify the detection rate and the classification of burrows
a plot c. 10x15 m was marked out with string in each of the 11 main counting
areas. In five of these plots, the counters marked each burrow with a white
plastic tag. In the other six plots, a single counter recorded all burrows he or she
found while passing through the plot as part of the main count. Immediately
following these counts, MPH, who did not take part in the total count, carried
out a detailed examination of each plot, where necessary lying on the ground
and feeling to the end of the burrow with a bamboo cane. In each plot, he
determined the number of (a) Puffin burrows that had been overlooked (i.e.
were unmarked), (b) burrows that belonged to a rabbit rather than a Puffin, (c)
entrances that were not true burrows (e.g. were very short), and (d) cases where
there were two entrances to a single burrow (i.e. the burrow had been counted
twice). Double occupancy of a burrow, where two pairs use a single entrance, is
extremely rare so this possibility was discounted.
Censuses of the Isle of May colony have previously been made in late
April in 1975, 1984, 1989, 1992 and 1998; similar occupancy checks were made
in two of these (Harris & Wanless 1998). In 1992, checks made in four areas
suggested that the count had over-estimated the population by 7%, and in 1998,
checks suggested an over-estimate of 2%. The probability of overlooking or

104 M.P. HARRIS ET AL. Atlantic Seabirds 5(3)
wrongly classifying a burrow varies from area to area and from year to year due
to the state of the vegetation, soil erosion, burrow density, numbers of rabbits,
and other factors. For comparison with previous counts – here and on the other
islands – we use the uncorrected burrow counts.
Craigleith About 95% of this 11.3 ha island was covered with a dense stand of
tree mallow Lavatera arborea reaching a height of 2.5 m. Even in early spring
the most sheltered parts of the island were under an almost closed canopy that
made counting burrows very difficult and time consuming. As far as was
practical the methodology followed that on the Isle of May. The count was
made on 19 April 2003 by six counters. Checks of the efficiency of counting
and classification in 11 plots were made by SM.
Fidra The count of the 7.4 ha island was made by six people on 4 May 2003
using the methodology outlined above. The efficiency of counting and burrow
classification was checked by SM in two plots and these figures are used to give
an approximate confidence interval for the count.
RESULTS AND COMPARISONS WITH PREVIOUS COUNTS
Isle of May Burrows were recorded virtually everywhere on the island where
there appeared to be sufficient soil. The uncorrected count was 74,517 burrows.
Results from the 11 p lots used to estimate observer error indicated that
a correction factor of 0.93 should be applied to the raw counts (Table 1). This
suggested that the overall count was 7% too high, main ly as a consequence of
recorded burrows either being too short for breeding or having several
entrances. The 95% confidence limits (CL) fo r this correction factor, ignoring
the one plot where there were just two burrows, were 0.891-0.975. Applying
this value to the count total (and rounding off to the nearest 100) resulted in a
corrected total of 69,300 (66,400-72,700, 95% CL) occupied burrows.
The early history of the Puffin on the Isle of May is fragmentary
(Eggeling 1960; Harris 1977; Harris & Wanless 1998). Before 1960, there were
generally fewer than 50 pairs, with most occupying fissures in the cliffs rather
than burrows in the central, flatter parts of the island. Numbers increased during
the 1960s with about 200 pairs in 1963 and about 2000 pairs in 1970. The first
systematic census of the colony was made in 1975 (3064 burrows) and counts
were subsequently made in 1984 (12,211), 1989 (18,628), 1992 (20,106) and
1998 (41,542). The average rate of increase between 1970 and 2003 was 10.9%
per annum (SE = 0.5%; Fig. 2).

2003 Atlantic Puffins in the Firth of Forth 105
Table 1. Checks of burrow counts and classification of Atlantic Puffin burrows on the
Isle of May, Craigleith and Fidra, south-east Scotland in 2003. Tabel 1. Controle van holentellingen en classificatie van papegaaiduikerholen op het
eiland May, Craighleith en Fidra, Zuidoost-Schotland, in 2003.
Plot Field
count
Correctly
classified
Mistaken classification Missed Corrected
count
Correction
factor
Too short or
used by rabbit
Second entrance
to another burrow
Isle of May
1 66 59 4 3 8 67 1.02
2 96 84 9 3 2 86 0.90
3 51 44 3 4 1 45 0.88
4 97 85 5 7 8 93 0.96
5 85 79 1 5 8 87 1.02
6 2 3 1.5
7 80 73 0.91
8 52 51 0.91
9 59 46 0.98
10 40 34 0.85
11 21 19 0.90
Total 649 604 0.93
Craigleith
1 9 9 0 0 3 12 1.33
2 6 6 0 0 2 8 1.33
3 9 9 0 0 0 9 1.00
4 75 68 7 0 31 99 1.32
5 60 54 5 1 10 64 1.07
6 8 8 0 0 12 20 2.50
7 43 43 0 0 11 54 1.26
8 59 53 3 3 2 55 0.93
9 18 17 1 0 1 18 1.00
10 104 90 12 2 7 97 0.93
11 76 70 5 1 11 81 1.07
Total 467 427 33 7 90 517 1.25
Fidra
1 57 50 7 0 1 51 0.90
2 54 51 3 0 2 53 0.98
Total 111 101 10 0 3 104 0.94

106 M.P. HARRIS ET AL. Atlantic Seabirds 5(3)
Figure 2. Counts of Atlantic Puffin burrows on the Isle of May, Craigleith and Fidra,
south-east Scotland between 1956 and 2003.
Figuur 2. Resultaten van tellingen van papegaaiduikerholen op May, Craigleith en
Fidra, Zuidoost-Schotland, tussen 1956 en 2003.

2003 Atlantic Puffins in the Firth of Forth 107
Craigleith The burrow count in 2003 was 9683. Overall, the count appeared to
be 25% too low (Table 1), highlighting the problems of counting in tall dense
vegetation. The corrected burrow total was 12,100 (9200-15,000, 95% CL).
The only previous estimates of Puffin numbers on Craig leith are 75-
100 burrows in 1959, 1325 burrows in 1977, 3361 burrows in 1985, and 28,000
burrows in 1999 (Fairlamb 1998-1999; RWJ Smith pers. comm.; Royal Society
for the Protection of Birds (RSPB) pers. comm.). The 1999 count was based on
estimates of burrow density sampled in different habitats and a visual
assessment that 55% of the island was covered by tree mallow but no estimate
of precision was made. These counts suggest a steady rate of increase of 14.4%
per annum (SE = 0.4%) between 1959 and 1999 (Fig. 2). If numbers had
continued to increase at this rate, there would have been about 48,000 burrows
in 2003 – four times the actual count. We attribute this marked decline to the
very obvious recent rapid spread of tree mallow rendering the island much less
suitable for breeding Puffins.
Fidra Burrows were dispersed at low density over the island with the exception
of the low area to the south-west of the landing, which appeared to be a long
defunct rabbit warren with few, if any, Puffin burrows. Tree mallow was present
in a localized area near the lighthouse. A total of 1559 occupied burrows was
counted. The checks showed that some apparent burrows included in the count
were unusable and that the count overestimated the population by 6% (Table 1);
the corrected total was 1466 (c. 1388-1528, 95% CL) burrows.
Puffins were first recorded ashore on Fidra in 1966. Four burrows were
occupied in 1967 when a single egg was found. Counts have been made in 22
subsequent years (Fig. 2; Andrews 1994-1997; Fairlamb 1998-1999; Jones
2000-2003; RSPB pers. comm.). Between 1976 and 2003 the average rate of
increase was 9.5% per annum (SE = 1.4%).
DISCUSSION
The 2003 count indicated that the Isle of May was the largest single colony of
Atlantic Puffins in Britain and Ireland, with 8% of the Scottish population and
7% of the Brit ish and Irish population (Harris & Wanless 2004). Both breeding
success and adult survival remain high at this colony (personal observations),
and in the absence of density dependent effects there is no reason to suppose
that the numbers will not continue to increase. At the current rate of increase,
the numbers breeding on the Isle of May would double by 2010 and, if the other
large colonies in east Britain were to reach carrying capacity (see below), even
more birds could be attracted.

108 M.P. HARRIS ET AL. Atlantic Seabirds 5(3)
The Isle of May had a combined total of 3812 pairs of Herring Gull
Larus argentatus and Lesser Black-backed Gulls L. fuscus in 2003 (Charras &
Parkinson 2003). Although there is no evidence that the gulls have a negative
impact on Puffin reproductive performance (Finney et al. 2001), their p resence
in areas where Puffins breed at low density reduces the attractiveness to
prospecting Puffins (Finney et al. 2003). As the density of Puffin burrows
increases over most of the Isle of May, gulls may be expected to have less of an
effect on recruitment and Puffin numbers might increase at an even faster rate.
Given that there are still areas of apparently suitable habitat where the density of
burrows is low, there is potential for the colony to increase substantially.
Assuming that (a) only 50% of the land surface is suitable for Puffin burrows,
(b) none of the already occupied high density areas become unsuitable, and (c)
an average density of 1 burrow/m2, the island could theoretically have a carry ing
capacity of one quarter of a million burrows.
Within the Firth of Forth the only long established colonies of Puffins
are on the Isle of May, Craigleith and the Bass Rock. However, during the last
few decades several other islands have been colonised. The numbers of burrows
or birds present at these colonies have been counted or estimated in many years
(Smith 1966, 1974; Harris et al. 1987; Andrews 1994-1997; Fairlamb 1998-
1999; Jones 2000-2003; RSPB pers. comm.; RWJ Smith pers. comm.). Numbers
on the Bass Rock have not increased in recent years and there are probably now
only about 10 pairs. Puffins were first recorded breeding on Inchkeith in 1965
(three burrows, one egg), although birds were seen ashore in 1961. There was
then a rapid increase with 292, 380, 395 and 800-1000 burrows recorded during
visits in 1975, 1976, 1978 and 1994, respectively. There are no recent counts of
burrows on Inchkeith, but estimates of birds on the sea just off the island
suggests that there may currently be more than 2000 pairs at this colony.
Colonisation of Inchcolm possibly occurred in 1992 and breeding was proven
the following year; in 1995 there were 30 pairs, and in 1997 65 b irds. The Lamb
was colonised in about 1984 and eight sites (presumably burrows) were
recorded in 1985, 56 burrows in 1986 and at least 150 burrows in 1995.
Although three Puffins were seen "around" Inchmickery in 1973, there were
then few records until three pairs prospected and possibly bred in 1991. In 2003,
nine individuals were seen ashore and a further four on the sea. Combin ing
these estimates with our census data suggests that the total population of the
Firth of Forth is in the region of 84,000 burrows. This compares with 18,000
burrows in 1985. The cause of this rapid increase is unknown. Many other
species of seabirds in the Firth of Forth, with the notable exception of terns
Sterna spp., have also increased in numbers over the period (Harris et al. 1987;
Jones 2000-2003). Protection at the colonies may have played a small part but

2003 Atlantic Puffins in the Firth of Forth 109
the food supply, perhaps in both the winter and summer, must surely have
increased as well.
The two other major Puffin colonies in eastern Britain (both in
Northumberland) were also censused in 2003. The Farne Islands held 55,700
burrows (John Walton pers. comm.). Coquet Island held 11,300 occupied
burrows and an approximately equal number o f apparently unoccupied burrows
(Paul Morrison pers. comm.); the reason for this high proportion of apparently
unoccupied burrows in 2003 was unknown but the total burrow count was very
similar to those in 2001 and 2002 (RSPB unpublished data). The various Farne
Islands and Coquet Island are small and flat with generally shallow soil -
conditions that lead to the collapse of burrows and subsequent soil erosion - and
appear to have only limited capacity for further increase in numbers of breeding
Puffins.
In 1969-1970, Cramp et al. (1974) estimated that there were about
29,000 pairs of Puffins in east Britain between the Moray Firth and
Flamborough Head in Yorkshire. In 1985-1987, numbers had increased to
55,000 pairs (Lloyd et al. 1991). Counts made in 1998-2003 put the number at
over 130,000 (Harris & Wanless 2004). These totals suggest an average increase
of 6% per annum for the region over the last 30 years. In Britain, the Puffin is
usually considered a bird of wild and remote p laces. However, in 2003 there
were more Puffins nesting on the North Sea coasts of Scotland and north-east
England, than at the famous seabird colony of St Kilda.
Tree mallow is indigenous to England and Wales but was introduced to
Scotland (Cox 2002). Although not very dense or widespread, it is well-
established on Fidra, where attempts are currently being made to control it
(Dave Jones pers. comm.). Unless similar measures are undertaken to control its
spread on Craigleith, Puffin numbers there are likely to be reduced further. Tree
mallow is intolerant of grazing (Gillham 1953), so consideration might be given
to removing some of it and introducing rabbits to Craig leith to restrict its
regeneration.
ACKNOWLEDGEMENTS
Liz Wickens, Stijn Bierman, Genevieve Jones, Morten Frederiksen, Ian Thomson, Elaine Ogston, Vicky Hughes, and Calum Leitch took part in the counts, which were funded by a contract placed with the Centre for Ecology and Hydrology by Scottish Natural Heritage. We thank the many people
who have counted Puffins over many years and who deposited their data with the RSPB, Forth Seabird Group and ourselves. John Walton and Paul Morrison supplied details of the counts on the Farne Islands and Coquet Island, respectively, and John Davies improved the manuscript with his criticisms.

110 M.P. HARRIS ET AL. Atlantic Seabirds 5(3)
INVENTARISATIE VAN PAPEGAAIDUIKERS IN DE FIRTH OF FORTH,
ZUIDOOST-SCHOTLAND, IN 2003
In drie kolonies in de Firth of Forth werden de broedende Papegaaiduikers in 2003 geïnventariseerd. Op het eiland May werden 69.301 bezette nestholen gevonden, waarmee het eiland de grootste
kolonie in Groot-Brittannië en Ierland is. Deze populatie nam van 1970 t/m 2003 toe met een jaarlijkse gemiddelde groei van 10,9%. De aantallen op Fidra (1466 holen) groeide in 1976-2003 met een vergelijkbare snelheid, nl. 9,5% per jaar. Op Craigleith bedroeg het aantal bezette holen in
2003 (12.300) minder dan de helft van het in 1999 geschatte aantal. Deze afname lijkt veroorzaakt door de snelle uitbreiding van een exoot, Lavatera arborea. De geografisch te onderscheiden populatie Papegaaiduikers tussen de Moray Firth en Flamborough Head werd in 2003 geschat op 130.000 bezette holen, hetgeen overeenkomt met een jaarlijkse groei van 6% gedurende de
afgelopen dertig jaar.
REFERENCES
Andrews I.J. (ed.) 1994-1997. Forth Islands bird reports 1994-1997. Unpublished reports of the Forth Seabird Group.
Charras Y. & Parkinson I. 2003. Studies of breeding birds and other biological recording on the Isle
of May in 2003. Scottish Natural Heritage, Cupar (Fife). Cox J.H.S. 2002. Lavatera arborea. In Preston C.D, Pearman D.A. & Dines T.D. (eds.) The new
atlas of the British and Irish Flora. p. 219. Oxford University Press, Oxford. Cramp S., Bourne W.R.P. & Saunders D. 1974. The seabirds of Britain and Ireland. Collins,
London. Eggeling W.J. 1960. The Isle of May. Oliver & Boyd, Edinburgh. Fairlamb D. (ed.) 1998-99. Forth island bird reports. Unpublished reports of the Forth Seabird
Group.
Finney S.K., Wanless S., Harris M.P. & Monaghan P. 2001. The impact of gulls on puffin reproductive performance: an experimental test of two management strategies. Biological Conservation 98: 159-165.
Finney S.K., Harris M.P., Keller L.F., Elston D.A., Monaghan P. & Wanless S. 2003 Reducing the
density of breeding gulls influences the pattern of recruitment of immature Atlantic puffins Fratercula arctica to a breeding colony. Journal of Applied Ecology 40: 545-552.
Gillham M.E. 1953. An ecological account of the vegetation of Grassholm Island, Pembrokeshire. Journal of Ecology 41: 84-99.
Harris M.P. 1977. Puffins on the Isle of May. Scott. Birds 9: 285-289. Harris M.P. & Wanless S. 1998. Status of the puffin Fratercula arctica on the Isle of May National
Nature Reserve. ITE report to Scottish Natural Heritage, Cupar (Fife).
Harris M.P. & Wanless S. 2004. The Atlantic Puffin Fratercula arctica. In: Mitchell P.I., Newton S.F., Ratcliffe N. & Dunn T.E. (eds.) Seabird populations of Britain and Ireland. pp. 392-406. T . & A.D. Poyser, London.
Harris M.P., Wanless S. & Smith R.W.J 1987. The breeding seabirds of the Firth of Forth, Scotland.
Proceedings of the Royal Society of Edinburgh 93B: 521-533. Jones D. (ed.) 2000-2003. Forth island bird reports. Unpublished reports of the Forth Seabird Group. Lloyd C., Tasker M.L. & Partridge K. 1991. The status of seabirds in Britain and Ireland. T & A.D.
Poyser, London.
Smith R.W.J. 1966. The seabirds of the Forth Islands. Seabird Bulletin 2: 59-60. Smith R.W.J. 1974. Seabirds of Inchkeith. Edinburgh Ringing Group Report 2: 7-12. Wanless S., Harris M.P., Murray S. & Wilson L.J. 2003. Status of the Atlantic Puffin on the Isle of
May National Nature Reserve, Craigleith and Fidra, Forth Islands Special Protection Area.
Centre for Ecology and Hydrology report to Scottish Natural Heritage, Cupar (Fife), UK.

2003 Spring departure of terns from �amibia 111
DEPARTURE OF TERNS IN SPRING 1999
FROM NAMIBIA
Guido O. Keijl
Keijl G.O. 2003. Departure of terns in spring 1999 from Namibia. Atlantic Seabirds 5(3): 111-118. During a study of terns wintering along the �amibian coast in
Feb-Apr 1999, departing terns were recorded. Most terns departed in the evening when other terns went to roosts. Departing flocks consisted only of Sandwich Sterna sandvicensis, Common S. hirundo and White-winged Black Chlidonias leucopterus Terns, of which the first two species originate from north-western European breeding grounds. A major drop in roosting numbers occurred from late February onwards and also a decline in body mass of Common and Sandwich Terns was noted during this period, while departure was observed from early March onwards. Even though the observational data are anecdotal, they suggest
that the three tern species migrate not only at night, but also that they may well cross at least part of their route in a straight line. The dominant tern migration strategy remains obscure, but time constraints seem an unlikely cause of jump migration. The jump migration strategy might indicate that the number of suitable stop-over sites is limited.
Brederodestraat 16a, NL-1901 HW Bakkum, The Netherlands, E-mail: [email protected]; WIWO, P.O. Box 925, 3700 AX Zeist, The Netherlands
INTRODUCTION
Palearct ic terns migrating between the northern hemisphere and the southern part of Africa seemingly face a t ight time schedule. Flight feathers are moulted, which takes several months (Stresemann 1963), and they have to complete this moult in the wintering areas or at stop-over sites. Migration of terns as known to most observers takes place along the coast at altitudes up to some tens of metres above sea level (Marr & Porter 1992; Krüger & Garthe 2001). This type of low-level migrat ion may involve thousands of birds per day, both in spring and autumn (Camphuysen & van Dijk 1983; Johansson & Jakobsson 1997). Terns are also known to migrate at night (Grimes 1977; Lambert 1988) and over land (Jellmann & Vauk 1978; Camphuysen 1992), however, but the extent of it remains largely unknown. Alerstam (1985) observed migrating Common Sterna hirundo and Arctic Terns S. paradisaea leaving Sweden in autumn at g reat altitude and supposed that terns try to cover large distances in one flight, just as waders (Piersma et al. 1990). Little is known about high-altitude migration in terns. Departing Black Terns Chlidonias niger and Common Terns from Lake IJsselmeer in autumn ascend to great heights before moving S or SW (Schouten 1982; Lensink et al. 2002). High-alt itude migration has not been described for terns in spring, and not at all for Sandwich Terns S. sandvicensis and White-

112 G.O. KEIJL Atlantic Seabirds 5(3)
winged Black Terns C. leucopterus. Lambert (1988) mentioned individual terns or tern flocks coming down at n ight from 'great altitude' to his well-lit observation post at sea in the Gulf of Guinea in spring, indicating that terns pass this area at high altitude at night.
In this contribution, observations from Namibia in spring 1999 are presented, where departing tern flocks were seen to ascend to great altitudes. From a review of available data, it is suggested that this type of high-altitude long-distance migrat ion in terns wintering in Africa could be a common phenomenon.
METHODS A project on Palaearctic terns was carried out by the Avian Demography Unit (ADU) and Foundation Working Group International Wader and Waterbird Research (WIWO) in Namib ia, 1 Februay-2 April 1999 (Arts et al. in prep.). Observations were done along the coast between Walvis Bay and a saltpan complex just north of Swakopmund, Namib ia. In Swakopmund, terns were ringed. Departing tern flocks were main ly discovered while counting roosting terns. Flight alt itudes and flight direction were estimated by eye.
OBSERVATIONS
In March we noticed several tern flocks leaving the study area. Only three tern species of Eurasian breeding origin were involved: Common Tern, Sandwich Tern and White-winged Black Tern. Other terns present in the area were Eurasian Black Tern and the southern African Damara S. balaenarum, Swift S. bergii and Caspian Terns S. caspia. The detailed observations are presented below:
• 4 March – Yacht Club (Walvis Bay), 19:30 hrs, compact flock of four White-winged Black Terns leaving towards the N, discovered when at considerable altitude, continuing to climb until out of sight (estimated at four kilometres distance).
• 6 March – Mile4 Saltworks (Swakopmund), 20:00 hrs, compact flock of approx 50 Sandwich Terns left silently from the roost, flying N and ascending steeply.
• 8 March – Yacht Club, 18:10 hrs, compact flock of 18 White-winged Black Terns discovered overhead at 1000 m by their agitated calls, flying NE. The terns continued to ascend and did not change direction until out of sight.
• 9 March – sewage ponds at Walvis Bay, 19:15 hrs, compact flock of 28 White-winged Black Terns heading NW, flying at great altitude and still ascending.

2003 Spring departure of terns from �amibia 113
• 11 March – Langstrand (between Walvis Bay and Swakopmund), 07:30 hrs, 8 Sandwich Terns, calling agitatedly and circling higher and higher until they disappeared in the clouds.
• 11 March – Yacht Club, 18:10 hrs, tight flock of 31 White-winged Black Terns discovered when already at considerable altitude, circling higher and higher and split in two flocks. One flock of 21 individuals left towards the NE, the other flock could not be followed). No calls heard.
• 11 March – Yacht Club, 18:20 hrs, five Sandwich Terns circled higher and higher, calling intensely, disappearing in the mist.
• 15 March – Mile4 Saltworks, 18:20 hrs, compact flock of about 130 Common Terns flew around calling for a while, gradually attaining height until they levelled off at considerable altitude and headed out (direction not noted).
• 16 March – Mile4 Saltworks, c. 20:00 hrs, compact flock of 25 Common Terns left the roost just before dark towards the NW.
• 18 March – Walvis Bay Saltworks, 18:00-18:05 hrs, flocks of 4, 3, 2, and 3 Sandwich Terns departed towards the NNW. All birds climbed in tight circles calling continuously and rose to about 200-300m altitude before levelling off. The earliest birds seemingly waited for the later departing birds to join them.
• 18 Mar – Walvis Bay Saltworks, 18:00-18:05 hrs, compact flock of 5 Common Terns ascended steadily and left in NNW direction.
Apparent arrival of terns was observed twice:
• 6 Mar – Mile4 Saltworks, 17:50 hrs, 6 Sandwich Terns, discovered by chance through binoculars, became discernible at an estimated 3 km altitude in a clear blue sky.
• 11 Mar – Walvis Bay, 18:38 hrs, 6 Sandwich Terns appeared from the clouds at probably 1.5 km altitude and quickly descended. They continued low over the water in N direction.
DISCUSSION
As departing terns in Namib ia were d iscovered by chance it is likely that many left unnoticed. Prior to 4 March, departing flocks have probably been overlooked because no attention was paid, even though numbers at the roost in Walvis Bay dropped steeply from 25 February onwards. A drop in body mass of Black, Common and Sandwich Terns was noted, probably indicating that the heaviest individuals had departed (cf. Zwarts et al. 1990). It is unknown what triggered the terns' departure in spring 1999. They may have left because of changing feeding conditions, for the departure coincided with an influx of warmer water from the north – a phenomenon occurring regularly in the Benguelan system (Shannon et al. 1986). Sandwich and Common Terns from Namibia departed towards the NW or N, White-winged Black Terns towards the NW (one flock), N (one flock) and

114 G.O. KEIJL Atlantic Seabirds 5(3)
NE (two flocks). If b irds fly straight N from Walvis Bay they soon find themselves flying over land, to meet the sea again in Central Angola. If terns migrate at night and/or at great altitude there is no need for them to fly over sea. Considering the distance, it is unlikely that terns will cover the entire stretch from Namib ia to Europe in one flight (Table 1). The West-African coast, where large numbers of terns occur in winter and spring (Brenninkmeijer et al. 2002) is a suitable stop-over site, whereas the Gulf of Guinea seems to be used mainly in autumn (Grimes 1977; Houghton & Mensah 1978; Lambert 1988). On their way from Namibia to the West-African coast the terns would probably cross the Gulf of Guinea quickly. Table 1. Calculated time needed (h) by terns on their way from �amibia to the African
West coast, and from �amibia to West-Europe, assuming a straight line or when
following the coastline. Flight speeds from 1Alerstam (1985) and 2Gudmundsson et al. (1992), 3Brenninkmeijer & Stienen (1994), 4Stienen & Brenninkmeijer
(1994), and 5Van der Winden & Schobben (2001). 'Commic tern' = Common or
Arctic S. paradisaea Tern. Tabel 1. Berekening van de benodigde vliegtijd (uren) voor sterns van �amibië naar de
Afrikaanse westkust en van �amibië naar West-Europa, indien afgelegd in een rechte lijn of langs de kust. Min en max vliegsnelheid van 1Alerstam (1985), 2Gudmundsson et al. (1992), 3Brenninkmeijer & Stienen (1994), 4Stienen &
Brenninkmeijer (1994) en 5Van der Winden & Schobben (2001). 'Commic Tern' =
Visdief of �oordse Stern.
Namibia - Senegal Namibia – West Europe
straight line along coast straight line along coast
5,500 8,000 8,500 14,000 km
'Commic' Tern1 40 km h-1 138 200 213 350
'Commic' Tern2 56 km h-1 98 143 152 250
Sandwich Tern3 24 km h-1 229 333 354 583
Sandwich Tern4 66 km h-1 83 121 129 212
Black Tern5 50 km h-1 110 160 170 280
It is very well possible that Sandwich and Common Terns leav ing Namibia make use of the predictable SE trade-winds to quickly migrate to West-Africa and skip the Gulf of Guinea. Extra weight is probably not just 'fuel' but also 'insurance' if unfavourable conditions are met with, for instance in rough weather on arrival (cf. Dunn 1973, Haney & Stone 1988, Sagar & Sagar 1989). Ringing results have shown that at least some Sandwich Terns breeding in West-Europe winter in Namib ia (Vandewalle 1988; Noble-Rollin & Redfern 2002). Sandwich Terns in The Netherlands arrive at the breeding

2003 Spring departure of terns from �amibia 115
Sandwich Terns and Common Terns with two Hartlaub’s Gulls, �amibia 1999. Grote
Sterns en Visdiefjes met twee Hartlaubsmeeuwen, Namibië 1999. (Tom van der Have)
colony from late March onwards, with peaks in arrival mid-April (experienced breeders) and mid-May (inexperienced breeders; Veen 1977; Brenninkmeijer & Stienen 1992). This would give birds leaving Namib ia in early March 30-45 days to cover the distance to western Europe and arrive in April, flying on average 190-330 km day-1. One Sandwich Tern, ringed as a chick on Griend, was captured in Namibia on 1 March 1999. Only six weeks later, on 18 April 1999, it was present in its natal colony. These data suggest that Sandwich Terns leaving Namibia in early March are indeed able to arrive in the Dutch colonies within six weeks travelling at 190-330 km day-1. Several Common Terns captured in Namib ia during this study were ringed in Sweden, Finland and Estonia. To reach these areas around early May from southern Africa, terns departing in early March have to fly on average 160-280 km day-1. This is considerably more than the 80-110 km day-1 calculated by Kasparek (1982).
Migration strategies of marsh terns Chlidonias spp. are even less well known than those of Sterna spp.. White-winged Black Terns are known to

116 G.O. KEIJL Atlantic Seabirds 5(3)
appear inland in Africa on migrat ion (Bates 1934; Begg 1973; Curry & Sayer 1979; Niko laus 1987; Goudswaard & Wanink 1993), even over the Sahara (Moreau 1967; Dupuy 1969; Bundy 1971), while they appear to be virtually absent along the western coasts of Africa. White-winged Black Terns are common during spring migration in Sudan (Nikolaus 1987) and these birds may have followed the lake-scattered Rift Valley on their way north from southern Africa. It is not known where White-winged Black Terns are going to after they have left Namibia. The distance between Namibia and the mid-point of the breeding area is over 10,000 km. Most White-winged Black Terns in 1999 left prior to 1 March. To arrive in early May they have to migrate with an average speed of almost 170 km day-1. The general idea that terns breeding in Europe or Asia migrate in a steady pace along the coast, meanwhile feeding, is probably not true, certainly not for (all) those wintering in southern Africa and possibly not for the entire stretch. Our observations suggest a strategy of jump migration (Piersma, 1987) as is found in several wader species. This could be an indication that the number of suitable stop-over sites is restricted.
ACKNOWLEDGEMENTS The ADU/WIWO team in 1999 consisted of Floor Arts, Mark Boorman, Pete Collins, Symen Deuzeman, Rosalind Jessop, Toril Lohne, Nils Helge Lorentzen, Tony and Maggie Tree, Tom van der Have and Jan van der Winden. They are thanked for collecting data and pleasant companionship. Comments of Allix Brenninkmeijer, Tom van der Have, Eric Stienen and Jan Veen greatly improved the manuscript. Kees Camphuysen provided some of the references.
VERTREKKENDE STERNS IN NAMIBIË IN HET VOORJAAR VAN 1999
Ten minste een deel van de in �oordwest-Europa broedende Visdieven Sterna hirundo en Grote Sterns S. sandvicensis overwintert in zuidelijk Afrika. Gedurende een onderzoek in �amibië zijn sterns gevangen en zijn tellingen en andere observaties aan sterns gedaan. Vooral in maart werden
tijdens slaapplaatstellingen (figuur 1) wegtrekkende groepjes Grote Sterns, Witvleugelsterns Chlidonias leucopterus en Visdieven gezien. Van lokale sternsoorten (Reuzen- S. caspia, Damara- S. balaenarum en Kuifstern S. bergii) en de op het noordelijk halfrond broedende Zwarte Stern C. niger is deze wegtrek niet waargenomen. Mogelijke aankomst werd tweemaal waargenomen. Vanaf eind februari nam het aantal overnachtende sterns in het gebied sterk af en bleken ook de gemiddelde gewichten af te nemen. Dit laatste zou echter ook verband kunnen houden met een veranderde voedselsituatie. Vermoedelijk is genoemde periode de gebruikelijke wegtrekperiode van sterns uit dit
gebied; de afname van gemiddelde gewichten zou dan verklaard kunnen worden doordat de zwaarste vogels wegtrekken. �a deze periode namen de gemiddelde gewichten weer toe.
Hoewel het om slechts een handvol waarnemingen gaat wordt duidelijk dat in ieder geval deze drie soorten sterns 's nachts trekken, een weinig bekend fenomeen, maar ook dat het daarmee
aannemelijk wordt dat de vogels niet per se de kust volgen om op hun volgende rustplaats te komen. Het is bekend dat er zich aan de West-Afrikaanse kust 's winters en in het vroege voorjaar grote aantallen sterns ophouden. Ondanks de rui in de wintermaanden, die enkele maanden in beslag neemt, lijken ze nauwelijks in tijdnood te komen en hoeven ze zich blijkbaar niet te haasten om in het
voorjaar weer tijdig op de kolonies aanwezig te zijn. De 'keuze' voor een sprongstrategie in plaats

2003 Spring departure of terns from �amibia 117 van dagelijks een stukje vliegen en onderweg foerageren zou een aanwijzing kunnen zijn dat het aantal voedselrijke rustgebieden onderweg beperkt is.
REFERENCES
Alerstam T. 1985. Strategies of migratory flight, illustrated by Arctic and Common Terns, Sterna
paradisaea and Sterna hirundo. In: M.A. Rankin (ed). Migration: mechanisms and adaptive significance. Contributions in Marine Science 27, Suppl.: 580-603.
Arts F.A., Collins P., Deuzeman S., Jessop R., Keijl G.O., Lohne T., Lorentzen N., Tree T ., Tree M., van der Have T.M. & van der Winden J. in prep. Terns and waders along the Namib coast, February-March 1999. WIWO-report, Zeist, The Netherlands, ADU-report, Cape Town, South Africa.
Bates G.L. 1934. Birds of the southern Sahara and adjoining countries in French West-Africa. Part III. Ibis 13 (IV): 213-239.
Begg G.W. 1973 The feeding habits of the White-winged Black Tern on Lake Kariba. Ostrich 44: 149-153.
Brenninkmeijer A. & Stienen E.W.M. 1992. Ecologisch profiel van de grote stern (Sterna sandvicensis). RIN-rapport 302. Instituut voor Bos- en Natuuronderzoek (IBN-DLO), Wageningen.
Brenninkmeijer A. & Stienen E.W.M. 1994. Pilot study on the influence of feeding conditions at the North Sea on the breeding results of the Sandwich Tern Sterna sandvicensis. Rapport 94/10, DLO-Instituut voor Bos- en Natuuronderzoek, Wageningen.
Brenninkmeijer A., Stienen E.W.M., Klaassen M. & Kersten M. 2002. Feeding ecology of wintering terns in Guinea-Bissau. Ibis 144:602-613..
Bundy G. 1971. Black Terns feeding over dry land. Brit . Birds 64: 32. Camphuysen C.J. 1992. Nachttrek van Grote Sterns Sterna sandvicensis door het binnenland.Sula 6:
56-57. Camphuysen C.J. & Dijk J. van 1983. Zee- en kustvogels langs de Nederlandse kust, 1974-79.
Limosa 56: 87-230. Curry P.J. & Sayer A. 1979. The inundation zone of the Niger as an environment for Palearctic
migrants. Ibis 121: 20-40. Dupuy A.R. 1969. Catalogue ornithologique du Sahara Algérien. Oiseau et RFO 39: 141-160 Gammelsröd T., Bartholomae C.H., Boyer D.C., Filipe V.L.L. & O'Toole M.J. 1998. Intrusion of
warm surface water along the Angolan-Namibian coast in February-March 1995: the 1995 Benguela nino. In: S.C. Pillar, Moloney C.L., Payne A.I.I. & Shillington F.A. (eds). Benguela Dynamics. S. Afr. J. Mar. Sci. 19: 41-56.
Goudswaard P.C. &Wanink J.H. 1993. Anthropogenic perturbation in Lake Victoria: effects of fish introductions and fisheries on fish eating birds. Proc. VII Pan-African Orn. Congress: 312-318.
Grimes L.C. 1977. A radar study of tern movements along the coast of Ghana. Ibis 119: 28-36. Gudmundsson G., Alerstam T. & Lafsson B. 1992. Radar observations of northbound migration of
the Arctic Tern Sterna paradisaea at the Antarctic Peninsula. Antarctic Science 4: 163-170. Houghton R.W. & Mensah M.A. 1978. Physical aspects and biological consequences of Ghanaian
coastal upwelling. Pp. 167-180. In: R. Boje & M. Tomczak (eds) Upwelling ecosystems: 167-180. Springer-Verlag.
Jellmann J. & Vauk G. 1978. Untersuchungen zum Verlauf des Frühjahrszuges über der Deutschen Bucht nach Radarstudien und Fang- und Beobachtungsergebnissen auf Helgoland. J. Orn. 119: 265-286.
Johansson B. & Jakobsson G. 1997. Höststräcket av fisktärna Sterna hirundo och silvertärna S. paradisaea över södra Sverige. Ornis Svecica 7: 61-80.

118 G.O. KEIJL Atlantic Seabirds 5(3) Kasparek M. 1982. Zur Zuggeschwindigkeit des Flussseeschwalbe Sterna hirundo. J. Orn. 123: 297-
305. Krüger T. & Garthe S. 2001. Flight altitudes of coastal birds in relation to wind direction and speed.
Atlantic Seabirds 3 (spec. iss.): 203-216. Lambert K. 1988. Nächtliche Zugaktivität von Seevögeln im Golf von Guinea. Beitr. Vogelkunde
34: 29-35. Lensink R., Gasteren H. van, Hustings F., Buurma L.M, Duin G. van, Linnartz L., Vogelzang F. &
Witkamp C. 2002. Vogeltrek over Nederland, 1976-1993. Schuyt & Co Uitg., Haarlem. Marr T. & Porter R. 1992. Spring seabird passage off Senegal. Birding World 5: 391-394. Moreau R.E. 1967. Water-birds over the Sahara. Ibis 109: 232-259. Nikolaus G. 1987. Distribution atlas of Sudan's birds with notes on habitat and status. Bonner zool.
Monogr. 25. Zool. Forschungsinst. & Mus. Alexander Koenig. Bonn. Noble-Rollin D. & Redfern C. 2002. Sandwich Tern Sterna sandvicensis. In: Wernham C. et al.
(eds). The migration atlas: movements of the birds of Britain and Ireland: 381-384. T. & A.D. Poyser, London.
Piersma, T. 1987. Hink, stap of sprong? Reisbeperkingen van arctische steltlopers door voedselzoeken, vetopbouw en vliegsnelheid. Limosa 60: 185-191.
Piersma T ., Zwarts L. & Bruggeman J.H. 1990. Behavioural aspects of the departure of waders before long-distance flights: flocking, vocalizations, flight paths and diurnal t iming. Ardea 78: 157-184.
Sagar P.M. & Sagar J.L. 1989. The effects of wind and sea on the feeding of Antarctic Terns at the Snares Islands, New Zealand. Notornis 36: 171-182.
Schouten C. 1982. Voorkomen en doortrek van de Zwarte Stern Chlidonias niger in het IJsselmeergebied. Limosa 55: 56-58.
Shannon L.V., Boyd A.J., Brundrit G.B. & Taunton-Clark J. 1986. On the existence of an El �ino-type phenomenon in the Benguela system. J. mar. Res. 44: 495-520.
Stienen E.W.M. & Brenninkmeijer A. 1994. Voedselecologie van de grote stern Sterna sandvicensis: onderzoek ter ondersteuning van een populatie-dynamisch model. Rapport DLO-Instituut voor Bos- en Natuuronderzoek, Wageningen.
Stresemann E. 1963. Zeitraum und Verlauf der Handschwingen-Mauser palaearctischen Möwen, Seeschwalben und Limicolen. J. Orn. 104: 424-435.
van der Winden J. & Schobben H.P.M. 2001. Zwarte Stern Chlidonias niger profiteert van nieuwe slaapplaats in het IJsselmeergebied. Limosa 74: 87-94.
Vandewalle F.J. 1988. Origins and migration routes of some Palaearctic terns wintering in Africa south of the Zambesi and Cunene rivers. Gerfaut 78: 131-150.
Zwarts L., Ens B.J., Kersten M. & Piersma T. 1990. Moult, mass and flight range of waders ready to take off for long-distance migrations. Ardea 78: 339-364.

2003 Collecting feather lice 119
A COMPARISON OF TWO METHODS FOR
COLLECTING FEATHER LICE FROM DEAD BIRDS
JENS-KJELD JENSEN¹ & BERGUR OLSEN²
Jensen J-K. & Olsen B. 2003. A comparison of two methods for collecting
feather lice from dead birds. Atlantic Seabirds 5(3): 119-126. Two procedures for the collection of feather lice from birds are described – a ‘dry’ method and a ‘wet’ method. The dry method consists of placing the bird in a plastic bag with chloroform for 30 minutes after which the plumage is brushed and all dislodged lice collected. The wet method
consists of thoroughly washing the dead bird in soapy water and straining the water to collect the lice. Eleven Little Auk Alle alle corpses were deloused using both methods. Three species of feather louse were recorded using both methods but the wet method consistently resulted in the recording of more lice than the dry method alone. The wet
method is especially suitable for collecting lice from dead birds but is impractical for use on live birds.
¹FO-270 Nólsoy, Faroe Islands; ²Faroese Fisheries Laboratory, FO-100 Tórshavn,
Faroe Islands. E-mail [email protected]
INTRODUCTION
Feather lice can provide valuable in formation about their bird hosts. A classic
example is the work of Hopkins (1942) where he indicated a close relationship
between the flamingos (Phoenicopteriformes) and the geese (Anseriformes) in
spite of the fact that flamingos superficially more resemble storks than herons
(Ciconiiformes). Zonfrillo and Palma (2000) referred to feather lice from the
Levantine Shearwater Puffinus yelkouan in their discussion of the taxonomic
status of shearwaters, and Jensen et al. (1999) deduced from the feather lice
found on Sooty Shearwaters collected around the Faroe Islands that these birds
came from Tristan da Cunha. Several Iceland Gulls Larus glaucoides collected
in the Faroe Islands were infested with feather lice from Little Auks Alle alle,
probably as a result of predation by the gulls on the auks in Greenland colonies
(Palma & Jensen in prep.). Paterson et al. (2000) address the issue of co-
evolution of seabirds and feather lice.
Small live birds are usually deloused by suspending them by their head
in a glass container filled with chloroform vapours (Williamson 1954; Ontario
Bird Banding Association, 1960). Fowler and Cohen (1983) improved this
method and considered the statistical validity of the method for a range of host
species. Their results suggest that as many as 88% of the lice present on a bird
(excluding the head) may be ext racted by this method, and that the collected

120 J-K. JENSEN & B. OLSEN Atlantic Seabirds 5(3)
samples appear to be reasonably representative of the species and age classes of
the feather lice present. However, they stated that the only method by which the
absolute number of ectoparasites present on a bird may be determined is by
careful feather-by-feather examinat ion of its plucked p lumage.
Clayton & Walther (1997) published a thorough account on the
collection of arthropod parasites from both live and dead birds, but most authors
do not give details on how they deloused the birds (e.g. Jensen et al. 1999;
Pilgrim & Palma 1982), so it is difficu lt to compare results. Systematically
delousing a dead bird feather-by-feather is very time consuming, therefore it is
feasible only when the sample comprises few birds. A more or less systematic
inspection of the feathers to establish presence or absence of feather lice,
however, is often the rule. Foster et al. (1996) washed birds in soapy water and
strained off the lice from the water. They found this method to be very effective
and stated that the higher abundance of lice they found on Great Shearwater
Puffinus gravis compared with a study by Bourgeois & Threlfall (1979) was
probably due to different collecting techniques. On birds found dead, the
feathers are often wet and dirty but the lice cling to the feathers even after death.
Therefore, washing the birds and straining off the lice from the water as carried
out by Foster et al. (1996) appears to be a good method.
The aim of this study was to compare the efficiency of two sampling
methods for collecting feather lice from dead birds. In the first method, we used
chloroform to extract the lice, should any have remained alive, and brushed
them onto a sheet of white paper. In the second method, the same birds were
washed thoroughly in soapy water and the lice strained off in a special strainer
following Foster et al. (1996).
METHODS
We examined 11 Little Auks found dead on the beach in Nólsoy, Faroe Islands,
in December and January 1996-1998. The corpses were stored separately in
plastic bags before examination in order to avoid transfer of lice between them.
A few of them were stored in a freezer. Prio r to delousing, all the birds were
air-dried by hanging them indoors for 1 or 2 days until they were completely
dry.
Method 1: the 'Dry' Method To delouse the corpses using method 1, each bird
was placed in a plastic bag with a cotton wad saturated with concentrated
chloroform for 30 mins to ensure that all lice were dead. Each corpse was then
held over white paper and the feathers brushed with the fingers and manipulated
for a couple of minutes until no more debris or lice fell onto the paper. All
dislodged material such as sand, beach debris, feathers, etc. was systematically

2003 Collecting feather lice 121
Figure. 1. The feather lice strainer is made of a 20 cm
PVC waste pipe and a 6 cm
high socket made from a pipe
coupling, and equipped with a
400 micron plankton net. The internal diameterof the pipe is
10 cm. The pipe coupling has
been cut so the wider part is 2
cm high, sawn through below
and glued together with the plankton net in between. As
the water must flow easily
from the strainer the socket
has been sawn so that it stands
on four legs. Figuur 1. De veerluisfilter is
gemaakt van 20 cm PVC-pijp
en een 6 cm hoge pijphouder
voorzien van een planktonnet
van 400 micron. De interne diameter van de pijp is 10 cm.
Het bovenstuk van de
pijphouder is 2 cm hoog, van
onder doorgezaagd en
vastgelijmd met het plankton-net ertussen.Om het water
ongestoord te laten vloeien is
de standaard uitgezaagd zodat
het op vier poten staat.
searched for lice under a dissecting microscope. Lice were collected with a wet
needle and immersed in 70% alcohol.
Method 2: the 'Wet' Method In method 2, the same b irds that had been
deloused using method 1 were washed in order to find more lice. Each corpse
was thoroughly washed twice in a plastic bucket with lukewarm water and
liquid soap. After each wash, the water was poured through a strainer (Fig. 1).
Finally, each corpse was thoroughly rinsed in the bucket with a pressurized
water spray and the water again strained off. The lower part of the lice-strainer,
which holds the mesh net, was then placed under the dissecting microscope and
any additional lice collected were again stored in 70% alcohol. The bucket and
the lice strainer were cleaned very thoroughly after processing each bird.

122 J-K. JENSEN & B. OLSEN Atlantic Seabirds 5(3)
Table 1. The number of feather lice collected from 11 Little Auks using chloroform
(method 1 – the Dry Method) and washing the same birds (method 2 – the Wet Method). Values indicated for method 2 include those for method 1.
Tabel 1. Het aantal veerluizen dat verzameld werd van elf dode Kleine Alken met behulp
van choloroform (‘droge’ methode 1) en door dezelfde vogels te wassen (‘natte’
methode 2). Waarden voor methode 2 zijn inclusief die voor methode 1.
Species Method Males Females Nymphs
Austromenopon 1. Dry 39 37 88
merguli (T.) 2. Wet 84 99 110
% increase wet over dry 115 168 25
Quadraceps 1. Dry 142 173 357
klatti (T.) 2. Wet 164 209 382
% increase wet over dry 15 21 7
Saemundssonia 1. Dry 17 27 38
merguli (D.) 2. Wet 32 48 60
% increase wet over dry 88 78 58
All lice were identified by comparing them with specimens previously
determined by R.L. Palma and slide-mounted following the technique in Palma
(1978). A representative part of this insect material is deposited in the Natural
History Museum, Tórshavn, Faroe Islands.
In presenting the results for method 2 the lice collected using method 1
were added to those collected using method 2, as we would expect that all lice
found with method 1 would also have been found by merely washing the birds
after the lice were dead. Freezing the birds before delousing might well have
the same effect as the treatment with chloroform, and therefore the treatment of
the frozen birds with chlo roform could have been omitted.
RESULTS
Three species of feather lice were collected from the 11 Little Auks (Table 1),
and all species were found during the first treatment (method 1 – the Dry
Method). Washing the birds (method 2 – the Wet Method) did not reveal any
new species, although the total number of lice d iscovered increased by 29% on

2003 Collecting feather lice 123
Table 2. Feather lice infestation of 11 Little Auks indicated by using chloroform
(method 1 – the Dry Method) and by washing the same birds (method 2 – the
Wet Method). Values represent numbers of birds, and those indicated for method 2 include those from method 1.
Tabel 2. Aantal met veerluizen besmette Kleine Alken volgens de droge methode 1 en
de natte methode 2. De waarden voor methode 2 zijn inclusief die voor
methode 1.
Species Method Males Females Nymphs
Austromenopon 1. Dry 5 6 7
merguli (T.) 2. Wet 7 8 7
% increase wet over dry 40 33 0
Quadraceps 1. Dry 11 10 9
klatti (T.) 2. Wet 11 10 10
% increase wet over dry 0 0 11
Saemundssonia 1. Dry 7 9 10
merguli (D.) 2. Wet 9 11 10
% increase wet over dry 29 22 0
average (Table 1). The wet method was especially effective in collecting adults
of Austromenopon merguli (a 141% increase) and Saemundssonia merguli (an
82% increase), while the number of adult Quadraceps klatti increased by only
18%. The increase in number of nymphs was lower - 25%, 58% and 7%
respectively.
The observed infestation rate (i.e number of birds hosting the various
species and ages of lice) also increased when the birds were washed (Table 2).
Quadraceps klatti occurred on all the birds with either method, while the
infestation rate for adult Austromenopon merguli and Saemundssonia merguli
increased 36% and 25% respectively when the birds were washed. Infestation
with nymphs increased by 11 % for Quadraceps klatti but no increase in the
number of nymphs was found for the other two species.
DISCUSSION
Skinned birds in collections that have been washed with soapy water have few if
any feather lice, demonstrating the efficiency of washing away lice with soapy

124 J-K. JENSEN & B. OLSEN Atlantic Seabirds 5(3)
water. Delousing birds using the wet method probably extracts almost all the
lice, so in this discussion the cumulative number of lice extracted with methods
1 and 2 are treated as the total number present on the bird. Searching the same
birds after delousing failed to reveal any further lice.
The dry method probably dislodges only those lice that are unattached
to the feathers and leaves the remainder. Quadraceps klatti, the most numerous
louse we found on the Little Auks, is most easily extracted both as adult and
nymph, as respectively 85% and 93% were extracted using the dry method. For
Saemundsonia merguli, 55% of the adults and 63% of the nymphs were
extracted with the dry method, while for Austromenopon merguli the respective
proportions were 42% and 80%. As the nymphs were ext racted more easily
than the adults for all three species, the dry and wet methods also indicate
different age distribution of the lice. The infestation rate was also higher after
applying the wet method, although, for birds heavily in fested there was no
difference.
These findings suggest that it is impossible to extract a representative
sample of louse species and age classes using a method that fails to ext ract all
lice. This is especially the case with live birds, but on dead birds rough methods
can be used and washing the birds as described above (the wet method) after the
lice have been killed or are dead, seems to be a reliable method. It is relatively
easy, quick and effective, and if the corpses are not required, can be done in the
field. However, some lice live within the quills of feathers and will probably be
unaffected by either dry or wet methods of collecting. These lice will require
special examination by opening feather quills of dead or moulted birds.
The use of chloroform in our dry method might not have had the same
effect as in the study of Fowler & Cohen (1983), where the lice on the live birds
might have actively left the feathers as they were affected by the chloroform
vapour. After the treatment with chloroform, we therefore brushed the birds
towards the head against the feathers until apparently all the loose lice were
found. The brushing of the feathers in the dry method is unlikely to increase the
likelihood of collect ing lice subsequently using the wet method. Therefore, we
assume that the same total number of lice would have been discovered using the
wet method alone, provided that the lice were dead before washing.
Before washing dead birds for delousing, we recommend that the lice
are killed by either freezing the birds or by placing them in a plastic bag with
chloroform vapour for 30 minutes. We do not know whether lice that die from
freezing or from chloroform vapour attach more tightly to the feathers. In any
case, birds found dead are often frozen before delousing, so freezing the birds
apparently is a good standard method to kill lice on dead birds.
Delousing live birds must be carried out as careful as possible, so
washing the birds is excluded. The period should also be as short as is necessary

2003 Collecting feather lice 125
to ext ract a representative sample of the louse species and age classes (Fowler &
Cohen 1983). According to Fowler & Cohen (1983), as many as 88% of the lice
present on a Blackbird Turdus merula (excluding the head) may be ext racted in
30 minutes from the live bird using their method, but there may be large
differences between louse species collected. They also state that any method
based upon the examination of feathers in situ is likely to be strongly biased
against the recording of mobile species and the smaller nymphal instars.
Before examination, it is very important that the corpses are stored
separately so that transfer of lice between them does not take place. The lice-
strainer must also be cleaned and examined very carefully after each session.
In this study we have compared delousing methods for feather lice, but
washing the birds in soapy water and straining off the water is also an effective
way of extracting feather mites from dead birds, but in this case the net in the
strainer has to be 100 micron mesh (Foster et al. 1996) rather than the 400
micron net used here for lice.
Comparing collections of feather lice compiled using different methods
may give inaccurate results as the efficiency of ext racting the lice depends on
the species and their age. Washing a dead bird thoroughly in soapy water as in
the wet method extracts almost all the lice from the plumage and so is an
effective tool for studying the louse fauna of dead birds. It is an especially
suitable method for use on dirty and wet specimens found on the seashore and
elsewere.
ACKNOW LEDGEMENTS
We thank Dr. Eilif Gaard for his advice on the strainer and Annika Gulklett for her contribution to an early draft. Thanks also to Ricardo L. Palma, Jim Read, Bernard Zonfrillo, and two anonymous
referees for their review of the manuscript.
EEN VERGELIJKING VAN TWEE METHODEN OM VEERLUIZEN
VAN DODE VOGELS TE VERZAMELEN
In dit artikel worden twee methoden voor het verzamelen van veerluizen beschreven: een ‘droge’ methode en een ‘natte’ methode. De droge methode houdt in dat een dode vogel 30 minuten in een
plastic zak met chloroform wordt gehouden, waarna het verenkleed wordt gekamd en alle luizen die hebben losgelaten, worden verzameld. De natte methode bestaat uit het grondig wassen van een dode vogel met water met zeep, waarna het water wordt gefilterd om de luizen te verzamelen. Elf
dode Kleine Alken Alle alle werden met beide methoden van luizen ontdaan. Met beide methoden werden drie soorten luizen vastgesteld, maar de ‘natte’ methode resulteerde steevast in hogere aantallen luizen dan de ‘droge’ methode. De ‘natte’ methode is zeer geschikt om luizen van dode vogels te verzamelen, maar is niet praktisch bij levende vogels.

126 J-K. JENSEN & B. OLSEN Atlantic Seabirds 5(3)
REFERENCES
Bourgeois C.E. & Threlfall W. 1979. Parasites of the greater shearwater (Puffinus gravis) from
Newfoundland, Canada. Canadian Journal of Zoology 57: 1355-1357.
Clayton D.H. & Walther B.A. 1997. Collection and quantification of arthropod parasites of birds. In D.H. Clayton & J. Moore (eds.) Host-parasite evolution: General principles and avian models. pp. 419-440. Oxford University Press, Oxford.
Foster G.W., Kinsella J.M., Price R.D., Mertins J.W. & Forrester D.J. 1996. Parasitic helminths and arthropods of Greater Shearwaters (Puffinus gravis) from Florida. Journal of the Helminthological Society of Washington 63: 83-88.
Fowler J.A. & Cohen S. 1983. A method for the quantitative collection of ectoparasites from birds.
Ringing and Migration 4: 185.189. Hopkins G.H.E. 1942. The Mallophaga as an aid to the classification of birds. Ibis 84: 94-106. Jensen J.K., Palma R.L. & Zonfrillo B. 1999. Feather lice from Sooty Shearwater Puffinus griseus
in the Faroe Islands. Atlantic Seabirds 1: 71-76.
Ontario Bird Banding Association. 1960. A modified Fair Isle apparatus for collecting bird ectoparasites. Bird Banding 31: 157.
Palma R.L. 1978. Slide-mounting of lice: a detailed description of the Canada balsam technique. New Zealand Entomologist 6: 432-436.
Paterson A.M., Wallis G.P., Wallis L.J. & Gray R.D. 2000. Seabird and louse coevolution: complex histories revealed by sequence data and reconciliation analyses. Systematic Biology 49: 383-399.
Pilgrim R.L.C. & Palma R.L. 1982. A list of the chewing lice (Insecta: Mallophaga) from birds in New Zealand. National Museum of New Zealand Miscellaneous Series 6: 32 [also published as Notornis 29 (supplement)].
Williamson K. 1954. The Fair Isle apparatus for collecting bird ectoparasites. British Birds 47:
234-235. Zonfrillo B. & Palma R.L. 2000. The feather lice of the Levantine Shearwater Puffinus yelkouan
and its taxanomic status. Atlantic Seabirds 2: 68-72.

2003 �otes on seabirds 127
�otes on seabirds
The international ornithological journal Ardea, issued by the Netherlands Ornithologists' Union since 1912, until recently had a rather popular short section called �otes on seabirds, edited by Karel H. Voous (Nrs. 1-75, 1963-1988). Th is seemed to be a useful possibility to obtain an international audience for interesting seabird records that otherwise either would go lost, or were to be published in relatively obscure journals or cruise reports. The editorial board would like to re-introduce the concept for Atlantic Seabirds with "Notes on seabirds" numbered in order of appearance. These Notes should have a short title, no abstract, no summary, at most 1 Table or Figure, perhaps a photograph, and crisp text. The relevance of these notes is (for the moment) restricted to Atlantic regions, but notes with global relevance will be considered. These short notes should have five references at most and the contents could be interesting sightings (birds in areas they shouldn't be or in numbers they normally never are), aberrant plumages, wrecks and influxes, strange breeding records (too big clutches, foster parents), interesting/unusual dietary informat ion, very interesting ringing recoveries or exceptional age of seabirds.
�otes on seabirds 76
�ORTHER� GIA�T PETRELS MACRONECTES HALLI I� BRAZIL
In Brazil, the Northern Giant Petrel Macronectes halli was known from only a single second-year specimen found dead at Ilha Comprida, southern São Paulo state (24°50'S, 47°45'W) on 27 September 1994 (coll. Zool. Mus. Univ. São Paulo #73726; Martuscelli et al. 1995). When the bird was fresh, the reddish bill tip was used for identification (b iometrics: culmen 105, bill depth at base 46.3, bill width 35.2, tail 157, tarsus 105, wing 510mm). This note reports two additional records: a first-year female captured and kept by fishermen on the beach at Praia do Leste, Iguape (24°40'S, 47°24'W) before 15 October 1999 (sent to Santos Aquarium on 21 October 1999 where it died a few days later, now coll. Zool. Mus. Univ. São Paulo #75483) and another bird found alive on 3 October 2000 near Albardão Lighthouse, southern Rio Grande do Sul state (33°13'S, 52°40'W) that died a few days later in a rehabilitation centre. The skin of this specimen has not been prepared, but photographs of the bird were made where it had been kept (Fig. 1). Both petrels could be identified by the reddish-

128 Atlantic Seabirds 5(3)
Figure 1. �orthern Giant Petrels Macronectes halli stranded in Brazil: a juvenile from
São Paulo state (top), and an adult from Rio Grande do Sul state (bottom). Figuur 1. In Brazilië Aangespoelde �oordelijke Reuzenstormvogels Macronectes halli:
een juveniel uit de provincie São Paulo (boven) en een adult uit de provincie Rio
Grande do Sul (onder).

2003 �otes on seabirds 129 brown bill tip. The first bird was a juvenile with typical blackish plumage (Fig. 1, b iometrics: culmen 86.8, bill height at base 44.6, bill width 32.3, tail 225, tarsus 84.0mm), the other individual was an adult with pale eyelids and a strong contrast between under- and upperparts (Fig. 1). The Northern Giant Petrel has been fairly common in nearby Uruguayan waters in recent years, including seven birds ringed at Macquarie, Crozet and Kerguelen Islands (Olmos 2002). In southern Brazil, the Southern Giant Petrel M. giganteus is much more common and birds are recorded regularly north up to Rio de Janeiro. During winter, giant petrels are frequently seen near the coast and Neves (2000) frequently recorded giant petrels during offshore seabird censuses (probably all giganteus). The specific identity of eight skins in the collection of the Fundação Universidade Federal do Rio Grande remains to be determined, as these birds have lost their characteristic bill tip coloration, as previously noted by Bourne & Warham (1966).
Bourne W.R.P. & Warham H. 1966. Geographical variation in the Giant Petrels of the Genus Macronectes. Ardea 54: 45-67.
Martuscelli P., F. Olmos & R.S. Silva 1995. First record of the Northern Giant Patrel Macronectes halli for Brazilian waters. Bull. Brit. Ornith. Cl. 115: 187-188.
Neves T .S. 2000. Distribuição e abundância de aves marinhas na costa sul do Brasil. MSc. thesis, FURG, Rio Grande.
Olmos F. 2002. Non-breeding seabirds in Brazil: a review of band recoveries. Ararajuba 10: 31-42.
Leandro Bugoni*, Tatiana da Silva �eves, Andréa Corrado Adornes,
Fábio Olmos & Viviane Barquete
*Fundação Univ. Fed. do Rio Grande (FURG), CP 474, 96201-900, Rio
Grande, RS Brazil, E-mail: [email protected]
�otes on seabirds 77
LESSER CRESTED TER�S STERNA BENGALENSIS O� THE SOUTH AFRICA� ATLA�TIC COAST
Lesser Crested Terns Sterna bengalensis arabica from breeding populations in the Middle East migrate south along the eastern coast of Africa. Migrants to southern Africa are largely confined to the northeast of the region from Mozambique (mostly Dec-Apr) to Kwazulu-Natal, South Africa (mostly Jan-Mar; Ryan 1997; Parker 1999). Three records from the Eastern Cape are from February, March and May, respectively.
Lesser Crested Terns have been recorded west of Cape Agulhas on five occasions (Table 1). Four of these records were in March and in addition to
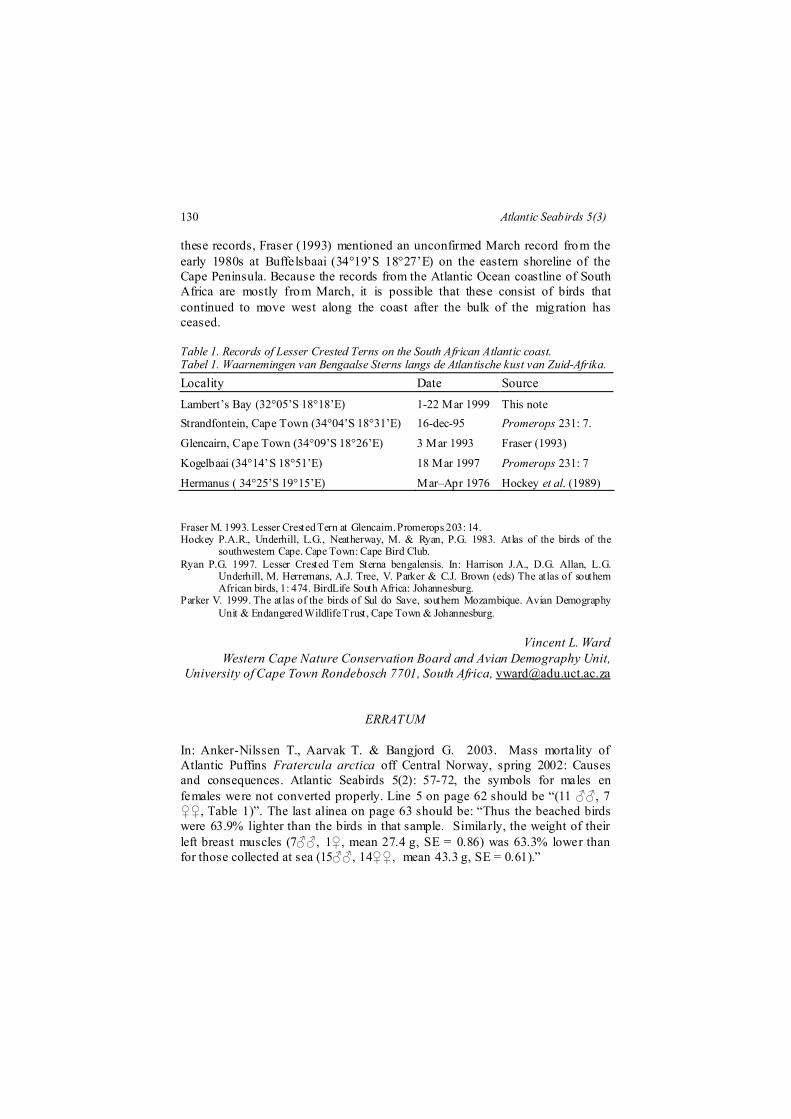
130 Atlantic Seabirds 5(3)
these records, Fraser (1993) mentioned an unconfirmed March record from the early 1980s at Buffelsbaai (34°19’S 18°27’E) on the eastern shoreline of the Cape Peninsula. Because the records from the Atlantic Ocean coastline of South Africa are mostly from March, it is possible that these consist of birds that continued to move west along the coast after the bulk of the migration has ceased. Table 1. Records of Lesser Crested Terns on the South African Atlantic coast. Tabel 1. Waarnemingen van Bengaalse Sterns langs de Atlantische kust van Zuid-Afrika.
Locality Date Source
Lambert’s Bay (32°05’S 18°18’E) 1-22 Mar 1999 This note
Strandfontein, Cape Town (34°04’S 18°31’E) 16-dec-95 Promerops 231: 7.
Glencairn, Cape Town (34°09’S 18°26’E) 3 Mar 1993 Fraser (1993)
Kogelbaai (34°14’S 18°51’E) 18 Mar 1997 Promerops 231: 7
Hermanus ( 34°25’S 19°15’E) Mar–Apr 1976 Hockey et al. (1989)
Fraser M. 1993. Lesser Crested Tern at Glencairn. Promerops 203: 14. Hockey P.A.R., Underhill, L.G., Neatherway, M. & Ryan, P.G. 1983. Atlas of the birds of the
southwestern Cape. Cape Town: Cape Bird Club. Ryan P.G. 1997. Lesser Crested Tern Sterna bengalensis. In: Harrison J.A., D.G. Allan, L.G.
Underhill, M. Herremans, A.J. Tree, V. Parker & C.J. Brown (eds) The atlas of southern African birds, 1: 474. BirdLife South Africa: Johannesburg.
Parker V. 1999. The atlas of the birds of Sul do Save, southern Mozambique. Avian Demography Unit & Endangered Wildlife Trust, Cape Town & Johannesburg.
Vincent L. Ward
Western Cape �ature Conservation Board and Avian Demography Unit,
University of Cape Town Rondebosch 7701, South Africa, [email protected]
ERRATUM
In: Anker-Nilssen T., Aarvak T. & Bangjord G. 2003. Mass mortality of Atlantic Puffins Fratercula arctica off Central Norway, spring 2002: Causes and consequences. Atlantic Seabirds 5(2): 57-72, the symbols for males en females were not converted properly. Line 5 on page 62 should be “(11 ♂♂, 7 ♀♀, Table 1)”. The last alinea on page 63 should be: “Thus the beached birds were 63.9% lighter than the birds in that sample. Similarly, the weight of their left breast muscles (7♂♂, 1♀, mean 27.4 g, SE = 0.86) was 63.3% lower than for those collected at sea (15♂♂, 14♀♀, mean 43.3 g, SE = 0.61).”
2003 �ews and notices 131
�ews and notices
BOOK REVIEWS
MITCHELL, I.P., NEWTON, S.F., RATCLIFFE, N. & DUNN, T.E. 2004.
Seabird Populations of Britain and Ireland. T. & A.D. Poyser, London.,
Hardback, ISBN 0-7136-6901-2. 511 pages, 71 figures, 91 tables, numerous
photographs and drawings. ₤35,= (c. €46,=)
The first counts of British and Irish seabirds were made in the 19th century, and
the first international census, for the Gannet Morus bassanus, was published by
the greatest British ornithological historian, J.H. Gurney jr, in 1913. This census
was repeated and Brit ish Fulmars Fulmarus glacialis added between the wars,
and these censuses for Britain were converted on to a regular basis by James
Fisher, and the Kittiwake Rissa tridactyla added, afterwards. My contribution
was to suggest that this was a waste of observer time, and that all our seabirds
should be counted together (Bird Study l2: 46-47, 1965). Th is was accepted
enthusiastically by James, so when we formed the Seabird Group the next year
we made him Chairman of a Census Committee to organise the first complete
British and Irish seabird census in 1969-1970, which he named "Operation
Seafarer" after the first Anglo-Saxon list of our seabirds.
This first census was carried out under difficult ies not emphasised at the
time. It was conducted in haste to provide a baseline against which to measure
the impact of imminent petroleum developments, with limited resources. It was
directed by James, and organised, and many of the observations made, by its
only member of staff, David Saunders. It was largely complete and the resulting
book, The Seabirds of Britain and Ireland, planned when James was killed in a
road accident in 1970, leaving David isolated in west Wales and me in northern
Scotland. At this point Stanley Cramp, who had not previously been much
involved apart from raising support but had an office in London, stepped in. He
was in a hurry since he had other commitments, and behaved rather arbitrarily
(for example, my dedication to James explaining his role got left out of the first
edition, and was abbreviated in the second), but we were too relieved to get it
done by 1974 to complain.
It is noticeable that those involved in organising these censuses do not
volunteer to carry out another. The Nature Conservancy Council took over and
provided modern data-processing facilities for a permanent Seabird Colony
Register (SCR) during the next census in 1985-1987, largely organised by Clare
Lloyd. The resulting report, The Status of Seabirds in Britain and Ireland
(1991), was a bit larger, and the report on the third census, Seabird 2000, which

132 �ews and notices Atlantic Seabirds 5(3)
is the main subject of this review, is twice as big, beautifully produced, and the
only major howlers I have detected are the promotion of the fairly well-known
island of Eynhallow from Orkney to Shetland on p.88, the use of a "less than"
symbol at the start of the key to all the maps of changes, and no explanation of
the different colours of symbols on the European Storm-petrel Hydrobates
pelagicus map on p. 87.
It differs from the previous surveys mainly by including inland colonies,
and the greater attention given to the nocturnal underground-nesting petrels,
counted by plotting their response to recorded calls. It starts with discussions of
census methods, current status and trends, causes of change, and the
international context, fo llowed by species accounts written by a variety of well-
qualified people, with tables of results for counties, maps of distribution and
changes, tables of international totals, and finally discussions of causes of
seabird population change and the international importance of our seabirds
(expressed as confusing possible ranges of population size; this was the place
for the nice clear figures in Appendix IV. The counting instructions and
recording forms, techniques for counting petrels by playing recorded calls,
scientific names and recorded totals are given in appendices.
Among various points, while Fulmars are still increasing in the south-
west, there has been a decline in the north, possibly due to long-lining. It is not
mentioned that caution is needed over old reports of Manx Shearwaters Puffinus
puffinus and Atlantic Puffins Fratercula arctica which, as suggested by their
names, were somet imes confused. There is a great increase in the totals of
Leach's Storm-petrels Oceanodroma leucorhoa at sites all located near deep
water (it is not mentioned that this is not found in North America), and no
mention of gull, as well as skua, predation on St Kilda, which was already
prominent in 1960. There has been a decrease of northern Great Cormorants
Phalacrocorax carbo, with an increase to the south and inland, where they have
been joined by the inland continental race sinensis; this could involve breeding
in the winter quarters following protection there.
There has been a decline of Arctic Skuas Stercorarius parasiticus
possibly due to competition with and predation by the increasing Great Skuas S.
skua, which have turned on birds following a lack of fish, and a dramatic
decline of Herring Gulls Larus argentatus, though their numbers are now
becoming stabilised, possibly due in part to changed availability of garbage and
fish and in part to botulism due to eating rotten food. The Greater Black-backs
L. marinus have declined less dramatically, whereas the Lesser Black-backs L.
fuscus, have increased. The Kittiwakes Rissa tridactyla, which were still
increasing in the 1980s, are down by a quarter, perhaps partly due to a failure of
their fishy food-supply, and partly because this has also led to more predation
from Great Skuas. Sandwich, Common and Little Terns Sterna sandvicensis, S.

2003 �ews and notices 133
hirundo and S. albifrons had declined slightly, possibly from a variety of causes
including trapping of the first two in the winter.
The Common Guillemots Uria aalge, which had been suffering badly
from oil pollution among other things, have more than doubled since Operation
Seafarer following good breeding seasons, and the Razorbills Alca torda have
also done well except in the west of Ireland, possibly due to past losses in
salmon nets. Better census-methods involving early counts of birds on the sea
produced a much larger total for Black Guillemots Cepphus grylle, and the total
for Atlantic Puffins is also up, especially in the north-east; though their long
term decline, possibly due to climatic factors, continues in the south-west.
The discussion of causes of population change omits to consider the past
thoroughly. In the early 19th century there was a huge human population on the
land in Britain, with a low standard of life, lead ing to a crisis when the potato
crop failed in the west in the "hungry 1840s", and our seabirds were apparently
heavily exploited, and have been recovering ever since. We used to speculate in
the last century how soon their subsequent increase would reach its ceiling, and
presumably we are now seeing this, with fluctuating success from place to
place, from year to year and from species to species. The 19th century overkill
by "sportsmen" and plumage-collectors also hit some of the weaker populations
along the east and south coasts particularly hard, exterminating Great
Cormorants and Black Guillemots in the north-east and auks in the inner
Channel, for example, and some have still not returned.
Comparatively litt le attention is also paid throughout the book to another
major factor, not just climatic change, but the weather. Storms (and droughts
inland) may wipe out a whole season’s seabird productivity, and go on to cause
serious adult mortality both then and during the subsequent moult and winter
(British Birds 97, in press). It is obvious that if seabirds live for decades but
have fairly stable populations they cannot breed successfully very often, and
they evidently also sometimes suffer catastrophic natural mortality of the
immatures and/or adults. This may require a different type of investigation, and
it is to be hoped that the regular censuses may shed more light on it.
While there is a good deal about predation, one of the more scandalous
situations has never received much attention. Those who went on the 1966
Congress Cruise may remember how while the Isle of May was then a sordid
gull slum, there was a sort of pink shimmer of Roseate Terns S. dougallii over
Inchmickery in the central Firth of Forth. Soon afterwards the gulls were
poisoned on the May, and for a while the Firth was full of dead bodies, while
afterwards the surviving birds descended on all the other islands and roof-tops
for miles around, including Inchmickery (photo, p.238), since when the Forth
Roseate Terns have been reduced to a remnant on a rock. It seems time
134 �ews and notices Atlantic Seabirds 5(3)
Inchmickery was also cleaned up as well as the Isle of May, and the Roseate
Terns tempted back from Ireland again.
There is also little comment on possibly one of the most serious
problems, when seabird colonies are targeted by individual predators. The entire
season’s production of thousands of terns on the Sands of Forvie was once
wiped out by two or three pairs of Herring Gulls, and that of a west coast Little
Ternery by a pair o f Magpies Pica pica. It is now accepted practice to exclude
Red Foxes Vulpes vulpes by electric fences, and Clive Craik has shown that it is
easy to control the Mink Mustela vison attacking west coast seabird colonies.
Yet, when I suggested at the 8th International Seabird Conference that someone
should set about the small proportion of the Shetland Great Skuas now
devastating their seabird colonies with a 22 rifle, there was a gasp of horror.
In general, this report is a fine production that has involved a vast
amount of work, and my main doubt is about cover. During Operation Seafarer,
the Census Committee met at regular intervals to review this, while we
borrowed RAF Shackleton aircraft afterwards to make sure of it. Since then I
get the impression that there has been increasing concern with counting the
often uncountable rather than finding everything. For example, while the maps
of European Storm-petrel colonies show increasingly large, confident blobs,
litt le seems to have been done about some of the queries, for example around
Skye, which seem to have got lost, and the Irish also think they have more birds.
Some of the gull figures also seem doubtful, notably the comparisons
with the BTO Atlases (p.208, 219). Are these declines real, or merely a measure
of declining thoroughness? There are similar problems with the surveys of roof-
nesting gulls, where the largest population, in Aberdeen, was noticed very late
in the day, although there is a full-frontal view of a big colony as one walks out
of the railway station. Are these figures in turn increasing totals, or merely a
measure of increasing thoroughness? And where are the Ring-billed Gulls L.
delawarensis and Little Gulls L. minutus, which seem likely to be breeding
somewhere by now?
The real question now is where to go next. This book is already quite big
enough, without putting off the young by doubling it every fifteen years with a
dimin ishing amount that is new. The next thing we need to know is what is
happening elsewhere, in case for example our Sandwich Terns are periodically
taking French Leave in the Netherlands in the same way that Brit ish Roseate
Terns seem to have found the Irish more hospitable. In fact what we now need
to measure is not so much national totals in well-covered countries, as meta-
populations throughout their range, doubtless including interesting but poorly-
covered places abroad providing scope for exciting expeditions. Maybe the
European Union would put up some money for this?
W.R.P. Bourne