Embed Size (px)
Citation preview
A Survey of Human Cancer Classification using Micro Array Data
G. Sophia Reena
P. Rajeswari
Head Of The Department
Research Scholar Department Of Computer Applications,
Department Of Computer Science, P.S.G.R Krishnammal College for Women
P.S.G.R Krishnammal College for Women Coimbatore, India.
Coimbatore, India.
Abstract
Cancer research is an interesting research area in the field of medicine. Classification is momentously necessary for cancer diagnosis and treatment. The precise prophecy of dissimilar tumor types has immense value in providing better care and toxicity minimization on the patients. Classification of patient taster obtainable as gene expression profiles has become an issue of prevalent study in biomedical research in modern years. Formerly, cancer classification depends upon the morphological and clinical. The modern arrival of the micro array technology has permitted the concurrent observation of thousands of genes, which provoked the progress in cancer classification using gene expression data. This study hub on the broadly used assorted data mining and machine learning techniques for appropriate gene selection, which pilot to exact cancer classification. In addition to, it provides a general idea for further improvement in this field.
Keywords: Microarray; Gene selection; Machine learning; Cancer classification; 1. Introduction
Data mining (the analysis step of the Knowledge Discovery in Databases process, or KDD), a relatively young and interdisciplinary field of computer science, is the process of extracting patterns from large data set by combining methods from statistics and artificial intelligence with database management. With recent technical advances in processing power, storage capacity, and inter-connectivity of computer technology, data mining is seen as an increasingly important tool.
In recent years numerous techniques were proposed in the literature for gene selection and cancer classification. Data mining algorithms are the most extensively used to classify gene expression data, in these divination of the disease plays an important role for cancer classification.
DNA micro arrays are also commonly known, as gene chips, DNA chip, or biochip. In which it is a collection of microscopic DNA spots attached to a solid surface. Scientists use DNA micro arrays to measure the expression levels of large numbers of genes simultaneously or to genotype multiple regions of a genome. Important knowledge can be extracted from these data by the use of data analysis techniques. It focuses on various techniques and methods proposed for biological data analysis. Gene expression profiling is a technique used in molecular biology to query the expression of thousands of genes simultaneously. Microarray Applications Microarray Type Application CGH Tumor classification,
risk assessment, and prognosis prediction
Expression analysis Drug Development, drug response, and therapy development.
Mutation/Polymorphism analysis
Drug development, therapy development, and tracking disease progression.
Gene expression profiling or microarray
analysis has enabled the measurement of thousands of genes in a single RNA sample. This technique has been successfully exploited for classification and diagnostic conjecture of cancer
P Rajeswari et al, Int. J. Comp. Tech. Appl., Vol 2 (5), 1523-1533
IJCTA | SEPT-OCT 2011 Available [email protected]
1523
ISSN:2229-6093
nodules. Numerous learning algorithms and mining techniques are currently applied for identifying cancer using gene expression data.
The residue of this paper is primed as follows. Section II focuses some of the earlier proposed research work on cancer classification. Section III provides a fundamental idea on which the future research work focuses on and concludes the paper with fewer discussions. Section IV encompasses the paper referenced in this survey. 2. Related works
Wang, et al., [1] demonstrates that DNA micro array can pursue the expressions of many genes simultaneously. Micro-array data habitually a surround a petite number of samples, it includes a hefty number of gene expression levels as a feature. It is a challenging task to choose relevant genes involved in different types of cancer. For the purpose of mining information about genes from a cancer micro-array data and dimensionality reduction, the algorithm such as feature selection algorithms was systematically analyzed. Selection of relevant genes from micro array data can be obtained using Wrappers, Filters and CFS (correlation-based feature selector) and the machine learning algorithms such as decision trees, naïve Bayes and support vector machines. The data set used in this paper was on acute leukemia and lymphoma micro-array data. The classification performance of this experiment shows that the best accuracy can be obtained on acute leukemia and diffuse large B-cell lymphoma micro-array data set than the published result. As well as it is also probable to select relevant genes with high confidence through the use of different classification combinations and feature selection approaches. The experimental results of this paper show that the gene selection did by filters, CFS, and wrappers, verified a similar performance on the analyzed data set. For fast analysis of data the filters and CFS suggested. However, in order to select a very few genes validation of the results, the wrapper approaches can be proposed.
F. Chu And L. Wang [2] stated that Micro
array gene expression data generally have a huge number of dimensions. The classifier used here is a support vector machine (SVM for cancer classification with the microarray gene expression data. The selection of genes has been completed by the use of four effective feature dimensionality reduction methods, for instance, principal components analysis (PCA), class-
separability measure, Fisher ratio, and T-test. The data set used here is SRBCT, lymphoma data set and leukemia data set of publicly available micro array gene expression data set. To do multi-group classification a voting scheme is then used by k (k − 1 ) b inary SVMs. The result showed that genetic selection of T-test performed well than the other three approaches. In all the three data set, the SVMs obtained very good accuracies with very few numbers of genes compared with previously published methods.
Huilin Xiong And Xue-Wen Chen [3] says the new approach called kernel function, which improves the performance of the classifier in genetic data. The efficiency of a kernel approach has been probed in which it is depends upon on optimizing a data-dependent kernel model. The K-nearest-neighbor (KNN) and support vector machine (SVM) could be used as a classifier for performance analysis. Data set utilized here, ALL-AML Leukemia Data, Breast-ER, Breast-LN,, Colon Tumor Data, Lung Cancer Data and Prostate Cancer from micro array data. Kernel optimization schemes have been discovered to classify gene expression data. The performance is evaluated when applying the optimized kernel in classifying gene expression data. Compared with KNN, SVM as “oksvm”, with optimized kernel provides better accuracy.
L. Shen And E.C. Tan [4] presented the penalized logistic regression for classification of cancer. The penalized logistic regression united with two-dimension reduction methods in order that the classification accuracy and computational speed were improved. Support vector machines and least squares regression chose for comparison. The method called the Recursive feature elimination (RFE) was used for iterative gene selection, which tries to select a gene subset that was most relevant to the cancers. Seven publicly available data sets such as breast cancer, central nervous system, colon tumor, Acute Leukemia, Lung cancer, ovarian cancer and Prostate cancer data set were chosen from [16] to performance evaluation. Linear SVM is used to compare with the regression methods.
Two software packages one was MATLAB by Schwaighofer and the other one was written by Gunn [18] used for SVM Implementation. The excellent performance could be achieved the combination of Penalized logistic regression and PLS.
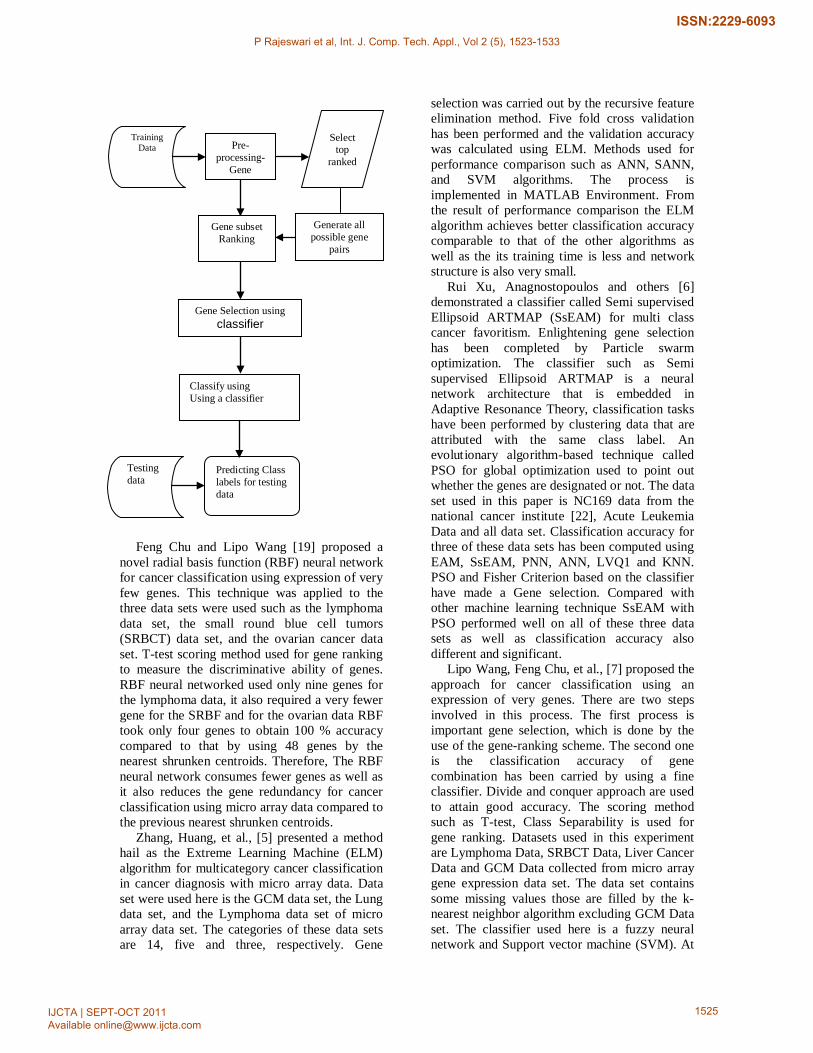
The procedure of the system used in this
survey
P Rajeswari et al, Int. J. Comp. Tech. Appl., Vol 2 (5), 1523-1533
IJCTA | SEPT-OCT 2011 Available [email protected]
1524
ISSN:2229-6093
Feng Chu and Lipo Wang [19] proposed a
novel radial basis function (RBF) neural network for cancer classification using expression of very few genes. This technique was applied to the three data sets were used such as the lymphoma data set, the small round blue cell tumors (SRBCT) data set, and the ovarian cancer data set. T-test scoring method used for gene ranking to measure the discriminative ability of genes. RBF neural networked used only nine genes for the lymphoma data, it also required a very fewer gene for the SRBF and for the ovarian data RBF took only four genes to obtain 100 % accuracy compared to that by using 48 genes by the nearest shrunken centroids. Therefore, The RBF neural network consumes fewer genes as well as it also reduces the gene redundancy for cancer classification using micro array data compared to the previous nearest shrunken centroids.
Zhang, Huang, et al., [5] presented a method hail as the Extreme Learning Machine (ELM) algorithm for multicategory cancer classification in cancer diagnosis with micro array data. Data set were used here is the GCM data set, the Lung data set, and the Lymphoma data set of micro array data set. The categories of these data sets are 14, five and three, respectively. Gene
selection was carried out by the recursive feature elimination method. Five fold cross validation has been performed and the validation accuracy was calculated using ELM. Methods used for performance comparison such as ANN, SANN, and SVM algorithms. The process is implemented in MATLAB Environment. From the result of performance comparison the ELM algorithm achieves better classification accuracy comparable to that of the other algorithms as well as the its training time is less and network structure is also very small.
Rui Xu, Anagnostopoulos and others [6] demonstrated a classifier called Semi supervised Ellipsoid ARTMAP (SsEAM) for multi class cancer favoritism. Enlightening gene selection has been completed by Particle swarm optimization. The classifier such as Semi supervised Ellipsoid ARTMAP is a neural network architecture that is embedded in Adaptive Resonance Theory, classification tasks have been performed by clustering data that are attributed with the same class label. An evolutionary algorithm-based technique called PSO for global optimization used to point out whether the genes are designated or not. The data set used in this paper is NC169 data from the national cancer institute [22], Acute Leukemia Data and all data set. Classification accuracy for three of these data sets has been computed using EAM, SsEAM, PNN, ANN, LVQ1 and KNN. PSO and Fisher Criterion based on the classifier have made a Gene selection. Compared with other machine learning technique SsEAM with PSO performed well on all of these three data sets as well as classification accuracy also different and significant.
Lipo Wang, Feng Chu, et al., [7] proposed the approach for cancer classification using an expression of very genes. There are two steps involved in this process. The first process is important gene selection, which is done by the use of the gene-ranking scheme. The second one is the classification accuracy of gene combination has been carried by using a fine classifier. Divide and conquer approach are used to attain good accuracy. The scoring method such as T-test, Class Separability is used for gene ranking. Datasets used in this experiment are Lymphoma Data, SRBCT Data, Liver Cancer Data and GCM Data collected from micro array gene expression data set. The data set contains some missing values those are filled by the k-nearest neighbor algorithm excluding GCM Data set. The classifier used here is a fuzzy neural network and Support vector machine (SVM). At
Testing data
Pre-processing-
Gene
Select top
ranked
Generate all possible gene
pairs
Gene subset Ranking
Gene Selection using classifier
Classify using Using a classifier Predicting Class
labels for testing data
Training Data
P Rajeswari et al, Int. J. Comp. Tech. Appl., Vol 2 (5), 1523-1533
IJCTA | SEPT-OCT 2011 Available [email protected]
1525
ISSN:2229-6093

first need to divide the whole data set into two one for training and the remaining part for testing and then ranking is performed by the use of the scoring scheme after that top genes have been selected from the ranked data set. Each selected gene is passed one by one into the classifier if no accuracy is attained, then the next process is performed that is gene combination here cross validation have been performed on the training data. Two or three gene combination has been calculated from the top genes with the use of cross validation and it is then inputted into the classifier until good accuracy is achieved. The result of all data set specifies that finding gene minimum gene selections for cancer classification provides very good classification accuracy as well as T-score and CS is the best approach for important gene selection.
Wang X And Gotoh O [8] presented a method for cancer classification using a single gene with the use of micro array gene expression profiling. The gene selection has been made by the use high class-discrimination capability according to their depended degree by the classes. The classifier is developed the foundation of the rules generated by the selection of single genes. The method called rough sets based soft computing could be used for cancer classification with a single gene. Data set such as leukemia, lung cancer and prostate cancer from the website: http://datam.i2r.a-star.edu.sg/data/krbd/. Before do gene selection and classification the data are preprocessed. In the single genetic method the prediction procedure and result are easily understood because this model is based on the rules evaluated with the help of single genes. This model is simple and effective as well as achieved better classification accuracy in all of this data set than multi-gene models.
Xiyi Hang [9] described a new approach called Sparse Representation using micro array gene expression profiles for cancer diagnosis. The Sparse representation can be acquired by the use of L1-regularized least squares. Classification is accomplished by defining discriminating functions for each category from the coefficient vector classification. A cancer diagnosis is analyzed by casting the problem of cancer classification as a sparse representation of test data used as a linear combination of training data. Support vector machines (SVM) used, as a classifier for performance foundation Data set used here is 9_Tumors and Brain_Tumor2. Kruskal-Wallis non-parametric one-way ANOVA (KW) and the between-within class’s sum of squares (BW) used for gene
selection. Here, a classification model is created by the use of the training procedure. Numerical experiment is indented to perform verification of the new method called as a sparse representation of gene expression data, which is compared with the multi-category SVMs. The sparse representation method is implemented in MATLAB R14.The Result of SVM are calculated By GSM GEMS (Gene Expression Model Selector), with graphical user interface for classification data, this freeware is available at http:// www.gemssystem.org/. The SVM Method used as One versus-rest (OVR), one-versus-one (OVO), directed acyclic graph SVM (DAGSVM),all-at once method by Weston and Watkins (WW) , and all-at-once method by Crammer and Singer (CS) for computing the performance accuracy without gene selection. 9 human tumor types such as NSCLC, colon, breast, ovary, leukemia, renal, MCNS and Brain_Tumor2 contains 4 types of malignant glioma those are classic glioblastomas, class drogliomas, non-classic glioblastomas, and nonclassic anaplastic oligodendrogliomas used as a data set in this experiment. Stratified 10-fold cross validation utilized for performance evaluation. The result of sparse representation can be computed when KW and the Bw methods used for gene selection along with SVM Result also calculated by these 2 gene selection methods. When comparing the new approach’s accuracy is akin to SVM Result as well as there are no differences in gene selection only partial improvement. Therefore, the result shows that the sparse representation approach is similar to that of SVM performance.
Mallika Rangasamy And Saravanan
Venketraman [10] developed a new algorithm called an efficient Statistical Model Based classification algorithm for cancer classification using very few genes from micro gene expression data. This model used classical statistical technique for the purpose of ranking the gene and 2 various classifiers used for gene selection and prediction. The projected method proves that which is cable of generating very high accuracy with the use of very few genes. This paper utilized a three-cancer dataset as Lymphoma; Liver and Leukemia. There are some missing values in these datasets that can be filled by the use of The K-Nearest neighbour (KNN) algorithm. Gene selection can be carried out with the help of ANOVA, Linear Discriminant Analysis (LDA) and SVM-OAA RBF Kernel. Linear Discriminant Analysis
P Rajeswari et al, Int. J. Comp. Tech. Appl., Vol 2 (5), 1523-1533
IJCTA | SEPT-OCT 2011 Available [email protected]
1526
ISSN:2229-6093
(LDA) used for the 2 class datasets such as Liver and Leukemia.
Support Vector machine-one-against- all (SVM-OAA) and Linear Discriminant Analysis (LDA) is used as a classifier for performance evaluation. Datasets is randomly divided into two one for training and another part for testing and gene ranking that is ANOVA P-Values can be computed using one-way ANOVA. Top genes were selected from the ranked data and gene combination has been performed. The classifier is trained using all possible gene combinations and the classifier is validated using 5 fold or 10 fold cross validation methods. The best gene combination can be selected from the result of accuracy. Compared with the previous result obtained by ELM [5] SVM OAA attains best accuracy with the use of very few genes Than LDA. The same classifier used on Leukemia and Liver datasets for both the gene selection and classification that improves the strength of the model.
Wang, X., And Gotoh, et al., [11] screened a high-class discriminative power and gene pairs utilized to create simple prediction models. These prediction models were used in single genes or gene pairs based on the soft computing approach and rough set theory for selecting single genes. The simple prediction models applied for four these data sets such as CNS tumor, colon tumor, lung cancer and DLBCL.A rule base pipelines used as a ruse based method to construct cancer predictors. Feature selection is used an attribute depended degree from rough set theory and rule classifier is created by the use selected genes. Using the attribute depended degree, some single genes or gene pairs can be detected. The algorithm was applied to the central nervous system (CNS) tumor, colon tumor, lung cancer, and diffuse large B-cell lymphoma (DLBCL) from Kent Ridge Bio-medical Dataset. Single genes are founded through the use of high-class discriminative power. Gene pair or a single gene builds four decision rules, which are used to execute prediction of cancer. The classifiers C4.5 and Naive Bayes used to predict performance of the gene sets. The C4.5 and Naive Bayes Result is compared with FCBF, CFSSF and ReliefF .The efficiency of this method can be validated with the use of Leave-one-out cross-validation (LOOCV). Cancer prediction using soft computing produces better results than the previously published results.
A. Bharathi And Dr.A.M.Natarajan [12] presented a gene selection scheme called
ANOVA, which is used to find the minimum number of genes from micro array gene expression that can be used in classification of cancer. The proposed ranking scheme called 2 ways analyses of Variance (ANOVA) used for the selection of important genes. The classification can be found by the use of well-known classifiers such as Support Vector Machines. The lymphoma data sets were used to demonstrate the effectiveness of this approach. If the selected data contains missing values or empty cell entries, it must be preprocessed. This work encompasses of 2 steps. Step1 is an important gene selection using a scoring scheme called Analysis of Variance (ANOVA) method and then the top genes can be selected with the highest scoring value from ranked data. The next step is the classification capability of all gene combinations can be performed with the use of the support vector machine. Selected genes are putted into the classifier if no good accuracy is obtained means classification is performed with a gene combination. Redundant can be handled by using called Principal Component Analysis (PCA) before using the SVM algorithm. The data set is divided into two parts by using a cross validation method such as 5 fold cross validation. One is used as a training data and remaining part is used as a testing data. For the purpose cancer classification, finding minimum gene sets using ANOVA and CV are an efficient ranking method. The obtained results using ANOVA with SVM compared to the T - score method.
R. Mallika, And V. Saravanan [13] defined a novel method for cancer classification using expressions of very few genes. This method uses the same classifier for both selection and classification. This method used three datasets such as Lymphoma, Liver and Leukemia datasets from micro array gene expression data. The classifiers as Support vector machines-one against all (SVM-OAA), K nearest neighbour (KNN) and Linear Discriminant analysis (LDA) were compared with one another. Gene ranking can be performed by the use of Analysis of Variance (ANOVA). It includes the process such as pre-processing the gene expression data, top ranked gene selection, gene subset ranking, gene combination, gene selection using SVM and classification using SVM, KNN, LDA and finally testing data can be predicted. The classifier was validated using 5 fold cross validation (CV) technique. The classifiers SVM-OAA performed well on the lymphoma data and KNN and SVM-OAA classifiers produce the
P Rajeswari et al, Int. J. Comp. Tech. Appl., Vol 2 (5), 1523-1533
IJCTA | SEPT-OCT 2011 Available [email protected]
1527
ISSN:2229-6093
same accuracy on the liver and leukemia data. The classifier SVM-OAA gives better higher accuracy than that of KNN and SVM-OAA classifiers.
N. Revathy And R. Amalraj [14] defined a new method to process microarray data for cancer classification. There are several methods were available to rank the gene expression data. The most often used methods are T-score and ANOVA and so on. But those are not suitable for large data sets. To rectify this problem the author proposed the technique is the Enrichment score. The Classifier used here Support Vector Machine (SVM). The data set is randomly divided into two one for training and the remains for testing. The classifier is trained with the data. The lymphoma data set is used for performance demonstration. There are two processes involved one is gene ranking done by using the proposed method called enrichment score. Top genes can be selected from the ranked data, which is passed into the classifier one by one if no good accuracy is attained, gene combination can be performed from the ranked data set. Again the combination of genes can be classified until good accuracy is achieved. The result can be evaluated with the use of SVM and the T - Score and SVM and Enrichment score. The performance accuracy and classification time can be compared with one another. The SVM With the enrichment score performed well with higher accuracy than the SVM With T-Score.
Santanu Ghorai, Anirban Mukherjee and others [15], offered a nonparallel plane proximal classifier (NPPC) ensemble for cancer classification based on microarray gene expression profiles. A hybrid CAD method is introduced based on filters and wrapper methods. Minimum redundancy maximum relevance (MRMR) ranking method is used for feature selection that uses mutual information criterion to do minimum gene selection. The wrapper method is applied on those gene sets to reduce the computational burden and nonparallel plane proximal classifier (NPPC) is selected as a component of wrapper method. The data set exploit here is ALL-AML, Colon cancer, Lung cancer, Breast Cancer, Lymphoma, Liver Cancer, Prostate cancer from the Stanford micro array database. The absent values of the Lymphoma and Liver cancer data sets has been applied by using k-nearest neighbor algorithm [24] .To evaluate performance the data set is divided into training and testing data and to test the performance the proposed classifier NPPC which is implemented in MATLAB the Gunn
SVM toolbox [8]. Gene selection and simultaneous feature subset, and parameter selection have been carried out by GA.To train NPPC expert, a simultaneous feature based on genetic algorithms and the model selection scheme is utilized by increasing cross-validation accuracy. The affiliations of the ensemble are chosen by the recital of the trained models on a validation set. Minimum average proximity-based decision combiner is commenced intended for grouping NPPC. The new approach of mingling decisions for cancer diagnosis is premeditated and compared with the classifier support vector machine (SVM). Experimental result on cancer datasets illustrates that nonparallel plane proximal classifier (NPPC) proffers enhanced accuracy comparable to that of the SVM classifier with reduced training time on average.
Zainuddin et al., [27] given an enhanced wavelet neural network for early analysis of cancer patients using clustering algorithms. Translation parameter is caused based on the a variety of clustering algorithms, that is, K-means (KM), Fuzzy C-means (FCM), symmetry-based K-means (SBKM), symmetry-based Fuzzy C-means (SBFCM) and modified point symmetry-based K-means (MPKM) clustering algorithms. The data sets such as LEU, SRBCT, GLO and CNS collected for the development of cancer classification in the use of micro array gene expression data [26]. The T-Test is used for feature selection from micro array gene data set. The highest classification can be achieved with the use of MPKM algorithms in all the three data sets. The experimental results showed that the proposed classifiers achieved a superior accuracy, which ranges from 86% to 100%. Performance comparisons are also made with other classifiers, which show that this proposed approach outperforms most of them.
Microarray data analysis was conducted by Osareh et al., [28] for cancer classification. An automated system is developed for consistent cancer analysis based on gene microarray expression data. The classifier named as K nearest neighbors, naive Bayes, neural networks and decision tree, Support vector machine. Microarray datasets were chosen that includes both binary and multi-class cancer problems. From the result of experimental best classification model is captured using the support vector machine classifier.
Jinn et al., [29] applied the Data Mining Techniques for Cancer Classification using Gene Expression Data. Feature selection from
P Rajeswari et al, Int. J. Comp. Tech. Appl., Vol 2 (5), 1523-1533
IJCTA | SEPT-OCT 2011 Available [email protected]
1528
ISSN:2229-6093
microarray dataset has been carried out using t- Statistics (t-GA) based genetic algorithm. The decision-based classifier is used which is applied on the top data sets. The proposed method provides highest accuracy than that of the other methods. Colon, Leukemia, Lymphoma, Lung and Central nervous system (CNS) is selected form literature. Those were preprocessed using min-max normalization syntax
W' ij= W ij – min (W ij) / Max (W ij)- min (W ij) The performance of this T-GA is compared
with the previously used gene selection methods such as GA, T-Statistic, Info Gain and GS.The experimental result shows when applying the decision tress based classifier in all of these data sets with the scoring scheme T-GA provides highest accuracy than that of GA, T-Statistic, Info Gain and GS.
Kai-Lin Tang, Wei-Jia Yao, et al., [30] defined Discriminant Kernel-PLS for cancer classification using gene expression profiles. The data set such as acute leukemia, prostate cancer and lung cancer were tested by the use of NIPALS-KPLS method. The data set is divided into training and testing data. Kernel matrix is formulated for all training and testing data. Kernel functions named as Polynomial, ANOVA, Multi-polynomial and Poly-ANOVA were used to create kernel matrix.5-fold cross validation is used to verify the performance of the kernel functions by the D-KPLS, Kernel selection based on alignment index and DFV classification accuracy is calculated. AI is used to measure the extent of matching between a kernel matrix and a target. DFV calculates the mean distance from each sample to other samples belonging to the same class. DFV and AI are founded only for training data. The problem of over fitting can be avoided by concerning the second highest value with kernel function. Here, kernel matrix acts as an interface between the input and learning models, When compared with conventional method, the proposed method provides the prediction accuracy of 100% by the 1-ANOVA.
Manuel et al., [31] presents a Kernel Alignment k-NN for cancer classification using gene expression profiles. The k Nearest Neighbor classifier has been applied to the cancer identification to get better results. However, the performance of the k-NN depends upon on the distance. This paper learns a linear combination of dissimilarities using the kernel alignment algorithm. A semi-definite programming approach can be utilized to optimize the error function and incorporates a
term that penalizes the complexity of the family of distances avoiding over fitting. Kernel alignment k-NN performs well when compared with other metric learning strategies and improves the classical k-NN based on a single dissimilarity.
Jin et al., [32] proposed a Machine Learning Techniques and Chi-Square Feature Selection for Cancer Classification Using SAGE Gene Expression Profiles. Recently invented Serial Analysis of Gene Expression (SAGE) technology facilitates to concurrentely measure the expression levels of tens of thousands of genes in a inhabitants of cells. SAGE is enhanced than Microarray in that SAGE can scrutinize both known and unknown genes even as Microarray can only gauge known genes. SAGE gene expression profiling based cancer classification is a better because cancers may be owing to a quantity of unknown genes. Whereas a broad assortment of ways has been applied to established Microarray based cancer classification. With the intention to pact with the high dimensional problem, Chi-square is used for tag/gene selection. Both binary classification and multicategory classification are investigated. The experiment is performed on two human SAGE datasets: brain and breast. The experimental results shows that SVM and Naive Bayes are the outperforming SAGE classifiers with the use of Chi-square for gene selection can improve the performance than other classifiers probed.
Dimitris et al., [33], explained a gene expression analysis system for medical diagnosis. The author presents novel system based molecular-level information for medical diagnosis. High dimensional vectors of gene expressions are used as an input. A diverse of data pre-processing methods, such as missing values estimation and data normalization can be integrated. The Pre-processing Unit organizes the gene data to transitory into the diagnostic Unit, which is the most important processing unit of the planned method. An assorted gene selection method has been espoused for diagnostic function. To evaluate the performance of the proposed system, three data sets such as the prostate cancer dataset, colon cancer and lung cancer were taken from Stanford micro array database used in an experiment for disease diagnosis. Novel SVM-based architecture is used as a classifier in this experiment. The intended system has been widely tested on an assortment of an assortment of obtainable datasets. The author displays its recital for prostate cancer
P Rajeswari et al, Int. J. Comp. Tech. Appl., Vol 2 (5), 1523-1533
IJCTA | SEPT-OCT 2011 Available [email protected]
1529
ISSN:2229-6093

diagnosis and compares its performance with a entrenched multiclass classification systems. The domino effect illustrate that the wished-for system could be attested a precious analytic assist in medicine.
Wang et al., [34] recognizes a comprehensive Fuzzy-Based Framework for cancer microarray Data Gene Expression Analysis. A fuzzy-based ensemble model and a comprehensive fuzzy-based framework for cancer classification using micro array gene expression data were proposed. This method uses three microarray cancer data sets, called as Leukemia Cancer, Colon Cancer and Lymphoma Cancer Data Set. When Compared with other traditional statistical and machine learning mock-up, the method used here, can professionally confront numerous important tribulations in cancer microarray gene expression data analysis, counting highly linked genes, high dimensionality, highly noisy data. A novel fuzzy based system is used for both gene selection and classification using micro array gene expression data. Neuro-Fuzzy Ensemble model (NFE) makes fuzzy based system more practicable to micro array gene profiles. The performance acquired by using fuzzy based system is more viable.
Huang et al., [35] suggested the well-organized choice of discriminative genes from microarray gene expression data for cancer diagnosis. New mutual information (MI)-based feature-selection way to resolve the so-called large p and small n problem skilled in a microarray gene expression-based data is offered. Initially, a grid-based feature-clustering algorithm is launched to eradicate superfluous features. A huge gene set is then very much abridged in an effective tactic. As a consequence, the computational effectiveness of the entire feature- assortment procedure is to a large extent improved. Second, MI is straightly predictable by resources of quadratic MI as one with Parzen window compactness estimators. This method is endowed to convey dependable domino effect still when merely a small precedent suite is accessible. As well, a new MI-based criterion is planned to shun the very much superfluous choice, results in a methodical manner. At most recent, ascribed to the direct assessment of MI, the proper chosen trait subsets can be plausibly dogged.
Ireaneus Anna Rejani et al in [36] projected a tumor discovery modus operandi as of mammogram. Their tactic spotlight on the result of two tribulations. Detection of tumors as suspicious regions with a very weak contrast to
their background. Extracting features, which categorize tumors. The tumor detection method trails the system of (a) mammogram enhancement (b) The segmentation of the tumor area (c) The taking out of aspects from the segmented tumor area (d) SVM classifier usage. The upgrading is the amendment of the image excellence to a improved and additional comprehensible echelon. The mammogram augmentation procedure consists of sieving, top bonnet process, DWT. Then the dissimilarity elongating is used to hoist the difference of the image. The segmentation of mammogram images performs a vital function to boost the detection and diagnosis of breast cancer. The renowned segmentation system used is thresholding. The features are extracted from the segmented breast area. After that, phase classifies the regions using the SVM classifier. The approach was tested on 75 mammographic images, from the mini-MIAS database. This approach acquired a sensitivity of 88.75%.
Mu et al in [37] projected a system to be appropriate v-SVM learning as an alternative of c-SVM learning to breast cancer detection, and perform v-SVM parameter choice pedestal on the restricted leave-one-out error approximation using grid seek with no necessitate for corroboration data. An effectual technique of Radial Basis Function Networks (RBFN) foundation on the self-organizing clustering results has also been applied to improve the detection recital of using only self-organizing maps. To appraise the concert of this new attitude Wisconsin diagnosis breast cancer dataset is used. Experimental surveillance shows that the anticipated method bid momentous concert than the existing approaches.
Machine learning is a bough of Artificial Intelligence (AI) that uses a variety of statistical, probabilistic and optimization systems that permits computers to “learn” from past examples and to detect hard-to-discern patterns from large, noisy or complex data sets. Therefore, machine learning is frequently used in cancer diagnosis and detection. In the research work by Osareh et al in [38], SVM, K-nearest neighbors and probabilistic neural networks classifiers are jointed with signal-to-noise ratio feature ranking, sequential forward selection-based feature selection and principal component analysis feature extraction to distinguish between the benign and malignant tumors of breast. The overall accuracy for breast cancer diagnosis achieved equal to 98.80% and 96.33% in order
P Rajeswari et al, Int. J. Comp. Tech. Appl., Vol 2 (5), 1523-1533
IJCTA | SEPT-OCT 2011 Available [email protected]
1530
ISSN:2229-6093
that using SVM classifier models against two widely used breast cancer benchmark datasets.
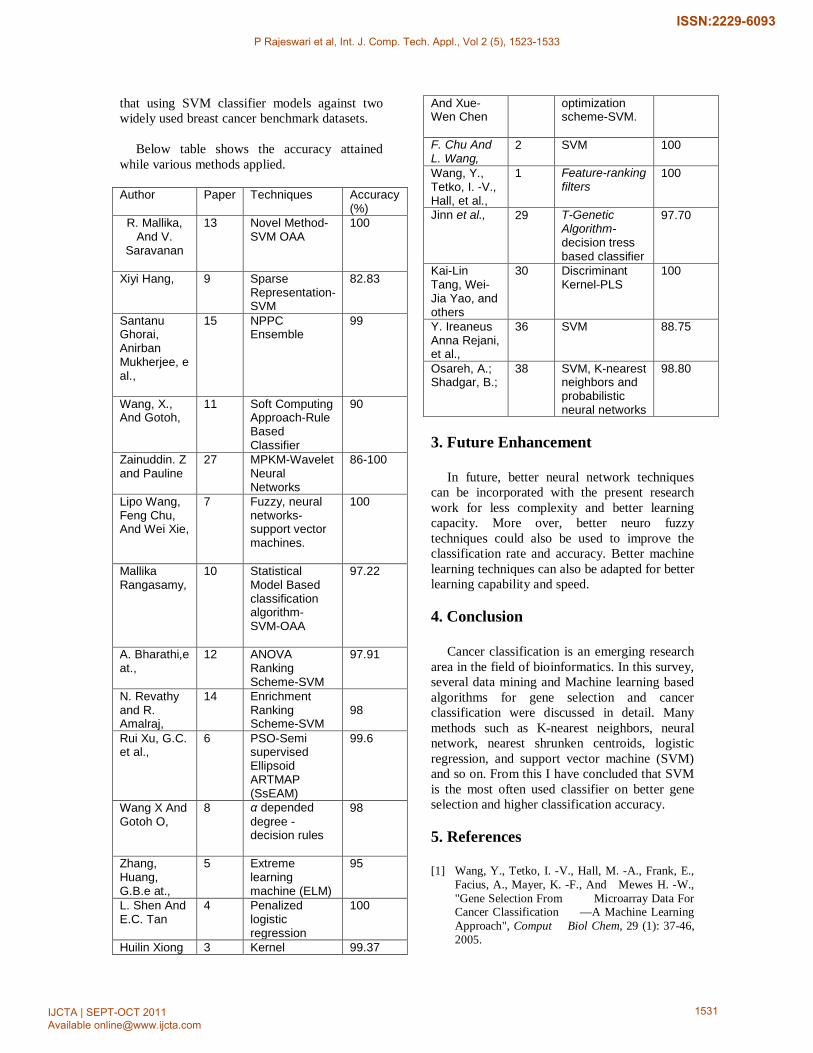
Below table shows the accuracy attained
while various methods applied.
Author Paper Techniques Accuracy (%)
R. Mallika, And V.
Saravanan
13 Novel Method-SVM OAA
100
Xiyi Hang, 9 Sparse Representation-SVM
82.83
Santanu Ghorai, Anirban Mukherjee, e al.,
15 NPPC Ensemble
99
Wang, X., And Gotoh,
11
Soft Computing Approach-Rule Based Classifier
90
Zainuddin. Z and Pauline
27
MPKM-Wavelet Neural Networks
86-100
Lipo Wang, Feng Chu, And Wei Xie,
7 Fuzzy, neural networks- support vector machines.
100
Mallika Rangasamy,
10
Statistical Model Based classification algorithm- SVM-OAA
97.22
A. Bharathi,e at.,
12 ANOVA Ranking Scheme-SVM
97.91
N. Revathy and R. Amalraj,
14 Enrichment Ranking Scheme-SVM
98
Rui Xu, G.C. et al.,
6 PSO-Semi supervised Ellipsoid ARTMAP (SsEAM)
99.6
Wang X And Gotoh O,
8 α depended degree - decision rules
98
Zhang, Huang, G.B.e at.,
5 Extreme learning machine (ELM)
95
L. Shen And E.C. Tan
4 Penalized logistic regression
100
Huilin Xiong 3 Kernel 99.37
And Xue-Wen Chen
optimization scheme-SVM.
F. Chu And L. Wang,
2 SVM 100
Wang, Y., Tetko, I. -V., Hall, et al.,
1 Feature-ranking filters
100
Jinn et al., 29 T-Genetic Algorithm- decision tress based classifier
97.70
Kai-Lin Tang, Wei-Jia Yao, and others
30 Discriminant Kernel-PLS
100
Y. Ireaneus Anna Rejani, et al.,
36 SVM 88.75
Osareh, A.; Shadgar, B.;
38 SVM, K-nearest neighbors and probabilistic neural networks
98.80
3. Future Enhancement
In future, better neural network techniques can be incorporated with the present research work for less complexity and better learning capacity. More over, better neuro fuzzy techniques could also be used to improve the classification rate and accuracy. Better machine learning techniques can also be adapted for better learning capability and speed.
4. Conclusion
Cancer classification is an emerging research
area in the field of bioinformatics. In this survey, several data mining and Machine learning based algorithms for gene selection and cancer classification were discussed in detail. Many methods such as K-nearest neighbors, neural network, nearest shrunken centroids, logistic regression, and support vector machine (SVM) and so on. From this I have concluded that SVM is the most often used classifier on better gene selection and higher classification accuracy.
5. References [1] Wang, Y., Tetko, I. -V., Hall, M. -A., Frank, E.,
Facius, A., Mayer, K. -F., And Mewes H. -W., "Gene Selection From Microarray Data For Cancer Classification —A Machine Learning Approach", Comput Biol Chem, 29 (1): 37-46, 2005.
P Rajeswari et al, Int. J. Comp. Tech. Appl., Vol 2 (5), 1523-1533
IJCTA | SEPT-OCT 2011 Available [email protected]
1531
ISSN:2229-6093
[2] F. Chu And L. Wang, "Applications Of Support Vector Machines To Cancer Classification With Microarray Data", International Journal Of Neural Systems, Vol. 15, No. 6, 475–484,2005.
[3] Huilin Xiong And Xue-Wen Chen,"Optimized Kernel Machines For Cancer Classification Using Gene Expression Data", Proceedings Of The 2005 IEEE Symposium On Computational Intelligence In Bioinformatics And Computational Biology, Pp.1-7, 2005.
[4] L. Shen And E.C. Tan, “Dimension Reduction-Based Penalized Logistic Regression For Cancer Classification Using Microarray Data,” IEEE/ACM Trans. Computational Biology And Bioinformatics, Vol. 2, No. 2, Pp. 166-175, Apr.-June 2005..
[5] Zhang, Huang, G.B., Sundararajan, N. And Saratchandran, P., "Multicategory Classification Using An Extreme Learning Machine For Microarray Gene Expression Cancer Diagnosis", IEEE/ACM Transactions On Computational Biology And Bioinformatics, Vol. 4, No.3, Pp. 485 – 495, 2007.
[6] Rui Xu, Anagnostopoulos, G.C. And Wunsch, D.C.I.I.,"Multiclass Cancer Classification Using Semi supervised Ellipsoid ARTMAP And Particle Swarm Optimization With Gene Expression Data", IEEE/ACM Transactions On Computational Biology And Bioinformatics, Vol.4, No.1, Pp. 65-77, 2007.
[7] Lipo Wang, Feng Chu, And Wei Xie, "Accurate Cancer Classification Using Expressions Of Very Few Genes", IEEE/ ACM Transactions On Computational Biology And Bioinformatics, 4, 40-52,2007.
[8] Wang X And Gotoh O, "Cancer Classification Using Single Genes”, Genome Informatics, Vol. 23, Pp.179-188, 2009.
[9] Xiyi Hang, "Cancer Classification By Sparse Representation Using Microarray Gene Expression Data", IEEE International Conference On Bioinformatics And Biomedicine Workshops, Pp. 174-177, 2008.
[10] Mallika Rangasamy And Saravanan Venketraman,"An Efficient Statistical Model Based Classification Algorithm For Classifying Cancer Gene Expression Data With Minimal Gene Subsets”, International Journal Of Cyber Society And Education, Vol. 2, No. 2, Pp.51-66, 2009.
[11] Wang, X., And Gotoh, O., Microarray-Based Cancer Prediction Using Soft Computing Approach, Cancer Informatics, 7:123–139, 2009.
[12] A. Bharathi And Dr.A.M.Natarajan,"Cancer Classification Of Bioinformatics Data Using ANOVA ", International Journal Of Computer Theory And Engineering, Vol. 2, No. 3, 1793-8201,2010.
[13] R. Mallika, And V. Saravanan, "An SVM Based Classification Method For Cancer Data Using Minimum Microarray Gene Expressions", World Academy Of Science, Engineering And Technology 62 2010.
[14] N. Revathy And R. Amalraj, "Accurate Cancer Classification Using Expressions Of Very Few Genes", International Journal Of Computer Applications, Vol.14, No.4, 201.
[15] Santanu Ghorai, Anirban Mukherjee, Sanghamitra Sengupta, And Pranab K. Dutta, " Cancer Classification From Gene Expression Data By NPPC Ensemble", IEEE/Acm Transactions On Computational Biology And Bioinformatics, Vol. 8, No. 3, May/June 2011.
[16] J. Li and H. Liu, “Kent Ridge Biomedical Data Set Repository,” http://sdmc-lit.org.sg/GEDatasets, 2002.
[17] A. Schwaighofer, “SVM MATLAB Toolbox,” http://www.cis.tugraz.at/igi/aschwaig/svm_v251.tar.gz, 2001.
[18] S. Gunn, “SVM MATLAB Toolbox,” http://www.isis.ecs.soto n.ac.uk/resources/svminfo/, 2001.
[19] Feng Chu and Lipo Wang, “Applying Rbf Neural Networks To Cancer Classification Based On Gene Expressions,” International Joint Conference on Neural Networks, July 16-21,2006.
[20] J. Devore, and R. Peck, Statistics: the Exploration and Analysis of the Data.3rd edition, Pacific Grove, CA: Duxbury Press, 1997.
[21] V. G. Tusher, R. Tibshirani, and G. Chu, “Significance analysis of microarrays applied to the ionizing radiation response,” Proc. Natl. Acad. SCI. USA, vol. 98, Pp. 5116-5121, 2001.
[22] U. Scherf, D. Ross, M. Waltham, L. Smith, J. Lee, L. Tanabe, K. Kohn, W. Reinhold, T. Myers, D. Andrews, D. Scudiero, M. Eisen, E. Sausville, Y. Pommier, D. Botstein, P. Brown, and J. Weinstein, “A Gene Expression Database for the Molecular Pharmacology of Cancer,” Nature Genetics, vol. 24, Pp. 236-44, 2000.
[23] Peng, F. long, and C. Ding, “Feature Selection on Mutual Information: Criteria of Max-Dependency, Max-Relevance, and Min-Redundancy,” IEEE Trans. Pattern Analysis and Machine Intelligence, vol. 27, no. 8, Pp. 1226-1238, Aug. 2005.
[24] O. Troyanskaya et al., “Missing Value Estimation Methods for DNA Microarrays,” Bioinformatics, vol. 17, Pp. 520-525, 2001.
[25] Liver cancer dataset (http://genome-www.stanford. edu/hcc/):
[26] Brown MPS, Grundy WN, Lin D, Cristianini N, Sugnet CW, Furey TS, Ares M Jr, Haussler D, “Knowledge-based analysis of microarray gene
P Rajeswari et al, Int. J. Comp. Tech. Appl., Vol 2 (5), 1523-1533
IJCTA | SEPT-OCT 2011 Available [email protected]
1532
ISSN:2229-6093
expression data by using support vector machines”, Proc Nat Acad Sci USA, Vol 97, pages 262-267, 2000.
[27] Zainuddin. Z and Pauline. O, "Improved wavelet neural network for early diagnosis of cancer patients using microarray gene expression data", International Joint Conference on Neural Networks, 2009. IJCNN 2009.
[28] Osareh. A and Shadgar. B, "Microarray data analysis for cancer classification", 5th International Symposium on Health Informatics and Bioinformatics (HIBIT), 2010.
[29] Jinn-Yi Yeh, Tai-Shi Wu, Min-Che Wu and Der-Ming Chang, "Applying Data Mining Techniques for Cancer Classification from Gene Expression Data", International Conference on Convergence Information Technology, 2007.
[30] Kai-Lin Tang, Wei-Jia Yao, Tong-Hua Li, Yi-Xue Li And Zhi-Wei Cao, “Cancer Classification From The Gene Expression Profiles By Discriminant Kernel-Pls”,Journal Of Bioinformatics And Computational Biology,Vol.8,Suppl.1(2010) 147-160.
[31] Manuel Martin-Merino and Javier de las Rivas, "Kernel Alignment k-NN for Human Cancer Classification Using the Gene Expression Profiles", Springer link, Artificial Neural Networks – ICANN 2009.
[32] Xin Jin, Anbang Xu, Rongfang Bie and Ping Guo, "Machine Learning Techniques and Chi-Square Feature Selection for Cancer Classification Using SAGE Gene Expression Profiles", Springerlink, Data Mining for Biomedical Applications, 2006.
[33] Dimitris Maroulis, Dimitris Iakovidis, Ilias Flaounas and Stavros Karkanis, "A gene expression analysis system for medical diagnosis", IFIP International Federation for Information Processing, 2006.
[34] Zhenyu Wang and Palade. V, "A Comprehensive Fuzzy-Based Framework for Cancer Microarray Data Gene Expression Analysis", Proceedings of the 7th IEEE International Conference on Bioinformatics and Bioengineering, 2007.
[35] Huang. D, Chow. T.W.S, Ma. E.W.M and Jinyan Li, " Efficient selection of discriminative genes from microarray gene expression data for cancer diagnosis", IEEE Transactions on Circuits and Systems, 2005.
[36] Y. Ireaneus Anna Rejani, Dr.S. Thamarai Selvi, “Early Detection of Breast Cancer Using SVM Classifier Technique”, International Journal on Computer Science and Engineering Vol 1, Issue 3, pages 127-130, 2009.
[37] Mu, T.; Nandi, A.K.; “Detection of breast cancer using v-SVM and RBF networks with self organized selection of centers”, The 3rd IEE
International Seminar on Medical Applications of Signal Processing, pages 47 – 52, 2005.
[38] Osareh, A.; Shadgar, B.; “Machine learning techniques to diagnose breast cancer”, 5th International Symposium on Health Informatics and Bioinformatics (HIBIT), pages 114 – 120, 2010.
P Rajeswari et al, Int. J. Comp. Tech. Appl., Vol 2 (5), 1523-1533
IJCTA | SEPT-OCT 2011 Available [email protected]
1533
ISSN:2229-6093