Embed Size (px)
Citation preview
A Superimposition Method for Small
Ligand Molecules: Implementation and
Application
Den Naturwissenschaftlichen Fakultäten
der Friedrich-Alexander-Universität Erlangen-Nürnberg
zur
Erlangung des Doktorgrades
vorgelegt von
Alexander von Homeyer
aus Nürnberg

Als Dissertation genehmigt von den
Naturwissenschaftlichen Fakultäten der Universität Erlangen-Nürnberg
Tag der mündlichen Prüfung: 11.06.2007
Vorsitzender
der Promotionskommission: Prof. Dr. D.-P. Bänsch
Erstberichterstatter: Prof. Dr. J. Gasteiger
Zweitberichterstatter: Prof. Dr. T. Clark

The studies in this work were carried out on suggestion of Prof. Dr. Gasteiger at the
Computer-Chemie-Centrum and the Institute for Organic Chemistry of the Friedrich-Alexander
University Erlangen-Nürnberg.
First of all I would like to thank my supervisor Prof. Dr. Johann Gasteiger for giving me the
opportunity to join his group. This work would not have been possible without his support.
Furthermore, my special thanks go to Martin Reitz, Dr. Lothar Terfloth, Dr. Thomas Kleinöder,
Dr. Christof Schwab und Ulrike Burkard for many scientific discussions.
Many thanks go to the people who supported me in programming problems as Dr. Thomas
Kleinöder, Dr. Lothar Terfloth, Thomas Tröger, Dr. Achim Herwig, Dr. Jörg Wegner and Markus
Hemmer. Special thanks in this regard go to Georg Hager for his help in development for parallel
computers and Jörg Marusczyk for his help in the development of a graphical user interface.
Without a stable working environment the studies of this work would not have been possible. I am
grateful to the administrators of the UNIX and Windows operating systems: Dr. Achim Herwig,
Martin Reitz, Dr. Markus Sitzmann, Dr. Lothar Terfloth, Dr. Thomas Kleinöder, Dr. Yongqan Han,
Vladimir Sykora, Jörg Marusczyk, Dr. Alexei Tarkhov, Dr. Oliver Sacher, Dr. Frank Oellien and
Dr. Wolf-Dietrich Ihlenfeldt.
I would also like to thank my colleagues Dr. Lothar Terfloth, Dr. Achim Herwig, Dr. Frank
Oellien and Dr. Oliver Sacher when assistance was necessary concerning problems with the
administration of the data backup system.
I am also grateful to our secretaries Angela Döbler, Ulrike Scholz, Karin Holzke and Carolin
Hidalgo for help with administrative issues.
Also, thanks to all the other colleagues, who contributed to a pleasant work atmosphere.
Futher, I would like to thank Elsevier MDL for the provision of the MDDR-05.1 (MDL® Drug
Data Report) database.
Finally, I gratefully acknowledge the financial support of this work through the projects SOL
(Search and Optimization of Lead Structures) funded by the Bundesministerium für Bildung und
Forschung (BMBF), SFB 583 (Redoxaktive Metallkomplexe - Reaktivitätssteuerung durch
molekulare Architekturen) funded by the Deutschen Forschungsgemeinschaft (DFG), TEMBLOR
(The European Molecular Biology Linked Original Resources) funded by the European Union and
KONWIHR (Kompetenznetzwerk für Technisch-Wissenschaftliches Hoch und
Höchstleistungsrechnen in Bayern) funded by the state of Bavaria.

Nothing in biology makes sense except in the light of evolution.
Theodosius Dobzhansky, The American Biology Teacher, 35, 1973

Dedicated to my wife Monika, my son Nicolas and to my parents


Contents
i
Contents
1 INTRODUCTION 7
1.1 LIGAND-BASED DESIGN AS A MOTIVATION 7
1.2 3D MAXIMUM COMMON SUBSTRUCTURE 9
1.3 OBJECTIVE AND OUTLINE 11
2 GENETIC ALGORITHMS AND THEIR APPLICATIONS IN CHEMISTRY 13
2.1 BIOLOGICAL MOTIVATION 13
2.2 CLASSIFICATION 15
2.3 ENCODING 16
2.4 SELECTION 16
2.5 CROSSOVER 17
2.6 MUTATION 17
2.7 NEW TECHNIQUES 18
2.8 APPLICATIONS IN CHEMISTRY 19
2.8.1 Conformational Search and Structure Optimization 20
2.8.2 Protein-Ligand Docking 21
2.8.3 De Novo Molecular Design 22
2.8.4 Pharmacophore Perception and Pseudoreceptor Modeling 23
2.8.5 Chemical Structure Handling 25
2.8.6 Processing of 3D Chemical Graphs 26
2.8.7 QSAR 27
2.8.8 Combinatorial Libraries 28
2.8.9 Structure Prediction of Biological Macromolecules 29
3 STATE OF THE ART IN SMALL MOLECULE ALIGNMENT 32
3.1 INTRODUCTION 32
3.2 CLASSIFICATION OF SMALL MOLECULE SUPERIMPOSITION METHODS 32
3.3 RIGID ALIGNMENT METHODS 33
3.4 SEMIFLEXIBLE ALIGNMENT METHODS 35
3.5 FLEXIBLE ALIGNMENT METHODS 38
4 MATERIALS AND METHODS 42
4.1 USED HARDWARE AND DEVELOPMENT TOOLS 42
4.2 CLUSTERING PARAMETERS OF PHYSICOCHEMICAL PROPERTIES 43
4.3 AMINO ACID SEQUENCE DATABASE 43
4.4 MULTIPLE SEQUENCE ALIGNMENT 44
4.5 RETRIEVAL OF PROTEIN-LIGAND COMPLEXES 45
4.6 HYDROGEN ATOM ADDITION 46

Contents
ii
4.7 3D STRUCTURE GENERATION 46
4.8 CALCULATION OF PHYSICOCHEMICAL PARAMETERS 46
4.9 BIOPATH DATABASE 48
4.10 A DATABASE OF DRUGLIKE COMPOUNDS 49
4.11 VISUALIZATION OF MOLECULAR STRUCTURES 49
5 GAMMA: A SUPERIMPOSITION METHOD FOR FLEXIBLE MOLECULES 50
5.1 OVERVIEW OF THE HYBRID GENETIC ALGORITHM 50
5.2 GENETIC DATA STRUCTURE 52
5.2.1 A Chromosome Encoding a Match Lists of Atoms 52
5.2.2 A Chromosome Encoding Torsion Angles 53
5.3 GENETIC AND NON-GENETIC OPERATORS 54
5.3.1 Crossover 54
5.3.2 Mutation 55
5.3.3 Creep and Crunch 56
5.3.4 Automatic Adaptation of Operator Probabilities 57
5.3.5 Selection 57
5.4 THE FITNESS FUNCTION 60
5.4.1 The Fitness Function Defined by a Linear Combination 60
5.4.2 Multi-Objective Fitness Function 63
5.4.3 Modified Distance Parameter 65
5.4.4 Pareto Front Exploration 66
5.5 CLOSE CONTACT CHECK 67
5.6 MATCHING THE CONFORMATIONS – THE DIRECTED TWEAK 68
5.7 CALCULATION OF VALUES FOR RANGES OF MATCHING CRITERIA 69
5.8 STOPPING CRITERIA FOR THE GENETIC ALGORITHM 74
5.9 PARALLELIZATION OF THE GENETIC ALGORITHM 75
5.10 CALCULATION OF RING CONFORMATIONS 81
6 APPLICATIONS 83
6.1 MOLECULAR SUPERIMPOSITIONS IN THE ABSENCE OF THE RECEPTOR 3D STRUCTURE 84
6.1.1 Introduction 84
6.1.2 Computational Methods 84
6.1.3 Results 86
6.1.4 Discussion 92
6.2 VALIDATION STUDY USING CRYSTALLOGRAPHIC DATA 93
6.2.1 Introduction 93
6.2.2 Generating the Datasets 94
6.2.3 Ligand Alignments Using GAMMA 97

Contents
iii
6.2.4 Herpes Simplex Virus Type 1 Thymidine Kinase 99
6.2.5 Streptavidin 104
6.2.6 Dihydrofolate Reductase 110
6.2.7 Thrombin 120
6.2.8 Estrogen Receptor α 126
6.2.9 Penicillopepsin 132
6.2.10 Overview of the Results 139
6.2.11 Discussion 141
6.3 COMPARISON OF DIFFERENT SUPERIMPOSITION CRITERIA APPLIED TO TRANSITION STATE INHIBITORS
143
6.3.1 Introduction 143
6.3.2 Computational Methods 146
6.3.3 Results and Discussion 151
6.3.4 Conclusions 157
6.4 LIGAND-BASED VIRTUAL SCREENING OF A DRUG DATABASE 158
6.4.1 Overview of Virtual Screening 158
6.4.2 Calculation of Enrichment Factors 161
6.4.3 Computational Methodology 161
6.4.4 Results and Discussion 168
6.4.5 Conclusions 181
6.5 ADDRESSING RING FLEXIBILITY 182
6.5.1 Introduction 182
6.5.2 Tropacocaine 183
6.5.3 Staurosporine 186
6.5.4 Pethidine 188
6.5.5 M77 and IQP 190
6.5.6 Discussion 192
7 CONCLUSIONS AND OUTLOOK 194
SUMMARY 197
ZUSAMMENFASSUNG 200
BILBLIOGRAPHY 203
APPENDIX 225
A. PROGRAM DESCRIPTION OF GAMMA 2.7 225
Starting the Graphical User Interface 225
Selecting a Structure Input File 226

iv
Starting the Calculation 227
Visualizing the Results 227
Batch Mode Execution 230
B. ANNOTATION OF THE SOURCE CODE OF GAMMA 236
C. OVERVIEW OF SUPERIMPOSITION APPROACHES 240
D. PUBLICATIONS 244
E. CURRICULUM VITAE 245

Abbreviations
v
Abbreviations
2D Two-dimensional
3D Three-dimensional
3D-MCSS Three-dimensional maximum common substructure
CA Carbonic anhydrase
C@ROL Compound Access & Retrieval On Line
CoMFA Comparative molecular field analysis
CoMSIA Comparative molecular similarity indices analysis
CORINA Coordinates
COX Cyclooxygenase
EA Evolutionary algorithm
ER Estrogen receptor
GA Genetic algorithm
GAMMA Genetic Algorithm for Multiple Molecule Alignment
HAC Hydrogen bond acceptor
HDO Hydrogen bond donor
HSV Herpes simplex virus
HTS High-throughput screening
LGA Lamarckian genetic algorithm
LRS Linear ranking selection
MC Monte carlo
MCSS Maximum common substructure
MTX Methotrexate

Abbreviations
vi
MW Molecular weight
NSAID Non-steroidal anti-inflammatory drug
PDB Protein data bank
PEOE Partial Equalization of Orbital Electronegativities
PETRA Parameter Estimation for the Treatment of Reactivity Applications
QSAR Quantitative structure-activity relationship
QSPR Quantitative structure-property relationship
RMS Root mean-square
ROF Rule of five
RTB Rotatable Bonds
RTS Restricted tournament selection
SA Simulated annealing
TK Thymidine kinase
TS Tabu search
VS Virtual screening

1.1 Ligand-based Design as a Motivation
7
1 Introduction
1.1 Ligand-based Design as a Motivation
Today, the pharmaceutical industry is confronted with a decline in the number of new drugs.
Increased costs and changes in therapeutic standards enlarged the time scale to bring a new
drug into the market (1,2). In 2001 the costs to develop a new drug ran up to $800 million. This
led to the understanding that the drug discovery pipeline has to be improved by faster, cheaper
and safer development methods in the preclinical drug discovery process.
On the other hand, the last decades have witnessed a technological revolution in molecular
biology and information technology that offer new opportunities for more rational approaches
in drug design. The human genome project is completed and also sequencing projects of other
organism’s genomes are finishing. We have about 30000 genes in the human genome but the
druggable genome is limited to between 2000 and 3000 proteins with some precedent for
binding a drug-like molecule (3,4). Now, a repertoire is at hand for structural elucidation
methods like X-ray and NMR technologies. As also the computing power increased the
development of computational approaches to use information from structure elucidation was
moved along.
As a consequence of the decrease in the number of drugs on the one hand and the
development of the new methodologies on the other hand a more rational approach is now
chosen in research and development. In today’s drug design new methodologies from
bioinformatics and chemoinformatics are claiming their place due to developments in
genomics, proteomics, combinatorial chemistry, automated high-throughput screening (HTS),
molecular modeling software and increased computing power.
Rational in silico drug design can be done in two ways: ligand-based or structure-based. With
the availability of the 3D structure of a biological target it is feasible to use a structure-based
approach to evaluate and predict the binding mode of a ligand within the active site of the
receptor with docking methods. In cases when no 3D structural information about target
proteins with their receptor site is available ligand-based design is applied. The ligand-based
approach starts with a group of ligands binding to the same receptor with the same
mechanism. Today four different strategies based on the prior knowledge of the targets 3D
structure and the ligands binding to it are predominant (Table 1).

1.1 Ligand-based Design as a Motivation
8
Table 1: Strategies for rational drug design depending on the prior knowledge of the structural
information of the macromolecular target and of its ligands.
Ligands unknown Ligands known
Receptor structure unknown combinatorial chemistry,
high-throughput screening
3D-MCSS, QSAR,
pharmacophore models,
similarity search
Receptor structure known de novo design,
receptor-based 3D searching
structure-based design,
docking
In the first case, when there is no protein 3D structure available and no ligands are at hand, it
is possible to create substance libraries with combinatorial chemistry or to use HTS to search
in real substance libraries for candidates. Secondly, if a protein 3D structure is at hand but no
ligands are available that bind, then the de novo design of ligands is a plausible choice. In de
novo design compounds are constructed within the receptor site. If there is no protein 3D
structure disposable but a set of ligands is available from which it is known that they interact
with the protein then it is possible to identify a pharmacophore. Finally, in the case when both
are at hand, a protein 3D structure and its ligands, structure-based design can be used. This
includes docking or structure-based virtual screening.
Despite the rapidly developing field of 3D structure determination of biopolymers, it is still
frequently the case that the structure of a therapeutically relevant target is unknown.
Moreover, many proteins can never be crystallized or their structure will dramatically change
when taken out of their natural environment, such as membrane proteins. In this situation,
methods of rational drug design that try to identify putative similarities between sets of
bioactive molecules are valuable alternatives. Therefore, it is tried to superimpose ligands to
approximate their binding geometry in the macromolecular targets active site. A prerequisite
is that the ligands bind to the same receptor with the same mechanism. Because ligands adopt
a spatial orientation of physicochemical features in a way that receptor binding is
accomplished the conformational space has to be sampled to find the bioactive conformation.
By calculation of the structural requirements of the ligands it is possible to draw conclusions

1.2 3D Maximum Common Substructure
9
on the spatial requirements of the binding pocket. The ligand-based approach can then be used
for 3D-QSAR, pharmacophore elucidation, receptor modeling or database searching. Popular
statistical techniques in 3D-QSAR are CoMFA (Comparative Molecular Field Analysis) (5)
and COMSIA (6). A pharmacophore defines the spatial arrangement of key chemical features,
such as hydrogen-bonding sites, hydrophobic and electrostatic interaction sites that are
recognized by a receptor. Handling of the conformational flexibility is the most challenging
task in pharmacophore generation since the active conformations of the molecules are usually
unknown. Ligands rarely bind in their lowest energy conformation. A study on protein-ligand
complexes showed that over 60% of the ligands do not bind in a local energy minimum
conformation (7).
1.2 3D Maximum Common Substructure
A possible similarity measurement between molecules to be superimposed is the 3D maximum
common substructure (3D-MCSS). The common substructure of the molecules to be
compared consists of the largest structural fragment that they have in common when
compared in space. The larger the 3D-MCSS the larger the similarity of the compounds and
the more probable it is that they have a similar biological activity.
Most of the algorithms predating 1990 to search for the largest common 3D-MCSS were
based on one individual, rigid conformation for each compound, without considering
conformational flexibility (8,9,10). Finding the MCSS took usually place via interatomic
distance comparison. The first detailed study on such distance-based methods to search for
three-dimensional similarities was published 1991 by Pepperrell and Willett (11). Further
possibilities for the computation of three-dimensional similarities result from angle-based (12,13) and fragment-based methods, described by Fisanick et al. (14).
If the similarity of the two compounds atorvastatin, 1, and fluvastatin, 2, (Figure 1) is
analyzed via identifying the 3D-MCSS, then one determines that only certain atoms of the
molecules are part of this common substructure.

1.2 3D Maximum Common Substructure
10
1
OH
OOHOH
F
N
NH
O
2
OH
OOHOH
N
F
3 OH
O
S
OHO
CoA
Figure 1: The molecular structures of the three
molecules atorvastatin, 1, fluvastatin, 2, and
3-hydroxy-3-methyl-glutaryl-CoA (HMG-CoA),
3.
One part of the 3D-MCSS which is represented by spheres in Figure 2A comprises an
HMG-like moiety. HMG-CoA (3-hydroxy-3-methylglutaryl-coenzyme A), 3, is an
intermediate product in cholesterol biosynthesis and is processed by the enzyme HMG-CoA
reductase. Both atorvastatin and fluvastatin are HMG-CoA reductase inhibitors.
A
B
Figure 2: The superimposition of the bioactive conformations of 1 and 2 is depicted in A and B.
The 3D-MCSS comprises 24 atoms that are marked as spheres in B.

1.3 Objective and Outline
11
The found substructure has a high probability to comprise the pharmacophore, which is able
to trigger a biological effect. To assess the similarities between the molecules a distance
measure is needed. The root mean square (RMS) deviation is used to judge the distances of
the matched atoms in the 3D-MCSS and, therefore, the quality of the resulting alignment.
1.3 Objective and Outline
A method is presented that applies a hybrid genetic algorithm (GA) to determine the
3D-MCSS. It is based on preliminary work of M. Wagener (15) and S. Handschuh (15,16) that
allows one to compare chemical structures through molecular superimpositions by matching
corresponding atoms. Originally, this method was developed for the constitutional
comparison of two compounds. The structural overlays were computed based on the topology
of a molecule. Afterwards, the method was extended for the flexible treatment of pairs and
sets of three-dimensional structures of molecules.
The computationally expensive task to determine a 3D-MCSS by flexible superimposition of
ligand compounds is solved by a genetic algorithm, an optimization method that imitates the
adaptation methods of nature. Genetic algorithms are robust optimization methods that are
based on the principles of genetics and natural selection (17,18). They are efficient for
applications with a large search space and can be applied for problems where systematic
search algorithms will fail (19,20). Because a GA is not based on a deterministic procedure, the
optimization does not necessarily arrive at the optimum solution. In order to alleviate this
problem, an additional method, the directed-tweak (21) procedure, was implemented to match
the conformations of the molecules to be overlaid. A major goal of this hybrid procedure is to
adequately address the conformational flexibility of ligand molecules. The presented method
uses different physicochemical properties in the 3D-MCSS search to differentiate the atoms to
be matched.
One of the aims of this work was to extend the hybrid method and to optimize the usability
for screening and high-throughput purposes so that the 3D-MCSS search can be applied to
large databases. Another objective was to develop new methodologies to allow flexibility of
ring systems. To accomplish this the method was extended by implementing new features like
the selection of one best Euclidean compromise solution out of a set of Pareto optimal

1.3 Objective and Outline
12
solutions originating from the Pareto selection, the automatic calculation of cutoff values for
chemical features that define ranges in which atoms are allowed to match with each other, the
generation of ring conformations using the 3D structure generator CORINA (22) in a library
version and the parallelization of the serial genetic algorithm using an island model allowing
for the exchange of genetic information between different parallel processes. The different
methodologies were then tested with different datasets. First, superimpositions were
performed using ligands of membrane-associated receptors for which no structural
information is available. Two examples of ligands of membrane spanning G-protein-coupled
receptors (GPCRs) were selected, specifically ligands of the 5-HT1B /5-HT1D and the AT1
receptors. Another aim is to compare the calculated alignments of the hybrid GA with
experimental superimpositions and the predicted conformation of the test molecules with the
bioactive conformations found in protein-ligand complexes. The molecular superimpositions
are performed with inhibitors of the herpes simplex type 1 thymidine kinase, ligands that bind
to streptavidin and dihydrofolate reductase, inhibitors of thrombin, antagonists of the estrogen
receptor α and finally penicillopepsin binding ligands. In a third study, transition state
inhibitors of the arginase II are used to compare to what extent different matching criteria
such as physicochemical properties or the enforced match of predefined atoms influence the
superimposition results. In another study, the parallel version of the hybrid GA is used for
screening a database of flexible, drug-like molecules to show that GAMMA can preferentially
select compounds from a virtual library that have the same activity as the rigid query
molecule. Celecoxib is used to screen for cyclooxygenase-2 (COX-2) inhibitors and diazepam
to search for benzodiazepines. The aim of the last study is to test the generation of ring
conformations applying a library version of the 3D structure generator CORINA. This method
is tested with the compounds tropacocaine, staurosporine, pethidine and ligands of the cAMP-
dependent protein kinase A with ring systems not being in a low-energy conformation.
In the next chapter a more detailed introduction to evolutionary algorithms and their different
applications in several fields of chemistry is provided. Chapter three gives an outline of
different approaches that handle the superimposition problem applying different algorithms.
Chapter four summarizes the material and methods that were applied for the development and
for the studies in this work. A detailed description of the program GAMMA and the
underlying hybrid algorithm is given in chapter five. Subsequently, chapter six discusses
different applications of the presented method and the achieved results.

2.1 Biological Motivation
13
2 Genetic Algorithms and their Applications in
Chemistry
Genetic algorithms (GAs) are a subclass of evolutionary algorithms (EAs). A GA is a
stochastic search method that is inspired by the basic principles of natural selection and
genetics. GAs have successfully been applied to solve problems within fields that have a high
dimensionality, a strong non-linearity, that are non-differential or noisy and NP-complete. An
EA imitates the adaptation mechanism of a population of individuals to a changing
environment.
The capabilities of biological systems for self-preservation combined with species strategies
for surviving and the development of complex structures for problem solution through
evolution has highly influenced the implementation of new algorithmic techniques. Many of
the applications in the field of chemistry possess a search space that is exponentially
proportional to the problem dimension with the consequence that they cannot be solved by
exhaustive search methods. Multidimensional search spaces and problems that are NP-
complete can be better explored by heuristic techniques.
New developments do not just use pure EA principles but fuse them with other optimization
techniques like Monte Carlo (MC), Tabu Search (TS), simulated annealing (SA), neural
networks or fuzzy computing to increase program effectiveness. For such combinations, the
evolutionary search serves as a global screening technique for detecting a set of results which
can then be refined by local optimization to acquire the final solution.
2.1 Biological Motivation
A GA is a stochastic search method that is inspired by the basic principles of Darwinian
evolution and by DNA-like genetics. Evolution means that the stock of genes of a species
changes over the sequence of generations and this change optimizes the adaptation of the
carriers to their environment. The mechanism of adaptation was postulated to be the natural
selection first mentioned by Darwin. Individuals breed far more offspring to be able to survive
with the restricted natural resources which leads to ecological competition and, therefore, to
selection pressure. The offspring generations differ in their genetic attributes from each other
as well as from those of their parents. This variance is caused by the two genetic mechanisms

2.1 Biological Motivation
14
mutation and crossover. In a struggle for life only the best-adapted individuals with the
highest fitness will survive - often termed survival of the fittest - and bring their genetic
information into the next generation.
Figure 3: Flow diagram of an evolutionary algorithm. P(t) is the population in generation t, P'(t) is a
subpopulation whose individuals are selected from P(t) for interbreeding. P(t+1) is the population in
the next generation t+1 generated from P(t) and/or P'(t). For the next generation P(t+1) will be the new
P(t).
EAs (Figure 3) have in common the treatment of potential solutions for a given computational
problem as members of populations. At the beginning of the computation a random initial
population, P(0), is generated. The individuals represent discrete points in the search space
and vary in their fitness and adaptation to the problems' solution. For each generation, t, the
individuals in the current population, P(t), are evaluated, ranked according to their fitness and

2.2 Classification
15
subjected to selection pressure. The chromosomes of the survivors are the targets for the
application of genetic operators that may include mutation, crossover, or both. These newly
bred children represent the members of the resulting population, P(t+1). The optimization
proceeds for a fixed number of iterations or until convergence is detected within the
population.
2.2 Classification
EAs, like random search and simulated annealing (SA), are a subclass of stochastic methods
which contain a component of randomness in their algorithmic procedure. Therefore, they
stand in contrast to deterministic processes which aim to locate the optimal solution by
systematically moving through the search space. To be qualified as an EA, an algorithm
should be population-based and some form of selection should be used to manipulate this
population. The first criterion is a characteristic that differentiates an EA from the individual-
based SA. The main algorithms combined under the term evolutionary algorithm or
evolutionary computation are genetic algorithms (GA), evolutionary programming (EP),
evolution strategies (ES), genetic programming (GP) and, finally, classifier systems (CFS)
(Figure 4).
Figure 4: Classification of evolutionary algorithms.

2.3 Encoding
16
The development of EAs can be traced back to the late 1950's and the early 1960's when
computer scientists in Europe and the US independently developed different methods
simulating Darwinian principles. One of the first papers in this field was published by Alex
Fraser in 1957 (23,24). Fraser used a crossover operator to evolve a population of binary strings.
The development of the underlying principles of GAs originally started in 1962 by John
Holland (25) and colleagues at the University of Michigan with the aim to study cellular
automata. The techniques were summarized by Holland (26) in 1975 and then thoroughly
reviewed and enhanced by Goldberg (27). The research on GAs stayed mainly theoretical with
only few applications until the early 1980s. From then on, however, they spread through a
large range of disciplines like science, engineering, and the business world.
2.3 Encoding
The individuals as the phenotype describe possible solutions of the problem and have to be
encoded in a certain manner. The data structure is realized in the form of chromosomes which
consist of a collection of coding units that are referred to as genes. Taken together, all
chromosomes represent the genome of the individual. In its original form a GA encodes the
attributes of an individual as a fixed-length bit string. The binary encoding is, however, often
inappropriate for many problems. Thus, in the last few years the coding has been extended to
non-binary representations that use integer, real-valued or matrix structures as chromosomes.
2.4 Selection
The Darwinian principle of survival of the fittest is realized by selecting individuals based on
computed fitness scores. Fitter individuals are more likely to be selected while less fit
individuals are omitted. The calculation of fitness scores gives each individual in the
population a reproduction probability depending on its own objective value and the objective
values of all the other individuals. A GA uses usually stochastic selection mechanisms with
roulette wheel selection being most commonly applied. First, each individual receives a
segment on a roulette wheel that has a size proportional to its fitness and then random
positions on the wheel are chosen. A problem associated with this kind of selection

2.5 Crossover
17
mechanism is that too strong a selection pressure can lead to premature convergence to local
optima. To circumvent this problem one can use an individual's rank rather than its actual
fitness. Another model is tournament selection that takes randomly selected population
members for competing against each other. The competition winners will create the next
generation. Another method is the elitism strategy that copies only the best candidate
solutions unchanged to the next population.
2.5 Crossover
The genetic operator crossover takes two parent chromosomes and recombines their genes
with a probability, Pc, to produce one or more offspring chromosome that has features of both
parents. The occurrence of crossover can take place either as one-point, multi-point or uniform
crossover. One-point-crossover is the simplest form, which breaks both chromosomes at
arbitrarily selected points and exchanges all parameter values on one side of the cut of the
first chromosome with the parameter values on the other side of the second chromosome and
chains them together. Multi-point crossover selects two or more random intersection points in
both chromosomes to swap the genes. Uniform crossover randomly determines for every
single genomic element on the chromosome whether the values have to be exchanged or not.
GAs use crossover as the primary operator prior to mutation recombining a pair of bit strings
to produce a new pair of bit strings. The cutting point on the chromosomes of the parents is
chosen by chance without respect to the boundaries of genes. This is in contrast to GAs using
real- and integer-coding where the breakpoints lie between these real or integer values.
2.6 Mutation
The mutation operator sets one or more genes or genome elements in the parent genome to a
different value with a certain probability, Pm, for each locus, thereby providing a new
individual. GAs use mutation as the secondary operator applied after crossover. GAs that
encode the attributes in a binary bit string use mutation to invert a bit on a string either from
"0" to "1" or "1" to "0". The consequence of this mutation is the generation of a new allele of
the ancestor's gene in the descendant's chromosome. In GA variations using integer- or real-
coded strings, the numbers on the string are replaced by a new random value within a

2.7 New Techniques
18
predefined range. One disadvantage of the binary encoding scheme is that the decoded genes
can generate attributes that show high impact on their candidate solutions when high-order
bits are exchanged. Gray coding is another mechanism to encode data in a binary mode that
encodes adjacent values so that they differ by only one bit. This results in smaller impact on
the encoded phenotype.
2.7 New Techniques
The no free lunch theorem (28) points out that efficient optimization techniques involving
knowledge concerning the task are likely to outperform a "black-box" implementation. Hence,
it can be concluded that a more problem specific approach could be more successful. An
example is the application of problem-specific operators tailored to the problem domain.
Examples for such operators could be insertion and deletion to add or remove genetic
information in chromosomes or a translocation operator to move genetic information from
one chromosome to another. In the method presented in this work for the superimposition of
several 3D structures, two knowledge-augmented operators called creep and crunch are
applied. Creep leads to a larger maximum common substructure by adding a matching pair of
atoms to the match list taking into account restrictions imposed by the geometry of the
molecules. Crunch acts as an antagonist to the creep operator reducing the number of atom
pairs in the substructure which are responsible for bad geometric distance parameters. This
operation should help the search to avoid becoming trapped in local minima during the
optimization process.
Search problems often have multiple objectives that have to be optimized simultaneously and
which are often contradictory. A separate class of EAs, called multiobjective EAs (MOEA),
has been developed to solve such jobs. An example of a multiobjective optimization problem
(MOP) in chemistry is the search for the maximum common substructure (MCSS or MCS). In
this case, two conflicting criteria must be optimized: the number of matching atoms in the
substructure has to be maximized, whereas the deviations in the coordinates of the
superimposed molecules must be minimized. It is clear that these criteria are conflicting
because the more the substructure increases the more decreases the geometric fit. An optimum
must be found that takes both criteria into account. As a solution it was proposed to use Pareto
optimality whereby for each possible size of the common substructure an optimal geometric

2.8 Applications in Chemistry
19
fit is produced (15,16). A solution exists if there are no other superimpositions that have better
or at least equivalent values for one or more of the two criteria. Another application using the
Pareto technique is the program MoSELECT for combinatorial library design using a
framework called MOGA (MultiObjective Genetic Algorithm) (29). The aim was to overcome
the limitations of the weighted-sum method to handle multiple objectives such as diversity,
physicochemical properties or drug-likeness.
Even though EAs are able to find good solutions for a broad range of optimization problems
in acceptable time scales, the computing time grows fast if they are applied to harder and
larger problems. Therefore, much effort has been invested to speedup the algorithm through
parallelization. Three main implementation techniques, as suggested by Cantú-Paz (30), will be
discussed in this section. The first category is the global single-population master-slave GA
that works on a single panmictic population, but the evaluation of fitness is distributed among
several processors. The second group is the single-population fine-grained GAs that is applied
on massively parallel computers. The population is divided into a large number of small
subpopulations, so-called demes, with ideally only one individual per processing unit.
Interbreeding and selection is realized only between small neighborhoods, but since the
neighborhoods overlap a good solutions can spread across the entire population. The third
class is called the multi-deme, coarse-grained or distributed GAs which is the most widely
used method. The population is divided into subpopulations the difference to the fine-grained
GAs being that the number of demes is smaller. The exchange of individuals between the
subpopulations is managed through a migration operator. The coarse-grained variant
differentiates between two models to organize the migration. The unrestricted migration
topology allows migration between any two subpopulations and the stepping stone or ring
model allows migration only between neighboring subpopulations. A quasi course-grained
model was chosen for the parallelization of the docking program AUTODOCK 3.0 by
Thormann et al. (31).
2.8 Applications in Chemistry
EAs have become very popular in chemoinformatics. A comprehensive overview of
applications of EAs in molecular design is given by Clark (32) in the form of a compilation of

2.8 Applications in Chemistry
20
articles. A review on EAs and their application in different research areas in computational
chemistry is given in (33).
2.8.1 Conformational Search and Structure Optimization
One of the first application areas where EAs were used for in chemistry is the search for
conformations of the structure of small molecules at a potential energy minimum.
A GA-based method has been designed by Nair and Goodman (34) for searching the
conformations of linear alkanes. The chromosomes consisted of real number representations
of the dihedral angles of the compounds. The fitness of a candidate solution was scored by the
energy of a force field. A criterion was defined based on the torsion angles to assure that the
population consisted of a diverse set of structures.
Hartke (35) applied a modified GA to the geometry optimization of Lennard-Jones clusters up
to 150 atoms using a phenotype algorithm that acts directly on the clusters themselves. The
geometries of the clusters were locally optimized via a quasi-Newton method. An additional
operator called directed mutation for reducing isolated faults that still existed in the final
phase of the algorithm was introduced. To prevent an individual to dominate the whole
population niching was used. Niching mimics the idea of ecological niches that divides a
population into several subpopulations.
Mekenyan et al. (36) employed a GA to generate a small collection of most diverse conformers
with the aim of an optimal coverage of the conformational space under potential energy
constraints. The fitness of a candidate solution is quantified by the 3D dissimilarity or
similarity of its conformers to all other solutions in the population.
Jin et al. (37) used three different GA programs for the identification of low-energy conformers
of the endogenous opioid [Met]-enkephalin pentapeptide with no a priori structural
information. A binary bit string chromosome was used that encodes each torsion angle by an
eight-bit string.
2.8 Applications in Chemistry
21
2.8.2 Protein-Ligand Docking
Another important aspect in rational drug design is the evaluation and prediction of the mode
of binding a ligand within the receptor pocket of a protein. Two problems have to be faced
when performing the docking procedure. First, many different binding modes have to be
evaluated and compared with each other and, secondly, a good scoring function has to be
designed for the assessment of the protein-ligand complexes.
The program DOCK (38) fills the binding pocket with spheres and performs docking by
matching atoms with the centers of spheres. Oshiro et al. (39) applied a GA to extend the
original rigid docking mechanism to allow for ligand flexibility. The fitness function includes
molecular mechanics calculations for the candidate evaluation.
The Family Competition Evolutionary Algorithm (FCEA) for docking was introduced by
Yang and Kao (40). The genome is represented by one chromosome for the search solution and
three additional chromosomes, carrying adjustable variables to control the behavior for three
mutation operators. The technique was tested on the dihydrofolate reductase enzyme with the
anticancer drug methotrexate and two analogues of the antibacterial drug trimethoprim
resulting in lowest-energy structures with RMS derivations to the corresponding crystal
structures ranging from 0.67 to 1.96 Å.
The docking program GOLD (Genetic Optimization for Ligand Docking) introduced by Jones
et al. (41) does not only treat ligands as flexible but also the protein is partially set flexible near
the active site. The chromosomal information for conformations is represented by two binary
bit strings, one encoding the torsion angles of the ligand and the other one encoding the
torsion angles of the protein side chains. GOLD uses an implementation of the island model
with different subpopulations and, therefore, applies a migration operator. GOLD was
implemented in a parallel version with the public domain library PVM (Parallel Virtual
Machine).
In AUTODOCK 3.0 (42) a hybrid GA is implemented that applies a local search at each new
generation. An additional feature is the use of a Lamarckian genetic algorithm (LGA). The
environmental adaptations of an individual's phenotype are mapped into its genotype and
become heritable traits. The chromosomes carry real-valued genes. The scoring function
estimates the free energy change upon binding. As already discussed in section 2.7
AUTODOCK 3.0 was later made parallel (31).

2.8 Applications in Chemistry
22
DARWIN (43) uses a parallel GA to optimize the molecule's conformation and orientation and
employs the molecular mechanics program CHARMM for energy calculation. The
chromosomal information is encoded in a binary format. The coordinates of the ligands on the
chromosomes are optimized through a gradient energy minimization. The parallel version
uses the PVM software.
Gardiner et al. (44) presented a method for protein-protein docking whereby a GA is used to
move the surface of the smaller query protein relative to the larger target protein to detect the
area of greatest surface complementary. A chromosome carries six integer elements
representing the six degrees of freedom necessary to define the movement of the two rigid
bodies. A niching technique is applied to restrict the GA search to explore different regions of
the solution space.
2.8.3 De Novo Molecular Design
De novo molecular design is an approach for constructing chemically reasonable compounds
that bind to key regions of biological target proteins of known 3D structure. Constraints on
the design process come from knowledge of the structural features of the target protein.
Furthermore, the designed molecule has to satisfy as many interaction sites as possible.
Globus et al. (45) introduced a new variant of EAs that uses a graph representation of the
candidate solutions. Therefore, it is called genetic graphs. The designed compounds must fit
the constraint of 2D similarity with a target structure. The algorithm uses only the crossover
operator that splits molecules into fragments and combines the parts from each parent-
molecule. The fitness measure combines an all-pairs-shortest-path and a modified Tanimoto
index on the number of rings in the target molecule versus the candidate.
The program TOPAS (TOPology-Assigning System) (46) is a fragment-based application that
is based on a simple (1,λ) evolution strategy. In the (1,λ) model one parent generates
λ offspring, from which the best individual survives. A set of 25,000 fragment structures is
available for building blocks. For each generation the program produces structural variants
from a parent compound which is the focus of similarity. The fitness of the individuals is
measured either by their 2D-structural similarity or their topological distance to the template
molecule. The fittest individual was selected as the parent of the next generation.

2.8 Applications in Chemistry
23
Pegg et al. (47) developed the program ADAPT for structure-based de novo drug design. The
compounds are represented by acyclic graphs with a maximum of 16 fragments that are
subject to crossover and mutation. The fitness function uses molecular interactions that are
evaluated with flexible docking calculations through the DOCK program. Local sampling
allows the mutation operator only to change fragment types to similar fragment types and
diversity is reintroduced by randomly adding, subtracting, or swapping at most two fragments
from each compound.
Budin et al. (48) developed the application PEP (Program to Engineer Peptides) for the
construction of peptidic ligands that should bind and fit to the constraints of a target region of
a molecule. It combines the search in the conformational space of the ligand by docking and
in the chemical space through de novo design. At each growing step an amino acid is attached
to the already built peptide and the resulting peptides are energy minimized. A chromosome
with a more favorable energy has a higher probability to be selected.
2.8.4 Pharmacophore Perception and Pseudoreceptor Modeling
Determining a pharmacophore in the absence of the 3D structure of a target protein is feasible
through a series of compounds with measured binding affinities. In this case, a set of plausible
superimpositions of ligands can help to derive binding geometries and to analyze the
similarities and dissimilarities of ligands. In chapter 3 a more comprehensive overview on
alignment methods is provided. As the program GAMMA is described in more detail in
chapter 5 it will not be mentioned here.
Jones et al. developed the program GASP (Genetic Algorithm Superimposition Program) (49)
for flexible molecular alignment and pharmacophore elucidation. The chromosomes of the
GA encode torsion angles as Gray-coded binary strings and the intermolecular mapping of
pharmacophore features as integer strings. A molecule with the smallest number of features is
selected as rigid template for adaptation of the other molecules. The fitness function consists
of the weighted sum of the number and similarity of overlaid elements, the common volume
of all the molecules, and the internal van der Waals energy of each molecule.
Holliday and Willett (50) presented the program MPHIL (Mapping PHarmacophores In
Ligands) that identifies the smallest 3D pattern of pharmacophoric points within a set of rigid
molecules. Two GAs are implemented within this approach whereby the first GA-1 selects a

2.8 Applications in Chemistry
24
combination of points from each molecule in such a way that the resulting set can be
maximally superimposed. The second GA-2 then tries to improve the fitting between the
superimposed molecules. The fitness of an individual in GA-1 is given by the goodness of the
overlap of the points based on calculated interatomic distances. The GA-2 applies crossover
and different types of mutation like removing a point and adding a randomly selected point or
removing two points and replacing them by their midpoint.
A recently presented approach that also uses a genetic algorithm was described by Cho et al. (51). The genetic algorithm in their program FLAME (Flexibly Align MolEcules) is used to
identify maximum common pharmacophores (MCP). To generate unique conformations, all
noncyclic rotatable bonds in a compound are randomly assigned a discrete value and encoded
in a chromosome. The MCP between the template and the test compound is evaluated using a
clique-detection algorithm. The fitness score is the number of common pharmacophores.
After the first GA directed alignment a simultaneous optimization of the internal energies and
alignment scores is performed. The algorithm is capable of performing multiple
superimpositions.
A genetic algorithm incorporated in the program GALAHAD (Genetic Algorithm with Linear
Assignment for Hypermolecular Alignment of Datasets) (52) is applied to pregenerated sets of
conformations. By superposing molecules a hypermolecule is constructed that retains the
aggregate as well as the geometry and the molecular connectivity of the ligands. Each
molecule becomes a substructure in this hypermolecule. The cost function is not purely atom-
based any more but now uses ionic, hydrogen-bonding, hydrophobic and steric features.
Another technique for model building in the absence of a targets 3D structure based on known
ligands is pseudoreceptor modeling. Methods applied in this application field are Comparative
Molecular Field Analysis (CoMFA) (5), which represents 3D field properties around a series of
superimposed molecules, models constructing a surface over one or more active compounds
and methods placing atoms or groups of atoms, e.g. amino acid side chains, around a set of
active ligands.
GERM (Genetically Evolved Receptor Models) (53) applies a GA to maximize the correlation
between the calculated drug-receptor binding and measured drug activity. An ensemble of
possible protein atom positions is constructed on a grid around the surface of superimposed
molecules. The chromosomes consist of bit strings and each bit corresponds to a grid point

2.8 Applications in Chemistry
25
together with pseudoreceptor atom assignments. The fitness function comprises the ligand-
receptor energy and the correlation between calculated drug-receptor binding and measured
drug activities.
The program PARM (Pseudo Atomic Receptor Model) (54) was developed on the basis of the
GERM algorithm and combines the GA with a cross-validation technique. It places grid
points around superimposed ligands and calculates a formal charge that is equal but opposite
in sign to the average partial atomic charge of the ligand atoms in the neighborhood. Pseudo-
receptor atom types are then assigned to those grid points.
Quasar (55) generates a family of quasi-atomistic receptor models whereby the surface adapts
to each single ligand. Quasar can represent a ligand by multiple conformations, orientations,
and protonation states (4D-QSAR). An averaged receptor surface is initially built by
surrounding the ligands with H-bond flip-flop particles that act as hydrogen-bond donors and
also as hydrogen-bond acceptors. The surface is then individually optimized for each ligand
resulting in a family of receptor models. Finally, a GA is employed to optimize the population
of the generated models by placing atoms on the receptor surfaces. The program was extended
to multiple representations of the topology of the quasi-atomistic receptor construct or a set of
different induced-fit models (5D-QSAR).
2.8.5 Chemical Structure Handling
Applications in the area of chemical structure handling are the determination of the minimal
chemical distance between different structures, the retrieval of compounds with particular
properties from a database, the matching of flexible 3D molecules to pharmacophores or the
determination of the maximum overlap of molecular electrostatic potentials.
As an application in synthesis design and for the analysis of the structural biological activity,
Wagener and Gasteiger (56) determined the largest common substructure of two compounds
using a GA. This method is the precursor of the procedure presented in this work for the
superimposition of ligand molecules. A chromosome encodes the matching consisting of a
node mapping which is coded by integers and is represented as a fixed-length linked list of
matching bonds. The fitness function evaluates the number of bonds that participate in the
bond matching, how often two adjacent bonds in one structure are assigned to two non-
adjacent bonds in the other structure and the number of unconnected parts in the two

2.8 Applications in Chemistry
26
structures. Additional operators applied to the chromosomes are creep and crunch (see
chapter 2.7). It was shown that the determination of the largest substructure contained twice in
a single molecule allows one to derive synthesis precursors.
Brown et al. (57) described a GA based technique for efficient substructure searching via
computation of a Maximum Overlap Set (MOS) using a GA for the generation of
hyperstructures which are pseudomolecules represented by a set of superimposed structures.
Chromosomes are represented by integer strings that encode mappings between a graph
representing a query structure and a hyperstructure as matching. The GA's fitness function
measures the number of bonds (edges) that match in the mapping. One mutation and two
crossover operators, namely uniform crossover and node-based crossover, are applied to
create variation in the population.
A graph-based genetic algorithm was proposed by Brown et al. (58) for the evolution of
molecular graphs from a predefined set of elements or molecular fragments. Fingerprints are
used to describe molecules and to calculate their similarity to the objectives. The Tanimoto
similarity is calculated of each candidate molecule to a number of objective molecules and
then a Pareto ranking is determined (see chapter 2.7). The graph-based mutation operator
swaps existing fragment nodes with new fragment nodes and also the graph edges. Also,
different crossover operators were used that exchange parts of the graphs.
2.8.6 Processing of 3D Chemical Graphs
A problem in the processing of 3D chemical graphs is the identification of common structural
features in sets of ligands. Application areas are the generation of molecular alignments and
flexible 3D substructure searching. Programs applied in this field are the already discussed
procedures GASP (49) and GAMMA (15,16).
Wild and Willett (59) used a GA, implemented in the program FBSS (Field-Based Similarity
Searching), to perform a field-based similarity search. FBSS permits the calculation of
electrostatic potential, hydrophobic, and steric fields as similarity types and can be applied to
field-based similarity searching in chemical databases. A GA automatically generates
molecular alignments. The goal is to maximize the Carbo index as a measure for the inter-
molecular structural similarity. A chromosome encodes the translations and, if conformational
flexibility is taken into account, also rotations of a structure that has to be matched to a target

2.8 Applications in Chemistry
27
molecule. The fitness is evaluated by the similarity coefficient of the resulting alignment.
FBSS was also applied to the generation of alignments for 3D QSAR models (60) that were
tested on several data sets taken from literature. An alignment can be performed based on a
single or on a combination of three different field types. The computed 3D QSAR models
showed results comparable with manually generated alignments.
2.8.7 QSAR
The aim of Quantitative Structure-Activity Relationships (QSAR) or Quantitative Structure-
Property Relationships (QSPR) is to find a correlation between the structure of compounds
and their biological activity or physicochemical properties and derive a model to predict the
activity or properties of novel compounds. A model usually consists of a linear combination
of features, descriptors, and coefficients. As it is possible to generate a large number of
descriptors for each compound, the selection of features that yield a reliable relationship is a
complex and time-consuming task for which GAs have been applied. The majority of the
applications use chromosomes each encoding a different descriptor subset through a binary
string representation. A "0" bit means that the descriptor is not included in the subset while a
"1" bit denotes the presence of the descriptor in the subset.
Lee and Briggs (61) published a 3D QSAR study on sets of epothilone analogs on the basis of
the CoMFA method to check for inhibition of microtubuli depolymerization. They employed
the GFA (Genetic Function Approximation) method to generate multiple QSAR models and
descriptor sampling. GFA uses a conventional GA coupled with multiple linear regression.
A. Yasri and D. Hartsough (62) published an approach that employs a GA for subset selection
but which does not restrict the search to a certain number of descriptors. The chromosomes
associated with a training set are evaluated by the neural network to receive a fitness value by
mapping input descriptors to the dependent activity. The size of the hidden neural network
layer is dynamically modified in parallel to variable selection to adapt the network
architecture.
Daren (63) carried out a QSPR study on polychlorinated biphenyls with a hybrid approach
combining a GA with PLS (Partial Least Squares). The fitness function consisted of a
modified cross-validation correlation coefficient through which many low-dimensional PLS
models and the best multiple least squares models were obtained.

2.8 Applications in Chemistry
28
Kauffman et al. (64) used the ADAPT software to develop a QSAR model for 314 selective
cyclooxygenase-2 (COX-2) inhibitors. SA and a GA were used for the selection of descriptor
subsets coupled with a multiple linear regression (MLR) fitness evaluator to generate RMS
minimized sets of 5 to 12 descriptors. Then, neural networks were used to improve the MLR
descriptor models. A model was developed from the reduced descriptor pool for classification
into actives and inactives using a combination of a GA and a k-nearest neighbor (KNN)
method.
Gao et al. (65) presented a binary QSAR approach applying a GA for the selection of variables
for the analysis of high-throughput screening (HTS) data. The fitness was reflected through
the accuracy of the derived binary QSAR model. Binary QSAR models using GA based
variable selection yielded models with fewer molecular descriptors and higher predictive
cross-validated accuracy than without GA-based variable selection.
Cho et al. (66) presented the program GAS (Genetic Algorithm guided Selection) for variable
selection whereby the encoding included both descriptors and compound subsets allowing
variable or subset selection, respectively. The chromosomes encoded combinations of
descriptors or compounds through indicator variables. For subset selection an integer
encoding represented the subset the compound is designated to.
Landavazo et al. (67) applied evolved neural networks for QSAR examinations on
dihydrofolate reductase inhibition by pyrimidines. Evolutionary computation was applied to
train neural networks instead of using neural networks trained via backpropagation. Mutation
was used to act on the number of layers and nodes, on weights, biases, means, and standard
deviations.
2.8.8 Combinatorial Libraries
EAs are an interesting method for generation of virtual combinatorial libraries that require
high diversity across the chemical space and for the analysis of the inherent complexity of the
search space. In addition, other desired features can be added to the generation process like
drug-likeness or specific physicochemical properties. The selection of diverse molecules or
sublibraries from larger libraries is also a combinatorial problem suitable for EAs.

2.8 Applications in Chemistry
29
The method presented by Sheridan and Kearsley (68) employed a GA for the construction of
tripeptoid libraries out of a set of building blocks. The method applied best third selection that
chooses the top-scoring best three solutions and a stochastic selection. A neighbor mutation
operator changes fragments that are most similar to each other. In a later publication the work
was extended to the use of 3D scoring methods for conformations applying SQ (69) or FLOG (70). SQ superimposes a query conformation onto a target molecule and FLOG docks a query
conformation into a known receptor site. It was shown that the assembly of libraries from
fragments in high-scoring molecules leads to libraries that will also be high-scored.
Illgen et al. (71) synthesized a combinatorial library of 15,360 compounds that are structurally
arranged as active site inhibitors of the serine protease thrombin. A GA was employed for the
selection of potent inhibitors from this library based on biologically evaluated structure-
activity relationships.
Xue et al. (72) developed mini-fingerprints, which are much smaller and simpler than other
more widely used fingerprint representations, to search databases for molecules with similar
activity. Descriptor combinations were explored that succeeded in good compound
classification. A combination of principal component analysis (PCA) and a GA were applied
to analyze the descriptor combinations. A binary chromosome encodes for the presence or
absence of descriptors.
Gillet et al. (29) presented MoSELECT that is based on a MultiObjective Genetic Algorithm
(MOGA) that handles a family of solutions that are equally valid and each represents a
different compromise between the objectives. A chromosome represents a combinatorial
subset of the virtual library which is evaluated by Pareto ranking based on the values of the
individual objectives. Its rank is calculated as the number of individuals in the population by
which it is dominated. A comparison of SELECT and MoSELECT showed equal computation
times, but the MOGA version had the advantage of finding a whole family of solutions.
2.8.9 Structure Prediction of Biological Macromolecules
The prediction of macromolecular structures, particularly of protein tertiary structure, also
known as the folding problem, is a very difficult problem because of the complex
hypersurface with several local minima. Another challenging task within the field of structure

2.8 Applications in Chemistry
30
prediction of biological macromolecules is the RNA tertiary structure which is complicated by
a lack of experimental structural information.
For the investigation of protein folding lattice models, united-atom models, and all-atom
representations are the main types of representation that have been used.
Knig and Dandekar (73) presented a refined GA modeling approach for protein structures. A
binary encoding is used for the candidate solutions. The GA is extended through a pioneer
search that searches new regions in the search space if the population is loosing its genetic
variance. This method permitted 14 % less evaluations for the detection of the global
minimum for a 20 residue chain on a simple lattice model. Another new technique is the
systematic recombination strategy. The best individual recombines with another genetically
different solution by systematic crossover at all possible crossover points and the fittest
resulting individual is picked. Also, this method gave a speed up in search of 50 %. A
following investigation with full main chain representation was performed applying a target
function that evaluates fitness per residue to judge predicted structures.
Gibbs et al. (74) applied an evolutionary Monte Carlo technique for ab initio protein structure
prediction based on a model that describes the conformations by using six optimized
backbone torsion angles and fixed side chains approximating rotationally averaged real side
chains. A chromosome represents a conformation encoded by a sequence of residues through
a list of integers, each specifying one of the six possible Φ-Ψ angle pairs that a residue may
adopt. Only mutation is used to change the candidate solutions. The fitness is evaluated
through the energy of a conformation describes by a simple force field. For polypeptides with
up to 38 residues and α and β secondary structural elements were predicted. A comparison of
the used force field with a complex all-atom model showed similar effectiveness in predicting
the structures of independent folding units.
An important area of RNA structure prediction is determining which nucleotides form stem
loops and identify the folding processes. After the identification of the nucleotides within a
stem loop the 3D structure of the loop has to be identified. Shapiro et al. (75,76) applied a
parallel GA for the prediction of RNA folding. The individuals encode the size, the start and
the stop positions of stem loops in an individual as tuples. The fitness function evaluates the
change in Gibbs free energy for the tertiary structure of the RNA relative to a fully single
stranded molecule as the sum of stem and loop energies. An annealing mutation operator is

2.8 Applications in Chemistry
31
applied that allows a relative high number of mutations to take place at the beginning of the
process but reduces them slowly as the GA proceeds.
Various other application areas exist where GAs were realized. These application fields
comprise crystal structure solution from powder diffraction data, crystal structure prediction,
indexing of powder diffraction data, phasing of diffraction data, the generation of NMR pulse
shapes, prediction of 1H NMR chemical shifts, structure determination, the resonance
assignment problem or the structure refinement problem, solving the Schrödinger equation,
parameter optimization within semi-empirical and force field methods, handling and modeling
of chemical reactions, protein, DNA, or RNA sequence alignment. However, it should be
pointed out that just a partial overview was given which does not claim to be complete.

3.1 Introduction
32
3 State of the Art in Small Molecule Alignment
3.1 Introduction
The following chapter reviews important innovations in the field of small molecule
alignments that have been taken place until now. As mentioned above (see chapter 1.1), it is
an important task in drug design to identify similarities of three-dimensional structures of
compounds that share similar biological activities, especially when the 3D structure of the
macromolecular target molecule is not known. Ideally, the ligands should bind to the same
biological target within the same cavity of the molecule. Otherwise the deduced models will
be misleading. In order to reach this the 3D structures of the small ligand molecules are
aligned to identify geometrical similarities and related spatial arrangements of chemical
features. If this results in a plausible overlay it can be used for 3D-QSAR analyses to correlate
the obtained conformations with the biological activity. Apparent structurally dissimilar
molecules have to be similar concerning physicochemical properties to bind to the same
target. Steric and electrostatic interactions are mainly responsible for the recognition of a
ligand by its receptor. The superimposition step is a crucial step for following analyses
comprising e.g. pharmacophore evaluation, receptor modeling, ligand-based virtual screening
or 3D-QSAR examination. It has to be considered that a “perfect” alignment does not
automatically reflect the true binding mode of the ligands in the receptor site. This does then
in turn affect the quality of the results of the following analyses for which the superimposition
step is a crucial.
3.2 Classification of Small Molecule Superimposition Methods
A variety of approaches for molecular alignment has been proposed in the literature and many
of them have been reviewed by Lemmen and Lengauer (77). A tabular overview can be found
in the appendix C. The approaches can be classified by different point of views. One
classification scheme can be build upon the aspect of molecular similarity. The molecules to
be superimposed can be compared by looking at point-based similarities like e.g. atoms or
pharmacophoric points, the shape or molecular surface based similarities or by looking at
similarities of fields of various physicochemical properties. Sure, the differentiations can be
flat as also atoms can associated with physicochemical properties. The physicochemical

3.3 Rigid Alignment Methods
33
properties that are used for comparing the molecules are e.g. electron densities, charge
distributions, hydrophobicity or hydrogen-bonding. Another classification scheme is based on
the treatment of conformational flexibility of the molecules. This classification scheme will be
used here. The applied alignment approaches can handle 3D structures as rigid entities or as
flexible entities. Some of the techniques try to introduce conformational flexibility in an
indirect fashion. They compare sets of precomputed conformations for one molecule using
conformation generation programs in advance and afterwards perform a rigid body alignment
of the generated conformations. This is a so-called semiflexible approach. Another technique
that tries to bring flexibility into the search process generates conformations on-the-fly by
applying different algorithms. One class of algorithms performs a systematic search in the
conformational space while the others use stochastic methods to generate conformations for a
molecule.
A disadvantage of the semi-flexible approach is that it is often difficult to decide a priori on
the number of conformation used for the subsequent alignment. Besides, only metastable and
low energy conformations are considered and bent conformations as they can occur e.g. in
transition states can not be detected with such an approach.
The advantage of on-the-fly flexing is that the computed conformations are not restricted to
low-energy conformers. The disadvantage is that it is more time consuming, than to use pre-
computed low-energy conformers.
3.3 Rigid Alignment Methods
Because it is a more basic approach, rigid body alignment methods will be discusses first. The
approaches for rigid-body alignment presented here try to maximize similarity of surface
descriptors or the volume overlap. The volume is generally given through Gaussian functions,
approximating different properties, such as van der Waals overlap, electron density overlap, or
electrostatic potential overlap. The different optimization methods that try to achieve this will
be reviewed here.
A simplex optimization method for optimizing the superimposition of molecules is applied in
the computer methodology QUASIMODI by Nissink et al. (78). The rotational and the
translational step are separated in such a way that two similarity indices are used. For
optimizing the rotational step a Patterson-density-based similarity index is used and
3.3 Rigid Alignment Methods
34
afterwards an electron-density derived similarity is applied for further optimizing the
translational orientation. Electron density models are handled in Fourier space.
Cocchi et al. (79) also described a simplex optimization method. Their molecular similarity
index is based on size and shape descriptors and the molecular electrostatic potential (MEP).
A supermolecule is used as a reference structure. The MEP of the supermolecule is defined by
the average MEP of the compounds that define the supermolecule.
Another simplex optimization approach was presented by Melani et al. (80) using a procedure
called Field Interaction and Geometrical Overlap (FIGO). The alignment process
superimposes molecular interaction fields (MIFs) and the heavy atoms of the structures. Both
aspects flow into an alignment index that is optimized.
Lemmen et al. (81) applied a divide and conquer strategy for superimposing rigid compounds.
In the RigFit approach the molecules are fragmented and for the fragments an optimal
superimposition is achieved by comparing similarities of physicochemical properties that are
realized as sets of Gaussian functions. The rotational and translational optimization is realized
using a quasi-Newton method in Fourier space. The RigFit methodology was incorporated in
the flexible alignment approach FLEXS that was developed earlier (82,83).
Next, two methods are described that are based on molecular surface similarity to
superimpose molecules. The surface shape-based algorithms are insensitive to connectivity
and the relative size of the molecules to be compared.
Cosgrove et al. (84) applied a clique-detection algorithm to find sets of patches of the surface
of similar curvature. The method was implemented in the program SPAt (Surface Patch
Alignment).
Also, Goldman et al. (85) described a shape-based molecular similarity searching method.
Descriptors for the surface shape are calculated by least-squares fitting of a quadratic function
to small sections of the surface. Single points on the surface together with the principal
directions of curvature are used to align molecular surfaces. The method was implemented in
the computer program QSD (Quadratic Shape Descriptors).
A genetic algorithm is used in the FBSS (Field-Based Similarity Searching) (60) approach by
Jewell et al. to align the fields of two molecules. The chromosomes of the GA encode the
rotations and translations of the molecular structures. The fitness function is the value of the

3.4 Semiflexible Alignment Methods
35
Gaussian similarity coefficient. The fields comprise an electrostatic, a hydrophobic and a
steric field. The method tries to maximize the value of the Carbo index when aligning a
reference compound to a target structure.
Another GA-based approach is applied by Bultinck et al. (86) and implemented in the program
QSSA (Quantum Similarity Superposition Algorithm). They try to maximize molecular
quantum similarity (MQS) and apply a Lamarckian GA combined with a simplex method as a
local optimizer. Therefore, molecules are aligned on the basis of electron density functions.
The approach by Richmond et al. (87) is the LAMDA (Linear Assignment Method for Database
Alignment) method that applies Procrustes transformation to maximize the overlay of
corresponding atoms. Linear assignment is used to minimize total cost of matching pairs of
atoms. The cost function is defined using atomic partial charge. Geometric inconsistencies are
resolved using a form of distance geometry. The alignment is performed using least squares
fit.
3.4 Semiflexible Alignment Methods
To bring some flexibility into the search process and to allow to screening of different
conformations for one molecule some approaches apply conformation generation methods
before applying a rigid-body superimposition.
Iwase et al. (88) used a simplex algorithm to superimpose rigid three-dimensional structures. In
their program SUPERPOSE four types of physicochemical properties are employed to match
the compounds. These properties are hydrogen-bonding donor, hydrogen-bonding acceptor,
hydrogen-bonding donor/acceptor and hydrophobicity. A physicochemical property type is
represented as a sphere with a predefined radius and is assigned to a functional group in a
molecule.
Martin et al. (89) described a semiflexible approach that uses a clique-detection algorithm to
match pharmacophore points that obey given distance constraints. In the procedure called
DISCO (DIStance COmparison) the pharmacophore points are defined for ligand atoms
comprising positive charge, negative charge, hydrogen-bond donor, hydrogen-bond acceptor
and hydrophobic character. Hypothetical receptor atoms are included and are determined from
the position of heavy atoms in the ligand structure. The molecule with the fewest

3.4 Semiflexible Alignment Methods
36
conformations is used as a reference on which all other molecules are aligned. This process is
sequentially repeated for all the conformations of the template compound.
Barnum et al (90) described superimposition of molecules by identifying common
pharmacophoric features. Their program CATALYST considers features like hydrogen-bond
donors and acceptors, negative and positive charge centers, and regions of exposed
hydrophobic surface. Both, ligand atoms and projected positions of complementary site atoms
are considered as hydrogen-bonding features. The scoring function is based on the maximum
likelihood rule and considers the occurrence of a match in all structures and an estimate of the
rarity of such a matching in non-bonding molecules.
Another approach applying an atom-based clique-detection algorithm is presented by Miller et
al. (91) that is implemented in the program SQ. Clique-detection is used to identify initial
superimpositions of one molecule onto a reference structure by correct type and optimal
distances. In an optimization step the scoring function SQuEAL (Steric and Qualitative
Electronic ALignment) is maximized using the simplex algorithm. This scoring function is
deduced from the SEAL function and is composed of an atomic property similarity and steric
similarity part. Atoms are composites incorporating information about atomic number,
hybridization, and physiochemical types whereby physiochemical types are cations, anions,
neutral H-bond donors, neutral H-bond acceptors, polar (unspecified H-bonding group),
hydrophobic and other.
A gradient based approach for volume overlap optimization was proposed by Masek et al. (92)
realized in the MSC method (Molecular Shape Comparison). The intersection volume is used
to measure the shape similarity. Multiple shape matching superimpositions are randomly
generated at the beginning of the optimization process. The matches can be restricted to
electrostatic potential, hydrogen-bonding or lipophilicity. Low-energy conformations are
pregenerated for the two molecules to be compared and afterwards each conformation of the
first molecule is MSC-compared with each conformation of the second molecule.
Mestres et al. (93) also used a gradient-based technique to optimize their scoring function for
the alignment process. This function deals with two types of fields. The fields comprise the
molecular steric volume (MSV) and the molecular steric potential (MEP) which are both
represented by sets of Gaussian functions. The technique was implemented in the program
MIMIC.

3.4 Semiflexible Alignment Methods
37
One recently presented approach by Tervo et al. (94) named BRUTUS uses a combination of a
gradient based and a systematic search to optimize molecular alignments. A systematic search
for starting positions is performed followed by a local gradient based search to optimize
rotations and translations. Their program is based on optimizing the alignment of electrostatic
and steric fields. The similarity estimation is based on the Hodgkin index.
Arakawa et al. (95,96) applied the Hopfield Neural Network (HNN) to accomplish the overlay
of three-dimensional molecular structures. Like Iwase et al. they also used four kinds of
chemical properties, namely a hydrophobic group, hydrogen-bonding acceptor, hydrogen-
bonding donor, and hydrogen-bonding donor/acceptor, to compare compounds to be
superimposed. The HNN determines the correspondences of the properties between the two
molecules.
Generalized Procrustes analysis (GPA) was proposed by Kroonenberg et al. as a method for
aligning molecules (97). Common atoms in the molecules to be aligned are chosen as the
criteria for matching the structures. At least three common atoms have to be chosen for the
alignment rule to realize the superimposition of molecules.
A Procrustes transformation is also used by Richmond et al. (52). Molecules or hypermolecules
are superimposed by maximizing the overlay of corresponding features. The presented
method is a further development of the LAMDA approach presented above. A genetic
algorithm incorporated in the program GALAHAD (Genetic Algorithm with Linear
Assignment for Hypermolecular Alignment of Datasets). The GA is applied to pregenerate
sets of conformations. By superimposing molecules a hypermolecule is constructed that
retains the aggregate as well as the geometry and the molecular connectivity of the ligands.
Each molecule becomes a substructure in this hypermolecule. The cost function is not purely
atom-based. It uses ionic, hydrogen-bonding, hydrophobic and steric features.
An approach for rigid-body superimposition applying a Monte Carlo search procedure and the
Rational Function Optimization (RFO) method was proposed by Kearsley et al. (98). The
method was realized in the program SEAL (Steric and Electrostatic ALignment). The criteria
for the alignment are the atomic partial charges and steric volumes. The method computes the
regional overlap of these molecular properties using a damping function. The alignment
process is started with randomly generated starting configurations and iterated many times
keeping always the best results for the next step. The Monte Carlo search procedure was used

3.5 Flexible Alignment Methods
38
to rotate and translate one structure with respect to the other. Then, the alignment function is
minimized using the Rational Function Optimization (RFO) approach. A subset of low energy
conformations is selected that is maximally dissimilar in shape. An extension of the SEAL
approach, TORSEAL, was describes by Klebe et al. (99). The alignment function was modified
using additional physicochemical properties like hydrophobic fields and later hydrogen-
bonding properties. A prefit of multiple conformations is performed with SEAL. Then, a
subsequent flexible post-optimization is employed with the conformer generator MIMUMBA
to enhance the flexibility of structures under inspection. Another extension of the SEAL
method was introduced by Feher et al. (100) called MultiSEAL that allows the alignment of
multiple molecules and conformation.
Another heuristic method, simulated annealing (SA), was suggested by Perkins et al. (101). The
program PLM maximizes the overlap between two molecular surface volumes using SA. To
compare the similarities hydrogen-bonding and electrostatics are used as features.
3.5 Flexible Alignment Methods
Next, algorithms for the superimposition problem are reviewed that are considering full
flexibility. Most of them use heuristic methods to change the torsion angles. The review on
systematic search procedures will come first.
Lemmen and Lengauer (82,83) applied a divide and conquer strategy to flexibly align
molecules. They implemented a fragmentation-reassembly approach to simplify the
conformational search process. Their program FLEXS is based on the docking system
FLEXX. Two molecules are superimposed by aligning a flexible test molecule onto a rigid
reference compound. In a first step the test molecule is partitioned into rigid fragments and
afterwards reassembled by iteratively adding the fragments considering chemical similarity.
The reassembling is started by identifying an optimal placement of a base fragment. A set of
conformations for the fragments is used to allow flexing of the rebuild test compound.
Similarity is measured using bonding terms and overlap terms. Gaussian functions describe
the different field properties. Later, FLEXS was extended by incorporating the above
mentioned method RigFit that can be applied as an alternative base placement method.
Another similar approach was described by Krämer et al. (102) and Pitman et al. (103)
implemented in the programs FLASHFLOOD and its successor fFLASH. They apply a

3.5 Flexible Alignment Methods
39
partitioning-reassembly approach, too. The conformational flexibility is handled by sampling
the conformational space of the fragments. FLASHFLOOD uses a field-based technique
while fFLASH applies point-like features, e.g. hydrogen-bond donors, hydrogen-bond
acceptors, charges and hydrophobic regions.
The program SURFLEX-SIM was described by Jain et al. (104). It also uses a divide and
conquer strategy to overlay three-dimensional molecular structures. A molecular
fragmentation and incremental reconstruction is applied therefore. SURFLEX-SIM is derived
from the Surflex docking system. A so-called morphological similarity is considered that is
defined as a Gaussian function of the differences in molecular surface distances of two
molecules at weighted observation points on a uniform grid. The overall molecular volume
overlap has to be minimized. The molecules are decomposed by breaking acyclic rotatable
bonds. Then, the molecules are reassembled by aligning the fragments onto the template
molecule under similarity constraints. The similarity score is optimized by performing a
gradient-based optimization. A multiple superimposition is made feasible by analyzing all
pairwise superimpositions. The best scoring superimposition is selected and all other
molecules are iteratively realigned onto the molecules contained in this best superimposition.
This results in a growing multiple alignment set.
Another systematic search algorithm is presented by Gironés et al. (105,106) implemented in the
program TGSA-Flex (Topo-Geometrical Superposition Approach). Rotations around single
bonds are performed in small increments. Common structural features that are used for
matching are based on atomic numbers, molecular coordinates, and connectivity.
The method described by Korhonen (107) applies flexibility of molecules in the alignment
process via the Merck Molecular Force Field (MMFF94). Their field-based superimposition
program FLUFF (Flexible Ligand Unified Force Field) maximizes the similarity of the
electrostatic and the VDW volume. The superimposition is performed by applying a geometry
optimization.
The distance geometry approach is a Monte Carlo type algorithm. It was applied by Sheridan
et al. (108) to search for conformations that inhibit a pharmacophore, which is occurring in all
molecules that have to be aligned. The definition of a pharmacophore is a prerequisite for the
method. The search should end in a low-energy conformation that makes the alignment
feasible via the pharmacophore.

3.5 Flexible Alignment Methods
40
Labute (109) described a MOE-based approach that also uses a Monte Carlo type routine. The
procedure is called RIPS (Random Incremental Pulse Search) and is applied to simultaneously
search conformations of each molecule. It is also employed to search for optimal alignments
of the compounds. The atom properties that are taken into account are volume, aromaticity,
hydrogen bond donor, hydrogen bond acceptor, hydrophobicity, log P, molar refractivity and
surface exposure. The quality of the alignment is quantified by the overlap of property
densities based on Gaussian densities.
Also, the method described by McMartin et al. (110) to superimpose a flexible molecule onto a
rigid template is based on a Monte Carlo algorithm combined with an energy minimization
procedure. The method TFIT (Template FITting) optimizes the overlap of atoms that have
similar chemical features, namely hydrogen-bonding, charge and hydrophobicity. The method
applies a Monte Carlo procedure to generate perturbations to the molecule that has to be
fitted. Perturbation and optimization are iterated in a large number of cycles in order to cover
conformational space
Another heuristic method, simulated annealing, was applied by Mills et al. (111) to optimize the
superimposition of ligand molecules. The method is implemented in the program SLATE.
Torsion angles of the compounds are changed during the annealing process at a random
amount. Superimposition criteria comprise hydrogen-bonding and aromatic-ring properties. A
distance matrix is calculated from the physicochemical properties and is minimized according
to the ligands to be superimposed. The ligands are represented by ligand acceptor atoms.
Protein acceptor atoms are predicted from the ligand and the aromatic rings of the ligand are
represented by points above and below the centroid. A multiple molecule alignment is realized
by analysis of pairwise matches and by search for a conformation of a molecule that is present
in alignments with all other molecules.
A genetic algorithm was described by Jones et al. (112) to handle flexible ligand
superimpositions. The program GASP (Genetic Algorithm Similarity Program) can handle
multiple ligands as flexible without relying on predefined correspondences between groups in
the superimposed molecules. Another advantage is that both can be handled flexible, the
template and the test molecule. Similarity in molecules is compared using pharmacophoric
features such as hydrogen-bond donor protons, acceptor lone-pairs, and ring centers including
projected site points. A chromosome encodes the torsion angles in all molecules and the

3.5 Flexible Alignment Methods
41
intramolecular feature correspondences. The fitness is represented by an intermolecular
conformational energy term, the volume overlay, and an intermolecular matching energy term.
A recently presented approach that also uses a genetic algorithm was described by Cho et al. (51). The genetic algorithm in their program FLAME ((Flexibly Align MolEcules) is used to
identify maximum common pharmacophores (MCP). The MCP comprises a base, a
hydrogen-bond acceptor, and a hydrophobic or aromatic ring. To generate unique
conformations, all noncyclic rotatable bonds in a compound are randomly assigned a discrete
value. The MCP between the template and the test compound is evaluated using a clique-
detection algorithm. After the first GA directed alignment a simultaneous optimization of the
internal energies and alignment scores is performed. The algorithm is capable of performing
multiple molecule superimpositions.
In general it is difficult to compare all the approaches, especially on the basis of runtimes as
different hardware platforms were used. Also, it has to be recognized that the computing
power is changing very quickly over time. A benchmark system was suggested by Lemmen (83) in 1998, but it was not generally used in all the subsequent published papers. Another
aspect is that various parameters are used in the different presented approaches. A comparison
of the programs Catalyst, DISCO and GASP has been conducted on their ability to generate
known pharmacophores. That means the quality of the generated models was determined (113).
It turned out that GASP and Catalyst outperform DISCO and in doing so have nearly
equivalent performance. As the number of resolved ligand-bound protein structures increases
a new approach appeared that combines ligand-based and receptor-based techniques (114). It is
realized as a consensus strategy to maximally exploit the structural information available and
to improve the results obtained with either of the methods alone.

4.1 Used Hardware and Development Tools
42
4 Materials and Methods
4.1 Used Hardware and Development Tools
The calculation algorithms of the presented hybrid method were implemented using the C
programming language.
The serial version of the program was developed using the GNU-Compiler GCC version 3.x
under the operating system Linux on a PC with an Athlon 3 GHz processor and 1GB main
memory.
The first parallel version of the method was implemented using the GNU-Compiler GCC
version 3.x on a SGI Origin 3400. The machine is equipped with 28 processors and 56GByte
main memory. It has a ccNUMA-architecture, which means that the whole memory can be
linearly addressed from every processor, but physically it is distributed upon nodes with four
CPUs. This computer is scheduled for memory-intensive, serial and moderate parallel
programs. The 28 Processors are MIPS R14000-CPUs with 500 MHz with a L1-cache having
32 KB and a L2-cache having 8 MB. The theoretical bandwidth to the main memory is 1.6
GByte/s.
The parallel version of the program was later ported from the SGI Origin 3400 to a Linux
cluster using the GNU-Compiler GCC version 3.x. The Linux cluster consists of different
systems that are connected with Gigabit Ethernet. The cluster has 175 computing knots
thereof 64 computing knots with dual Xeon 3.20 GHz "Nocona" (800 MHz FSB / 666 MHz
RAM), 2 GByte RAM, 80 GB IDE main board per knot. Here, the computing knots with the
Xeon “Nocona” 3.2 GHz processors were used.
Production runs and test runs were handled with the queuing-system Torque. A parallel job is
delivered to the queuing-system with a job script.
The graphical user interface (GUI) of the hybrid genetic algorithm was implemented using the
JAVA programming language. The GUI was developed under the Windows operating system
on a Pentium-III-PC with 1 GHz and 250 MB main memory using the JBuilder IDE (versions
6 – X.).

4.2 Clustering Parameters of Physicochemical Properties
43
4.2 Clustering Parameters of Physicochemical Properties
The calculation of superimpositions of 3D structures with the presented hybrid GA is based
on the similarity of physicochemical properties. Cutoff values for chemical features that
define ranges, in which atoms are allowed to match with each other are calculated
automatically. To achieve this, a clustering method was implemented that is based on the
C Clustering Library (115) and on the statistics program Statist1.0.1 (116). Both programs are
written in the programming language C. Thus, it was possible to integrate relevant source
code into the superimposition program GAMMA.
The C Clustering Library was developed at the University of Tokyo in the Institute of
Medical Science of the Human Genome Center. It was originally developed for the analysis of
gene expression data to group genes and to identify similarities between their gene expression
profiles. The C Clustering Library is a collection of numerical routines that implement the
clustering algorithms that are most commonly used. The algorithms that are made available
are hierarchical clustering, k-means clustering, self-organizing maps, and principal
component analysis. To measure the similarity or distance between data, several distance
measures are available such as the Pearson correlation, the absolute value of the Pearson
correlation, the uncentered Pearson correlation, the absolute uncentered Pearson correlation,
Spearman’s rank correlation, Kendall’s τ, the Euclidean distance, the harmonically summed
Euclidean distance and the city-block distance.
The program Statist1.0.1 (http://www.usf.uni-osnabrueck.de/~breiter/tools/statist) offers
several statistical functions, too.
4.3 Amino Acid Sequence Database
The ASTRAL Compendium (117) is a web-based service providing access to databases and
tools for the analysis of protein structures and their amino acid sequences. The sequence data
can be accessed at http://astral.berkeley.edu. Most of the resources that are provided depend
upon the coordinate files maintained and distributed by the PDB (118). Also, the sequences are
partially derived from the SCOP (Structural Classification of Proteins) (119) database that
classifies protein entries from the PDB with respect to their structural and evolutionary
relationships. SCOP can be accessed on the WWW at http://scop.berkeley.edu. The

4.4 Multiple Sequence Alignment
44
hierarchical classification of protein domains comprises families, superfamilies, folds, classes
and species. The sequence data in the ASTRAL files is organized with respect to a SCOP
domain which can be organized as a genetic domain or as an original-style ASTRAL SCOP
sequence set. A SCOP domain may include fragments from different PDB chains. In a genetic
domain the fragments are concatenated in the order in which they appear in the original gene
or sequence. In the original-style ASTRAL SCOP sequence sets, there is a separate entry for
each chain. For the experiments in chapter 6 ASTRAL SCOP original-style sequence subsets
were retrieved, based on PDB SEQRES records, with less than 95% identity to each other.
4.4 Multiple Sequence Alignment
Multiple sequence alignment (MSA) was applied for the analysis of amino acid sequences.
The resulting alignments are used to find conserved consensus patterns. The aligned positions
are also applied to estimate evolutionary distance among the sequences to allow for
clustering. The resulting clustering tree reflects phylogenetic relationships among the
sequences.
The algorithm CLUSTALW (120) was applied for the MSA procedure. CLUSTALW is a
progressive method and gives individual weights to each sequence. First, all pairwise
alignments between sequences are performed and a distance matrix that gives the divergence
of each pair of sequences is calculated. The closest related sequences are aligned. The
resulting consensus alignment is then aligned with the next best sequence or cluster of
sequences, and so forth, until an alignment is obtained which includes all of the sequences.
The neighbor-joining method (121) is applied to construct phylogenetic trees out of the MSA. It
is applicable to any type of evolutionary distance data. The procedure tries to find a unique
final tree under the principle of minimum evolution. The principle of this method is to find
pairs of operational taxonomic units (OTUs [=neighbors]) that minimize the sum of branch
length at each stage of clustering of OTUs starting with a star-like tree. The branch lengths as
well as the topology of a parsimonious tree are received by this method.
Both methods mentioned above are available in the Jalview Java alignment editor (122).

4.5 Retrieval of Protein-Ligand Complexes
45
4.5 Retrieval of Protein-Ligand Complexes
Searches for similar sequences in the Relibase+ (123) database are carried out using the FASTA
sequence alignment algorithm (124). To facilitate the search process Relibase+ provides a
precalculated sequence alignment database comprising all entries stored in the PDB (125).
The FASTA method performs a local pairwise alignment of the search sequence with all
database sequences. First, initial regions of identity are searched in the query and the database
sequence using a look-up table. Then, a rescan is performed to find the 10 best identical
regions, to join the initial regions together and to locate the best matches. The 10 found
regions represent partial alignments without gaps. Afterwards, an optimization is applied
around the initial region to find the best fit.
The superimposition of ligand binding sites is accomplished using Relibase+. The ligand
binding sites are aligned onto a reference binding site by overlaying homologous protein
chains. First, the reference chain is selected and then a list of homologous protein chains is
retrieved from the preprocessed sequence alignment database. Afterwards, chains to be
superimposed are selected and aligned with the reference chain using a divide and conquer
alignment algorithm (126). The query and the target sequence are iteratively divided beginning
from the middle residue in the query. The divided sequences are aligned separately and then
merged. An optimal global alignment of two sequences with no short-cuts is determined.
Aligned positions that do not exhibit any insertions and deletions are extracted from the
results. The Cα atoms of the corresponding amino acids are used for a first coarse
superimposition. The next step is influenced by the choice if the superimposition is restricted
to the binding site Cα atoms or the whole main chain. If the process is restricted to the binding
site, then, in the next step it is tried to determine conserved residues amongst the binding sites
that are subsequently used for the final superimposition. If the superimposition is not
restricted to binding site Cα atoms, then, only 60 % of the Cα atoms that resemble the lowest
RMS deviations of superimposed Cα atom pairs are used. A transformation matrix that results
from the overlay is then applied to the entire structure.

4.6 Hydrogen Atom Addition
46
4.6 Hydrogen Atom Addition
Hydrogen atoms were added using CORINA version 3.2 (22) to generate neutralized
molecules.
4.7 3D Structure Generation
The number of compounds for which the experimental 3D structure information is available
from X-ray data is small compared to the total number of compounds. The 3D structure
generator CORINA was applied (22) to obtain 3D structural information for compounds where
no experimental data is at hand(127). CORINA converts the constitution of a molecule as laid
down in a connection table or linear string into a 3D low-energy conformation of a molecule.
This calculated conformation does not necessarily correspond to a bioactive conformation.
The method is capable of generating multiple conformations for ring systems of less than ten
ring atoms. CORINA is a rule and database computer program that uses tables with standard
values for bond length and angles. The compound is fragmented in acyclic parts, large rings
with a size of more than nine atoms and small/medium rings with less or equal nine atoms.
Therefore, CORINA handles rings and chains separately. Acyclic fragments are handled using
the principle of longest pathways. The main chains are extended as much as possible by
setting the torsion angles to anti or trans configurations, unless a cis-double bond is specified.
This method minimizes non-bonding interactions. Rings of up to a size of nine atoms are
processed using a table of single ring templates. Finally, the structures are reassembled. The
procedure for generating a 3D structure for polymacrocycles follows the so-called "principle
of superstructure". First, the ring system is reduced to its superstructure. Then, a 3D model for
the superstructure which contains only small rings can be generated by using the methods for
small rings.
4.8 Calculation of Physicochemical Parameters
The calculation of physicochemical properties is required for the alignment process with
GAMMA as chemical features are used as matching criteria. In the studies presented here, a
variety of atomic properties was used such as the octanol/water partition coefficient log P,

4.8 Calculation of Physicochemical Parameters
47
σ-electronegativity χσ, lone pair electronegativity χLP, the total charge qtot and the effective
atom polarizability αeff.
The log P values were calculated based on atomic increments by the XLogP method of Wang
et al. (128). The log P is calculated by summing the contributions of component atoms and
correction factors. Multivariate regression analysis of 1853 organic compounds with known
log P values was used to determine contributions of each atom type and correction factor.
Σ-Electronegativities, χσ, and σ-charges, qσ were calculated using the PEOE (Partial
Equalization of Orbital Electronegativities) procedure (129). Within the PEOE method charges
are derived by an iterative equalization of orbital electronegativities. If the two atoms of a
bond have different electronegativities, the more electronegative atom will attract electron
density from the other atom in an initial stage. The consequence is a charge separation that
induces an electrostatic field directed exactly contrary to the direction of the electron flow.
Therefore, only a fraction of charge is transferred and electronegativities do not equalize
totally but only partially. This partial equalization is achieved by an iterative scheme: after
each step of charge transfer new electronegativity values are calculated based on the new
charge values and, secondly, the fraction of transferred charge decreases within increasing
iteration number. The method is capable of describing short range inductive effects in the
σ-skeleton but is not appropriate for describing effects separated by larger distances as e.g.
resonance effects in π-electron systems. Therefore, π-electronegativities χπ,
lone pair electronegativities χLP and π-charge have to be calculated on another basis. For
experiments on the transition state inhibitor analogues the PEPE (partial equalization of
π-electronegativity) method as implemented in PETRA 3.2 was applied.
Within the PEPE method the concept of partial equalization of orbital electronegativities was
extended to π-systems (130). The concept of resonance is used to treat a compound as an
ensemble of different valence bond resonance structures having a different distribution of
localized π-bonds and formal charges. Weights are assigned to the different resonance
structures and the “real” molecule is treated as a hybrid of all contributing resonance forms.
The PEPE scheme was later replaced by calculations based on the Hückel Molecular Orbital
(HMO) theory. The HMO theory was modified to include inductive effects that are normally
not accounted for (131). The Hückel theory is derived from quantum mechanical principles and
takes into account σ- and π-interactions and pseudo-hyperconjugation. The PEOE/MHMO

4.9 BioPath Database
48
scheme was implemented into the in-house programming library MOSES. This
implementation was used for all other experimental approaches in this work.
Total atomic partial charges, qtot, were used as the sum of the σ- and π-partial charges.
Values for the polarizability were calculated using an additiviy scheme. The implementation
estimates the mean molecular polarizability (MMP) as the sum of the contributions of atoms (132). The atomic increments are dependent on the hybridization state. To describe the decrease
in stabilization of charge with the distance from the charge center a damping function is
applied. The value of effective polarizability is a quantitative measure of the stabilization
energy resulting from the effect of polarizability.
The methods mentioned above to calculate atomic properties are available through the
program package PETRA (Parameter Estimation for the Treatment of Reactivity Applications)
and by calculation modules based on the C++ framework MOSES written in-house (131,133).
4.9 BioPath Database
The BioPath biochemical pathways database is a database of molecules involved in the
endogenous metabolism and of the reactions interconverting them. The database was
produced from the information which is contained on the famous wall-chart distributed by
Boehringer Mannheim, now Roche (134). In order to make the wealth of data contained on the
poster and the corresponding atlas (135) accessible by computational methods, effort was made
to input all information into a database. For this purpose, all structures were entered as
connection tables, lists of all atoms and their bonds. Reactions were represented by their
starting materials and products and cofactors involved, giving the full stoichiometry of the
reaction including even protons. Furthermore, all atoms of the starting materials were mapped
onto those of the products, indicating their correspondence by the numbers of their atoms and
all reaction sites where bonds are broken, made, or altered were marked. This latter feature
makes the database unique among all other databases of metabolic pathways like for example
KEGG (136), BioCyc (137) or MetaCyc (138). Additionally, each reaction was enriched by
supplementary information such as enzyme name, EC number, the pathway the reaction is
part of, and the organism it occurs. The BioPath database presently consists of about 1545
reactions and more than 1175 structures. BioPath has been made accessible through the

4.10 A Database of Druglike Compounds
49
C@ROL (Compound Access & Retrieval On Line) (139) retrieval system on the web at:
http://www2.chemie.uni erlangen.de/services/biopath.
Of eminent importance for the application reported here is that all reactions in BioPath have
their reaction centers marked, i.e., the bonds broken and made in a reaction are indicated and
the atoms of those bonds are mapped from the starting materials onto those in the products.
This allows the automatic construction of reaction intermediates (used in chapter 6.3).
4.10 A Database of Druglike Compounds
To perform virtual database screening the MDDR-05.1 (MDL® Drug Data Report) database (140) of druglike molecules was used. The MDDR is a commercially available database that
contains bioactivity data for newly launched or developmental drugs including searchable 3D
models. The contained molecules have been synthesized, screened in vitro and are intended
for medical use. The MDDR was developed by Prous Science. The version of the MDDR
database that was used in chapter 6.4 contained 159662 entries.
Access to the MDDR can be gained with the database management system ISIS/Base (141). It
allows the storage, retrieval and searching of compounds with customizable forms. ISIS/Base
provides techniques to filter compound databases as e.g. the molecular weight, the computed
octanol/water partition coefficient log P, the number of rotatable bonds, the number of
hydrogen-bond acceptors and donors, and other search criteria.
4.11 Visualization of Molecular Structures
The figures in the paper were prepared and produced by the free Molecular Graphics
Visualization Tools WebLab Viewerlite 3.7 (142) and RasTop 1.3.1 (143). WebLab ViewerLite
uses OpenGL graphics for visualizing molecular models. RasTop is a graphical interface to
the program RasMol adapted for Windows platform.

5.1 Overview of the Hybrid Genetic Algorithm
50
5 GAMMA: A Superimposition Method for Flexible
Molecules
5.1 Overview of the Hybrid Genetic Algorithm
The program GAMMA is based on preliminary work of M. Wagener (15) and S. Handschuh (15,16) to compare chemical structures through molecular superimpositions by matching
corresponding atoms. Originally, the method was developed for the topological comparison of
two compounds. Then, the method was extended to the flexible treatment of pairs and of sets
of multiple three-dimensional structures (56).
The method is capable to overlay the structures independent of their initially chosen
conformation. Thus, only one start conformation is necessary per structure. The task to
optimize the atomic alignment of the three-dimensional structures is solved by a hybrid
genetic algorithm (GA). The term hybrid was introduced because it is a combination of a
genetic algorithm and a numerical optimization method.
The optimization process does not start from a single starting point but from a population of
different individuals. Every individual consists of two independently handled chromosomes.
The chromosomes represent potential solutions for the search problem. One of the two
chromosomes encodes the match of the atoms of the compounds to be superimposed. The
other chromosome encodes torsion angles if flexibility of the molecules is taken into account.
The combination of the solutions that are represented by the two chromosomes flows into the
configuration of the overall solution that is represented by an individual. The individuals of
the start population are randomly initialized and then subjected to a selection procedure. The
probability for an individual to be transferred into the next generation of the GA depends on
its goodness. A fitness score represents the goodness, which is again a measure for the
adaptation of the individual to the problem space. The search for the 3D maximum common
substructure (3D-MCSS, see chapter 1.2) comprises two conflicting criteria that have to be
optimized. On the one hand, the number of matching atoms between the molecules has to be
maximized and, on the other hand, the deviations in the coordinates of the superimposed
atoms have to be minimized. After selection the genetic operators modify the individuals
again. Consequently, a complete optimization applying a GA begins with the initialization of
the start population and ends with obtaining a set of optimized solutions after cycling through
all generations. The genetic operators, selection, mutation and recombination are iteratively

5.1 Overview of the Hybrid Genetic Algorithm
51
applied with a certain predefined probability to the chromosomes of an individual. Two
additional operators called creep and crunch are introduced in the program GAMMA that are
tailored specifically to the MCSS search problem. Both do not function only by chance. The
solutions of a GA are retrieved through a non-deterministic process and do not necessarily
represent the global minimum of the search space. In order to alleviate this problem an
optimization method called directed tweak is applied to the individuals of the consecutive
population. The directed tweak method leads to an adaptation to the conformational space of
the compounds to be superimposed by changing their torsion angles. The goodness of the
alignment after application of the directed tweak procedure to an individual is the basis for its
probability to survive the selection process. To retrieve an optimal solution it is usually
necessary to perform several runs of one GA. It should be mentioned that the method
calculates more than one solution except the user decides that the algorithm should display
just one single best result.
In the following chapters, the small molecule superimposition program GAMMA and the
developments and changes that have been applied in the course of this work will be discussed.
One of the aims of this thesis was to extend the hybrid method and to optimize the usability
for screening and high-throughput purposes so that the 3D-MCSS search can be applied to
large databases. In chapters 5.1 to 5.3, 5.5 and 5.6 an introduction to the basic hybrid genetic
algorithm of the program GAMMA is given that represents the status prior begin of this work.
New features that were implemented in the course of this work are summarized in the other
chapters. In chapter 5.4 a method is shown to select one best Euclidean compromise solution
out of a set of Pareto optimal solution. The automatic calculation of cutoff values for chemical
features that define ranges, in which atoms are allowed to match with each other, is discussed
in chapter 5.7. An abort criterion for the optimization procedure is summarized in chapter 5.8.
The parallelization of the serial genetic algorithm using an island model allowing for the
exchange of genetic information between different parallel processes is described in chapter
5.9. Subsequently, chapter 5.10 discusses the generation of ring conformations using the 3D
structure generator CORINA in a library version

5.2 Genetic Data Structure
52
5.2 Genetic Data Structure
A major task in adapting a GA to a specific search problem is the encoding of possible
solutions in the individuals. The problem to identify good solutions for the molecular
superimposition of conformationally flexible three-dimensional structures has to be described
by a formalism that resembles some kind of genetic information. Nature stores all possible
solutions of a problem in the form of chromosomes. An approach was chosen that represents
such a solution as an individual which is in turn represented by a data structure that consists
out of two independent chromosomes. The whole of the individuals represents the population
of the GA. Thus, the 3D-MCSS search problem is decomposed into two partial problems that
are optimized separately.
5.2.1 A Chromosome Encoding a Match Lists of Atoms
The data structure encoded in the first chromosome represents atom to atom mappings
between the molecules taking part in the match. Hence, a matchlist is available that is realized
as a fixed-length linked list. The matching of non-hydrogen atoms is coded by integers. Each
atom is allowed to appear only once in the matchlist to inhibit double allocations. This
condition is observed by the genetic operators.
A match list is defined by the number of molecules to be superimposed, n, and the number of
non-hydrogen atoms, N, of the largest molecule. This results in an n·N table in which the
molecules are organized as rows and the columns contain their atoms. The molecules are
sorted according to their size. The size of the substructure is determined by match tuples
wherein at least one atom of every molecule has to participate.
The first step in the previous program version was to initialize the individuals by calculating
all possible combinations of the non-hydrogen atoms contained in the molecules. The
maximum number of combinations is Nx·Ny·Nz. whereby Nx represents the number of
non-hydrogen atoms in the molecule x. The matching criteria are already considered with
forming all these combinations. These criteria include physicochemical properties, as e.g. the
atomic partial charge. The final number of combinations can be smaller then Nx·Ny·Nz when
following this restriction. The individuals are then initialized by a random selection of atomic
tuples from the pregenerated matchlist. If redundant references to atoms arise by this

5.2 Genetic Data Structure
53
selection, then the atom is replaced by another one that is not yet in the list or by a zero-
mapping.
Despite the minimization of possible matches through the matching criteria the number of
possible combinations is growing exponentially with the number of molecules and with the
number of atoms. This proofed to be not practicable in memory usage. Therefore, the
mechanism for generating the matchlist was altered. A matchlist of an individual is now
initialized by initially filling the first row of the table with the atoms of the largest molecule.
Next, the rows of the table are filled with randomly selected atoms of the remaining
molecules. If multiple assignments of one or more atoms are occurring in a row then this atom
is replaced by another not yet chosen atom or by a zero-mapping. Matching criteria as
mentioned above are taken into account when building these matches. The advantage of the
new initialization routine is that it is now possible to increase the number of molecules for a
multiple molecule alignments. The main memory usage was scaled down by a factor of about
103 from the gigabyte range to the megabyte range compared to the previous program version.
5.2.2 A Chromosome Encoding Torsion Angles
GAMMA introduces conformational flexibility during the superimposition of 3D molecular
models. This is essential to optimize the geometric fit in the 3D-MCSS. Suitable
conformations of the molecules have to be generated therefore. Also, a suitable description for
the torsion angles has to be found. This was realized in a second chromosome that consists of
a list of bit strings representing the torsion angles of the flexible molecules. Each bond that is
at both ends connected to at least one multi atom substituent but not a ring bond (e.g. a methyl
group) is defined as rotatable. A fundamental problem arises when applying this coding
scheme. The distribution of torsion angles should be large enough to cover the whole
conformational space. But this leads to convergence problems and thus to high computation
times. Each possible change of a torsion angle is binary coded in 8-bit (112). All torsion angles
of all flexible compounds are concatenated to one bit string. Thus, each bit string has the
length of 8ntor, with ntor being the sum of torsion angles in all molecules. For this kind of
coding the Gray form of the binary representation is selected. Gray coding has the advantage
that adjacent integer values differ only in one bit in contrast to the standard binary encoding.
When using the standard binary coding several bits are changing with a step from one integer

5.3 Genetic and Non-Genetic Operators
54
value to another. In contrast, Gray coding allows having smaller impacts on the phenotype of
the solution when altering the bit string.
The first step of the angle coding process is the transformation of the angle values that range
from -180º to +180º into integers ranging from 0 to 256. The angle -180º then corresponds to
the integer number 0, +180º corresponds to 255 and 0º corresponds to 128. The second step is
to transform the integer value into an 8-bit Gray coded string. The smallest possible torsion
angle change is 1.4° (256/180°).
5.3 Genetic and Non-Genetic Operators
The individuals change their genetic configuration during the optimization process. To permit
such alterations adequate modifiers have to be implemented. In a genetic algorithm such
modifiers are called genetic operators and the way they are acting is derived from how nature
alters genetic information. Because we have two chromosomes for one individual with a
different encoding scheme the genetic operators change the two chromosomes, the match list
and the torsion angle bit string, in a different manner.
5.3.1 Crossover
A Crossover operator exchanges coincidentally selected parts between two individuals. The
crossover operator is the most important mechanism for the improvement of the individuals
during the genetic optimization.
The crossover operator that acts on the first chromosome selects partial substructures in the
matchlists of two different individuals by chance and generates two new potentially better
solutions. The mechanism that was implemented in GAMMA is a so-called two point
permutation crossover. First, two crossover points are randomly selected in two chromosomes
of two parental individuals. The information string that is to be crossed is contained in
between these two points. It is needed that the selected partial substructures have to be of
equal length. Next the partial list of the chromosome of one parental individual is copied and
attached to the tail of the chromosome of the other parental individual. In this first step,
double allocations may be introduced that have to be deleted later on. If an atom of molecule I
appears twice in the match list, the corresponding original match pair has to be replaced by

5.3 Genetic and Non-Genetic Operators
55
the new one that was copied to the tail. If there are still double assignments existing for a
molecule then they are replaced by another randomly chosen atom that fulfills the matching
criteria. Otherwise, if there are no more atoms that obey these restrictions, a zero mapping has
to be introduced.
The crossover operator acting upon the second chromosome of torsion angles is a one-point
crossover. That means that one point is chosen by chance at the same position in both parental
strings. Afterwards, the partial bit strings beyond that position are swapped between the two
parent chromosomes. This results in the change of a torsion angle and the generation of a new
conformation.
5.3.2 Mutation
A mutation causes a punctual change in the genetic material of an individual. In the case of
the matchlist atom tuples are randomly altered. The number of mutation points for a matchlist
that contains n molecules is n-1 because the first molecule cannot be mutated. These points
are selected by chance with exactly one mutation point for every molecule. The boundary
condition must be considered that every atom is allowed to appear only once per row in the
match table. Hence, the considered atom has to be changed into one that is not yet in the
match list and if this is not possible a zero-mapping is introduced. Also, the matching criteria
have to be taken into account.
The second mutation operator that changes the torsion angle bit string inverts one bit of a
binary coded torsion angle string. A 1 bit is converted into a 0 bit or vice versa. In the old
program version of GAMMA the torsional mutation operator has changed every torsion angle
in all molecules whilst in the current version this was reduced to only one mutation per bit
string. This reduces the tendency of dispersing conformations with a simultaneous mutation of
all torsion angles. As already mentioned the torsion angles are encoded using the Gray
method. With Gray coding of integers a certain angle value can be set in small steps by a
simple mutation. This is not possible with the standard binary coding scheme. Therefore, Gray
coding is more suitable for the treatment with genetic algorithms.

5.3 Genetic and Non-Genetic Operators
56
5.3.3 Creep and Crunch
The two genetic operators described so far, crossover and mutation, are an exact imitation of
their models from natural genetics. Both do not include certain knowledge of the search
problem that has to be optimized. With respect to the superimposition problem one can call
them “blind”, since the Fitness of the generated individuals is only evaluated later. To increase
the efficiency of the GA additional knowledge should be brought into the search process.
Therefore, two additional operators called creep and crunch were developed that are better
tailored to the search problem. Hence, they are called knowledge-augmented operators. Since
it is not the task of a GA to simulate nature but rather to solve an optimization problem, the
employment of operators that do not have a correspondence in nature makes sense. In contrast
to crossover and mutation they do not act stochastically and they are only applied to the first
chromosome, the matchlist with assignments of atoms of the molecules.
The creep operator increases the size of the substructure by adding a tuple of matching atoms
to the matchlist while obeying restrictions imposed by the spatial arrangement of the atoms.
The newly added atomic tuple must not cause a large increase in the distance parameter, D,
value of the original match. The distance parameter, D, describes how well the conformations
of the three-dimensional structures to be compared are adapted to each other.
In a first step of the creep operation two atomic tuple are coincidentally selected. Afterwards,
the distances of the atoms within the tuple to every other atom in the associated molecule that
is not yet involved in the overlay are calculated. That results in the distances d1moli and d2moli
for molecule i and d1molj and d2molj for molecule j. If the two calculated differences
d1moli - d1molj und d2moli - d2molj are smaller or equal a defined threshold the atoms of the newly
found atom tuple are allowed to become part of a new match tuple. This procedure reflects
some kind of hill climbing because it recognized still missing atom tuples in a common
substructure and leads to some additional progress on the way to the maximum.
The crunch operator acts as an antagonist to the creep operator in reducing the size of the
substructure. The goal of the crunch operator is to eliminate match pairs which are responsible
for bad geometric distance parameters. This operator avoids that the search process becomes
being trapped in local optima during the optimization process. The first step is the selection of
an atom tuple from the matchlist of the individual. Next, the distances within a molecule
between this atomic tuple and all other atomic tuples are calculated. This results in the

5.3 Genetic and Non-Genetic Operators
57
distances dmoli and dmolj. The calculation of the difference dmoli - dmolj helps to identify atom
tuples, whose molecule-internal distances deviate strongly from other atomic tuples, i.e. the
difference dmoli - dmolj exceeds a certain tolerance value. As a consequence the atomic tuple is
replaced by a zero-mapping or new atoms of other molecules are selected randomly to build
new atom tuples.
5.3.4 Automatic Adaptation of Operator Probabilities
The genetic operators act on the chromosomes of the individuals with a certain user defined
probability. It is problem that one cannot assume that a certain combination of operator
probabilities to be generally valid for all optimization processes, since all operators can affect
each other mutually in their effects. An optimal operator probability combination can not be
easily determined. A simultaneous variation of all operator probabilities would require 116
GAMMA runs. Hence, another procedure was incorporated that adapts the probabilities of the
operators during the optimization process. This has the advantage that it is not necessary to
control the process from outside. The probability, with which an operator is used in the
optimization process, is changed according to the fitness of the produced individuals. If the
fitness of an individual is outstandingly high, the probability of the operator, that generated
this individual, must be increased. However, it is not sufficient to reward only the operator
that is directly responsible for an individual. Also all the operators that created the conditions
for the last step must be rewarded. Accordingly, the probabilities of the operators that have
negatively contributed to the fitness are reduced. This adaptation of the probabilities takes
place at the end of each generation.
5.3.5 Selection
A selection process has to be established after the modification and the generation of new
individuals. This selection mechanism is responsible to move individuals from one generation
into the next one based on their relative fitness. The selection operator causes evolutionary
pressure by applying a filter that allows only the fittest individuals to pass. This procedure
corresponds to Darwin's theory of survival of the fittest. Different selection strategies exist for

5.3 Genetic and Non-Genetic Operators
58
a GA. The choice of a certain selection procedure has a strong impact on the selection
pressure.
A commonly used selection procedure in literature about genetic algorithms is roulette wheel
selection. Each individual receives a sector on a roulette wheel. The number of compartments
of the wheel corresponds to the number of individuals. The size of a sector is proportional to
the percentage of fitness of the individual with regard to the fitness of the entire population. In
order to generate a complete new population, the wheel must be turned as often as individuals
are contained in the population. This selection procedure is based on the assumption that the
probability for an individual to be shifted into the next generation is proportional to its fitness.
Therefore, this procedure is also called proportional selection. If some of the individuals
posses an overproportional fitness, the problem arises that they supersede the other
individuals to fast. The consequence is the arising of premature convergence. Most
individuals then become extinct already at the beginning of the optimization within fewer
generations, because they do not have a chance of survival with a selection pressure to high.
Afterwards the optimization stops, since no more genetic variety is prevailed.
An improved version of this selection technique goes through two stages. In the first stage the
expected number of descendants of each individual ei is determined. It is given by the
probability of selection pi and the size of the population N.
Npe ii ⋅= (1)
Afterwards the floating point value of ei is converted into a discrete number of descendants ni.
Errors can occur in this transformation step because ni can adopt arbitrary values within the
range between 0 and N, although with different probabilities. These errors can be reduced by
an improved selection procedure. Thereby each individual gets as many descendants, as
denoted by the integer portion of ei. The remainder of the new population is then filled up
with the help of a roulette wheel. However, only the right-of-comma positions of ei are used
for the weights of the compartments and additionally, if a compartment was selected it will be
removed from the roulette wheel. As a consequence, this individual is no longer taken into
account in further turns of the wheel. By this procedure the error is minimized. This selection
procedure is known in literature as remainder stochastic sampling without replacement (144).
An alternative selection mechanism is the linear ranking selection (LRS) which is based on
the linear rank scaling (145). The probability of an individual to survive the selection procedure

5.3 Genetic and Non-Genetic Operators
59
is not determined by the fitness value of an individual but on its rank derived from its fitness.
In linear rank scaling the selection probability pi is a linear function of the individual’s rank. If
N is the size of population and ri corresponds to the rank of the individual i in a descending
sorted population according to the fitness then the selection probability is given by the
following function:
−
−−−=
11
)(1
minmaxmaxN
r
Np i
i ηηη (2)
The parameters ηmax and ηmin are two control parameters that determine the maximal and
minimal selection probability for the best and the worst individual. For normalization reasons
the following two assumptions count:
212 maxmaxmin ≤≤−= ηηη and (3)
In proportional selection and in linear rank scaling also the worst individual has a chance to
survive.
5.3.5.1 Ecological Niches: Crowding and Sharing
The search space of the 3D-MCSS consists out of several local optima that can be far away
from each other. Thus, it can happen that the GA converges to a not optimal solution. In order
to avoid premature convergence to a not optimal solution and to maintain the genetic variety,
the initial population should consist of as various a members as possible that are relevant for
the solution. Another way to achieve the same goal is based on the knowledge that the search
area can be divided in niches (56,57,27). This is a model derived from ecology in which one or
more organisms have similar characteristics that are particularly adapted to the requirements
of the ecological niche. Transferred to the GA this means that a niche is a local optimum,
which is occupied by several similar individuals, in our case similar match lists. Thus,
methods have to be found that make it possible that not only one niche is occupied, but as
much different niches as possible, among them also the global optimum. In this way the
genetic variability in the population is kept on a high level. Two different procedures are
described here to divide a population into niches: crowding and sharing. In sharing it is
considered how many similar individuals exist in the population. The more individuals
occupy a certain optimum, the more their fitness is reduced. Another method to introduce

5.4 The Fitness Function
60
niches is crowding. An individual generated from a genetic operator does not replace one of
his direct ancestors but another individual which is similar to it. Hence, a subpopulation is
determined randomly. The size of this subpopulation is given by a crowding factor. The
member of the partial population, that is most similar to the newly developed individual, is
replaced by it. With this procedure a higher genetic variety is ensured during the optimization.
5.3.5.2 Restricted Tournament Selection
In order to prevent loss of genetic varieties, which could arise with the roulette wheel
selection, a further type of selection was implemented. Its procedure is influenced by the
above mentioned crowding method. This alternative is called restricted tournament selection
(RTS) (146). RTS is a modification of the binary tournament selection in which pairs of
individuals are chosen at random from the entire population and both individuals have to
compete in a tournament for a place in the new population. Thus, RTS is based on the concept
of local competition. The RTS does not select the individuals by chance but by their similarity
to each other. In RTS an individual I is chosen from the basic population by chance and
changed by the genetic operators into a new element I’. For each I’ a small subpopulation
with an optional member size Srts is selected from the basic population. The individual II that
is most similar to I’ among the chosen individuals is saved. I’ has then to compete with II for
a place in the new population. The winner of the tournament is then shifted to the next
generation of the GA. This form of binary tournament restricts an individual from competing
with individuals too different to it and a rapid decrease of genetic variety can be prevented.
Another advantage of the described mechanism of RTS is the possibility of the so-called
continuous selection. A continuous selection allows individuals from different generations to
compete with each other.
5.4 The Fitness Function
5.4.1 The Fitness Function Defined by a Linear Combination
The careful selection of the fitness function is of importance for the successful application of
a GA. It is the only information, that can be used for proceeding the optimization. In the case
of an optimization with boundary conditions, a penalty function is used, so that these
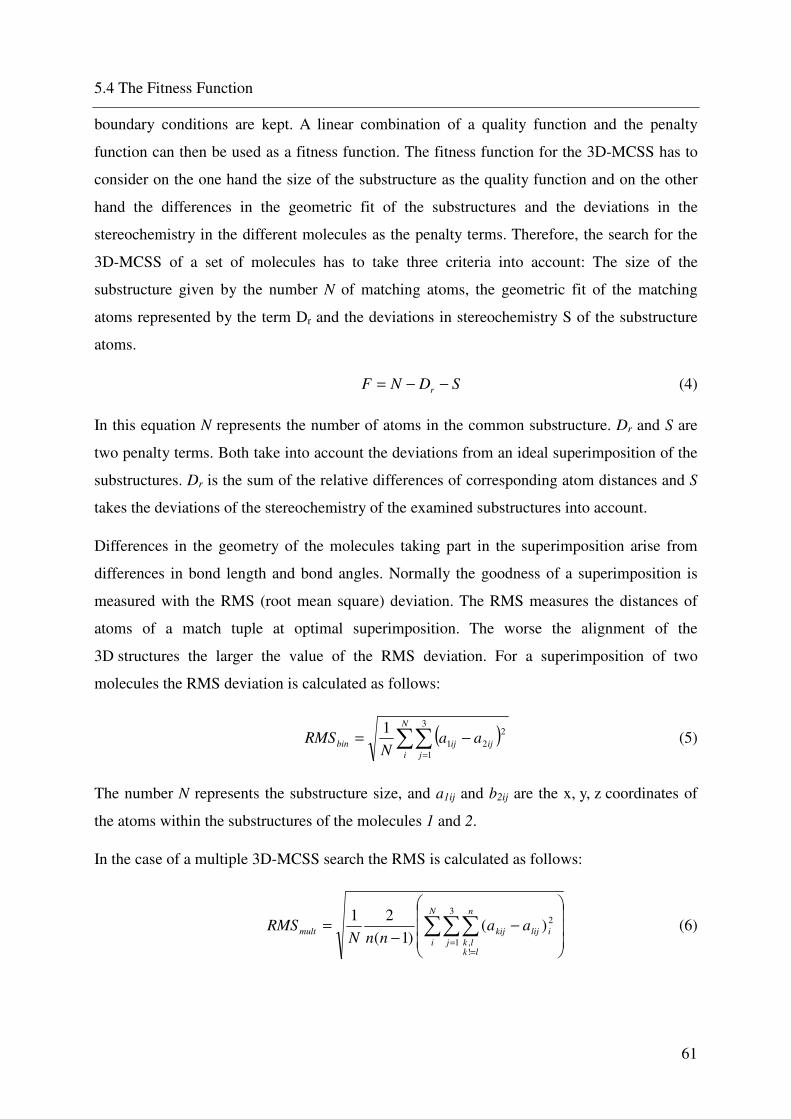
5.4 The Fitness Function
61
boundary conditions are kept. A linear combination of a quality function and the penalty
function can then be used as a fitness function. The fitness function for the 3D-MCSS has to
consider on the one hand the size of the substructure as the quality function and on the other
hand the differences in the geometric fit of the substructures and the deviations in the
stereochemistry in the different molecules as the penalty terms. Therefore, the search for the
3D-MCSS of a set of molecules has to take three criteria into account: The size of the
substructure given by the number N of matching atoms, the geometric fit of the matching
atoms represented by the term Dr and the deviations in stereochemistry S of the substructure
atoms.
SDNF r −−= (4)
In this equation N represents the number of atoms in the common substructure. Dr and S are
two penalty terms. Both take into account the deviations from an ideal superimposition of the
substructures. Dr is the sum of the relative differences of corresponding atom distances and S
takes the deviations of the stereochemistry of the examined substructures into account.
Differences in the geometry of the molecules taking part in the superimposition arise from
differences in bond length and bond angles. Normally the goodness of a superimposition is
measured with the RMS (root mean square) deviation. The RMS measures the distances of
atoms of a match tuple at optimal superimposition. The worse the alignment of the
3D structures the larger the value of the RMS deviation. For a superimposition of two
molecules the RMS deviation is calculated as follows:
( )∑∑=
−=N
i j
ijijbin aaN
RMS3
1
221
1 (5)
The number N represents the substructure size, and a1ij and b2ij are the x, y, z coordinates of
the atoms within the substructures of the molecules 1 and 2.
In the case of a multiple 3D-MCSS search the RMS is calculated as follows:
−−
= ∑∑∑=
=
N
i j
n
lklk
ilijkijmult aannN
RMS3
1!,
2)()1(
21 (6)

5.4 The Fitness Function
62
Again, the number N represents the substructure size, n is the number of molecules and akij
and alij are the x, y, z coordinates of the atoms within the substructures of the molecules k and
l. The term )1(
2−nn
reflects the possible number of combinations for calculations of atomic
distances with n molecules.
However, the RMS value shows large deviations even if the changes in a superimposition are
only small. To alleviate this problem another fitness function was chosen which is not affected
by such strong deflections. The relative differences of corresponding distances in the
substructures serve as a measurement for the goodness of a matchlist instead of the RMS
value.
The usage of relative atomic distances prevents a single strong deviation from dominating the
whole fitness function. The term Dr, for the relative differences of corresponding atom
distances indicates the geometrical quality of the overlay of two molecules and is defined by
the following equation:
∑∑=
−=
N
i
N
ijj
binrjidjid
jidjidD
!21
21_ )),(),,(max(
|),(),(| (7)
In this equation i and j represent two of the N match pairs, d1(i,j) and d2(i,j) represent the
distances of the atoms in molecule 1 and molecule 2 respectively. The two arguments i and j
define to which match pair the atoms belong of which the distance is used.
In the case of a multiple 3D-MCSS search the term Dr is adapted in analogy to the RMS for
multiple superimpositions and is calculated as follows:
∑∑∑= =
−
−=
N
i
N
ijj
n
lklk lk
lk
multrjidjid
jidjid
nnND
! !,
_ )),(),,(max(
|),(),(|
)1(21
(8)
The parameters i and j representing two of the N match pairs, n is the number of molecules,
d1(i,j) and d2(i,j) represent the distances of the atoms in molecule 1 and molecule k
respectively. The two arguments i and j define to which match pair the atoms belong of which
the distance is used. The term )1(
2−nn
reflects the possible number of combinations for
calculations of atomic distances with n molecules.

5.4 The Fitness Function
63
To ease the discussion Dr_bin and Dr_mult will be summarized as Dr. If only distances are used
to describe the geometry then an additional term has to be introduced in the fitness function
that compares the stereochemistry of the substructures. If the structures to be overlaid are
enantiomers, the computed Dr Parameters would be completely identical. Structures that are
compared can be enantiomeric to each other as soon as they contain four or more atoms.
When larger compounds are superimposed then it is possible that some parts of the
substructure can be aligned perfectly whilst other parts behave like two non-superimposable
mirror images. In order to consider the stereochemistry of the substructures a descriptor is
computed for each atom tuple that describes the local spatial environment of the atoms of the
atom tuples, if the match list contains more than three pairs of matches. The term S is then
described as the sum of the stereochemistry parameter Si over all atomic tuples:
∑= iSS (9)
The descriptor Si of a match tuple is determined by spanning a plane in the molecules that
have to be compared. The planes are defined by the atoms of the nearest three match pairs in
the match list. One plane is spanned by the three atoms of the first molecule, and the other
plane is spanned by the assigned atoms of the second molecule. If the fourth atoms are on the
same side of the according plane, then they agree in their stereochemistry. However, if they
are on different sides, then the atoms of the regarded match tuples are arranged like mirror
images in the three-dimensional space. The descriptor Si is taken as the larger distance of the
two distances between the according planes and the corresponding central atom. Therefore, it
not only considered that the two atoms have a different arrangement in space, but also their
deviation from each other is considered.
<⋅
>⋅=
0),,max(
0,0
2121
21
iiii
ii
iddifdd
ddifS (10)
5.4.2 Multi-Objective Fitness Function
The search for the 3D-MCSS is a multi-objective optimization (MOO) problem as two
independent functionalities have to be set: the size of the substructure and the geometric fit.
MOO is also known by various other names, including Pareto optimization. To solve the
MOO problem with stochastic methods in an acceptable timeframe, specific multiobjective

5.4 The Fitness Function
64
evolutionary algorithms (MOEAs) or multiobjective genetic algorithms (MOGAs) were
developed. As mentioned above, a worse geometric fit can be seen as a penalty term
influenced by two parameters, the differences of corresponding atom distances and deviations
in the stereochemistry. The quality term and the penalty term are contradictory parameters.
The substructure size has to be as large as possible whereas the deviation in the positions of
the superimposed atoms should be as low as possible. Above, both were combined in a linear
fitness function to find an optimal goodness for the individuals. But now both parameters are
regarded as separated criteria that have to be optimized independently. Vilfredo Pareto
developed a concept for solving multi criteria optimization. He defined that an optimized state
exists if none of the criteria can be improved further without making the other one worse (17).
Transferred to the 3D-MCSS search problem this means that the size of the substructure and
optimize the geometric fit have to be simultaneously maximized. Not only one probably
perfect substructure per GA experiment is obtained but for each possible size of the common
substructure an optimal geometric fit is produced that cannot be further minimized. Such
solutions are called non-dominated or Pareto optimal and they are lying on a surface known
as the Pareto optimal frontier (17). If a certain solution corresponds to a vector from which it is
assumed that it is better than another since it is partially smaller, then a definition of the
Pareto optimality is that the vector u is partially smaller than v, symbolically: u<pv, if the
following conditions are kept:
))(())(()( iiii vuivuipvu <∃∧≤∀⇔< (11)
The parameters ui, and vi are components of u and v, ∀ is the allquantor (all elements…) and
∃ is the existential quantor (at least one element). Under these conditions it is possible to say
that vector u dominates vector v. If vector u is neither dominated nor dominating, both vectors
are equivalent solutions of the problem.
The solutions of a Pareto optimization can be visualized providing a Pareto plot. In our
3D-MCSS search the Pareto curve connects the substructure sizes with the RMS values of the
superimpositions. This allows the user to pick a genetic individual that is part of the Pareto
optimal solutions and perform visual inspections.

5.4 The Fitness Function
65
5.4.3 Modified Distance Parameter
As described above, the computed parameter Dr uses the relative differences of corresponding
distances in the described substructures. The application of relative differences prevents too
strong deviations to dominate the fitness function. When applying the Pareto optimization
without a linear combination for the calculation of the fitness value we are not bound to the
term Dr anymore. A modified distance parameter D can be used that is easier to calculate, as it
does not use a standardization concerning the maximal distance. Another difference is that it
uses the squared distances of corresponding atoms instead of absolute distances and sums
them up. For the superimposition of two molecules the distance parameter D is calculated as
follows:
∑=
−=N
ijji
bin jidjidD
!,
221 )),(),(( (12)
Here, with d1(i,j) and d2(i j) are the atom distances in molecule 1 and molecule 2, N is the
number of match pairs or size of the substructure and i and j are the indices of the atom tuples
that have to be compared.
In the case of a multiple 3D-MCSS search the term D is adapted in analogy to the formulas
above and is calculated as follows:
∑∑= =
−−
=N
ijji
n
lklk
lkmult jidjidnn
D
!,
!,
2)),(),((2
)1(41
(13)
The parameters dk(i,j) and dl(i j) are the atom distances in molecule k and molecule l, N is the
number of match pairs or size of the substructure, n is the number of molecules and i and j are
the indices of the atom tuples that have to be compared. To ease the discussion, Dbin and Dmult
will be summarized as D. The distance parameter D describes how well the conformations of
the three-dimensional structures to be compared are adapted to each other. D is computed as
the square of the difference of the atomic distances in molecule k (dk(1,4)) of the atomic tuples
i and j and the atomic distances in molecule l (dl(a,c)) of the atomic tuple i and j. Thus, D is
more related to the RMS deviation than Dr. As mentioned above, the RMS value is subject to
large changes even if the superimposition changes only slightly. Therefore, the distance value,
D, is better adapted to the specific use during a GA optimization as it does only use internal

5.4 The Fitness Function
66
distances. However, the RMS value of an overlay is computed uniquely at the end of each
program run and serves as a measurement that can be analyzed by the user.
5.4.4 Pareto Front Exploration
As mentioned above MOO permits several – possibly conflicting – objective functions, which
are to be ‘optimized’ simultaneously. Not only one substructure is obtained per GA
experiment as a solution, but for each possible size of the common substructure one optimal
geometric fit is produced that cannot be further minimized. The solutions can be found on a
surface known as the Pareto optimal frontier (17). If a single or even only a limited set of
3D-MCSS search experiments is analyzed, it is possible to analyze the results provided by a
MOO. But if larger datasets or even virtual screening experiments have to be analyzed this is
not feasible any more.
An approach is needed that automatically extracts one optimal solution from the Pareto front.
This leads to the concept of the ideal point, or utopia point (147). For each objective function it
specifies the optimal feasible value. The points on the Pareto front have to be as close to the
perceived ideal as possible. A so-called Euclidean compromise solution was proposed that
selects the best point in such a way that it minimizes the Euclidean distance to the utopia
point (Figure 5).
In the case of a 3D-MCSS search the final solutions of the hybrid GA are presented using the
RMS deviation as a measurement for the geometric fit. Hence, the utopia point is defined as
the maximally possible substructure size and the minimal possible RMS. The maximal
possible MCSS is always restricted by the number of heavy atoms of the smallest molecule in
the superimposition set and the minimal possible RMS is always zero. First, a coordinate
system is defined wherein the x-axis represents the substructure size and the y-axis represent
the RMS value. Subtracting the minimum values of the substructure size and the RMS
deviations scales the x and the y values. Afterwards, both axes are normalized by dividing the
x values and the y values through the maximum values of the substructure size and the RMS
deviations. For both, the substructure size and the RMS error, we end up with values in a
range between 0 and 1.

5.5 Close Contact Check
67
Figure 5: Optimal Euclidean compromise solution.
The optimal point on the Pareto front is then defined by the minimal Euclidean distance to the
utopia point in the normalized coordinate system:
( ) ( )22min UtopiaParetoUtopiaPareto yyxxd −+−= (14)
The parameters xUtopia and yUtopia represent the x and y coordinates of the utopia point whereby
xPareto and yPareto represent the x and y coordinates of a point on the Pareto front. The results
are dependent on the weights of the objectives to be optimized. In our case, the weight is 1 for
the substructure size and the RMS deviation. This method was applied in the chapters 6.1 and
6.2 for the superimposition of ligand sets.
5.5 Close Contact Check
The conformation search depends on the increment, s, and the number of rotatable bonds, n.
An increment 1.4° is used for the change of the torsion angles. The number of conformations,
N, is given by the formula:

5.6 Matching the Conformations – the Directed Tweak
68
n
sN
=
360 (15)
Therefore, the number of conformations that are created with GAMMA is high and
furthermore the algorithm can also create conformations with possible van der Waal clashes.
Avoiding such self-clashes can help to reduce the number of generated conformations. The
superimpositions of structures without van der Waals clashes will have a higher fitness than
those that exhibit severe van der Waals interactions. To prevent unfavorable conformations
with an overlap of van der Waals radii, the distances of non-bonded atoms are calculated and
compared with the sum of the corresponding van der Waals radii. This close contact check
serves as a penalty function in the distance parameter D. The D-parameter is multiplied by a
corresponding penalty factor if a close contact is found. This leads to a decreasing geometric
fitness of the individuals containing molecules with VDW clashes.
5.6 Matching the Conformations – the Directed Tweak
The solutions of a GA are retrieved through a non-deterministic process and do not
necessarily represent the global minimum of the search space. In order to alleviate this
problem the GA was extended with a numerical optimizer called directed tweak, first
introduced by Hurst (21). Directed tweak allows for an RMS-fit considering molecular
flexibility. The directed tweak method leads to an adaptation of the conformational space of
the compounds to be superimposed by changing torsion angles. By the use of local
coordinates for the handling of rotatable bonds it is possible to formulate analytical
derivatives of the objective function. Flexible RMS-fits are obtained with a gradient-based
local optimizer. The directed tweak method makes use of the Davidon-Fletcher-Powell (148)
optimizer to minimize differences in the conformations. The squared differences of the
distances of corresponding atom pairs are used to minimize the differences in the geometry of
the superimposed structures by changing torsion angles. A new distance parameter results
from the alterations of the dihedral angle and recalculation of all atom positions. Therefore, D
is a function of the dihedral angle. The obtained superimpositions are not limited to low-
energy conformations. Before determination of the fitness, the geometric fit of each individual
is improved by mapping torsion angles by the directed tweak method. The selection of the
new individual is then based on these new values. However, the next generation consists of

5.7 Calculation of Values for Ranges of Matching Criteria
69
the original individuals before applying the directed tweak to avoid loss of genetic
information or premature convergence.
5.7 Calculation of Values for Ranges of Matching Criteria
The binding of a molecule to a macromolecular target is influenced by many physicochemical
properties. Such properties that are responsible for receptor binding affinities are, e.g., the
hydrogen-bonding potential, the electrostatic potential or hydrophobic interactions. These
binding properties are mainly based on dipole-dipole interactions and are related to various
electronic effects. Also, two molecules can exert similar biological effects if their charge
distributions and shapes are similar, even though they have different molecular structures. To
compare the similarity between compounds, atoms with similar chemical features that lead to
their observed properties are to be superimposed. Different physicochemical properties such
as partial atomic charges (qσ, qπ, qtot), electronegativity, χ, polarizability, α, or the
octanol/water partition coefficient, log P, can be chosen as features for the superimposition. It
is also possible to take other atom properties into account, such as distinguishing between
aromatic and non-aromatic ring atoms, or ring and non-ring atoms. The first version of the
presented superimposition method GAMMA used an approach whereby the user had to define
ranges for the physicochemical properties. The atoms to be overlaid must conform to a given
matching criterion or tolerance interval of the physicochemical property. For example, if the
matching criterion interval is chosen to be qtot = +/-0.05e and qtot of an atom of the first
molecule equals -0.2e, only atoms in the interval of qtot = [-0.25, -0.15] are allowed to build
match tuples with the first atom. It is possible to combine several physicochemical properties
simultaneously. The atoms to be matched have to coincide in all chosen criteria at the same
time. This is analogue to a logical expression with each physicochemical property being
linked with a logical AND. If two atoms x and y of two different molecules are allowed to
match because they fall within the range of a property A but are not allowed to match because
they do not fall within the range of property B then atoms x and y are not allowed to match.
Also, the proper steric fit of the molecules into the binding site of the target must be taken into
account. The surface conveys the steric requirements of the receptor binding site. Therefore,
the steric similarity of the molecules to be aligned must be taken into account by examination
of the steric overlap. In this method, molecules with given geometry are superimposed with
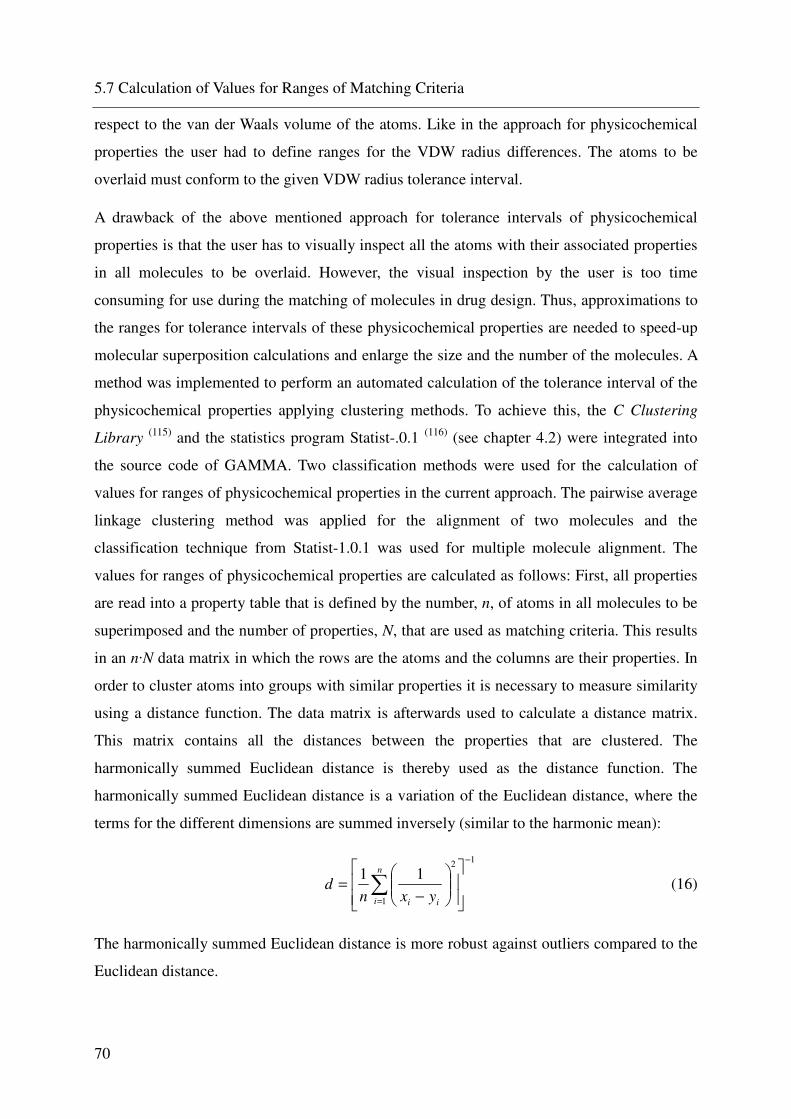
5.7 Calculation of Values for Ranges of Matching Criteria
70
respect to the van der Waals volume of the atoms. Like in the approach for physicochemical
properties the user had to define ranges for the VDW radius differences. The atoms to be
overlaid must conform to the given VDW radius tolerance interval.
A drawback of the above mentioned approach for tolerance intervals of physicochemical
properties is that the user has to visually inspect all the atoms with their associated properties
in all molecules to be overlaid. However, the visual inspection by the user is too time
consuming for use during the matching of molecules in drug design. Thus, approximations to
the ranges for tolerance intervals of these physicochemical properties are needed to speed-up
molecular superposition calculations and enlarge the size and the number of the molecules. A
method was implemented to perform an automated calculation of the tolerance interval of the
physicochemical properties applying clustering methods. To achieve this, the C Clustering
Library (115) and the statistics program Statist-.0.1 (116) (see chapter 4.2) were integrated into
the source code of GAMMA. Two classification methods were used for the calculation of
values for ranges of physicochemical properties in the current approach. The pairwise average
linkage clustering method was applied for the alignment of two molecules and the
classification technique from Statist-1.0.1 was used for multiple molecule alignment. The
values for ranges of physicochemical properties are calculated as follows: First, all properties
are read into a property table that is defined by the number, n, of atoms in all molecules to be
superimposed and the number of properties, N, that are used as matching criteria. This results
in an n·N data matrix in which the rows are the atoms and the columns are their properties. In
order to cluster atoms into groups with similar properties it is necessary to measure similarity
using a distance function. The data matrix is afterwards used to calculate a distance matrix.
This matrix contains all the distances between the properties that are clustered. The
harmonically summed Euclidean distance is thereby used as the distance function. The
harmonically summed Euclidean distance is a variation of the Euclidean distance, where the
terms for the different dimensions are summed inversely (similar to the harmonic mean):
1
1
211
−
=
−= ∑
n
i ii yxnd (16)
The harmonically summed Euclidean distance is more robust against outliers compared to the
Euclidean distance.

5.7 Calculation of Values for Ranges of Matching Criteria
71
The hierarchical clustering methods describe atom property data in terms of a tree structure.
Next, a node is created by joining the two closest items. Subsequent nodes are created by
pairwise joining of items or nodes based on the distance between them, until all items belong
to the same node. A tree structure can then be created by retracing which items and nodes
were merged. In pairwise average-linkage clustering, the distance between two nodes is
defined as the average over all pairwise distances between the elements of the two nodes. The
distance between two nodes can be directly extracted from the distances matrix. The tree
structure generated by the hierarchical clustering routine is further analyzed by dividing the
properties of the atoms into n clusters. This can be achieved by ignoring the top n − 1 linking
events in the tree structure, resulting in n separated subnodes. The elements in each subnode
are then assigned to the same cluster. The decision to which cluster each element belongs is
based on the hierarchical clustering result stored in the tree structure. Afterwards, the distance
between clusters is calculated. It is defined as the smallest distance over the pairwise
distances. This distance is then used as the cutoff value for the tolerance interval of the
physicochemical property that was classified into clusters.
Statist-1.0.1 uses an own algorithm to make a good assumption of the number of classes in the
data. The maximum number of possible classes is set to 10. The centroids of the classes are
determined by calculating the means of a class. The tolerance interval of the physicochemical
property is then calculated as the distance between the arithmetic means of two classes.
If the calculated range is too high the search for matches becomes inefficient because too
many of the atoms fall within the range of the physicochemical property and, as a result, too
many atoms are allowed to match with each other. This results in increased computation times
and makes it difficult to discriminate the atoms concerning their physicochemical properties.
On the other hand, if the range is too small, too few atoms are allowed to match and a
superposition cannot be achieved during optimization.
The two molecules melagatran and inogatran were selected to exemplify the automatic
generation of tolerance intervals for chemical features. The molecular structures of the two
compounds are shown in Figure 6. Additionally, the values of the atomic total charge qtot and
of the atomic increment of the octanol/water partition coefficient log P are shown.

5.7 Calculation of Values for Ranges of Matching Criteria
72
A
4
B
5
C
D
Figure 6: The two molecules melagatran, 4, (A and C) and inogatran, 5, (B and D) are shown
together with the values for the atomic total charge qtot (A and B) and the atomic increment of the
octanol/water partition coefficient log P (C and D).
Seven different clusters are recognized for the two physicochemical properties. Table 1 gives
an overview of the seven clusters for the atomic total charge qtot and the atomic increment of
the octanol/water partition coefficient log P. Here, the ranges and the cluster distance are
given (matchtol). The cluster distance defines the cutoff value for the tolerance interval of the
physicochemical property.

5.7 Calculation of Values for Ranges of Matching Criteria
73
Table 2: The cluster that have been built for the atoms of the two molecules melagatran and
inogatran according to their atomic total charge qtot and the atomic increment of the octanol/water
partition coefficient log P. The ranges of the values for the atoms that fall within a cluster are shown.
The matching tolerance between atoms of the molecules is given in the last row.
Atomic total charge qtot Atomic increment of log P
Cluster Range (eU) Cluster Range
1 0.331 – 0.393 1 0.128 – 0.181
2 -0.627 - -0.553 2 -0.045 – -0.01
3 -0.474 - -0.406 3 0.297 - 0.340
4 -0.054 – 0.037 4 -0.138 - -0.101
5 -0.218 – 0.130 5 -0.371 - -0.341
6 -0.318 - -0.293 6 0.033 – 0.067
7 0.081 – 0.096 7 -0.305 - -0.301
Matchtol 0.075 Matchtol 0.128
A
-0.8
-0.6
-0.4
-0.2
0
0.2
0.4
0.6
1 2 3 4 5 6 7 8
Cluster
qto
t (e
U)
Cluster 1
Cluster 2
Cluster 3
Cluster 4
Cluster 5
Cluster 6
Cluster 7
B
-0.5
-0.4
-0.3
-0.2
-0.1
0
0.1
0.2
0.3
0.4
1 2 3 4 5 6 7 8
Cluster
log
P
Cluster 1
Cluster 2
Cluster 3
Cluster 4
Cluster 5
Cluster 6
Cluster 7
Figure 7: The atoms of the two molecules melagatran and inogatran are clustered according to the
atomic total charge qtot (A) and the atomic increment of log P (B). Only atoms that fall within the same
cluster are allowed to match with each other during the optimization process of the 3D-MCSS search.

5.8 Stopping Criteria for the Genetic Algorithm
74
A graphical overview of the seven clusters that have been determined for the two atomic
physicochemical properties is given in Figure 7. The algorithm for the automatic
determination of cutoff values for matching criteria was applied to studies shown in chapters
6.1, 6.2, and 6.4.
5.8 Stopping Criteria for the Genetic Algorithm
A GA is a stochastic optimization procedure, which is not subject to deterministic rules. It is
not as easy to determine an abort criterion for a GA as for a classical method which is based
on gradients. Also, the development of the population’s fitness cannot give a hint whether the
absolute maximum was reached or not. It is possible in a GA optimization that an optimum
was not reached in the course of several generations and then the optimum is obtained by a
sudden improvement. However, one can make a statement how probable a further
improvement still is. A more suitable measurement, in order to pursue the convergence of a
population, is the total bias btot. The total bias is composed out of the average of the bias of
the match tuple, bmatch, and, if flexibility is taken into account, the bias of the torsion angles,
btor.
2tormatch
tot
bbb
+= (17)
If the molecules to be overlaid are kept rigid the total bias btot equals the bias of the match
tuple bmatch. The bias of the match tuple bmatch is described as follows: An atom A2,i of
structure II (M2) is most frequently matched to an atom A1,i of structure I (M1). The bmatch then
measures the probability for finding this specific match pair in one individual of the whole
population. The presented bmatch is the average value of all atoms A1,i and individuals.
∑=1
21
1
maxfreq1 n
i
imatch
I
),M(A
nb (18)
The parameter n1 describes the number of atoms in molecule I (M1), A1,I and A2,j are the atoms
in M1 or M2, maxfreq (A1,i, M2) ) is the number of the atom A2,j of M2, which is mapped on an
atom A1,i of M1 most frequently, and I is the size of the population. A bmatch of 0.75 means, that
a certain match pair appears with an average probability of 75% in each individual. The
highest value that bmatch can attain is 1.0. A bias of 1.0 means that a specific atom of M1 is

5.9 Parallelization of the Genetic Algorithm
75
always matched onto one and the same atom of M2 in each individual of a generation.
Therefore, this same match pair would occur in all individuals.
The bias of the torsion angles btor is the average occurrence of all 1bits in all the torsion bit
strings of all individuals:
∑=⋅
=torn
i
itor
poptor
tor bnn
b8
0,8
1 (19)
The parameter ntor represents the number of rotatable angles of the molecules, whereby every
torsion angle is encoded with 8 Bits. The parameter npop is the number of individuals in a GA
experiment and the bias btor,i is a measure of the distribution of 1bits in the ith position in the
torsion bit strings of the whole population. If more than the half of the population carries a
1Bit in the ith position, then the whole population has the tendency to prefer a 1Bit there.
≤−
>
=
2,
2,
11
11
,pop
BitBitpop
pop
BitBit
itorn
NifNn
nNifN
b (20)
In general it can be stated that the total bias raises in the same way the optimization
progresses. As the level of available genetic information decreases with the bias raising it can
be argued that a certain value for the bias can serve as a stopping criterion. The bias serves as
a measurement for the convergence of the population. During the optimization procedure a
calculation of the bias is performed in every new generation of the GA. If desired by the user
cutoff value for the total bias can be set as a termination condition as it can be reckoned that a
further improvement will not be reached.
5.9 Parallelization of the Genetic Algorithm
In order to speed up the 3D-MCSS search the presented hybrid GA was made parallel (149).
The improvements in parallel and distributed computing offer a means to overcome some of
the limitations of single processor machines. An overview of different implementation
techniques is given by Cantú-Paz (30).
GAMMA was originally made parallel on an SGI ORIGIN 3400 with 28 processors and 56
GBytes memory (see chapter 4.1). The Message Passing Interface (MPI) was chosen as the

5.9 Parallelization of the Genetic Algorithm
76
programming interface because message passing is a natural programming model for
distributed-memory MIMD computers. Also, MPI was a convincing alternative as it is
platform independent. Hence, a subsequent port to workstation-clusters was easily feasible. If
the parallel version of GAMMA is running on a parallel machine the same MPI program is
started on many processors. It is independent from the number of processes that are started
and they can communicate by message passing. Later, the parallel version of the program was
ported from the SGI Origin 3400 to a Linux cluster.
A complete run of the program GAMMA consists of several independent GA experiments that
are consecutively executed in the serial version. The parallelization was realized on the level
of the outermost program loop that enumerates the experiments of the GA. The experiments
are consistently distributed upon the processes of the system. This solution was chosen
because of the independent treatment of the single experiments by the algorithm.
Figure 8: Distribution of the experiments upon the different processes. The experiments are running
independently in parallel per processor. This mechanism is comparable to an allopatric population
distribution. The individuals are separated due to a physical barrier and evolve without interaction.
Therefore, the resulting populations can vary strong.
The coherence of the populations is guaranteed by executing the independent experiments in
parallel (Figure 8). The individuals are separated due to a physical barrier and evolve without
interaction. Therefore, the resulting populations can vary strongly. The mechanism is
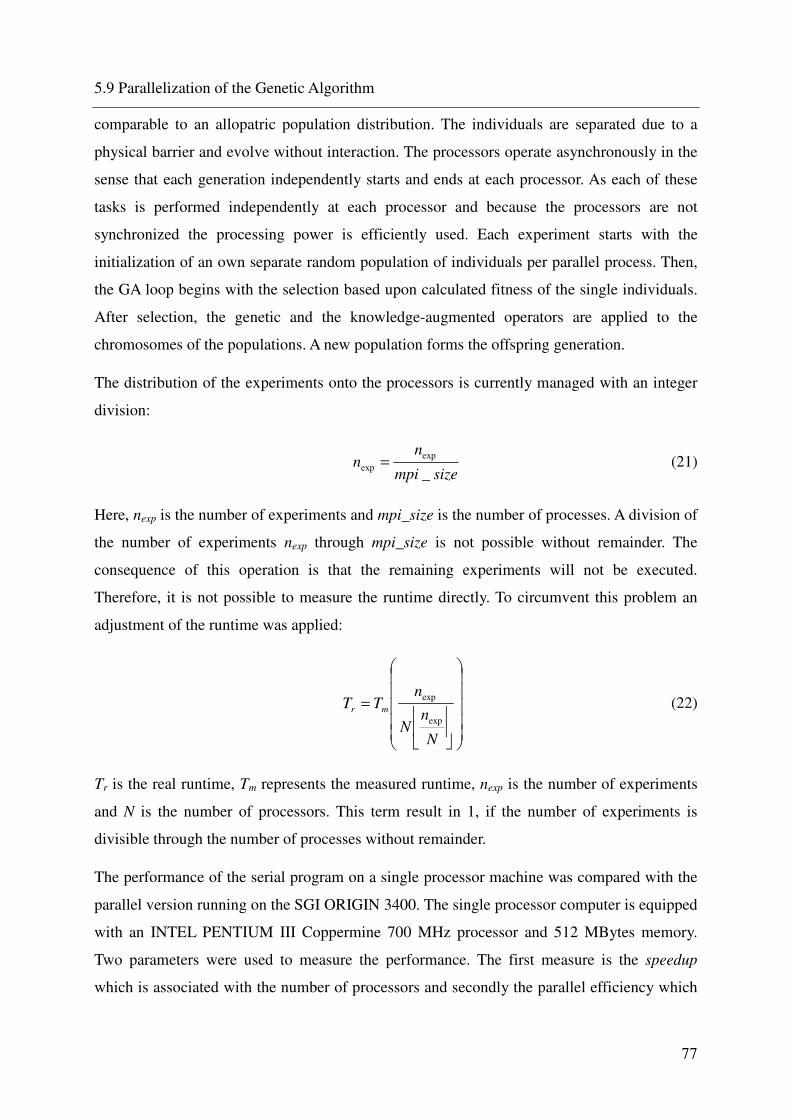
5.9 Parallelization of the Genetic Algorithm
77
comparable to an allopatric population distribution. The individuals are separated due to a
physical barrier and evolve without interaction. The processors operate asynchronously in the
sense that each generation independently starts and ends at each processor. As each of these
tasks is performed independently at each processor and because the processors are not
synchronized the processing power is efficiently used. Each experiment starts with the
initialization of an own separate random population of individuals per parallel process. Then,
the GA loop begins with the selection based upon calculated fitness of the single individuals.
After selection, the genetic and the knowledge-augmented operators are applied to the
chromosomes of the populations. A new population forms the offspring generation.
The distribution of the experiments onto the processors is currently managed with an integer
division:
sizempi
nn
_exp
exp = (21)
Here, nexp is the number of experiments and mpi_size is the number of processes. A division of
the number of experiments nexp through mpi_size is not possible without remainder. The
consequence of this operation is that the remaining experiments will not be executed.
Therefore, it is not possible to measure the runtime directly. To circumvent this problem an
adjustment of the runtime was applied:
=
N
nN
nTT mr
exp
exp (22)
Tr is the real runtime, Tm represents the measured runtime, nexp is the number of experiments
and N is the number of processors. This term result in 1, if the number of experiments is
divisible through the number of processes without remainder.
The performance of the serial program on a single processor machine was compared with the
parallel version running on the SGI ORIGIN 3400. The single processor computer is equipped
with an INTEL PENTIUM III Coppermine 700 MHz processor and 512 MBytes memory.
Two parameters were used to measure the performance. The first measure is the speedup
which is associated with the number of processors and secondly the parallel efficiency which

5.9 Parallelization of the Genetic Algorithm
78
gives the utilization of the processors. The speedup is defined as the increase in performance
(units of work per unit time) with increase in the number of nodes for a fixed problem size:
N
NT
TS 1= (23)
SN is the speedup when using N processors, T1 is the runtime needed on one processor and TN
is the runtime on N processors. The efficiency EN delivers a measurement for processor
utilization through normalization onto the number of used processors:
N
SE N
N = (24)
EN is the efficiency at N processors and SN represents the speedup using N processors.
Five test sets with molecules of different size and different flexibility were chosen for the
measurement. Every set contained three molecules to be superimposed. The data sets
consisted of inhibitors and ligands of cytochrome P450c17 (CYP450), of HSV-1 thymidine
kinase (HSV-1TK), of HIV protease (HIV1Prot), of a Fab fragment of a monoclonal antibody
(Immglb) and of the glycogen phosphorylase (GlyPhos). The same number of experiments,
generations and individuals was chosen for all compound sets in all program runs. In addition,
the same operator probabilities were applied. The number of processors ranged from one to
15. Superimpositions of these molecule sets were carried out to determine their 3D-MCSS.
All 3D structures investigated in this report have been obtained by CORINA (22). The 3D
substructure search starts with one conformation for each structure and investigates the
conformational flexibility during the optimization process.
The results of the scalability study are shown Figure 9. Both, the serial and the parallel
version of GAMMA were applied. A serial version of the hybrid GA can be regarded as the
program running on one processor. It can be seen from Figure 9 that the performance increase
of the algorithm is fairly good, although not ideal. Increasing the number of processors results
in a proportional decrease of CPU time. The parallel program has a good scalability;
especially when the number of processors was lower than eight. The measured speedup shows
a quite linear curve for all five test sets. Strong downward deviations can be found for the
HSV-1TK data set for 14 and 15 processors, for the CYP450 data set for eight and 15
processors, for the GlyPhos data set for three and nine processors and for the HIV1Prot data
set for three and 14 processors.
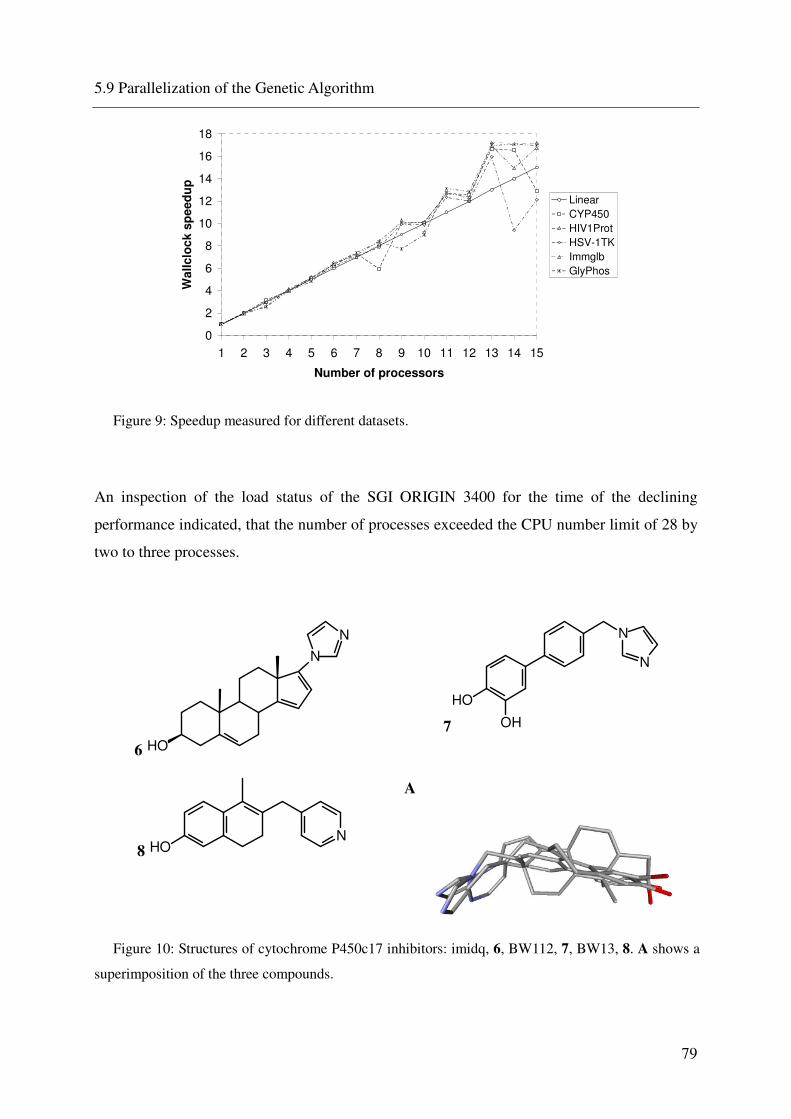
5.9 Parallelization of the Genetic Algorithm
79
0
2
4
6
8
10
12
14
16
18
1 2 3 4 5 6 7 8 9 10 11 12 13 14 15
Number of processors
Wal
lclo
ck s
pee
du
pLinear
CYP450
HIV1Prot
HSV-1TK
Immglb
GlyPhos
Figure 9: Speedup measured for different datasets.
An inspection of the load status of the SGI ORIGIN 3400 for the time of the declining
performance indicated, that the number of processes exceeded the CPU number limit of 28 by
two to three processes.
6
N
N
HO
7
N
N
HO
OH
8 N
HO
A
Figure 10: Structures of cytochrome P450c17 inhibitors: imidq, 6, BW112, 7, BW13, 8. A shows a
superimposition of the three compounds.

5.9 Parallelization of the Genetic Algorithm
80
This leads to the conclusion that the deviations are caused by load imbalances due to the
trivial parallelization technique. Some of the performance runs show a super linear speedup,
especially for the Immglb and for the GlyPhos data set. As one example out of the five test
sets, the superimposition of the three cytochrome P450c17 inhibitors, imidq, BW112 and
BW13is shown in Figure 10.
Cytochrome P450c17 (17-alpha-hydroxylase/C17- 20 lyase) is a key enzyme for the androgen
and glucocorticoid biosynthesis. Like most cytochrome P450 isoenzymes, P450c17 also has
heme as prosthetic group. Substances conjugate to this enzyme by coordinating to the central
iron atom at one end and by a hydrogen-bond at the other end of their skeleton. Thus,
substances with a high affinity to the enzyme should have a free electron pair (e.g. a nitrogen
atom) and at least one hydrogen-bond acceptor or donor. It can be seen that the oxygen atoms
as well as nitrogen atoms are matched on both ends of all three molecules.
Figure 11: Island model in which every process of the parallel genetic algorithm carries its own
subpopulation (deme).The demes exchange individuals via migration with each other. A ring migration
topology model is shown.
In the course of porting the parallel version of the GA to a Linux cluster, it was modified in
the direction of interacting subpopulations (demes) instead of independent subpopulations.

5.10 Calculation of Ring Conformations
81
The demes of each GA can exchange genetic information with each other. The isolated demes
evolve for a certain number of generations (isolation time). After the isolation time an
individual migrates with a certain probability defined by the program user from one deme to
another (island model) (Figure 11). A migration operator had to be implemented additionally
to the other above mentioned genetic operators.
Three migration strategies were implemented to enable this exchange: In the first model, a
copy of a random individual from one deme migrates to another process and replaces a
random individual there (RANDOM). In the second strategy, a copy of the fittest individual
migrates to another deme and replaces the worst ranked individual (BEST_WORST). In the
third migration model the individual of a deme that is most similar to the fittest individual is
replaced by another individual that has been rated as most similar to the fittest individual in
the other deme (DIVERSITY). The last strategy has the intention to increase the genetic
variability of a subpopulation. Moreover, three different topologies were implemented such
that the subpopulations are allowed to exchange the migrants: In the ring topology every
deme has two neighboring demes with which a transfer of genetic information can be
managed (Figure 11). In the unrestricted migration topology every deme can exchange
individuals with every other deme and finally in the neighborhood migration topology, also
called torus, a deme can exchange genetic information with its nearest neighbors. The
unrestricted migration topology combined with the BEST_WORST migration strategy and a
migration probability of 10 % has been applied for virtual database screening in chapter 6.4.
5.10 Calculation of Ring Conformations
Two different strategies were implemented to make ring conformations available for the
3D-MCSS search.
The first algorithm introduces the ring conformations already while the molecules to be
superimposed are read into the main memory. To make this possible all ring fragments that are
available for a test compound are compared with the ring conformation that is contained in the
template compound. If the ring system contains substituents also the first sphere exo atoms
are taken into account. The comparison is done via RMS minimization. The ring
conformation that is most similar to the ring conformation found in the template compound is
then incorporated into the test ligands.

5.10 Calculation of Ring Conformations
82
The second strategy introduces ring conformations while the initial population of the GA is
generated. Here, all possible ring conformations for the test ligands are calculated and
distributed over the individuals. If a compound that carries a certain ring conformation
survives the optimization procedure depends on its fitness. In contrast to the methodology
described above the fitness of the individual is the crucial factor that decides on the survival
of an individual with molecules that possess a certain ring conformation.
In order to make use of the functionality for the generation of multiple ring conformations
possible the source code of the hybrid genetic algorithm was combined with the library
version of the 3D structure generator CORINA (22). CORINA applies a knowledge-based
approach and makes use of experimental data for generation of three-dimensional molecular
models to generate three-dimensional atomic coordinates from the constitution of a molecule.
For small ring systems consisting of less than nine atoms, CORINA is able to generate
different reasonable ring geometries by using a list of ring templates derived from the
statistical and empirical data. These ring templates are stored as a list of torsion angles, for
each ring size and number of unsaturations in the ring, ordered by their conformational
energy. In the case of fused and bridged ring systems a backtracking algorithm is applied to
detect sets of conformations for each single ring. The conformations are afterwards refined by
a simplified force field and ordered according to an energy function that takes into account the
torsional energy of the individual rings, the Pitzer strain energy caused by exocyclic
substituents and the additional strain found in fused or bridged ring systems. The procedure
for generating a 3D structure for polymacrocycles was not applied in the presented work.

5.10 Calculation of Ring Conformations
83
6 Applications
To test the capabilities of the methods implemented in the program GAMMA several
superimposition experiments were carried out.
In chapter 6.1 superimpositions are performed using ligands of membrane associated
receptors for which no structural information is available. When the 3D structure of a
therapeutically relevant target is unknown but a set of ligands with measured binding
affinities is at hand, then plausible superimpositions can help to sample ideas of possible
binding geometries. This is the situation when superimposition programs are normally
applied. Two examples of ligands of membrane spanning G-protein-coupled receptors
(GPCRs) were selected, specifically ligands of the 5-HT1B /5-HT1D and the AT1 receptors.
In chapter 6.2 a validation study is presented that uses crystallographic data as a knowledge
base. Here, it is investigated how well GAMMA reproduces X-ray bioactive conformations.
This study was performed to asses the quality of molecular alignments produced with
GAMMA. The experiments encompass mutual and simultaneous multiple molecule
alignments of molecules which bind to the same receptor, and where the conformations of the
bound states are known. The matching of ligands of sets of different proteins that were taken
from the Brookhaven Protein Data Bank are presented. The ligand data sets comprise
inhibitors of the herpes simplex type 1 thymidine kinase, ligands that bind to streptavidin and
dihydrofolate reductase, inhibitors of thrombin, antagonists of the estrogen receptor α and
finally penicillopepsin binding ligands.
In the following chapter 6.3 the influence of different superimposition criteria on the results of
the molecular alignment process is evaluated. Transition state inhibitors of the arginase II are
used to compare to what extend different matching criteria such as physicochemical
properties or the enforced match of predefined atoms influence the superimposition results.
In the fourth set of experiments, in chapter 6.4, two queries against the MDDR-05.1 (MDL®
Drug Data Report) (140) database were performed. The MDDR database contains drug-like
compounds. Aim of this study is to show that the presented method is capable of
preferentially select compounds that have the same activity as a query molecule. For this
purpose, on the one hand celecoxib as a selective cyclooxygenase-2 (COX-2) inhibitor was
chosen and on the other hand diazepam, a benzodiazepine, which binds to a specific subunit
of the GABAA receptor as probes.

6.1 Molecular Superimpositions in the Absence of the Receptor 3D Structure
84
Finally, in a last study, in chapter 6.5, the problem of ring flexibility is addressed. The aim
was to test if the 3D-MCSS search procedure is able to select test compounds with another
ring conformation than the global low-energy-conformation that is more similar to the ring
conformation of a template molecule. The last method was tested with the compounds
tropacocaine, staurosporine, pethidine and ligands of the cAMP-dependent protein kinase A.
6.1 Molecular Superimpositions in the Absence of the Receptor 3D
Structure
6.1.1 Introduction
Enzymes play a key role in the research of the pharmaceutical industry, because they
represent targets for the specific development of drugs. Compared to the number of known
receptors the number of receptors where the 3D structure is known is still small. It is quite
clear that many proteins can never be crystallized or their structure will dramatically change
when taken out of their natural environment, such as for membrane proteins. If a set of
different active ligands is available for a receptor it is feasible to draw conclusions about the
spatial requirements of the ligands to fit into said receptor by analyzing their similarities. To
this end, the method will be exemplified for the determination of the 3D maximum common
substructure (3D-MCSS) by superimposing ligands for which the 3D structure of the receptor
is not known. This provides indications of substructural elements that are relevant for the
receptor affinity of the different substrates. The two presented examples deal with ligands of
the membrane spanning G-protein-coupled receptors (GPCRs) which are targets for some of
the top selling drugs.
6.1.2 Computational Methods
The three-dimensional structures of the ligands were calculated with the 3D structure
generator CORINA (22). As the hybrid method overlays structures independently of the
initially chosen conformation, only one conformation per structure is necessary. Next,
physicochemical parameters were determined. Total atomic partial charges were added as the
sum of the σ- and π-partial charges calculated by the PEOE method developed by Gasteiger
and Marsili (129) and a modified Hückel MO calculation (131). The log P values were calculated

6.1 Molecular Superimpositions in the Absence of the Receptor 3D Structure
85
based on atomic increments by the XLogP method of Wang et al. (128). Both methods were
reimplemented in a calculation module written in-house based on our C++ framework
MOSES (131,133). The control parameters for the GA are given in Table 3. Each GA experiment
was performed 50 times with randomly initiated starting populations. Different runtimes were
applied for a pairwise overlay or a multiple molecule alignment, since the problem space
increases exponentially with the number of match tuples and the size of the conformational
space. Therefore, the number of generations for the multiple molecule alignments is extended
from 200 to 1000 and the population size from 100 to 250.
Table 3: Control parameter for the genetic algorithm.
GA parameter value
Number of experiments nexp 50
Number of generations ngen 200 (pairwise alignment)
1000 (multiple molecule alignment)
Number of individuals Npop 100 (pairwise alignment)
250 (multiple molecule alignment)
Selection method Slinear
SRTS
1.4
0.11·Npop
Probability for crossover pcross 0.5
Probability for mutation pmut 0.3
Probability for creep pcreep 1.0
Probability for crunch pcrunch 0.1
Probability for torsional crossover ptorcross 0.7
Probability for torsional mutation ptormut 0.6
Limit of convergence lconv 0.95

6.1 Molecular Superimpositions in the Absence of the Receptor 3D Structure
86
The superimpositions were performed using both, the linear ranking selection (LRS) and the
restricted tournament selection (RTS). The RTS employs the Pareto fitness. This fitness
approach provides a set of Pareto optimal solutions. The Euclidean compromise solution was
used to extract one optimal solution from this set of Pareto optimal solutions. The technique
how to determine one optimal solution from the Pareto front is described in chapter 5.4.4.
6.1.3 Results
6.1.3.1 Triptans
Serotonin (5-hydroxytryptamine, 5-HT) can be found in a large number of tissues. In the
organism it is synthesized out of the essential amino acid tryptophan. The 5-HT receptors
belong to the group of G-protein-coupled receptors. Triptans are agents indicated for the acute
treatment of migraine attacks and belong to the group of agonists of the 5-HT1B/1D¯ -receptors.
They lead to vasoconstriction and can activate 5-HT1 receptors on peripheral terminals of the
trigeminal nerve innervating cranial blood vessels. Naratriptan (150), rizatriptan (151) and
zolmitriptan (152) are selective 5-hydroxytryptamine receptor subtype agonist. They are
assumed to be agonists for a 5-hydroxytryptamine receptor subtype of the 5-HT1B and 5-HT1D
family. In contrast, they have only weak affinity for other 5-HT receptors as the 5-HT1A,
5-HT2, 5-HT3, 5-HT4 5-HT5A or 5-HT7 receptor. Figure 12 shows the structure diagrams of
the three 5-HT1B/1D¯ -receptor agonists, zolmitriptan, 9, naratriptan, 10, and rizatriptan, 11.
The differences in the affinity between the three triptans to the human 5-HT1D receptor are
shown in Table 4. The selection of the template compound for molecular superimpositions is
influenced by the given logarithmically transformed dissociation constant, pKi.
Pairwise superimpositions of zolmitriptan and naratriptan, as well as a joint superimposition
of all three agonists are performed to detect molecular similarities. In all cases, zolmitriptan,
9, served as the template for flexible alignments. The presented results are chosen according
to their fitness score.

6.1 Molecular Superimpositions in the Absence of the Receptor 3D Structure
87
9
O
NH
N
NH
O 10
O
O
HN
NH
N
S
11 NH
NN
N
N
Figure 12: The structure diagrams of the
5-HT1B/1D¯ -receptor agonists, zolmitriptan, 9,
naratriptan, 10, rizatriptan, 11.
Table 4: Logarithmically transformed dissociation constants of the three triptans: zolmitriptan,
naratriptan and rizatriptan measured at the human 5-HT1D receptor (153).
Compound pKi (5-HT1D)
zolmitriptan 9.07
naratriptan 8.55
rizatriptan 8,18
Pairwise superimposition of zolmitriptan and naratriptan
At first, an overlay of zolmitriptan, 9, with naratriptan, 10, was performed using both, the
linear ranking selection (LRS) and the restricted tournament selection (RTS). The results are
shown in the upper part of Figure 13, wherein the alignment with LRS is shown on the left, A,
and the alignment using RTS is shown on the right, B. Both calculations arrived at a
substructure size of 16 atoms. The RMS deviation for the RTS-based alignment is slightly
better than the RMS value of the LRS-based overlay, 1.01 and 1.46 Å, respectively. In both
cases the common indole moiety is matched, while in the RTS-based overlay the nitrogen
atoms of the dimethylaminoethyl residue of zolmitriptan and of the piperidyl ring of
naratriptan are better brought into spatial closeness than in the LRS-based overlay. Both

6.1 Molecular Superimpositions in the Absence of the Receptor 3D Structure
88
alignments match one oxygen atom of sulfonamide substituent of naratriptan with the
carbonyl oxygen of the oxazolidinon ring of zolmitriptan.
A
B
LRS
RMS (Å): 1.46, substructure size: 16
RTS
RMS (Å): 1.01, substructure size: 16
C
D
LRS
RMS (Å): 3.03, substructure size: 15
RTS
RMS (Å): 1.96, substructure size: 10
Figure 13: The pairwise superimpositions of zolmitriptan with naratriptan (A and B) and the joint
superimpositions of zolmitriptan, naratriptan and rizatriptan (C and D) are shown. The left part shows
superimpositions that are based on the linear ranking selection (A and C). The right part shows
superimpositions that are based on the restricted tournament selection (B and D).

6.1 Molecular Superimpositions in the Absence of the Receptor 3D Structure
89
Multiple molecule superimpositions
The simultaneous superimposition of all three molecules, zolmitriptan, 9, naratriptan, 10, and
rizatriptan, 11, was performed afterwards. Here, the overlay done with LRS has a larger
substructure and a higher RMS deviations than the superimposition with the restricted
tournament selection. Again, the indole rings are matched. But strong differences can be seen
concerning a match of the nitrogen atoms of the dimethylaminoethyl residue of zolmitriptan,
of the piperidyl ring of naratriptan and of the dimethylaminoethyl residue of rizatriptan.
Clearly, the LRS-based superimposition has performed better here, because the
dimethylaminoethyl of rizatriptan within the RTS-based alignment is not matched and passes
its chain into the unaligned space. In contrast to the binary alignments, the oxygen atoms of
the sulfonamide are not matched with the carbonyl oxygen atom of the oxazolidinon ring but
with its ring oxygen atom. The triazole ring of rizatriptan is not matched in both cases.
6.1.3.2 Sartans
It is possible to reduce the conversion of angiotensin I to angiotensin II in the
renin-angiotensin system through inhibition of the angiotensin-converting enzyme (ACE).
ACE inhibitors are essential for the therapy of hypertension and congestive heart failure. The
development of selective angiotensin type-I (AT1) receptor antagonists that block the
activation of the angiotensin II AT1 receptor extends the therapeutic possibilities. The AT1
receptors possess seven transmembrane domains that are typical for G-protein-coupled
receptors (GPCRs). Most of the AT1 receptor antagonists, or sartans, carry a
tetrazole-biphenyl moiety. Candesartan (154), valsartan (155) and irbesartan (156) are such specific
antagonist of AT1 receptors. They are nonpeptide angiotensin II antagonist that selectively
blocks the binding of angiotensin II to the AT1 receptor. Figure 14 shows the 2D structures of
the three AT1 receptor antagonists, candesartan, 12, valsartan, 13, and irbesartan, 14. Table 1
demonstrates that the three sartans used in this study have different half maximal inhibitory
concentrations, IC50. As candesartan, 12, has the lowest IC50 value, it was chosen as the
template compound for the binary and the multiple molecule alignments.

6.1 Molecular Superimpositions in the Absence of the Receptor 3D Structure
90
Pairwise superimposition of candesartan and valsartan
The pairwise superimposition of candesartan, 12, and valsartan, 13, were again performed
with the two selection mechanisms LRS and RTS. LRS reached a larger common substructure
12N
N
N
N
O
HOO
NHN
13
HN
N
N
N
OHO
O
N
14
HN
N
N
N
N
O
N
Figure 14: The structure diagrams of the,
candesartan, 12, valsartan, 13, irbesartan, 14.
Table 5: The half maximal inhibitory concentration, IC50, of the three sartans: candesartan,
valsartan and irbesartan (157).
Compound IC50, nmol/L
candesartan 3
valsartan 6
irbesartan 8

6.1 Molecular Superimpositions in the Absence of the Receptor 3D Structure
91
A
B
LRS
RMS (Å): 1.18, substructure size: 30
RTS
RMS (Å): 0.71, substructure size: 28
C
D
LRS
RMS (Å): 1.44, substructure size: 23
RTS
RMS (Å): 0.94, substructure size: 21
Figure 15: The pairwise superimpositions of candesartan with valsartan (A and B) and the joint
superimpositions of candesartan, valsartan and irbesartan (C and D) are shown. The left part shows
superimpositions that are based on the linear ranking selection (A and C). The right part depicts
superimpositions that are based on the restricted tournament selection (B and D).
size with 30 atoms for both compounds. The RTS-based alignment has a substructure size of
two atoms less, 28 atoms, but therefore a lower spatial deviation in the positions of the

6.1 Molecular Superimpositions in the Absence of the Receptor 3D Structure
92
matched atoms (Figure 15). In both cases, the tetrazole-biphenyl moieties are superimposed
perfectly. Differences arise from the overlay of other structural elements, even though in both
alignments the carboxyl groups are matched and also a nitrogen atom of the
benzo[d]imidazole ring of candesartan is brought close to the nitrogen atom of the side chain
of valsartan. Therefore, both alignments lead to a quite similar outcome.
Multiple molecule superimpositions
The joint superimpositions of the three compounds differ slightly concerning the overlay of
the side chains. Again, the tetrazole-biphenyl moieties are superimposed very well. In the
LRS-based alignment the carboxyl groups of candesartan and valsartan are matched with the
oxygen atom of the carbonyl group of the spiro ring system of irbesartan. In the RTS-based
superimposition, in contrast, the oxygen atom of the carbonyl group of the spiro ring system
points into the opposite direction and is matched with the oxygen atom of the amide group of
valsartan. Interestingly, in both cases, three nitrogen atoms are superimposed originating from
the benzo[d]imidazole ring of candesartan, from the amide group of valsartan and from a
nitrogen atom of the spiro ring system of irbesartan. In both cases another nitrogen atom of
the spiro ring system of irbesartan is taking part in the match.
6.1.4 Discussion
In all the presented alignments, the usage of the restricted tournament selection leads to lower
RMS deviations than the application of the linear ranking selection. This, on the other hand,
has the consequence that the LRS-based alignments achieve larger maximum common
substructure sizes. This is clearly an effect of the applied fitness functions. While the LRS
uses a fitness function which stresses more the size of the reached substructure and simply
subtracts the term, representing the deviations in the spatial positions of the matched atoms,
the RTS-based Pareto-fitness function weights both factors as equally relevant for defining a
compromise solution. Nevertheless, it must be noted that the Pareto front with the Pareto
optimal solutions does by all means also contain solutions with a higher substructure size, but
the selection of the optimal Euclidean compromise solution depends on the aforementioned
weights. In summary, the user should incline the more on the LRS-based mechanism the more
similar the structures are, as one can imagine that the structures should resemble are quite

6.2 Validation Study Using Crystallographic Data
93
similar substructure concerning the atoms. In contrast, in the case of quite dissimilar
compounds, where it is not easy to predict which atoms could be part of the substructure, the
RTS-based alignment should be applied, to put more stress on the spatial deviations of the
matched atoms.
In both cases, superimposing triptans and sartans, the presented method has demonstrated to
detect relevant substructural elements. In the case of the triptans, a substructural element was
detected that resembles a structure which is similar to serotonin (5-hydroxytryptamine, 5-HT)
and all triptans bind to serotonin receptors. For all three compounds, the indolyl moiety and a
nitrogen atom of the dimethylaminoethyl residue of zolmitriptan, of the piperidyl ring of
naratriptan and of the dimethylaminoethyl residue of rizatriptan were matched.
For the sartans, the tetrazole-biphenyl moieties were identified as the relevant common
substructural element which should also be obvious for a skilled person.
6.2 Validation Study Using Crystallographic Data
6.2.1 Introduction
As a ligand has to adopt a conformation which is in some way complementary to its target
protein for receptor binding a superimposition method should be able to reproduce such
biologically active conformations. In a validation study, we wanted to show that GAMMA can
produce good alignments by comparing the computed superimpositions with reference
alignments obtained from crystallographic data contained in the PDB (125). Crystal structures
are the most common source of structural information for macromolecules. The selected
crystal structures are evaluated for resolution and temperature factors. Crystal structures with
a resolution determined to lower than 2.5 Å are reckoned as acceptable for the
superimposition studies. Because a high temperature factor reflects disorder due to motion we
restricted the used PDB entries to crystal structures with a temperature factor below 30. Due
to the resolution of crystal structures the reference alignments are subject to error. The
average positional errors of atoms in a crystal structure are approximately one-sixth the
resolution of the crystal structure (158). The average resolution of the crystal structures used in
this study is 1.81 Å, and thus the average uncertainty in the locations of the atoms in the
molecules used in this study is approximately 0.3 Å.

6.2 Validation Study Using Crystallographic Data
94
6.2.2 Generating the Datasets
The ASTRAL Compendium was retrieved to obtain sequence information on proteins that are
contained in the PDB. The ASTRAL Compendium is used to identify sets of proteins with an
identical amino acid sequence. This is feasible because the sequences are partially derived
from the SCOP (Structural Classification of Proteins) database that classifies protein entries
from the PDB concerning to their structural and evolutionary relationships. In this way it is
insured that the protein-ligand complexes that are retrieved have a sequence identity of 100%
and that the proteins belong to the same fold class. This helps in finding ligands bound to the
same or closely related proteins. Proteins within the same SCOP superfamily have a high
sequence similarity and show functional relationships within the binding pockets. All
sequences of one and the same species are determined. The resulting sequences are afterwards
used for a multiple amino acid sequence alignment using CLUSTALW. The aim is to find
sequence groups which have a higher sequence identity to each other than they have to other
groups. This is done by constructing a phylogenetic distance tree from which the largest
cluster can be selected. The longest sequence is chosen from this cluster as the query for a
FASTA sequence search in the Relibase+. A minimum sequence identity of 100% was used
for the sequence search. This ensures that only proteins that have no additional changes and
mutations in relevant active site residues are retrieved. If the resulting data set contains
enough ligands to perform a superimposition experiment, the resolution of the crystal
structures is restricted to 2.0 Å. If the resulting data set was too small the resolution was
extended to 2.5 Å.
To allow for comparison of the ligands complexed in the binding sites of the crystal structures
the binding sites were superimposed using Relibase+. The ligand-enzyme complex with the
natural substrate of the corresponding protein was selected as a reference for the
superimposition or, if not available an inhibitor with high affinity or selectivity. The
superimposition was carried out using the Cα atoms of the binding site residues only to focus
the alignment of the proteins onto the active site and, therefore, minimize the influence of
protein parts outside of the active site on the superposition process. Figure 16 shows the
superimposed protein-ligand complexes of dihydrofolate reductase chains as an example of a
similar binding site search leading to aligned cocrystallized ligands.
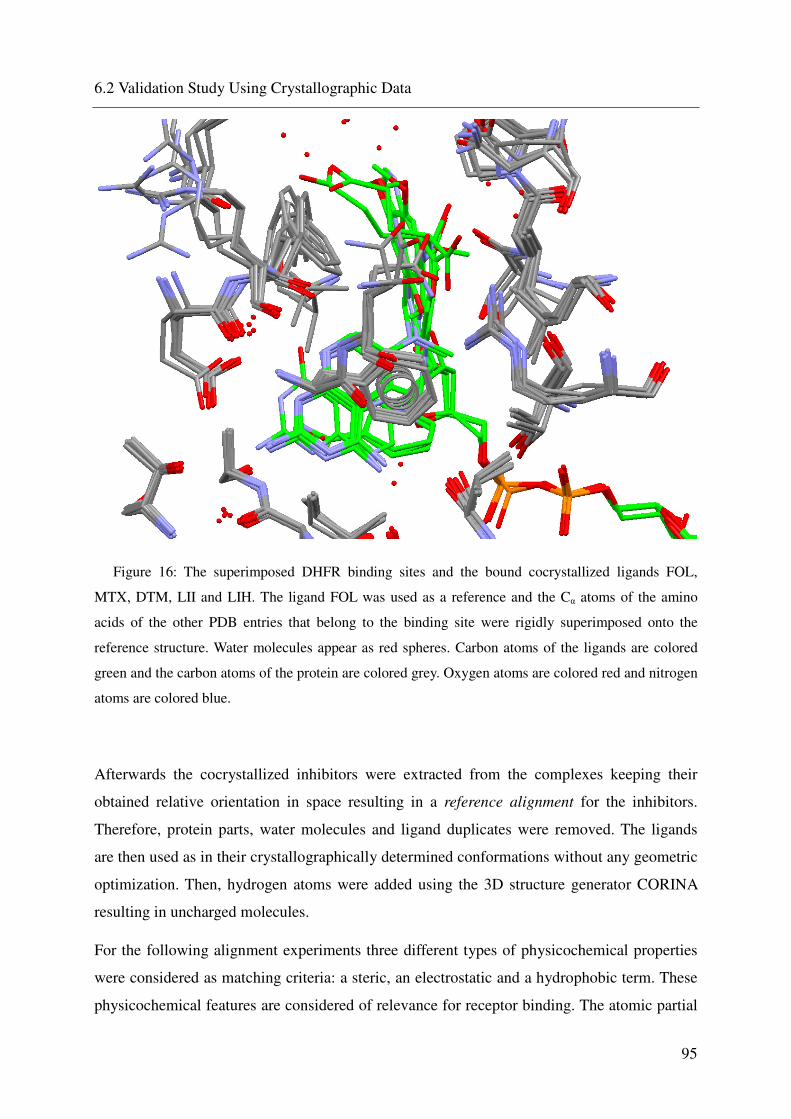
6.2 Validation Study Using Crystallographic Data
95
Figure 16: The superimposed DHFR binding sites and the bound cocrystallized ligands FOL,
MTX, DTM, LII and LIH. The ligand FOL was used as a reference and the Cα atoms of the amino
acids of the other PDB entries that belong to the binding site were rigidly superimposed onto the
reference structure. Water molecules appear as red spheres. Carbon atoms of the ligands are colored
green and the carbon atoms of the protein are colored grey. Oxygen atoms are colored red and nitrogen
atoms are colored blue.
Afterwards the cocrystallized inhibitors were extracted from the complexes keeping their
obtained relative orientation in space resulting in a reference alignment for the inhibitors.
Therefore, protein parts, water molecules and ligand duplicates were removed. The ligands
are then used as in their crystallographically determined conformations without any geometric
optimization. Then, hydrogen atoms were added using the 3D structure generator CORINA
resulting in uncharged molecules.
For the following alignment experiments three different types of physicochemical properties
were considered as matching criteria: a steric, an electrostatic and a hydrophobic term. These
physicochemical features are considered of relevance for receptor binding. The atomic partial

6.2 Validation Study Using Crystallographic Data
96
charges help to appreciate basic properties such as solubility by the amount of the compound's
polarity, intermolecular interactions by identifying sites of Coulomb interactions or hydrogen-
bond acceptors/donors. The partition coefficient in octanol/water log P is used to reflect the
hydrophobicity character. The atomic increment of the octanol/water partition coefficient
log P and the total charge qtot were calculated as chemical features used for the alignment
process. An automatic calculation of the tolerance intervals for both physicochemical
properties was chosen. A tolerance interval of ±0.4·Å was specified for the van der Waals
radius. The resulting compounds were used as a point of comparison for the alignments with
the hybrid GA.
Next, the ligands that are used for the superimposition onto the crystal-based conformations
are prepared. Low energy conformations of the ligands were generated by CORINA as
starting conformations for the superimposition experiments. Hydrogen atoms were added to
generate neutralized and charged molecules. The atomic increments of the octanol/water
partition coefficient log P and the values for the total charge qtot were calculated. The
compound cocrystallized with the protein that served as a reference for the superimposition of
the protein-ligand complexes then serves as the template for the other ligands in the following
superimposition experiments performed with GAMMA.
The hybrid GA was applied to five test sets with a variable number of enzyme inhibitors for
comparison with the superimpositions obtained from the X-ray crystallography of a protein–
inhibitor complex.
Pairwise and multiple superimpositions were performed with all molecules in the test set that
fall into the same receptor class. The bioactive conformation of one inhibitor was used as a
template and the other inhibitors were flexibly fitted to this template using GAMMA. In the
case of pairwise alignment experiments, the 50 best superimposition results of one GAMMA
experiment are ranked according to the fitness score. These 50 results are further reranked
according to the RMS deviation between the conformation predicted by GAMMA and the
experimentally determined conformation. In this chapter, the RMS deviations between the
template molecule and the ligands that were superimposed onto the template are designated
with RMSA (Alignment RMS).

6.2 Validation Study Using Crystallographic Data
97
The evaluation of the results is done by comparing the experimental superimposition of
ligands obtained through the alignment of the Cα atoms of the binding site residues with the
superimposition obtained by GAMMA. This is achieved by measuring the RMS difference
between the non-hydrogen atoms of the test molecule as observed in the experimental
superimposition and as predicted in the GAMMA superimposition without performing a RMS
minimization. This will be entitled the RMSO (RMS for different spatial orientation). Another
possibility to compare the GAMMA predicted results with the experimental results is to
perform a match applying an RMS minimization between the non-hydrogen atoms of
conformation found in the experimental superimposition and the conformation found in the
GAMMA superimposition. The calculated RMS deviation will be denoted with RMSC (RMS
for matched conformations). Additionally, the RMS deviation between a CORINA low energy
conformation and the conformation of the protein bound ligand was measured. This RMS
difference is designated with RMSL (RMS for comparison with CORINA low-energy
conformation). This nomenclature for the different RMS values is applied to lighten the
understanding which RMS measurement is currently described.
6.2.3 Ligand Alignments Using GAMMA
Four different strategies were used for the application of the hybrid GA to molecular overlays.
Pairwise and multiple molecule alignments were performed with each using two different
selection methods. The selection algorithms that were used are the linear ranking selection
(LRS) and the restricted tournament selection (RTS). The RTS employs the Pareto fitness.
This fitness approach provides a set of Pareto optimal solutions. The Euclidean compromise
solution was used to extract one optimal solution from this set of Pareto optimal solutions.
The technique how to determine one optimal solution from the Pareto front is described in
chapter 5.4.4.
The presentation of our data sets was ordered with respect to size and flexibility of the
ligands. At first, studies of smaller ligands with a more rigid skeleton are presented and finally
studies with larger peptidic ligands are shown. It is started with inhibitors of the herpes
simplex type 1 thymidine kinase, then ligands that bind to streptavidin and dihydrofolate
reductase. Then, inhibitors of thrombin are presented, afterwards, antagonists of the estrogen
receptor and, finally, penicillopepsin binding ligands.

6.2 Validation Study Using Crystallographic Data
98
The control parameters of the GA in our standard protocol are given in Table 6. Each GA
experiment was performed 50 times with randomly initiated starting populations. Different
runtimes were applied for a multiple molecule alignment and a pairwise overlay. This is
necessary as the number of possible match tuples and the size of the conformational space
increases exponentially with the number of molecules. The number of generations for
multiple molecule alignments was extended from 200 to 1000 and the population size from
100 to 250.
Table 6: Control parameter for the genetic algorithm.
GA parameter value
Number of experiments nexp 50
Number of generations ngen 200 (pairwise alignment)
1000 (multiple molecule alignment)
Number of individuals Npop 100 (pairwise alignment)
250 (multiple molecule alignment)
Selection method Slinear
SRTS
1.4
0.11·Npop
Probability for crossover pcross 0.5
Probability for mutation pmut 0.3
Probability for creep pcreep 1.0
Probability for crunch pcrunch 0.1
Probability for torsional crossover ptorcross 0.7
Probability for torsional mutation ptormut 0.6
Limit of convergence lconv 0.95

6.2 Validation Study Using Crystallographic Data
99
6.2.4 Herpes Simplex Virus Type 1 Thymidine Kinase
Herpes is a viral infection caused by the Herpes Simplex Virus (HSV). There are two types of
Herpes Simplex Viruses: HSV Type 1 and HSV Type 2. When cells are infected HSV-1
incorporates its double stranded DNA into the cell nucleus where a circular episomal dsDNA
is maintained. There, the virus establishes a latent infection predominantly found in neurons
of the ganglion of the trigeminal or fifth cranial nerve. The viral proteins as e.g. the DNA
polymerase and the thymidine kinase (TK, EC 2.7.1.21) serve for the multiplication of the
virus.
The TK is a transferase catalyzing the transfer of the γ-phosphate group from ATP to
thymidine to produce thymidine 5'-phosphate. It is a key enzyme for the synthesis of DNA. In
contrast to mammalian TK, the viral TK has a broad substrate specifity and can serve as a
drug target as the mammalian TK is unable to phosphorylate drugs that can bind to the viral
TK. Most drugs that are directed against the HSV-1 TK are nucleoside analogues that contain
different sugar-mimicking moieties instead of the deoxyribose. After superimposition of the
binding site Cα atoms, a set of five cocrystallized ligands was extracted: 2'-deoxythymidine
(THM), 6-hydroxypropylthymine (HPT), TMC, RCA, and 5-iododeoxyuridine (ID2) (Table
7).
Table 7: The five HSV-1 TK inhibitors used for pairwise and multiple molecule superimpositions
with GAMMA. The PDB code, the PDB identifier of the ligand, the number of heavy atoms and the
number of rotatable bonds are given.
PDB code PDB identifier No. Atoms No. Rotatable Bonds
1P7C (159) THM 17 2
1E2M (160) HPT 13 3
1E2K (161) TMC 18 2
1E2N (160) RCA 21 3
1KI7 (162) ID2 17 2

6.2 Validation Study Using Crystallographic Data
100
THM was chosen to serve as the reference molecule in all pairwise and multiple molecule
alignments with GAMMA. The other four ligands were flexibly fitted onto the template
compound.
The structure diagrams of the five HSV-1 TK inhibitors are shown in Figure 17.
15 HO
O
OH
NO
HN
O
16
O
NH
HN
O
OH
17
HO
OH
HN
NO
O
18
NH O
NH
HO
O
O
NH
HN
O
19 HO
O
O N
HN
O
I
OH
Figure 17: Structure diagrams of the five HSV-
1 TK inhibitors 2'-deoxythymidine (THM), 15,
6-hydroxypropylthymine (HPT), 16, TMC, 17,
RCA, 18, and 5-iododeoxyuridine (ID2), 19.
All five compounds are low-molecular-weight nucleoside analogues. They differ in size
(13-21 heavy atoms) but are quite similar in flexibility with two or three rotatable bonds. The
inhibitors are nucleoside analogues that often contain different sugar-mimicking moieties
instead of a deoxyribose. The sugar-like chains interact with the protein via hydroxyl groups
by forming hydrogen-bonds directly with amino acid residues or by using bridging water

6.2 Validation Study Using Crystallographic Data
101
molecules in the sugar binding pocket of the active site. The thymidine binding pocket
interacts with the pyrimidine ring by direct hydrogen-bonds or by water bridged hydrogen-
bonds.
Pairwise superimpositions:
The results of the pairwise superimpositions are summarized in Table 8. The results obtained
with an LRS-based and an RTS-based superimposition a nearly equal except to the results of
the pairwise alignment of RCA, 18, with THM, 15. Here, the RTS-based superimposition
performs poorer than the LRS-based alignment. In general, it can be said that the
superimpositions that achieve the best RMSO deviations and the best RMSC deviations are
found in low-ranking positions except for the alignment of THM and THC. On the other hand,
the best-ranked superimposition led to convincing results having RMSO and RMSC
differences below 1 Å except for the alignment of THM with RCA.
The pairwise alignment of THM, 15, and HPT, 16, achieved with RTS is shown as an example
in Figure 18. On the left hand side of Figure 18, the superimpositions of HPT onto THM
calculated by GAMMA are depicted (A and C). On the right hand side the superimposition of
the predicted conformation of HPT with the PDB conformation of HPT is shown (B and D).
The upper part of Figure 18 shows the best-ranked alignment (A) while the lower part shows
the alignment that leads to the lowest RMS value for the comparison of the predicted
conformation of HPT with the experimentally determined conformation of IGN (C and D).
The superimposition of THM and HPT produces an RMS difference in the atomic positions of
0.47 Å when compared to the experimentally determined conformation. The superimposition
results are the same in substructure size and RMS deviation. As can be expected, also the
RMSC values differ only in 0.03 Å. When taking into account the positional errors in structure
elucidation this difference is not measurable. Both GAMMA superimpositions show an
overlay of the hydroxyl group of HPT with the 5' hydroxyl group in the deoxyribose moiety
of THM. The overlay of these hydroxyl groups is remarkably because both are
phosphorylated by the HSV-1 thymidine kinase. Therefore, GAMMA superimposes those
parts of the ligands that are modified by the reaction catalyzed by the thymidine kinase.
Moreover, also the pyrimidine moieties that are relevant for receptor binding are nearly
perfectly matched.

6.2 Validation Study Using Crystallographic Data
102
Table 8: Overview of the results of pairwise alignments of HSV-1 TK inhibitors:
Mode: selection mode. Size: no. atoms in the MCSS. RMSA: RMS deviation of pairwise molecule
alignment. RMSO: RMS deviation for different spatial orientation between ligand aligned onto the
template and ligand bound to its protein. RMSC: RMS deviation between conformation of protein
bound ligand and conformation of ligand resulting from superimposition onto the template. BestR:
result for highest ranking superimposition. BestS: result for superimposition leading to the lowest
RMSC. Ranks of superimposition are given in brackets. RMSL: RMS deviation between CORINA low
energy conformation and conformation of the protein bound ligand.
RMSO (Å) RMSC (Å) Pair Mode Size
RMSA
(Å) BestR BestS BestR BestS RMSL (Å)
LRS 17 0.58 0.58 0.58 (17) 0.58 0.58 (17) THM-THM
RTS 13 0.27 0.62 0.53 (14) 0.57 0.48 (14) 1.75
LRS 9 0.17 0.95 0.84 (47) 0.59 0.44 (47) THM-HPT
RTS 8 0.06 0.96 0.96 (38) 0.47 0.44 (38) 0.47
LRS 14 0.32 0.74 0.74 (11) 0.69 0.69 (11) THM-TMC
RTS 14 0.32 0.74 0.84 (7) 0.70 0.51 (7) 2.13
LRS 12 0.70 1.75 1.75 (44) 1.18 0.94 (44) THM-RCA
RTS 9 0.06 2.45 2.44 (32) 1.82 0.93 (32) 0.51
LRS 16 0.61 0.97 0.85 (23) 0.92 0.80 (23) THM-ID2
RTS 16 0.50 0.82 0.77 (30) 0.78 0.63 (30) 1.00

6.2 Validation Study Using Crystallographic Data
103
A
B
RMS (Å): 0.06, substructure size: 8 RMS (Å): 0.47
C
D
RMS (Å): 0.06, substructure size: 8 RMS (Å): 0.44
Figure 18: Left part: superimpositions of HPT onto THM (A and C). Right part: superimposition of
the predicted conformation of HPT with the PDB conformation of HPT (B and D). A shows the
best-ranked alignment. C depicts the alignment that leads to the lowest RMS value for the comparison
of the predicted conformation of HPT with the experimentally determined conformation of IGN (D).
Multiple molecule superimpositions
Table 9 gives an overview of the results of the joint multiple molecule superimpositions of the
five HSV-1 TK ligands. The RTS-based superimpositions gave slightly higher RMSO and
RMSC values than the LRS-based superimposition. The conformations calculated in the
multiple molecule alignment are more dissimilar to the bioactive conformation than the
CORINA calculated low-energy conformations.

6.2 Validation Study Using Crystallographic Data
104
Table 9: Overview of the results of the simultaneous multiple molecule alignments of HSV-1 TK
inhibitors. The test compounds are simultaneously and flexibly superimposed onto the template
compound THM.
Mode: selection mode. Size: no. atoms in the MCSS. RMSA: RMS deviation of alignment. RMSO:
RMS deviation between ligand aligned onto the template in multiple molecule alignment and ligand
bound to its protein. RMSC: RMS deviation between conformation of protein bound ligand and
conformation of ligand resulting from multiple molecule superimposition onto the template. RMSL:
RMS deviation between CORINA low energy conformation and conformation of the protein bound
ligand.
Test compd.
Mode Size RMSA (Å) RMSO (Å) RMSC (Å) RMSL (Å)
LRS 11 1.23 1.17 0.96 HPT
RTS 10 1.59 1.38 1.04 .047
LRS 11 1.23 3.15 2.53 TMC
RTS 10 1.59 3.19 2.53 2.13
LRS 11 1.23 1.45 0.67 RCA
RTS 10 1.59 1.59 0.67 0.51
LRS 11 1.23 2.43 1.41 ID2
RTS 10 1.59 2.60 1.42 1.00
The multiple molecule alignment of THM with the other four HSV-1 TK inhibitors is shown
in Figure 19. The pyrimidine rings are aligned but the ring system of ID2, 19, is notably
shifted out of the plane of the other ligands.
6.2.5 Streptavidin
Streptavidin is found in the bacterium Streptomyces avidinii. One of the strongest biological,
noncovalent interactions can be observed in the binding of the vitamin biotin to streptavidin.
It is used in different test systems in immunology and molecular diagnostics. The biological
function of streptavidin is still not well understood.

6.2 Validation Study Using Crystallographic Data
105
A
B
Figure 19: Comparison of the X-ray alignment (left, A) of the three ligands with a multiple
molecule superimposition using GAMMA (right, B). The GAMMA-based superimposition results in
an RMS deviation of 1.59 Å, and a substructure size of 10. The compound that was used as a rigid
template for the GAMMA superimposition, depicted in B, is colored in red in A and B. The molecules
that were flexibly aligned onto the template with GAMMA, shown in B, are shown in CPK colors in A
and B.
A subset of three streptavidin ligands was extracted from the PDB entries 1SRI, 1SRJ and
1SRG. (Table 10).
Table 10: Overview of the three streptavidin ligands used for pairwise and multiple molecule
superimpositions with GAMMA. The PDB code, the PDB identifier of the ligand, the number of
heavy atoms and the number of rotatable bonds are given.
PDB code PDB identifier No. Atoms No. Rotatable Bonds
1SRI (163) DMB 20 3
1SRJ (163) NAB 22 3
1SRG (163) MHB 19 3

6.2 Validation Study Using Crystallographic Data
106
The topological structures of the three streptavidin ligands are shown in Figure 20. The
cocrystallized ligands were used to perform pairwise and multiple molecule alignment studies
with GAMMA. DMB, 20, was used as the reference molecule in all superimposition
experiments. NAB, 21, and MHB, 22, were flexibly fitted onto the template compound DMB.
The three compounds belong to the class of aromatic azo compounds. They have similar size
(19-22 heavy atoms) and three rotatable bonds. The oxygen atoms of the carboxyl group form
hydrogen-bonds with hydrogen-bond donating groups in the protein. Additionally the
hydroxyl group acts as a hydrogen bond donor for acceptor groups in the protein. An
interesting fact is that the hydroxyl group of NAP bound to a naphtyl moiety does not match
exactly the hydroxyl groups of DMB and MHB in the superimposed protein-ligand
complexes. The carboxyl group seems to form the crucial hydrogen-bonding interactions with
the protein in the case of NAB.
20
N O
OH
N
OH 21
N O
OH
N
OH
22
N O
OH
N
OH
Figure 20: Structure diagrams of the three
streptavidin ligands DMB, 20, NAB, 21, and
MHB, 22.
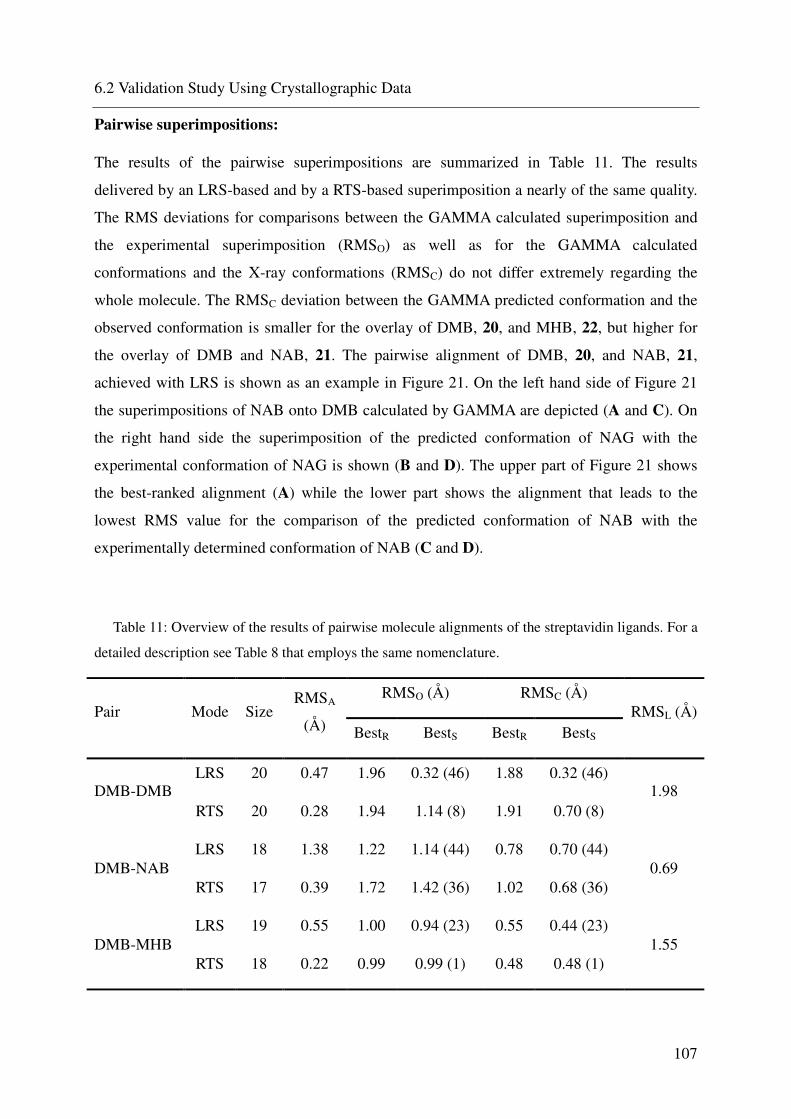
6.2 Validation Study Using Crystallographic Data
107
Pairwise superimpositions:
The results of the pairwise superimpositions are summarized in Table 11. The results
delivered by an LRS-based and by a RTS-based superimposition a nearly of the same quality.
The RMS deviations for comparisons between the GAMMA calculated superimposition and
the experimental superimposition (RMSO) as well as for the GAMMA calculated
conformations and the X-ray conformations (RMSC) do not differ extremely regarding the
whole molecule. The RMSC deviation between the GAMMA predicted conformation and the
observed conformation is smaller for the overlay of DMB, 20, and MHB, 22, but higher for
the overlay of DMB and NAB, 21. The pairwise alignment of DMB, 20, and NAB, 21,
achieved with LRS is shown as an example in Figure 21. On the left hand side of Figure 21
the superimpositions of NAB onto DMB calculated by GAMMA are depicted (A and C). On
the right hand side the superimposition of the predicted conformation of NAG with the
experimental conformation of NAG is shown (B and D). The upper part of Figure 21 shows
the best-ranked alignment (A) while the lower part shows the alignment that leads to the
lowest RMS value for the comparison of the predicted conformation of NAB with the
experimentally determined conformation of NAB (C and D).
Table 11: Overview of the results of pairwise molecule alignments of the streptavidin ligands. For a
detailed description see Table 8 that employs the same nomenclature.
RMSO (Å) RMSC (Å) Pair Mode Size
RMSA
(Å) BestR BestS BestR BestS RMSL (Å)
LRS 20 0.47 1.96 0.32 (46) 1.88 0.32 (46) DMB-DMB
RTS 20 0.28 1.94 1.14 (8) 1.91 0.70 (8) 1.98
LRS 18 1.38 1.22 1.14 (44) 0.78 0.70 (44) DMB-NAB
RTS 17 0.39 1.72 1.42 (36) 1.02 0.68 (36) 0.69
LRS 19 0.55 1.00 0.94 (23) 0.55 0.44 (23) DMB-MHB
RTS 18 0.22 0.99 0.99 (1) 0.48 0.48 (1) 1.55

6.2 Validation Study Using Crystallographic Data
108
A
B
RMS (Å): 1.38, substructure size: 18 RMS (Å): 0.78
C
D
RMS (Å): 1.09, substructure size: 18 RMS (Å): 0.70
Figure 21: Left part: superimpositions of NAB onto DMB calculated by GAMMA (A and C). Right
part: superimposition of PDB conformation of NAG with experimental conformation of NAG (B and
D). A shows the best-ranked alignment. C depicts the alignment that leads to the lowest RMS value
for the comparison of the predicted conformation of NAB with the experimentally determined
conformation of NAB (D).
The pairwise alignment of DMB and NAB is the more interesting example as the hydroxyl
group of NAP bound to a naphtyl moiety does not match exactly the hydroxyl groups of DMB
in the superimposition of protein-ligand complexes. The overlay of the carboxyl groups that
are relevant for receptor binding can be recognized. The overlay of the hydroxyl groups seems
to be poor but this reflects exactly the situation found in the experimental superimposition.

6.2 Validation Study Using Crystallographic Data
109
Multiple molecule superimpositions
Table 12 gives an overview of the results of the simultaneous multiple molecule
superimpositions of NAB, 21, and MHB, 22, onto DMB, 20. Concerning the RMSO and
RMSC deviations between the GAMMA calculated superimposition and the experimental
superimposition and the GAMMA predicted conformations and the X-ray conformations the
RTS selection maintains clearly the better results.
Table 12: Overview of the results of the simultaneous multiple molecule alignments of the three
streptavidin ligands. The test compounds are simultaneously superimposed onto the template
compound DMB. For a detailed description see Table 9 that employs the same nomenclature.
Test compd.
Mode Size RMSA (Å) RMSO (Å) RMSC (Å) RMSL (Å)
LRS 18 2.82 1.29 0.17 NAB
RTS 13 1.59 0.77 0.17 0.69
LRS 18 2.82 2,06 1.70 MHB
RTS 13 1.59 1.81 1.54 1.55
An example for a multiple molecule alignment of NAB and MHB onto the reference
compound DMB applying LRS is shown as an example in Figure 22. It can be recognized that
the alignment of the hydroxyl group carrying phenyl rings is enforced at the cost of the
overlay of the carboxyl groups. This is the main contrast to the binary superimposition that
lays its stress on the overlay of the carboxyl group carrying phenyl ring.

6.2 Validation Study Using Crystallographic Data
110
A
B
Figure 22: Comparison of the X-ray alignment (left, A) of the three ligands with a multiple
molecule superimposition using GAMMA (right, B). The GAMMA-based superimposition results in
an RMS deviation of 2.82 Å, and a substructure size of 18. The template molecule is colored red. The
compound that was used as a rigid template for the GAMMA superimposition, depicted in B, is
colored in red in A and B. The molecules that were flexibly aligned onto the template with GAMMA,
shown in B, are shown in CPK colors in A and B.
6.2.6 Dihydrofolate Reductase
Dihydrofolate reductase (DHFR, EC 1.5.1.3) is found ubiquitously in prokaryotes and
eukaryotes, and in all dividing cells, maintaining levels of fully reduced folate coenzymes.
Bacterial species possesses distinct DHFR enzymes based on their pattern of binding
diaminoheterocyclic molecules compared to mammalian DHFR. The DHFR complexes with
the two molecules folic acid and NADPH. It catalyzes the NADPH-dependent reduction of
folate to dihydrofolate and further to tetrahydrofolate. Both molecules are brought together
very tightly so that the folate can be reduced by transfer of hydrogen atoms into a usable form
by the NADPH. This is an essential step in de novo synthesis both of glycine, of purines and
of deoxythymidine phosphate. Deoxythymidine phosphate is an important precursor used for
DNA synthesis. DHFR is also important for the conversion of deoxyuridine monophosphate
to deoxythymidine monophosphate.
Its central role in DNA precursor synthesis has made DHFR a target of anticancer
chemotherapy. The fact that DHFR is mainly expressed in dividing cells makes it a
preferential anticancer target. In cancer therapy only cells are killed that reproduce at a high
rate applying DHFR inhibiting chemotherapeutics. DHFR was actually the first enzyme

6.2 Validation Study Using Crystallographic Data
111
targeted for cancer chemotherapy. Methotrexate (MTX) is selective for cells in the S-phase of
the cell cycle and, therefore, has a greater negative effect on rapidly dividing cells, which are
replicating their DNA. MTX is used as anti-cancer agent for many neoplastic disorders and
was recently introduced into the therapy of autoimmune diseases. MTX has a similar binding
mode with DHFR as folate. MTX has approximately the same size as folate and blocks the
enzymes active site and prohibits the binding of folate. The affinity of MTX for DHFR is
about one thousand-fold that of dihydrofolic acid. Both compounds bind to DHFR with their
head part that contains the pteridine derivative moiety.
After superimposing the DHFR protein-ligand complexes the ligands from the PDB entries
1DRF, 1U72, 1MVT, 1KMV and 1KMS were extracted. The DHFR was selected as one
possible test case. The superimposition mode of folic acid and of the other inhibitors that are
found in aligned crystal structures of binding sites of the enzyme differ from the expected
superposition from the perspective of the topology of the structures. The two fused
heterocycles in both ligands deviate by a ring flip of 180°. Table 13 shows a list of the
cocrystallized ligands in their PDB entries of the human DHFR complexes that are used in
this study. In pairwise matches of the DHFR inhibitors the ligands MTX, LII, LIH and DTM
were all individually aligned to the ligand folic acid while for a multiple molecule alignment
MTX, LII, LIH and DTM were all simultaneously aligned to the ligand folic acid.
Table 13: The five ligands used for pairwise and multiple molecule superimpositions with
GAMMA are shown. Given is the PDB code, the PDB identifier of the ligand, the number of heavy
atoms and the number of rotatable bonds.
PDB code PDB identifier No. Atoms No. Bonds
1DRF (164) FOL 32 9
1U72 (165) MTX 33 9
1MVT (166) DTM 27 6
1KMV (167) LII 25 4
1KMS (167) LIH 25 3

6.2 Validation Study Using Crystallographic Data
112
The cocrystallized ligands were used to perform pairwise and multiple molecule alignment
studies with GAMMA. FOL was used as the reference molecule in all superimposition
experiments. MTX, DTM, LII and LIH were flexibly fitted onto the reference molecule. The
structure diagrams of the five DHFR ligands are shown in Figure 23.
The folic acid can be broken down into other structural moieties. Folate, 23, contains a
pteridyl moiety that is connected to a p-amino benzoic acid moiety over a CH2NH-bridge and
further with a glutamic acid moiety. The relevant part for receptor binding is the pteridyl
moiety. Inhibitors of the DHFR are known to contain a moiety similar to the pteridine.
Compounds without the pteridine-like moiety are only weak inhibitors. MTX, 24, also
contains a pteridine ring system but a NH2-group connected to the pteridine instead of a
carbonyl group as found in folic acid. The other three inhibitors are different to FOL, 23, and
MTX, 24. They contain a deazapteridine moiety and different chains connected to this ring
system. DTM, 25, comprises a trimethoxybenzyl moiety, LII, 26, a dimethoxybenzyl and LIH,
27, contains a chinolylamino residue. They differ in size (25-32 heavy atoms) and have a
different degree of flexibility.
If looking solely on the topological structures of the ligands an intuitive superimposition of
the two heterocycles of the pteridine and deazapteridine moieties would result in a simple
overlay one on the top of the other. But the binding situation of ligands existing in the crystal
structures is different and becomes clear if one inspects the electrostatics and the hydrogen-
bonding sites [20]. In the literature both alternatives are often referred to as the hetero and the
X-ray alignments.
Pairwise superimpositions:
The results of the pairwise superimpositions are summarized in Table 14. The superimposition
results achieved with linear ranking selection (LRS) perform slightly better than the
superimposition results obtained with restricted tournament selection (RTS). In most cases
LRS-based superimpositions reach lower RMS deviations for comparisons between the
GAMMA calculated superimposition and the experimental superimposition (RMSO) as well
as for the GAMMA calculated conformations and the X-ray conformations (RMSC). In most
cases the ranks that achieve the lowest RMSC and RMSO deviations are settled quite below in
the top 50 of the hit list for GAMMA superimpositions. In all cases, the calculated GAMMA

6.2 Validation Study Using Crystallographic Data
113
23
N NH2
NH
O
N
N
HN
O
HN
OHO
O
HO
24
N NH2
N
NH2
N
N
N
O
HN
O
HO
OHO
25
N NH2
N
H2N
N
N
O
O
O
26
N
NH2
N NH2NO
O
27
N
NH2
N NH2N
HNN
Figure 23: Structure diagrams of the five
DHFR ligands folic acid (FOL), 23,
methotrexate (MTX), 24, DTM, 25, SRI-
9662 (LII), 26, and SRI-9439 (LIH), 27.
conformations among these ranks are more similar to the experimentally observed
conformation than a low-energy conformation calculated by CORINA.

6.2 Validation Study Using Crystallographic Data
114
All presented results below originate from superimposition experiments obtained with linear
ranking selection. The superimposition results of FOL, 23, and MTX, 24 is depicted in Figure
24.
Table 14: Overview of the results of pairwise alignments of DHFR ligands. For a detailed
description see Table 8 that employs the same nomenclature.
RMSO (Å) RMSC (Å) Pair Mode Size
RMSA
(Å) BestR BestS BestR BestS RMSL (Å)
LRS 32 0.46 0.97 0.58 (7) 0.97 0.58 (7) FOL-FOL
RTS 31 0.52 1.02 0.45 (4) 1.02 0.45 (4) 2.70
LRS 27 1.52 2.11 1.52 (33) 1.90 1,16 (33) FOL-MTX
RTS 25 0.70 2.24 1.53 (12) 2.06 1.16 (12) 2.54
LRS 19 3.09 3.60 2.31 (41) 2.94 1.76 (41) FOL-DTM
RTS 15 1.84 3.29 2.28 (45) 2.81 1.40 (45) 1.76
LRS 20 2.51 2.66 2.43 (5) 1.84 1.04 (5) FOL-LII
RTS 17 2.16 2.47 2.13 (41) 1.35 0.90 (41) 1.58
LRS 15 2.55 2.55 2.35 (22) 1.34 1.16 (22) FOL-LIH
RTS 12 1.43 2.72 1.88 (29) 2.04 0.75 (29) 1.86
On the left hand side of Figure Figure 24, the superimpositions of MTX onto FOL calculated
by GAMMA are depicted (A and C). On the right hand side the superimposition of the
predicted conformation of MTX with the experimental conformation of MTX is shown (B
and D). The upper part shows the best-ranked alignment (A) while the lower part shows the
alignment that leads to the lowest RMS value for the comparison of the predicted
conformation of MTX with the experimentally determined conformation of MTX (C and D).
The best scored GAMMA alignment reflects the so-called hetero mode where the pteridine

6.2 Validation Study Using Crystallographic Data
115
rings of FOL and MTX are tightly overlaid. The RMS deviation for this overlay is 1.52Å
(Figure 24 A). A comparison of the conformations of MTX received by this GAMMA
alignment with the conformation of MTX as found in the crystal structure has an all-atom
A
B
RMS (Å): 1.52, substructure size: 27 RMS (Å): 1.90
C
D
RMS (Å): 1.77, substructure size: 27 RMS (Å): 1.16
Figure 24: Left part: superimpositions of MTX onto FOL calculated by GAMMA (A and C). Right
part: superimposition of predicted conformation of MTX with PDB conformation of MTX (B and D).
A shows the best-ranked alignment. C depicts the alignment that leads to the lowest RMS value for the
comparison of the predicted conformation of MTX with the experimentally determined conformation
of MTX (D).

6.2 Validation Study Using Crystallographic Data
116
RMS deviation of 1.90Å (Figure 24 B). This RMS value is mainly influenced by a mismatch
in the pteridine moieties. The p-amino benzamide and the glutamic acid group do not deviate
much in the spatial positions of the atoms. When looking at the other 50 results of the
alignments of FOL with MTX, the lowest RMS value with 1.16 Å for the overlay between the
predicted conformation and the experimentally determined conformation (Figure 24 D) is
found at rank 33.
A
B
C
Figure 25: Top view on the alignment of the pteridine moieties of FOL and MTX (A). This overlay
was achieved with the superimposition found at rank 33. It represents the alignment that leads to the
lowest RMS deviation between the GAMMA predicted conformation of MTX and the experimental
conformation of MTX. B shows the pteridine ring system of FOL and C show the pteridine moiety of
MTX separately but under regard that the spatial orientation is kept.
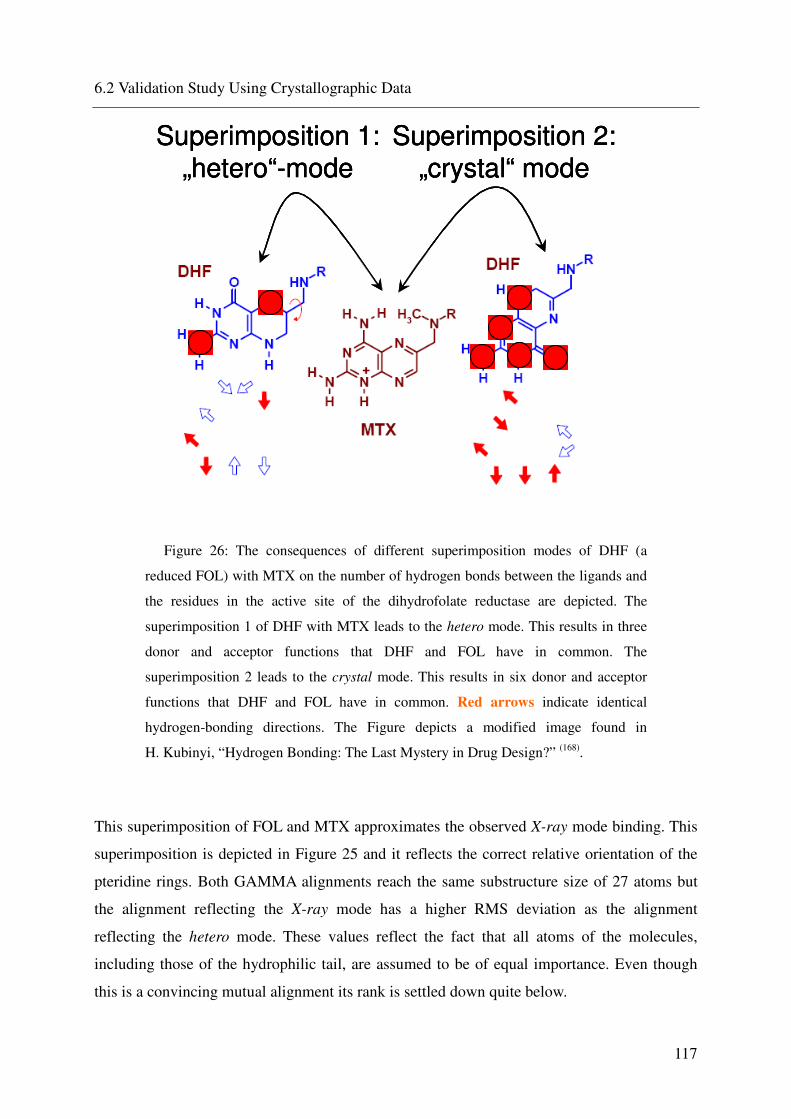
6.2 Validation Study Using Crystallographic Data
117
Figure 26: The consequences of different superimposition modes of DHF (a
reduced FOL) with MTX on the number of hydrogen bonds between the ligands and
the residues in the active site of the dihydrofolate reductase are depicted. The
superimposition 1 of DHF with MTX leads to the hetero mode. This results in three
donor and acceptor functions that DHF and FOL have in common. The
superimposition 2 leads to the crystal mode. This results in six donor and acceptor
functions that DHF and FOL have in common. Red arrows indicate identical
hydrogen-bonding directions. The Figure depicts a modified image found in
H. Kubinyi, “Hydrogen Bonding: The Last Mystery in Drug Design?” (168).
This superimposition of FOL and MTX approximates the observed X-ray mode binding. This
superimposition is depicted in Figure 25 and it reflects the correct relative orientation of the
pteridine rings. Both GAMMA alignments reach the same substructure size of 27 atoms but
the alignment reflecting the X-ray mode has a higher RMS deviation as the alignment
reflecting the hetero mode. These values reflect the fact that all atoms of the molecules,
including those of the hydrophilic tail, are assumed to be of equal importance. Even though
this is a convincing mutual alignment its rank is settled down quite below.
Superimposition 1: „hetero“-mode
Superimposition 2: „crystal“ mode
Superimposition 1: „hetero“-mode
Superimposition 2: „crystal“ mode
Superimposition 1: „hetero“-mode
Superimposition 2: „crystal“ mode

6.2 Validation Study Using Crystallographic Data
118
Although the chemical structures of DHF and MTX look very similar a simple atom-by-atom
superposition would mislead to a wrong overlay. A closer inspection of the hydrogen-bond
donor and acceptor patterns of both compounds that are established with residues in the active
site of DHFR gives the necessary hint (Figure 26). A simple atom-by-atom superposition
would lead to the hetero alignment of both molecules that results in only three common
hydrogen bond donor and acceptor functions. In contrast, in the crystal alignment both ligands
have six donor and acceptor functions in common.
Multiple molecule superimpositions
Table 15 gives an overview of the results of the simultaneous multiple molecule
superimpositions of MTX, 24, DTM, 25, LII, 26, and LIH, 27, onto FOL, 23. The multiple
molecular superimpositions of the five DHFR ligands using FOL as a template on which the
other four inhibitors are matched (Figure 27) leads to an overall RMS difference of 1.9 Å with
a substructure size of 10. As in the case of pairwise alignments the application of LRS leads to
lower RMS differences than the usage of RTS. Both, the RMSO and the RMSC deviations are
lower for the LRS-based superimpositions than for the RTS-based superimpositions. As it is
not a simple task in a multiple molecule alignment to compare different rankings of isolated
conformations, just the best-ranked superimposition were inspected. In a multiple molecule
superimposition, a molecule is not only superimposed onto the template but also the
alignment to the other flexible compounds is simultaneously evaluated.
The quite small RMS value of 1.9 Å for the multiple molecule superimpositions is surprising
because the pterine moiety of the template FOL is shifted relative to the pteridine rings of the
other four ligands, therefore, leading to a superimposition mode that is more equivalent to the
X-ray mode than to the hetero mode. This seeming contradiction is dissolved when looking at
the 3D-MCSS of the five compounds. Normally, GAMMA weights all atoms including those
in the pteridine rings, in the p-amino-benzamide and in the carboxyl groups with the same
importance for a match. In reality the alignment of the molecules is determined mainly by the
pteridine ring match. In the current alignment the substructure atoms are mainly found in the
pterin and the benzene moiety, therefore, the superimposition is directed to thy X-ray mode
(Figure 27).

6.2 Validation Study Using Crystallographic Data
119
Table 15: Overview of the results of simultaneous multiple molecule alignments of the five DHFR
ligands. For a detailed description see Table 9 that employs the same nomenclature.
Test compd.
Mode Size RMSA (Å) RMSO (Å) RMSC (Å) RMSL (Å)
LRS 10 1.90 5.30 1.87 MTX
RTS 8 2.28 5.80 1.87 2.7
LRS 10 1.90 3.03 1.58 DTM
RTS 8 2.28 3.69 1.58 1.86
LRS 10 1.90 3.28 2.54 LII
RTS 8 2.28 3.31 2.54 1.58
LRS 10 1.90 2.37 0.99 LIH
RTS 8 2.28 3.44 1.50 1.76
An example for a multiple molecule alignment is shown in Figure 27. A closer inspection of
the conformations of MTX received by the GAMMA alignment with the conformation of
MTX as found in the crystal structure has an all-atom-RMS deviation of 1.87 Å. In contrast to
pairwise alignments, where the RMS value is mainly influenced by a mismatch in the
pteridine moieties, the results received by the multiple molecule alignment is obtained by
deviations in the pteridine moieties and also the p-amino benzamide and the glutamic acid
moieties. Therefore, the predicted alignment of MTX onto FOL of the multiple molecule
superimpositions is more close to the observed binding mode.

6.2 Validation Study Using Crystallographic Data
120
A
B
Figure 27: Comparison of the X-ray alignment (left, A) of the three ligands with a multiple
molecule superimposition using GAMMA (right, B). The GAMMA-based superimposition results in
an RMS deviation of 1.9 Å, and a substructure size of 10. The template molecule is colored red. The
compound that was used as a rigid template for the GAMMA superimposition, depicted in B, is
colored in red in A and B. The molecules that were flexibly aligned onto the template with GAMMA,
shown in B, are shown in CPK colors in A and B.
6.2.7 Thrombin
Thrombin (EC 3.4.21.5) is a serine protease that plays an important role in the blood
coagulation cascade. Thrombin is activated through a signaling pathway of molecules that is
set on by tissue injuries and inflammation. In the last step Factor VII activates thrombin that
catalyzes the cleavage of the soluble plasma protein fibrinogen into the insoluble fibrin. Fibrin
then polymerizes and is embedded together with platelets into the thrombus. The cleavage of
the fibrinogen protein chain occurs between the amino acids arginine and glycine. Through to
its role in blood coagulation thrombin can act as a drug target in anticoagulant therapy.
Just as the other serine protease trypsin, thrombin contains a catalytic triad that consists out of
serine, histidine and aspartic acid (Asp189). The Asp189 is found at the bottom of the
so-called S1 pocket of the active site. Serine is used to perform the cleavage of fibrinogen.
Inhibitors of thrombin posses a group that is analogues to the amino acid arginine that is

6.2 Validation Study Using Crystallographic Data
121
necessary in the fibrinogen cleavage. Most inhibitors of thrombin carry a guanidinium or
amidinium moiety that can form a salt bridge with Asp189.
As the hybrid genetic algorithm deals with small molecule ligands, it is not feasible to take
the natural substrate fibrinogen or the potent inhibitor hirudin as a template for
superimposition experiments. Both are polypeptides. Therefore, the protein structure from
human thrombin in PDB entry 1K22 complexed with its small molecule inhibitor melagatran
(MEL) was used to perform a similar binding site search. From the received set of
superimposed ligand-protein complexes we have chosen the three PDB entries 1K22, 1K21
and 1LHC. Afterwards the cocrystallized ligands MEL, inogatran (IGN) and DuP714 (DP7)
were extracted from the PDB (Table 16).
The cocrystallized ligands were than used to perform pairwise and multiple molecule
alignment studies with GAMMA. MEL was used as the reference molecule in all
superimposition experiments. IGN and DP7 were flexibly fitted onto the template compound.
The structure diagrams of the three thrombin inhibitors are shown in Figure 28.
Table 16: The three thrombin inhibitors used for pairwise and multiple molecule superimpositions
with GAMMA. The PDB code, the PDB identifier of the ligand, the number of heavy atoms and the
number of rotatable bonds are given.
PDB code PDB identifier No. Atoms No. Rotatable Bonds
1K22 (169) MEL 31 9
1K21 (169) IGN 31 12
1LHC (170) DP7 33 12

6.2 Validation Study Using Crystallographic Data
122
28
NHO
N
O
HN
H2N NH
O
HO
29
O
N
O
HN
HN
H2N
NH
HN
O
OH
30
N
BHN OH
OH
NHHN
NH2
O
O
NH
O
Figure 28: Structure diagrams of the three
thrombin inhibitors melagatran (MEL), 28,
inogatran (ING), 29, and DuP714 (DP7), 30.
All three compounds are low-molecular-weight peptidomimetic inhibitors. They have similar
size (31-33 heavy atoms) and carry a guanidine (IGN, DP7) or benzamidine (MEL) group that
forms a salt bridge with the residue Asp189 in the S1 pocket. The inhibitor DP7 carries an
additional boronic acid moiety that forms a tetrahedral geometry after nucleophilic attack of a
hydroxide ion. Therefore, the boronic acid mimics the tetrahedral transition state of serine
proteases. The azetidine of MEL, the piperidine of IGN and the pyrrolidine of DP7 extend
into the S2 subpocket and the cyclohexyl moieties of MEL and IGN and the benzyl group of
DP7 extend into the hydrophobic S3 pocket of the active site.

6.2 Validation Study Using Crystallographic Data
123
Pairwise superimpositions:
The results of the pairwise superimpositions are summarized in Table 17. In nearly all cases
linear ranking selection (LRS) outperforms the restricted tournament selection (RTS). The
LRS-based superimpositions reach lower RMS deviations for comparisons between the
GAMMA calculated superimposition and the experimental superimposition (RMSO) as well
as for the GAMMA calculated conformations and the X-ray conformations (RMSC).
Table 17: Overview if the results of pairwise alignments. For a detailed description see Table 8 that
employs the same nomenclature.
RMSO (Å) RMSC (Å) Pair Mode Size
RMSA
(Å) BestR BestS BestR BestS RMSL (Å)
LRS 31 0.31 0.93 0.40 (3) 0.93 0.40 (3) MEL-MEL
RTS 30 0.86 1.22 0.37 (3) 1.22 0.37 (3) 2.84
LRS 26 2.19 1.46 1.15 (14) 1.35 0.96 (14) MEL-IGN
RTS 23 1.67 2.09 1.60 (19) 2.05 1.45 (19) 1.77
LRS 22 1.84 2.21 1.45 (12) 1.99 1.27 (12) MEL-DP7
RTS 18 1.38 3.02 1.73 (32) 2.81 1.64 (32) 1.74
The ranks that achieve RMSO deviations below 1.5 Å and RMSC deviations below 1.3 Å can
be found in the top 15 of the hit list for LRS-based GAMMA superimpositions. RTS-based
alignments produce inferior results. Also, the calculated GAMMA conformations among these
ranks are more similar to the experimentally observed conformation than a low-energy
conformation calculated by CORINA.

6.2 Validation Study Using Crystallographic Data
124
A
B
RMS (Å): 2.19, substructure size: 26 RMS (Å): 1.35
C
D
RMS (Å): 2.13, substructure size: 26 RMS (Å): 0.96
Figure 29: Left part: superimpositions of IGN onto MEL calculated by GAMMA (A and C). Right
part: superimposition of predicted conformation of IGN with PDB conformation of IGN (B and D). A
shows the best-ranked alignment. C depicts the alignment that leads to the lowest RMS value for the
comparison of the predicted conformation of IGN with the experimentally determined conformation of
IGN (D).
The pairwise alignment of MEL, 28, and IGN, 29, achieved with LRS is shown as an example
in Figure 29. The left hand side of Figure 29 depicts the superimpositions of IGN onto MEL
calculated by GAMMA (A and C). On the right hand side the superimposition of the
predicted conformation of IGN with the experimental conformation of IGN is shown (B and
D). The upper part shows the best-ranked alignment (A) while the lower part shows the
alignment that leads to the lowest RMS value for the comparison of the predicted
conformation of IGN with the experimentally determined conformation of IGN (C and D).

6.2 Validation Study Using Crystallographic Data
125
The overlay of the moieties that are relevant for receptor binding can be recognized. The basic
guanidinium of IGN is matched with the amidinium group of MEL. Also, the hydrophilic
cyclohexyl parts are overlaid. In the middle part of the structures one can recognize the
overlay of the azetidine ring of MEL with the piperidine ring of IGN.
Multiple molecule superimpositions
Table 18 gives an overview of the results of the simultaneous multiple molecule
superimpositions of IGN, 29, and DP7, 30, onto MEL, 28. As in the case of pairwise
alignments, the application of LRS leads to lower RMS differences than the usage of RTS.
The LRS-based superimpositions reach lower RMS deviations for comparisons between the
GAMMA calculated superimposition and the experimental superimposition (RMSO) as well
as for the GAMMA calculated conformations and the X-ray conformations (RMSC). In
contrast to the pairwise alignments, just the best-ranked superimposition were inspected.
The achieved RMSO deviations for LRS-based GAMMA superimpositions are below 2.5 Å
and worse than those obtained with pairwise alignments. Interestingly, the conformation
calculated for DP7 in a multiple molecule alignment is more similar to the experimental
conformation (RMSC: 1.74) than the one calculated with the best-ranked pairwise alignment
(RMSC: 1.99).
An example for a multiple molecule alignment of IGN and DP7 onto the reference compound
MEL applying LRS is shown as an example in Figure 30. The overlay of the moieties that are
relevant for receptor binding can be recognized. But the resulting alignments gave larger
deviations for RMSO as well as for RMSC than for the single pairwise alignments. Also, the
guanidinium moieties of IGN and DP7 are not properly superposed onto the amidinium of
MEL. In the left part of Figure 30 showing the X-ray alignment it can be seen that these
moieties that form a salt bridge to Asp189 in the S1 pocket are overlaid properly while the
hydrophobic cyclohexyl and benzyl moieties show a twisted orientation against each other.

6.2 Validation Study Using Crystallographic Data
126
Table 18: Overview of the results of the simultaneous multiple molecule alignments. For a detailed
description see Table 9 that employs the same nomenclature.
Test compd.
Mode Size RMSA (Å) RMSO (Å) RMSC (Å) RMSL (Å)
LRS 19 1.43 2.33 1.74 IGN
RTS 11 0.92 3.85 3.22 1.74
LRS 19 1.43 2.07 1.74 DP7
RTS 11 0.92 2.22 2.12 1.77
A
B
Figure 30: Comparison of the X-ray alignment (left, A) of the three ligands with a multiple
molecule superimposition using GAMMA (right, B). The GAMMA-based superimposition results in
an RMS deviation of 1.43Å, and a substructure size of 19. The template molecule is colored red. The
compound that was used as a rigid template for the GAMMA superimposition, depicted in B, is
colored in red in A and B. The molecules that were flexibly aligned onto the template with GAMMA,
shown in B, are shown in CPK colors in A and B.
6.2.8 Estrogen Receptor α
The estrogen receptors (ER) belong to the group of transcription regulating receptors. The two
genes ESR1 and ESR2 express two isoforms called α and β receptor that differ with respect to
tissue distribution and transcriptional activity. The receptor proteins are found in the cellular
nucleus and estrogen is an agonist of the receptor. This member of the nuclear receptor family
has a C-terminal Ligand-Binding Domain (LBD) for binding of estrogen or similar ligands.
After binding of estrogen the receptor protein undergoes conformational changes and forms a

6.2 Validation Study Using Crystallographic Data
127
homodimer. The homodimer can then bind to a specific DNA sequence that controls
transcription of specified genes. The DNA binding domain is a highly conserved two zinc
finger DNA binding module. The N-terminal part of the protein consists of the transactivation
domain (AF1).
Estrogens are of importance for both genders as they affect the differentiation, and the
development of reproductive tissues like e.g. the mammary glands in women and the testis in
men. Estrogens are also involved in maintaining bone density and neuroprotective processes.
The so-called anti-estrogens are used in treatment of certain breast cancers and some prostate
cancers.
The receptor antagonist CM3 was chosen as a template for the superimposition experiments
with GAMMA. It is one of the larger ligands found in the PDB entries of the human ERα. The
three PDB entries 1YIN, 1XP6 and 1XP1 were chosen from the received set of superimposed
ligand-protein-complexes. Afterwards, the cocrystallized antagonists CM3, AIU and AIH
were extracted (Table 19).
Table 19: The three ERα antagonists used for pairwise and multiple molecule superimpositions
with GAMMA. The PDB code, the PDB identifier of the ligand, the number of heavy atoms and the
number of rotatable bonds are given.
PDB code PDB identifier No. Atoms No. Rotatable Bonds
1YIN (171) CM3 35 6
1XP6 (172) AIU 34 6
1XP1 (172) AIH 34 6
Pairwise and multiple molecule alignment studies were conducted with the three
cocrystallized ligands. CM3 was used as the reference molecule in all superimposition
experiments. 1AIU and 1AIH were flexibly fitted onto the reference molecule. The structure
diagrams of the three ERα antagonists are shown in Figure 31.

6.2 Validation Study Using Crystallographic Data
128
All three compounds are very similar in size (34-35 heavy atoms) and have the same number
of rotatable bonds. CM3, 31, is 2,3-diaryl-chromane with a 5 fluorine substituents and with an
alkyl substituted piperidine side chain. AIU, 32, and AIH, 33, are dihydrobenzoxathiins with
31
O
OH
FHO
O
N
32
O
OHS
HO
O
N
33
O
OHS
HO
O
N
Figure 31: Structure diagrams of the three ERα
antagonists CM3, 31, AIU, 32, and AIH, 33.
an alkyl substituted pyrrolidine side chain. AIU and AIH are diastereomers with two methyl
substituents at the pyrrolidine. The chromane and the dihydrobenzoxathiin skeletons together
with the phenolyl substituent mimic the shape of estrogen. The two hydroxyl substituents, the
one bound to the chromane or the dihydrobenzoxathiin skeletons as well as the one from the
phenolyl, are necessary to form hydrogen-bonds with active site residues.

6.2 Validation Study Using Crystallographic Data
129
Pairwise superimpositions:
An overview of the results of the pairwise superimpositions is given in Table 20. The RTS-
based superimpositions gave slightly better results for the comparison of the calculated
superimposition with the experimental superimposition as well as for the comparison of the
predicted conformations with the X-ray derived conformations. For RTS, the best-ranked
alignments gave RMSO differences below 2.2 Å and RMSC deviations below 2.15 Å. In the
case of the pairwise alignment of AIH, 32, onto CM3, 31, the rank of the alignments that led
to the best RMSO and RMC values are settled right at the back. The conformations that are
found with a GAMMA alignment are more similar to the bioactive conformations than the
CORINA low-energy conformation.
Table 20: Overview of the results of pairwise alignments. For a detailed description see Table 8 that
employs the same nomenclature.
RMSO (Å) RMSC (Å) Pair Mode Size
RMSA
(Å) BestR BestS BestR BestS RMSL (Å)
LRS 35 2.03 2.18 2.01 (26) 2.17 2.01 (26) CM3-CM3
RTS 32 1.91 2.06 1.99 (2) 2.01 1.98 (2) 2.29
LRS 27 1.66 1.93 1.81 (26) 1.78 1.68 (26) CM3-AIU
RTS 25 1.55 2.0 1.98 (2) 1.74 1.71 (2) 2.06
LRS 27 2.09 2.25 1.88 (46) 2.14 1.73 (46) CM3-AIH
RTS 25 1.63 2.20 1.94 (32) 2.12 1.75 (32) 2.13
The pairwise alignment of AIU onto CM3 calculated on the basis of RTS is shown as an
example superimposition in Figure 32. On the left hand side of Figure 32, the
superimpositions of AIU onto CM3 calculated by GAMMA are depicted (A and C). On the
right hand side the superimposition of the predicted conformation of AIU with the
experimental conformation of AIU is shown (B and D). The upper part shows the best-ranked
alignment (A) while the lower part shows the alignment that leads to the lowest RMS value

6.2 Validation Study Using Crystallographic Data
130
for the comparison of the predicted conformation of AIU with the experimentally determined
conformation of AIU (C and D).
A
B
RMS (Å): 1.55, substructure size: 25 RMS (Å): 1.74
C
D
RMS (Å): 1.42, substructure size: 24 RMS (Å): 1.71
Figure 32: Left part: superimpositions of AIU onto CM3 calculated by GAMMA (A and C). Right
part: superimposition of predicted conformation of AIU with PDB conformation of AIU (B and D). A
shows the best-ranked alignment. C depicts the alignment that leads to the lowest RMS value for the
comparison of the predicted conformation of AIU with the experimentally determined conformation of
AIU (D).

6.2 Validation Study Using Crystallographic Data
131
It can be seen that the overlay of the hydroxyl substituents that are relevant for receptor
binding is not successful. The alignment represents a compromise solution that matches not
only the chromane with the dihydrobenzoxathiin skeleton but also the aryl moieties and the
pyrrolidine ring with the piperidine ring.
Multiple molecule superimpositions
Table 21 gives an overview of the results of the simultaneous multiple molecule
superimpositions of AIU, 32, and AIH, 33, onto CM3, 31. In contrast to the results obtained
with a pairwise match, the RTS-based superimpositions gave higher RMSO and RMSC values
than the LRS-based superimposition. The outcome of the best-ranked pairwise alignments
gave again better RMS deviations in all cases for comparing the calculated superimposition
with the experimental superimposition and for comparing the predicted conformation with the
experimental conformation. The RMSC difference is nearly in the same range as the RMSL
that compares a CORINA calculated low-energy conformation with the bioactive
conformation.
Table 21: Overview of the results of the simultaneous multiple molecule alignments. The test
compounds are jointly superimposed onto the template compound CM3. For a detailed description see
Table 9 that employs the same nomenclature.
Test compd.
Mode Size RMSA (Å) RMSO (Å) RMSC (Å) RMSL (Å)
LRS 27 5.16 2.23 2.1 AIU
RTS 18 3.15 3.17 2.6 2.08
LRS 27 5.16 2.29 2.15 AIH
RTS 18 3.15 2.67 2.15 2.16
Figure 33 presents the multiple molecule alignment compared with the reference alignment of
CM3, 31, AIU, 32, and AIH, 33. The overlay of the both dihydrobenzoxathiin skeletons of
AIU and AIH is good while they are not matched with the chromane skeleton of CM3. The

6.2 Validation Study Using Crystallographic Data
132
phenyl moiety in the middle of the three compounds is fitted well while only the pyrrolidine
ring of AIU is matched onto the piperidine ring of the template. The pyrrolidine of AIH in
contrast does not match with either of the two other heterocycles.
6.2.9 Penicillopepsin
Penicillopepsin (3.4.23.20) is an aspartic proteinase found in the filamentous fungus
Penicillium janthinellum. It possesses trypsinogen-activating activity and hydrolyses proteins
with a broad specificity similar to that of pepsin A. For its catalytic activity penicillopepsin
A
B
Figure 33: Comparison of the X-ray alignment (left, A) of the three ligands with a multiple
molecule superimposition using GAMMA (right, B). The GAMMA-based superimposition results in
an RMS deviation of 3.15 Å, and a substructure size of 18. The template molecule is colored red. The
compound that was used as a rigid template for the GAMMA superimposition, depicted in B, is
colored in red in A and B. The molecules that were flexibly aligned onto the template with GAMMA,
shown in B, are shown in CPK colors in A and B.
prefers hydrophobic residues at P1 and P1'. The active site contains two catalytic aspartic acid
residues Asp33 and Asp213. One of both polarizes a water molecule to maintain a
nucleophilic attack on the amide bond of the peptide to be cleaved.

6.2 Validation Study Using Crystallographic Data
133
Table 22: The five penicillopepsin ligands used for pairwise and multiple molecule
superimpositions with GAMMA. The PDB code, the PDB identifier of the ligand, the number of
heavy atoms and the number of rotatable bonds are given.
PDB code PDB identifier No. Atoms No. Rotatable Bonds
1PPL (173) IVA-VAL-VAL-PLE-OPH 42 18
1BXQ (174) PP8 43 19
1PPM (173) CBZ-ALA-ALA-PLE-OPH 42 17
1PPK (173) IVA-VAL-VAL-PTA-OET 35 16
1APV (175) IVA-VAL-VAL-DFO-NME 36 14
The five ligands binding to penicillopepsin that are used for the superimposition studies are
listed in Table 22 with their PDB entry codes.
After extraction of the cocrystallized ligands pairwise and multiple molecule alignment
studies were performed with GAMMA. The ligand of PDB entry 1PPL was used as the
reference molecule in all superimposition experiments. The ligands of the other PDB entries
were flexibly aligned onto the reference compound. The structure diagrams of the five
penicillopepsin inhibitors are shown in Figure 34.
The ligands deposited in the PDB entries 1PPL, 1PPM, 1PPK and 1BXQ are phosphorus
containing peptides. The phosphorus group is able to mimic the transition state. Hence, the
inhibitors bind in the active site of penicillopepsin without being cleaved. The inhibitor in
1APV possesses two fluorine atoms adjacent to a ketone which is found to be hydrated in the
penicillopepsin active site. This gem-diol mimics the tetrahedral reaction intermediate.

6.2 Validation Study Using Crystallographic Data
134
34
OHN
NH
O
HN O
P
O
OHO
O
O
35
HN O
O
NH
OHN
P
O
HO
O
O
O
H2N
O
36
O
O
HN
NH
O
OHN
P
O
HO
O
O
O
37
OHN
NH
O
HN O
P
O
OH
OO
38
O
NH
NHO
NH
O
OH
HO
F
F
O
NH
Figure 34: Structure diagrams of the five
penicillopepsin ligands deposited in the PDB
entries 1PPL, 34, 1PPM, 35, 1PPK, 36, 1BXQ,
37, and 1APV, 38.

6.2 Validation Study Using Crystallographic Data
135
Pairwise superimpositions:
The results of the pairwise superimpositions are summarized in Table 23.
Table 23: Overview of the results of pairwise alignments. For a detailed description see Table 8 that
employs the same nomenclature. For the sake of simplicity the PDB entry codes are given instead of
the PDB ligand identifiers.
RMSO (Å) RMSC (Å) Pair Mode Size
RMSA
(Å) BestR BestS BestR BestS
RMSL
(Å)
LRS 42 1.29 1.29 1.18 (2) 1.24 1.18 (2) 1PPL-1PPL
RTS 35 1.83 2.14 2.14 (1) 2.11 2.06 (37) 2.37
LRS 39 1.43 2.09 1.39 (8) 2.02 1.35 (8) 1PPL-1BXQ
RTS 32 1.83 3.41 2.07 (37) 3.07 2.04 (37) 2.97
LRS 34 0.92 1.49 1.23 (7) 1.33 1.30 (7) 1PPL-1PPM
RTS 29 1.90 7.33 2.69 (29) 5.00 2.32 (29) 2.27
LRS 32 0.59 0.72 0.72 (1) 0.68 0.68 (1) 1PPL-1PPK
RTS 30 1.13 1.36 1.36 (1) 1.31 1.31 (1) 1.95
LRS 31 1.08 1.35 1.21 (22) 1.19 1.07 (22) 1PPL-1APV
RTS 26 1.28 2.73 1.77 (5) 2.46 1.69 (5) 1.23
Clearly, in all superimposition experiments LRS outperforms RTS. The LRS-based
superimpositions achieve lower RMS deviations for comparisons between the GAMMA
calculated superimposition and the X-ray-based alignments (RMSO) as well as for the
GAMMA calculated conformations and the X-ray conformations (RMSC). For all inhibitors
convincing mutual alignments for LRS-based superimpositions were found. The RMSO
deviation between the ligand bound to its protein and the ligand aligned onto the template is
below 2.1 Å. Also, the RMSC difference between the conformation of the protein bound

6.2 Validation Study Using Crystallographic Data
136
A
B
RMS (Å): 1.08, substructure size: 31 RMS (Å): 1.19
C
D
RMS (Å): 1.22, substructure size: 31 RMS (Å): 1.07
Figure 35: Left part: superimpositions of 1APV onto 1PPL calculated by GAMMA (A and C).
Right part: superimposition of predicted conformation of 1APV with PDB conformation of 1APV (B
and D). A shows the best-ranked alignment. C depicts the alignment that leads to the lowest RMS
value for the comparison of the predicted conformation of 1APV with the experimentally determined
conformation of 1APV (D).

6.2 Validation Study Using Crystallographic Data
137
ligand and the conformation of the ligand resulting from the superimposition onto the
template is below 2.1 Å.
As an example the pairwise alignment of 1APV, 38, onto 1PPL, 34, obtained with LRS is
shown in Figure 35.
On the left hand side of Figure 35 the superimpositions of 1APV onto 1PPL calculated by
GAMMA are depicted (A and C). On the right hand side the superimposition of the predicted
conformation of 1APV with the experimental conformation of 1APV is shown (B and D). The
upper part shows the best-ranked alignment (A) while the lower part shows the alignment that
leads to the lowest RMS value for the comparison of the predicted conformation of 1APV
with the experimentally determined conformation of 1APV (C and D).
This superimposition is not representing the best result, but it is the most interesting
superimposition because of the differences in the moieties extending into the active site of
penicillopepsin. 1APV exhibits a carbon atom bound to two fluorine atoms next to a gem-diol
while 1PPL carries a phosphonate. The superimposition ranked 22 exhibits a convincing
overlay of these moieties. The best-ranked superimposition overlays especially the gem-diol
carbon with the two hydroxyl groups at the expense of the two fluorine atoms.
Multiple molecule superimpositions
Table 24 gives an overview of the results of the joint superimpositions of the five inhibitors.
1BXQ, 37, 1PPM, 35, 1PPK, 36 and 1APV, 38, are flexibly aligned onto 1PPL, 34. As in the
case of pairwise alignments the application of LRS leads to lower RMS differences than the
usage of RTS. Especially the conformation of the ligand of the PDB entry 1PPK calculated
with a RTS-based alignment leads to high RMS deviations for both the RMSO and the RMSC.
The achieved RMSO deviations for LRS-based GAMMA superimpositions are above 3 Å for
the PDB entry 1BXQ. Only the predicted conformations for the inhibitor found in PDB entry
1APV stays below 2 Å for the RMSO and the RMSC difference. The simultaneous overlay of
multiple molecules performed worse compared with the results of pairwise superimpositions.

6.2 Validation Study Using Crystallographic Data
138
Table 24: Overview of the results of the simultaneous multiple molecule alignments. The test
compounds are simultaneously and flexibly superimposed onto the template compound 1PPL. For a
detailed description see Table 9 that employs the same nomenclature. For the sake of simplicity the
PDB entry codes are given instead of the PDB ligand identifiers.
Test compd.
Mode Size RMSA (Å) RMSO (Å) RMSC (Å) RMSL (Å)
LRS 19 4.81 3.17 2.97 1BXQ
RTS 7 1.73 3.65 2.97 2.97
LRS 19 4.81 2.86 2.27 1PPM
RTS 7 1.73 3.36 2.27 2.27
LRS 19 4.81 2.36 2.32 1PPK
RTS 7 1.73 5.49 4.23 1.95
LRS 19 4.81 1.60 1.41 1APV
RTS 7 1.73 2.18 1.41 1.23
The moieties that are of relevance for the interaction with the two catalytic aspartic acids,
Asp33 and Asp213, namely the carbon atom bound to two fluorine atoms with its neighboring
gem-diol and the phosphorus carrying groups are matched (Figure 36). The main
contributions to the high RMS deviations can be found in a poor overlay of the other atoms
that are part of the 3D-MCSS.

6.2 Validation Study Using Crystallographic Data
139
A
B
Figure 36: Comparison of the X-ray alignment (left, A) of the five ligands with a multiple molecule
superimposition using GAMMA (right, B). The GAMMA-based superimposition results in an RMS
deviation of 4.81Å, and a substructure size of 19. The template molecule is colored red. The
compound that was used as a rigid template for the GAMMA superimposition, depicted in B, is
colored in red in A and B. The molecules that were flexibly aligned onto the template with GAMMA,
shown in B, are shown in CPK colors in A and B.
6.2.10 Overview of the Results
Figure 37 shows the differences between results obtained with linear ranking selection (LRS)
and with restricted tournament selection (RTS). The distribution of the RMS deviations for
linear ranking selection (LRS) and restricted tournament selection (RTS) for pairwise (A and
C) and multiple molecule alignments (B and D) is depicted. The upper part of the Figure
shows the RMS deviations between the predicted superimposition and the experimental
superimposition (RMSO) and the lower part shows the RMS deviations between the predicted
conformation resulting from a GAMMA alignment and the conformation as found in the
experimental superimposition (RMSC).
In most cases LRS performs better than RTS while the opposite is seen only in some
experiments.

6.2 Validation Study Using Crystallographic Data
140
A
0
1
2
3
4
5
6
7
8
1 24
Pairwise Alignments
RM
S (
Å)
LRS
RTS
B
0
1
2
3
4
5
6
7
1 18
Multiple Molecule Alignments
RM
S (
Å)
LRS
RTS
C
0
1
2
3
4
5
6
1 24
Pairwise Alignments
RM
S (
Å)
LRS
RTS
D
0
1
2
3
4
5
1 18
Multiple Molecule Alignments
RM
S (
Å)
LRS
RTS
Figure 37: Distribution of RMS deviations for linear ranking selection (LRS) and restricted
tournament selection (RTS) for pairwise (A and C) and multiple molecule alignments (B and D). The
upper part of the Figure shows the RMS deviations between the predicted superimposition and the
experimental superimposition (RMSO) and the lower part shows the RMS deviations between the
predicted conformation resulting from a GAMMA alignment and the conformation as found in the
experimental superimposition (RMSC). The presented RMSO and RMSC deviations for the alignments
are found in tables 8, 11, 14, 17, 20 and 23 for pairwise alignments and in tables 9, 12, 15, 18, 21 and
24 for multiple molecule alignments from the previous chapter.
Table 25 shows the mean RMS differences for the comparison between the predicted
superimposition and the experimental superimposition (RMSO) on the one hand and between
the predicted conformation and the X-ray conformation on the other hand (RMSC).
Concordant with the results shown in Figure 37 it can be seen that the results obtained with an
LRS-based superimposition are better than results obtained with RTS-based superimposition.

6.2 Validation Study Using Crystallographic Data
141
Table 25: The mean RMS deviations for RMSO and RMSC are given for the 24 pairwise alignments
and the 18 multiple molecule alignments shown in Figure 37 . The RMS deviations are broken down
to the two selection mechanisms of the hybrid GA that were applied.
RMSO (Å) RMSC (Å) Selection
mode Pairwise Multiple Pairwise Multiple
LRS 1.62 2.47 1.37 1.73
RTS 2.15 3.01 1.79 1.99
6.2.11 Discussion
It was shown that the application of the hybrid GA for the determination of the 3D-MCSS can
produce reasonable molecule superimpositions. The method was tested on six ligand datasets
that bind to various target molecules and for which crystallographic data on the binding
modes is available: inhibitors of the herpes simplex type 1 thymidine kinase, streptavidin
ligands, dihydrofolate reductase ligands, thrombin inhibitors, estrogen receptor α antagonists
and penicillopepsin ligands. The molecules show differences in size and flexibility.
The hybrid genetic algorithm can be used to perform pairwise alignments or multiple
molecule superimpositions. The presented results show that a mutual flexible alignment of
two molecules, B and C, onto a template compound A, does not yield the same
superimpositions as a joint alignment of B and C onto the reference A. The superposition of
multiple molecules has the disadvantage that useful results cannot be achieved with a run of
the program in small timeframes. In the presented studies, simply the runtime was increased
by increasing the number of generations and the population size of the GA. But a broad study
that evaluates the necessary runtime of a multiple molecule alignment so that it results in the
same quality of the results than a pairwise alignment is still missing and remains a task for
further exploration.
It must be stressed that the search space for a joint superimposition of n molecules onto one
template is much larger than for n-1 pairwise molecules onto a template. The reason is that the
multiple molecule alignment does additionally take into account an optimization of the n-1
test molecules among each other. The number of possible configurations increases

6.2 Validation Study Using Crystallographic Data
142
multiplicatively with every molecule added to a simultaneous superimposition. If just three
molecules are aligned at once and good results for superimposing the second molecule with
the first and for the third molecule with the first are retrieved, there is no guarantee that the
alignment of the second with the third compound yields a good match.
Another interesting phenomenon is that the multiple molecule alignment considers a
substructure to be present in all tested compounds at the same time. On the one hand, this can
be a drawback as it neglects that another substructure resides only in a subset of the tested
ligands. The consequence is that this substructure of a ligand subset is not taken into account.
On the other hand, exactly this drawback can be an advantage if the substructure present only
in a subset of ligands would put too much weight in the alignment process. An example is the
result of the multiple molecule alignment of dihydrofolate reductase ligands. In the reference
alignment the superimposition is influenced by the overlay of features in the pteridine ring
system neglecting a proper superimposition of the p-amino benzamide and the glutamic acid
moiety (Figure 27 A). In all pairwise superimpositions in contrast the program tried to overlay
the pteridyl moieties, the p-amino benzamide and the glutamic acid group at the same time
giving all atomic matches the same emphasis (Figure 24 A and C). The multiple molecule
alignment identifies a 3D-MCSS only in parts of the pteridine and the p-amino benzamide
moieties totally disregarding the glutamic acid part (Figure 27 B). This has the effect that the
superimposition is directed to the X-ray mode. As a consequence, it would be a task for
further studies to evaluate the algorithm when applied to finding the maximum set of
maximum common substructures (MSMCSS) instead of detecting one maximum common
substructure (MCSS).
An additional problem is that the best-ranked superimposition does not necessarily represent
the alignment with the highest coincidence with the experimental superimposition. And often
enough, the result that has the highest coincidence with the X-ray alignment is ranked worse
This can be seen for the superimposition of FOL with MTX in Table 14, where the alignment
,that represents the crystal alignment best, has only the rank 33. Therefore, studies are
necessary to identify a better expression of the fitness scoring function to increase the
similarity of the predicted superimposition with the experimental superimposition. This
should further help in generating pharmacologically meaningful alignments.
One of the limitations of the current approach using flexible alignments becomes clear if the
test ligands are much larger in size than the reference compound. Even if a MCSS is found for

6.3 Comparison of Different Superimposition Criteria Applied to Transition State Inhibitors
143
certain parts of the molecules the problem for the currently implemented algorithm arises how
to accommodate the other parts of the test molecules that have no matching partner so far. The
current algorithm would change torsion angles in such a way that unmatched atoms in the test
molecules converge to atoms in the template compound. This can lead to conformations
highly dissimilar to the bioactive conformation. A solution could be to first identify a relevant
MCSS common to the template and the test compounds and afterwards optimize only those
torsion angles that lead to a better fit in the matching atoms while keeping all other rotatable
bonds unchanged.
Concerning the physicochemical features that are used as matching criteria another weak
point arises which is not in the scope of the presented hybrid genetic algorithm but which
affects the alignment process. Uncharged compounds were used for the presented studies,
which do not reflect the actual circumstances as they are found under physiological
conditions. For example the compound methotrexate is protonated at physiological pH on a
nitrogen atom in the pteridyl moiety, thereby changing its physicochemical properties as it is
turned from a hydrogen-bond acceptor into a hydrogen-bond donor. This could be a reason
why the best-ranked superimposition of the alignment of methotrexate onto folic acid does
not reflect the “X-ray” mode but the “hetero” mode. But this is not a flaw of the presented
superimposition procedure rather a problem of the availability of adequate software to
reproduce the correct protonation state at physiological pH.
6.3 Comparison of Different Superimposition Criteria Applied to
Transition State Inhibitors
6.3.1 Introduction
The goal of this study was to explore how the quality of the superimposition is affected if
different levels of knowledge are given into the superimposition process. For this, three
different overlay procedures were performed. First, the atoms which are known to participate
in the hydrogen-bonding of an inhibitor with the catalytic pocket of the enzyme were forced
to be matched to the corresponding atoms of the intermediate. In the second approach,
constraints were provided that allowed only atoms with similar physicochemical properties to

6.3 Comparison of Different Superimposition Criteria Applied to Transition State Inhibitors
144
Figure 38: Energy diagram of an uncatalyzed reaction compared to an enzyme catalyzed reaction
(∆G‡u vs. ∆G‡
e) with the corresponding transition states Tu and Te and reaction intermediates Iu and Ie.
be matched to each other. In the third superimposition process, no further constraints were
provided to see how the program can find a solution if no information on binding is available.
The study was performed with transition state inhibitors of arginase II that catalyzes a
hydrolysis reaction of an aliphatic system. Three different inhibitors were studied in order to
gain deeper insights into the validity of the transition state hypothesis and the performance of
our approach.
Enzymes are proteins which originate from gene expression. They catalyze reactions and play
a vital role for a lot of functions in living organisms. The efficiency, measured by the term
kcat/Km, can reach acceleration rates of up to 1020 compared to the uncatalyzed reaction (176).
Km is the Michaelis-Menten constant which describes the substrate concentration required for
an enzyme to reach on-half of its maximum velocity and kcat is the number of reaction
processes per unit time. These rate enhancements are influenced by different factors
comprising geometric, electronic, and bonding effects. Some studies stress that there might be
a covalent bonding involved between the transition state and the enzyme to explain such
outstanding rate enhancements (177). To initiate the catalyzing process an enzyme must bind
the substrate(s).

6.3 Comparison of Different Superimposition Criteria Applied to Transition State Inhibitors
145
But Linus Pauling pointed out that the enzyme also has to be complementary in structure to
the activated complex of the reaction it catalyzes, thus the configuration that reflects the
intermediate between the reacting substances and the products (178,179). The tight binding of the
strained configuration, i.e. the transition state, is leading to a decrease in the energy barrier of
the reaction.
Figure 38 shows the energy diagram of an uncatalyzed and of an enzyme catalyzed reaction
proceeding through an intermediate. In this diagram, it is assumed that the binding of the
substrate leads to an energy decrease, but the energy decrease for the binding of the reaction
intermediate, Ie is much more pronounced in accordance with the Pauling hypothesis (178,179).
Pauling further mentioned that analogs to these transition states should act as potent inhibitors
of enzymatic reactions. The inhibitor of an enzyme should be quite similar to the transition
state of the reaction catalyzed by this enzyme in terms of geometric arrangement and of
physicochemical effects. However, in contrast to the transition state, an inhibitor cannot
undergo the bond breaking and making process observed in the enzymatic reaction of the
natural substrate. Thus, the transition state analog occupies the catalytic site of the enzyme
and blocks it from processing the natural substrate, leading to inhibition. Transition state
analogs are promising as new lead compounds, highly specific enzyme inhibitors, highly
potent agrochemicals or herbicides.
In this respect enzymes as catalysts differ strongly from other drug target classes like cell
surface receptors, ion channels, transporters, nuclear hormone receptors or DNA. Therefore,
dysfunctions of metabolic pathways in living organisms originate from unbalanced reaction
kinetics and accordingly enzyme catalysis. It is of high interest to interfere in the regulation of
pathways. Thus, the inhibition of enzymes is an important tool in drug and agrochemical
research (180).
To understand the structural aspects of the transition state and of reaction intermediates of
enzyme catalyzed reactions models are necessary that display information at atomic
resolution. To determine the transition state of a chemical reaction quantum chemical methods
of various degrees of sophistication can be applied, but at high computational costs.
We, however, were interested in developing a fast method that can be applied to large datasets
of molecules. That is where chemoinformatics has to come in, in order to model the 3D
6.3 Comparison of Different Superimposition Criteria Applied to Transition State Inhibitors
146
structure of substrates and to analyze physicochemical effects that bind small molecules in
proteins and that make bonds breaking and new ones forming.
In order to support this endeavor our group has developed BioPath, a database of biochemical
reactions, that stores molecules and reactions at atomic resolution (181). Specifically, molecules
are stored as connection tables, as lists of all atoms and all bonds.
This standard representation of chemical structures is important to allow the interfacing of
automatic 3D-structure generators for obtaining 3D molecular models. The bond breaking and
making events in the biochemical reactions are indicated by marking the reaction center and
by mapping the atoms of the reactants onto those of the products.
The marking of the reaction center plays a crucial role in the studies reported here as it allows
the generation of intermediates of enzymatic reactions. This, in conjunction with the 3D
modeling of all molecules puts us in a position to explore how inhibitors of enzymes match in
3D space with the starting materials, intermediates and products of enzyme catalyzed
reactions.
Based on this, the generation of intermediates from the information contained in the BioPath
database provides a 3D structural query for searching for inhibitors of enzyme catalyzed
reactions. This methodology is tested with an enzymatic reaction for which inhibitors are
known. This should provide a proof of concept for then using only information on the
structure of a reaction intermediate to search for inhibitors in 3D structure databases.
6.3.2 Computational Methods
6.3.2.1 Generation of Reaction Intermediate
To avoid determining the exact geometry and energy of a transition state by time-consuming
quantum mechanical calculations the problem is simplified by first investigating those
reactions that proceed through a reaction intermediate. Such reactions are predominantly
observed when the reaction occurs through an attack at a Csp2-atom involving first an addition
and then an elimination step. When the energy of such a reaction intermediate is appreciably
above the substrate, the structure of the transition state should be quite close to that of the
reaction intermediate according to the Hammond postulate (182). Such intermediates of a
reaction can automatically be generated if an appropriate data source is available. A suitable

6.3 Comparison of Different Superimposition Criteria Applied to Transition State Inhibitors
147
database for this task is the BioPath database (see chapter 4.9). The general outline of the
approach for generating reaction intermediates as transition state models and then to search
for transition state analogs is presented in Figure 39.
Of eminent importance for the application reported here is that all reactions in BioPath have
their reaction centers marked, i.e., the bonds broken and made in a reaction are indicated and
the atoms of those bonds are mapped from the starting materials onto those in the products.
This allows the automatic construction of reaction intermediates. Figure 40 illustrates this for
the reaction catalyzed by arginase II (EC 3.5.3.1). L-arginine, 39, is hydrolyzed and hence
converted to L-ornithine, 40, and urea, 41. From the information on which bonds are broken
in this reaction, the reaction intermediate, 42, can be generated.
Obtain Ligand X-ray Structureextraction of ligand from ligand-
receptor complex
3D Structure Generationcalculation of 3D coordinates for
atoms
Physicochemical Property Calculation
assignment of atomic properties
Small molecule alignmentsuperimposition of reaction
intermediate onto transition state
analogue inhibitor
Generation of Reaction Intermediate
definition of reaction center,
making and breaking of bonds
BioPath
Relibase
Figure 39: General outline of the process of comparing reaction intermediates with enzyme
inhibitors indicating the different steps.
To generate the reaction intermediate the BioPath database is loaded into the CACTVS
(Chemical Algorithms Construction, Threading, and Verification System) system (183). This

6.3 Comparison of Different Superimposition Criteria Applied to Transition State Inhibitors
148
program offers an extensive scripting interface which allows the manipulation of data. For
this application a program was implemented which allows the generation of intermediates for
several reaction types.
N
NH2
OH
O
NH2
NH
H
H
NH2
NH2
O
NH2
H
O
OH
NH2
OHH+ +
39 40 41
42
N
N
O
O
N
N
H
H
OH
HH
H
H
H
H
H
Figure 40: Hydrolysis of L-arginine, 39, to L-ornithine, 40, and urea, 41, catalyzed by arginase II as
stored in the BioPath database. The bonds broken and made are marked by lines crossing the bonds.
The corresponding reaction intermediate, 42, as generated from this reaction center information.
This is done by a simple algorithm which uses the information on the bonds broken and made
in the reaction center for a specific reaction type. It allows the generation of intermediates for
all reactions matching a specific reaction type. First, the reaction center for a specific reaction
is defined and then the BioPath database is scanned for all reactions matching this defined
reaction center. The retrieved reactions are stored into a hit list. The reactions from the hit list
are then split into a substrate-handle and a product-handle. The handle which is closer to the
intermediate (reaction center and transformation to build the intermediate) is then modified by
making and breaking the bonds that are part of the reaction center according to the
intermediate. The generated intermediates are saved in a file.
6.3.2.2 3D Structure Generation
CORINA (22,127) was used to convert the constitutions of the molecules as laid down in a
connection table into 3D structures. This generated model is a low energy conformation of a
6.3 Comparison of Different Superimposition Criteria Applied to Transition State Inhibitors
149
molecule and does not necessarily correspond to the biologically relevant conformation. This
problem will be addressed later in the superimposition process by the program GAMMA.
6.3.2.3 Extraction of Ligand X-ray Binding Conformations
ABH was known from literature to be a potent inhibitor for arginase II. The PDB entry 1D3V
with the ligand ABH was selected as the reference protein chain to search for similar ligand-
protein complexes. The Relibase system was used to search for ligand-protein complexes with
a sequence identity of 100%. The obtained complexes were superimposed using the binding
site residues only. The positional differences between the backbone Cα atoms were minimized.
From the hitlist 1HQ5 with the ligand S2C/BEC and 1R1O with the ligand SDC were chosen.
The resolutions for the crystal structures were 1.7 for 1D3V, 2.3 for 1HQ5 and 2.8 for 1R1O.
Afterwards the ligands were extracted from the complexes keeping their obtained relative
orientation in space. The received crystallographically determined conformations were used
as reference ligands in the following alignment studies with GAMMA.
6.3.2.4 Calculation of Atomic Physicochemical Properties
In these studies, five atomic properties were used as superimposition criteria. These properties
comprise lone pair electronegativity χLP, σ-electronegativity χσ, effective atom polarizability
α, total charge qtot, octanol/water partition coefficient log P. Total atomic partial charges were
added as the sum of the σ- and π-partial charges calculated by the PEOE method developed by
Gasteiger and Marsili (129) and a modified Hückel MO calculation (131). The calculation of σ-
electronegativity χσ is based on work of Hutchings et al. (132). The effective atom polarizability
α is calculated based on work published by Gasteiger and coworkers (132). The log P values
were calculated based on atomic increments by the XLogP method of Wang et al. (128). The
calculation methods are provided by the program package PETRA (Parameter Estimation for
the Treatment of Reactivity Applications) (184) and a module written in-house based on our
C++ framework MOSES (131,133).

6.3 Comparison of Different Superimposition Criteria Applied to Transition State Inhibitors
150
6.3.2.5 Ligand Alignments Using GAMMA
The programs were afterwards flexibly superimposed using GAMMA. In this approach, two
functions are additionally used to automatically superimpose molecules. First, atoms can
optionally be characterized by physicochemical properties. The atoms to be overlaid must
then conform to a given interval of the physicochemical property. For example, if the
matching criterion is chosen to be total atomic charges, qtot, and the interval selected to be
qtot = ± 0.05 e, then for an atom of the first molecule with qtot = -0.2 e, only atoms in the
interval of qtot = [-0.25, -0.15] are allowed to build match tuples with this first atom.
Combinations of several physicochemical properties have to be valid at the same time. The
physicochemical properties are calculated by the program package PETRA (184).
Secondly, GAMMA allows the selection of sets of atom tuples that can be enforced to match.
Therefore, indices have to be given for all those atoms of the molecules that must build match
tuples with each other. All the remainder of the atoms have to fit the resulting spatial or, if
given, physicochemical demands.
Table 26: Control parameter for the genetic algorithm.
GA parameter value
Number of experiments nexp 10
Number of generations ngen 100
Number of individuals N 100
Probability for crossover pcross 0.6
Probability for mutation pmut 0.6
Probability for creep pcreep 0.5
Probability for crunch pcrunch 0.3
Probability for torsional crossover ptorcross 0.6
Probability for torsional mutation ptormut 0.6
6.3 Comparison of Different Superimposition Criteria Applied to Transition State Inhibitors
151
The quality of a superposition is scored by the root mean square (RMS) error and the size of
the achieved substructure. The control parameter in our standard protocol applying the hybrid
GA is given in Table 26.
6.3.3 Results and Discussion
Arginase (EC-code 3.5.3.1) is a manganese metalloenzyme containing a metal-activated
hydroxide ion, a critical nucleophile in metalloenzymes that catalyze hydrolysis or hydration
reactions. A hydrogen-bond formed by the metal-bound hydroxide holds the enzyme in the
proper orientation for catalysis however nonmetal substrate-binding sites are also implicated
in the enzyme mechanism. The enzyme arginase is part of the hepatic urea cycle and
metabolism of amino groups. It catalyzes the hydrolytic cleavage of L-arginine, 39, into
L-ornithine, 40, and urea, 41, through a metal-activated hydroxide mechanism (185). The
reaction is shown in Figure 40. The hydrolysis of L-arginine occurs by a nucleophilic attack
of the metal-bridging hydroxide ion at the guanidinium carbon atom. In mammals, two
isoenzymes are identified: Both isoforms differ in their tissue distribution. Arginase I is found
predominantly in hepatocytes and arginase II occurs extrahepatic. The arginase isoenzymes
differ from each other in terms of their catalytic, molecular, and immunological properties.
Human penile arginase is a potential target for the treatment of sexual dysfunction in male (186). The reaction and the invoked intermediate, 42, are given in Figure 40.
The study with arginase II investigates a hydrolysis reaction of an aliphatic system having
substantial conformational flexibility. Furthermore, the hydrolysis of a guanidine group can
serve as a model reaction for a large group of hydrolysis reactions involving ester and amide
groups. Three different inhibitors were studied in order to gain deeper insights into the
validity of the transition state hypothesis and the performance of our approach. The 3D
structures of the inhibitors were taken from the 3D experimental observations as stored in the
Protein Data Bank (PDB) (118). Structures of the intermediates, on the other hand, had to be
generated by CORINA.
For all shown superimpositions the intermediate structure generated from BioPath was
handled as flexible while the superimposition partner served as a rigid template.
For the first case, atoms that are known to interact with the binding pocket of the enzyme
through hydrogen-bonds were forced to match together. The knowledge on the hydrogen-

6.3 Comparison of Different Superimposition Criteria Applied to Transition State Inhibitors
152
bonding model is derived from the study of the crystal structures of the three PDB entries
(Figure 41).
Figure 41: Hydrogen-bond interactions for the three transitions state analogue inhibitors of arginase
II. 1D3V with the ligand ABH was used as a reference and the Cα atoms of the amino acids of 1HQ5
and 1R1O that belong to the binding site were rigidly superimposed onto the reference structure. The
boronic acid-based inhibitors ABH and BEC undergo nucleophilic attack by manganese bridging
hydroxide ion and form tetrahedral boronate anions. The ionized sulfonamide NH- group of SDC in
1R1O coordinates to the active site manganese metal ions. ABH forms six hydrogen-bonds in contrast
to BEC and SDC forming five hydrogen-bonds. The additional H-bond of ABH is formed with a water
molecule in the active site of arginase II Manganese ions appear as pink spheres. Water molecules
appear as red balls. The carbon atoms of the ligands are colored green. Hydrogen-bonding interactions
are marked with green lines when connected to one of the ligand atoms or in red when connecting a
water molecule with an active site residue

6.3 Comparison of Different Superimposition Criteria Applied to Transition State Inhibitors
153
In the second case, physicochemical properties, which were assumed to be relevant for the
receptor-ligand-interaction, were introduced. In the last and simplest case, only 3D structural
information of the inhibitor was used.
In this experiment, the 3D structures of following three inhibitors were used: (S)-2-amino-6-
boronohexanoic acid (ABH), 43, (PDB-Id: 1D3V) (187,188), S-(2-boronoethyl)-L-cysteine
(BEC, sometimes also S2C), 45, (PDB-Id: 1HQ5) (187,188), and S-(2-sulfonamidoethyl)-L-
cysteine (SDC), 47, (PDB-Id: 1R1O) (185) from Rattus norvegicus, all shown in Figure 42.
43
NH3
+
O O
B
OH
OH
44
N+
O O
B
O
OO
H
H
H
H
H
H
45
NH3
+
S
O O
B
OH
OH
46
N+
S
O O
B
O
OO
H
H
H
H
H
H
47
N+
S
O O
S
O
O
NH
H
HH
H
Figure 42: Inhibitors of arginase II: ABH, 43, and in its active form as hydrated ABH, 44. BEC, 45,
and in its active form as hydrated BEC, 46. SDC, 47. Atoms that are forced to take part in a match
marked with boxes.
The boronic acid-based analogues of L-arginine, ABH and BEC, undergo a nucleophilic
attack by the metal-bridging hydroxide ion in the arginase active site. The resulting tetrahedral
boronate ion mimics the tetrahedral intermediate, and its flanking transition states, in the
hydrolysis of L-arginine. ABH and BEC are slow binding competitive inhibitors belonging to
the class of boronic acid inhibitors while SDC contains a sulfonamide group. Bound into the
active site of the enzyme, ABH and BEC form tetrahedral boronate anions, 44 and 46,
respectively. These mimic the tetrahedral intermediate of the arginase hydrolysis reaction. The

6.3 Comparison of Different Superimposition Criteria Applied to Transition State Inhibitors
154
same function is fulfilled by the sulfonamide group of SDC. For all three inhibitors, the
experimentally derived 3D structure as bound into arginase is available from the PDB protein
databank (95).
In the first superimposition, the atoms of the inhibitor and of the intermediate that should
match were assigned as constraints for the superimposition process. This information was
derived from references (185,186,188). The atoms assigned to match between the intermediate and
each inhibitor are indicated in structures 42, 44, 46, and 47 by dashed boxes.
For the second kind of superimposition, similarity ranges regarding physicochemical
properties which are describing the electronic effects for the binding into the binding pocket
of the enzyme were taken as matching criteria. Therefore, atomic properties were calculated
for the three inhibitors and the reaction intermediate. It concerns lone pair electronegativity,
σ-electronegativity, effective atom polarizability, total charge, octanol/water partition
coefficient.
Table 27: Ranges, ∆p, of physicochemical properties assigned to the superimposition process.
physicochemical property inhibitor
ABH BEC SDC
lone pair electronegativity
(eV) 2.10 2.10 not used
σ-electronegativity (eV) 2.10 2.10 not used
effective atom
polarizability (Å3) 0.60 1.00 not used
total charge (e.U.) 0.25 0.25 0.35
octanol/water partition
coefficient 0.50 0.50 0.60

6.3 Comparison of Different Superimposition Criteria Applied to Transition State Inhibitors
155
This allows only those atoms to match which are similar regarding these properties and
should bind into the same region of the binding pocket. The physicochemical values used in
the superimposition and the defined ranges are given in Table 27. The ranges, ∆p, in the
physicochemical properties were used such that only those atoms were allowed to be
superimposed if their properties, p, had values that deviated by less than ∆p.
Table 28: Superimposition of the arginase reaction intermediate, 42, with ABH, 43, with given
match-tuples (A), based on physicochemical properties (B), and without any constraints (C).
Superimposition of the arginase reaction intermediate, 42, with BEC, 45, with given match-tuples (D),
based on physicochemical properties (E), and without any constraints (F). Superimposition of the
arginase reaction intermediate, 42, with SDC, 47, with given match tuples (G), based on
physicochemical properties (H), and without any constraints (I).
match tuples given
ranges of physicochemical
properties given no constraints given
ABH A
B
C
BEC D
E
F
SDC G
H
I
The ranges were set by initial inspection of the properties of the atoms given as match tuples
in the first superimposition experiment.

6.3 Comparison of Different Superimposition Criteria Applied to Transition State Inhibitors
156
For the third superimposition no constraints were specified for the superimposition process
providing a match totally adjusted to the geometry of the molecules.
First, the superimposition with the inhibitor ABH, 43, was analyzed. All three experiments
showed a good overlap between the inhibitor and the reaction intermediate. A look at the
RMS values shows how close the superimpositions lie together: With given match tuples the
RMS value is 0.34 Å (Table 28A), with given constraints on physicochemical properties
0.78 Å (Table 28B), and without any constraints on the superimposition 1.11 Å (Table 28C).
As can be seen, the superimposition without constraints performs worst. The superimposition
with given match match tuples reaches the largest maximum substructure size with 13 atoms.
For the inhibitor BEC, 45, the RMS value of the superimposition onto the intermediate is
0.97 Å when matching tuples are given (Table 28D), 1.59 Å when physicochemical properties
are given (Table 28E), and 0.64 Å without any given constraints (Table 28F). For the
superimposition without any constraints the lowest RMS value was obtained, but here a
maximum substructure size of only 8 atoms was reached. In this case, the sulfur atom and
both flanking C-atoms of BEC were not recognized as match partners to the corresponding
atoms of the intermediate as they exceeded the given property ranges. Here, the purely
geometric superimposition performs slightly poorer than the others.
Table 29: RMS values obtained in the superimposition experiments with arginase II. The RMS
values are given in Å. The substructure-size for all superimpositions is given in braces.
inhibitor Information given into the superimposition process
match tuples given ranges of physicochemical
properties given no constraints given
ABH 0.34 (13) 0.78 (11) 1.11 (11)
BEC 0.97 (13) 1.59 (10) 0.64 (8)
SDC 1.04 (12) 0.87 (12) 1.15 (12)

6.3 Comparison of Different Superimposition Criteria Applied to Transition State Inhibitors
157
For the last inhibitor SDC, 47, in the superimposition with matching atoms given the RMS
value is 1.04 Å (Table 28G), with given physicochemical properties the RMS is 0.87 Å (Table
28H), and without any constraints the RMS is 1.15 Å (Table 28I). Here, again the geometric
superimposition is better than with given match tuples, but also slightly poorer than with
physicochemical properties.
An overview of the RMS values for all superimpositions is given in Table 29. For all three
inhibitors the differences between the three methods can hardly be recognized by visual
inspection.
6.3.4 Conclusions
It was shown that 3D molecular models of intermediates of enzyme catalyzed reactions can
automatically be generated from a database of biochemical reactions and can serve as
templates for matching inhibitors of the enzymes that catalyze the corresponding reaction. It
was shown by superimposing these generated intermediates onto known transition state
analog inhibitors that the similarity between both is sufficient to use the intermediate as a
template to search for new transition state analog inhibitors. This was performed by the
superimposition method which uses a GA enriched with a numerical optimization method. If
there is no experimental 3D information on the inhibitors available it is also possible to use
computed 3D molecular information which still delivers good results. As the superimposition
process also allows conformational changes, detailed information on the steric requirements
of enzyme-catalyzed reactions can be gained. The consideration of physicochemical effects in
the superimpositions allows one to draw conclusions on the electronic effects operating in the
enzyme pocket. This approach provides a three-dimensional structure query that can be used
for searching in databases of chemical structures for new potential enzyme inhibitors without
using elaborate and time-consuming ab initio methods. This opens the prospects for finding
new drugs and agrochemicals.

6.4 Ligand-based Virtual Screening of a Drug Database
158
6.4 Ligand-based Virtual Screening of a Drug Database
6.4.1 Overview of Virtual Screening
In the modern drug discovery process, virtual screening (VS), also known as in silico
screening, plays a central role and has reached the status of a powerful alternative and
complement to high throughput screening (HTS) (189,190,191,192). While HTS uses automated
assays to search through large numbers of chemical substances, VS is a computational
process. It enables a user to reduce a compound database to a limited number of compounds
potentially binding to a target of interest. Hence, it is the computer-based counterpart to high-
throughput screening of combinatorial libraries. In VS a molecule of interest is used as a
probe to search within a large database for other compounds which are similar in 3D structure
and exert desired properties. The query represents a molecule with a certain biological activity
or a hypothesis about structural features, like e.g. a pharmacophore model for a certain
biological activity. Therewith the vast chemical space can be pressed down to biologically
more interesting entities which avoid the problem of a broad search. In this context it is
necessary to apply filters to assure that the library meets standards of biological relevance or
drug-likeness. Because of the increasing computer power it is possible to apply fast filtering
criteria and to screen large compound collections in a reasonable time. Virtual screening is a
powerful tool to enrich libraries with compounds that are more suitable for further studies in
the viewpoint of the user. Because of reducing the search space VS can focus libraries for
later testing in HTS by eliminating compounds with unwanted properties. This is an important
aspect as HTS is expensive, with costs between $10000 and $1 million, and furthermore VS is
significantly cheaper and faster to use compared with HTS (193). Also, VS provides the
possibility to test virtual substances that have not yet been synthesized. Thus, VS is able to
speed up the hit identification process and can reduce the costs of the lead discovery process
when applied in an early stage of the drug discovery process. So, the development of VS was
a logical consequence of the developments in high-throughput screening and combinatorial
chemistry.
Different search methods exist for VS that employ different levels of 2D topological or 3D
structural information:
• substructure search in 2D or 3D to identify common substructural elements between the
database compounds and the query molecule,

6.4 Ligand-based Virtual Screening of a Drug Database
159
• similarity search in 2D or 3D to detect molecules in the database that are similar to the
query molecule,
• docking in 3D to find molecules that possibly fit into a receptor binding site,
• quantitative structure activity relationship (QSAR) analysis in 2D or 3D to locate
molecules with an adequately high biological activity.
Concerning the 3D screening techniques, the search methods can be classified into two main
groups (Table 30). The first applies molecular docking as the search technique, suitable in
cases when the 3D structure of the macromolecular target is at hand, while the other method is
based on comparing the similarity between the query and the database molecules. The ligand-
based approach can be subdivided into methods employing a pharmacophore-based
comparison and methods comparing the whole structure of the probe and the database
compounds.
Table 30: Presented is a possible classification scheme for the different virtual screening techniques
that are based on three-dimensional structures of the database molecules.
Virtual Screening
Similarity-based VS, small molecule screening
No information on the protein is necessary
One or more compounds that are known to bind to the protein
are used as a query
Compounds are extracted from the database according to a
similarity criterion
VS by docking,
Protein structure based or
receptor-based screening
Require knowledge of the 3D
structural information of the
target proteins binding site.
Similarity based on a
Pharmacophore
Uses just partial structural
information of the molecule
Similarity based on the
structure of the whole
ligand molecule
Another classification scheme is based on the treatment of the flexibility of the molecules.
Here, three approaches exit:

6.4 Ligand-based Virtual Screening of a Drug Database
160
1. applications that represent and search each molecule as a single conformer,
2. approaches that store multiple pregenerated conformers of each molecule in a database,
3. search methods that perform “on-the-fly” conformer generation.
The storage of maximally dissimilar conformations for one molecule in a database is
reasonable, as this should increase the probability of producing a hit over a single conformer (194). Those molecules whose conformation satisfies the predefined specifications are
classified as ‘hits’.
As mentioned above filtering techniques are an important aspect to reduce the database size to
a reasonable volume and to restrict the compound library content to molecules that satisfy
drug-like criteria or that show an activity against a particular target. The Lipinski Rule of Five
(ROF) is the best-known property filtering technique to estimate absorption or permeation of
compounds (195). The ROF proves that the probability for poor absorption or permeation is
higher when the following claims are fulfilled:
• molecular weight (MW) > 500,
• calculated n-octanol/water partition coefficient (CLOGP) > 5,
• hydrogen-bond donors (HDO) > 5,
• hydrogen-bond acceptors (HAC) > 10.
The cutoffs of each of the four parameters are all close to 5 or a multiple of 5 giving rise to
the name. Still some of the top selling drugs fall out of the ROF ranges. Reasons for this can
be that the compounds are substrates for transporters or they are pro-drugs. Also, some natural
products exerting some biological effect often fall out of this range. It should be clear that
these values reflect some biological meaning as they appeal factors influencing the diffusion
of substances through lipid double layer membranes. Smaller molecules with a lower
molecular weight permeate faster and also lipophilic substances diffuse easier through the cell
membrane, because the inside of the phospholipid double layer is lipophilic. But phospholipid
double layers also have an outer hydrophilic surface. This means that a drug also needs a
certain hydrophilicity reflected by its ability to establish hydrogen-bonds. Additionally to the
claims mentioned in the ROF, other criteria can be applied to filter virtual libraries. Such
extensions can e.g. be the number of rotatable bonds to minimize the risk of having highly
flexible compounds
6.4 Ligand-based Virtual Screening of a Drug Database
161
6.4.2 Calculation of Enrichment Factors
Enrichment rates are used to validate the quality of VS (196) and to indicate how known actives
are enriched in a VS hit list compared to a random selection. The enrichment factor is defined
as:
=
D
N
S
SFSef act)(
)( (25)
Where D is the total number of compounds in the database of which a contingent Nact exerts a
certain biological activity. A subset of S compounds is selected while the VS process of which
F(S) are substrates with essential activity. In fact, the enrichment factor reflects the proportion
of the concentration cSubset(A) of active compounds in the subset to the concentration
cDatabase(A) of actives in the whole database.
)(/)()( AcAcSef DatabaseSubset= . (26)
Inspection is facilitated by conversion of the relation F(S)/S versus A/D into enrichment plots.
The resulting curve would have a slope of 1 if the deployed screening method would be able
to discriminate perfectly between actives and inactives and would place all actives in the front
of a ranking list. The slope would be immediately 0 after all Nact molecules have been
evaluated and only the inactives remain in the ranked list. In fact, curves in real VS
evaluations have a hyperbolic course. A VS method should produce a curve that lies over a
diagonal line representing a random selection of active candidates.
6.4.3 Computational Methodology
6.4.3.1 Overview
In the following it was shown that GAMMA could preferentially select compounds from a
virtual library that have the same activity as the query molecule. For this purpose, celecoxib
and diazepam were chosen as probes. Celecoxib is a selective cyclooxygenase-2 (COX-2)
inhibitor and diazepam is a benzodiazepine, which binds to a specific subunit of the GABAA
receptor as probes. Thus, two virtual screening experiments are conducted. The aim is to sort
the database entries in such a way that those molecules, that are similar to the queries, will be
enriched at the top portion of a ranked list of the database compounds. The VS applying

6.4 Ligand-based Virtual Screening of a Drug Database
162
GAMMA should select a set of ligands enriched with actives, relative to the entire database.
Figure 43 reflects the approach that was chosen to conduct the experiments.
Database prefilteringsample size reduction
Database preparationsmall fragment removal,
hydrogen atom addition, charge neutralization,
3D structure generation,
logP and qtot calculation
Small molecule alignmentsuperimposition of database
compounds onto query molecule
Analysisenrichment of active compounds
Query molecule
MDDR
Figure 43: Flowchart that illustrates the proceeding in the VS experiments that were conducted in
this study.
In this study, the MDDR-05.1 (140) was employed as the compound library for VS with
GAMMA. The MDDR (MDL® Drug Data Report) is a commercially available database that
contains structures of drugs with their drug properties (see chapter 4.10). The version of the
MDDR database that was used contains 159662 entries.
6.4.3.2 Prefiltering and Preparation of the Database
The MDDR was first subject to different filters whereby the following properties were
examined. The molecular weight (MW), the calculated n-octanol/water partition coefficient
(CLOGP), the number of hydrogen-bond donors (HDO) and acceptors (HAC), and the

6.4 Ligand-based Virtual Screening of a Drug Database
163
number of rotatable bonds (RTB) to extract a subset of compounds that is more convenient for
the two VS experiments. Those filters have been applied using the ISIS/BASE (141) software.
Nearly the same parameters for filtering were chosen as Lipinski and coworkers did, but it
was decided to additionally include the number of rotatable bonds to gain control of the
flexibility of the database compounds. The number of rotatable bonds reflects the flexibility
of the molecules. Thus, it is an indicator for the complexity of the alignment process.
Concerning the ranges of the calculated n-octanol/water partition coefficient, the number of
hydrogen-bond donors and the number of hydrogen-bond acceptors also lie nearby the values
suggested by Lipinski (Table 31). Solely for the molecular weight the range was slightly
increased, as it was shown, that drugs, particularly the MDDR entries, show a tendency
towards increased molecular weight (197). The effect of the individual properties on the
compound removal of the database entries is shown in Figure 44. The selected ranges insure
that the two query molecules, celecoxib and diazepam, fall within these ranges.
Table 31: Threshold values for the applied properties to filter the MDDR database.
Filter Threshold
Molecular weight (MW) 270 ≤ MW ≤ 540
ClogP (CLOGP) ≤ 5
Number of HB donors (HDO) ≤ 5
Number of HB acceptors (HAC) ≤ 10
Number of rotatable bonds (RTB) ≤ 7
Afterwards, CORINA (198,199) was used to reduce the structures to a single connected
compound (counter-ions and solvent molecules were removed), to add hydrogen atoms and to
neutralize charges. The resulting database has been converted into a database containing 3D
coordinates for the atoms using CORINA. As the hybrid method overlays structures
independent of the initially chosen conformation only one conformation per structure is
necessary. Thus, the program can work even when only one conformation of a

6.4 Ligand-based Virtual Screening of a Drug Database
164
0
0.05
0.1
0.15
0.2
0.25
0.3
0.35
TD
F ≤
7
270
≤ M
W≤ 5
40
Clo
gP
≤ 5
HA
C ≤
10
HD
O ≤
5
Filter
Rem
ove
d c
om
po
un
ds
(%)
Figure 44: The fraction of the database compounds that was removed with each of the filters
applied separately.
compound is stored in the database. Stereoisomers were kept in the database and not handled
as doublets. Another preparation step of the database was to add physicochemical parameters.
The log P values were calculated based on atomic increments by the XLogP method of Wang
et al. (128). Total atomic partial charges were added as the sum of the σ- and π-partial charges
calculated by the PEOE method developed by Gasteiger and Marsili (129) and a modified
Hückel MO calculation (131). Both methods were reimplemented in a calculation module
written in-house based on our C++ framework MOSES (131,133). This whole process of
prefiltering reduced the size of the original MDDR database to a compound library of 62922
molecules. This whole process of prefiltering and database preparation reduced the size of the
original MDDR database to a compound library of 62871 molecules. This is the final number
of compounds that will be contained in the test database. The distribution of the properties of
the resulting database that was used for our VS experiments is shown in the Figure 45.
Also, the two query molecules celecoxib and diazepam have to be prepared to set them up as
3D probes. CORINA was applied to add hydrogen atoms, to neutralize charges and to
generate 3D coordinates. Afterwards, physicochemical properties were added just like for the
database compounds. This means that log P values based on atomic increments and total
atomic partial charges were added.

6.4 Ligand-based Virtual Screening of a Drug Database
165
A
0
5
10
15
20
25
30
25
0 -
30
0
30
0 -
35
0
35
0 -
40
0
40
0 -
45
0
45
0 -
50
0
50
0 -
55
0
Molecular Weight (g/mol)
Fre
qu
ency
(%
)
B
0
15
30
45
60
-14
- -
12
-12
- -
10
-10 -
-8
-8 -
-6
-6 -
-4
-4 -
-2
-2 -
0
0 -
2
2 -
4
4 -
6
6 -
8
CLogP
Fre
qu
ency
(%
)
C
0
5
10
15
20
25
30
35
40
0 1 2 3 4 5
Number of H-bond Donors
Fre
qu
ency
(%
)
D
0
5
10
15
20
25
0 1 2 3 4 5 6 7 8 9 10
Number of H-bond Acceptors
Fre
qu
ency
(%
)
E
0
5
10
15
20
0 1 2 3 4 5 6 7
Number of Rotatable bonds
Fre
qu
ency
(%
)
Figure 45: Distribution of the filtering properties
for molecular weight (A), for the n-octanol/water
partition coefficient (B), for the number of H-bond
donors (C), for the number of H-bond acceptors (D)
and for the number of rotatable bonds (E) in the
resulting database with 62922 compounds.
6.4.3.3 Ligand Alignments Using GAMMA
Next, the 3D probes for the database search were used with the parallel version of GAMMA.
For the VS experiments three different types of physicochemical properties were considered
as matching criteria: a steric, an electrostatic and a hydrophobic term. The atomic increment
of the octanol/water partition coefficient log P and the total charge qtot were calculated as
chemical features used for the alignment process. An automatic calculation of the tolerance
intervals for both physicochemical properties was chosen. A tolerance of ±0.4·Å of the van
der Waals radius was specified.

6.4 Ligand-based Virtual Screening of a Drug Database
166
The candidate molecules of the database were superimposed pairwise onto the reference
molecule. The alignment with the highest fitness score among all evaluated GAMMA
experiments is retained. After finishing the VS the superimpositions were ranked using the
fitness of the alignment as the scoring function. The overlays are ranked by decreasing fitness
score i.e. the database order is reorganized concerning the rank of the molecular
superimposition. The accumulation of actives within the best scoring alignments is inspected.
The active molecules are those database molecules that posses the same activity index as the
query molecule,.
The control parameters of our standard protocol that applies the hybrid GA for VS are given
in Table 32. Here, we have 100 individuals that represent 100 randomly generated start
conformations. How often an operator affects the individuals per generation, C, is given by
the following formulas:
NPC op *= for unary operators and (27)
2* NPC op= for binary operator. (28)
Pop is the operator probability as given by the user and N is the size of the population.
Therefore, the crossover operator will act 35 times the mutation operator will act 60 times per
GA generation.
We are generating 60 new conformations per generation with the mutation operator and 70
conformations per generation with the crossover operator but we have redundancy in such a
way that one and the same individual could be affected by both operators. The probability P
that an individual is not affected by torsional crossover and torsional mutation is:
)1(*)1( torcrosstormut ppP −−= (29)
The parameter ptormut is the probability for torsional mutation and ptorcross is the probability for
torsional crossover. Transferred to this experiment this means that P = (1-0.6)*(1-0.7) = 0.12,
or 12%. In other words, 88% of the 100 individuals are statistically affected by torsional
crossover or mutation. Thus, it can be assumed that 88 conformations are generated per
generation per database molecule or 17600 conformations per GA run or 422400
conformations in all 24 experiments. If a conformation generation on-the-fly is used, this
results in a much larger search space than if we would use pregenerated low energy

6.4 Ligand-based Virtual Screening of a Drug Database
167
conformations per database compound. This fact has to be taken into account when later
looking at the computational efficiency.
Table 32: Control parameter for the genetic algorithm.
GA parameter value
Number of experiments nexp 24
Number of generations ngen 200
Number of individuals N 100
Probability for crossover pcross 0.5
Probability for mutation pmut 0.3
Probability for creep pcreep 1.0
Probability for crunch pcrunch 0.1
Probability for torsional crossover ptorcross 0.7
Probability for torsional mutation ptormut 0.6
Probability for migration pmigration 0.1
Limit of convergence lconv 0.95
As we have 3.85 rotatable bonds in average per database entry and use a step size of 1.4° for
the change of the torsion angles. The number of conformations is given by the formula:
n
sN
=
360 (30)
Here, N is the number of conformations, s is the rotation step size and n is the number of
rotatable bonds. Consequently, we are exploring a conformation space of
(360/1.4)3.85 = 1901829985.95 conformations per database molecule!

6.4 Ligand-based Virtual Screening of a Drug Database
168
6.4.4 Results and Discussion
6.4.4.1 Computational Efficiency
The standard protocol that was applied for VS takes 34.98s to 77.97s per mutual alignment or
about 604308 cps/week on a Linux Cluster. On the Linux cluster we used 8 computing knots
with two Xeon “Nocona” 3.2 GHz processors each. The results are summarized in Table 33.
Table 33: Processing times for querying the database of 62871 compounds for both screening
experiments. Times refer to a Linux cluster using 16 processors.
COX-2 inhibitor
celecoxib
GABAA
diazepam
Averaged values for
both experiments
Total runtime in
seconds 4902212 2199106 3550659
Total runtime 56d 17h 43m 32s 25d 10h 51m 46s 41d 2h 17m 39s
Runtime/Alignment
in seconds 77.97 34.98 56.40
Processed cps/week 7756.58 17290.84 12523.71
6.4.4.2 Cyclooxygenase-2 Inhibitor Celecoxib
In the first experiment celecoxib was used, 48, (Celebrex®) (Figure 46) as the query
molecule. Celecoxib is a selective cyclooxygenase-2 (COX-2) inhibitor and it is classified as
a nonsteroidal anti-inflammatory drug (NSAID). Acetylsalicylic acid (Aspirin®) is a typical
example of such a nonspecific COX inhibitor. It covalently inhibits COX by acetylating the
side chain of serine 530. This has the effect that the enzymes active side is blocked and the
natural substrate cannot be bound. But contrary to the classical NSAIDs, which unselectively
inhibits all isoforms, COX-1, COX-2 and COX-3, celecoxib is a noncompetitive selective
COX-2 inhibitor. The COX-2 inhibitor celecoxib is used for the treatment of rheumatoid
arthritis, osteoarthritis, and familial adenomatous polyposis (FAP). It exerts its effects by
inhibiting the synthesis of prostaglandin H2 (PGH2).

6.4 Ligand-based Virtual Screening of a Drug Database
169
N
N
F3C
S
CH3
H2N
OO
Figure 46: Chemical structure of celecoxib, 48, which was used as a query molecule for VS.
The cyclooxygenases (E.C. 1.14.99.1) catalyze the formation of prostaglandin G2 (PGG2)
from arachidonic acid (cyclooxygenase activity), and also the reduction of PGG2 to PGH2
(peroxidase activity). Because of catalyzing this two step reaction COX is a bifunctional
enzyme. PGH2 is again a precursor that is passed into either the cyclooxygenase or the
lipoxygenase pathway. In the cyclooxygenase pathway thromboxanes, prostacyclins and the
prostaglandins D, E and F are synthesized. In the lipoxygenase pathway leukotrienes are
produced. The thromboxane TXA2 conveys the aggregation of thrombocytes and causes
vasoconstriction, while the prostacyclins cause vasodilatation and inhibit the aggregation of
thrombocytes. They are important mediators for inflammatory effects, fever and allergic
reactions (200). The isoforms COX-1 is constitutively expressed in many different cells to
catalyze the creation of prostaglandins used for basic housekeeping messages throughout the
body. The second isoforms COX-2 is mainly expressed after induction by proinflammatory
cytokines, bacterial lipopolysaccharides or growth factors like the tumor necrosis factor
(TNF). It is found just in special cells and is used for signaling pain and inflammation. The
selectivity of COX-2 inhibitors is based on an additional lipophilic pocket in the active site of
COX-2 which is not accessible in COX-1 (201). It should be mentioned that in the VIGOR
(Vioxx Gastrointestinal Outcome Research) study, that was conducted to compare the efficacy
and adverse effect profiles of another COX-2 inhibitor, rofecoxib (Vioxx®), and an
unselective NSAID, naproxen, had indicated a significant 4-fold increased risk of acute

6.4 Ligand-based Virtual Screening of a Drug Database
170
myocardial infarction (heart attack) in rofecoxib patients when compared with naproxen
patients over the 12 month span of the study (202). In 2004 rofecoxib was withdrawn from the
market because of concerns about increased risk of heart attack and stroke. Still, it is unclear
whether those adverse effects are common to all COX-2 inhibitors.
The quality of our search experiment was assessed by enrichment factors. In the MDDR
celecoxib has an activity index of 78454 indicating it as a CYCLOOXYGENASE 2
INHIBITOR. The MDDR provides sometimes more than just one activity index per
compound. Therefore, all compounds that have at least one activity index with the signature
78454 were defined as an active candidate while all other compounds were defined as
inactive. Using this definition we have 839 active molecules in a database of 62871 entries.
Table 34 shows the results of the enrichment studies and Figure 47 shows the enrichment
plots that were obtained for the VS with the COX-2 inhibitor celecoxib to search for
molecules having the signature 78454 in their activity index list. The top 10% of the ranked
database contains about 62% of the COX-2 inhibitors contained in the whole MDDR. The x-
axis represents the percentage of the ranked MDDR database that has been screened and the
y-axis shows the percentage of the active COX-2 inhibitors that were found.
Table 34: The results of the enrichment studies showing the percentage of active COX-2 inhibitors
found in the top 1%, top 5% and top 10% of the ranked MDDR database. The calculated enrichment
factors are given in the last row.
Screened ranked database (%) COX-2 inhibitors found (%) Enrichment Factor
1 31.0 31.0
5 51.1 10.2
10 62.6 6.3
The enrichment curves are shown in Figure 47. The x-axis represents the percentage of the
ranked MDDR database that has been screened and the y-axis shows the values for the
enrichment factor.

6.4 Ligand-based Virtual Screening of a Drug Database
171
A
0
20
40
60
80
100
0 20 40 60 80 100
Screened Ranked Database (%)
Nu
mb
er A
ctiv
e C
om
po
un
ds
(%)
B
0
10
20
30
40
50
60
70
0 1 2 3 4 5 6 7 8 9 10
Screened Ranked Database (%)
Nu
mb
erA
ctiv
e C
om
po
un
ds
(%)
C
0
5
10
15
20
25
30
35
0 10 20 30 40 50 60 70 80 90 100
Screened Ranked Database (%)
En
rich
men
t F
acto
r
Figure 47: The enrichment of active compounds
is shown for the whole screened and ranked
database (A) and for the first ten percent of the
screened ranked database (B). The black line
indicates the expected number of active compounds
that would be found with a random selection. The
red curve shows the real number of found
compounds by our screening technique. Figure C
shows the course of the calculated enrichment
factor for the screened ranked database.
After performing a ligand-based VS it is expected that superimpositions carrying the same
activity index as the query molecule should reach higher fitness scores than the inactive
compounds. Figure 48 shows that this is the case for the database search applying our hybrid
GA method. The x-axis represents the fitness score of the superimposition results and the y-
axis shows the percentage of number of compounds found in the alignment belonging to the
particular fitness. The number of compounds of the actives and inactives was normalized to
the total number of compounds of actives and inactives that can be found in the database. A
clear discrimination between actives and inactives can be found. Superimpositions that
contain the COX-2 inhibitors occupy the higher fitness scores while alignments of celecoxib
with inactives can mainly be found in the area of lower fitness scores.

6.4 Ligand-based Virtual Screening of a Drug Database
172
0
2
4
6
8
10
12
14
16
18
0 5 10 15 20 25
Fitness Score
Nu
mb
er C
om
po
un
ds
(%)
Active compounds(COX-2 inhibitors)
Inactive compounds
Figure 48: Fitness score distribution for actives (COX-2 inhibitors) and for inactives.
Table 35 shows the chemical structures of the ten best hits of the database search with
celecoxib using GAMMA. All hits are 1,5-diarylpyrazoles with a benzenesulfonamide group,
wherefrom hits eight and nine are N-substituted derivatives. This indicates the structural
similarity of the best ten hits. Only hits four and six are marked as inactive meaning their
activity indices are unequal 78454. Both compounds have the activity indices 2100 and 75840
classifying them as ANTIINFLAMMATORY and CHEMOPREVENTIVE. In studies using a
variety of NSAIDs it was shown that the application of these compounds decreases cancer
incidence by acting on multiple molecular targets of which one possible is COX-2 (203).
The MDDR database has different categorizations for the activity records. Sometimes
activities are given for specific mechanisms of action against a biological target, as for
example the activity class TNF INHIBITOR. But also activity classes exist that are more
bound to a therapeutic area like e.g. ANTIMIGRAINE or that is descriptive of the chemical
class, as e.g. PYAZOLIDINONE. As already mentioned a database structure is often
associated with more then one activity index. Now we were interested in evaluating all given
activity indices for the ten best ranked hits. The activity indices were decoded to obtain the
corresponding activity class and their frequency of occurrence in the top ten of the hit list is
shown in Figure 49. The three classes that occur most frequently are CYCLOOXYGENASE
2 INHIBITOR, ANTIARTHRITIC and ANTIINFLAMMATORY. This corresponds with the

6.4 Ligand-based Virtual Screening of a Drug Database
173
Table 35: The chemical structures of the ten best hits found with the query structure celecoxib, 42.
The rank that was evaluated with the fitness score is given.
Query N
N
FF
F
S
NO
O
HH
Ranking
position Structure
Ranking
position Structure
1
(active)
49
NN
FF
F
SN
OO
HH
2 (active)
50
NN
FF
F
S
NO
O
HH
3
(active)
51
NN
FF
F
SOH
NO
O
HH
4
(inactive)
52
NN
S OO
N
FF
F
HH
5
(active)
53
NN
H
FF
F
SOH
S
NO
O
HH
6
(inactive)
54
NN
FF
F
S
NO
O
HH

6.4 Ligand-based Virtual Screening of a Drug Database
174
7
(active)
55
NN
FF
F
H
S
N
NO
OO
HH
8 (active)
56
NN
FF
F
S
NHO
OO
O
NO
O
9
(active)
57
NN
FF
F
S
NHO
OO
O
NO
O
10
(active)
58
NN
FF
F
S
Cl
NO
O
HH
0 2 4 6 8 10
ACTINIC KERATOSES AGENT FOR
PLATELET ANTIAGGREGATORY
NEURONAL INJURY INHIBITOR
NITRIC OXIDE DONOR
ANALGESIC NON OPIOID
CHEMOPREVENTIVE
ANTIINFLAMMATORY
ANTIARTHRITIC
CYCLOOXYGENASE 2 INHIBITOR
Frequency
Figure 49: Distribution of the frequencies of MDDR activity classes in the best ten hits that were
found with a database search with celecoxib.
therapeutic use of COX-2 inhibitors for the treatment of rheumatoid arthritis, osteoarthritis
and as an anti-inflammatory agent.

6.4 Ligand-based Virtual Screening of a Drug Database
175
Another interesting aspect is the inspection of the screening results with respect to their 2D
chemical structure. The query molecule celecoxib contains the typical structural components
of the COX-2 inhibitors that are now in use in drugs. There, a pyrazol ring is connected with
two aryl substituents. The majority of compounds within the activity class
CYCLOOXYGENASE 2 INHIBITOR resemble this type of species. Another COX-2
inhibitor which does not fall within that compound class was found as hit number 47, 59,
(Figure 50). It contains a pyranone ring instead of the pyrazol ring. The pyranone moiety is
directly connected with an aryl group and sulfide bridge bonded with another aryl group. The
compound belongs to the two activity classes ANALGESIC NON OPIOID and
CYCLOOXYGENASE 2 INHIBITOR.
59
S
OO CF3
S OO
Figure 50: Hit 47 out of the celecoxib screening results.
6.4.4.3 The GABAA Receptor Agonist Diazepam
In the second screening experiment the query molecule was diazepam, 60, (Valium®,
Faustan®) (Figure 51). Diazepam belongs to the class of benzodiazepines and is a GABAA
receptor agonist. The effects caused on GABAA receptors are directed by the binding of
γ-aminobutyric acid (GABA) leading to the opening of a chloride channel (204). The inhibiting
neurons in the brain and in the spinal cord use GABA as neurotransmitter. This results in a

6.4 Ligand-based Virtual Screening of a Drug Database
176
hyperpolarized cell membrane which means that the excitability of the target cell is decreased.
Benzodiazepines are able to allosterically enforce the effects of GABA. The clinical use of
benzodiazepines is quite broad as hypnotics, sedatives, anxiolytics, skeletal muscle relaxants,
anticonvulsants. They are the most important group within the tranquilizers.
N
N
Cl
O
Figure 51: Chemical structure of diazepam, 60, which was used as a query molecule for VS.
As in the celecoxib experiment, enrichment factors are calculated to evaluate the quality of
the screening experiment with diazepam. All compounds with the activity index 06210 were
classified as actives and all the others as inactive. The activity index 06210 denotes
BENZODIAZEPINE. In our database we can find 51 entries possessing this activity. In the
top 1% of the ranked database already about 71% of the actives can be found (Table 36).
Figure 52 shows the results of the enrichment studies. The x-axis represents the percentage of
the ranked MDDR database that has been screened and the y-axis shows the percentage of the
active compounds that were found.
The enrichment curves are presented in Figure 52. The x-axis represents the percentage of the
ranked MDDR database that has been screened and the y-axis shows the values for the
enrichment factor.
Also, for the diazepam screen we were interested if those alignments that contain a database
molecule with the same activity index as diazepam reach higher fitness scores as the
alignments where an inactive compound takes part in. Figure 53 shows the distribution of the
fitness scores on the x-axis and the percentage of the number of compounds belonging to the

6.4 Ligand-based Virtual Screening of a Drug Database
177
Table 36: The results of the enrichment studies showing the percentage of active compounds found
in the top 1%, top 5% and top 10% of the ranked MDDR database. The calculated enrichment factors
are given in the last row.
Screened ranked database (%) 06210 found (%) Enrichment Factor
1 71.4 71.4
5 75.5 15.1
10 75.5 7.6
A
0
20
40
60
80
100
0 20 40 60 80 100
Screened Ranked Database (%)
Nu
mb
er A
ctiv
e C
om
po
un
ds
(%)
B
0
10
20
30
40
50
60
70
80
0 1 2 3 4 5 6 7 8 9 10
Ranked Database Screened (%)
Nu
mb
er A
ctiv
e C
om
po
un
ds
(%)
C
0
10
20
30
40
50
60
70
80
0 20 40 60 80 100
Screened Ranked Database (%)
En
rich
men
t F
acto
r
Figure 52: The enrichment of active compounds
is shown for the whole screened ranked database
(A) and for the first ten percent of the screened
ranked database (B). The black line indicates the
expected number of active compounds that would
be found with a random selection. The red curve
shows the real number of found compounds by our
screening technique. Figure C shows the course of
the calculated enrichment factor for the screened
ranked database.
particular fitness score on y-axis. Alignments with an active molecule in the database have
clearly higher fitness scores than the fitness scores out of alignments with inactives.

6.4 Ligand-based Virtual Screening of a Drug Database
178
0
2
4
6
8
10
12
14
16
18
20
0 5 10 15 20
Fitness score
Nu
mb
er c
om
po
un
ds
(%)
Active compounds(benzodiazepines)
Inactive compounds
Figure 53: Fitness score distribution for actives (benzodiazepines) and for inactives
Table 37 shows the chemical structures of the ten best scoring hits out of the search with
diazepam. All have a benzodiazepine skeleton in common and differ in the side chains bound
to this skeleton. The inactive molecules found in the hit list are the hits number three, four,
five and eight. The activity entries classify two of them as ANTINEOPLASTIC, one as a
CCK A ANTAGONIST and the last one is used as PHARMACOLOGICAL TOOL. For
structures of 1,4-benzodiazepine class some have been identified that are highly selective
cholecystokinin receptor subtype A antagonists (205). Also, it was shown that benzodiazepine
peptidomimetics exert Ras farnesyltransferase inhibition (206).
As mentioned above, the MDDR often associates more then one activity index with one entry.
Thus, Figure 54 depicts the frequency of every activity class that can be found in the ten best
scoring hits. The best three scoring hit are the activity classes BEDNZODIAZEPINE,
ANXIOLYTIC and BENZODIAZEPINE AGONIST. As already mentioned, all the best ten
hits belong structurally to the chemical species of benzodiazepines. It is also known that
diazepam and other benzodiazepines are therapeutically used as anxiolytic agents.

6.4 Ligand-based Virtual Screening of a Drug Database
179
Table 37: The chemical structures of the ten best hits found with the query structure diazepam. The
rank that was evaluated with the fitness score is given.
Query N
N
Cl
O
Ranking
position Structure
Ranking
position Structure
1 (active)
61
N
N
O
Cl
2 (active)
62
N
N
Cl
O
3
(inactive)
63
N
N
NH
ONH
OI
4
(inactive)
64
N
N
NH
O
FF
F
N
N
N
5
(inactive)
65
N
N
NH
O
FF
F
N
N
N
6 (active)
66
N
N
O
Cl
F
F
F
F
7 (active)
67
N
N
Cl
O
ON
O
8
(inactive)
68
N
N
Cl
O
I

6.4 Ligand-based Virtual Screening of a Drug Database
180
9 (active)
69
N
N
O
Cl
F
F
F
10
(active) 70
N
N
Cl
OH
O
0 1 2 3 4 5 6 7
DIAGNOSTIC FOR CANCER
ISOTOPE
DIAGNOSTIC AGENT
CCK A ANTAGONIST
AGENT FOR PREMEDICATION
ANTICONVULSANT
ALCOHOL DETERRENT
SLEEP DISORDERS AGENT FOR
PHARMACOLOGICAL TOOL
FARNESYL PROTEIN TRANSFERASE INHIBITOR
ANTINEOPLASTIC
BENZODIAZEPINE AGONIST
ANXIOLYTIC
BENZODIAZEPINE
Frequency
Figure 54: Distribution of the frequencies of MDDR activity classes in the best ten hits that were
found with a database search with diazepam.
The search with the query compound diazepam results in a hit list which mainly contains
chemical species of the benzodiazepine type. A closer look into the resulting hit list was done
to identify compounds with a different chemical 2D structure. Hit 61, 71, (Figure 55)
resembles a different kind of chemical and also with different kind of activity classes than the
query compound. It contains a benzoyl-chlorophenyl moiety connected via an amide bond
with an imidazolylthio group. The activity classes it belongs to are ANTISECRETORY
GASTRIC and ANTIULCERATIVE. Therefore, it does not fall within the therapeutic
spectrum of diazepam, but shows a similar pharmacologic action as other benzodiazepines.

6.4 Ligand-based Virtual Screening of a Drug Database
181
71
N
OCH3
ClO
SNH
N
Figure 55: Hit 61 out of the diazepam screening results
6.4.5 Conclusions
It was shown that GAMMA is capable of screening a database of flexible, drug-like molecules
for candidates that are similar to a given rigid query molecule. Both examples for a VS based
on ligand-based search technique show that it is feasible to enrich a much greater percentage
of actives in the upper part of the ordered database than can be achieved with a random
selection. The enrichment plots show typical hyperbolic curves with the enriched actives
curve lying above the diagonal that represents a random selection of active compounds.
Hence, GAMMA is able to preferentially select compounds from the MDDR database with
the same activity as the query molecule. Also, a good discrimination between actives and
inactives concerning the fitness scores of the superimpositions was achieved. The alignments
that contain active database compounds have higher fitness scores than the superimpositions
that contain inactive compounds. It should be mentioned that the classification for actives and
inactives that was used does not ensure that all structures falling in the inactives pool are
really inactives as it is not sure whether they have been tested experimentally for the activities
we were interested in. Taking this into account we could also conclude that GAMMA has
identified additional interesting candidates that could, on the one hand, be active or, on the
other hand, could serve as leads for further optimization. The runtime with 56.43 seconds per
mutual alignment and about 41 days for the entire database search on a 16 processor Linux
cluster seems to be quite slow. But compared with other search techniques we are generating a
much higher number of conformations per database compound than in other approaches.
There, databases are often chosen that store a limited number of pregenerated conformations.
Full flexibility was used for all the tested database molecules and kept only the query

6.5 Addressing Ring Flexibility
182
compound rigid. The runtime could be reduced by using a less strict range for the torsion
angle increments.
6.5 Addressing Ring Flexibility
6.5.1 Introduction
Compounds that bind to a macromolecular target are mostly flexible and can change their
conformation during the binding process. Hence, the bioactive conformation of the molecule
does not necessarily correspond to a global or even local low-energy conformation. The
torsion angles change while the molecule adopts the conformation that fits best to the binding
site. Thereby, not only the flexible acyclic parts are changed but also the flexible ring systems
can alter its conformations.
Rings are important for organic molecules as they influence the shape and the molecular
flexibility. Through their spatial expansion they also have an influence on the steric positions
of other substituents of a compound. Biologically active molecules often interact with their
target by their ring systems, either with heteroatoms within the ring or by hydrophobic
interactions. Because of their size their influence on the global molecular properties should
not be underestimated. Electronic ring properties determine the reactivity of a compound and
with that the metabolic stability and toxicity.
The data used in this study were retrieved from the Protein Data Bank for crystal structures of
macromolecules cocrystallized with their ligands or obtained with the 3D structure generator
CORINA. The Relibase+ system was applied to search for different ring types and ring
conformations that do not correspond to a low energy conformation. The protein-ligand
complexes to be used were all restricted to resolutions better than 2.0 Å.
The ligands were extracted from the protein-ligand complex and this bioactive conformation
was used as the template for the superimpositions.
To address the problem of ring flexibility we incorporated CORINA in a library version in the
presented application. This enabled us to include the 3D structure generator CORINA with its
ring conformation generation functionality. Ring conformations can be generated for rings
with up to eight atoms.

6.5 Addressing Ring Flexibility
183
The ring conformations are introduced in the 3D-MCSS search process in two ways: (i) by
randomly generating possible ring conformations for a compound and spreading it randomly
over the initial start population or by performing a prematch of the ring conformations that are
contained in the template and in the test molecules. In both cases the ring conformations are
not changed anymore during the 3D-MCSS-optimization process. Therefore, we do not use an
on-the-fly generation of ring conformation. This approach may suffer from a loss of bioactive
conformations due to a too coarse search process, but on the other hand the number of
possible conformations for eight-membered rings is still quite small.
In all the conducted superimposition studies we provided a template with a ring system that
does not correspond to the global low-energy conformation. The test compounds were all
initially generated in their low-energy conformation containing a ring system that comes
across with a global low energy conformation. At the end of the 3D-MCSS-search procedure
the method should have been able to select test compounds with another ring conformation
than the global low-energy-conformation that is more similar to the ring conformation of the
template molecule.
We will present the results by beginning with quite simple examples that serve as basic test
cases. Here we wanted to evaluate if the method is able to find another ring conformation than
the global-minimum at all. We will start with alignment studies where identical molecules are
matched but differ in their global overall conformation as well as in the conformation of the
ring system that they have in common. Finally we will present results of a superimposition of
different molecules.
6.5.2 Tropacocaine
Tropacocaine, 72, is an alkaloid found in the leaves of the coca plant (Erythroxylum coca). It
is a structural analog of cocaine and therefore acts like cocaine but is less toxic. It can be
applied as a local anesthetic. The used tropacocaine derivative contains a tropane ring system,
which is composed of a pyrrolidine and a piperidine ring (Figure 56).

6.5 Addressing Ring Flexibility
184
72
N
H3C
O
O
Figure 56: Structure diagram of tropacocaine, 72. Tropacocaine contains a tropane ring system
which is composed of a pyrrolidine and a piperidine ring.
The upper part of Figure 57 shows the two start conformations that were used for
tropacocaine for superimpositions. Part A of Figure 57 shows the conformation of the
template with the low energy conformation. The pyrrolidine ring is found in the envelope and
the piperidine ring in the boat conformations. Part B shows the conformation of the test
molecule with the pyrrolidine ring in the envelope and the piperidine ring in the chair
conformation. The middle part depicts the best-ranked superimpositions found when a
prematch of the ring conformations is performed prior to the optimization process (C) and
when different possible ring conformations where used in the initial start population of the
genetic algorithm (D). The lower part, E, shows the superimposition of the two tropacocaine
conformations without changes in the ring conformations. The low energy conformation
contains the pyrrolidine ring in the envelope and the piperidine ring in the chair
conformations. The low energy conformation was chosen as the template molecule. For the
test compound we have generated a ring conformation that contains the pyrrolidine ring
system in the envelope and the piperidine ring system in the boat conformation. With both
methods the correct low energy ring conformation of the tropane ring system was found and
also both conformations were perfectly matched with an RMS difference of the atoms in the
substructures of 0.0 Å (Figure 57 C and D). In contrast, if no changes in the ring
conformations are applied the alignment leads to larger RMS deviations (Figure 57 E).

6.5 Addressing Ring Flexibility
185
A
B
C
D
RMS (Å): 0.00, substructure size: 18 RMS (Å): 0.00, substructure size: 18
E
RMS (Å): 1.42, substructure size: 18
Figure 57: Upper part: start conformations for tropacocaine. A: conformation of the template with
the low energy conformations of the pyrrolidine ring (envelope) and the piperidine ring (chair). B:
conformation of the test molecule with the pyrrolidine ring in the envelope and the piperidine ring in
the boat conformation. Middle part: best-ranked superimpositions found when a prematch of the ring
conformations is performed (C) and when different possible ring conformations where used in the
initial start population (D). Lower part: superimposition of the two tropacocaine conformations
without changes in the ring conformations (E).

6.5 Addressing Ring Flexibility
186
6.5.3 Staurosporine
Staurosporine, 73, is a natural product found in the bacterium Streptomyces staurosporeus.
The biological activity ranges from antifungal to antihypertensive. It was also possible to
demonstrate an inhibitory effect on several protein kinases which gave rise to the idea to
apply it for anti-cancer treatment.
When broken down into substructural elements staurosporine consist of a sugar moiety and a
heterocyclic indolcarbazole element which is planar (Figure 58).
73
O
N
H
NH
O
H3CN
HN
O
CH3
CH3
Figure 58: Structure diagram of staurosporine, 73. Staurosporine can be broken down into a sugar
moiety and a heterocyclic indolcarbazole element which is planar.
The upper part of Figure 59 shows the two start conformations that were used for
staurosporine for superimpositions. Part A of Figure 59 shows the conformation of the
template with a conformation found in the PDB entry 1AQ1 that contains the sugar moiety in
a twisted boat conformation. Part B shows the conformation of the test molecule with the
sugar ring in a low-energy chair conformation. The middle part depicts the best-ranked
superimpositions found when a prematch of the ring conformations is performed prior to the
optimization process (C) and when different possible ring conformations where used in the
initial start population of the GA (D). The lower part shows the superimposition of the two
staurosporine conformation without changing the ring conformations (E). In the low energy
conformation the sugar ring forms a chair conformation. This conformation will be used for
the test compound. The template holds a conformation extracted from the PDB entry 1AQ1,
where the sugar ring can be found in a twisted boat conformation. For the test molecule
staurosporine was used with its sugar ring in a low-energy chair conformation. Again, both

6.5 Addressing Ring Flexibility
187
A
B
C
D
RMS (Å): 0.32, substructure size: 35 RMS (Å): 0.32, substructure size: 35
E
RMS (Å): 0.98, substructure size: 35
Figure 59: Upper part: start conformations of staurosporine. Part A shows the template with a
conformation found in the PDB entry 1AQ1 that contains the sugar moiety in a twisted boat
conformation. B shows the conformation of the test molecule with the sugar ring in a low-energy chair
conformation. Middle part: best-ranked superimpositions found when a prematch of the ring
conformations is performed (C) and when different possible ring conformations where used in the
initial start population (D). Lower part: superimposition of the two staurosporine conformation without
changing the ring conformations (E).
methods found analogous solutions in the best-tanked superimposition (Figure 59 C and D).
In both cases the test molecule was found to contain the sugar moiety in the boat

6.5 Addressing Ring Flexibility
188
conformation. The superimposition of both conformations without changing the conformation
of the sugar moiety is shown in Figure 59 E for comparison. Due to the large size of
staurosporine the RMS differences between both conformations are not that drastic as in the
case of tropacocaine. But it can be clearly recognized in Figure 59 E that the substituents of
the sugar ring point into different spatial directions, therefore, increasing the RMS value.
6.5.4 Pethidine
Pethidine, 74, unites the muscle cramp resolving effects of atropine and the analgesic effects
of morphine. Because of its morphine mimicking effects it can be applied as an analgesic but
because of its side effects its use is deprecated. Its morphine-like effects arise from the action
as an agonist on the µ-opioid receptor. The atropine-like effects in contrast arise from its
interaction with the sodium ion channel. Pethidine contains a piperidine ring (Figure 60).
74
N
CH3
O
OH3C
Figure 60: Structure diagram of pethidine, 74. Pethidine contains a piperidine ring.
The upper part of Figure 61 shows the two start conformations that were used for pethidine
for superimpositions. Part A shows the conformation of the template with a boat conformation
for the piperidine ring system generated with CORINA. Part B shows the conformation of the
test molecule with the piperidine moiety in a low-energy chair conformation. The middle part
of Figure 61 depicts the best-ranked superimpositions found when a prematch of the ring
conformations is performed prior to the optimization process (C) and when different possible
ring conformations where used in the initial start population of the GA (D). The lower part of
Figure 61 shows the superimposition of the two pethidine conformation without changing the
ring conformations (E). The template compound for the superimposition carries

6.5 Addressing Ring Flexibility
189
A
B
C
D
RMS (Å): 0.22, substructure size: 18 RMS (Å): 1.18, substructure size: 18
E
RMS (Å): 1.28, substructure size: 18
Figure 61: Upper part: start conformations for pethidine. A: conformation of the template with a
boat conformation. B: conformation of the test molecule in a low-energy chair conformation. Middle
part: best-ranked superimpositions found when a prematch of the ring conformations is performed (C)
and when different possible ring conformations where used in the initial start population (D). Lower
part: superimposition of two pethidine conformations without changing ring conformations (E).

6.5 Addressing Ring Flexibility
190
a boat conformation that has to be found for the test molecule that carries a low-energy chair
conformation. The obtained results for the best-ranked superimposition using a prematch on
the one hand differs slightly from the result obtained when the generated ring conformations
were distributed upon the GA start population. Even though both versions contain a twisted
ring for the piperidine instead of a low-energy boat conformation, the resulting
superimpositions gave better RMS deviations for the method that applied a prematch. The
alignment of both conformations without changing the conformation of the piperidine ring is
shown in Figure 61 E for comparison. This example is especially interesting, because both
methods that generate new ring conformations did not recognize a boat conformation as the
relevant ring conformation but selected a twisted chair conformation. Also, the new twisted
chair conformation leads to a dramatic change in the positions of the phenyl and the ethylester
derivative. In the template conformation with the boat conformation of the piperidine ring, the
phenyl ring is found in axial position while the ethylester substituents are found in an
equatorial position. The low-energy conformation of pethidine in contrast has the phenyl
substituents in equatorial position while the ethylester substituents are bound in an axial
position. The newly generated twisted conformation has its substituents bound in analogy to
the template. Also, here the phenyl substituent is found in an axial position while the
ethylester is found in an equatorial position.
6.5.5 M77 and IQP
The next example could not be handled by the method that performs a prematch of ring
conformations of flexible rings in the molecules. The reason for this is that both molecules
contain ring systems of different size. Two ligands were used: M77 that can be found in the
PDB entry 1Q8W (207) and IQP that is contained in the PDB entry 1YDR (208). M77 contains a
diazepane and IQP contains a methylpiperazine ring. The molecular structures of both
compounds are shown in Figure 62. Both bind to the cAMP-dependent protein kinase A.
The two compounds posses an isoquinoline moiety. M77 was selected as a template with its
seven-membered diazepane ring system to see how the compound IQP with its six-membered
methylpiperazine ring is matched onto it (Figure 63). In the upper part of Figure 63 the two
start conformations are shown that were used for M77 and IQP for the superimposition. Part
A shows the conformation of the template. Part B shows the conformation of the test

6.5 Addressing Ring Flexibility
191
molecule with a piperidine moiety in a low-energy chair conformation. The lower part of
Figure 63 depicts the best-ranked superimpositions found when different possible ring
conformations where used in the initial start population of the genetic algorithm (C). E shows
the best-ranked superimposition that was found when the ring conformations are not changed.
75
O S O
N
NH
N
76
S
N
O O
NH3C
NH
Figure 62: Structure diagrams of the two ligands M77, 75, deposited in the PDB entry 1QAW and
IQP, 76, deposited in the PDB entry 1YDR. Both posses an isoquinoline moiety. Additionally, M77
contains a diazepane and IQP contains a methylpiperazine ring.
The methylpiperazine ring is selected in a low-energy chair conformation before the
optimization starts. The best-ranked superimposition contains IQP with a twisted chair
conformation which has the advantage that both nitrogen atoms of the methylpiperazine ring
system can be matched. In this case, one can see that the overall match of two different
molecules with ring systems of different size is mainly influenced by the acyclic parts and not
mainly by the ring conformations. The superimposition where the ring conformations were
not changed led to a lower RMS deviation than the superimposition that uses different ring
conformations in the start population of the GA. The match of the atoms in the isochinoline
and the sulfonamide part for the superimposition that changes the ring conformations is worse
than in the superimposition without changing the ring conformation. These deviations in the
atomic positions have a much greater influence on the final RMS difference than small
changes in the ring conformations that could maybe optimize deviations in the positions of
atoms that are part of the methylpiperazine and the diazepane moieties.

6.5 Addressing Ring Flexibility
192
A
B
C
E
RMS (Å): 1.65, substructure size: 19 RMS (Å): 0.47, substructure size: 19
Figure 63: Upper part: start conformations that were used for M77 and IQP for superimposition.
Part A shows the template, B shows the test molecule. Lower part: best-ranked superimposition found
when different possible ring conformations where used in the initial start population (C). E shows the
best-ranked superimposition found when the ring conformations are not changed.
6.5.6 Discussion
An approach for searching ring conformations for a superimposition method has been
presented. It combines the hybrid GA that allows for flexible fitting of torsion angles of
acyclic parts with the ability of the 3D structure generator CORINA to generate multiple ring
conformations. Four examples have been presented that comprise the alignment of one and
the same molecule with different ring conformations and the superimposition of two different
compounds with rings of different size. The examples show that the method is suitable for
molecules that have a ring system of equal size and differ in the axial and equatorial positions
of their substituents.
The method is less suitable for molecules that contain rings of different size and large acyclic
parts. The larger the substituents of the rings the smaller the benefit in gaining a good
superimposition. The reason for this is that the influence of the acyclic parts on the overall fit

6.5 Addressing Ring Flexibility
193
grows with their size while the influence of the atoms that are part of the ring system
decreases. Only in the case when we have differences in the axial or equatorial positions
between the template and the test compound the conformation of the ring system is enhanced
as demonstrated in the pethidine example. In this regard an additional study that evaluates the
flapping of nitrogen ring atoms should be performed.
The version that applies a prematch of the ring conformations can only be applied to
molecules taking part in a superimposition that contain rings of equal size. But it performs in
general better than the other method that generates different possible ring conformations for
the initial start population of the GA.

7 Conclusions and Outlook
194
7 Conclusions and Outlook
An atom-based approach was presented for the detection of the three-dimensional maximal
substructure (3D-MCSS) by superimposing pairs or sets of molecules. A hybrid genetic
algorithm is applied to accomplish this task. The atoms to be matched can be discriminated by
means of different chemical properties. In the presented work we used medium-sized and
larger peptidic drug-like molecules.
The previous version of the presented method was expanded by implementing new features
like the selection of one best Euclidean compromise solution out of a set of Pareto optimal
solution originating from the Pareto selection, the automatic calculation of cutoff values for
chemical features that define ranges in which atoms are allowed to match with each other, the
introduction of generating ring conformations using the 3D structure generator CORINA in a
library version, the parallelization of the serial genetic algorithm using an island model
allowing for the exchange of genetic information between different parallel processes.
Especially the introduction of the Euclidean compromise solution for the restricted
tournament selection and the automatic calculation of tolerance intervals for physicochemical
properties increased the usability of the algorithm for larger datasets. The user of the program
is not forced to interfere anymore. Finally, the parallelization of the hybrid genetic algorithm
facilitated the application of the presented method to virtual screening of compound libraries.
The different methodologies have been applied in several studies.
In the first study, superimpositions were performed using ligands of membrane associated
receptors for which no structural information is available. Two examples of ligands of
membrane spanning G-protein-coupled receptors (GPCRs) were selected, specifically ligands
of the 5-HT1B /5-HT1D and the AT1 receptors. In both cases, superimposing triptans and
sartans, the presented method has demonstrated to be able to detect relevant substructural
elements. In the case of the triptans, a substructural element was detected that resembles a
structure which is similar to serotonin (5-hydroxytryptamine, 5-HT) and all triptans bind to
serotonin receptors. For the sartans, a moiety was identified that is a relevant common
substructural element which is important for receptor binding.
In a second validation study, we compared the calculated alignments obtained by the hybrid
GA with superimpositions received from X-ray data and the predicted conformation of the test
molecules with the bioactive conformations found in protein-ligand complexes. It was

7 Conclusions and Outlook
195
possible to show that the application of the hybrid GA can produce reasonable molecule
superimpositions. However, the conducted experiments also showed that a broader study
should be realized that evaluates the necessary runtime of a multiple molecule alignment so
that it results in the same quality of the results as obtained by a pairwise alignment. Also, it
came out that the method for multiple molecule alignment should be further compared to an
alternative approach that detects a maximum set of maximum common substructures
(MSMCSS) instead of a MCSS to take into account locally found substructures between test
ligands that are not seen in the final results. Here, also another shortcoming was revealed
indicating that the best-ranked superimposition does not necessarily represent the alignment
with the highest coincidence with an alignment received from X-ray data. And often enough,
the result that has the highest coincidence with the X-ray alignment is ranked worse.
Therefore, in future work the fitness scoring function has to be expressed in better terms to
increase the similarity of the predicted superimposition with the experimental
superimposition. This should further help in generating pharmacologically meaningful
alignments. Another limitation of the current approach is given in cases when the test ligands
are much larger in size than the reference compound. GAMMA then tries to find
conformations for the molecules during a superimposition by changing torsion angles in those
parts of the test molecules that have no matching partner so far. This ends up in strained
conformations far away from a bioactive conformation.
In the third study, we compared different matching criteria applied to transition state inhibitors
of the arginase II. Here we could show that in the absence of knowledge on the target
macromolecule a superimposition based on physicochemical properties is the appropriate
solution while in the case where there is a certain level of knowledge available on the binding
interactions like hydrogen-bonding it is advisable to force the corresponding atoms taking part
in these interactions to match. Also, this approach provides a new methodology for generating
three-dimensional structure reaction intermediates that can be used as queries for searching in
databases of chemical structures for new potential enzyme inhibitors without using elaborate
and time-consuming ab initio methods. In the fourth study, we applied the parallel version of
the hybrid genetic algorithm for screening a database of flexible, drug-like molecules and we
were able to show that GAMMA can preferentially select compounds from a virtual library
that have the same activity as the rigid query molecule. It was possible to show that we enrich
a much greater percentage of actives in the upper part of an ordered database than can be
achieved with a random selection. The connection between the runtime of the algorithm and

7 Conclusions and Outlook
196
the flexibility of the compounds was made clear. It was shown that the runtime could be
scaled down if a less strict range for the torsion angle increments would be used.
In a last study, the combination of the flexible fitting of torsion angles of acyclic parts with
the ability of to generate multiple ring conformations was applied. It was shown that the
method is suitable for molecules that have a ring system of equal size and differ in the axial
and equatorial positions of their substituents but also restrictions of the method could be
shown when applied to molecules that contain rings of different size and large acyclic parts.

Summary
197
Summary
The aim of the present work was to extend an already available method for the
superimposition of three-dimensional models of molecules by implementing new features.
The flexible alignment of molecules assists in the detection of similarities between
compounds. The determination of similarities between molecules plays an important role in
drug design. The three-dimensional maximum common substructure (3D-MCSS) of
compounds is an adequate similarity measurement. The 3D-MCSS represent the spatial
arrangement of the largest structural fragment that they have in common. The program
GAMMA (Genetic Algorithm for Multiple Molecule Alignment) superimposes pairs or sets of
molecules based on the combination of a genetic algorithm with a numerical optimization
method called directed tweak. Genetic algorithms are stochastic optimization methods that are
based on the principles of genetics and natural selection. They imitate mechanisms used by
nature to adapt to a changing environment. The atoms to be matched can be discriminated by
means of different chemical properties. Further, it is possible to select atoms in advance,
which are supposed to be part of the 3D-MCSS. The restricted tournament selection prevents
loss of genetic diversity during the optimization process and makes use of the Pareto fitness.
As the search for the 3D-MCSS is a multidimensional problem that has to optimize three
contradictory criteria, the size of the MCSS, the geometric fit and a stereochemical descriptor
the Pareto optimization was introduced. This optimization technique does not only deliver
one probably perfect 3D-MCSS per GA experiment but for each possible size of the common
substructure an optimal geometric fit is produced that cannot be further minimized. The
hybrid genetic algorithm was extended by implementing new features. An approach was
developed that automatically extracts one optimal solution from a set of Pareto optimal
solutions provided by the Pareto fitness used in the restricted tournament selection. The
optimal feasible value is the one that is closest to a perceived ideal. A so-called Euclidean
compromise solution was proposed that selects the best point in such a way that it minimizes
the Euclidean distance to the ideal point. The calculation of physicochemical properties is
required for the alignment process as the chemical features are used as matching criteria. A
method for the automatic calculation of cutoff values for chemical features was developed
that define ranges in which atoms are allowed to match with each other. To speed up the
search process and to enable alignments of several thousand compounds the parallelization of
the serial genetic algorithm using an island model allowing for the exchange of genetic
Summary
198
information between different parallel processes was realized. Finally, ring flexibility was
introduced by generating ring conformations by combining the current procedure with a
library version of the 3D structure generator CORINA. Especially the introduction of the
Euclidean compromise solution for the Pareto fitness and the automatic calculation of
tolerance intervals for physicochemical properties increased the usability of the algorithm for
larger datasets as the user of the program is not forced to interfere. Finally, the parallelization
of the hybrid genetic algorithm facilitated the application of the presented method to virtual
screening of compound libraries. The different methodologies have been applied in several
studies. The applicability of the hybrid genetic algorithm was tested by means of four
examples of usage with medium-sized and larger peptidic drug-like molecules.
Superimpositions were performed where a user-defined molecule was used as a rigid
template, to which the conformations of the other compounds adapt. First, superimposition
studies were performed using ligands of membrane associated receptors for which no
structural information is available. Here, the method demonstrated that it can identify
substructural elements that are of relevance for receptor binding. In a second study, the
calculated alignments of the hybrid GA were compared with experimental superimpositions
and the predicted conformation of the test molecules with the bioactive conformations found
in protein-ligand complexes. The method was tested on six ligand datasets that bind to various
target molecules and for which crystallographic data on the binding mode is available:
inhibitors of the herpes simplex type 1 thymidine kinase, streptavidin ligands, dihydrofolate
reductase ligands, thrombin inhibitors, estrogen receptor α antagonists and penicillopepsin
ligands. The molecules show differences in size and flexibility. It was possible to show that
the application of the hybrid GA can produce reasonable molecule superimpositions. In the
third study, different matching criteria applied to transition state inhibitors of the arginase II
were compared. Here, it was possible to show that in the absence of knowledge on the target
macromolecule a superimposition based on physicochemical properties is the appropriate
solution while in the case that there is a certain level of knowledge on the binding interactions
like hydrogen-bonding it is advisable to force the corresponding atoms taking part in these
interactions to match. In the next study, the capability of GAMMA was demonstrated to
extract active molecules similar to a query molecule from a compound library of flexible,
drug-like molecules. The parallel version of the hybrid genetic algorithm was applied to
perform two virtual screening (VS) experiments. The MDDR (MDL Drug Data Report) was
selected as an example for a typical drug database. Celecoxib was used to screen for

Zusammenfassung
199
cyclooxygenase-2 (COX-2) inhibitors and diazepam to search for benzodiazepines. GAMMA
was able to enrich the upper part of a ranked database list with active molecules in both
experiments. It was possible to show that a much greater percentage of actives was enriched
in the upper part of an ordered database than can be achieved with a random selection. In a
last study, the combination of the flexible fitting of torsion angles of acyclic parts with the
ability of to generate multiple ring conformations was applied. It was shown that the method
is suitable for molecules that have a ring system of equal size and differ in the axial and
equatorial positions of their substituents but also restrictions of the method could be shown
when applied to molecules that contain rings of different size and large acyclic parts.
Zusammenfassung
200
Zusammenfassung
Das Ziel der vorliegenden Arbeit war es, eine bereits vorhandene Methode für die
Überlagerung von dreidimensionalen Molekülmodellen durch Implementierung neuer
Funktionen zu erweitern. Die flexible Überlagerung von Molekülen ist eine wichtige
Methode, um Ähnlichkeiten zwischen chemischen Verbindungen aufzufinden. Bei der
Entwicklung neuer Wirkstoffe spielt die Ermittlung von Ähnlichkeiten zwischen Molekülen
eine wichtige Rolle. Ein geeignetes Ähnlichkeitmaß ist die größte gemeinsame
dreidimensionale Substruktur (3D-MCSS) von Verbindungen. Die 3D-MCSS stellt die
räumliche Anordnung des größten gemeinsamen Strukturfragments dieser Verbindungen dar.
Das Programm GAMMA (Genetic Algorithm for Multiple Molecule Alignment) überlagert
Paare oder Gruppen von Molekülen. Der zugrunde liegende Algorithmus kombiniert einen
genetischen Algorithmus mit einer numerischen Optimierungmethode. Genetische
Algorithmen sind stochastische Optimierungmethoden, die auf den Grundregeln der Genetik
und der natürlichen Selektion basieren. Sie ahmen die natürlichen Mechanismen, sich einer
ändernden Umwelt anzupassen, nach. Die zu überlagernden Atome können aufgrund ihrer
unterschiedlichen physikochemischen Eigenschaften voneinander unterschieden werden.
Weiterhin ist es möglich Matchpaare zu erzwingen, also Atome auszuwählen, die Bestandteil
der 3D-MCSS sein sollen, oder auf die die Substruktur begrenzt werden soll. Die Selektion
des eingeschränkten Wettkampfs (engl.: Restricted Tournament Selection) (RTS) verhindert
einen Verlust an genetischer Vielfalt und verwendet die so genannte Pareto Fitness während
des Optimierungsprozesses. Da die Suche nach der 3D-MCSS ein mehrdimensionales
Problem ist, das drei gegenläufige Kriterien optimiert, die Größe der MCSS, die geometrische
Anpassung und einen Stereochemideskriptor, wurde das Konzept der Pareto Optimierung
eingeführt. Diese Optimierungstechnik liefert nicht nur eine beste 3D-MCSS pro GA
Experiment, sondern für jede möglicher Substrukturgröße wird ein Satz optimaler
geometrischer Anpassungen ausgegeben, der nicht weiter optimiert werden kann. Der hybride
genetische Algorithmus wurde erweitert, indem neue Methoden realisiert wurden. Es wurde
eine Methode implementiert, die automatisch eine optimale Lösung aus einem Satz
Pareto-optimaler Lösungen extrahiert, die durch die Selektion des eingeschränkten
Wettkampfs ermittelt wurden. Dabei ist die beste Lösung diejenige, die einem zuvor
definierten Idealpunkt am ehesten entspricht. Es wurde die so genannte Euklidische
Kompromisslösung entwickelt, die den besten Punkt dermaßen wählt, dass der Euklidische
Zusammenfassung
201
Abstand zum idealen Punkt minimal ist. Die Berechnung physikochemischer Eigenschaften
ist für den Überlagerungsprozess notwendig, da diese chemischen Merkmale als
Überlagerungskriterien dienen. Es wurde eine Methode entwickelt, die automatisch
Grenzwerte für die Werte physikochemischer Parameter berechnet. Die Grenzwerte definieren
einen Wertebereich innerhalb dem die physikochemischen Werte der Atome liegen, die
miteinander gematcht werden können. Um den Optimierungsprozess zu beschleunigen und
die Überlagerung mehrerer Tausender Verbindungen zu ermöglichen wurde der serielle
genetische Algorithmus parallelisiert. Dabei wurde das so genannte Inselmodel verwendet,
das einen Austausch genetischer Information zwischen parallelen Prozessen erlaubt.
Schließlich wurde die Flexibilität von Ringsystemen ermöglicht, indem der Algorithmus mit
einer Bibliotheksversion des 3D Strukturgenerators CORINA kombiniert wurde. Insbesondere
die Einführung der Euklidischen Kompromisslösung für Lösungen, die mit der Paretofitness
ermittelt wurden, und die automatische Berechnung von Toleranzintervallen für die
physikochemischen Eigenschaften, haben die Anwendbarkeit des Algorithmus für große
Datensätze ermöglicht. Schließlich erleichterte die Parallelisierung des hybriden genetischen
Algorithmus die Anwendung für virtuelles Screening von Substanzdatenbanken. Die neu
entwickelten Methoden wurden in mehreren Studien zur Anwendung gebracht. Für die
Datensätze der vier Studien wurden Moleküle mittlerer Größe und auch größere peptidische
Wirkstoffe ausgewählt. Für die dabei durchgeführten Überlagerungen wurde jeweils ein
benutzerdefiniertes Molekül als Templat verwendet, auf das die anderen Verbindungen mittels
konformeller Anpassung gelegt wurden. Zuerst wurden Überlagerungsstudien durchgeführt,
wobei Liganden von membranassoziierten Rezeptoren zum Einsatz kamen. Für diese
Rezeptorproteine stand keinerlei 3D Strukturinformation zur Verfügung. Der Algorithmus war
in der Lage Substrukturen zu identifizieren, die für die Rezeptorbindung relevant sind. In
einer zweiten Studie wurden die durch den Optimierungsprozess ermittelten
Molekülüberlagerungen mit den Überlagerungen der rezeptorgebundenen Liganden
verglichen. Außerdem wurde ein Vergleich der durch die berechnete Überlagerung ermittelten
Konformation mit der bioaktiven Konformation durchgeführt. Dieses Verfahren wurde an
sechs verschiedenen Datensätzen geprüft. Dabei kamen Inhibitoren der Herpes Simplex Typ-1
Thymidin Kinase, Liganden des Streptavidins, Inhibitoren der Dihydrofolatreduktase,
Inhibitoren des Thrombins, Antagonisten des Erstrogenrezeptors α und Liganden des
Penicillopepsins zur Anwendung. Alle Moleküle unterschieden sich dabei hinsichtlich Größe
und Flexibilität. Es konnte gezeigt werden, dass die Anwendung des Hybridalgorithmus

Zusammenfassung
202
sinnvolle Molekülüberlagerungen berechnet. In einer dritten Studie wurden unterschiedliche
Überlagerungskriterien an den Übergangszustandsinhibitoren der Arginase II getestet. Dabei
konnte gezeigt werden, dass im Falle fehlender Strukturinformationen des makromolekularen
Rezeptormoleküls eine Überlagerung aufgrund physikochemischer Eigenschaften die
vorzuziehende Herangehensweise ist. Im Fall, dass Wissen über die Struktur und
Anforderungen des spezifischen Rezeptors vorliegt, wie zum Beispiel welche Atome für die
Ausbildung von Wasserstoffbrückenbindungen nötig sind, ist es vorteilhaft ein Match der
entsprechenden Atome zu erzwingen. In der nächsten Studie wurde die Fähigkeit von
GAMMA aufgezeigt aus einer Datenbank flexibler Wirkstoffmoleküle Verbindungen selektiv
herauszufiltern die dem bioaktiven Anfragemolekül ähnlich sind. Dabei kam die parallele
Version des hybriden genetischen Algorithmus zur Anwendung. Es wurden zwei virtuelle
Screeningexperimente durchgeführt. Als Datenbank wurde die MDDR (MDL Drug Data
Report) verwendet, die eine typische Wirkstoffdatenbank repräsentiert. Die Verbindung
Celecoxib wurde ausgewählt, um Hemmstoffe der Cyclooxygenase-2 (COX-2)
herauszufiltern und Diazepam, um nach Benzodiazepinen zu suchen. GAMMA war dabei in
der Lage, aktive Verbindungen im oberen Abschnitt einer sortierten Datenbank anzureichern.
Es wurde gezeigt, dass ein höherer Prozentsatz aktiver Verbindungen, die dem jeweiligen
Anfragemolekül entsprechen, im oberen Abschnitt der sortierten Datenbank vorzufinden war.
In einer letzten Studie wurde die Kombination der flexiblen Überlagerung mittels Änderung
von Torsionswinkeln mit der Generierung multipler Ringkonformationen zur Anwendung
gebracht. Dabei konnte gezeigt werden, dass diese Methode für Moleküle geeignet ist, die ein
Ringsystem gleicher Größe besitzen und sich in den axialen und äquatorialen Positionen ihrer
Substituenten unterscheiden, Es konnten aber auch Einschränkungen der Anwendbarkeit bei
Molekülen mit unterschiedlicher Ringgröße und großen azyklischen Strukturelementen
aufgezeigt werden.

Bilbliography
203
Bilbliography
[1] R. F. Service, "Surviving the Blockbuster Syndrome", Science 2004, 303, 1796-1799.
[2] M. Dickson and J. P. Gagnon, "Key factors in the rising cost of new drug discovery
and development", Nat. Rev. Drug Discov. 2004, 3, 417-429.
[3] A. L. Hopkins and C. R. Groom, "The druggable genome", Nat. Rev. Drug Discov.
2002, 1, 727-730.
[4] A. P. Russ and S. Lampel, "The druggable genome: An update", Drug Discov. Today
2005, 10, 1607-1610.
[5] R. D. Cramer III, D. E. Patterson, and J. D. Bunce, "Comparative molecular field
analysis (CoMFA). 1. Effect of shape on binding of steroids to carrier proteins", J. Am.
Chem. Soc.1988, 110, 5959-5967.
[6] G. Klebe, U. Abraham, and T. Mietzner, "Molecular similarity indices in a comparative
analysis (CoMSIA) of drug molecules to correlate and predict their biological
activity", J. Med. Chem. 1994, 37, 4130-4146.
[7] E. Perola and P. S. Charifson, "Conformational Analysis of Drug-Like Molecules
Bound to Proteins: An Extensive Study of Ligand Reorganization upon Binding", J.
Med. Chem. 2004, 47, 2499-2510.
[8] R. P. Sheridan, R. Nilakantan, A. Rusinko III, N. Bauman, K. S. Haraki, and R.
Venkataraghavan, "3DSEARCH: A system for three-dimensional substructure
searching", J. Chem. Inf. Comput. Sci.. 1989, 29, 255-260.
[9] J. H. Van Drie, D. Weininger, and Y. C. Martin, "ALADDIN: an integrated tool for
computer-assisted molecular design and pharmacophore recognition from geometric,
steric, and substructure searching of three-dimensional molecular structures", J.
Comput. Aided Mol. Des. 1989, 3, 225-251.

Bilbliography
204
[10] A. T. Brint and P. Willett, "Algorithms for the identification of three-dimensional
maximal common substructures", J. Chem. Inf. Comput. Sci.. 1987, 27, 152-158.
[11] C. A. Pepperrell and P. Willett, "Techniques for the calculation of three-dimensional
structural similarity using inter-atomic distances", J. Comput. Aided Mol. Des. 1991,
5, 455-474.
[12] G. Lauri and P. A. Bartlett, "CAVEAT: a program to facilitate the design of organic
molecules", J. Comput. Aided Mol. Des. 1994, 8, 51-66.
[13] P. A. Bath, A. R. Poirrette, P. Willett, and F. H. Allen , "Similarity searching in files of
three-dimensional chemical structures: Comparison of fragment-based measures of
shape similarity", J. Chem. Inf. Comput. Sci. 1994, 34, 141-147.
[14] W. Fisanick, K. P. Cross, and A. Rusinko III, "Similarity searching on CAS registry
substances. 1. Global molecular property and generic atom triangle geometric
searching", J. Chem. Inf. Comput. Sci.. 1992, 32, 664-674.
[15] S. Handschuh, M. Wagener, and J. Gasteiger, "Superposition of three-dimensional
chemical structures allowing for conformational flexibility by a hybrid method", J.
Chem. Inf. Comput. Sci. 1998, 38, 220-232.
[16] S. Handschuh and J. Gasteiger, "The search for the spatial and electronic requirements
of a drug", J. Mol. Model. 2000, 6, 358-378.
[17] C. M. Fonseca and P. J. Fleming, “Genetic Algorithms for Multiobjective
Optimization: Formulation, Discussion and Generalization” in Genetic Algorithms:
Proceedings of the Fifth International Conference on Genetic Algorithms, Morgan
Kaufman, San Mateo, 1993, 416-423.
[18] G. Jones, "Genetic and Evolutionary Algorithms" in Encyclopedia of Computational
Chemistry, P. v. R. Schleyer, N. L. Allinger, T. Clark, J. Gasteiger, P. A. Kollman, H. F.
Schaefer III, and P. R. Schreiner (Editors), John Wiley & Sons, Inc., Chichester, UK
1998, 1127-1136.

Bilbliography
205
[19] A. W. R. Payne and R. C. Glen, "Molecular recognition using a binary genetic search
algorithm", J. Mol. Graph. 1993, 11, 74-91+121.
[20] E. Fontain, "Application of genetic algorithms in the field of constitutional similarity",
J. Chem. Inf. Comput. Sci. 1992, 32, 748-752.
[21] T. Hurst, "Flexible 3D searching: The directed tweak technique", J. Chem. Inf.
Comput. Sci. 1994, 34, 190-196.
[22] J. Sadowski, J. Gasteiger, and G. Klebe, "Comparison of automatic three-dimensional
model builders using 639 X-ray structures", J. Chem. Inf. Comput. Sci. 1994, 34,
1000-1008.
[23] A. S. Fraser, "Simulation of genetic systems by automatic digital computers. I.
Introduction", Aust. J. Biol. Sci. 1957, 10, 484-491.
[24] A. S. Fraser, "Simulation of genetic systems by automatic digital computers. II.
Effects of linkage or rates of advance under selection", Aust. J. Biol. Sci. 1957, 10,
492-499.
[25] J. H. Holland, "Outline for a logical theory of adaptive systems", JACM 1962, 9, 297-
314.
[26] Holland, J. H., Adaptation in natural and artificial systems, University of Michigan
Press, Ann Arbor 1957.
[27] Goldberg, D. E., Genetic Algorithms in Search, Optimization, and Machine Learning,
Addison-Wesley, Reading, MA 1969.
[28] D. H. Wolpert and W. G. Macready, "No free lunch theorems for optimization", IEEE
Trans. Evol. Comput. 1997, 1, 67-82.
[29] V. J. Gillet, W. Khatib, P. Willett, P. J. Fleming, and D. V. S. Green, "Combinatorial
library design using a multiobjective genetic algorithm", J. Chem. Inf. Comput. Sci.
2002, 42, 375-385.
Bilbliography
206
[30] E. Cantu-Paz, "A survey of parallel genetic algorithms", Calculateurs Paralleles,
Reseaux et Systems Repartis 1998, 10, 141-171.
[31] M. Thormann and M. Pons, "Massive docking of flexible ligands using environmental
niches in parallelized genetic algorithms", J. Comput. Chem. 2001, 22, 1971-1982.
[32] D. E. Clark, Evolutionary Algorithms in Molecular Design, R. Mannhold, H. Kubinyi,
and H. Timmerman (Editors) Wiley-VCH, Weinheim 2000.
[33] A. von Homeyer, "Evolutionary Algorithms and their Applications in Chemistry" in
Handbook of Chemoinformatics: From Data to Knowledge in 4 Volumes, J. Gasteiger
(Editor), Wiley-VCH, Weinheim 2003, 1239-1280.
[34] N. Nair and J. M. Goodman, "Genetic algorithms in conformational analysis", J.
Chem. Inf. Comput. Sci. 1998, 38, 317-320.
[35] B. Hartke, "Global cluster geometry optimization by a phenotype algorithm with
niches: Location of elusive minima, and low-order scaling with cluster size", J.
Comput. Chem. 1999, 20, 1752-1759.
[36] O. Mekenyan, D. Dimitrov, N. Nikolova, and S. Karabunarliev, "Conformational
Coverage by a Genetic Algorithm ", J. Chem. Inf. Comput. Sci. 1999, 39, 997-1016.
[37] A. Y. Jin, F. Y. Leung , and D. F. Weaver, "Three variations of genetic algorithm for
searching biomolecular conformation space: Comparison of GAP 1.0, 2.0, and 3.0", J.
Comput. Chem. 1999, 20, 1329-1342.
[38] I. D. Kuntz, J. M. Blaney, S. J. Oatley, R. Langridge, and T. E. Ferrin, "A geometric
approach to macromolecule-ligand interactions", J. Mol. Biol. 1982, 161, 269-288.
[39] C. M. Oshiro, I. D. Kuntz, and J. S. Dixon, "Flexible ligand docking using a genetic
algorithm", J. Comput. Aided Mol. Des. 1995, 9, 113-130.
[40] J. M. Yang and C. Y. Kao, "Flexible Ligand Docking Using a Robust Evolutionary
Algorithm", J. Comput. Chem. 2000, 21, 988-998.

Bilbliography
207
[41] G. Jones, P. Willett, R. C. Glen, A. R. Leach, and R. Taylor, "Development and
validation of a genetic algorithm for flexible docking", J. Mol. Biol. 1997, 267, 727-
748.
[42] G. M. Morris, D. S. Goodsell, R. S. Halliday, R. Huey, W. E. Hart, R. K. Belew, and A.
J. Olson, "Automated docking using a Lamarckian genetic algorithm and an empirical
binding free energy function", J. Comput. Chem. 1998, 19, 1639-1662.
[43] J. S. Taylor and R. M. Burnett, "DARWIN: A program for docking flexible
molecules", Proteins Struct. Funct. Genet. 2000, 41, 173-191.
[44] E. J. Gardiner, P. Willett, and P. J. Artymiuk, "Protein docking using a genetic
algorithm", Proteins Struct. Funct. Genet. 2001, 44, 44-56.
[45] A. I. Globus, J. Lawton, and T. Wipke, "Automatic molecular design using
evolutionary techniques", Nanotechnology 1999, 10, 290-299.
[46] G. Schneider, M. L. Lee, M. Stahl, and P. Schneider, "De novo design of molecular
architectures by evolutionary assembly of drug-derived building blocks", J. Comput.
Aided Mol. Des. 2000, 14, 487-494.
[47] S. C. H. Pegg, J. J. Haresco, and I. D. Kuntz, "A genetic algorithm for structure-based
de novo design", J. Comput. Aided Mol. Des. 2001, 15, 911-933.
[48] N. Budin, N. Majeux, C. Tenette-Souaille, and A. Caflisch, "Structure-based ligand
design by a build-up approach and genetic algorithm search in conformational space",
J. Comput. Chem. 2001, 22, 1956-1970.
[49] G. Jones, P. Willett, and R. C. Glen, "A genetic algorithm for flexible molecular
overlay and pharmacophore elucidation", J. Comput. Aided Mol. Des. 1995, 9, 532-
549.
[50] J. D. Holliday and P. Willett, "Using a genetic algorithm to identify common structural
features in sets of ligands", J. Mol. Graph. Model. 1997, 15, 221-232.

Bilbliography
208
[51] S. J. Cho and Y. Sun, "FLAME: A program to flexibly align molecules", J. Chem. Inf.
Model. 2006, 46, 298-306.
[52] N. J. Richmond, C. A. Abrams, P. R. N. Wolohan, E. Abrahamian, P. Willett, and R. D.
Clark, "GALAHAD: 1. Pharmacophore identification by hypermolecular alignment of
ligands in 3D", J. Comput. Aided Mol. Des. 2006, 20, 567-587.
[53] D. E. Walters and R. M. Hinds, "Genetically evolved receptor models: A
computational approach to construction of receptor models", J. Med. Chem. 1994, 37,
2527-2536.
[54] J. Pei, J. Zhou, G. Xie, H. Chen, and X. He, "PARM: A practical utility for drug
design", J. Mol. Graph. Model. 2001, 19, 448-454.
[55] A. Vedani and M. Dobler, "5D-QSAR: The key for simulating induced fit?", J. Med.
Chem. 2002, 45, 2139-2149.
[56] Wagener, M, and J. Gasteiger, "The Determination of Maximum Common
Substructures by a Genetic Algorithm: Application in Synthesis Design and for the
Structural Analysis of Biological Activity", Angew. Chem. Int. Ed. 1994, 33, 1189-
1192.
[57] R. D. Brown, G. Jones, P. Willett, and R. C. Glen, "Matching two-dimensional
chemical graphs using Genetic Algorithms", J. Chem. Inf. Comput. Sci. 1994, 34, 63-
70.
[58] N. Brown, B. McKay, F. Gilardoni, and J. Gasteiger, "A graph-based genetic algorithm
and its application to the multiobjective evolution of median molecules", J. Chem. Inf.
Comput. Sci. 2004, 44, 1079-1087.
[59] D. J. Wild and P. Willett, "Similarity searching in files of three-dimensional chemical
structures. Alignment of molecular electrostatic potential fields with a genetic
algorithm", J. Chem. Inf. Comput. Sci. 1996, 36, 159-167.

Bilbliography
209
[60] N. E. Jewell, D. B. Turner, P. Willett, and G. J. Sexton, "Automatic generation of
alignments for 3D QSAR analyses", J. Mol. Graph. Model. 2001, 20, 111-121.
[61] K. W. Lee and J. M. Briggs, "Comparative molecular field analysis (CoMFA) study of
epothilones-tubulin depolymerization inhibitors: Pharmacophore development using
3D QSAR methods", J. Comput. Aided Mol. Des. 2001, 15, 41-55.
[62] A. Yasri and D. Hartsough, "Toward an Optimal Procedure for Variable Selection and
QSAR Model Building", J. Chem. Inf. Comput. Sci. 2001, 41, 1218-1227.
[63] Z. Daren, "QSPR studies of PCBs by the combination of genetic algorithms and PLS
analysis", Comput. Chem. 2001, 25, 197-204.
[64] G. W. Kauffman and P. C. Jurs, "QSAR and k-Nearest Neighbor Classification
Analysis of Selective Cyclooxygenase-2 Inhibitors Using Topologically-Based
Numerical Descriptors", J. Chem. Inf. Comput. Sci. 2001, 41, 1553-1560.
[65] H. Gao, M. S. Lajiness , and J. V. Drie, "Enhancement of binary QSAR analysis by a
GA-based variable selection method", J. Mol. Graph. Model. 2002, 20, 259-268.
[66] S. J. Cho and M. A. Hermsmeier, "Genetic algorithm guided selection: Variable
selection and subset selection", J. Chem. Inf. Comput. Sci. 2002, 42, 927-936.
[67] D. G. Landavazo, G. B. Fogel, and D. B. Fogel, "Quantitative structure-activity
relationships by evolved neural networks for the inhibition of dihydrofolate reductase
by pyrimidines", BioSystems 2002, 65, 37-47.
[68] R. P. Sheridan and S. K. Kearsley, "Using a genetic algorithm to suggest combinatorial
libraries", J. Chem. Inf. Comput. Sci.. 1995, 35, 310-320.
[69] M. D. Miller, R. P. Sheridan, and S. K. Kearsley, "SQ: A program for rapidly
producing pharmacophorically relevent molecular superpositions", J. Med. Chem.
1999, 42, 1505-1514.
[70] R. P. Sheridan, S. G. SanFeliciano, and S. K. Kearsley, "Designing targeted libraries
with genetic algorithms", J. Mol. Graph. Model. 2000, 18.

Bilbliography
210
[71] K. Illgen, T. Enderle, C. Broger, and L. Weber, "Simulated molecular evolution in a
full combinatorial library", Chem. Biol. 2000, 7, 433-441.
[72] L. Xue, J. W. Godden, and J. Bajorath, "Evaluation of descriptors and mini-
fingerprints for the identification of molecules with similar activity", J. Chem. Inf.
Comput. Sci. 2000, 40, 1227-1234.
[73] R. nig and T. Dandekar , "Refined genetic algorithm simulations to model proteins", J.
Mol. Model. 1999, 5, 317-324.
[74] N. Gibbs, A. R. Clarke , and R. B. Sessions, "Ab initio protein structure prediction
using physicochemical potentials and a simplified off-lattice model", Proteins Struct.
Funct. Genet. 2001, 43, 186-202.
[75] B. A. Shapiro, J. C. Wu, D. Bengali, and M. J. Potts, "The massively parallel genetic
algorithm for RNA folding: MIMD implementation and population variation",
Bioinformatics 2001, 17, 137-148.
[76] B. A. Shapiro, D. Bengali, W. Kasprzak, and J. C. Wu, "RNA folding pathway
functional intermediates: Their prediction and analysis", J. Mol. Biol. 2001, 312, 27-
44.
[77] C. Lemmen and T. Lengauer, "Computational methods for the structural alignment of
molecules", J. Comput. Aided Mol. Des. 2000, 14, 215-232.
[78] J. W. M. Nissink, M. L. Verdonk, J. Kroon, T. Mietzner, and G. Klebe, "Superposition
of molecules: Electron density fitting by application of fourier transforms", J. Comput.
Chem. 1997, 18, 638-645.
[79] M. Cocchi and P. G. De Benedetti, "Use of the supermolecule approach to derive
molecular similarity descriptors for QSAR analysis", J. Mol. Model. 1998, 4, 113-131.
[80] F. Melani, P. Gratteri , M. Adamo, and C. Bonaccini, "Field interaction and
geometrical overlap: A new simplex and experimental design based computational

Bilbliography
211
procedure for superposing small ligand molecules", J. Med. Chem. 2003, 46, 1359-
1371.
[81] C. Lemmen, C. Hiller, and T. Lengauer, "RigFit: A new approach to superimposing
ligand molecules", J. Comput. Aided Mol. Des. 1998, 12, 491-502.
[82] C. Lemmen and T. Lengauer, "Time-efficient flexible superposition of medium-sized
molecules", J. Comput. Aided Mol. Des. 1997, 11, 357-368.
[83] C. Lemmen, T. Lengauer , and G. Klebe, "FLEXS: A method for fast flexible ligand
superposition", J. Med. Chem. 1998, 41, 4502-4520.
[84] D. A. Cosgrove, D. M. Bayada, and A. P. Johnson, "A novel method of aligning
molecules by local surface shape similarity", J. Comput. Aided Mol. Des. 2000, 14,
573-591.
[85] B. B. Goldman and W. T. Wipke, "Quadratic Shape Descriptors. 1. Rapid
Superposition of Dissimilar Molecules Using Geometrically Invariant Surface
Descriptors", J. Chem. Inf. Comput. Sci. 2000, 40, 644-658.
[86] P. Bultinck, T. Kuppens, X. Gironés, and R. Dorca, "Quantum similarity superposition
algorithm (QSSA): A consistent scheme for molecular alignment and molecular
similarity based on quantum chemistry", J. Chem. Inf. Comput. Sci. 2003, 43, 1143-
1150.
[87] N. J. Richmond, P. Willett, and R. D. Clark, "Alignment of three-dimensional
molecules using an image recognition algorithm", J. Mol. Graph. Model. 2004, 23,
199-209.
[88] K. Iwase and S. Hirono , "Estimation of active conformations of drugs by a new
molecular superposing procedure", J. Comput. Aided Mol. Des. 1999, 13, 499-512.
[89] Y. C. Martin, M. G. Bures, E. A. Danaher, J. DeLazzer, I. Lico, and P. A. Pavlik, "A
fast new approach to pharmacophore mapping and its application to dopaminergic and
benzodiazepine agonists", J. Comput. Aided Mol. Des. 1993, 7, 83-102.

Bilbliography
212
[90] D. Barnum, J. Greene, A. Smellie, and P. Sprague, "Identification of common
functional configurations among molecules", J. Chem. Inf. Comput. Sci. 1996, 36,
563-571.
[91] M. D. Miller, R. P. Sheridan, and S. K. Kearsley, "SQ: A program for rapidly
producing pharmacophorically relevent molecular superpositions", J. Med. Chem.
1999, 42, 1505-1514.
[92] B. B. Masek, A. Merchant, and J. B. Matthew, "Molecular shape comparison of
angiotensin II receptor antagonists", J. Med. Chem. 1993, 36, 1230-1238.
[93] J. Mestres, D. C. Rohrer, and G. M. Maggiora, "MIMIC: A molecular-field matching
program. Exploiting applicability of molecular similarity approaches", J. Comput.
Chem. 1997, 18, 934-954.
[94] A. J. Tervo, T. Rönkkö, T. H. Nyrönen, and A. Poso, "BRUTUS: Optimization of a
grid-based similarity function for rigid-body molecular superposition. 1. Alignment
and virtual screening applications", J. Med. Chem. 2005, 48, 4076-4086.
[95] M. Arakawa, K. Hasegawa, and K. Funatsu, "Novel Alignment Method of Small
Molecules Using the Hopfield Neural Network", J. Chem. Inf. Comput. Sci. 2003, 43,
1390-1395.
[96] M. Arakawa, K. Hasegawa, and K. Funatsu, "Application of the Novel Molecular
Alignment Method Using the Hopfield Neural Network to 3D-QSAR", J. Chem. Inf.
Comput. Sci. 2003, 43, 1396-1402.
[97] P. M. Kroonenberg, W. J. Dunn III, and J. J. F. Commandeur, "Consensus Molecular
Alignment Based on Generalized Procrustes Analysis", J. Chem. Inf. Comput. Sci.
2003, 43, 2025-2032.
[98] S. K. Kearsley and G. M. Smith, "An alternative method for the alignment of
molecular structures: Maximizing electrostatic and steric overlap", Tetrahedron
Comput. Methodol. 1990, 3, 615-633.

Bilbliography
213
[99] G. Klebe, T. Mietzner, and F. Weber, "Methodological developments and strategies for
a fast flexible superposition of drug-size molecules", J. Comput. Aided Mol. Des.
1999, 13, 35-49.
[100] M. Feher and J. M. Schmidt, "Multiple flexible alignment with SEAL: a study of
molecules acting on the colchicine binding site", J. Chem. Inf. Comput. Sci. 2000, 40,
495-502.
[101] T. D. Perkins, J. E. Mills, and P. M. Dean, "Molecular surface-volume and property
matching to superpose flexible dissimilar molecules", J. Comput. Aided Mol. Des.
1995, 9, 479-490.
[102] A. Kramer, H. W. Horn, and J. E. Rice, "Fast 3D molecular superposition and
similarity search in databases of flexible molecules", J. Comput. Aided Mol. Des.
2003, 17, 13-38.
[103] M. C. Pitman, W. K. Huber, H. Horn, A. mer, J. E. Rice, and W. C. Swope,
"Flashflood: A 3D field-based similarity search and alignment method for flexible
molecules", J. Comput. Aided Mol. Des. 2001, 15, 587-612.
[104] A. N. Jain, "Ligand-Based Structural Hypotheses for Virtual Screening", J. Med.
Chem. 2004, 47, 947-961.
[105] X. Gironés, D. Robert, and R. Dorca, "TGSA: A Molecular Superposition Program
Based on Topo-Geometrical Considerations", J. Comput. Chem. 2001, 22, 255-263.
[106] X. Gironés and R. Dorca, "TGSA-Flex: Extending the Capabilities of the Topo-
Geometrical Superposition Algorithm to Handle Flexible Molecules", J. Comput.
Chem. 2004, 25, 153-159.
[107] S. P. Korhonen, K. Tuppurainen, R. Laatikainen, and M. Peräkylä, "FLUFF-BALL, A
Template-Based Grid-Independent Superposition and QSAR Technique: Validation
Using a Benchmark Steroid Data Set", J. Chem. Inf. Comput. Sci. 2003, 43, 1780-
1793.

Bilbliography
214
[108] R. P. Sheridan, R. Nilakantan, J. S. Dixon, and R. Venkataraghavan, "The ensemble
approach to distance geometry: Application to the nicotinic pharmacophore", J. Med.
Chem. 1986, 29, 899-906.
[109] P. Labute and C. Williams, "Flexible alignment of small molecules", J. Med. Chem.
2001, 44, 1483-1490.
[110] C. McMartin and R. S. Bohacek, "Flexible matching of test ligands to a 3D
pharmacophore using a molecular superposition force field: comparison of predicted
and experimental conformations of inhibitors of three enzymes", J. Comput. Aided
Mol. Des. 1995, 9, 237-250.
[111] J. E. J. Mills, I. J. P. de Esch, T. D. J. Perkins, and P. M. Dean, "SLATE: A method for
the superposition of flexible ligands", J. Comput. Aided Mol. Des. 2001, 15, 81-96.
[112] G. Jones, P. Willett, and R. C. Glen, "A genetic algorithm for flexible molecular
overlay and pharmacophore elucidation", J. Comput. Aided Mol. Des. 1995, 9, 532-
549.
[113] Y. Patel, V. J. Gillet, G. Bravi, and A. R. Leach, "A comparison of the pharmacophore
identification programs: Catalyst, DISCO and GASP", J. Comput. Aided Mol. Des.
2002, 16, 653-681.
[114] M. H. J. Seifert, "ProPose: Steered virtual screening by simultaneous protein - Ligand
docking and ligand - Ligand alignment", J. Chem. Inf. Model. 2005, 45, 449-460.
[115] M. J. L. de Hoon, S. Imoto, J. Nolan, and S. Miyano, "Open source clustering
software", Bioinformatics 2004, 20, 1453-1454.
[116] Statist version 1.0.1, 2001, Universität Osnabrück, D. Melcher,
http://www.usf.uni-osnabrueck.de/~breiter/tools/statist.
[117] J. M. Chandonia, G. Hon, N. S. Walker, L. Lo Conte, P. Koehl, M. Levitt, and S. E.
Brenner, "The ASTRAL Compendium in 2004", Nucleic Acids Res. 2004, 32.

Bilbliography
215
[118] H. M. Berman, J. Westbrook, Z. Feng, G. Gilliland, T. N. Bhat, H. Weissig, I. N.
Shindyalov, and P. E. Bourne, "The Protein Data Bank", Nucleic Acids Res. 2000, 28,
235-242.
[119] A. Andreeva, D. Howorth, S. E. Brenner, T. J. P. Hubbard, C. Chothia, and A. G.
Murzin, "SCOP database in 2004: Refinements integrate structure and sequence
family data", Nucleic Acids Res. 2004, 32.
[120] J. D. Thompson, D. G. Higgins, and J. K. Gierse, "CLUSTAL W: improving the
sensitivity of progressive multiple sequence alignment through sequence weighting,
position-specific gap penalties and weight matrix choice", Nucleic Acids Res. 1994,
22, 4673-4680.
[121] N. Saitou and M. Nei, "The neighbor-joining method: a new method for reconstructing
phylogenetic trees", Mol. Biol. Evol. 1987, 4, 406-425.
[122] M. Clamp, J. Cuff, S. M. Searle, and G. J. Barton, "The Jalview Java alignment
editor", Bioinformatics 2004, 20, 426-427.
[123] M. Hendlich, A. Bergner, J. Gunther, and G. Klebe, "Relibase: Design and
development of a database for comprehensive analysis of protein-ligand interactions",
J. Mol. Biol. 2003, 326, 607-620.
[124] D. J. Lipman and W. R. Pearson, "Rapid and sensitive protein similarity searches",
Science 1985, 227, 1435-1441.
[125] H. M. Berman, J. Westbrook, Z. Feng, G. Gilliland, T. N. Bhat, H. Weissig, I. N.
Shindyalov, and P. E. Bourne, "The Protein Data Bank", Nucleic Acids Res. 2000, 28,
235-242.
[126] E. W. Myers and W. Miller, "Optimal alignments in linear space", Comput. Appl.
Biosci. 1988, 4, 11-17.
[127] CORINA, 2005, Erlangen, Germany, Molecular Networks GmbH,
http://www.mol-net.com.

Bilbliography
216
[128] R. Wang, Y. Gao, and L. Lai, "Calculating partition coefficient by atom-additive
method", Perspect. Drug Discov. Des. 2000, 19, 47-66.
[129] J. Gasteiger and M. Marsili, "Iterative partial equalization of orbital electronegativity--
a rapid access to atomic charges", Tetrahedron 1980, 36, 3219-3228.
[130] J. Gasteiger and H. Saller, "Calculation of Charge Distribution in ConjugatedSystems
by a Quantification of the Resonance Concept", Angew. Chem. Int. Ed. 1985, 24, 687-
689.
[131] T. Kleinöder, "Prediction of Properties of Organic Compounds - Empirical Methods
and Management of Property Data", University Erlangen-Nürnberg, 2005.
[132] J. Gasteiger and M. D. Hutchings, "Quantification of effective polarisability.
Applications to studies of X-ray photoelectron spectroscopy and alkylamine
protonation", J. Chem. Soc., Perkin Trans. 2, 1984, 559-564.
[133] A. Herwig, "Development of an Integrated Framework for Chemoinformatics
Applications", University Erlangen-Nürnberg, 2004.
[134] Roche Applied Science, "Roche Applied Science's Biochemical Pathways", 2006,
Swiss Institute of Bioinformatics (SIB).
[135] G. Michal, Biochemical Pathways. Biochemie-Atlas, Spektrum Akademischer Verlag,
Heidelberg, Germany 1999.
[136] M. Kanehisa, S. Goto, M. Hattori, K. F. Aoki-Kinoshita, M. Itoh, S. Kawashima, T.
Katayama, M. Araki, and M. Hirakawa, "From genomics to chemical genomics: new
developments in KEGG", Nucleic Acids Res. 2006, 34.
[137] P. R. Romero and P. D. Karp, "Using functional and organizational information to
improve genome-wide computational prediction of transcription units on pathway-
genome databases", Bioinformatics 2004, 20, 709-717.
[138] R. Caspi, H. Foerster , C. A. Fulcher, R. Hopkinson, J. Ingraham, P. Kaipa, M.
Krummenacker, S. Paley, J. Pick, S. Y. Rhee, C. Tissier, P. Zhang, and P. D. Karp,

Bilbliography
217
"MetaCyc: a multiorganism database of metabolic pathways and enzymes", Nucleic
Acids Res. 2006, 34.
[139] C@ROL, 2006, Erlangen, Germany, Molecular Networks GmbH,
http://www.mol-net.com.
[140] MDL® Drug Data Report, 2005, San Ramon, CA, USA, Elsevier MDL,
http://www.mdl.com.
[141] ISIS/BASE, 2006, San Ramon, CA, USA, Elsevier MDL, http://www.mdl.com.
[142] WebLab Viewer Lite, 1998, Accelrys, http://www.accelrys.com, antes MSI.
[143] RasTop, 2001, P. Valadon, http://www.geneinfinity.org/rastop.
[144] J. E. Baker, “Reducing Bias and Inefficiency in the Selection Algorithm” in
Proceedings of the Second International Conference on Genetic Algorithms and their
application, J. J. Grafenstette (Editor), Lawrence Erlbaum Associates, Mahwah,
1987,14-21.
[145] J. E. Baker, “Adaptive Selection Methods for Genetic Algorithms” in Proceedings of
the 1st Internatiuonal Conference on Genetic Algorithms, Lawrence Erlbaum
Associates, Mahwah, 1985,101-111.
[146] G. R. Harik, “Finding Multimodal Solutions Using Restricted Tournament Selection”
in Proceedings of the Sixth International Conference on Genetic Algorithms, L.
Eshelman (Editor), Morgan Kaufmann, San Francisco, 1995, 24-31.
[147] P. L. Yu, "A class of solutions for group decision problems", Management Science
1973, 19, 936-946.
[148] W. H. Press, B. P. Flannery, S. A. Teukolsky, W. T. Vetterling, Numerical recipes in C:
The art of scientific computing, Cambridge University Press, 1997.
[149] A. von Homeyer and J. Gasteiger, "Computer Simulations of Enzyme Reaction
Mechanisms: Application of a Hybrid Genetic Algorithm for the Superimposition of
Bilbliography
218
Three-Dimensional Chemical Structures" in High Performance Computing in Science
and Engineering, S. Wagner, W. Hanke, A. Bode, and F. Durst (Editors), Springer,
Heidelberg 2004, 261-271.
[150] S. S. Jhee, T. Shiovitz, A. W. Crawford, and N. R. Cutler, "Pharmacokinetics and
pharmacodynamics of the triptan antimigraine agents: A comparative review", Clin.
Pharmacokinet. 2001, 40, 189-205.
[151] P. J. Goadsby and R. B. Lipton, "Newer triptans: Emphasis on rizatriptan", Neurology
2000, 55.
[152] B. Pham, "A systematic review of the use of triptans in acute migraine", Can. J.
Neurolog. Sci. 2001, 28, 272.
[153] N. M. Ramadan, V. Skljarevski, L. A. Phebus, and K. W. Johnson, "5-HT1F receptor
agonists in acute migraine treatment: A hypothesis", Cephalalgia 2003, 23, 776-785.
[154] C. Malerczyk, B. Fuchs, G. G. Belz, S. Roll, K. Breithaupt-Grögler, V. Herrmann , S.
G. Magin, A. Högemann, B. Voith, and E. Mutschler, " Angiotensin II antagonists and
plasma radioreceptor-kinetics of candesartan in man", Br. J. Clin. Pharmacol. 1998,
45, 567-573.
[155] A. Mitchell, U. Rushentsova, W. Siffert, T. Philipp, and R. R. Wenzel, "The
angiotensin II receptor antagonist valsartan inhibits endothelin 1-induced
vasoconstriction in the skin microcirculation in humans in vivo: Influence of the G-
protein [beta]3 subunit (GNB3) C825T polymorphism[ast]", Clin. Pharmacol. Ther.
2006, 79, 274-281.
[156] M. A. Adams and L. Trudeau, "Irbesartan: Review of pharmacology and comparative
properties", Can. J. Clin. Pharmacol. 2000, 7, 22-31.
[157] R. Hübner and W. Fuchs, "Rezeptorkinetik von AT1-Rezeptorantagonisten", Pharm.
Unserer Zeit 2001, 30, 304-307.

Bilbliography
219
[158] H. J. Bohm and G. Klebe, "What can we learn from molecular recognition in protein-
ligand complexes for the design of new drugs?", Angew. Chem. Int. Ed. 1996, 35,
2588-2614.
[159] A. Gardberg, L. Shuvalova, C. Monnerjahn, M. Konrad, and A. Lavie, "Structural
basis for the dual thymidine and thymidylate kinase activity of herpes thymidine
kinases", Structure 2003, 11, 1265-1277.
[160] C. Wurth, U. Kessler, J. Vogt, G. E. Schulz, G. Folkers, and L. Scapozza, "The effect of
substrate binding on the conformation and structural stability of Herpes simplex virus
type 1 thymidine kinase", Protein Sci. 2001, 10, 63-73.
[161] A. Prota, J. Vogt, B. Pilger, R. Perozzo, C. Wurth, V. E. Marquez, P. Russ, G. E.
Schulz, G. Folkers , and L. Scapozza, "Kinetics and crystal structure of the wild-type
and the engineered Y101F mutant of Herpes simplex virus type 1 thymidine kinase
interacting with (North)-methanocarba-thymidine", Biochemistry 2000, 39, 9597-
9603.
[162] J. N. Champness, M. S. Bennett, F. Wien, R. Visse, W. C. Summers, P. Herdewijn, E.
De Clercq, T. Ostrowski, R. L. Jarvest, and M. R. Sanderson, "Exploring the active
site of herpes simplex virus type-1 thymidine kinase by X-ray crystallography of
complexes with aciclovir and other ligands ", Proteins Struct. Funct. Genet. 1998, 32,
350-361.
[163] P. C. Weber, M. W. Pantoliano, D. M. Simons, and F. R. Salemme, "Structure-based
design of synthetic azobenzene ligands for streptavidin", J. Am. Chem. Soc. 1994, 116,
2717-2724.
[164] C. Oefner, A. D'Arcy, and F. K. Winkler, "Crystal structure of human dihydrofolate
reductase complexed with folate", Eur. J. Biochem. 1988, 174, 377-385.
[165] V. Cody, J. R. Luft, and W. Pangborn, "Understanding the role of Leu22 variants in
methotrexate resistance: Comparison of wild-type and Leu22Arg variant mouse and
human dihydrofolate reductase ternary crystal complexes with methotrexate and
NADPH", Acta Crystallogr. Sect. D: Biol. Crystallogr. 2005, 61, 147-155.

Bilbliography
220
[166] V. Cody, N. Galitsky, J. R. Luft, W. Pangborn, and A. Gangjee, "Analysis of two
polymorphic forms of a pyrido[2,3-d]pyrimidine N9-C10 reversed-bridge antifolate
binary complex with human dihydrofolate reductase", Acta Crystallogr. Sect. D
Biol.Crystallogr. 2003, 59, 654-661.
[167] A. E. Klon, A. roux, L. J. Ross, V. Pathak, C. A. Johnson, J. R. Piper, and D. W.
Borhani, "Atomic structures of human dihydrofolate reductase complexed with
NADPH and two lipophilic antifolates at 1.09 Å and 1.05 Å resolution", J. Mol. Biol.
2002, 320, 677-693.
[168] H. Kubinyi, "Hydrogen Bonding, the Last Mystery in Drug Design?" in
Pharmacokinetic Optimization in Drug Research. Biological, Physicochemical, and
Computational Strategies, B. Testa, H. van de Waaterbemd, G. Folkers, and R. Guy
(Editors), Helvetica Chimica Acta and Wiley-VCH, Zürich 2001, 513-524.
[169] F. Dullweber, M. T. Stubbs, D. Musil, J. Stuerzebecher, and G. Klebe, "Factorising
ligand affinity: A Combined thermodynamic and crystallographic study of trypsin and
thrombin inhibition", J. Mol. Biol. 2001, 313, 593-614.
[170] P. C. Weber, "Kinetic and crystallographic studies of thrombin with Ac-(D)Phe-Pro-
boroArg-OH and its lysine, amidine, homolysine, and ornithine analogs",
Biochemistry 1995, 34, 3750-3757.
[171] Q. Tan, T. A. Blizzard, J. D. Morgan II, E. T. Birzin, W. Chan, Y. T. Yang, L. Y. Pai, E.
C. Hayes, C. A. Dasilva, S. Warrier, J. Yudkovitz, H. A. Wilkinson, N. Sharma, P. M.
D. Fitzgerald, S. Li, L. Colwell, J. E. Fisher, S. Adamski, A. A. Reszka, D. Kimmel, F.
Dininno, S. P. Rohrer, L. P. Freedman, J. M. Schaeffer, and M. L. Hammond,
"Estrogen receptor ligands. Part 10: Chromanes: Old scaffolds for new SERAMs",
Bioorg. Med. Chem. Lett. 2005, 15, 1675-1681.
[172] T. A. Blizzard, F. Dininno, J. D. Morgan II, H. Y. Chen , J. Y. Wu, S. Kim, W. Chan, E.
T. Birzin, Y. T. Yang, L. Y. Pai, P. M. D. Fitzgerald, N. Sharma, Y. Li, Z. Zhang, E. C.
Hayes, C. A. Dasilva, W. Tang, S. P. Rohrer, J. M. Schaeffer, and M. L. Hammond,
"Estrogen receptor ligands. Part 9: Dihydrobenzoxathiin SERAMs with alkyl

Bilbliography
221
substituted pyrrolidine side chains and linkers", Bioorg. Med. Chem. Lett. 2005, 15,
107-113.
[173] M. E. Fraser, N. C. J. Strynadka, P. A. Bartlett, J. E. Hanson, and M. N. G. James,
"Crystallographic analysis of transition-state mimics bound to penicillopepsin:
Phosphorus-containing peptide analogues", Biochemistry 1992, 31, 5201-5214.
[174] A. R. Khan, J. C. Parrish, M. E. Fraser, W. W. Smith, P. A. Bartlett, and M. N. G.
James , "Lowering the entropic barrier for binding conformationally flexible inhibitors
to enzymes", Biochemistry 1998, 37, 16839-16845.
[175] M. N. G. James, A. R. Sielecki, K. Hayakawa, and M. H. Gelb, "Crystallographic
analysis of transition state mimics bound to penicillopepsin: Difluorostatine- and
difluorostatone-containing peptides", Biochemistry 1992, 31, 3872-3886.
[176] S. Borman, "Much ado about enzyme mechanisms", Chem. Eng. News 2004, 82, 35-
39.
[177] X. Zhang and K. N. Houk, "Why enzymes are proficient catalysts: Beyond the pauling
paradigm", Acc. Chem. Res. 2005, 38, 379-385.
[178] L. Pauling, "Nature of forces between large molecules of biological interest 3", Nature
1948, 161, 707-709.
[179] L. Pauling, "Molecular architecture and biological reactions 2", Chem. Engng News
1946, 24, 1375-1377.
[180] J. G. Robertson, "Mechanistic basis of enzyme-targeted drugs", Biochemistry 2005, 44,
5561-5571.
[181] M. Reitz, O. Sacher, A. Tarkhov, D. mbach, and J. Gasteiger, "Enabling the
exploration of biochemical pathways", Org. Biomol. Chem. 2004, 2, 3226-3237.
[182] G. S. Hammond, "A correlation of reaction rates 12", J. Am. Chem. Soc. 1955, 77, 334-
338.
Bilbliography
222
[183] W. D. Ihlenfeldt, Y. Takahashi, H. Abe, and S. Sasaki, "Computation and management
of chemical properties in CACTVS: An extensible networked approach toward
modularity and compatibility", J. Chem. Inf. Comput. Sci. 1994, 34, 109-116.
[184] J. Gasteiger, "Empirical Methods for the Calculation of Physicochemical Data of
Organic Compounds" in Physical Property Prediction in Organic Chemistry, C.
Jochum, M. G. Hicks, and J. Sunkel (Editors), Springer-Verlag, Heidelberg 1988, 119-
138.
[185] E. Cama, H. Shin, and D. W. Christianson, "Design of Amino Acid Sulfonamides as
Transition-State Analogue Inhibitors of Arginase", J. Am. Chem. Soc. 2003, 125,
13052-13057.
[186] N. N. Kim, J. D. Cox, R. F. Baggio, F. A. Emig, S. K. Mistry, S. L. Harper, D. W.
Speicher, S. M. Morris, D. E. Ash, A. Traish, and D. W. Christianson, "Probing erectile
function: S-(2-boronoethyl)-L-cysteine binds to arginase as a transition state analogue
and enhances smooth muscle relaxation in human penile corpus cavernosum",
Biochemistry 2001, 40, 2678-2688.
[187] J. D. Cox, N. N. Kim, A. M. Traish, and D. W. Christianson, "Arginase-boronic acid
complex highlights a physiological role in erectile function", Nat. Struct. Biol. 1999, 6,
1043-1047.
[188] E. Cama, D. M. Colleluori, F. A. Emig, H. Shin, S. W. Kim, N. N. Kim, A. M. Traish,
D. E. Ash, and D. W. Christianson, "Human arginase II: Crystal structure and
physiological role in male and female sexual arousal", Biochemistry 2003, 42, 8445-
8451.
[189] B. K. Shoichet, "Virtual screening of chemical libraries", Nature 2004, 432, 862-865.
[190] G. Klebe, "Virtual ligand screening: strategies, perspectives and limitations", Drug
Discov. Today 2006, 11, 580-594.
[191] W. Patrick Walters, M. T. Stahl, and M. A. Murcko, "Virtual screening - An overview",
Drug Discov. Today 1998, 3, 160-178.

Bilbliography
223
[192] H.-J. Böhm and G. Schneider, “Virtual Screening for Bioactive Molecules” in Methods
and Principles in Medicinal Chemistry, R. Mannhold, H. Kubinyi, and H. Timmerman
(Editors) Wiley-VCH, Weinheim 2000.
[193] A. F. Warr, "High-Throughput Chemistry" in Handbook of Chemoinformatics: From
Data to Knowledge, 4 Volume Set ,Vol. 4, J. Gasteiger (Editor), Wiley-VCH, Weinheim
2003, 1604-1639.
[194] S. K. Kearsley, D. J. Underwood, R. P. Sheridan, and M. D. Miller, "Flexibases: a way
to enhance the use of molecular docking methods", J. Comput. Aided Mol. Des. 1994,
8, 565-582.
[195] C. A. Lipinski, F. Lombardo, B. W. Dominy, and P. J. Feeney, "Experimental and
computational approaches to estimate solubility and permeability in drug discovery
and development settings", Adv. Drug Deliv. Rev. 1997, 23, 3-25.
[196] H. Xu, "Retrospect and prospect of virtual screening in drug discovery", Curr. Top.
Med. Chem. 2002, 2, 1305-1320.
[197] T. I. Oprea, "Property distribution of drug-related chemical databases", J. Comput.
Aided Mol. Des. 2000, 14, 251-264.
[198] J. Sadowski, J. Gasteiger, and G. Klebe, "Comparison of automatic three-dimensional
model builders using 639 X-ray structures", J. Chem. Inf. Comput. Sci. 1994, 34,
1000-1008.
[199] CORINA, 2005, Erlangen, Germany, Molecular Networks GmbH, http://www.mol-
net.com.
[200] R. G. Kurumbail, J. R. Kiefer, and L. J. Marnett, "Cyclooxygenase enzymes: Catalysis
and inhibition", Curr. Opin. Struct. Biol. 2001, 11, 752-760.
[201] R. G. Kurumbail, A. M. Stevens, J. K. Gierse, J. J. McDonald, R. A. Stegeman, J. Y.
Pak, D. Gildehaus, J. M. Miyashiro, T. D. Penning, K. Seibert, P. C. Isakson, and W.
Bilbliography
224
C. Stallings, "Structural basis for selective inhibition of cyciooxygenase-2 by anti-
inflammatory agents", Nature 1996, 384, 644-648.
[202] C. Bombardier, L. Laine, A. Reicin, D. Shapiro, R. Burgos-Vargas, B. Davis, R. Day,
M. B. Ferraz, C. J. Hawkey, M. C. Hochberg, T. K. Kvien, and T. J. Schnitzer,
"Comparison of upper gastrointestinal toxicity of rofecoxib and naproxen in patients
with rheumatoid arthritis", New Engl. J. Med. 2000, 343, 1520-1528.
[203] K. Kashfi and B. Rigas, "Non-COX-2 targets and cancer: Expanding the molecular
target repertoire of chemoprevention", Biochem. Pharmacol. 2005, 70, 969-986.
[204] R. M. McKernan and P. J. Whiting, "Which GABAA-receptor subtypes really occur in
the brain?", Trends Neurosci. 1996, 19, 139-143.
[205] M. G. Bock, R. M. DiPardo, B. E. Evans, K. E. Rittle, W. L. Whitter, D. F. Veber, P. S.
Anderson, and R. M. Freidinger, "Benzodiazepine gastrin and brain cholecystokinin
receptor ligands: L-365,260", J. Med. Chem. 1989, 32, 13-16.
[206] G. L. James, J. L. Goldstein, M. S. Brown, T. E. Rawson, T. C. Somers, R. S.
McDowell, C. W. Crowley, B. K. Lucas, A. D. Levinson, and J. Marsters,
"Benzodiazepine peptidomimetics: Potent inhibitors of Ras farnesylation in animal
cells", Science 1993, 260, 1937-1942.
[207] C. Breitenlechner, M. Gassel, H. Hidaka, V. Kinzel, R. Huber, R. A. Engh, and D.
Bossemeyer, "Protein Kinase a in Complex with Rho-Kinase Inhibitors Y-27632,
Fasudil, and H-1152P: Structural Basis of Selectivity", Structure 2003, 11, 1595-1607.
[208] R. A. Engh, A. Girod, V. Kinzel, R. Huber, and D. Bossemeyer, "Crystal structures of
catalytic subunit of cAMP-dependent protein kinase in complex with
isoquinolinesulfonyl protein kinase inhibitors H7, H8, and H89", J. Biol. Chem. 1996,
271, 26157-26164.

A Program Description of GAMMA 2.7
225
Appendix
A. Program Description of GAMMA 2.7
GAMMA has a command line interface for supporting the batch mode or can be used with a
graphical user interface.
The graphical user interface (GUI) is written in Java as an application, that means it is made
for stand alone computers and not developed as an applet for the WWW. This user manual
refers to the Linux version.
Starting the Graphical User Interface
You can start the graphical user interface by executing the script gamma.sh. This can be
accomplished either by typing the name of the script in a shell (see Figure 64) or you can set a
link on your desktop. Copy the gamma.sh script to the desktop and it will be executed after
clicking on the respective icon (Figure 65).
Figure 64: Execution of the gamma.sh script in a shell
Figure 65: Desktop icon of the gamma.sh script.

A Program Description of GAMMA 2.7
226
When gamma 2.7 is started, a graphical interface will be displayed on the screen (Figure 66)
consisting of two windows:
the gamma 2.7-console and
the gamma 2.7–input mask.
A
B
Figure 66: Graphical user interface of GAMMA. A shows the main window and B shows the
window of the console.
Selecting a Structure Input File
Input files are selected and loaded by pressing File → Open in the menu in the upper left part
of the graphical user interface (GUI). A dialog box appears displaying the user’s home

A Program Description of GAMMA 2.7
227
directory. From there, go to the GAMMA installation directory and then change to the
“example” directory. Select the file CTXINP by double clicking.
The name and path of the output directory is set by pressing File → Output Directory in the
menu in the upper left part of the GUI. GAMMA will write information on the
superimposition process there consisting of several files. The default output path is the file
where the input file is selected.
Starting the Calculation
The calculation is started by pressing the button with the arrow sign in the pane directly under
the menu bar.
Figure 67: Button to start the calculation .
After the calculation is finished, an external dialog window appears that informs you that the
calculation is finished. The dialog box can be closed by pressing the Ok button.
Visualizing the Results
When the calculation is finished a new window has to be opened to display the results. Press
the button with its icon that symbolizes a graph (Figure 68).
Figure 68: Button to open the PARETO FRAME.

A Program Description of GAMMA 2.7
228
The gamma 2.7 PARETO FRAME opens up (Figure 69). It is intended for graphical display
of the superimposition results.
Figure 69: The window of the PARETO FRAME.
By pressing File → Open in the menu in the upper left part of the graphical user interface of
the PARETO FRAME a dialog box appears displaying the directory which has been chosen as
the output directory. Select the file pareto.dat by double clicking. A dialog window appears
that informs You on the reading status of the file. Afterwards, just press close and the dialog
box will disappear.
By pressing Plot → Pareto Plot a diagram will appear (Figure 70) listing RMS-values
against the size of the substructure between the molecules that has been found in the
GAMMA calculation.
If the option Global Best Individual was selected, only one point is visible in a Pareto plot.
For the selection mode RTS: restricted tournament selection this point represents the
optimal Euclidean compromise solution.

A Program Description of GAMMA 2.7
229
Figure 70: Pareto Plot with RMS-values listed against substructure size.
By moving the mouse pointer over the individual dots in the Pareto plot the size of the
substructure and the RMS-value and the number of the experiment for this individual result
will be displayed.
Figure 71: Pareto plot displaying a popup menu after clicking on one of the red dots.

A Program Description of GAMMA 2.7
230
When pressing on one of the red dots a popup is displayed (Figure 71). Now, press the
Rasmol: MOL2 menu and the superimposition belonging to the chosen dot appears in the
RasMol molecule viewer.
Figure 72: Superimposition shown with RasMol.
Batch Mode Execution
GAMMA also supports the execution in batch mode. This allows an easy integration into
existing workflows and IT environments for high-throughput and routinely carried out
calculations.
The batch version can be started at a shell (on UNIX/Linux systems) provided that all system
variables and/or paths have been set correctly. The following command line will display some
help on the screen how to run GAMMA in batch mode (Table 38).
gamma27 --help

A Program Description of GAMMA 2.7
231
Table 38: Command line options for batch mode execution in alphabetical order. Parameters
starting with lower case are given first.
Option Description
-a <gap> Specifies the number of generations that will be taken into account for the automatic scaling of the probabilities of the operators.
-b Determination of the global best individual that results from all experiments.
-c Dynamic scaling of the operator probabilities is switched off. By default the operator probabilities are fitted by registrating the operators or the operator sequences that led to a higher fitness of the individuals. Consequently the probabilities of these operators will be increased
-d <type> Different ring conformations are calculated using the library version of the 3D structure generator CORINA.
The type can be:
pr Ring conformations are evaluated by performing a prematch of the ring conformations that are contained in the template and in the test molecules.
init Ring conformations by consistently spreading over the initial start population
initr Ring conformations are randomly spread over the initial start population
-e <nexp> The maximum number of independent GAMMA runs is nexp (number of experiments).
-fmoln=<a_num, ... >, fmolm=<a_num, ... >
The given atom indices a_num of molecule n builds a match tuple with a_num of molecule m.
-g <ngen> The maximum number of generations is ngen.
-i <npop> The number of individuals of one generation is npop.
-l <conv> Use the convergence to prematurely abort the generations of the genetic algorithm. The user defines a convergence limit of conv between [0.0,1.0].
-m atoprop=x The atom property atoprop is used as matching criterion with tolerance x:

A Program Description of GAMMA 2.7
232
only atoms which do not differ in atoprop by more than x are eligible to build a match tuple, atoprop can be any PETRA value e.g. -mQTOT=0.1.
If an automatic calculation of the ranges is desired then –m atoprop=a.
-n <sigma> Use a sharing factor of sigma.
-p op=<prob> Defines the operator probability prob (between 0 and 1) for the given operator op (mut, cross, crunch, creep, torcross, tormut, migration).
-r Stop the generation of a new random seed.
-s mode=<par> A selection mode is selected with a parameter par: The mode can be:
prop Selection proportional to the individual fitness. par has to be in the interval [1.0,...].
linear Linear scaling: selection corresponding to sequence numbers of the individuals that are based on their fitness values; the selection probability is a linear function of this number par (selective pressure) has to be in the interval [1.0,2.0].
uniform Uniform scaling: only the par best individuals of a generations can be selected. par has to be in the interval ]0.0,1.0].
pareto No unified fitness function, but for each optimization criteria one best individual is saved. par has to be greater than 0.0.
rts Restricted tournament selection, includes pareto fitness: par is the size of the subpopulation for the restricted tournament selection. par has to be greater than 0.0.
-t <topo> This parameter can only be used for the parallel version and is not available through the GUI.
The migration topology defines how the subpopulations are allowed to exchange the migrants:
ring Every deme has two neighboring demes with which a transfer of genetic information can be managed.
prom In this unrestricted migration topology every deme can exchange individuals with every other deme.
torus In the neighborhood migration topology, also called torus, a deme can exchange genetic information with its nearest neighbors.

A Program Description of GAMMA 2.7
233
-v <vdwr> Use a tolerance factor for VWD radius match of vdwr.
-w <cfac> Use crowding factor cfac.
-z This parameter avoids incestuous crossover by controlling the similarity of crossing individuals.
-Amoln=<a_num, ... >, Amolm=<a_num, ... >
Only the given atom indices a_num of molecule n and m can will be of the substructure. n and m are CTXINP record numbers.
-Bmoln=<a_num1-a_num2, ...>, Bmolm=<a_num1-a_num2, ...>
Only the bonds between the given atom indices a_num1 and a_num2 of molecule n and m can be rotated during the superimposition process. This is to be given for all molecules n, m etc. of CTXINP.
-C <cluster> Use the cluster method for automatic calculation of ranges for physicochemical properties.
Allowed clustering methods:
mm pairwise complete- (maximum-) linkage.
ms pairwise single-linkage
mc pairwise centroid-linkage
ma pairwise average-linkage
st find mean, median, standard deviation and build histogram
-D <dist> Apply the following distance measure for the distance matrix of a clustering method. Allowed distance methods:
e Euclidean distance
h Harmonically summed Euclidean distance
b City-block distance
c Correlation
a Absolute value of the correlation
u Uncentered correlation
x Absolute uncentered correlation
s Spearman’s rank correlation
k Kendall’s τ
-E <elite> Use an elite of size num in selection.
-F=n,m The flexibility of molecules n and m is enabled; n and m are

A Program Description of GAMMA 2.7
234
CTXINP record numbers.
-P <filename> Specifies the full file name (path and file name) of the structure input file. By default, the input file name that is stored in the project file is used.
-Q <filename> Specifies the full file name (path and file name) of the descriptor output directory. By default, the output files are stored in the input file directory.
-R=n The flexibility of molecule n is disabled (rigid). Therefore, molecule n acts as a template for the rotation. This parameter is only allowed in combination with –F. If no -F and -R flags are given, all molecules are rigid.
-S <strat> This parameter can only be used for the parallel version and is not available through the GUI.
An individual migrates with from one deme to another using the migration strategy strat:
rand A copy of a random individual is selected in one deme to migrate to another process and to replace a random individual there.
best_worst A copy of the fittest individual migrates to another deme and replaces the worst ranked individual.
diversity The individual of a deme that is most similar to the fittest individual is replaced by another individual that has been rated as most similar to the fittest individual in the other deme.
-T Controls the output of the status information on:
a torsion angles
b best individuals
c chromosomes
d convergence and bias
e population fitness
f fitness frequency
g Program settings
h history
i Program initialization
o operator probabilities
p pairs
s substructure sizes
t runtime

A Program Description of GAMMA 2.7
235
The simplest way to run GAMMA in batch mode is to use a shell script in which the full file
name (path and file name) of the input and output file and all parameters and settings are
stored. The batch mode supports additional parameters that are not accessible with the GUI,
since those parameters are only usable for the execution on parallel machines or the
parameters are still experimental. Parallel execution is mostly managed through a queuing-
system using scripts.
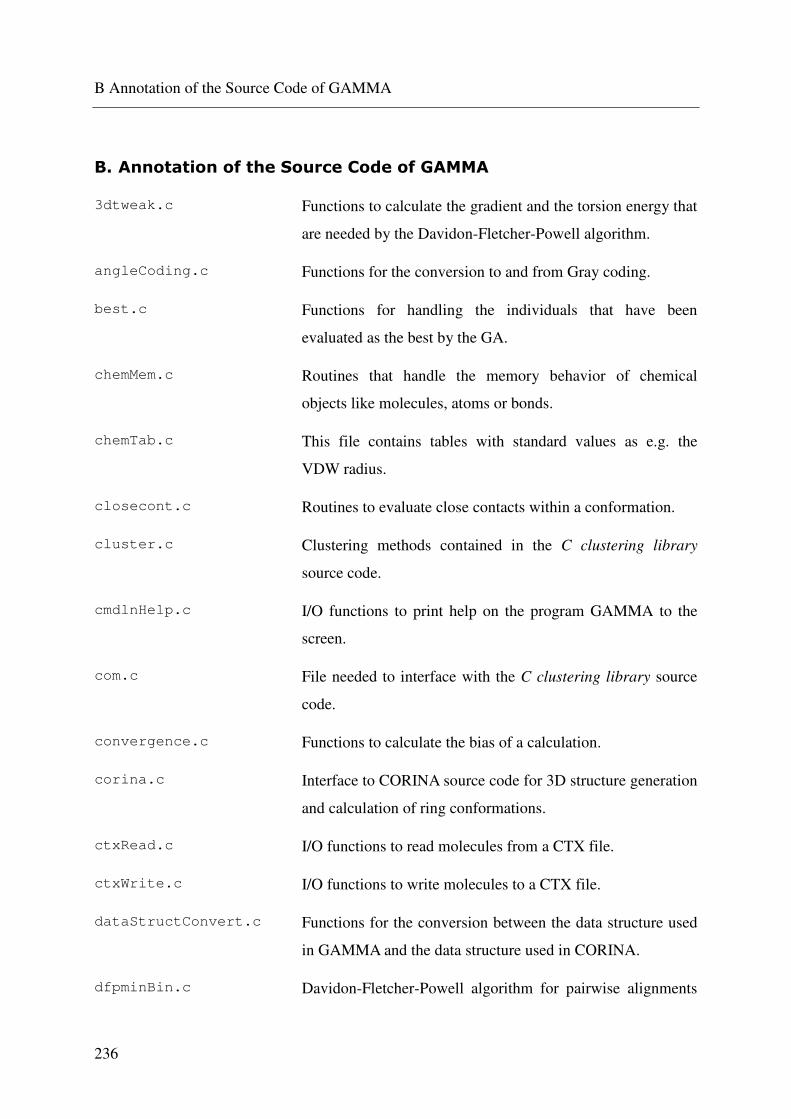
B Annotation of the Source Code of GAMMA
236
B. Annotation of the Source Code of GAMMA
3dtweak.c Functions to calculate the gradient and the torsion energy that
are needed by the Davidon-Fletcher-Powell algorithm.
angleCoding.c Functions for the conversion to and from Gray coding.
best.c Functions for handling the individuals that have been
evaluated as the best by the GA.
chemMem.c Routines that handle the memory behavior of chemical
objects like molecules, atoms or bonds.
chemTab.c This file contains tables with standard values as e.g. the
VDW radius.
closecont.c Routines to evaluate close contacts within a conformation.
cluster.c Clustering methods contained in the C clustering library
source code.
cmdlnHelp.c I/O functions to print help on the program GAMMA to the
screen.
com.c File needed to interface with the C clustering library source
code.
convergence.c Functions to calculate the bias of a calculation.
corina.c Interface to CORINA source code for 3D structure generation
and calculation of ring conformations.
ctxRead.c I/O functions to read molecules from a CTX file.
ctxWrite.c I/O functions to write molecules to a CTX file.
dataStructConvert.c Functions for the conversion between the data structure used
in GAMMA and the data structure used in CORINA.
dfpminBin.c Davidon-Fletcher-Powell algorithm for pairwise alignments

B Annotation of the Source Code of GAMMA
237
used by the directed tweak.
dfpmin.c Davidon-Fletcher-Powell algorithm for multiple molecule
alignments used by the directed tweak.
distanceParameter.c Functions for calculation of the distance parameter D and the
relative match distance.
elitism.c Functions to select an elite if elitism strategy is applied.
evaluation.c Routines for the evaluation of the fitness of the GA
individuals.
funcs.c File needed to interface with the Statist-1.0.1 source code.
ga.c The genetic algorithm loop.
gamma.c This file contains the main function with the program loop
that iterates over the number of experiments.
gen3d.c File needed to interface with the CORINA source code.
geneticMem.c Routines that handle the memory behavior of objects used by
the GA.
initData.c Several functions to initialize the program GAMMA.
initPop.c Routines for the initialization of the individuals of the GA
population.
license.c Function that computes if license is expired.
linpack.c File needed to interface with the C clustering library source
code.
match3d.c Calculation of the match of the molecules based on the match
list generated with the GA.
matchCriteria.c Functions that calculate if atoms are allowed to match
concerning the physicochemical properties.
matrix.c File with functionality for matrices.

B Annotation of the Source Code of GAMMA
238
memory_handling.c File needed to interface with the Statist-1.0.1 source code.
migration.c Functions for the migration of individuals of the GA between
the populations of the GA. This functionality is used in the
parallel version only.
multipleMatch.c Calculation of the match of the molecules based on the match
list generated with the GA.
niching.c Functions that are used to calculate crowding and sharing if
ecological niches are used in the GA.
operators.c Functions that implement the behavior of the genetic
operators mutation, crossover, creep and crunch.
paretoOptimality.c Routine to compare the Pareto fitness.
parseCmdln.c Functions to parse the command line.
permute.c File needed to interface with the CORINA source code.
plot.c File from Statist-1.0.1 source code that contains a function to
plot a histogram.
propCluster.c Functions for the automatic calculation of cutoff values for
the ranges of physicochemical properties in which atoms are
allowed to match. Interface to functions in the C clustering
library.
random.c Contains functions to generate a new random seed and a
random number generator.
ranlib.c File needed to interface with the C clustering library source
code.
ring.c File with functions to calculate ring closure.
rmatch.c Functions that calculate a prematch of the ring conformations
between the test molecules and the template molecule.
rms.c Function for the calculation of the RMS deviation between

C Overview of Superimposition Approaches
239
atoms.
selection.c Routines that implement the behavior of the selection
methods.
stereoChemDescriptor.c Functions that implement the calculation of the
stereochemistry descriptor S.
strings.c File that contains string functionality.
terminate.c Functions for freeing memory of previously allocated objects
to terminate the program.
torsion.c Routines to calculate the torsion angles between bonds and
the rotation matrix.
traceOut.c Some smaller functions to write trace output to files.
wctxacol.c I/O functions to write the color of atoms of a molecule to a
CTX file.
wctxmat.c I/O functions to write the matched molecules to a CTX file.
wctxrms.c I/O functions to write the RMS value of a 3D match to a
CTX file.

C Overview of Superimposition Approaches
240
C. Overview of Superimposition Approaches
1st Author Ref Method name Similarity criteria Optimization algorithm
Superposition mode
Arakawa (95,96) hydrophobic, hydrogen-bond-donor, hydrogen-bond acceptor, hydrogen-bond donor/acceptor
Hopfield neural network (HNN)
semiflexible using SPARTAN
Barnum (90) CATALYST hydrogen-bond donor, acceptor negative and positive charge centers, hydrophobic surface regions
semiflexible
Bultinck (86) QSSA molecular quantum similarity (MQS)
Lamarckian GA + simplex as local optimizer
rigid
Cho (51) FLAME maximum common pharmacophore (MCP) (base, hydrogen-bond acceptor, hydrophobic/aromatic ring)
GA for conformation generation, clique-detection for MCP detection
semiflexible
Cocchi and De Benedetti
(79) molecular electrostatic potential (MEP), size, and shape descriptors
simplex rigid
Cosgrove (84) SPAt molecular surface shape
clique-detection to find reduced set of surface points
rigid
Feher (100) MULTISEAL modified SEAL function for multiple molecules
Monte Carlo and and rational function optimization (RFO)
semiflexible (RIPS from MOE)
Gironés (105,106) TGSA
TGSA-Flex
simply based on atomic numbers, molecular coordinates, and connectivity.
topo-geometrical superposition algorithm
flexible
Goldman and Wipke
(85) QSD principal directions of surface curvature
quadratic shape desriptors (QSD) algorithm
rigid
Handschuh (15,16,149) GAMMA Physicochemical properties
GA and quasi Newton method
flexible
Iwase (88) SUPERPOSE hydrogen-bonding donor, hydrogen-bonding acceptor,
simplex semiflexible using

C Overview of Superimposition Approaches
241
hydrogen-bonding donor/acceptor, hydrophobicity
CAMDAS
Jain (104) SURFLEX-SIM molecular volume overlap
fragmentation-reassembly approach (divide and conquer algorithm) and gradient-based optimization
flexible
Jewell (60) FBSS electrostatic, hydrophobic and steric fields
GA encodes translation and rotation
rigid
Jones (112) GASP intermolecular conformational energy, volume overlay, intermolecular matching energy
GA flexible
Kearsley and Smith
(98) SEAL electrostatic and steric terms
Monte Carlo and and rational function optimization (RFO)
rigid
Klebe (99) TORSEAL steric, electrostatic, hydrophobic, and hydrogen-bond interaction fields described by Gaussian function
Monte Carlo and and rational function optimization (RFO)
semiflexible using MIMUMBA
Korhonen (107) FLUFF-BALL electrostatic and steric fields
flexible
Krämer (102) fFLASH hydrogen-bond donor, hydrogen-bond acceptor, base, acid, hydrophobic
fragmentation-reassembly approach (divide and conquer algorithm) and clique based pattern matching
flexible
Kroonenberg (97) GPA common atoms generalized Procrustes analysis (GPA)
semiflexible
Labute (109) MOE-based approach
volume, aromaticity, hydrogen bond donor/acceptor, hydrophobicity, log P, molar refractivity, surface exposure
random incremental pulse search (RIPS)
flexible
Lemmen (81) RigFit physicochemical properties described by Gaussian functions
fragmentation-reassembly approach (divide and conquer algorithm), quasi Newton method
rigid
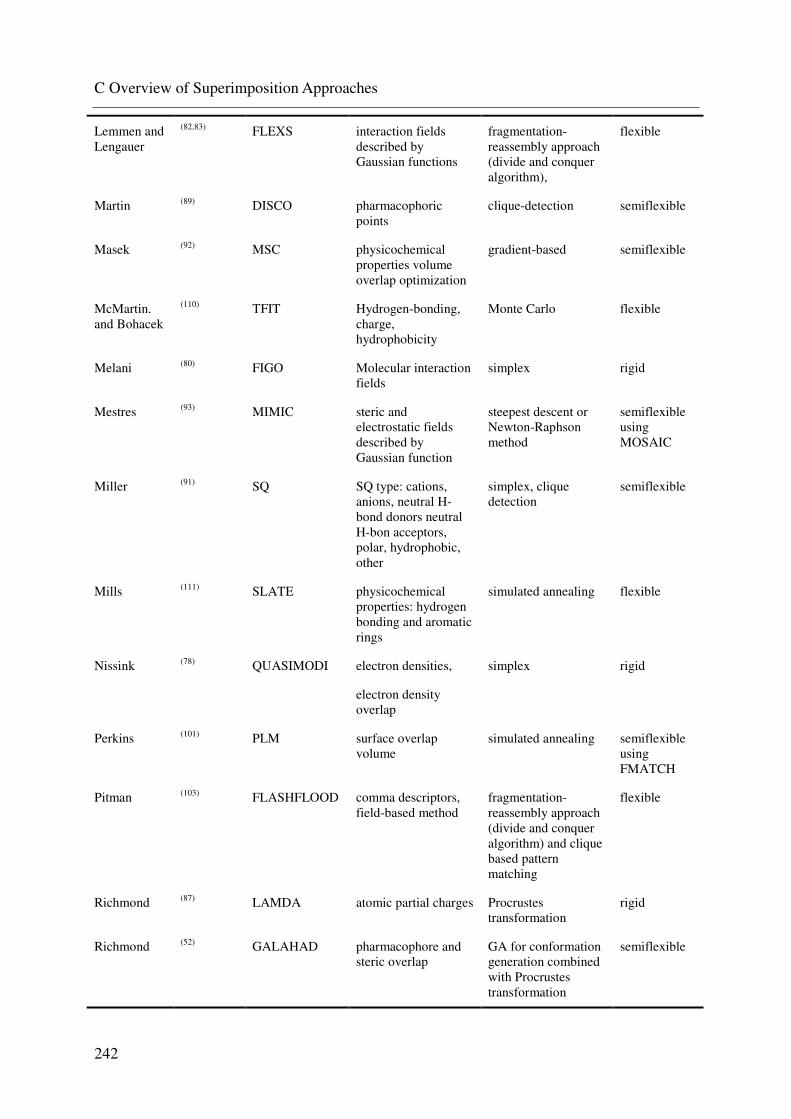
C Overview of Superimposition Approaches
242
Lemmen and Lengauer
(82,83) FLEXS interaction fields described by Gaussian functions
fragmentation-reassembly approach (divide and conquer algorithm),
flexible
Martin (89) DISCO pharmacophoric points
clique-detection semiflexible
Masek (92) MSC physicochemical properties volume overlap optimization
gradient-based semiflexible
McMartin. and Bohacek
(110) TFIT Hydrogen-bonding, charge, hydrophobicity
Monte Carlo flexible
Melani (80) FIGO Molecular interaction fields
simplex rigid
Mestres (93) MIMIC steric and electrostatic fields described by Gaussian function
steepest descent or Newton-Raphson method
semiflexible using MOSAIC
Miller (91) SQ SQ type: cations, anions, neutral H-bond donors neutral H-bon acceptors, polar, hydrophobic, other
simplex, clique detection
semiflexible
Mills (111) SLATE physicochemical properties: hydrogen bonding and aromatic rings
simulated annealing flexible
Nissink (78) QUASIMODI electron densities,
electron density overlap
simplex rigid
Perkins (101) PLM surface overlap volume
simulated annealing semiflexible using FMATCH
Pitman (103) FLASHFLOOD comma descriptors, field-based method
fragmentation-reassembly approach (divide and conquer algorithm) and clique based pattern matching
flexible
Richmond (87) LAMDA atomic partial charges Procrustes transformation
rigid
Richmond (52) GALAHAD pharmacophore and steric overlap
GA for conformation generation combined with Procrustes transformation
semiflexible

D Publications
243
Sheridan (108) distance geometry distance-geometry (Monte Carlo like procedure)
flexible
Tervo (94) BRUTUS electrostatic and steric Fields
gradient-based semiflexible using Confort

E Curriculum Vitae
244
D. Publications
1. J. Gasteiger, S. B auerschmidt, U. Burkard, M. C. Hemmer, A. Herwig,
A. von Homeyer; R. Höllering, T. Kleinöder, T. Kostka, C. Schwab, P. Selzer, L. Steinhauer,
Decision support systems for chemical structure representation, reaction modeling, and
spectra simulation,
SAR and QSAR in Environm. Res., 2002, 13(1), 89-110.
2. A. von Homeyer,
Evolutionary Algorithms and their Applications in Chemistry,
in Handbook of Chemoinformatics: From Data to Knowledge in 4 Volumes,
J. Gasteiger (Editor), Wiley-VCH, Weinheim, 2003, 1239-1280.
3. A. von Homeyer, M. Reitz,
Databases in Biochemistry and Molecular Biology,
in Handbook of Chemoinformatics: From Data to Knowledge in 4 Volumes,
J. Gasteiger (Editor), Wiley-VCH, Weinheim, 2003, 756-793.
4. A. von Homeyer, J. Gasteiger,
Computer Simulations of Enzyme Reaction Mechanisms: Application of a Hybrid Genetic
Algorithm for the Superimposition of Three-Dimensional Chemical Structures,
in High Performance Computing in Science and Engineering, Munich 2004,
S. Wagner, W. Hanke, A. Bode, F. Durst, Springer, Heidelberg, 2005, 261-271.
5. M. Reitz, A. von Homeyer, J. Gasteiger,
Query Generation to Search for Inhibitors of Enzymatic Reactions,
J. Chem. Inf. Model., 2006, 46, 2333-2341

E Curriculum Vitae
245
E. Curriculum Vitae
Persönliche Daten
Name
Geburtsdatum
Geburtsort
Staatsangehörigkeit
Familienstand
Alexander von Homeyer
23.08.1971
Nürnberg
Deutsch
verheiratet, ein Kind
Schulausbildung
09/1978 – 07/1979
08/1979 - 06/1981
09/1981 – 07/1982
09/1982 – 07/1992
Schönbornschule in Karlsdorf-Neuthard in Baden-Württemberg
Gem. Grundschule Bergheim-Ahe in Nordrhein-Westfalen
Max-Beckmann Grundschule in Nürnberg in Bayern
Sigena-Gymnasium in Nürnberg in Bayern
Hochschulausbildung
11/1992 – 10/1993 Grundstudium Chemie an der Friedrich-Alexander-Universität
Erlangen-Nürnberg
11/1993 – 10/1995 Grundstudium Biologie an der Friedrich-Alexander-Universität
Erlangen-Nürnberg
11/1995 – 11/1998 Hauptstudium der Biologie an der Friedrich-Alexander-Universität
Erlangen-Nürnberg,
Diplomarbeit in Virologie bei Prof. Dr. B. Fleckenstein,
Thema: Charakterisierung funktioneller Domänen des Vpr-Proteins
von SIVmac239
11/1998 – 09/1999 Aufbaustudium Informatik an der Technischen Universität München
10/1999 – 03/2000 Aufbaustudium Informatik an der Technischen Universität
Darmstadt
seit 03/2000 Anfertigung der Dissertation bei Prof. Dr. J. Gasteiger am
Computer-Chemie-Centrum und Institut für Organische Chemie der
Friederich-Alexander Universität Erlangen-Nürnberg

E Curriculum Vitae
246