Embed Size (px)
Citation preview

A study on the thermal stability of sodium
dithionite using ATR-FTIR spectroscopy
Vijaya Lakshmi Vegunta
This work has been carried out at INNVENTIA AB
Master Thesis in Fibre and Polymer Technology KTH Royal Institute of Technology Stockholm, Sweden June 2016

2
1. Abstract
Sodium dithionite (Na2S2O4) is a powerful reducing agent. It has therefore been suggested to be
used as an additive in kraft pulping to improve the yield. However, sodium dithionite easily
decomposes and it is thus important to determine the effect of different conditions. The aim of
this thesis has been to investigate the thermal stability of sodium dithionite under anaerobic
conditions using ATR-FTIR spectroscopy under different conditions, such as heating
temperature, concentration of the solution, heating time and pH.
The stability of sodium dithionite was found to decrease with increasing heating temperature,
concentration of sodium dithionite, heating time and pH. Sodium dithionite was found to be
relatively stable at moderate alkaline pH:s 11.5 and 12.5, while a rapid decrease in stability with
time was noted at higher heating temperatures and concentrations of sodium dithionite.
Based on this study on the thermal stability of sodium dithionite, the following conditions are
suggested as the most promising, when adding sodium dithionite to the kraft cooking as an
additive; pH 12.5, with 0.4 M concentration of the solution, at a heating temperature of 100 °C.

3
Table of Contents
1. Abstract ........................................................................................................................................ 2
2. Introduction .................................................................................................................................. 5
2.1 Kraft pulping .......................................................................................................................... 6
2.2 Stability of sodium dithionite ................................................................................................. 7
2.3 Decomposition of sodium dithionite ...................................................................................... 8
2.4 Effect of temperature and pH on decomposition of sodium dithionite solution .................... 9
2.5 Possible reaction mechanisms .............................................................................................. 10
3. Purpose of the study ................................................................................................................... 11
4. Experiment ................................................................................................................................. 12
4.1 Materials ............................................................................................................................... 12
4.2 Sample preparation ............................................................................................................... 12
5. Method ....................................................................................................................................... 13
5.1 ATR-FTIR spectroscopy ...................................................................................................... 13
5.2 Calculations .......................................................................................................................... 14
6. Results and discussion ................................................................................................................ 16
6.1 Effect of heating time ........................................................................................................... 16
6.2 Effect of heating temperature ............................................................................................... 20
6.3 Effect of concentration ......................................................................................................... 24
6.4 Effect of pH .......................................................................................................................... 28
6.5 Structural changes observed by infrared spectroscopy ........................................................ 31
6.6 Multivariate analysis ............................................................................................................ 33
6.7 Decomposition products ....................................................................................................... 34
7. Conclusions ................................................................................................................................ 36
8. Recommendation and future work ............................................................................................. 37
9. Acknowledgement ...................................................................................................................... 38
10. References ................................................................................................................................ 39
Appendix 1: Scatterplots for each pH of sodium dithionite solution using Simca ........................ 42

4
Appendix 2: MODDE .................................................................................................................... 45
Appendix 3: ATR-FTIR spectra of sodium dithionite solution at each pH ................................... 49
Appendix 4: IR frequencies of sulphur containing compounds ..................................................... 51
5
2. Introduction
Sodium dithionite (Na2S2O4) is a strong reducing agent with great industrial significance. Due to
its reducing ability it finds use in fields such as printing and dyeing of textiles, production of
synthetic rubber, synthesis of stabilizers for polymeric materials and as a biochemical reductant.
Sodium dithionite also has valuable environmental remediation applications. It is being used to
treat heavy metal waste in aquifers and other environmental significant treatments.
A study of Jayme and Wörner (1952) showed that improved strength, higher bleachability and
improved lignin degradation in kraft pulping were seen in the system when using sodium
dithionite as a pulping additive. Due to its reducing properties sodium dithionite is used as a
bleaching agent in textile and paper industry.
Sodium dithionite may be used for the preservation of hemicelluloses in pulping and as it will
not introduce new elements to the recovery system and it may be used without changing the
system. Sodium dithionite efficiently reduces carbonyl functionalities of functionalized
aldehydes and ketones to corresponding alcohols in good yields without affecting other
functional groups in water or dioxane system at 85 °C (De Vries and Kellogg 1980; Sigh et al.
1998). An experimental research has been done by using sodium dithionite as pulping additive
in a pilot scale and the results were promising (Wang et al. 2014). It is cost effective when
compared to other alternative additives, such as sodium borohydride (NaBH4).
Sodium dithionite must be handled strictly in an anaerobic environment due to its sensitivity
towards oxygen. Analytical procedures which require removal or transfer of its solutions is
therefore susceptible to serious error, underscoring the need for an in situ analytical technique.
Sulphur – oxygen (S-O) compounds have relatively intense stretching modes, readily observed in
the 1350 - 750 cm-1 wavenumber region of the infrared spectrum. In ATR (Attenuated total
reflectance)-FTIR (Fourier transform infrared) spectroscopy, the IR radiation interacts with the
sample mainly at the sample interface, resulting in a very short and reproducible effective path
length. This makes ATR-FTIR spectroscopy as an ideal candidate for the quantitative
determination of multicomponent mixtures of sulphur – oxygen (SxOyZ-) anions.

6
2.1 Kraft pulping
This section describes an overview of the kraft pulping process. Kraft pulping is currently the
dominant chemical method for pulping. The pulp produced using this process is stronger and
darker and requires chemical recovery to compete economically. The main objective of kraft
pulping is to liberate wood fibers from the wood matrix to obtain wood pulp. This is achieved by
removing lignin and preserving the molecular weight of carbohydrates as much as possible. The
kraft pulping process involves digesting of wood chips at elevated temperatures and pressure.
The typical out-line of this process is wood handling (chipping, debarking, and screening),
cooking in digester (kraft cooking), and oxygen delignification, washing of pulp, multi stage
bleaching and drying of pulp.
In kraft mills, the wood chips are fed into digester together with the cooking liquor. The cooking
liquor is white liquor which is a mixture of sodium hydroxide (NaOH) and sodium sulphide
(Na2S). The active species in this cooking process are hydroxyl (OH-) and hydrogen sulphide (HS-)
ions. The hydroxyl ions are consumed during kraft pulping and neutralize acidic groups. There is
only a slight decrease in hydrogen sulphide ion concentration during pulping. The first step in
kraft cooking is an impregnation step, where the cooking liquor is transported through the
surface of wood chips and followed by the penetration and diffusion into the wood chips.
Depending on the amount of hydroxyl and hydrogen sulphide ions present in the liquor, cooking
temperature and time; different compositions of pulp can be obtained (Kleppe 1970; Aurell and
Hartler 1965).
In modern kraft mills the cooking is carried out in continuous digesters. The temperature of the
digester is raised slowly up to 150 - 170 °C and held there up to 1 hour. The pulp produced at
this stage is called brown stock because of its colour. The brown stock is screened to remove
uncooked wood and washed to remove the spent cooking liquor (black liquor). After that the
pulp is sent to the bleach or pulp plant. The collected black liquor contains organic chemicals
whose content is based on the wood species and the conditions used for pulping. Additives such
as anthraquinone (AQ) and polysulphide (PS) acting as both reducing and oxidising to stabilize
hemicellulose against alkaline degradation has been studied in the industry.

7
2.2 Stability of sodium dithionite
The stability of sodium dithionite (Na2S2O4) in aqueous solution is discussed in this section. The
anhydrous solution of sodium dithionite is combustible and decomposes exothermically if
subjected to moisture. Under anaerobic conditions at room temperature, alkaline (pH 9-12)
aqueous solutions of dithionite decompose slowly over a matter of days. Therefore, sodium
dithionite is more stable and effective as a reducing agent in alkaline solution (Wayman and
Lem 1970).
The following generally accepted formula shows decomposition of sodium dithionite in aqueous
solutions at pH 7.
This reaction leads to several side reactions. However, there is a little agreement on the
importance of products (Spencer 1967).
The overall redox equilibria reaction for anaerobic oxidation of sodium dithionite to bisulphite is
described by the following formula (Mayhew 1978).
The stabilization of dithionite ion should be achieved by adding formaldehyde to the sample
which forms hydroxymethane sulfonate or formaldehyde bisulphite (HOCH2SO3) and
hydroxymethane sulphinate or formaldehyde sulphoxylate (HOCH2SO2-). Formaldehyde can
stabilize sulphite ion in aqueous solution through the formation of the hydroxymethane
sulfonate (De Carvalho and Schwedt 2001). The following reaction describes the stabilization of
sodium dithionite solution in formaldehyde.
Sodium dithionite is mainly stabilized by sodium polyphosphate, sodium carbonate and sodium
salts of organic acids.
The stability of dithionite can be determined by different methods namely iodometric,
potentiometric, spectrometric titrations, ion chromatography and electroanalytical methods
(Fox 1974).
Due to the instability of sodium dithionite (Na2S2O4) with oxygen (O2) the decomposition of
sodium dithionite should strictly be carried out under anaerobic conditions. The decomposition
exhibits an autocatalytic behaviour which is mainly affected by the concentration of dithionite
and the pH of the solution. The dithionite ion (S2O42-) decomposes rapidly in acidic conditions or
at high temperatures (even under anaerobic conditions). The decomposition of the dithionite

8
ion is accelerated by increasing acidity, higher concentration of the dithionite ion, temperature
and other sulphur containing species (Kilroy 1980 ; Wayman and Lem 1970).
Considering the stability of sodium dithionite in water, it dissolves in water and forms sodium
hydrogen sulphite (NaHSO3), sodium hydrogen sulphate (NaHSO4) and sodium thiosulphate
(Na2S2O3) (BASF AG 1988). Based on the pH range, sulphur dioxide (SO2), hydrogen sulphide
(H2S) and sulphide (S2-) are present in aqueous solution. Sodium dithionite transforms into
sodium sulphite (Na2SO3) and sodium thiosulphate (Na2S2O3) without the presence of air, and
forms sodium sulphite (Na2SO3) and sodium sulphate (Na2SO4) via oxidation with air. Hydrolysis
is faster at lower pH values (Camacho et al. 1995).
2.3 Decomposition of sodium dithionite
The decomposition and behaviour of sodium dithionite in solution has been studied over long
periods of time. Since early 20th century there are numerous studies carried out on the
decomposition pathway and kinetics of dithionite by several workers. The generally accepted
reaction is as follows and the formed decomposed products are sodium thiosulphate (Na2S2O3)
and sodium bisulphite or sodium hydrogen sulphite (NaHSO3) (Burlamacchi et al. 1969).
From this reaction other stable sulfur species such as sulphate (SO42-), dithionate (S2O6
2-) and
hydrogen sulphide (H2S) are also formed in traces. The rate of this reaction is greatly affected by
pH. The rate is slow in alkaline medium and rapid in acidic conditions (Kovács and Rábai 2002).
Decomposition products of sodium dithionite under various conditions are described by the
following equations at temperatures between 0 oC to 35 oC.
Under aerobic conditions:
Under anaerobic conditions:
In strong alkaline medium:
In weak alkaline and weak acidic medium:
In acidic medium

9
In strong acidic medium:
The decomposition of dithionite undergoes a number of protonation and decomposition
pathways that compete with each other (Kovács and Rábai 2002). Trithionite (S3O62-) is
produced in a 9:1 ratio related to bisulphite (HSO3-) and thiosulphate (S2O3
2-). The produced
trithionite (S3O62-) can be disproportionate into dithionate (S2O6
2-) and elemental sulphur or it
reacts with water and forms bisulphite (HSO3-) and hyposulphite (S2O2
2-) anions. When sodium
dithionate undergoes thermal decomposition, it decomposes in an autocatalytic way. After a
short induction period the radical hyposulfite (SO2-) ion present in the solution under goes rapid
reaction and forms sodium thio sulphate (Na2S2O3) and sodium hydrogen sulphite (NaHSO3)
(Rinker et al. 1960).
Under aerobic conditions the formation of hydrogen sulphite (HSO3-) and hydrogen sulphate
(HSO4-) lowers the pH of the media and accelerates the process of decomposition. Therefore, to
keep the solutions of dithionite stable it must be cooled and kept in alkaline state using NaOH
solution with oxygen excluded.
Due to complex nature of dithionite (S2O42-) the analysis of the dithionite ion has been a difficult
problem to solve. From previous studies an attractive procedure for determining dithionite
(S2O42-), bisulphite (HSO3
-) and thiosulphate (S2O32-) contents in the product by carrying three
operational distinct iodometric titrations has been described. However, the data presented is
quite insufficient to support this method and it is also impracticable (Wollak 1930).
Coming to the kinetics of sodium dithionite solution, the decomposition in aqueous solution
under anaerobic conditions is a second order (sum of exponents in rate law is equal to two; rate
law equation for second order reaction (d[A]/dt = - k[A]2)) with respect to sodium dithionite
concentration. The decomposed products formed are sodium thiosulphate (Na2S2O3) and
sodium hydrogen sulphite (NaHSO3) (Meyer 1903).
2.4 Effect of temperature and pH on decomposition of sodium dithionite solution
The anhydrous salt of sodium dithionite decomposes exothermically in air on prolonged heating
above 90 oC. The main decomposition or oxidation products are sodium sulphate (Na2SO4) and
sulphur dioxide (SO2). At temperatures above 150 oC, in absence of air, sodium dithionite
decomposes in a vigorous reaction giving mainly sodium sulphite (Na2SO3), sodium thiosulphate
(Na2S2O3), sulphur dioxide and small amounts of sulphur (S). However, decomposition of sodium
dithionite above 250 oC is an endothermic reaction.
10
Sodium dithionite present in the form of powder can decompose in air on contact with small
amounts of water to produce intense heat and burns with flame. The aqueous solution of
sodium dithionite decomposes slowly in cold and rapidly in warm conditions. Initially thermal
analysis in nitrogen showed that decomposition of sodium dithionite takes place by evaluation
of heat and sulphur dioxide as reported by earlier workers (Janzen 1972; Lister and Garvie 1959;
Erdey et al. 1965). As the temperature increases the concentration of dithionite ion decreases
(Wayman and Lem 1970; Camacho et al. 1995).
Coming to effect of pH, sodium dithionite decomposes rapidly under weak acidic conditions
(especially under warm conditions). In an alkaline solution, the decomposition reaction is much
slower and the products formed are thiosulphate (S2O32-) and bisulphite (HSO3
-) (Greenwood
and Earnshaw 1984) as well as a small amount (2-4%) of sulphide (S2-) and sulphur (S). The
disproportion occurs slowly at pH greater than or equal to 8 and rapidly in acidic conditions.
Decomposition of sodium dithionite in alkaline solution is accelerated by thiosulphates (S2O32-)
and polysulphides (Sn2-). In addition of strong acids to dithionite solution it changes from yellow
to red in colour. After a short time, complete decomposition occurs with precipitation of
sulphur. A weak alkali at pH range from 8-13 stabilizes dithionite solutions and can then be kept
for weeks below 10 oC with no presence of air or oxygen. The aqueous solution of sodium
dithionite in the presence of air readily decomposes into sulphite (SO32-) and sulphate (SO4
2-) at
room temperature, with or without stabilizer. Dithionite ion decomposes rapidly in acidic
conditions and at higher temperature even under anaerobic conditions (Cleghorn and Davies
1970; Selwyn and Tse 2008).
2.5 Possible reaction mechanisms
The dithionite ions react with water and decompose into sulphur containing species. The
following reaction describes the decomposition of sodium dithionite with water.
The main decomposition products are bisulphite (HSO3-) and thiosulphate (S2O3
2-) ions. The
actual decomposition process is more complicated than it appears in the equation. This is due to
that various sulphur containing species react with one another to form other sulphur containing
species, such as hydrogen sulphide (H2S), polysulphides (H2Sx) and elemental sulphur (S). These
new species can react with dithionite ions and further decrease the dithionite ion concentration
(Selwyn and Tse 2008).
The solution of sodium dithionite has been found to contain detectable amounts of the sulfur
dioxide radical ion (SO2-.) in equilibrium with the dimer (Janzen 1972; Markarov and Silaghi-
Dumitrescu 2013). This behaviour has been observed by previous studies on decomposition
reaction of sodium dithionite in aqueous solutions. In both solid and liquid states, the dithionite
electron spin resonance has been observed to yield (SO2-.) radical ion.

11
The overall reaction of decomposition of sodium dithionite in various aqueous solutions has
been shown in the following reaction:
The possible mechanism could be the initial and slowest stage of reaction with water and is
explained by following reaction:
This is followed by a rapid reaction of sulphoxylate ion (HSO2-) with dithionite ions and forms
thiosulphate and sulphite:
3. Purpose of the study
The purpose of this study was to examine the thermal stability of alkaline sodium dithionite
solutions under anaerobic conditions using ATR-FTIR spectroscopy.

12
4. Experiment
4.1 Materials
The materials used in this study were sodium dithionite (Na2S2O4) (≥ 85% purity) supplied by
Merck KGaA, Darmstadt, Germany and sodium hydroxide (NaOH) (≥ 99.0 % purity) supplied by
Merck KGaA, Darmstadt.
4.2 Sample preparation
The sodium dithionite solutions were prepared under anaerobic conditions. For that a box
purged with nitrogen gas was used. The solutions were prepared in 50 ml volumetric flasks
(purged with nitrogen) by mixing sodium dithionite and deionized water (purged with nitrogen).
The pH of the solutions was adjusted using sodium hydroxide. For pH 9, deionized water
(purged with nitrogen) was used for preparing the solutions. For the pH:s 11.5, 12.5 and 14, the
pH was adjusted by adding required amounts of sodium hydroxide. The prepared solution was
transferred to an autoclave (a Teflon bottle with a steel cap) previously purged with nitrogen
and kept in an oil bath for heating with experimental heating times according to run order. After
heating the autoclave, it was placed in a water bath with temperature of 10 °C for cooling. The
sample solution was cooled for 40 min. After cooling the sample solution, 2 drops of sample
solution was placed on the ATR-FTIR crystal and a spectrum was recorded also under nitrogen
atmosphere.
Table 1: Parameters involved in experimental study are shown in the following table
Parameters Conditions
pH 9; 11.5; 12.5; 14
Temperature (°C) 80; 100; 120
Time (min) 10; 20; 30
Concentration (M) 0.2; 0.4; 0.6

13
5. Method
5.1 ATR-FTIR spectroscopy
The ATR - FTIR spectra of the samples were recorded using a Varian 680-IR FTIR spectrometer
(Varian Inc., Santa Clara (CA), USA). The software used was Varian Resolutions Pro (Varian Inc.,
Santa Clara (CA), USA) (Version 5.1) and ATR-FTIR system was operated in ATR mode. The Pike
MIRacleTM ATR crystal consists of a single reflection diamond with w/Znse crystal plate (Pike
Technologies Inc., Madison (WI), USA). The ATR crystal was having contact area with diameter
Ø2 mm and the penetration depth of the IR light of 2 µm.
For ATR sampling the IR beam was directed into the ATR crystal of refractive index of 2.4. The
working pH range is 1 - 14 and long wave cut off is at 525 cm-1. This makes single reflection
diamond with w/Znse ATR crystal plate applicable for this experimental study. The IR beam
reflects from the internal surface of the crystal and creates an evanescent wave. The created
wave projects orthogonally into the sample which was in intimate contact with the crystal.
Some part of the energy from the evanescent wave is absorbed by the sample and the reflected
radiation is reflected to the detector. The graphical representation of single reflection ATR
crystal can be seen in Figure 1: where dp is depth of penetration and ө is critical angle.
Figure 1: Graphical representation of a single reflection ATR
The background spectra and sodium dithionite samples spectra were scanned and collected
with spectral resolution of 4 cm-1 and spectral range of 4000 – 525 cm-1; 24 scans were
collected. Average spectra were calculated from these 24 scans and baseline corrected at 3800
cm-1.
ATR crystal
Evascent wave
Bulk sample
dp
ɵ
IR beam

14
5.2 Calculations
The stability of the sodium dithionite in the aqueous solution was evaluated from IR spectra.
Two spectra were taken as an example, as illustrated in Figure 2, one was a reference spectrum
of sodium dithionite solution having conditions: pH 9 and 0.6 M concentration at temperature
20 °C. The other spectrum was a dithionite solution spectrum having conditions: pH 9, 0.6 M
concentration and heated at 80 °C for 20 min. The observed signal at 1051 cm-1 was identified
as SO2 antisymmetric stretch of sodium dithionite. This signal at 1051cm-1 was used for
evaluating stability of sodium dithionite solution.
The height of the signal was evaluated by drawing base line at the base of signal between two
minimal points. A straight line drawn from base line to signal maxima was determined as height
of the signal, as illustrated in Figure 2.
Figure 2: Determination of height of the signal from the baseline. Spectrum of reference
sodium dithionite solution at pH 9 with 0.6 M concentration at 20 °C and spectrum of sodium
dithionite solution at pH 9 with 0.6 M concentration at 80 °C heated for 20 min. (I) is height of
the signal of experimental run and (Io) is the height of the signal of the sodium dithionite
solution at 20 °C.
The determined heights of this signal at 1051 cm-1 were used for calculating stability of sodium
dithionite solution according to Eq(1):
0
0.01
0.02
0.03
0.04
0.05
800900100011001200
Ab
so
rban
ce
Wavenumber (cm-1)
Reference sodium dithionitesolution (pH 9 ,0.6 M, 20 °C)
Sodium dithionite solution(pH 9 ,0.6 M, 80 °C, 20 min)
1051
I
15
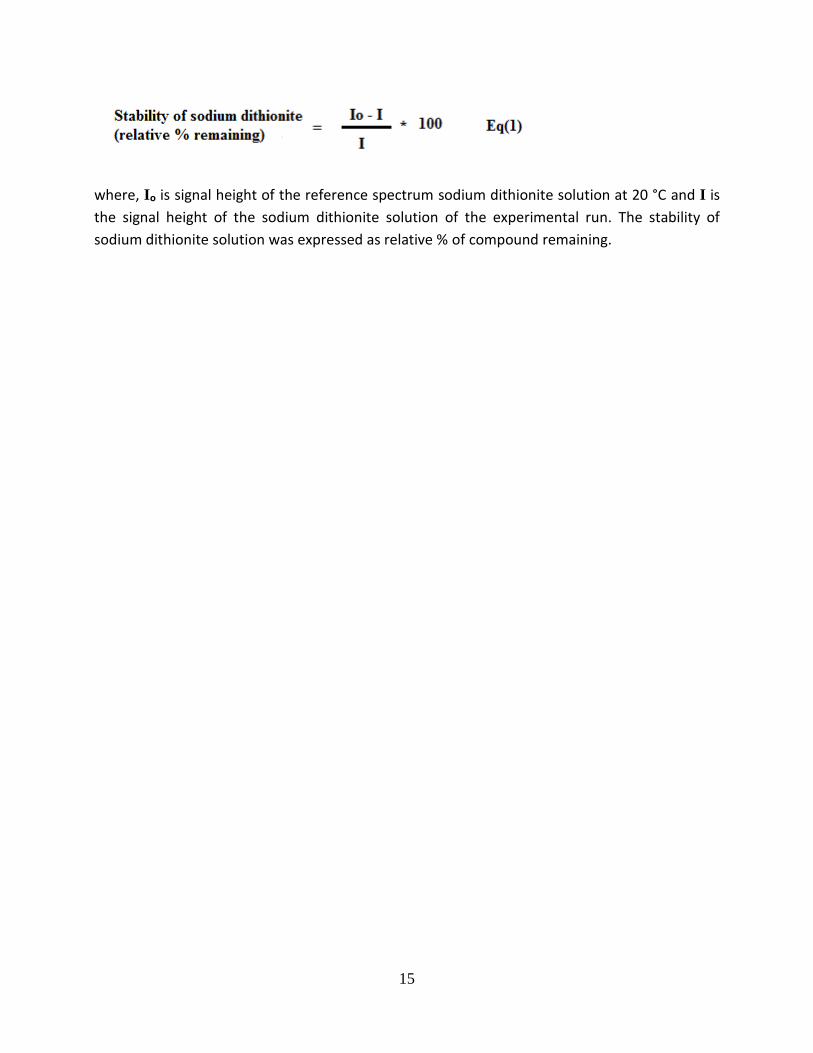
where, Io is signal height of the reference spectrum sodium dithionite solution at 20 °C and I is
the signal height of the sodium dithionite solution of the experimental run. The stability of
sodium dithionite solution was expressed as relative % of compound remaining.

16
6. Results and discussion
The effect of heating temperatures 80 °C, 100 °C and 120 °C, pH:s 9, 11.5, 12.5 and 14,
concentrations 0.2 M, 0.4 M and 0.6 M and heating times 10 min, 20 min and 30 min have been
investigated. The stability of dithionite is presented as the percentage of compound remaining.
One could consider that the trends illustrating the stability of sodium dithionite in Figures 3-17
could appear somewhat different if additional conditions were used such as 90 °C or 100°C, 0.3
M or 0.5 M, pH 10 or 13.
6.1 Effect of heating time
Figure 3: Stability of alkaline sodium dithionite solutions at pH 9 as a function of heating time
showing effects of heating temperature and concentration of sodium dithionite solution.
Figure 3 shows the stability of sodium dithionite solution at pH 9 under anaerobic conditions as
a function of heating time. At pH 9 the stability decreased with increasing heating time of the
sodium dithionite solution. The successive decrease in stability of sodium dithionite solution
with increasing heating temperature, concentration of solution and heating time was seen.
0
20
40
60
80
100
0 10 20 30
Sta
bil
ity o
f d
ith
ion
ite (
rela
tive %
re
main
ing
)
Heating time (min)
0.2M 80°C
0.4M 80°C
0.6M 80°C
0.2M 100°C
0.4M 100°C
0.6M 100°C
0.2M 120°C
0.4M 120°C
0.6M 120°C

17
Figure 4: Stability of alkaline sodium dithionite solution of pH 11.5 as a function of heating
temperature, heating time and concentration of sodium dithionite solution.
Figure 4 shows the stability of alkaline sodium dithionite solution under anaerobic conditions at
pH 11.5 as a function of heating time. The sodium dithionite solution was found to be stable at
all conditions of 80 and 100 °C. The stability of sodium dithionite decreases at the highest
heating temperature and longest heating times at all concentrations of sodium dithionite
solution. When it comes to temperature 120 °C after 10 min, the sodium dithionite solution
starts to lose its stability and the stability decreases with increasing in concentration of solution
and heating time.
0
20
40
60
80
100
0 10 20 30
Sta
bil
ity o
f d
ith
ion
ite
(re
lati
ve
%
rem
ain
ing
)
Heating time (min)
0.2M 80°C
0.4M 80°C
0.6M 80°C
0.2M 100°C
0.4M 100°C
0.6M 100°C
0.2M 120°C
0.4M 120°C
0.6M 120°C

18
Figure 5: Stability of alkaline sodium dithionite solution at pH 12.5 as a function of heating
time showing effects of heating temperature and concentration of sodium dithionite solution.
Figure 5 shows the stability of alkaline sodium dithionite solutions under anaerobic conditions
at pH 12.5 as a function of heating time. The alkaline sodium dithionite solution at pH 12.5 was
stable at all conditions studied except for the highest dithionite concentration of 0.6 M at 120 °C
for heating time 30 min. The similar behaviour of sodium dithionite solutions with pH 11.5 is
observed. It is evident that the stability was higher at pH 12.5 as compared to pH 11.5.
0
20
40
60
80
100
0 10 20 30
Sta
bil
ity o
f d
ith
ion
ite
(re
lati
ve
%
rem
ain
ing
)
Heating time (min)
0.2M 80°C
0.4M 80°C
0.6M 80°C
0.2M 100°C
0.4M 100°C
0.6M 100°C
0.2M 120°C
0.4M 120°C
0.6M 120°C

19
Figure 6: Stability of alkaline sodium dithionite solution at pH 14 as a function of heating time
showing effects of heating temperature and concentration of sodium dithionite solution.
Figure 6 shows the stability of alkaline sodium dithionite solutions under anaerobic conditions
at pH 14 as a function of heating time. The stability of sodium dithionate decreases gradually
with increasing heating temperature, heating time and concentration of sodium dithionite. The
decrease in stability of sodium dithionite solution is rapid at higher concentrations, higher
temperatures and heating time.
0
20
40
60
80
100
0 10 20 30
Sta
bil
ity o
f d
ith
ion
ite
(re
lati
ve
%
rem
ain
ing
)
Heating time (min)
0.2M 80°C
0.4M 80°C
0.6M 80°C
0.2M 100°C
0.4M 100°C
0.6M 100°C
0.2M 120°C
0.4M 120°C
0.6M 120°C

20
6.2 Effect of heating temperature
Figure 7: Stability of sodium dithionite at pH 9 as a function of heating temperature showing
effects of heating time and concentration of sodium dithionite solution.
Figure 7 shows the stability of sodium dithionite solutions under anaerobic conditions at pH 9 as
a function of heating temperature. The stability of sodium dithionite solution gradually
decreased with increase in heating temperature of the solution. At higher temperature and
concentration of the sodium dithionite solution the stability decreases with heating time.
The decomposition of sodium dithionite increases as the heating temperature increases at the
highest concentration and heating time.
0
20
40
60
80
100
80 100 120Sta
bil
ity o
f d
ith
ion
ite (
rela
tive %
re
main
ing
)
Heating temperature ( C)
0.2M 10 min
0.2 M 20 min
0.2M 30 min
0.4 M 10 min
0.4 M 20 min
0.4 M 30 min
0.6M 10 min
0.6 M 20 min
0.6 M 30 min

21
Figure 8: Stability of sodium dithionite at pH 11.5 as a function of heating temperature
showing effects of heating time and concentration of sodium dithionite solution.
Figure 8 shows the stability of alkaline sodium dithionite solutions under anaerobic conditions
at pH 11.5 as a function of heating temperature. The sodium dithionite solution is stable at all
conditions until 100 °C. The stability starts to decrease from 100 °C as the concentration of
solution, heating temperature and heating time increases.
Sodium dithionite solution is unstable at highest heating temperatures (120 °C) with highest
concentrations (0.4 M and 0.6 M)
The decomposition degree increases with increase in heating temperature, heating time and
concentration of the solution. The degree of decomposition is higher at highest temperature
120 °C at all conditions and low until 100 °C at all conditions.
0
20
40
60
80
100
80 100 120Sta
bil
ity o
f d
ith
ion
ite (
rela
tive %
re
main
ing
)
Heating temperature ( C)
0.2 M 10 min
0.2 M 20 min
0.2M 30 min
0.4 M 10 min
0.4 M 20 min
0.4 M 30 min
0.6 M 10 min
0.6 M 20 min
0.6 M 30 min

22
Figure 9: Stability of sodium dithionite at pH 12.5 as a function of heating temperature
showing effects of heating time and concentration of sodium dithionite solution.
Figure 9 shows the stability of sodium dithionite solutions under anaerobic conditions of pH
12.5 as a function of heating temperature. Sodium dithionite solutions are stable at this pH
under most conditions but there was a rapid decrease in the stability at the highest
temperature, concentration and heating time of the solution. Sodium dithionite at this pH 12.5
shows similar behaviour as pH 11.5. The stability decreases at the highest temperature 120 °C.
0
20
40
60
80
100
80 100 120Sta
bil
ity o
f d
ith
ion
ite
(re
lati
ve
%
rem
ain
ing
)
Heating temperature ( C)
0.2 M 10 min
0.2 M 20 min
0.2 M 30 min
0.4 M 10 min
0.4 M 20 min
0.4 M 30 min
0.6 M 10 min
0.6 M 20 min
0.6 M 30 min

23
Figure 10: Stability of sodium dithionite at pH 14 as a function of heating temperature
showing effects of heating time and concentration of sodium dithionite solution.
Figure 10 shows the stability of alkaline sodium dithionite solutions under anaerobic conditions
at pH 14 as a function of heating temperature. The stability of sodium dithionite decreases with
increase in heating temperature, heating time and concentration of the solutions. The degree of
decomposition is lower at lower concentrations, heating time and heating temperature of the
sodium dithionite solution and higher at higher concentrations, highest heating temperature
and heating time.
The degree of decomposition at pH 14 increases rapidly at the highest heating temperature of
120 °C with higher concentration 0.6 M as the heating time increases.
0
20
40
60
80
100
80 100 120Sta
bil
ity o
f d
ith
ion
ite
(re
lati
ve
%
rem
ain
ing
)
Heating temperature ( C)
0.2 M 10 min
0.2 M 20 min
0.2M 30 min
0.4 M 10 min
0.4 M 20 min
0.4 M 30 min
0.6 M 10 min
0.6 M 20 min
0.6 M 30 min
24
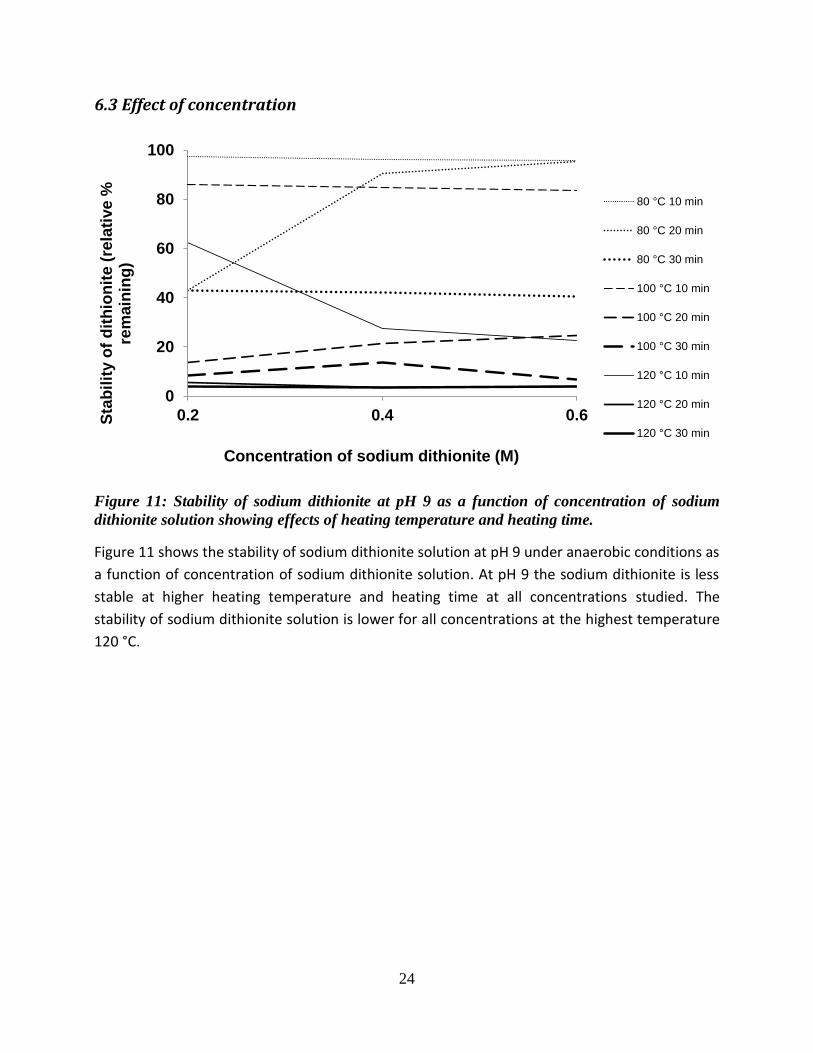
6.3 Effect of concentration
Figure 11: Stability of sodium dithionite at pH 9 as a function of concentration of sodium
dithionite solution showing effects of heating temperature and heating time.
Figure 11 shows the stability of sodium dithionite solution at pH 9 under anaerobic conditions as
a function of concentration of sodium dithionite solution. At pH 9 the sodium dithionite is less
stable at higher heating temperature and heating time at all concentrations studied. The
stability of sodium dithionite solution is lower for all concentrations at the highest temperature
120 °C.
0
20
40
60
80
100
0.2 0.4 0.6Sta
bil
ity o
f d
ith
ion
ite
(re
lati
ve
%
rem
ain
ing
)
Concentration of sodium dithionite (M)
80 °C 10 min
80 °C 20 min
80 °C 30 min
100 °C 10 min
100 °C 20 min
100 °C 30 min
120 °C 10 min
120 °C 20 min
120 °C 30 min

25
Figure 12: Stability of sodium dithionite at pH 11.5 as a function of concentration of sodium
dithionite solution showing effects of heating temperature and heating time.
Figure 12 shows the stability of sodium dithionites at pH 11.5 under anaerobic conditions as a
function of concentration of sodium dithionite solution. At pH 11.5 sodium dithionite solution is
stable under all conditions of concentrations until 100 °C. The stability decreases at all
concentrations at the higher temperature of 120 °C and the longest heating time 30 min.
0
20
40
60
80
100
0.2 0.4 0.6Sta
bil
ity o
f d
ith
ion
ite (
rela
tive %
re
ma
inin
g)
Concentration of sodium dithionite (M)
80 °C 10 min
80 °C 20 min
80 °C 30 min
100 °C 10 min
100 °C 20 min
100 °C 30 min
120 °C 10 min
120 °C 20 min
120 °C 30 min

26
Figure 13: Stability of sodium dithionite at pH 12.5 as a function of concentration of sodium
dithionite solution showing effects of heating temperature and heating time.
Figure 13 shows the stability of sodium dithionite solutions at pH 12.5 under anaerobic
conditions as a function of concentration of the solution, heating temperature and heating time.
The sodium dithionite solution at pH 12.5 is stable with respect to all concentrations studied
unless the temperature is higher than 100 °C. At higher concentration 0.6 M at highest heating
temperature (120 °C) for longest time (30 min) the stability of sodium dithionite solution
decreases.
0
20
40
60
80
100
0.2 0.4 0.6Sta
bil
ity o
f d
ith
ion
ite
(re
lati
ve
%
rem
ain
ing
)
Concentration of sodium dithionite (M)
80 °c 10 min
80 °C 20 min
80 °C 30 min
100 °C 10 min
100 °C 20 min
100 °C 30 min
120 °C 10 min
120 °C 20 min
120 °C 30 min

27
Figure 14: Stability of sodium dithionite at pH 14 as a function of concentration of sodium
dithionite solution showing effects of heating temperature and heating time.
Figure 14 shows the stability of sodium dithionite solutions under anaerobic conditions at pH 14
as a function of concentration of sodium dithionite. As the concentration increases the stability
of sodium dithionite decreases. At the highest heating temperature 120 °C the stability
decreases more rapidly with respect to increase in concentration of sodium dithionite solution.
0
20
40
60
80
100
0.2 0.4 0.6Sta
bil
ity o
f d
ith
ion
ite
(re
lati
ve
%
rem
ain
ing
)
Concentration of sodium dithionite (M)
80 °C 10 min
80 °C 20 min
80 °C 30 min
100 °C 10 min
100 °C 20 min
100 °C 30 min
120 °C 10 min
120 °C 20 min
120 °C 30 min

28
6.4 Effect of pH
Figure 15: Stability of sodium dithionite as a function of pH at heating temperature 80 °C in
alkaline conditions.
Figure 16: Stability of sodium dithionite as a function of pH at heating temperature 100 °C in
alkaline conditions.
0
20
40
60
80
100
9 10 11 12 13 14
Sta
bil
ity o
f d
ith
ion
ite
(re
lati
ve
%
rem
ain
ing
)
pH
0.2M 10min
0.2M 20min
0.2M 30min
0.4M 10min
0.4M 20min
0.4M 30min
0.6M 10min
0.6M 20min
0.6M 30min
0
20
40
60
80
100
9 10 11 12 13 14
Sta
bil
ity o
f d
ith
ion
ite (
rela
tive %
re
main
ing
)
pH
0.2M 10min
0.2M 20min
0.2M 30min
0.4M 10min
0.4M 20min
0.4M 30min
0.6M 10min
0.6M 20min
0.6M 30min

29
Figure 17: Stability of sodium dithionite as a function of pH at heating temperature 120 °C in
alkaline solutions.
In Figures 15, 16 and 17, the change in the stability of sodium dithionite as a function of pH is
shown. The sodium dithionite solution was less stable at weak and high alkaline conditions and
relatively stable at moderate alkaline conditions with pH (11.5-12.5). The degree of
decomposition for sodium dithionite solution increases with increasing heating temperature.
The stability decreases with increase in heating temperatures.
The degree of decomposition of sodium dithionite is rapid in weak alkaline condition, pH 9
when compared to moderate alkaline conditions pH 11.5 and pH 12.5. It is due to presence of
sodium hydroxide in solutions at pH 11.5 and pH 12.5. In case of pH 11.5 and pH 12.5 sodium
hydroxide was added to adjust the pH of the sodium dithionite solution which also in turn
stabilizes sodium dithionite. So the solution at pH 11.5 and pH 12.5 are relatively stable when
compared to pH 9. At higher concentrations of sodium hydroxide, the stability decreases with
increase in heating temperature, heating time and concentration of the solution. May be this is
due to the hydroxide ions that catalyse the reaction to some extent, but the effect is not
proportional to concentrations.
From previous work of researchers, the equilibrium between dimer and monomer species of
dithionite is known (Burlamacchi et al. 1969). The dimer sulfur dioxide ion (SO2-) is more
reactive than dithionite ion (S2O42-). Due to presence of the low concentrations of sulfur dioxide
ion (SO2-) in equilibrium with dithionite ion (S2O4
2-) the decomposition reaction is slow (Lambeth
and Palmer 1973). The increase in decomposition is observed in the sodium dithionite solution
0
20
40
60
80
100
9 10 11 12 13 14Sta
bil
ity o
f d
ith
ion
ite
(re
lati
ve
%
rem
ain
ing
)
pH
0.2M 10min
0.2M 20min
0.2M 30min
0.4M 10min
0.4M 20min
0.4M 30min
0.6M 10min
0.6M 20min
0.6M 30min

30
at high heating temperatures. Maybe at high temperatures, the presence of high concentrations
of sulfur dioxide ion (SO2-) in equilibrium with dithionite ion was leading to increase in degree of
decomposition of sodium dithionite solution.
At pH:s 11.5 and 12.5, sodium dithionite solution is mostly stable unless it is subjected to high
heating temperature, heating time and concentration of the solution.
At pH:s 9 and 14, sodium dithionite solution is unstable. As the heating temperature, heating
time and concentration of sodium dithionite solution increases, the stability decreased.

31
6.5 Structural changes observed by infrared spectroscopy
All spectra used in this study are aqueous ATR-FTIR spectra of wavenumber range 4000 - 525
cm-1. Figure 18 shows the complete spectra of sodium dithionite solutions at pH:s 9, 11.5, 12.5
and 14, heating temperatures of 80 °C, 100 °C and 120 °C, and heating time 30 min. The spectra
of sodium dithionite showed two strong and broad signals, at 3326 cm-1 (O-H stretching) and
1635 cm-1 (O-H bending). The two signals observed are identified as characteristic signals for
water (H2O).
Figure 18: FTIR spectra of sodium dithionite solutions in the wavenumber range of 4000 –
600 cm-1.
0
0.1
0.2
0.3
600110016002100260031003600
Ab
so
rba
nc
e
Wavenumber (cm-1)
pH 9pH 11.5pH 12.5pH 14
O-H stretching
O-H bending
3326
1635
32
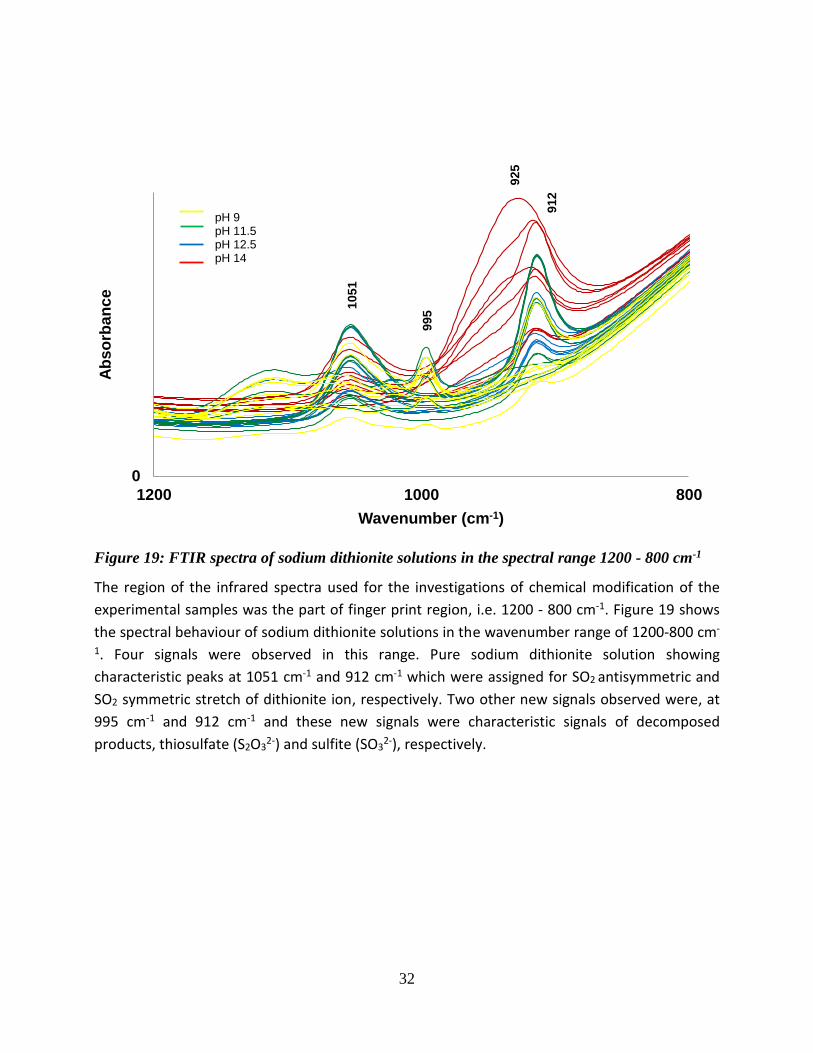
Figure 19: FTIR spectra of sodium dithionite solutions in the spectral range 1200 - 800 cm-1
The region of the infrared spectra used for the investigations of chemical modification of the
experimental samples was the part of finger print region, i.e. 1200 - 800 cm-1. Figure 19 shows
the spectral behaviour of sodium dithionite solutions in the wavenumber range of 1200-800 cm-
1. Four signals were observed in this range. Pure sodium dithionite solution showing
characteristic peaks at 1051 cm-1 and 912 cm-1 which were assigned for SO2 antisymmetric and
SO2 symmetric stretch of dithionite ion, respectively. Two other new signals observed were, at
995 cm-1 and 912 cm-1 and these new signals were characteristic signals of decomposed
products, thiosulfate (S2O32-) and sulfite (SO3
2-), respectively.
0
80010001200
Ab
so
rba
nc
e
Wavenumber (cm-1)
pH 9pH 11.5pH 12.5pH 14
10
51
995
92
5
91
2

33
6.6 Multivariate analysis
Figure 20: Scores scatter plot t1 vs t2 using SIMCA for the analyzing data with wave number
range (4000 - 525 cm-1)
Figure 20 illustrates the score plot of the complete spectra in the range of (4000 - 525 cm-1)
used for analyzing the data. The obtained spectra showed two different groups of experimental
behaviour. The sodium dithionite solutions at pH:s 9, 11.5 and 12.5 were grouped into one
group towards the left hand side to the zero and pH 14 to the right hand side. Two different
chemical reaction mechanisms were taken place by producing two different decomposed
products which could be predicted by observing Figure 20.
34
6.7 Decomposition products
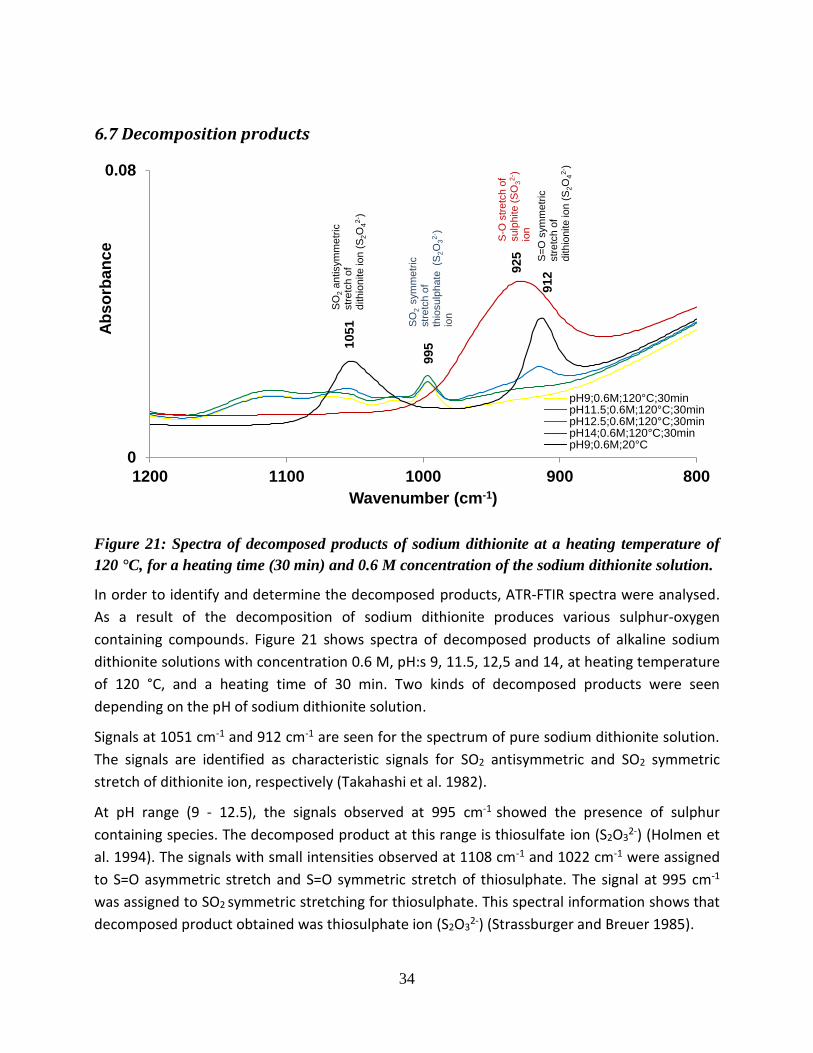
Figure 21: Spectra of decomposed products of sodium dithionite at a heating temperature of
120 °C, for a heating time (30 min) and 0.6 M concentration of the sodium dithionite solution.
In order to identify and determine the decomposed products, ATR-FTIR spectra were analysed.
As a result of the decomposition of sodium dithionite produces various sulphur-oxygen
containing compounds. Figure 21 shows spectra of decomposed products of alkaline sodium
dithionite solutions with concentration 0.6 M, pH:s 9, 11.5, 12,5 and 14, at heating temperature
of 120 °C, and a heating time of 30 min. Two kinds of decomposed products were seen
depending on the pH of sodium dithionite solution.
Signals at 1051 cm-1 and 912 cm-1 are seen for the spectrum of pure sodium dithionite solution.
The signals are identified as characteristic signals for SO2 antisymmetric and SO2 symmetric
stretch of dithionite ion, respectively (Takahashi et al. 1982).
At pH range (9 - 12.5), the signals observed at 995 cm-1 showed the presence of sulphur
containing species. The decomposed product at this range is thiosulfate ion (S2O32-) (Holmen et
al. 1994). The signals with small intensities observed at 1108 cm-1 and 1022 cm-1 were assigned
to S=O asymmetric stretch and S=O symmetric stretch of thiosulphate. The signal at 995 cm-1
was assigned to SO2 symmetric stretching for thiosulphate. This spectral information shows that
decomposed product obtained was thiosulphate ion (S2O32-) (Strassburger and Breuer 1985).
0
0.08
800900100011001200
Ab
so
rban
ce
Wavenumber (cm-1)
pH9;0.6M;120°C;30minpH11.5;0.6M;120°C;30minpH12.5;0.6M;120°C;30minpH14;0.6M;120°C;30minpH9;0.6M;20°C
995
925
912
SO
2a
ntisym
me
tric
str
etc
h o
f d
ith
ion
ite
io
n (
S2O
42
- )
SO
2 sym
me
tric
str
etc
h o
f th
iosu
lph
ate
(S
2O
32
- )
ion
S=
Osym
me
tric
str
etc
h o
f d
ith
ion
ite
ion
(S
2O
42
- )
S-O
str
etc
h o
fsu
lph
ite
(S
O3
2- )
io
n
1051
35
New strong and broad signal appeared at 925 cm-1 for pH 14 showing the presence of sulphite
(SO32-) (Takahashi et al. 1982). The signal at 925 cm-1 was assigned to S-O stretch of sulphite.
The decomposition reaction undergoes two mechanisms based on the pH; a disproportionation
reaction mechanism and an electron transfer disproportionation reaction mechanism. Possibly
at weak alkaline conditions the sodium dithionite undergoes a disproportionation reaction and
at strong alkaline conditions it follows an electron transfer disproportionation reaction (Janzen
1972).
The decomposition of the sodium dithionite solution is mainly depending on the pH of the
solution. The following reactions show the possible decomposed products of sodium dithionite
solution under alkaline conditions.
In strong alkaline conditions (pH 14):
In moderate alkaline conditions (pH 11.5 and pH 12.5):
In weak alkaline conditions (pH 9):
Table 2: Infrared frequencies of decomposed products and sodium dithionite solution.
Name Chemical formula Frequencies (cm-1)
Dithionite S2O42- 1051 (SO2 antisymmetric stretch)
912 (SO2 symmetric stretch)
Thiosulphate S2O32- 995 (SO2 symmetric stretch)
1108 (S=O asymmetric stretch)
1022 (S=O symmetric stretch)
Sulphite SO32- 925 (S-O stretch)

36
7. Conclusions
ATR – FTIR spectra have been used for determining stability of sodium dithionite under alkaline
conditions. The studies showed that the main factors having a significant effect on the
decomposition and stability of sodium dithionite were heating temperature, heating time,
concentration of the solution and pH. As the heating temperature, heating time and
concentration increases the degree of decomposition increases. The decomposition was higher
at weak (pH 9) and high (pH 14) alkaline conditions and was found to be relatively lower under
moderate (pH:s 11.5 and 12.5) alkaline conditions. The decomposition was also low at lower
concentrations of sodium hydroxide and higher at higher concentration of sodium hydroxide
present in the solution.
The stability of sodium dithionite solution at certain pH decreases with increasing heating
temperature, heating time and concentration of solution. In alkaline conditions, the stability
decreased rapidly at weak (pH 9) and strong (pH 14) alkaline conditions and was rather low at
moderate (pH: s 11.5 and 12.5) alkaline conditions. Sodium dithionite produces two different
decomposed products based on the pH of the solution. Thiosulfate (S2O32-) is formed as a
decomposed product of sodium dithionite solution having pH range of (9-12.5) and sulphite
(SO32-) is formed at pH 14. This showed that the aqueous solution of sodium dithionite thermally
followed two different chemical reaction mechanisms based on the pH of the solution.
From this study it was concluded that the thermal stability of a sodium dithionite solution was
mainly dependent on the pH of the solution. And the thermal stability of sodium dithionite with
certain pH decreased with increase in heating time, heating temperatures and concentration of
sodium dithionite.

37
8. Recommendation and future work
In this study it was found out that the sodium dithionite solutions were more stable under
certain conditions. Therefore, it would be interesting to conduct further studies on using sodium
dithionite solution as a pulping additive to the kraft cooking using the following conditions:
The sodium dithionite solution, with concentration of 0.4 M at temperature not higher than 100
°C at pH 12.5 can be used as an additive in kraft cooking.

38
9. Acknowledgement
I am very thankful to my supervisors, Lennart Salmén, Jasna Stevanic Srndovic and Mikael
Lindström for their guidance, support and fruitful discussions throughout the project. I
appreciate that Mikael Lindstrom and Lennart Salmén gave me the opportunity to write my
thesis at Innventia AB.
I would also like to thank Anne-Mari Olsson, Tomas Larsson and Joanna Hornatowska for their
welcoming smiles and wishes every day.

39
10. References
Aurell, R. and Hartler, N. (1965): Kraft pulping of pine; Part 2 The influence of charge of alkali
on the yield carbohydrate function and properties of the pulp, Sven. Pappertid. 68(4), 97-102.
Burlamacchi, L., Guareine, G. and Tiezzi, E. (1969): Mechanism of decomposition of sodium
dithionite in aqueous solution, Trans. Faraday Soc. 65, 496-502.
Camacho, F., Páez, P.M., Blázquez, G., Jiménez, M.C. and Fernández, M. (1995): Influence
of pH on the oxygen absorption kinetics in alkaline sodium dithionite solutions, Chem. Eng. Sci.
50 (7), 1181-1186.
Cleghorn, H.P. and Davies, M.B. (1970): Thermal decomposition of oxy sulfur salts and the
infrared spectra of their products, J. Chem. Soc. A. (0), 137-141.
De Carvalho, L.M. and Schwedt, G. (2001): Polarographic determination of dithionite and its
decomposition products: Kinetic aspects, stabilizers and analytical application. Anal. Chem.
436(2), 293-300.
De Vries, J.G. and Kellogg, R.M. (1980): Reduction of aldehydes and ketones by sodium
dithionite, J. Org. Chem. 45(21), 4126-4129.
Erdey, L., Simon, J., Gál, S. and Liptay, G. (1966): Thermoanalytical properties of analytical
gradients-IVA* : Sodium salts, Pergamon Press Ltd, Talanta. 13(1), 67-80.
Fox, J. L. (1974): Sodium dithionite reduction of flavin, FEB letters, 39 (1), 53-55
Greenwood, N.N. and Earnshaw, A. (1984): Chemistry of the elements, Pergamon Press Ltd,
Oxford, 15(18), 1564.
Holmen, D.A., Thompson, A.W., Bennett, D.W. and Otvos, J.D. (1994): Quantitative
determination of sulfur-oxygen anion concentrations in aqueous solution: Multicomponent
analysis of attenuated total reflectance infrared spectra, Anal. Chem. 66(9), 1378-1384.
Janzen, E.G. (1972): ESR studies of thermal decomposition mechanisms. II. Electron spin
resonance study of the SO2– formation in the thermal decomposition of sodium dithionite,
sodium and potassium metabisulfite, and sodium hydrogen sulfate, J. Phys. Chem. 76(2), 157-
162.
Jayme, G. and Wörner, G. (1952): Über and AufschuluB on Fichtenholz mit Laugen erhöten
reductions potentials, Holz als Roh- und Werkstoff. 10(6), 381-387 (in German).
Kilroy, W.P. (1980): Anaerobic decomposition of sodium dithionite in alkaline solution, J. Inorg.
Nucl. Chem. 42(7), 1071-1073.
Kleppe, P.J. (1970): Kraft pulping, Tappi, 53(1), 35-47.

40
Kovács, K.M. and Rábai , G. (2002): Mechanism of oscillatory decomposition of dithionite ion in
a flow reactor, Chem. Commun. 7, 790-791.
Lambeth, D.O. and Palmer, G. (1973): The kinetics and mechanism of reduction of electron
transfer proteins and other compounds of biological interest by dithionite, J. Bio. Chem.17 (10),
6095-6103.
Lister, M.W. and Garvie, R C. (1959): Sodium dithionite; Decomposition in aqueous solution
and in the solid state, Can. J. Chem. 37(9), 1567-1574.
Markarov, S.V. and Silaghi-Dumitrescu, R. (2013): Sodium dithionite and its relatives: Past and
present, J. Sul. Chem. 34(4), 444-449.
Mayhew, S.G. (1978): The redox potential of dithionite and SO2- from equilibrium reactions with
flavodoxins, methyl Viologen and hydrogen plus hydrogenase, Eur. J. Biochem. 85(2), 535-547.
Meyer, J. (1903): Zur kenntnis der hydro schwefligen säure, Z. Anorg. Allg. Chem. 34, 43-61.
Miller, F.A and Wilkins, C.H. (1952): Infrared spectra and characteristic frequencies of inorganic
ions and their use in qualitative analysis, Anal. Chem. 24(8), 1253-1294
Rinker, R.G., Gordon, T.P., Mason, D.M., Sakaida, R.R. and Corcoran, W.H. (1960): Kinetics and
mechanism of the sir oxidation of the dithionite ion (S2O42-) in aqueous solution, J. Phys. Chem.
64(5), 573-581.
Selwyn, L. and Tse, S. (2008): The chemistry of sodium dithionite and its use in conservation,
Chem. Eng. Sci. 53(2), 61-73.
Sigh, J., Kad, G.L., Sharma, M., and Dhillon, R.S (1998): Chemo selective carbonyl reduction of
functionalized aldehydes and ketones to alcohols with sodium dithionite, Tylor and Francis, 28
(12), 2253-2256.
Spencer, M.S. (1967): Chemistry of dithionite; Part 1 Kinetics of decompositions in aqueous
bisulfate solution, Trans. Faraday Soc. 63, 2510-2115.
Steudel, R., Göbel, T. and Holdt, G. (1988): The molecular composition of hydrophilic sulfur sols
prepared by acid decomposition of thiosulphate, J. Chem. Sci. 43(2), 203-218.
Strassburger, J. and Breuer, M.M. (1985): Quantitative Fourier transform infrared spectroscopy
of oxidized hair, J. Soc. Cosmetic. Chem. 36, 61-74.
Takahashi, H., Kaneko, N. and Miwa, K. (1982): Raman and infrared studies of the structure of
the dithionite ion in aqueous solution band force constants of S2Ox 2- type ions, Z. Anorg. Chem.
38(11), 1147-1153.
Wang, Y., Saad, A.B.M, Saur, O., Lavallery, J.C. and Morrow, B.A. (1998): FTIR study of
adsorption and reaction of SO2 and H2S on Na/SiO2, Appl. Cat. Env. 16(3), 279-290.

41
Wang, Y., Lindström, M.E., Lawoko, M. and Theliander, H. (2014): Pretreatment and enzymatic
treatment of spruce: Improved yield and pulp properties by adding sodium dithionite in kraft
pulping of spruce, Ph. D. Thesis, Royal Institute of Technology, 28-46.
Wayman, M. and Lem, W.J. (1970): Decomposition of sodium dithionite; Part II A reaction
mechanism for the decomposition of aqueous sodium dithionite, Can. J. Chem. 48(5), 782-787.
Weil, E.D., Sandler, S.R. and Gernon, M. (1953): Sulfur compounds; In krik-Othmer
encyclopedia of chemical technology, John Wiley and Sons, NJ, Hoboken, 23(5), 621-701.
Wollak, R. (1930): Zur Jodometrischen analyse eines gemenges von hydrosulfate, sulfit und
thiosulfate, J. Anal. Chem. 80(1), 1-4.
Zang, Z. and Ewing, G.E. (2002): Infrared spectroscopy of SO2 aqueous solutions, Spectrochem.
Acta. 58(16), 2105-2113.

42
Appendix 1: Scatterplots for each pH of sodium dithionite
solution using Simca
Multivariate analysis:
The multivariate data analysis of IR spectra was performed in SIMCA-14 1998-2015 (Umetrics
AB). The methods used are principle component analysis (PCA).
PCA is a projection method that describes the systematic variation in a data table X with a few
latent variables called scores (T). E is the residual variation in X. The weight of each variable in
the latent variables called loadings (P). PCA is used to get an overview of spectral data, detect
outliers and grouping of samples and also help to interpret some of the observed groupings.
The appendix contains diagrams obtained using SIMCA-14 of alkaline sodium dithionite solution
at each pH. This helps in clear understanding of the relationship between reponses’s Y of
different groups within the same pH. The Figures 22 - 25 shows the grouping of experimental
runs based on the experimental behaviour of sodium dithionite solution at each pH.
Figure 22: Scatter plot for pH 9 of wavenumber in the range of 4000- 525 cm-1

43
Figure 23: Scatter plot for pH 11.5 of wavenumber in the range of 4000 - 525 cm-1
.
Figure 24: Scatter plot for pH 12.5 of wavenumber in the range of 4000 - 525 cm-1

44
Figure 25: Scatter plot for pH 14 of wavenumber in the range of 4000 - 525 cm-1

45
Appendix 2: MODDE
Experimental design:
Experimental design is a methodology which allows the experimenter to systematically vary multiple factors with a context of one experimental design. The experimental design was mainly done on basing MODDE experimental design for designing the runs in the first place. The experimental runs are designed in order to reduce the number of experiments. Table 3 illustrates the design of run (a screening design: 4 factors, 1 midpoint, total 19 runs, 2 replicates). The results obtained are not enough to predict the stability of sodium dithionite solution. In order to study the behaviour of sodium dithionite more runs were added latter.
Table 3: Experimental design using MODDE software.
Exp. no Run order pH Concentration(M) Time(min) Temperature(◘C)
1 1 14 0,6 120 10
2 2 14 0,2 80 30
3 3 14 0,2 120 10
4 4 11,5 0,4 100 20
5 5 9 0,6 120 30
6 6 11,5 0,4 100 20
7 7 9 0,6 120 10
8 8 11,5 0,4 100 20
9 9 9 0,6 80 30
10 10 9 0,2 120 30
11 11 9 0,2 80 10
12 12 14 0,6 80 30
13 13 9 0,6 80 10
14 14 14 0,2 80 10
15 15 14 0,2 120 30
16 16 14 0,6 80 10
17 17 14 0,6 120 30
18 18 9 0,2 80 30
19 19 9 0,2 120 10

46
The significant factors affecting alkaline aqueous sodium dithionite solution decomposition under anaerobic conditions from MODDE experimental design can be seen in Figures 26 -29. The coefficient plot shows the coefficients related to scaled and centered variables. The plot expresses change in the response when the factors vary from low to high. Figures 26- 29 illustrate the significant effect of each factor on the stability of sodium dithionite solution at each pH.
Figure 26: MODDE Coefficients plot for pH 9, heating temperature (80 - 120 °C), heating
time (10 - 30min) and concentration of the solution (0.2 M - 0.6 M).

47
Figure 27: MODDE Coefficient plot for pH 11.5, heating temperature (80 - 120 °C), heating
time (10 - 30 min) and concentration of the solution (0.2 M - 0.6 M).
Figure 28: MODDE Coefficients plot for pH 12.5, heating temperature (80 - 120 °C), heating
time (10 - 30 min) and concentration of the solution (0.2 M - 0.6 M).

48
Figure 29: MODDE Coefficient plot for pH 14, heating temperature (80 - 120 °C), heating
time (10 - 30 min) and concentration of the solution (0.2 M - 0.6 M).

49
Appendix 3: ATR-FTIR spectra of sodium dithionite solution at
each pH
Figure 30: FTIR spectra for pH 9 at different concentrations of the sodium dithionite solution
(0.2 M - 0.6 M), heating time (10 - 30 min), and heating temperature (80 - 120 °C).
Figure 31: FTIR spectra for pH 11.5 at different concentrations of sodium dithionite solution
(0.2 M - 0.6 M), heating time (10 - 30 min), and heating temperature (80 - 120 °C).
0
0.05
800900100011001200
Ab
so
rba
nc
e
Wavenumber (cm-1)
pH 9
9,.2,80,30 9,.2,80,10 9,.2,80,20 9,.4,80,30 9,.4,80,20 9,.4,80,10
9,.6,80,30 9,.6,80,10 9,.6,80,20 9,.2,100,30 9,.2,100,20 9,.2,100,10
9,.4,100,30 9,.4,100,20 9,.4,100,10 9,.6,100,30 9,.6,100,20 9,.6,100,10
9,.2,120,30 9,.2,120,10 9,.2,120,20 9,.4,120,30 9,.4,120,20 9,.4,120,10
9,.6,120,30 9,.6,120,10 9,.6,120,20
0
0.05
800900100011001200
Ab
so
rban
ce
Wavenumber (cm-1)
pH 11.5
11.5,.2,80,30 11.5,.2,80,20 11.5,.2,80,10 11.5,.4,80,30 11.5,.4,80,20
11.5,.4,80,10 11.5,.6,80,30 11.5,.6,80,20 11.5,.6,80,10 11.5,.4,100,20r
11.5,.4,100,20r 11.5,.2,100,30 11.5,.2,100,20 11.5,.2,100,10 11.5,.4,100,30
11.5,.4,100,10 11.5,.6,100,30 11.5,.6,100,20 11.5,.6,100,10 11.5,.2,120,30
11.5,.2,120,20 11.5,.2,120,10 11.5,.4,120,30 11.5,.4,120,20 11.5,.4,120,10
11.5,.6,120,30 11.5,.6,120,20 11.5,.6,120,10

50
Figure 32: FTIR spectra for pH 12.5 at different concentrations of sodium dithionite solution
(0.2 M - 0.6 M), heating time (10 - 30 min), and heating temperature (80 - 120 °C).
Figure 33: FTIR spectra for pH 14 at different concentrations of sodium dithionite solution
(0.2 M - 0.6 M), heating time (10 - 30 min), and heating temperature (80 - 120 °C).
0
0.05
800900100011001200
Ab
so
rba
nc
e
Wavenumber (cm-1)
pH 12.5
12,.2,80,30 12,.2,80,20 12,.2,80,10 12,.4,80,30 12,.4,80,20 12,.4,80,10
12,.6,80,30 12,.6,80,20 12,.6,80,10 12,.2,100,30 12,.2,100,20 12,.2,100,10
12,.4,100,30 12,.4,100,20 12,.4,100,10 12,.6,100,30 12,.6,100,20 12,.6,100,10
12,.2,120,30 12,.2,120,20 12,.2,120,10 12,.4,120,30 12,.4,120,20 12,.4,120,10
12,.6,120,30 12,.6,120,20 12,.6,120,10
0
0.05
800900100011001200
Ab
so
rban
ce
Wavenumber (cm-1)
pH 14
14,.2,80,30 14,.2,80,10 14,.2,80,20 14,.4,80,30 14,.4,80,20 14,.4,80,10
14,.6,80,30 14,.6,80,10 14,.6,80,20 14,.2,100,30 14,.2,100,10 14,.2,100,20
14,.4,100,30 14,.4,100,20 14,.4,100,10 14,.6,100,30 14,.6,100,10 14,.6,100,20
14,.2,120,30 14,.2,120,10 14,.2,120,20 14,.4,120,30 14,.4,120,20 14,.4,120,10
14,.6,120,30 14,.6,120,10 14,.6,120,20

51
Appendix 4: IR frequencies of sulphur containing compounds Table 4: IR frequencies of sulfur containing compounds:
Name of the compound Chemical formula Frequencies (cm-1)
Bisulphite HSO3- 3662 (OH stretching)
HS stretching 2450 to 2620,
1047, 1054,1154,1219 (SO stretching)
610, 368, 415, 526, 610.
Meta sulphite S2O52- 966, 660-650, 568, 530-515, 450
Sulphite SO32- 1210, 1203, 1224
912 (S-O stretch)
Bisulphate HSO4 - 1050 (symmetric SO3 stretch),
890-900 (symmetric S-OH stretch),
590-600 (symmetric SO3 deformation)
1200 (antisymmetric SO2 stretch)
400-420 (asymmetric SO3 deformation)
590-600 (asymmetric SO3 rock)
Sulphate SO42- 980 (symmetric SO stretch)
450 (asymmetric OSO deformation)
1090-1210 (triply degenerate SO
stretch)
640 (triply degenerate OSO
deformation)
1003,1139 (strong band)
Thiosulphate S2O32- 1196, 1022, 633, 525
1042 (S=O stretching)
995 (SO2 symmetric stretch)
1108 (S=O symmetric stretch)
1022 (S=O symmetric stretch)
Dithionite S2O42- 625
1051 (SO2 antisymmetric stretch)
912 (SO2 symmetric stretch)

52
Dithionate S2O62- 1205, 1050-1030, 640, 525, 460, 385
Trithionate S3O6 2- 1200-1250 (very strong)
1000-1050 (strong)
530-670 (weak –medium)
420-430 (very weak)
Tetrathionate S4O6 2- 1270-1000 (very sharp)
1000-1015 (sharp)
644, 610, 543, 532, 525 (weak –
medium)
397, 390, 375, 303 (very weak)
Sulphur S 500-700 (weak)
(Miller and Wilkins 1952; Rinker et al. 1960; Takahashi et al. 1982; Wang et al. 1998; Zang and
Ewing 2002; Takahashi et al. 1982)

53