Embed Size (px)
Citation preview

* Corresponding author: [email protected]
A study on the numerical modelling of UHPFRC-strengthened members
Renaud Franssen1,2*, Serhan Guner3, Luc Courard2, and Boyan Mihaylov2
1FRIA (F.R.S.-F.N.R.S), National Fund for Scientific Research, Brussels, Belgium 2ArGEnCo Department, Research Unit in Urban and Environmental Engineering, University of Liège, Allée de la Découverte 9, Liège
(4000), Belgium 3Department of Civil Engineering, University of Toledo, 2801 W Bancroft St., MS 307, NI 3021, Toledo, OHIO (43606-3390), USA
Abstract. The maintenance of large aging infrastructure across the world creates serious technical,
environmental, and economic challenges. Ultra-high performance fibre-reinforced concretes (UHPFRC)
are a new generation of materials with outstanding mechanical properties as well as very high durability
due to their extremely low permeability. These properties open new horizons for the sustainable
rehabilitation of aging concrete structures. Since UHPFRC is a young and evolving material, codes are
still either lacking or incomplete, with recent design provisions proposed in France, Switzerland, Japan,
and Australia. However, engineers and public agencies around the world need resources to study, model,
and rehabilitate structures using UHPFRC. As an effort to contribute to the efficient use of this promising
material, this paper presents a new numerical modelling approach for UHPFRC-strengthened concrete
members. The approach is based on the Diverse Embedment Model within the global framework of the
Disturbed Stress Field Model, a smeared rotating-crack formulation for 2D modelling of reinforced
concrete structures. This study presents an adapted version of the DEM in order to capture the behaviour
of UHPFRC by using a small number of input parameters. The model is validated with tension tests from
the literature and is then used to model UHPFRC-strengthened elements. The paper will discuss the
formulation of the model and will provide validation studies with various tests of beams, columns and
walls from the literature. These studies will demonstrate the effectiveness of the proposed modelling
approach.
1 Introduction
Around the world, the maintenance of large aging
infrastructure is a persistent problem. The amount of
time and investments needed for rehabilitation increases
permanently. At the same time, solutions for repair are
not durable and require frequent inspections. The limited
sustainability of rehabilitation techniques raises the price
of maintenance and obliges public agencies to focus on
the most deteriorated structures while others are ignored.
Subsequently, the number of structures which will need
repair effort in the future will increase, considering also
that a large portion of the current public infrastructure in
the western world was built in the 1970’s and 80’s. All
these bridges, tunnels and other critical infrastructure
approach the age of 50 years at which major repair
measures are usually necessary.
Considering these pressing issues, ultra-high
performance fibre-reinforced concretes (UHPFRC) are a
promising class of materials in the field of repair,
rehabilitation and strengthening of concrete structures
[1,2]. They are based on a very fine granulometry of the
constituting particles with a small water-to-cement ratio,
and also include steel fibres [3]. This composition
provides enhanced properties that are very relevant to
structural repairs. UHPFRC is characterized by very high
strengths in compression (150-300 MPa) [4] and, more
importantly, it also exhibits enhanced tension behaviour
both in terms of strength and ductility [5]. The steel
fibres bridge the cracks and improve the crack control,
resulting in a significantly more ductile behaviour than
plain concrete. The enhanced tension behaviour can be
used for example for the strengthening of existing
members with insufficient shear capacity [6]. In addition
to these mechanical properties, UHPFRC is also a quasi-
impermeable material with high resistance to aggressive
environment [7]. This property is very important for the
rehabilitation of existing structures as UHPFRC layers
can be used to protect the concrete and reinforcement,
and in this way offset or completely eliminate
subsequent durability issues.
Despite its enhanced properties, the use of UHPFRC
for structural strengthening remains relatively limited. A
main reason for this is the lack of commonly accepted
models and approaches for evaluating the resistance of
UHPFRC-strengthened structures. While the awareness
among structural engineers about the properties of
MATEC Web of Conferences 199, 09001 (2018) https://doi.org/10.1051/matecconf/201819909001ICCRRR 2018
© The Authors, published by EDP Sciences. This is an open access article distributed under the terms of the Creative Commons Attribution License 4.0
(http://creativecommons.org/licenses/by/4.0/).

UHPFRC is growing, significant research is still needed
to provide practitioners and authorities with reliable
tools for design calculations. It is therefore the purpose
of this paper to contribute towards this objective by
describing and validating a nonlinear finite element
approach. The goal is to use an existing formulation for
the behaviour of reinforced and fibre-reinforced concrete
(FRC) [8, 9], and to extend its application to reinforced
concrete beams and columns strengthened with
UHPFRC layers. The validation of the model is
performed with 21 tests from 7 experimental studies
reported in the literature [10-16].
2 Constitutive models
In this study, two models will be used for the modelling
of UHPFRC. The finite element simulations will be
based on the Disturbed Stress Field Model (DSFM) for
reinforced concrete proposed by Vecchio (2000) [8].
This model is implemented in the non-linear finite
element software VecTor2 [17, 18] in a plane-stress
formulation. The additional contribution of fibres in the
concrete is modelled with the Diverse Embedment
Model [9] (DEM) integrated in the DSFM. Therefore,
the DSFM in combination with the DEM are used for the
modelling of fibre-reinforced concrete structures. In this
study, recommendations are provided on how to apply
the same formulation to UHPFRC.
2.1. Disturbed stress field model
The DSFM is a smeared rotating crack model that
originates from the modified compression field theory
for reinforced concrete elements subjected to shear [19].
In the DSFM, the cracks are assumed parallel to the
principal compressive stress directions in the concrete,
while the principal strain directions deviate from the
stress directions due to slip displacements in the cracks.
The slip displacements and crack widths are used to
calculate aggregate interlock stresses transferred across
the cracks. In addition to aggregate interlock, the DSFM
also accounts for the tension stiffening and softening of
the concrete, compression softening and confinement of
the concrete, as well as the yielding of the reinforcement.
2.2 Diverse embedment model for FRC
The DEM is used for modelling the tension behaviour of
fibre-reinforced concrete (FRC). The fundamental
assumption of the model is that the tensile stresses in the
cracks of FRC can be expressed as the sum of a concrete
contribution and fibres contribution (Figure 1). This
assumption was introduced by Voo and Foster [20] who
developed a variable engagement model (VEM) for
FRC. The DEM is largely based on this method, but also
includes additional phenomena such as the effect of
unsymmetrical anchorage of the fibres and hooked
fibres. As evident from Figure 1, the models predict that
as the crack opens, the tension transferred by concrete
diminishes quickly (tension softening) while the fibres
get activated and provide a more ductile post-peak
behaviour.
Figure 1. Principle of UHPFRC models (adapted from [20])
While the modelling of the concrete in tension has
been established in various codes and recommendations,
the DEM defines the participation of the fibres as
follows:
𝑓𝑓 = 𝛼𝑓𝑉𝑓𝜎𝑓,𝑐𝑟,𝑎𝑣𝑔 (1)
where 𝑓𝑓 is the tensile stress acting on the concrete area
and attributed to the fibres, 𝛼𝑓 is a factor that accounts
for fibre orientation, 𝑉𝑓 is the fibre volumetric ratio, and
𝜎𝑓,𝑐𝑟,𝑎𝑣𝑔 is the average fibre stress at the crack. This last
quantity is obtained by double integration across all fibre
angles 𝜃 and embedment lengths 𝑙𝑎:
𝜎𝑓,𝑐𝑟,𝑎𝑣𝑔 =2
𝑙𝑓∫ ∫ 𝜎𝑓,𝑐𝑟(𝑙𝑎, 𝜃) sin 𝜃
𝜋/2
0
𝑑𝜃 𝑑𝑙𝑎
𝑙𝑓/2
0
(2)
This model uses a relatively limited number of input
properties which do not require any tests other than a
standard compression test. The tensile resistance due to
the fibres is a function of the fibre diameter, fibre length,
steel tensile strength, and the maximal bond strength
between the concrete and the fibres. In both the DEM
and VEM for straight fibres and regular concrete, the
bond strength is defined as 𝜏𝑓,𝑚𝑎𝑥 = 0,396 √𝑓𝑐′ [MPa],
where 𝑓𝑐′ is the compressive strength of the concrete.
Concerning UHPFRC, it is proposed to increase the
bond resistance in recognition of the high density and
high cement content of the UHPFRC matrix. Based on
comparisons with tests, the value of 𝜏𝑓,𝑚𝑎𝑥 is modified
to:
𝜏𝑓,𝑚𝑎𝑥 = 0,75 √𝑓𝑐′ (3)
Figure 2 shows the difference in tensile behaviour of
FRC and UHPFRC with identical fibres and fibre ratios
(i.e. Vf=1.5%, fibre length = 20 mm and fibre diameter =
0.3 mm) as predicted by the DEM. The compressive
strength of the FRC is 50 MPa, while that of the
UHPFRC is three times higher. It can be seen that the
UHPFRC exhibits higher tensile strength estimated
as 0.33 √𝑓𝑐′. The descending branches of the curves are
associated with the pullout behaviour of the fibres, and
Total
Concrete
Fibres
MATEC Web of Conferences 199, 09001 (2018) https://doi.org/10.1051/matecconf/201819909001ICCRRR 2018
2

therefore depend to a large extend on the bond strength.
The bond between the fibres and matrix is stronger for
ultra-high performance concrete, and it results in
somewhat higher ductility. It should be noted though that
the fibres chosen for this comparison are more typical
for ultra-high performance fibre reinforced concrete than
for FRC. The fibres in FRC are usually longer, thicker,
and with lower volumetric ratio.
Figure 2. Modelling of FRC and UHPFRC based on the DEM
In the disturbed stress field model formulation
(DSFM), the predictions of the DEM are used to
evaluate the stresses in the fibre-reinforced concrete in
the principal tension direction. However, as the DSFM is
a smeared crack approach while the DEM focusses on a
discrete crack, it is necessary to establish a relationship
between the crack width and the average strains in the
concrete. The expression used in the VecTor2 code is
[21]
𝑤 = (1.7 +3.4 𝑉𝑓𝑙𝑓
𝑑𝑓) ⋅ 𝜀1 ⋅ 𝑠𝑐𝑟 (4)
where 𝜀1 is the average principal tensile strain and 𝑠𝑐𝑟 is
the average crack spacing. The term in the brackets
represents the ratio between the maximum crack width
and the average crack width measured in FRC tests. The
authors of this expression have also proposed an
expression for 𝑠𝑐𝑟 in normal strength members with
fibres and conventional reinforcement. However, based
on studies of UHPFRC, Jungwirth and Muttoni [22] and
Sigrist and Rauch [23] have proposed a simpler
expression which is adopted in this paper:
𝑠𝑐𝑟 = 0.75 𝑙𝑓 (5)
where lf is the fibre length. This equation is easy to use
and has shown adequate results in the modelling of
UHPFRC specimens.
In terms of compression response, the UHPFRC is
modelled again on the basis of a model for FRC [24]. In
addition to the compressive strength of the concrete, the
other important input to the model is the modulus of
elasticity which is determined from tests or is assumed
equal to 50 GPa.
Finally, as mentioned earlier, the DSFM also
accounts explicitly for slip displacements in the cracks.
In FRC this slip is associated with aggregate interlock
shear stresses across the cracks, but also with tangential
stress associated with the fibres. In the modelling of
UHPFRC, the aggregate interlock is limited due to the
small aggregate size (0.6-1.3 mm), while details about
the modelling of the fibre stresses are provided in [25].
3 Modelling of UHPFRC-strengthened beams
In this chapter, the described finite element formulation
will be used to model UHPFRC-strengthened beams
from the literature. Different strengthening layouts will
be considered, i.e. a layer of UHPFRC cast on the
compressive side of the section, on the tensile side, or U-
shaped layers. In addition, layers with and without
conventional steel reinforcement will be modelled.
The study of strengthened beams will first focus on a
test series by Safdar et al. [12] which consisted of four
specimens with rectangular sections (beam B0, BL20,
BL40 and BL60). All beams had identical 400 mm by
250 mm sections reinforced with symmetrical top and
bottom longitudinal bars as well as stirrups. The
longitudinal reinforcement ratio was 0.44% while the
stirrups ratio was 0.31%. The compressive strength of
the concrete was 29.7 MPa. The main properties of the
concrete members as well as the UHPFRC layers are
provided in Table 1.
The beams from the BL series were reinforced with
UHPFRC layers cast on the tension side of the section.
The only variable of the series was the thickness of the
layers. To cast the layers, the concrete at the bottom of
the section was removed by water-jetting. Because the
thickness of the layers was 0, 20 mm, 40 mm and 60
mm, the longitudinal reinforcement in specimens BL40
and BL60 was respectively partially and fully encased in
UHPFRC. The compressive strength of the strengthening
material was 156 MPa, the fibre volumetric ratio was
3%, and the fibre length and diameter were respectively
13 mm and 0.16 mm.
The tests specimens were loaded monotonically to
failure under symmetrical four-point bending as shown
in Figure 3. The length of the two symmetrical shear
spans was 1000 mm, resulting in a shear-span-to-
effective-depth ratio a/d of 2.8. The control specimen
B0, which did not have UHPFRC layers, failed in
flexure by yielding of the bottom longitudinal
reinforcement and eventual crushing of the concrete at
the top of the section.
MATEC Web of Conferences 199, 09001 (2018) https://doi.org/10.1051/matecconf/201819909001ICCRRR 2018
3
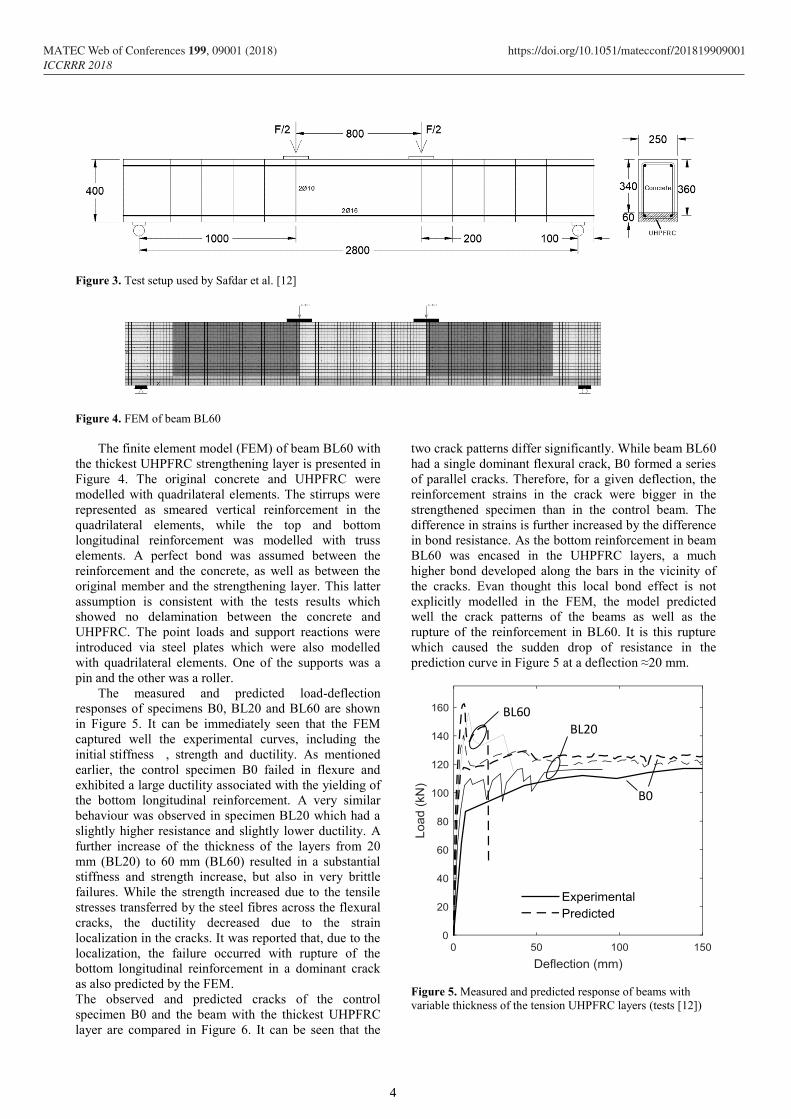
Figure 3. Test setup used by Safdar et al. [12]
Figure 4. FEM of beam BL60
The finite element model (FEM) of beam BL60 with
the thickest UHPFRC strengthening layer is presented in
Figure 4. The original concrete and UHPFRC were
modelled with quadrilateral elements. The stirrups were
represented as smeared vertical reinforcement in the
quadrilateral elements, while the top and bottom
longitudinal reinforcement was modelled with truss
elements. A perfect bond was assumed between the
reinforcement and the concrete, as well as between the
original member and the strengthening layer. This latter
assumption is consistent with the tests results which
showed no delamination between the concrete and
UHPFRC. The point loads and support reactions were
introduced via steel plates which were also modelled
with quadrilateral elements. One of the supports was a
pin and the other was a roller.
The measured and predicted load-deflection
responses of specimens B0, BL20 and BL60 are shown
in Figure 5. It can be immediately seen that the FEM
captured well the experimental curves, including the
initial stiffness , strength and ductility. As mentioned
earlier, the control specimen B0 failed in flexure and
exhibited a large ductility associated with the yielding of
the bottom longitudinal reinforcement. A very similar
behaviour was observed in specimen BL20 which had a
slightly higher resistance and slightly lower ductility. A
further increase of the thickness of the layers from 20
mm (BL20) to 60 mm (BL60) resulted in a substantial
stiffness and strength increase, but also in very brittle
failures. While the strength increased due to the tensile
stresses transferred by the steel fibres across the flexural
cracks, the ductility decreased due to the strain
localization in the cracks. It was reported that, due to the
localization, the failure occurred with rupture of the
bottom longitudinal reinforcement in a dominant crack
as also predicted by the FEM.
The observed and predicted cracks of the control
specimen B0 and the beam with the thickest UHPFRC
layer are compared in Figure 6. It can be seen that the
two crack patterns differ significantly. While beam BL60
had a single dominant flexural crack, B0 formed a series
of parallel cracks. Therefore, for a given deflection, the
reinforcement strains in the crack were bigger in the
strengthened specimen than in the control beam. The
difference in strains is further increased by the difference
in bond resistance. As the bottom reinforcement in beam
BL60 was encased in the UHPFRC layers, a much
higher bond developed along the bars in the vicinity of
the cracks. Evan thought this local bond effect is not
explicitly modelled in the FEM, the model predicted
well the crack patterns of the beams as well as the
rupture of the reinforcement in BL60. It is this rupture
which caused the sudden drop of resistance in the
prediction curve in Figure 5 at a deflection ≈20 mm.
Figure 5. Measured and predicted response of beams with
variable thickness of the tension UHPFRC layers (tests [12])
BL60 BL20
B0
MATEC Web of Conferences 199, 09001 (2018) https://doi.org/10.1051/matecconf/201819909001ICCRRR 2018
4

Figure 6. Measured and predicted crack patters at failure of
beams B0 (above) and BL60 (below) (post-processor Augustus
[26])
Another experimental study that focused on the effect
of the thickness of UHPFRC layers was performed by
Meda et al. [13]. However, while the beams studied by
Safdar et al. [12] had a strengthening layer only on the
tension side of the section, the latter test series featured
also side layers to increase the durability and shear
resistance. The control specimen SR had a 450 mm by
200 mm rectangular section and an a/d ratio of 1.95, see
Table 1. There were no stirrups in the beam, and
therefore it failed in shear along a critical diagonal crack.
The strengthened beams SA and SB featured U-shaped
layers with a thickness of 30 mm and 50 mm,
respectively. While the thin UHPFRC layers had only
steel fibres (Vf=1.25%), the thick layers also included U-
shaped transverse reinforcement for higher shear
resistance (open stirrups).
The U-shaped UHPFRC layers required somewhat
different modelling approach than the layers placed at
the top/bottom of the section. Because VecTor2
implements a 2D plane-stress formulation, it was
necessary to use overlapping elements for the modelling
of the beam web. The web included three layers of
elements with coinciding nodes: one layer for the
original concrete section and two for the UHPFRC cast
on either side of the concrete. Because the model is 2D,
possible slip displacements between the concrete and
UHPFRC are neglected (perfect bond conditions). In
reality, the interface between the two materials was
roughened with sandblasting.
Figure 7 shows the measured and predicted responses
of beams SR, SA and SB. It can be seen that the control
specimen SR, which failed in shear, exhibited a brittle
behaviour with a fast drop of resistance in the post-peak
regime. The UHPFRC layers suppressed the shear
failure, and the two strengthened beams failed in flexure
with significant yielding of the bottom reinforcement.
Figure 7. Measured and predicted response of beams with
variable thickness of U-shaped UHPFRC layers (tests [13])
As compared to specimen BL60 by Safdar et al. [12],
beams SA and SB exhibited a ductile behaviour. This
difference is explained mainly by the amounts of
longitudinal reinforcement used in the two test series.
While BL60 had a reinforcement ratio of only 0.44%,
SA and SB had 1.17% and 1.02%, respectively (Table
1). Therefore, the UHPFRC layers in the latter case had a
relatively minor contribution to the flexural capacity, and
thus a small influence on the ductility. This is confirmed
by the fact that, even though specimen SB had
significantly ticker UHPFRC layers than SA, the two
beams had nearly the same flexural capacity. As evident
from Figure 7, the FEM captured well the load bearing
capacity of the three beams, even though it
overestimated the difference between SA and SB. While
SB was predicted to fail in pure flexure, the model
predicted a combined flexure-shear failure of beam SA.
Also, the model overestimated the stiffness of the beams
on the basis of an estimated modulus of elasticity of the
concrete of 29900 MPa [13].
Similar FEM analyses were performed on a total of
18 UHPFRC-strengthened beams from the literature [10-
14], see Table 1. All comparisons were performed with
the same constitutive models (see section 2) without
additional calibration of model coefficients. On this
basis, the FEM produced beam strength predictions with
an average experimental-to-predicted ratio of 1.00 and a
coefficient of variation (COV) of 11.12%.
4 Strengthened walls or columns
In addition to beams, this study also includes the
modelling of UHPFRC-retrofitted vertical elements such
as columns and walls. A typical application of this
retrofit technique is found in column- or wall- type
bridge piers as these members are often exposed to
aggressive environment (i.e. deicing salts). Therefore,
the UHPFRC can be used to both protect against
corrosion and increase the load-bearing capacity. In
these applications the UHPFRC is often applied only in
the corrosion-critical zones near the base of the member.
SB SA
SR
MATEC Web of Conferences 199, 09001 (2018) https://doi.org/10.1051/matecconf/201819909001ICCRRR 2018
5

There are two main differences between the
UHPFRC strengthening of beams and columns/walls.
First, due to the presence of slabs, beams are usually
retrofitted with bottom or U-shaped UHPFRC layers. In
contrast, columns and walls are almost exclusively
retrofitted with UHPFRC jackets that envelope the entire
section. Second, there is a difference in the effectiveness
of the UHPFRC layers in the critical sections of the
members. While in beams the strengthening layers
provide a full contribution to the flexural capacity, this is
not the case in the base sections of columns and walls
where the bending moments are usually maximum. In
these locations there is a construction joint between the
UHPFRC and the existing foundation, and therefore the
steel fibres in the strengthening layers cannot transfer
tension to the foundation. As a result, the UHPFRC
contributes only to the compression zone of the base
section, as well as to the flexural and shear resistance
above this section.
These differences were taken into account in the
modelling of tests by Garneau [16] that included two
bridge piers. The main goal of tests S5 and S6 was to
demonstrate that UHPFRC can be used to strengthen
deficient lap splices located above the foundation of the
pier. The specimens differed in the yield strength of the
lapped reinforcement (485 MPa for S5 vs. 405 MPa for
S6) as well as the amount and detailing of the transverse
reinforcement (seismic vs. non-seismic stirrup design).
The dimensions of the original concrete section were
1200 mm by 600 mm, and this section was reduced to
900 mm by 300 mm after water jetting. The full
dimensions of the section were recovered by casting a
UHPFRC jacket with a compressive strength of 144 MPa
and a fibre ratio of 3%, see Table 1. The piers were
loaded with a horizontal force applied at 2675 mm above
the base, resulting in shear-height-to-depth ratio
2675/1200=2.23. The vertical load on the specimens was
kept constant with a value of 6% of the compressive
capacity of the original concrete section. The finite element model of the specimens is shown
in Figure 8. It includes both the test region and the
foundation block which was significantly ticker (2000
mm). As the longitudinal reinforcement was distributed
across the entire section, it was modelled as smeared
reinforcement similarly to the stirrups.
Figure 8. Finite element model and predicted crack pattern at
failure of column S5
The UHPFRC layers were modelled in the same way
as that was done for the beams with U-shaped layers,
except that an additional layer was added on the
compression edge of the pier. To avoid an unrealistic
transfer of tensile stresses from the fibres to the
foundation block, the top row of elements in the
foundation was modelled with a smaller thickness across
the tension zone of the base section. The depth of the
tension zone at failure was estimated iteratively based on
several analyses and a trial and error procedure.
Figure 9. Measured and predicted response of columns with
UHPFRC jackets (tests [16])
As evident from Figure 8, this modelling resulted in
a wide crack in the base section where the fibres were
not effective. Large plastic deformations developed in
the longitudinal reinforcement in this section, while the
remaining part of the pier remained largely elastic. The
same observations were reported in the tests where the
failure was eventually caused by the rupture of the
reinforcement in the base crack. The UHPFRC layers
were sufficient to completely suppress lap-splice
failures.
As can be seen from Figure 9, both tests specimens
behaved very similarly in terms of lateral load vs. top
lateral displacement. They exhibited significant ductility
before the reinforcement ruptured. Specimen S5 was
slightly stronger than S6 due to the higher yield strength
of the reinforcement. It can also be seen that the FEM
captured well the experimental results, even though it
overestimated the displacement corresponding to steel
rupture.
The last comparisons in this study are performed
with three column tests performed by Meda et al. [15].
The tests specimens with a 300 mm by 300 mm original
concrete section featured similar support and loading
conditions as piers S5 and S6. The axial load was
constant and corresponded to 26% of the compression
capacity of the original concrete section. Prior to testing
to failure, two of the original columns were subjected to
accelerated corrosion, which resulted in an
approximately 20% reduction of the mass of the
longitudinal reinforcement as well as partial spalling of
the concrete cover. The main properties of the specimens
are summarized in Table 1.
MATEC Web of Conferences 199, 09001 (2018) https://doi.org/10.1051/matecconf/201819909001ICCRRR 2018
6

Figure 10. Measured and predicted response of corroded and
repaired columns (tests [15])
Figure 10 shows the measured and predicted
responses of the three columns. Specimen PC is the
original reinforced concrete column which was not
subjected to corrosion. The accelerated corrosion was
applied to specimens DC and RC, where the former
column was tested without repair while the latter was
provided with a 40mm-thick UHPFRC jacket. All
specimens failed in flexure at the base section, but
exhibited different strengths and ductility. As compared
to the undamaged specimen PC, the corrosion in
specimen DC resulted in a substantial decrease of both
strength and ductility. By applying a UHPFRC jacket on
specimen RC, the strength was increased significantly
while the ductility remained small as compared to the
original column without corrosion. The FEM captured
very well the behaviour of specimens PC and RC, and
slightly overestimated the load and displacement
capacity DC. This is devoted to uncertainties of the
properties of the corroded reinforcement (distribution of
the corrosion in the section and along the bars) and the
surrounding damaged concrete (splitting cracks and
partially spalled concrete cover).
Finally, Figure 11 summarizes the strength
predictions of all 21 specimens with UHPFRC layers
included in this study. On the horizontal axis is the ratio
of the thickness of the UHPFRC layer to the total depth
of the section parallel to the plane of loading. On the
vertical axis is the experimental-to-predicted failure load
of the test specimens. As evident from the plot, the data
points are grouped close to the unit line across the entire
range of t/h values, thus exhibiting no clear bias with
respect to this variable. The average experimental-to-
predicted ratio is 0.99 and the COV is 11.2%.
5 Conclusions
This study demonstrated that FE modelling based on the
disturbed stress field model and the diverse embedment
model is a valuable approach for the assessment of
UHPFRC-strengthened concrete members. While these
models were originally developed for reinforced
concrete and fibre-reinforced concrete, it was shown that
they can be easily extended to model UHPFRC
strengthening layers. The advantage of these models is
that they require a straightforward input without
unknown parameters to define the behaviour of ultra-
high performance concrete.
Figure 11. Experimental-to-predicted ratios for 21 beams and
columns with strengthening UHPFRC layers
The results from the comparisons with both beam
and columns tests showed adequate strength predictions
without a clear bias with respect to important tests
variables. Because the models were built on an existing
formulation and FE code, they can be easily applied by
engineers who are already familiar with the formulation
for reinforced and fibre-reinforced concrete. As the
modelling of UHPFRC is an obstacle to the application
of this durable retrofitting material, the FEMs presented
in this study represent a step towards removing these
difficulties.
References
1. K. Habel, E. Denarié, E. Brühwiler, J. Struct. Eng.,
132, No. 11, 1793-1800 (2006)
2. E. Brühwiler, E. Denarié, Struct. Eng. Int., 23, No.
4, 450-457 (2013)
3. H.G. Russell, B.A. Graybeal, U.S. Department of
Transportation, McLean, VA, Report No. FHWA-
HRT-13–060 (2013)
4. K. Wille, A.E. Naaman, G.J. Parra-Montesinos, ACI
Mater. J., 108, No. 1, 46–54 (2011)
5. T Leutbecher, E. Fehling, Internation Symposium
on UHPC, Kassel, 435-448 (2004)
6. M. Bastien-Masse, E. Brühwiler, Struct. Eng. Int.,
26, No. 4, 365-374 (2016)
7. S. Abbas, M. L. Nehdi, M. A. Saleem, IJCSM, 10,
No. 3, 271-295 (2016)
8. F.J. Vecchio, J. Struct. Eng., 97, No. 1, 102-110
(2000)
9. S.-C. Lee, J.-Y. Cho, F.J. Vecchio, ACI Struct. J.,
108, No. 5, 516-525 (2011)
10. F.J. Alaee, B.L. Karihaloo, J. Compos. Constr., 7,
No. 3, 174-186 (2003)
11. T. Noshiravani, PhD Thesis at École Polytechnique
Lausanne, Switzerland, Structural Response of R-
RC
DC
PC
MATEC Web of Conferences 199, 09001 (2018) https://doi.org/10.1051/matecconf/201819909001ICCRRR 2018
7

UHPFRC – RC Composite Members Subjected to
Combined Bending and Shear (2004)
12. M. Safdar, T. Matsumoto, K. Kakuma, Compos.
Struct., 157, 448-460 (2016)
13. A. Meda, S. Mostosi, P. Riva, ACI Struct. J., 111,
No. 5, 1059-1068 (2014)
14. G. Martinola, A. Meda, G.A. Plizzari, Z. Rinaldi,
Cem. Concr. Compos., 32, 731-739 (2010)
15. A. Meda, S. Mostosi, Z, Rinaldi, P. Riva, Mater.
Struct., 49, 1967-1978 (2016)
16. J.-F. Garneau, PhD Thesis at École Polytechnique
de Montréal, Canada, Réhabilitation sismique des
piles-murs de pont rectangulaires par chemisage en
béton fibré à ultra-haute performance (2015)
17. P. Wong, H. Trommels, F.J. Vecchio, VecTor2 and
FormWorks Manual (2013)
18. P. Wong, H. Trommels, F.J. Vecchio, VecTor2-
Software for nonlinear analysis of two-dimensional
reinforced concrete membrane structures (2014)
19. F.J. Vecchio, M.P. Collins, ACI J. Proc., 83, No. 2,
219-231 (1986)
20. J.Y.L. Voo, S.J. Foster, Uniciv Report No. R-420,
School of Civil and Environmental Engineering,
University of New South Wales, 86 pp (2003)
21. J.R. Deluce, S.-C. Lee, F.J. Vecchio, ACI Struct. J.,
111, No.1, 93-102 (2014)
22. J. Jungwith, A. Muttoni, Proceedings of the
International Symposium on Ultra High
Performance Concrete in Kassel, Germany, 533-546
(2004)
23. V. Sigrist, M. Rauch, Tailor Made Concrete
Structures - Walraven & Stoelhorst (eds), 405-410
(2008)
24. S.-C. Lee, J.-H. Oh, J.-Y. Cho, Materials, 8, No. 4,
1442-1458 (2015)
25. S.-C. Lee, J.-Y. Cho, F.J. Vecchio, ACI Struct. J.,
113, No. 2, 275-285 (2016)
26. E.C. Bentz. Ph.D. thesis, Department of Civil
Engineering, University of Toronto, Toronto,
Canada, Sectional Analysis of Reinforced Concrete
Members (2000)
MATEC Web of Conferences 199, 09001 (2018) https://doi.org/10.1051/matecconf/201819909001ICCRRR 2018
8

Tab
le 1
. T
ests
sp
ecim
ens
A
uth
or
Na
me
b (
mm
) h
(m
m)
t (m
m)
d
(mm
) a/d
f'
c
(MP
a)
f'c,
UH
PF
RC
(MP
a)
Vf
(%)
𝝆𝒍
(%)
𝝆𝒗
(%)
𝑽𝒆
𝒙𝒑
(kN
) 𝑽
𝒑𝒓
𝒆𝒅
(kN
) 𝑽
𝒆𝒙
𝒑𝑽
𝒑𝒓
𝒆𝒅
⁄
UH
PF
RC
lay
ou
t
1
Ala
ee
Mix
1_
st2_
20
10
0
17
0
20
13
0
2.7
4
7
20
7
6
1.3
3
0.8
7
58
54
.4
1.0
7
2
No
shir
avan
i
BM
W0
1
50
25
0
0
23
7
3.4
4
1.6
0
0
0
.67
0.3
4
43
.2
46
.6
3
BM
W1
1
50
30
0
50
23
7
3.4
4
1.6
1
60
3
0.6
7
0.1
7
58
.9
65
0.9
1
4
BM
W2
1
50
30
0
50
25
5
3.1
4
1.6
1
60
3
1.1
6
0.1
7
10
4.7
1
04.9
1
.00
5
BM
W3
1
50
30
0
50
25
2
3.1
4
1.6
1
60
3
1.0
4
0.1
7
91
.7
10
0.3
0
.91
6
BM
W4
1
50
30
0
50
25
5
3.1
4
1.6
1
60
3
1.1
6
0.1
7
90
.7
10
1.6
0
.89
7
BM
W5
1
50
30
0
50
25
5
3.1
4
1.6
1
60
3
1.1
6
0.1
7
99
.6
10
8.7
0
.92
8
BM
N1
15
0
30
0
50
25
5
3.1
4
1.6
1
60
3
1.1
6
0.3
4
96
.7
99
.9
0.9
7
9
BM
N3
15
0
30
0
50
24
8
3.2
4
1.6
1
60
3
1.6
8
0.3
4
13
4.7
1
21
1.1
1
10
Saf
dar
B0
2
50
40
0
0
36
0
2.8
2
9.7
0
0
0
.44
0.3
1
11
8.9
1
29.4
5
1
1
BL
20
2
50
40
0
20
36
0
2.8
2
9.7
1
56
2
0.4
4
0.3
1
11
8.9
1
40.4
0
.85
12
BL
40
2
50
40
0
40
36
0
2.8
2
9.7
1
56
2
0.4
4
0.3
1
14
5.3
1
55.9
0
.93
13
BL
60
2
50
40
0
60
36
0
2.8
2
9.7
1
56
2
0.4
4
0.3
1
15
6.3
1
66.7
0
.94
14
BU
20
25
0
40
0
20
36
0
2.8
2
9.7
1
56
2
0.4
4
0.3
1
14
2.2
1
45.5
0
.98
15
BU
40
25
0
40
0
40
36
0
2.8
2
9.7
1
56
2
0.4
4
0.3
1
14
8.2
1
45.4
1
.02
16
BU
60
25
0
40
0
60
36
0
2.8
2
9.7
1
56
2
0.4
4
0.3
1
13
7
14
9
0.9
2
17
Med
a
SR
2
00
45
0
0
41
0
1.9
5
32
.6
0
0
1.5
0
4
50
44
2
18
SA
2
60
48
0
30
41
0
1.9
5
32
.6
10
8
1.2
5
1.1
7
0
75
1
68
6.3
1
.09
19
SB
3
00
50
0
50
41
0
1.9
5
32
.6
10
5
1.2
5
1.0
2
0.0
9
77
3
75
3.8
1
.03
20
Mar
tin
ola
Co
ntr
ol
30
0
50
0
0
46
0
2.3
7
22
0
0
0.3
0
1
90
14
6.2
94
2
1
Rei
nf.
3
80
54
0
40
46
0
2.3
7
22
17
7
2.5
0
.3
0
40
7.8
3
09
1.3
2
22
No
-Rei
nf.
3
80
54
0
40
54
0
2.0
1
22
17
7
2.5
0
0
2
57.2
2
19.2
1
.17
23
Med
a
PC
3
00
30
0
0
26
0
5.7
7
17
0
0
0.5
1
0.1
1
63
61
24
DC
3
00
30
0
0
26
0
5.7
7
17
0
0
0.4
1
0.1
1
46
54
.2
2
5
RC
3
80
38
0
40
30
0
45
17
13
0
1.2
0
.28
0.0
9
10
0
10
1.1
0
.99
26
Gar
nea
u
S5
60
0
12
00
15
0
94
5
2.8
3
36
14
4
3
0.8
0
.33
16
90
18
71
0.9
0
27
S6
60
0
12
00
15
0
94
5
2.8
3
35
14
2
3
0.8
0
.11
15
76
17
01
0.9
3
Aver
ag
e
0.9
9
CO
V (
%)
11
.21
b=
wid
th o
f re
tro
fitt
ed s
ecti
on
; h=
dep
th o
f re
tro
fitt
ed s
ecti
on
; t=
th
ickn
ess
of
UH
PF
RC
lay
ers;
d=
effe
ctiv
e d
epth
of
retr
ofi
tted
sec
tio
n b
ased
on
th
e lo
ngit
ud
inal
rei
nfo
rcem
ent
in t
he
ten
sio
n ½
of
the
sect
ion
(i.
e. w
ith
in h
/2 f
rom
th
e te
nsi
on e
dge)
; a=
sp
an/h
eigh
t o
f th
e b
eam
/co
lum
n s
ub
ject
ed t
o c
on
stan
t sh
ear;
fc’
= c
om
pre
ssiv
e st
ren
gth
of
con
cret
e; f
’ c,U
HP
FR
C =
co
mp
ress
ive
stre
ngth
of
UH
PF
RC
;
UH
PF
RC
MATEC Web of Conferences 199, 09001 (2018) https://doi.org/10.1051/matecconf/201819909001ICCRRR 2018
9

Vf=
fib
re v
olu
me
rati
o o
f th
e U
HP
FR
C;
ρl=
As/
bd
= l
on
git
ud
inal
rei
nfo
rcem
ent
rati
o (
As
is t
he
rein
forc
emen
t w
ith
in h
/2 f
rom
th
e te
nsi
on
ed
ge
of
the
sect
ion
); ρ
v=
sti
rru
p r
atio
cal
cula
ted
wit
h r
egar
ds
to
wid
th b
.
MATEC Web of Conferences 199, 09001 (2018) https://doi.org/10.1051/matecconf/201819909001ICCRRR 2018
10


