Embed Size (px)
Citation preview
A STUDY ON RAINFALL-RUNOFF CHARACTERISTICS OF URBAN CATCHMENT OF SUNGAI KERAYONG
by
FAUZI BIN BAHARUDIN
Thesis submitted in fulfilment of the requirements for the degree
of Master of Science
JULY 2007

ii
ACKNOWLEDGEMENTS
First of all I would like to thank Allah S.W.T for giving me the strength and good health
to complete the research. I would like to thank my family, Fauzan, Fatin and especially
to Ayah and Mama, for their endless support for me throughout the years. Without their
blessings, it is impossible for me to carry on and finally reach the final stage of my
study. Special thanks to my extraordinary supervisor, Assoc. Prof. Dr. Hj. Ismail
Abustan. He has sacrificed most of his precious time to help me with my thesis writing
and taught me a lot of new things regarding hydrology. Without his guidance, it would
have been very difficult for me to prepare a creditable thesis report.
I would also like to extend my gratitude to Dr. Rezaur Rahman Bhuiyan for he
had been helpful in explaining the technical aspects in this study. As for my big sister,
Kak Ayu, your kindness and generosity in guiding me during these years shall always
be remembered and appreciated. Not forgetting all fellow postgraduate friends, namely
Abg Fadzil, Choong Wee Kang, Leong, Remy, Ashraf, Ramadhan, Erwan, Farah
Alwani, Ramlah, Nurul Huda, Helmi, Fadzli, Rashwan, Fared, Rinie, and Husnul, Yan
(Ezral) and finally Rai (Rosmaini). It has been a great honour for me to know you guys.
Thank you very much.
Last but not least, I would like to thank my dearest Shazwani, for you have
always believed in me and continued to support me throughout the hard times. Thanks
so much. I am also thankful for all my friends and the others who directly or indirectly
had helped me but whose names have not been mentioned here. May success will
always be with all of you.

iii
TABLE OF CONTENTS
Page ACKNOWLEDGEMENTS ii
TABLE OF CONTENTS iii
LIST OF TABLES v
LIST OF FIGURES vii
LIST OF SYMBOLS ix
LIST OF ABBREVIATIONS x
LIST OF PUBLICATIONS xi
ABSTRAK xii
ABSTRACT xiii
CHAPTER ONE : INTRODUCTION
1.0 Introduction 1
1.1 Problem Statement 4
1.2 Objectives of Research 5
1.3 Research Scope of Works 5
1.4 Structure of Thesis 6
CHAPTER TWO : LITERATURE REVIEW
2.0
Introduction
8
2.1 The Hydrologic Cycle 8
2.2 Urban Stormwater Management 10
2.3 Rainfall and Runoff 12
2.4 Rational Method 16
2.5 Hydrograph Separation 18
2.6 Time of Concentration (tc) 25
2.7 Conclusion 31
CHAPTER THREE : METHODOLOGY
3.0 Introduction 32
3.1 Site Description 33

iv
3.1.1 Delineation of Subcatchments 34
3.2 Data Acquisition 35
3.2.1 Channels Data and Characteristics 35
3.2.2 Determination of Channel Slope (Sch) 43
3.2.3 Land Use Map 44
3.2.4 Rainfall and Water Level Data 47
3.3 Hydrograph Separation 51
3.4 Rainfall and Runoff Relationship 53
3.5 Estimation of Time of Concentration (tc) 54
3.6 Conclusion 60
CHAPTER FOUR : RESULTS AND DISCUSSION
4.0 Introduction 61
4.1 Characterization of Land Use 61
4.2 Rainfall and Runoff Analysis 63
4.3 Estimation of Time of Concentration (tc) 71
4.4 Conclusion 117
CHAPTER FIVE : CONCLUSION
5.1 Achievements 118
5.2 Impact and Recommendation for Further Studies 119
REFERENCES 121
APPENDICES
Appendix A : Selected Storm Event Hydrographs
Appendix B : Verification of Average Velocity of Flow in Channel
Appendix C : Determination of Channel Slope
Appendix D : Regression Analysis Output Using Minitab

v
LIST OF TABLES
Page
1.1 Sources of non-point urban runoff pollutants (Whipple,1983)
2
2.1 Minimum time of concentration for small catchments (DID, 2000)
31
3.1 Subcatchments in Sungai Kerayong catchment
34
3.2 Summary of mathematical expressions for parameter A and P
43
3.3 Summary of channel slope (Sch) and Manning roughness coefficient (n)
44
3.4 Sungai Kerayong hydrological stations (DID, 2000)
48
3.5 Typical values for depression storage (ASCE,1992)
53
4.1 Land use compositions in Sungai Kerayong catchment
63
4.2 Summary of Sungai Kerayong rainfall-runoff relationship
70
4.3 Values of parameters for time of concentration formulas for Taman Desa
72
4.4 Values of parameters for time of concentration formulas for Taman Miharja
72
4.5 Values of parameters for time of concentration formulas for Kg. Cheras Baru
73
4.6 Summary of tc estimates for Sungai Kerayong catchment (Taman Desa) from direct runoff hydrographs
85
4.7 Computation of N.S value for Yen and Chow formula (Taman Desa)
86
4.8 Computation of N.S value for NAASRA formula (Taman Desa)
86
4.9 Computation of N.S value for Kerby formula (Taman Desa)
87
4.10 Computation of N.S value for Bransby-Williams formula (Taman Desa)
87
4.11 Summary of estimated time of concentration by formula calculation for Taman Desa
88
4.12 Summary of tc estimates for Taman Miharja subcatchment from direct runoff hydrographs
99

vi
4.13 Computation of N.S value for Yen and Chow formula (Taman Miharja)
100
4.14 Computation of N.S value for NAASRA formula (Taman Miharja)
100
4.15 Computation of N.S value for Kerby formula (Taman Miharja)
101
4.16 Computation of N.S value for Bransby-Williams formula (Taman Miharja)
101
4.17 Summary of estimated time of concentration by formula calculation for Taman Miharja subcatchment
102
4.18 Summary of tc estimates for Kg. Cheras Baru subcatchment from direct runoff hydrographs
113
4.19 Computation of N.S value for Yen and Chow formula (Kg. Cheras Baru)
114
4.20 Computation of N.S value for NAASRA formula (Kg. Cheras Baru)
114
4.21 Computation of N.S value for Kerby formula (Kg. Cheras Baru)
115
4.22 Computation of N.S value for Bransby-Williams formula (Kg. Cheras Baru)
115
4.23 Summary of estimated time of concentration by formula calculation for Kg. Cheras Baru subcatchment
116

vii
LIST OF FIGURES
Page
1.1 Urban hydrographs (www.uwsp.edu)
1
2.1 The hydrologic cycle (nd.water.usgs.gov)
9
2.2 Baseflow separation methods (McCuen, 1989)
19
2.3 Australian Rainfall and Runoff baseflow separation (ARR,1987)
21
2.4 Diagram of baseflow separation by analytical solutions of the Boussinesq equation (Szilagyi and Parlange, 1998)
23
2.5 Equal area slope of main stream (ARR, 1987)
30
3.1 Flow chart of research activities
32
3.2 Sungai Kerayong catchment
33
3.3 Delineation of subcatchments
34
3.4 Satellite image of Kg. Cheras Baru channel
36
3.5 Kg. Cheras Baru channel cross section
36
3.6 Calculation of A and P for y < 0.5 at Kg. Cheras Baru channel
37
3.7 Calculation of A and P for y > 0.5 at Kg. Cheras Baru channel
37
3.8 Satellite image of Taman Miharja channel
38
3.9 Taman Miharja channel cross section
38
3.10 Calculations for left river bank section of Taman Miharja channel
39
3.11 Calculations for right river bank section of Taman Miharja channel
39
3.12 Satellite image of Taman Desa channel
40
3.13 Taman Desa channel cross section
40
3.14 Diagram for determination of parameters A and P (y<1.55m)
41
3.15 Diagram for determination of parameters A and P (y>1.55m)
42
3.16 Example of correlated satellite images and digital maps
45
3.17 Example of rainfall data for Taman Desa
49

viii
3.18 Example of water level data for Taman Desa
50
3.19 Baseflow separation and runoff volume
51
3.20 Diagram of runoff volume calculation
52
3.21 Estimation of tc from direct runoff hydrograph
54
3.22 Length and slope of overland plane values for Taman Desa
58
3.23 Length and slope of overland plane values for Taman Miharja
58
3.24 Length and slope of overland plane values for Kg. Cheras Baru
59
4.1 Land use map of Sungai Kerayong catchment
62
4.2 Rainfall and runoff at Kg. Cheras Baru
64
4.3 Land use of Kg. Cheras Baru
65
4.4 Rainfall and runoff at Taman Miharja
66
4.5 Land use of Taman Miharja
66
4.6 Rainfall and runoff at Taman Desa
68
4.7 Land use of Taman Desa
68
4.8 Rainfall-runoff relationship at Sungai Kerayong
69
4.9 Derivation of equal area slope of Sungai Kerayong 71
4.10 Direct runoff hydrographs and the tc estimates for Sungai Kerayong catchment (Taman Desa)
75
4.11 Direct runoff hydrographs and the tc estimates for Taman Miharja
89
4.12 Direct runoff hydrographs and the tc estimates for Kg. Cheras Baru
102

ix
LIST OF SYMBOLS
Q Discharge
A Area
C Runoff coefficient
I Rainfall intensity
in Net rainfall intensity
qt Discharge at time t
q0 Discharge at time=0
K Fitting coefficient
a Constant
b Constant
M Constant
tc Time of concentration
to Time of overland flow
tch Time of channel flow
L Length of catchment
Lo Length of overland plane
Lch Length of flow path in channel
S Catchment slope
So Overland slope
Sch Channel slope
Se Equal area slope of the main stream/channel
Vavg Average velocity of flow
Fc Conversion factor (Bransby-Williams equation)
A Area (Manning equation)
P Wetted perimeter (Manning equation)
R Hydraulic radius
y Water level
n Manning roughness coefficient
Na NAASRA retardance coefficient
Nk Kerby resistance coefficient
N.S Coefficient of determination (Nash and Sutcliffe, 1970)

x
LIST OF ABBREVIATIONS
ARR Australian Rainfall and Runoff
ARI Average Recurrence Interval
CA Cluster Analysis
DID Department of Irrigation and Drainage
HTC Humid Tropics Center
ILLUDAS Illinois Urban Drainage Simulator
JUPEM Department of Survey and Mapping, Malaysia
MSMA Urban Stormwater Management Manual for Malaysia
NIWA National Institute of Water and Atmospheric Research
PCA Principal Component Analysis
SWMM Stormwater Management Model
Tideda Time Dependent Data
TRRL British Transport and Road Research Laboratory

xi
LIST OF PUBLICATIONS
1. Baharudin, F. and Abustan I. (2006). Determination of rainfall-runoff characteristics in urban areas: Sungai Kerayong catchment, Kuala Lumpur. Proceedings of National Seminar in Civil Engineering Research (SEPKA 2006), 19th-20th December, UTM.
2. Baharudin, F., Abustan, I. and Sulaiman, A.H. (2007). A comparative study to estimate time of concentration for urban catchment: Sungai Kerayong, Kuala Lumpur. Persidangan Kebangsaan Awam 2007 (AWAM 07), 29th – 31st May, Langkawi.

xii
KAJIAN CIRI-CIRI HUJAN-AIR LARIAN DI KAWASAN TADAHAN BANDAR
SUNGAI KERAYONG
ABSTRAK
Tadahan Sungai Kerayong telah dipilih sebagai tadahan kajian bandar untuk
mengkaji proses penjanaan air larian di bawah pengaruh iklim topika. Tiga objektif
kajian telah ditentukan; pertama, untuk menghasilkan perhubungan antara hujan dan
air larian menggunakan kaedah regresi linear; kedua, menentukan peratusan
permukaan tidak telap dan dibandingkan dengan keputusan daripada perhubungan
hujan-air larian, dan ketiga untuk menganggar masa tumpuan air. Kawasan tadahan
dengan luas 48.3km2 telah dibahagi kepada 3 sub kawasan. Peta gunatanah tadahan
telah dihasilkan dari peta topografi digital dan imej satelit. Sejumlah 90 peristiwa banjir
dari tahun 2000 hingga 2003 telah dipilih dan dianalisis untuk menentukan ciri-ciri
hujan-air larian. Masa tumpuan air daripada kaedah hidrograf air larian terus
dibandingkan dengan keputusan yang diperoleh melalui persamaan empirik.
Keputusan regresi linear untuk hujan-air larian memberi anggaran permukaan tidak
telap sebanyak 76.2% dan nilai storan lekukan 1.98mm. Keputusan ini hampir sama
dengan anggaran daripada kaedah peta gunatanah iaitu 77.5%. Masa tumpuan air
kawasan tadahan yang dikira dengan kaedah hidrograf air larian terus adalah 139.5
minit. Formula empirik NAASRA memberi keputusan terbaik dengan masa tumpuan air
141.8 minit dan nilai N.S -0.007.

xiii
A STUDY ON RAINFALL-RUNOFF CHARACTERISTICS OF URBAN
CATCHMENT OF SUNGAI KERAYONG
ABSTRACT
Sungai Kerayong catchment was selected as an experimental urban catchment
in order to study the runoff generation processes in tropical climate. The study sets
three objectives, the first is to establish a reliable relationship between rainfall and
runoff; the second is to estimate the percentage of impervious surface and compared
the estimate with result from the rainfall-runoff correlation, and the third objective is to
estimate the time of concentration of the catchment. The catchment which has an area
of 48.3km2 was divided into three subcatchments. The land use map was created using
digital topographic maps and satellite images. A total of 90 single storm events from
year 2000 to 2003 were selected and analyzed. The observed time of concentration
values obtained from direct runoff hydrographs were compared with calculated values
using four empirical equations. The linear regression technique gave estimate of
impervious surface of 76.2% and depression storage of 1.98mm. This result is
consistent with the estimate of impervious surface from the land use map which is
77.5%. The time of concentration obtained from direct runoff hydrographs was 139.5
minutes. Among the empirical formula, NAASRA formula is the most suitable with time
of concentration of 141.8 minutes and N.S value of -0.007.

1
CHAPTER 1 INTRODUCTION
1.0 Introduction
Urban hydrology is a specific knowledge of hydrology applied in areas with very
high concentration of human activities which deal with natural process. The continuous
growth of population and massive development will affect the physical characteristics of
an area and change the hydrological practice. A notable aspect of urbanization is the
increase of impervious surfaces, which include paved streets, roads, parking lots and
roofs. High impervious surfaces are the common cause for high runoff volumes as the
soil infiltration capacity decreases (Figure 1.1). Thus, the drainage system for urban
areas is relatively different from natural catchments whereby it is designated
specifically to remove the runoff as fast as possible so that flooding can be prevented
and the negative influence on transportation is minimized (Delleur, 2003).
Figure 1.1: Urban hydrographs (www.uwsp.edu)

2
The common problem caused by urban runoff is the pollutants transported
through the urban catchment area. Pollutants generated on and discharged from land
surfaces as the result of the action of precipitation on and the subsequent movement of
water over the land surface are commonly referred to as non-point pollutants or
dispersed pollutants (Zoppou, 2001). Failures in urban infrastructures such as leachate
from landfills and sewer infiltration also represent another source of pollutant. When
these pollutants are transported into the receiving waters, it may cause both quality and
quantity problems and this scenario can be detrimental to human health and to aquatic
organisms. Table 1.1 shows examples of sources for non-point urban runoff pollutants.
Table 1.1: Sources of non-point urban runoff pollutants (Whipple, 1983)

3
Realizing the possible disastrous impacts that can occur, the approach of
stormwater management and modeling has been improving throughout the years. It
started in 1971 by the introduction of the stormwater management model (SWMM), a
software which combines detailed modeling of hydrology, hydraulics, pollution transport
and capable of performing continuous or single-event simulations. The knowledge
began to expand whereby other models were developed aiming to tackle the same
issue. Among them is the development of The Illinois Urban Drainage Simulator
(ILLUDAS) in 1974, which was developed by the British Transport and Road Research
Laboratory (TRRL), the Wallingford Storm Sewer Package (WASSP) developed in the
U.K by the National Water Council (1981) and MOUSE developed by the Danish
Hydraulic Institute (DHI) in 1996.
Malaysia particularly has also participated in the latest hydrologic research and
studies in urban areas. As mentioned earlier, the vast development in the country has
increased the percentage of impervious surfaces thus resulting in huge surface runoff
volumes. In addition to the problem, inadequate drainage facilities also contributed to
flash floods occurrence in urban areas (Anjum and Mohammad Kassim, 1999).
Obviously, this worrying scenario has served as the problem statement for this study.
Other researchers and scholars throughout the country have also taken the initiative to
conduct studies particularly to ease the negative impacts from urban runoff and
improve the hydrologic processes in urban areas (Sinnakaudan et. al., 2003; Abustan
et. al., 2000; Desa and Niemczynowicz, 1996).
The support from the government is clearly seen through the Department of
Irrigation and Drainage (DID) of Malaysia. On 21st June, 2000, the Cabinet had
approved the "Urban Stormwater Management Manual for Malaysia" (MSMA) to
replace Planning and Design Procedures No. 1:Urban Drainage Design Standards and
Procedures for Peninsular Malaysia – 1975, which is effective from 1st January,

4
2001. The manual has 48 chapters and is divided into eleven parts which covers all the
hydrology and hydraulics aspects for urban catchments. The primary goal of the
manual is to provide guidance to all regulators, planners and designers who are
involved in stormwater management and identifies a new direction for stormwater
management in urban areas in Malaysia. By having a standard guideline, the
construction of drainage system and detention facilities is becoming more consistent
and ensures an optimum planning for land development of urban area.
Perhaps the best way in dealing with the urban hydrology issues is that all
problems, whether flash floods or runoff quality or quantity, can no longer be evaluated
in isolated cases but will have to be looked at in an integrated manner. It is hoped that
by continuous research and extensive studies, the knowledge of urban hydrology can
be understood better. It is not only to improve the knowledge itself, but also to provide
a better environment for living for all mankind.
1.1 Problem Statement
The long standing issue on hydrology in this region is the study on runoff
generation. Studies on runoff and its characteristics in tropical climate are still scarce.
In Malaysian perspective, the urban stormwater designs applied was mainly based on
foreign experience. The most notable case being if that the design chart of runoff
coefficients in MSMA was adopted from the Australian data set (DID, 2000). The data
may not be applicable to Malaysia and may lead to failures in designing structures for
solving hydrologic problems such as flash floods. Proactive measures have to be taken
to add more information on hydrological data in Malaysian urban areas.
5
1.2 Research Objectives
The research is designed to address the issue of rainfall and runoff processes
in urban areas. The key objectives of this study are as follows:
1) To establish a reliable relationship between rainfall and runoff and obtain
estimate for impervious surface and depression storage of the catchment.
2) To estimate the impervious surface by using satellite images and digital
maps and compare the results with values obtained from the rainfall-runoff
correlation.
3) To compare the time of concentration (tc) of the studied catchment obtained
by direct runoff hydrographs method and empirical equations.
1.3 Research Scope of Works
In order to achieve the objectives of the research, the following works are to be
carried out:
1) Reviewing and searching literature on rainfall-runoff modeling and
characteristics to establish a reliable rainfall-runoff relationship for Sungai
Kerayong catchment.
2) Obtain the related rainfall and water level data from the Department of
Irrigation (DID) Malaysia as well as the digital maps from the Department of
Survey and Mapping.
3) Producing land use map and identifying the land characteristics to assess
the impervious surface of the catchment area.

6
4) Assessing the direct runoff hydrographs of selected storm events for the
time of concentration estimation, whereby four empirical equations are used
to make comparison and verify the results.
5) From No. 4 above, estimate the time of concentration.
6) Compare the value in No. 5 above with the time of concentration derived
from four empirical equations.
1.4 Structure of Thesis
Chapter 1 - Introduction
This chapter introduces the definition and related issues on urban hydrology.
Being the key topic of the research, it is important to describe a bit about the
background of urban hydrology. The objectives and scope of works are also explained
in this chapter.
Chapter 2 – Literature Review
Chapter 2 describes the studies from previous researchers which are related to
this research topic and being presented in sub-chapters for better understanding.
Chapter 3 - Methodology
All related theories are presented and the methodology of the research is
explained thoroughly in this chapter. A flow chart is presented to summarize the
research activities. Data such as rainfall, water level, river survey and digital maps are
collected and analyzed thoroughly.

7
Chapter 4 - Results and Discussion
This chapter presents three main results. The first result is on the correlation of
rainfall and runoff. The second is on the created land use map and the details on the
land use characteristics. The final result involves the estimation of the time of
concentration (tc). The results are discussed within each section throughout this
chapter.
Chapter 5 - Conclusion
It is the final chapter for this thesis, which highlights the findings of this research
and recommendations for further studies on the related topic.

8
CHAPTER 2 LITERATURE REVIEW
2.0 Introduction
Hydrology is a fascinating discipline of knowledge. It is concerned with water
on, under and above the land surface; ocean waters are the domain of oceanography
and the marine sciences. Scientific and engineering hydrology covers a broad field of
interdisciplinary subjects that may be approached from various perspectives, including
those of the geologists, chemists, civil engineers, environmental engineers, as well as
hydrologists. In short, the definition of hydrology can be interpreted as presented by the
U.S National Research Council in the following quote:
“Hydrology is the science that treats the waters of the Earth their
occurrence, circulation, and distribution, their chemical and physical
properties, and their reaction with the environment, including the
relation to living things. The domain of hydrology embraces the full
life history of water on Earth.”
2.1 The Hydrologic Cycle
Water does not remain locked up in the oceans, icecaps, groundwater system
or the atmosphere. Instead, water is continually moving from one reservoir to another.
This movement of water is called the hydrologic cycle. This phenomenon has even
been noticed in the early days of mankind. Solomon, King of Israel, in writing
Ecclesiastes 3000 years ago, provides a concise description of the hydrologic cycle:
“ All rivers flow into the sea, yet the sea is never full. To the place the
streams come from, there they return again.”
9
The main link in the water cycle in nature is exchange between the oceans and
land, which includes not only quantitative renewal, but qualitative restoration as well. All
types of natural waters are renewed annually, but the rates of renewal differ sharply.
Water present in rivers is completely renewed every 16 days, but the renewal periods
of glaciers, ground water, ocean water and lakes run to hundreds or thousand years
(Shiklamanov, 1993). When slowly renewed resources are used by humans at a rapid
rate, they effectively become non-renewable resources with subsequent disruptions of
the natural cycle.
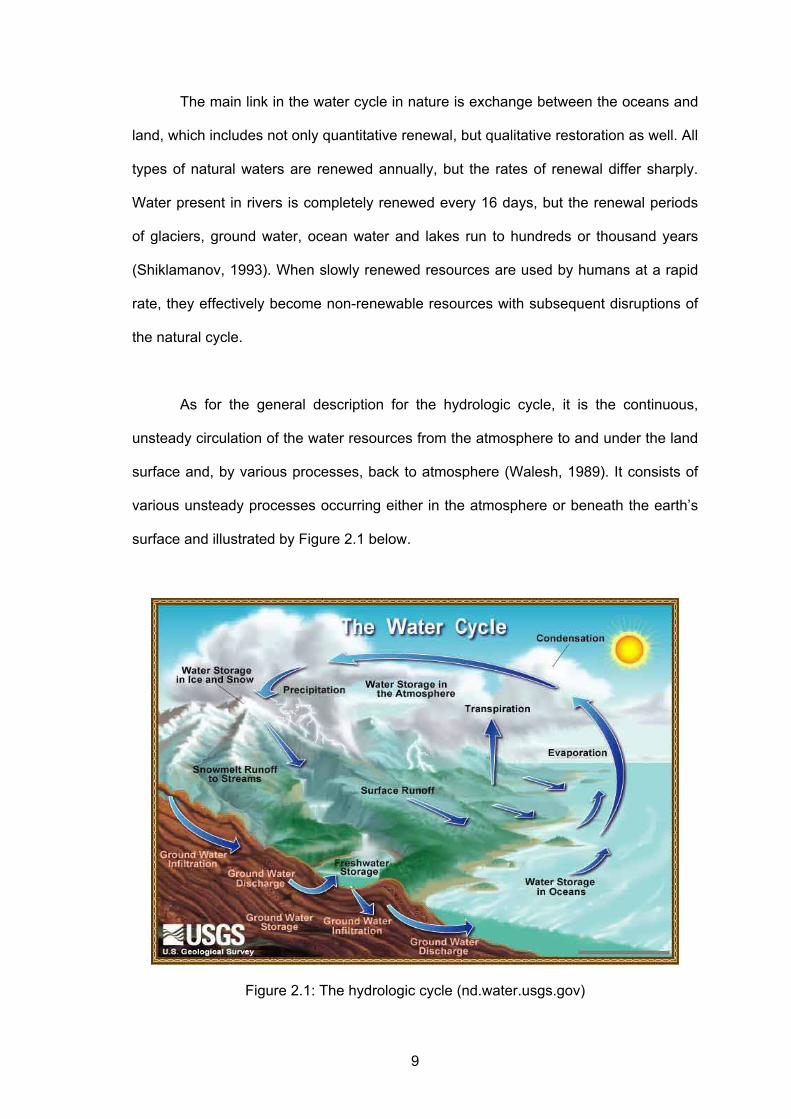
As for the general description for the hydrologic cycle, it is the continuous,
unsteady circulation of the water resources from the atmosphere to and under the land
surface and, by various processes, back to atmosphere (Walesh, 1989). It consists of
various unsteady processes occurring either in the atmosphere or beneath the earth’s
surface and illustrated by Figure 2.1 below.
Figure 2.1: The hydrologic cycle (nd.water.usgs.gov)

10
Wurbs et. al. (2002) has explained the hydrological processes involved in the
cycle. Energy from the sun results in evaporation of water from ocean and land
surfaces and also causes differential heating and resultant movement of air masses.
Water vapor is transported with the air masses and under the right conditions becomes
precipitation. Evaporation from the oceans is the primary source of atmospheric vapor
for precipitation, but evaporation from soil, streams, lakes and transpiration from
vegetation also contribute. Precipitation runoff from the land becomes streamflow. Soil
moisture replenishment, groundwater storage and subsurface flow occur as a result of
water infiltrating into the ground while stream and groundwater flow convey water back
to the oceans. Overall, the hydrologic processes by which water moves through the
hydrologic cycle includes atmospheric movement of air masses, precipitation,
evaporation, transpiration, infiltration, percolation, groundwater flow, surface runoff and
streamflow.
An interesting truth to note about the whole process is, although water in the
cycle is constantly in motion, it never leaves the earth. The earth itself is nearly a
‘closed system’ like a terrarium (Dasch, 2003). This shows that the earth neither gains
nor loses much matter, including water. The same water existed on earth millions of
years ago is most probably still is here today.
2.2 Urban Stormwater Management
Urban stormwater management is a knowledge used to understand, control,
and utilize waters in their different forms within the hydrologic cycle. It is applied in
developing areas with very high level of human interference with natural processes.
The hydrological process in urban areas is similar to those in rural areas but they occur
at smaller temporal and spatial scales in urban areas than in rural regions (Delleur,
2003). This brings essential differences with respect to theory, data collections and
calculation methods. Undeveloped land in rural areas has very little surface runoff

11
whereby most of the rainfall soaks into the top soil and evapotranspirates or migrate
slowly through the soil mantle as interflow to the streams, lakes or estuaries.
Problems with management of urban stormwater are closely related to the
concentration of population growth on a relatively small area. In order to enhance the
living standard and better transportation system, large impervious areas are
constructed. Most paved surfaces and rooftops allow no water to infiltrate, but instead
divert water directly to storm channels and drains. The resulting effect on the hydrology
of the receiving water is quite dramatic, especially for streams. A given rainstorm now
produces significantly more runoff volume than before, and flow peaks are increased
by a factor of 2 to more than 10 (Roesner et. al., 2001). The increased amount of water
flowing to streams during storms causes larger floods, and floods build to a peak faster
because of the rapid flow of water over smooth surfaces.
Large runoff volumes generated can accelerate transport pollutants and
sediments from urban areas (Niemczynowicz, 1999). For example, the motor vehicles
leave oils and exhaust residues on streets and household and industrial chemical
products also can be collected on the pavement surfaces. These non-point source
pollutants are readily washed off during storms, contaminating streams into which
urban runoff flows. Careless disposal of hazardous wastes on streets or in storm drains
also adds to the problems. Dasch (2003) has highlighted another impact of
urbanization on runoff, which as a result of impervious area development, most
precipitation has no chance to percolate downward to groundwater. Therefore, the
supply of groundwater to wells is reduced.
Having known the impacts of urbanization to stormwater management, the
traditional conveyance approach in stormwater management has been shifted during
the 1970s to storage approach with a focus on detention, retention and recharge. Later
12
on, during 1990s, stormwater came to be considered as a significant source of pollution
and the main objectives of stormwater management shifted to protection of the natural
water cycle and ecological systems by introduction of local source control, flow
attenuation and treatment in natural or constructed biological systems such as ponds,
wetlands, and root-zone treatment facilities (Niemczynowicz, 1999). Wurbs and Jones.
(2002) has stressed the general purposes of stormwater management whereby they
should enhance the quality of life in urban areas by reducing flood risk, minimizing the
disruption of normal urban activities caused by storm runoff and the importance of
protecting water quality in the urban areas.
Now it is time that the perspective of sustainability in relation to urban drainage
should be taken more seriously. Sustainability points to the reintegration of water in the
urban environment, working together with the hydrological cycle, observing ecological,
environmental, landscape and recreation opportunities (Pompeo, 1999). For this
reason, more research in stormwater management and development in structural and
non-structural measures should be carried out comprehensively. The first step in an
effective management strategy is to clearly define goals of the problem. This step is
crucial in gaining public support, and it provides the basis for developing technological
answers based on defensible scientific principles. Stormwater management programs
that fail to clearly define objectives and develop approaches based on sound science
are recipes for failure and litigation (Urbonas et. al., 2005).
2.3 Rainfall and Runoff
Rainfall is known as the main contributor to the generation of surface runoff.
Therefore there is a significant and unique relationship between rainfall and surface
runoff. By basic principle of hydrologic cycle, when rain falls, the first drops of water are
intercepted by the leaves and stems of the vegetation. This is usually referred to as
interception storage. Once they reach the ground surface, the water will infiltrate
13
through the soil until it reaches a stage where the rate of rainfall intensity exceeds the
infiltration capacity of the soil. The infiltration capacity of soil may vary depending on
the soil texture and structure. For instant, soil composed of a high percentage of sand
allows water to infiltrate through it quite rapidly because it has large, well connected
pore spaces. Soils dominated by clay have low infiltration rates due to their smaller
sized pore spaces. However, there is actually less total pore space in a unit volume of
coarse, sandy soil than that of soil composed mostly of clay. As a result, sandy soils fill
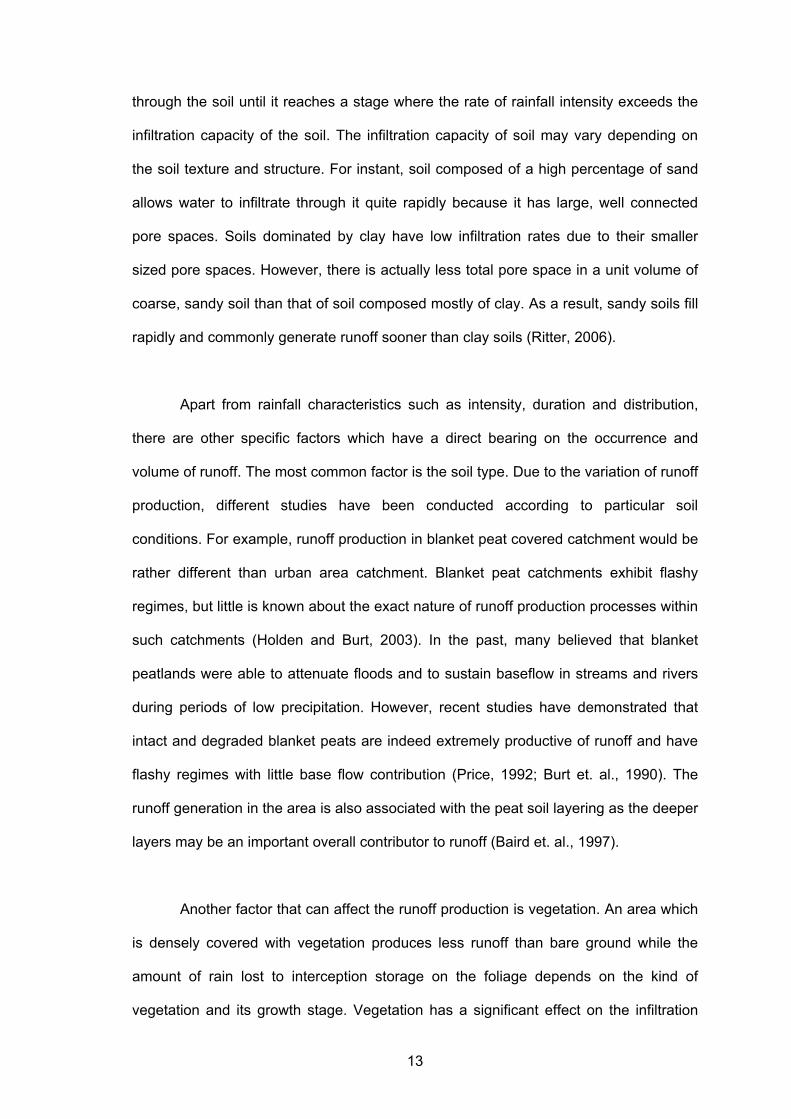
rapidly and commonly generate runoff sooner than clay soils (Ritter, 2006).
Apart from rainfall characteristics such as intensity, duration and distribution,
there are other specific factors which have a direct bearing on the occurrence and
volume of runoff. The most common factor is the soil type. Due to the variation of runoff
production, different studies have been conducted according to particular soil
conditions. For example, runoff production in blanket peat covered catchment would be
rather different than urban area catchment. Blanket peat catchments exhibit flashy
regimes, but little is known about the exact nature of runoff production processes within
such catchments (Holden and Burt, 2003). In the past, many believed that blanket
peatlands were able to attenuate floods and to sustain baseflow in streams and rivers
during periods of low precipitation. However, recent studies have demonstrated that
intact and degraded blanket peats are indeed extremely productive of runoff and have
flashy regimes with little base flow contribution (Price, 1992; Burt et. al., 1990). The
runoff generation in the area is also associated with the peat soil layering as the deeper
layers may be an important overall contributor to runoff (Baird et. al., 1997).
Another factor that can affect the runoff production is vegetation. An area which
is densely covered with vegetation produces less runoff than bare ground while the
amount of rain lost to interception storage on the foliage depends on the kind of
vegetation and its growth stage. Vegetation has a significant effect on the infiltration

14
capacity of the soil. A dense vegetation cover shields the soil from the intense raindrop
impact which eventually will cause a breakdown of the soil aggregate as well as soil
dispersion with the consequence of driving fine soil particles into the upper soil pores.
This results in clogging of the pores, formation of a thin but dense and compacted layer
at the surface which highly reduces the infiltration capacity. This particular effect is
often referred as to capping, crusting or sealing. In addition, the root system as well as
organic matter in the soil increases the soil porosity thus allowing more water to
infiltrate. Vegetation also retards the surface flow particularly on gentle slopes, giving
the water more time to infiltrate and to evaporate. Kobatake et. al. (2000) assessed the
impacts of vegetation recovery on runoff characteristics in the Ashio catchment, Japan.
Large flood events from 1974 to 1998 were selected and the results show that the peak
runoff coefficient has decreased from 0.59 to 0.38 throughout the years. The ratios of
runoff volume of observed and calculated hydrographs also decreased from 1.25 to
0.91. Based on the fact that the catchment has been experiencing changes from
polluted land due to mining and refining activities to steady recovery and growth of
vegetation in the area, the findings have positively proven the theory of vegetation
effects on runoff characteristics.
Slope and catchment size also influence the generation of surface runoff. Steep
slopes in the headwaters of drainage basins tend to generate more runoff than the
lowland areas. Overall mountain areas tend to receive more precipitation because they
force air to be lifted and cooled. On gentle slopes, water may temporarily pond and
later infiltrate, but in mountainsides, water tends to move downward more rapidly.
Wemple and Jones (2003) examined the runoff production on forest roads in a steep,
mountain catchment which support the earlier statement. Soils tend to be thinner on
steep slopes, limiting storage of water, and where bedrock is exposed, little infiltration
can occur. However, in some cases, accumulation of coarse sediment at the base of
steep slopes soak up runoff from the cliffs above, turning into subsurface flow (Dasch,

15
2003). Size of catchment may have an effect to the runoff generation in terms of the
runoff efficiency (volume of runoff per unit area). The larger the size of the catchment,
the larger is the time of concentration and the smaller the runoff efficiency.
A study to assess the trends of rainfall-runoff characteristics in the Alzette river
basin, Luxembourg was conducted by Pfister et. al. (2000). The relationship between
atmospheric circulation pattern and streamflow has been emphasized as there has
been a marked increase in the contribution of the westerly component of atmospheric
circulation to rainfall since 1950. Principal component analysis (PCA) was used to
compare the winter maximum daily flow with rainfall characteristics, including
predominant atmospheric circulation patterns, rainfall intensity and average duration of
rainfall events. By using the PCA method, the impact of zonal circulation, especially of
the westerly airflow component, on maximum daily mean flow of the Alzette river has
been identified with a strong correlation coefficient of 0.86. Time trends in the
streamflow and rainfall characteristics were investigated by computing Kendall’s test.
The results of Kendall’s tests showed positive trends in westerly airflow rainfall as well
as in maximum daily flow are statistically significant and southwesterly airflow rainfall
has also contributed to the increment of maximum daily mean flow depending on its
interannual fluctuations.
Another study has been conducted by Merz et. al. (2006), regarding the surface
generation process at the plot level in relation to rainfall events in a mountainous area
of the Himalayas. The study makes use of event analysis with two different
perspectives; the precipitation event analysis investigates runoff triggering mechanisms
and erosion plot events are studied to investigate surface runoff generation. The results
of the study indicated that rainfall events in the catchment can be divided into four
major clusters with each cluster having different characteristics and the runoff events in
the catchment are closely correlated to the event rainfall intensity parameters and the

16
proposed clusters. The land use characteristics also contributed for the surface flow
process whereby the infiltration excess flow is the main process in terms of runoff
generation on degraded land while saturation excess overland flow is more relevant for
agricultural land.
2.4 Rational Method
History has shown us the continuous evolution of drainage system design.
Numerous methods and researches have been carried out in order to find suitable
techniques in design applications. In the early 18th century the development of drains
and canals designs were established by trial and error because there was insufficient
information to derive methods to specify appropriate design flowrates. The introduction
of Chezy channel friction formula in the 1770s and the collection of meteorological data
in Europe in the early 19th century had helped the progress of the design procedures. In
the 1840s, the Mulvaneys developed the rational method for flow estimation, inventing
a recording rain gauge to measure intensity. From the design flow rates, a channel or
pipe size could be established using hydraulic equations such as the Chezy or
Manning formula (O’Loughlin et. al., 1996).
Rational method is well known as one of the basic approach to compute
stormwater flows from rainfall by relating peak runoff to rainfall intensity through a
proportionally factor. The first application of the rational method in urban drainage
design was introduced by Kuichling (1889) in the U.S. and Lloyd Davies (1906) in the
U.K. Since then, the method was gradually recognized and by 1940s, it became the
standard method for street drainage system designs (O’Loughlin et. al., 1996). When
the first flow rate or discharge formula was established, the rainfall intensities were not
considered as a significant factor. Only by 1945, the rainfall intensities were recognized
as an important proportion to be included in the following formula:

17
360
.. AICQ = (2.1)
where,
Q = calculated flowrate (m3/s),
C = runoff coefficient,
I = rainfall intensity (mm/h),
A = area of catchment involved (ha).
Although the method can be considered as the most reliable approach in
estimating the design storm peak runoff, experience has shown that it only provides
satisfactory results on small catchments of up to 80 hectares only (DID, 2000). Some
precautions should also be considered such as obtaining a good topographic map and
defining the boundaries of the drainage area. A field inspection of the area should be
carried out to examine the natural drainage divides. For larger catchments, storage and
timing effects become significant and the hydrograph method is needed (DID, 2000).
The Urban Stormwater Management Manual for Malaysia (MSMA) has outlined the
assumptions used in the rational method. The assumptions are as follow:
1) The peak flow occurs when the entire catchment is contributing to the flow.
2) The rainfall intensity is uniform over time duration equal to the time of
concentration, tc.
3) The rainfall intensity is the same over the entire catchment area.
4) The Average Recurrence Interval (ARI) of the computed peak flow is the same
as that of the rainfall intensity, ie; a 5 year ARI rainfall intensity will produce a 5
year ARI peak flow.

18
2.5 Hydrograph Separation
Hydrograph separation is a process of separating the major hydrograph
components for analysis namely the surface runoff and the baseflow. Surface runoff
(rainfall excess) is the water that enters the stream primarily by way of overland flow
across the ground surface while baseflow is defined as water that enters the streams
by way of deep sub-surface flow below the main water table and may include other
components such as throughflow and interflow (ARR, 1987). Several methods have
been proposed and used for separating the surface runoff and the baseflow but none of
them have proven to be more superior as there is no ready basis for distinguishing both
components in a stream at any instant (Linsley et. al., 1988). The selection of an
appropriate method depends on the type and amount of measured data available, the
desired accuracy for the design problem and the effort that the modeler wishes to
expend.
Numerous academic explanations have been published in elaborating the
separation methods. McCuen (1989) has outlined four types of baseflow separation,
which are:
1) Constant-discharge baseflow separation
2) Constant-slope baseflow separation
3) Concave baseflow separation
4) Master depletion curve method

19
`
Figure 2.2: Baseflow separation methods (McCuen, 1989)
The easiest method to use is the constant discharge baseflow method. It is a
straight line drawn from the lowest discharge rate at the start of the flood runoff and
extends at a constant discharge rate until it intersects the recession limb of the
hydrograph (Figure 2.2). The next method is the constant slope method whereby the
inflection point of the hydrograph recession is being used. The estimation of the
inflection point is indeed arbitrary but it can be defined by the point in which the
hydrograph change from being concave to convex (i.e, the slope being greater than 1
to the slope being less than 1). Simply stated, it is the line drawn from the lowest
discharge rate directly to the inflection point of the hydrograph.
Constant-slope method
Concave method
Constant-discharge method
Inflection point
Discharge
Time

20
The third method is called the concave baseflow separation. The baseflow is
assumed to decrease until the time of the peak discharge of the storm hydrograph.
From that point, the separation line is straight between that point and the inflection
point on the recession as shown in Figure 2.2. Finally is the master depletion curve
method which uses semi-logarithmic plots on the recession curves. A mathematical
function form (Equation 2.2) which fits the data is applied to construct the curve.
Ktot eqq −= (2.2)
where,
qt = discharge at time t,
qo = discharge at time t = 0,
K = fitting coefficient.
The Australian Rainfall and Runoff (1987) has proposed another method in
which the separation of baseflow is achieved by drawing tangents to the average
recession curves at the points of start and finish of the hydrograph and drawing a
straight line between these tangents points. However there is another way of
connecting the two tangents points. The discharge rate from point A on Figure 2.3 is
extended with a straight line until it reaches to point below the peak of the hydrograph
and then connected to the point B by a smooth curve as shown in Figure 2.3.

21
Figure 2.3: Australian Rainfall and Runoff baseflow separation (ARR, 1987)
Scholars around the world are continuously researching new techniques and
methods for the hydrograph separation. As an example, a study conducted by Szilagyi
and Parlange (1998) proposed a baseflow separation technique applicable for
individual flood events, with analytical solutions of the Boussinesq equation.
Demonstrated in four catchments in United States with total of 32 flood events, the
technique is based on the governing equation for flow in saturated porous media and
implying assumptions that a horizontal impermeable layer underlies a Dupuit aquifer
which is drained by a fully penetrating stream. The hydrograph is characterized into
three major regions and the analysis involved some essential equations as shown in
Equations 2.3 and 2.4.
Tangent at A
Tangent at B
Baseflow
A B
Discharge
Time

22
)()( taQdttdQ b−= (2.3)
( )( ) bb atbQtQ −− −−= 11
10 1)( , if b ≠ 1;
ateQtQ −= 0)( , if b = 1 (2.4)
where,
Q = measured discharge,
a and b = constants.
To summarize the proposed baseflow separation technique, the following steps have
been highlighted by the authors as well as the simplified diagram in Figure 2.4.
1) Plot log (-∆Q / ∆t) versus log (Q) for the receding limb of the flood hydrograph
with an appropriate value for ∆t.
2) Identification of region A at low discharge values characterized with a slope of
1.5.
3) Identification of region B to the right of region A with a slope steeper than 1.5.
Draw a straight line with a slope of 1.5 through the smallest discharge value (i.e.
QAB) in region B and extend it up to region C (i.e. to QBC, the maximum
discharge value in the steepest slope region). Region C contains the highest
rates of change in runoff values.
4) Transform the straight line in region B into Q(t) values by the application of
Equations 2.2 and 2.3. The baseflow maximum results at the backward
propagated time equaling the elapsed time between the observed QAB and QBC
discharge values.
5) Draw a straight line between the beginning of the rising hydrograph and the
estimated baseflow maximum. This part, by default, is arbitrary.

23
Figure 2.4: Diagram of Baseflow Separation by Analytical Solutions of the Boussinesq Equation (Szilagyi and Parlange, 1998)
24
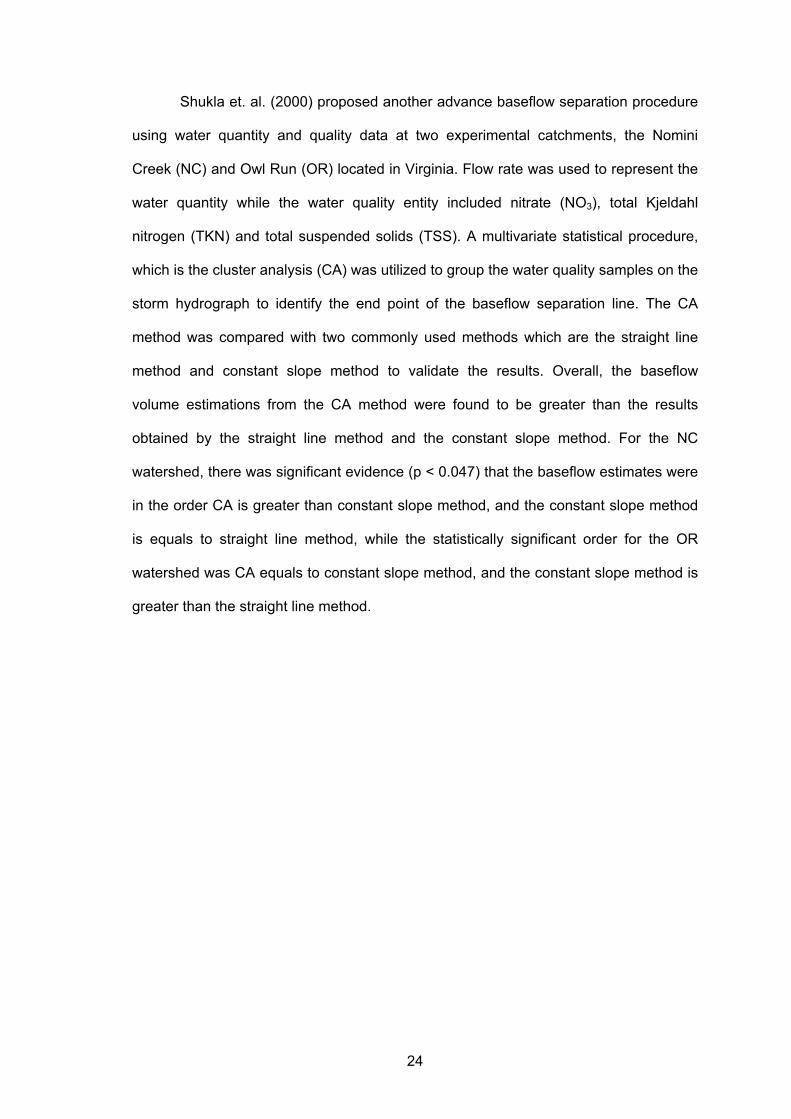
Shukla et. al. (2000) proposed another advance baseflow separation procedure
using water quantity and quality data at two experimental catchments, the Nomini
Creek (NC) and Owl Run (OR) located in Virginia. Flow rate was used to represent the
water quantity while the water quality entity included nitrate (NO3), total Kjeldahl
nitrogen (TKN) and total suspended solids (TSS). A multivariate statistical procedure,
which is the cluster analysis (CA) was utilized to group the water quality samples on the
storm hydrograph to identify the end point of the baseflow separation line. The CA
method was compared with two commonly used methods which are the straight line
method and constant slope method to validate the results. Overall, the baseflow
volume estimations from the CA method were found to be greater than the results
obtained by the straight line method and the constant slope method. For the NC
watershed, there was significant evidence (p < 0.047) that the baseflow estimates were
in the order CA is greater than constant slope method, and the constant slope method
is equals to straight line method, while the statistically significant order for the OR
watershed was CA equals to constant slope method, and the constant slope method is
greater than the straight line method.