Embed Size (px)
Citation preview

Volume 4, Number 4, October – December’ 2015
ISSN (Print):2319-9032, (Online):2319-9040
PEZZOTTAITE JOURNALS SJIF (2012): 3.562, SJIF (2013): 5.074, SJIF (2014): 5.857
International Journal of Logistics & Supply Chain Management Perspectives © Pezzottaite Journals. 1842 |P a g e
A STUDY ON INVENTORY MANAGEMENT OF INDIAN PHARMACEUTICAL INDUSTRY
AND ITS IMPACT ON PROFITABILITY
Dr. S. K. Sinha5 Dr. Ruchi Goyal6 Sunil Kumar7
ABSTRACT
The creation of firms‟ value is been positively expected by a well-designed and implemented working capital management.
The purpose of this paper is to examine the trends in inventory management and its impact on firms‟ performance and to
examine significant difference between the profitability of firms and industries. Here we consider the return on total assets as
dependent variable, which is used as a measure of profitability and relation between inventory management and their
profitability. For this purpose here, we have taken a sample of ten Indian Pharmaceuticals firms (NSE listed) and the period
of 2000-2014. In this study, we used panel data regression for the investigation of the results. The panel data regression
shows that the highly investments in inventories are associated with less profitability. In previous empirical work, a strong
significant relationship between WCM and profitability has been found. In this way the final analysis of the operational
efficiency, liquidity and profitability of the Indian Pharmaceuticals firms have shown a significant changes and it also shows
how best practices are prevailing in the Cipla Ltd. and others, which are contributing to performance.
KEYWORDS
Inventory, Profitability, Liquidity, Operational Efficiency etc.
INTRODUCTION
Management of working capital is similar with controlling inventories because of within the sphere of working capital,
economical and effective management of inventory poses a difficult drawback. Sensible Inventory Management could be a
sensible finance management as inventories occupy the foremost strategic position in maximization of financial gain. A study of
company Balance sheets shows that a firm's inventory usually constitutes fifteen to thirty percent of it is invested with capital.
Profits primarily rely upon the turnover of working capital that is generally determined, by the turnover of inventories. the right
management and management of inventory not solely solves the acute drawback of liquidity however additionally will increase
annual profits and causes substantial reduction within the working capital of a firm. Inventories form a link between production
and sale of product. Therefore, it is essential to possess an adequate level of investment in inventories. Managing the amount of
investment in inventory is like maintaining the amount of water associate degree exceedingly in a very bathtub with an open drain.
The water is flowing out unendingly. If water is let into slowly, the bathtub is shortly empty. If water is let in too quickly, the
bathtub overflows. Just like the water within the tub, the actual things of inventories keep dynamical; however, the amount could
keep constant. The fundamental monetary issues square measure to work out the right level of investment in inventories and to
determine what proportion inventory should be no inheritable throughout every period to take care of that level.
REVIEW OF LITERATURE
Marvill and Tavis (1973) in their study indicated that the credit terms offered, inventory decisions and short term borrowing each
affects the optional policies of the others because of the linkage among their associated cash flows. They pointed out that the
current assets and liabilities of a firm are the stock reflection of closely interrelated operational and financial cash flows. They
suggested that the net effect of these combined flows must be recognized in searching for the optimal credit inventory or short
term borrowing policies. Most of the earlier studies for short-term investment and borrowing decision do not allow for the
interrelationships of this system. This study presents a model where optimal credit inventory and borrowing decisions are selected
as part of a short-term funds' subsystem. In their study, they outlined that the critical credit inventory linkage is followed by the
borrowing component. They formulated a model in a chance constrained programming format. They mentioned clearly in their
paper that the credit term of a firm would influence demand for its product and influence its investment inventory. In this way, the
credit policies become determinants of inventory policy. Lieberman (1980) studied on "Inventory demand and cost of Capital
effects". As earlier studies, he also included the opportunity cost of inventories as a key explanatory variable along with sales in
his study. Lieberman, in his study, examined the size and significance of the theoretically important cost of capital effect on
inventory investment by utilizing firm specific cost of capital measures in a pooled cross section econometric analysis of
inventory behaviour. He used a firm specific cost of capital measure instead of a market interest rate, which avoided the
measurement errors introduced into the' analysis by, the later procedures. The econometric analysis was conducted using two
5Professor & Dean, Chaudhary Ranbir Singh University, Haryana, India, [email protected] 6Associate Professor, School of Business, Suresh Gyan Vihar University, Rajasthan, India, [email protected] 7Research Scholar, Suresh Gyan Vihar University, Rajasthan, India, [email protected]
Volume 4, Number 4, October – December’ 2015
ISSN (Print):2319-9032, (Online):2319-9040
PEZZOTTAITE JOURNALS SJIF (2012): 3.562, SJIF (2013): 5.074, SJIF (2014): 5.857
International Journal of Logistics & Supply Chain Management Perspectives © Pezzottaite Journals. 1843 |P a g e
samples of firms. The first sample, which includes heavy machinery producing companies, attempted to explain inventory
investment behaviour for companies that produce output III response to orders. The second samples consisted of textiles
companies that produce output predominantly to stock in anticipation of orders. He explained that the desired level of inventory
was the function of sales, the opportunity cost of holding inventories and in the case of goods produced to order, order backlogs.
Irvine (1981) devoted his study towards finding out whether or not the level of inventory depends significantly on the cost
associate with holding inventory. The study estimated time-series equations over a 1958-74 period explaining the monthly
inventory levels held by the total retail sector and the non-durable and durable sub sectors. He found that expected future sales are
the major, determinants of retail inventory levels. Furthermore, he observed that the estimated coefficients on the capital cost
measures are negatively signed but they are statistically significant. He pointed out that the target durable inventories seem to be
much more sensitive to fluctuations in capital cost than nondurable inventories. The Irvine study demonstrated that the
fluctuations in capital cost causes change in target levels of retail inventory, which are both statistically and economically
significant.
Mishra (1988) studied on inventory management and control in central public enterprises in India. The purpose of the study was to
analyze and evaluate the inventory position in the various industrial groups of the central public enterprises in India over a period
of ten years from 1976/77 to 1986/87. For the comparative analysis, all the central public enterprises were divided into 12
industrial groups and 8-service group. The collected data were analyzed by using traditional techniques like ratio analysis and
different statistical techniques like correlation coefficient and trend analysis. After analyzing the data, the study revealed that the
value of inventory varied not only from year to year but also from industry to industry over the period under the study. The value
of inventory and its trend in public enterprises of the different industrial group exhibited positive trend. There was huge
investment in inventory. He concluded that the overall inventory management of central public enterprises was unsatisfactory. The
study further noted that the inventory had a high degree of positive correlation with sales in public enterprise in India. Shin and
Soenen (1998) studied on efficiency of working capital management and corporate profitability. They investigated the relation
between the firm's net trade cycle and its profitability. The relation was examined using correlation and regression analysis. They
found that in all cases, a strong negative relation between the length of the firm's net trade cycle and its profitability. In addition,
shorter net trade cycles are associated with higher risk adjusted stock returns. Alam and Hossain (2001) examined and evaluated
the practice and performance of inventory management in Khulna Shipyard Ltd (KSL) covering ten years period ranging between
1987/88 to 1996/97 using different financial and statistical tools. After analysis of financial data, the study revealed that the
inventory management performance of KSL was in a poor shape. On an average, inventory occupied about two thirds of total
current assets and there was significant positive correlation existed between the two variables. Inventory to total assets also
corroborates high investment in inventory. Inventory to net sales ratio ranged 4.3percent to 243percent against the expected norm
of 12 to 20 percent, which showed over investment in inventory. The conversion period of stores and spares was exceptionally
high ranging between 183 days to 1303 days with an average 455 days. The conversion period of work in progress also
corroborates the same situation as it ranged between 47 days to 328 days. The profitability of KSL was adversely affected by the
excess investment in inventories and high conversion period of stores, spares, and work in progress during the period of review.
He suggested that the company should establish an integrated separate department for inventory management, which could work
in liaison with the production, finance and sales department to perform the functions like inventory planning, procurement,
storing, inspection, maintenance for effective control over different components of inventories.
According to Lazaridis and Tryfonidis (2006), assets management indicates what proportion a corporation shall continue its
existence if operations unit aborted. Moreover, it provides indications of the amount progress between functions of inventory
purchase to the purpose of assortment of sales amounts. Retention of inventories at a desirable level and setting credit policies by
suppliers of materials and granting credit to customers significantly affects company gain and together they investigated the
affiliation between gain and dealing capital management at intervals the stock market Market of Athens throughout 2001-2004.
The target of this analysis is to review the affiliation between gain and additionally the cycle of cash transformation and its
elements. Results indicate that a significant relationship exists between gross operational profit and additionally the money
transformation cycle. What are more managers can generate an honest profit for the company pattern the right management
techniques for the cash transformation cycle and its elements.
Pandey (2009) examined cash management, inventory management, receivables management, working capital management of
HINDALCO for the period 1989 to 2008. His findings suggested Company‟s investment activities are not able to generate proper
cash inflow. The time lag for converting raw materials to finished product has been increasing year after year in the study period.
Company should make proper arrangement and policies to make all debts good and to reduce the average collection period. To
conclude from the above review of studies, it is clear that factors affecting the level of working capital and its components have
differing relationship across different countries and firms' size. Moreover, the behaviour of these variables has been changing over
time. The review of studies shows that no attempt has been made to analyze working capital management in NALCO. Based on
previous studies, the current research tries to fill these gaps. Nobani, Abdollatif and Alhajjar (2010), studied the link between the
cash transformation cycle and profitability. To perform this analysis, they used information gathered from 34771 Japanese firms
between the years 1990-2004. Results indicated that a negative relationship existed between profitability and therefore the cash

Volume 4, Number 4, October – December’ 2015
ISSN (Print):2319-9032, (Online):2319-9040
PEZZOTTAITE JOURNALS SJIF (2012): 3.562, SJIF (2013): 5.074, SJIF (2014): 5.857
International Journal of Logistics & Supply Chain Management Perspectives © Pezzottaite Journals. 1844 |P a g e
transformation cycle. The result was constant all told sample firms except service suppliers and business firms. Chatreji (2010)
studied the impact of assets management on gain in firms listed in London securities market throughout the years 2006-2008. The
man of science has used the Pierson correlation to guage the impact of money transformation cycle, the amount of assortment of
assets, inventory retention period, liability settlement period, this too fast magnitude relation, to net operational profit. Results
indicated that a negative relationship exists between assets management and profitability.
OBJECTIVES & RESEARCH HYPOTHESES
The objective of this research is to distinguish the relationship between methods of inventory management and its impact on
profitability of Indian Pharmaceutical companies and to examine the causes for any significant differences between the Indian
pharmaceutical companies.
H0: A Significant relationship exists between the inventories days and return on total assets.
RESEARCH METHODOLOGY
The primary aim of this study is to investigate the impact of inventory, receivables & cash management on corporate profitability
of Indian Pharmaceutical Industry. This is achieved by developing a similar empirical framework first used by Shin and Soenen
(1998) and the subsequent work of Deloof (2003). We extend our study to examine the possible causes for any significant
differences between the Companies. Our study focuses exclusively on those Indian Pharmaceutical companies are listed in NSE
Pharma Indices.
Thus, the empirical study is based on a sample of 10 Indian Pharmaceutical Companies. The data has been collected from Prowess
database and companies annual reports. The sample was drawn from the list of NSE Pharma indices. All companies‟ data was
available for a 14 years‟ period, covering the accounting period 1999-2000 to 2012-2013. This has given a balanced panel data set
of 140 firm-year observations for a sample of 10 firms.
Explanatory variables
The efficiency ratios, namely accounts receivable, inventory and accounts payable have been computed, using the formulas as
follows:
Inventory Conversion Period (in days) = (Stocks * 365)/Cost of Sales
Control Variables
In order to account for firm‟s size and the other variables that may influence profits so we use sales a proxy for size (the natural
logarithm of sales), the gearing ratio (financial debt/total assets), the gross working capital turnover ratio (sales/current assets) and
the ratio of current assets to total assets are included as control variables in the regressions.
ANALYSIS OF INVENTORY OF INDIAN PHARMACEUTICAL INDUSTRY
Compression of Inventory
The volume of inventory represents the level of required material for production and sales. Table 1 shows the level of inventory in
selected Indian pharmaceutical companies taken in this research. It is observed from Table 1 that based on average inventory
Cipla Ltd. is the biggest pharmaceutical company in India maintaining average inventory of Rs.12217.6 million during the
research period followed by Aurobindo Pharma Ltd. with average inventory of Rs.7122.4 million. Cipla ltd. registered growth as
the inventory increased Rs 25111.6 million in the 2013 from Rs.2753.6 million of 2000, which shows a growth of 9.12 times.
During the 2000 to 2014, Cipla Ltd. maintained the largest level of inventory than that of other company in India with average of
Rs.5151.0 million, Rs.11934.0 million and Rs.22146.7 million of the first five year, second five year and third five year
respectively.
Based on average inventory Glenmark Pharmaceuticals Ltd. is smallest company maintain of Rs 1392.7 million. Glenmark
Pharmaceuticals Ltd. registered growth as the inventory increased Rs 2103.4 million in the 2013 from Rs. 348.9 million of 2000,
which shows a growth of 6.03 times. Divi‟s Laboratories Ltd. had the average inventory of Rs 3826.9 million that encountered the
highest growth than other companies. During the study period, the growth was 17.69 times. Its inventory was Rs.504.8 million in
2000 and reached to Rs 8932.7 million in 2013.
The industry average shows an increasing trend in inventory of Indian Pharmaceutical companies. It has grown more three times.
Volume 4, Number 4, October – December’ 2015
ISSN (Print):2319-9032, (Online):2319-9040
PEZZOTTAITE JOURNALS SJIF (2012): 3.562, SJIF (2013): 5.074, SJIF (2014): 5.857
International Journal of Logistics & Supply Chain Management Perspectives © Pezzottaite Journals. 1845 |P a g e
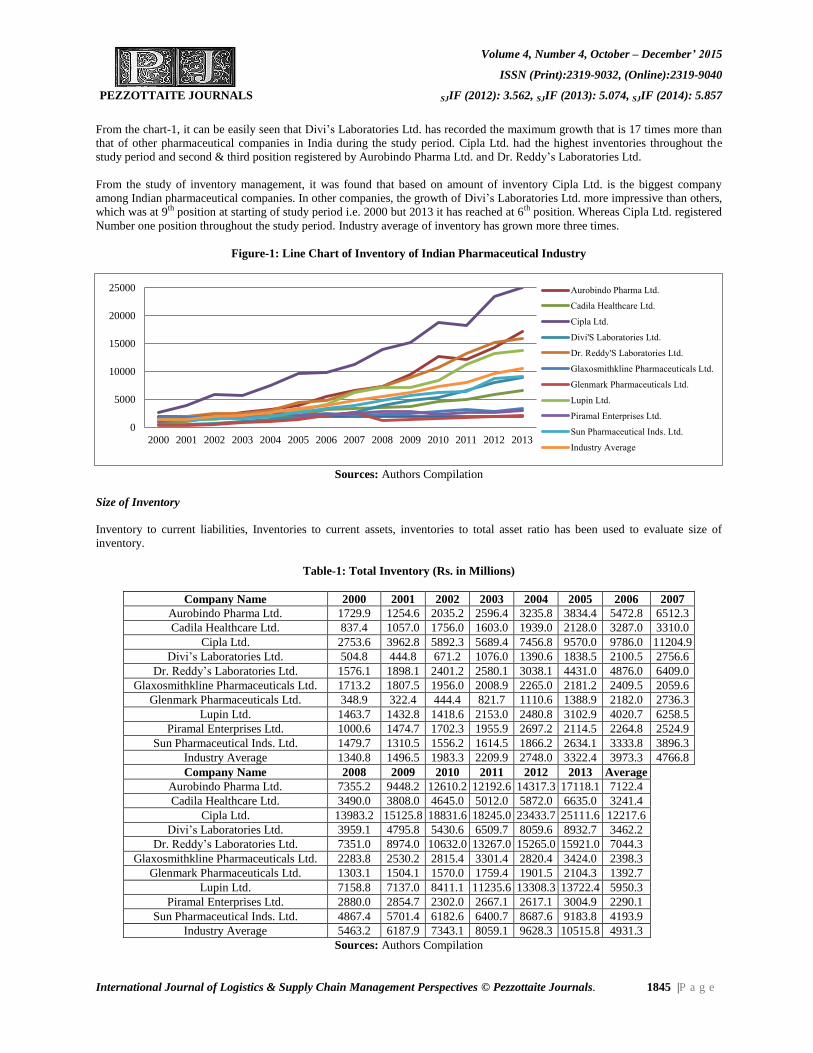
From the chart-1, it can be easily seen that Divi‟s Laboratories Ltd. has recorded the maximum growth that is 17 times more than
that of other pharmaceutical companies in India during the study period. Cipla Ltd. had the highest inventories throughout the
study period and second & third position registered by Aurobindo Pharma Ltd. and Dr. Reddy‟s Laboratories Ltd.
From the study of inventory management, it was found that based on amount of inventory Cipla Ltd. is the biggest company
among Indian pharmaceutical companies. In other companies, the growth of Divi‟s Laboratories Ltd. more impressive than others,
which was at 9th position at starting of study period i.e. 2000 but 2013 it has reached at 6th position. Whereas Cipla Ltd. registered
Number one position throughout the study period. Industry average of inventory has grown more three times.
Figure-1: Line Chart of Inventory of Indian Pharmaceutical Industry
Sources: Authors Compilation
Size of Inventory
Inventory to current liabilities, Inventories to current assets, inventories to total asset ratio has been used to evaluate size of
inventory.
Table-1: Total Inventory (Rs. in Millions)
Company Name 2000 2001 2002 2003 2004 2005 2006 2007
Aurobindo Pharma Ltd. 1729.9 1254.6 2035.2 2596.4 3235.8 3834.4 5472.8 6512.3
Cadila Healthcare Ltd. 837.4 1057.0 1756.0 1603.0 1939.0 2128.0 3287.0 3310.0
Cipla Ltd. 2753.6 3962.8 5892.3 5689.4 7456.8 9570.0 9786.0 11204.9
Divi‟s Laboratories Ltd. 504.8 444.8 671.2 1076.0 1390.6 1838.5 2100.5 2756.6
Dr. Reddy‟s Laboratories Ltd. 1576.1 1898.1 2401.2 2580.1 3038.1 4431.0 4876.0 6409.0
Glaxosmithkline Pharmaceuticals Ltd. 1713.2 1807.5 1956.0 2008.9 2265.0 2181.2 2409.5 2059.6
Glenmark Pharmaceuticals Ltd. 348.9 322.4 444.4 821.7 1110.6 1388.9 2182.0 2736.3
Lupin Ltd. 1463.7 1432.8 1418.6 2153.0 2480.8 3102.9 4020.7 6258.5
Piramal Enterprises Ltd. 1000.6 1474.7 1702.3 1955.9 2697.2 2114.5 2264.8 2524.9
Sun Pharmaceutical Inds. Ltd. 1479.7 1310.5 1556.2 1614.5 1866.2 2634.1 3333.8 3896.3
Industry Average 1340.8 1496.5 1983.3 2209.9 2748.0 3322.4 3973.3 4766.8
Company Name 2008 2009 2010 2011 2012 2013 Average
Aurobindo Pharma Ltd. 7355.2 9448.2 12610.2 12192.6 14317.3 17118.1 7122.4
Cadila Healthcare Ltd. 3490.0 3808.0 4645.0 5012.0 5872.0 6635.0 3241.4
Cipla Ltd. 13983.2 15125.8 18831.6 18245.0 23433.7 25111.6 12217.6
Divi‟s Laboratories Ltd. 3959.1 4795.8 5430.6 6509.7 8059.6 8932.7 3462.2
Dr. Reddy‟s Laboratories Ltd. 7351.0 8974.0 10632.0 13267.0 15265.0 15921.0 7044.3
Glaxosmithkline Pharmaceuticals Ltd. 2283.8 2530.2 2815.4 3301.4 2820.4 3424.0 2398.3
Glenmark Pharmaceuticals Ltd. 1303.1 1504.1 1570.0 1759.4 1901.5 2104.3 1392.7
Lupin Ltd. 7158.8 7137.0 8411.1 11235.6 13308.3 13722.4 5950.3
Piramal Enterprises Ltd. 2880.0 2854.7 2302.0 2667.1 2617.1 3004.9 2290.1
Sun Pharmaceutical Inds. Ltd. 4867.4 5701.4 6182.6 6400.7 8687.6 9183.8 4193.9
Industry Average 5463.2 6187.9 7343.1 8059.1 9628.3 10515.8 4931.3
Sources: Authors Compilation
0
5000
10000
15000
20000
25000
2000 2001 2002 2003 2004 2005 2006 2007 2008 2009 2010 2011 2012 2013
Aurobindo Pharma Ltd.
Cadila Healthcare Ltd.
Cipla Ltd.
Divi'S Laboratories Ltd.
Dr. Reddy'S Laboratories Ltd.
Glaxosmithkline Pharmaceuticals Ltd.
Glenmark Pharmaceuticals Ltd.
Lupin Ltd.
Piramal Enterprises Ltd.
Sun Pharmaceutical Inds. Ltd.
Industry Average
Continue...

Volume 4, Number 4, October – December’ 2015
ISSN (Print):2319-9032, (Online):2319-9040
PEZZOTTAITE JOURNALS SJIF (2012): 3.562, SJIF (2013): 5.074, SJIF (2014): 5.857
International Journal of Logistics & Supply Chain Management Perspectives © Pezzottaite Journals. 1846 |P a g e
Inventory to Current Assets
Inventory to current assets ratio shows that what portion of a company‟s inventories is financed from its available cash. In general,
the lower the ratio, the higher the liquidity of a company is. However, the value of inventory to current assets ratio varies from
industry to industry and company to company.
Table-2 shows the relationship between inventories to current assets, which shows the percentage of inventories total current
assets. The size of inventory is showing the industry average of Indian pharmaceutical companies is 38.71%, which may be ideal
ratio for pharmaceutical companies in India. The highest inventory to current assets ratio can be seen in Divi‟s Laboratories,
which is near about 56% of inventory in total current assets. The lowest inventories to current assets ratio is maintained by Dr.
Reddy‟s Laboratories Ltd., it has 26.04% and higher is maintained by Divi‟s Laboratories Ltd. it has 55.86% overall inventories to
current assets ratio. The inventories to current assets ratio of Cipla Ltd. is always higher than industry average, it has been moving
from 40.77% to 63.13% throughout of the study period and its annual average is 51.65%. The ratio of industry average shows
declining trend as it declined from 47.67% to 30.77%.
Inventory to Current Liabilities
Inventory to current liabilities indicates reliance on the available inventory for payment of short-term debt. It is one of the
measures of the solvency of a firm. A high Inventory to Current Liabilities ratio, relative to industry norms, suggests over-reliance
on unsold goods to finance operations. Inventory to current liabilities indicates the relationship between inventory and current
liabilities.
Table-2: Inventory / Current Assets (in %)
Company Name 2000 2001 2002 2003 2004 2005 2006 2007
Aurobindo Pharma Ltd. 42.80 24.83 30.78 33.62 40.57 32.65 31.24 36.05
Cadila Healthcare Ltd. 46.49 58.33 54.21 43.98 58.56 52.78 56.33 51.96
Cipla Ltd. 63.13 58.84 61.28 52.61 54.89 49.98 44.46 41.54
Divi‟s Laboratories Ltd. 64.47 43.66 52.19 53.35 56.51 60.94 53.59 54.73
Dr. Reddy‟s Laboratories Ltd. 33.99 16.75 17.41 22.76 18.63 25.97 16.14 30.53
Glaxosmithkline Pharmaceuticals Ltd. 52.89 49.40 44.25 55.83 56.13 60.59 64.04 47.38
Glenmark Pharmaceuticals Ltd. 39.10 28.50 25.41 36.79 27.23 26.80 33.04 30.65
Lupin Ltd. 31.73 29.17 25.38 48.26 49.34 27.80 30.28 42.40
Piramal Enterprises Ltd. 43.54 49.59 46.41 48.60 60.23 47.18 43.29 39.30
Sun Pharmaceutical Inds. Ltd. 58.60 48.09 36.06 44.13 14.16 14.76 15.48 15.80
Industry Average 47.67 40.72 39.34 43.99 43.63 39.94 38.79 39.03
Company Name 2008 2009 2010 2011 2012 2013 Average
Aurobindo Pharma Ltd. 36.21 42.56 42.35 42.65 40.62 34.67 36.54
Cadila Healthcare Ltd. 45.60 46.24 45.53 39.59 41.96 44.00 48.97
Cipla Ltd. 40.77 44.49 50.61 49.59 54.89 56.02 51.65
Divi‟s Laboratories Ltd. 57.15 65.94 56.92 53.60 57.29 51.72 55.86
Dr. Reddy‟s Laboratories Ltd. 28.74 37.70 34.42 31.53 27.36 22.63 26.04
Glaxosmithkline Pharmaceuticals Ltd. 18.34 12.57 12.06 13.35 11.20 13.51 36.54
Glenmark Pharmaceuticals Ltd. 22.95 29.89 39.61 29.26 20.23 14.23 28.84
Lupin Ltd. 49.63 40.97 37.60 38.54 36.55 28.58 36.87
Piramal Enterprises Ltd. 39.58 45.02 2.32 5.60 6.62 19.45 35.48
Sun Pharmaceutical Inds. Ltd. 19.55 45.99 25.13 23.34 41.03 22.86 30.35
Industry Average 35.85 41.14 34.66 32.71 33.77 30.77 38.71
Sources: Authors Compilation
Table 3 shows the relationship between inventories to current liability. This ratio shows the safe position of current liability. The
industry average of inventory to current liability is 125.5%. The industry average of inventory to current liability ratio is
fluctuated throughout the study period. The highest inventory to current liability is recorded by Divi‟s Laboratories Ltd. on an
overall average 204.1% and lowest of Piramal Enterprises Ltd. at 76.6%, Cipla Ltd. is at second position for this ratio as it is
169% as an overall average throughout the study period. Cipla Ltd. has shown opposite trend than the industry average, it has
increased from 165.1% of 2000 to 195.2% of 2013.
Table 3 shows the relationship between inventories to current liability. This ratio shows the safe position of current liability. The
industry average of inventory to current liability is 125.5%. The industry average of inventory to current liability ratio is

Volume 4, Number 4, October – December’ 2015
ISSN (Print):2319-9032, (Online):2319-9040
PEZZOTTAITE JOURNALS SJIF (2012): 3.562, SJIF (2013): 5.074, SJIF (2014): 5.857
International Journal of Logistics & Supply Chain Management Perspectives © Pezzottaite Journals. 1847 |P a g e
fluctuated throughout the study period. The highest inventory to current liability is recorded by Divi‟s Laboratories Ltd. on an
overall average 204.1% and lowest of Piramal Enterprises Ltd. at 76.6%, Cipla Ltd. is at second position for this ratio as it is
169% as an overall average throughout the study period. Cipla Ltd. has shown opposite trend than the industry average, it has
increased from 165.1% of 2000 to 195.2% of 2013.
Table 4 shows the inventory turnover ratio of Indian Pharmaceutical companies. The inventory turnover ratio is helpful to
analyses the velocity of inventory in the company. It is a relationship between cost of goods sold and average inventory, the
higher the ratio shows the higher efficiency of inventory. The inventory turnover ratio of Indian Pharmaceutical companies shows
the industry average is 3.44 times. The highest inventory turnover ratio of Glaxosmithkline Pharmaceuticals Ltd. with on an
average of 4.67 times and lowest is of Divi‟s laboratories Ltd. with 2.05 time as an annual average. The inventory turnover ratio of
Cipla Ltd. is moving between 1.68 times to 2.62 times, Piramal Enterprises Ltd. has recorded second highest inventory turnover
ratio of 4.39 times. During 2010 to 2014 inventory turnover ratio of Cipla Ltd. is moving between 2.23 to 2.62 times. The
inventory turnover ratio of Cipla Ltd. is not quite good. It is lower than the industry average.
Table-3: Inventory / Current Liability (in %)
Company Name 2000 2001 2002 2003 2004 2005 2006 2007
Aurobindo Pharma Ltd. 135.2 88.1 98.6 167.4 165.8 135.0 170.1 157.8
Cadila Healthcare Ltd. 114.8 124.4 101.9 88.1 105.2 106.5 87.3 119.2
Cipla Ltd. 165.1 160.4 164.1 151.6 150.8 150.5 185.3 128.6
Divi‟s Laboratories Ltd. 110.1 127.2 128.7 202.2 208.1 159.6 169.5 174.7
Dr. Reddy‟s Laboratories Ltd. 148.6 115.8 114.6 88.5 83.6 80.1 77.0 94.1
Glaxosmithkline Pharmaceuticals Ltd. 149.1 119.1 96.0 97.5 103.2 84.7 97.3 84.1
Glenmark Pharmaceuticals Ltd. 139.5 76.7 83.7 132.3 160.8 125.9 117.0 100.3
Lupin Ltd. 100.0 92.8 77.5 109.4 103.5 103.6 113.0 142.8
Piramal Enterprises Ltd. 84.0 89.8 108.5 104.5 122.0 103.2 96.0 90.0
Sun Pharmaceutical Inds. Ltd. 247.2 218.9 185.0 142.2 136.2 158.5 68.5 53.6
Industry Average 139.4 121.3 115.8 128.4 133.9 120.8 118.1 114.5
Company Name 2008 2009 2010 2011 2012 2013 Average
Aurobindo Pharma Ltd. 148.8 158.8 162.8 191.0 148.8 129.9 147.0
Cadila Healthcare Ltd. 118.9 98.1 119.5 103.7 136.4 126.3 110.7
Cipla Ltd. 138.1 157.4 202.1 197.7 219.8 195.2 169.0
Divi‟s Laboratories Ltd. 245.0 293.8 234.7 220.2 280.6 303.1 204.1
Dr. Reddy‟s Laboratories Ltd. 70.0 62.0 92.4 77.0 97.8 84.9 91.9
Glaxosmithkline Pharmaceuticals Ltd. 84.1 79.9 81.3 121.6 86.0 92.9 98.3
Glenmark Pharmaceuticals Ltd. 57.2 76.6 75.3 44.0 27.9 25.1 88.7
Lupin Ltd. 92.7 117.4 120.5 127.7 134.9 123.1 111.4
Piramal Enterprises Ltd. 88.0 79.0 28.3 33.5 34.7 39.0 78.6
Sun Pharmaceutical Inds. Ltd. 84.9 216.5 196.9 137.7 170.8 149.3 154.7
Industry Average 112.8 133.9 131.4 125.4 133.8 126.9 125.5
Sources: Authors Compilation
Inventory Conversion Period (ICP)
Table 5 shows the conversion period of inventory, it is shown from the table that the industry average of inventory conversion
period is 118 days (approx.). Based on industry average Divi‟s Laboratory Ltd. is taking most time of 189 days (approx.) in
conversion of inventory, whereas Glaxosmithkline Pharmaceuticals Ltd. has shown the best performance as it takes just 79 days
(approx.) in inventory conversion. Cipla Ltd. stands at 9th position in inventory conversion period. It takes 166 days (approx.) in
inventory conversion; Cipla Ltd. has improving his performance last five years from 164 days in 2011 to 139 days in 2013.
Table-4: Inventory Turnover Ratio (in Times)
Company Name 2000 2001 2002 2003 2004 2005 2006 2007
Aurobindo Pharma Ltd. 4.55 6.09 4.39 3.82 2.83 3.15 2.96 2.80
Cadila Healthcare Ltd. 3.82 3.44 3.63 4.55 4.00 4.06 2.99 3.19
Cipla Ltd. 2.34 2.15 1.68 2.13 1.97 2.01 2.26 2.34
Divi‟s Laboratories Ltd. 2.86 3.18 2.54 2.16 1.83 1.41 2.17 2.31
Dr. Reddy‟s Laboratories Ltd. 3.50 3.74 3.29 3.70 3.19 2.92 3.94 3.54
Glaxosmithkline Pharmaceuticals Ltd. 4.28 5.10 4.33 4.10 4.09 4.43 4.06 4.60

Volume 4, Number 4, October – December’ 2015
ISSN (Print):2319-9032, (Online):2319-9040
PEZZOTTAITE JOURNALS SJIF (2012): 3.562, SJIF (2013): 5.074, SJIF (2014): 5.857
International Journal of Logistics & Supply Chain Management Perspectives © Pezzottaite Journals. 1848 |P a g e
Glenmark Pharmaceuticals Ltd. 3.13 3.91 3.57 2.45 2.53 2.33 2.19 2.55
Lupin Ltd. 3.32 3.66 4.86 3.99 3.68 3.90 3.65 3.10
Piramal Enterprises Ltd. 3.76 3.91 4.15 4.64 3.49 4.20 4.81 5.25
Sun Pharmaceutical Inds. Ltd. 1.88 2.74 2.41 3.43 3.80 4.14 4.33 4.73
Industry Average 3.34 3.79 3.49 3.49 3.14 3.26 3.34 3.44
Company Name 2008 2009 2010 2011 2012 2013 Average
Aurobindo Pharma Ltd. 3.02 2.76 2.59 2.91 3.12 2.97 3.43
Cadila Healthcare Ltd. 3.37 3.92 3.85 3.91 3.98 4.10 3.77
Cipla Ltd. 2.24 2.30 2.23 2.48 2.35 2.62 2.22
Divi‟s Laboratories Ltd. 2.00 1.34 1.46 1.81 1.79 1.87 2.05
Dr. Reddy‟s Laboratories Ltd. 3.63 3.27 3.44 3.01 3.46 3.36 3.43
Glaxosmithkline Pharmaceuticals Ltd. 4.47 4.62 4.64 4.71 6.25 5.72 4.67
Glenmark Pharmaceuticals Ltd. 3.54 3.48 4.39 5.38 6.20 6.82 3.75
Lupin Ltd. 3.00 3.48 3.69 3.38 3.51 3.79 3.64
Piramal Enterprises Ltd. 5.30 6.28 3.40 3.70 4.24 4.29 4.39
Sun Pharmaceutical Inds. Ltd. 4.74 2.24 2.27 2.76 1.58 1.78 3.06
Industry Average 3.53 3.37 3.20 3.40 3.65 3.73 3.44
Sources: Authors Compilation
Table-5: Inventory Period (in days)
Company Name 2000 2001 2002 2003 2004 2005 2006 2007
Aurobindo Pharma Ltd. 8.00 59.96 83.09 95.56 128.89 115.95 123.44 130.47
Cadila Healthcare Ltd. 95.43 106.11 100.54 80.30 91.23 89.86 122.12 114.42
Cipla Ltd. 155.95 170.09 217.52 171.32 185.13 181.28 161.65 155.79
Divi‟s Laboratories Ltd. 127.53 114.81 143.78 168.78 199.82 258.43 167.87 158.08
Dr. Reddy‟s Laboratories Ltd. 104.37 97.71 110.81 98.68 114.27 125.01 92.72 103.08
Glaxosmithkline Pharmaceuticals Ltd. 85.28 71.64 84.30 89.07 89.28 82.45 89.95 79.40
Glenmark Pharmaceuticals Ltd. 116.66 93.25 102.32 149.21 144.12 156.85 166.54 143.37
Lupin Ltd. 109.87 99.71 75.06 91.58 99.07 93.48 99.88 117.80
Piramal Enterprises Ltd. 97.15 93.24 87.97 78.74 104.69 86.89 75.80 69.48
Sun Pharmaceutical Inds. Ltd. 194.12 133.04 151.48 106.53 96.12 88.13 84.31 77.20
Industry Average 109.44 103.95 115.69 112.98 125.26 127.83 118.43 114.91
Company Name 2008 2009 2010 2011 2012 2013 Average
Aurobindo Pharma Ltd. 121.01 132.37 140.67 125.49 116.95 123.00 107.49
Cadila Healthcare Ltd. 108.47 93.01 94.77 93.32 91.68 89.08 97.88
Cipla Ltd. 162.62 158.56 163.98 147.11 155.08 139.14 166.09
Divi‟s Laboratories Ltd. 182.59 271.76 249.68 201.91 203.47 195.20 188.84
Dr. Reddy‟s Laboratories Ltd. 100.60 111.49 106.25 121.33 105.35 108.68 107.17
Glaxosmithkline Pharmaceuticals Ltd. 81.64 78.96 78.66 77.55 58.43 63.77 79.31
Glenmark Pharmaceuticals Ltd. 103.06 104.76 83.17 67.88 58.83 53.48 110.25
Lupin Ltd. 121.85 104.81 99.04 108.05 103.95 96.31 101.46
Piramal Enterprises Ltd. 68.82 58.13 107.28 98.73 86.09 85.03 85.57
Sun Pharmaceutical Inds. Ltd. 76.96 163.23 160.84 132.18 231.00 205.44 135.76
Industry Average 112.76 127.71 128.43 117.36 121.08 115.91 117.98
Sources: Authors Compilation
Regression Analysis
To investigate the impact of inventory management on profitability, the model used for the regressions analysis is expressed
within the general type as given in equation:
ROTA = f (ln sales, gear, cata, clta, turnca, ivndays) Equation
ROTA = β0 + β1 lnsalesit + β2 gearit + β3 catait + β4 cltait + β5 turncait + β6 ivndaysit +εit [model]
Where i denoting firms (cross-section dimension) starting from one to ten and t denoting years (time-series dimension) starting
from one to fourteen.

Volume 4, Number 4, October – December’ 2015
ISSN (Print):2319-9032, (Online):2319-9040
PEZZOTTAITE JOURNALS SJIF (2012): 3.562, SJIF (2013): 5.074, SJIF (2014): 5.857
International Journal of Logistics & Supply Chain Management Perspectives © Pezzottaite Journals. 1849 |P a g e
The model specifies on top of is calculable using the regression-based framework (Fixed Effects and Pooled OLS) as used by
Deloof (2003). Our model differs, initial by using ROTA as a comprehensive measure of profitability and also the model includes
asset-management and funding policy as management variables. The information set used for this half is pooled across companies
and years, given associate balanced panel data set of one hundred forty firm-year observations.
A classical check for panel information is one among mounted effects model (FEM) versus Random Effects Model (REM). In the
REM, it is assumed that there is one common intercept term, however that the intercepts for individual companies vary from this
common intercept in a very random manner. To see that of those estimators are a lot of applicable to use, each a fixed effects and
a random effects expert was used to estimate the coefficients in model one. The Hausman check, that may be a check for the null
hypothesis of no correlation, rejects this null hypothesis then the choice is taken to employ a fixed effects framework.
Table-6: Regression Analysis
Coefficient Std. Error t-ratio p-value
Const −0.248755 0.155005 -1.6048 0.11108
GEAR −0.135787 0.195005 -0.6963 0.4875
CATA 0.605913 0.114072 5.3117 <0.00001 ***
CATURN 0.0488044 0.0155259 3.1434 0.00209 ***
CLTA −0.666031 0.268386 -2.4816 0.01442 **
INVDAYS −8.18222e-05 0.000285896 -0.2862 0.77521
LNSales 0.0182702 0.0126318 1.4464 0.1506
R-squared 0.334465
Sources: Authors Compilation
The Table-6 represents the results of regression one, applying a fixed affects methodology, wherever the intercept term is allowed
to vary across corporations. It is instantly obvious from the adjusted R-squared values that the employment of a firm specific
intercept improves the informative power of those models. In Regression, the adjusted R-squared explain make a case for 44% of
the variation in profitability
While the coefficient of inventories variable is negative during this regression, however the coefficient is not different very
different from zero. The coefficients of the opposite variables enclosed within the model are significant, apart from GEAR and
LNSales. The firms‟ profitability as measured by ROTA will increase with firms‟ size, gross working capital potency, and with a
lesser aggressiveness of asset management. This is often contrary to the traditional theory of asset management, wherever a
conservative policy is anticipated to sacrifice profitability at the expense of liquidity. As reveals by the study of Deloof (2003), the
capital structure incorporates a negative impact on profitability; apart from our findings, the coefficient of financial debt is
significant at five percent level. The aggressive financing policy observes for the sample companies that is anticipated to
contribute completely to profitability have unconcealed otherwise. This is often a usually observed feature of the sample
companies and this has the tendency of skyrocketing the risk of a short-run liquidity problem.
CONCLUSION
The different analyses have identified critical management practices and are expected to assist managers in identifying areas
where they might improve the inventory management performance of their operation. The results have provided to managers with
information regarding the basic financial management practices used by their peers and their peers attitudes toward these
practices. This study has shown that the Cipla Ltd., has been able to achieve high scores on the inventory management and it has
negative impact on its profitability. On this premise this industry may be referred as the „hidden champions‟ and could thus be
used as best practice among the Indian Pharmaceutical Industry.
REFERENCES
1. Agarwal, Pankaj, K., and Varma, Sunil Kumar. (2013) “Working Capital Management and Corporate Performance:
evidence from a study of Indian Firms, Int. J. Indian Culture and Business Management, Volume 7, No. 4, 552-571
2. Anand, M. (2001). “Working Capital performance of corporate India: An empirical survey”, Management &
Accounting Research, Vol. 4(4), pp. 35-65
3. Bolten, S. E. (1976). “Managerial Finance”, Boston: Houghton Mifflinco, p. 426
4. Deloof, D. (2003). “Does Working Capital Management affect Profitability of Belgian Firms”? Journal of Business
Finance and Accounting, Vol 30, No 3 & 4, pp. 573–587

Volume 4, Number 4, October – December’ 2015
ISSN (Print):2319-9032, (Online):2319-9040
PEZZOTTAITE JOURNALS SJIF (2012): 3.562, SJIF (2013): 5.074, SJIF (2014): 5.857
International Journal of Logistics & Supply Chain Management Perspectives © Pezzottaite Journals. 1850 |P a g e
5. Starr, Martin, K., and David, W. Millier (1962). “Inventory Control: Theory and Practice”, Englewood Cliffs, N.J.:
Prantice-Hall, p.17
6. Magee, J. F. “Guides of Inventory Policy” I-III, Harward Business Reviews, 34 (Jan-Feb, 1956) pp. 49-60, (Mar-Apr,
1956) pp. 103-116 and (May-June, 1956), pp. 57-70.
7. Shin, H. H., and Soenen, L. (19980. “Efficiency of working capital and corporate profitability”, Financial Practice and
Education, Vol. 8 No. 2, pp. 37-45
8. Smith, K. V. (1973). “State of the art of Working Capital Management” Financial Management, Autumn, pp. 50-55
9. Synder, Arthur. (April, 1964). “Principles of Inventory Management”, Financial Executives, XXXII.
10. Soloman, E., and Pringle, J. J. (1978). “An Introduction to Financial Management”, Prentice Hall of India, pp. 218-221.
11. Retrieved from
http://www.researchgate.net/publication/238599541_Trends_in_Working_Capital_Management_and_its_Impac...
12. Retrieved from http://www.slideshare.net/KrunalShah2/bjjk
13. Retrieved from http://www.slideshare.net/ankita3590/working-capital-management-13794247
*****


![[ARCHIVED] 8040 9040 GCE Biology International PDF](https://img.dokumen.tips/doc/110x75/577cc30e1a28aba711950644/archived-8040-9040-gce-biology-international-pdf.jpg)