Embed Size (px)
Citation preview

8/9/2019 A Study on Interference of Surface Model Footings Resting on Sand
http://slidepdf.com/reader/full/a-study-on-interference-of-surface-model-footings-resting-on-sand 1/9
Journal - The Institution of Engineers, Malaysia (Vol. 67, No. 1, March 2006) 15
A STUDY ON INTERFERENCE OF SURFACE MODEL
FOOTINGS RESTING ON SAND
Iqraz Nabi Khan1, K.C.Bohara2, M.L.Ohri3 and Alam Singh4
1Professor and Head, Department of Civil Engineering, Sri Balaji College of Engineering and Technology, Benad Road,
Jaipur-302013, Rajasthan, India.2
Assistant Engineer, Irrigation Department, Jodhpur, Rajasthan, India.3Former Professor, M.B.M. Engineering College, Jodhpur, Rajasthan, India.
4Former Professor and Head, M.B.M. Engineering College, Jodhpur, Rajasthan, India.
E-mail: [email protected]
1. INTRODUCTIONAll the structures, which exist on the earth, are ultimately
supported by the earth. The loads of a structure are transmitted
to the ground through its lowest structural element called the
foundation. In addition to the foundation material, the destiny
of a structure also depends on the properties of the patch of the
earth, rock or soil, on which the structure stands. So a
foundation engineer is concerned with the twin problems of
evaluating the ability of the earth to support the loads and
designing the proper transition members to transmit the
superstructure loads to the ground. The foundation design is
aimed at providing a means of transmitting the loads from a
structure to the underlying soil without causing any shearfailure or excessive settlement of the soil under the imposed
loads. Thus the choice of a suitable bearing capacity of soil
becomes the most important point to be considered in any
project. Bearing capacity, the supporting power of a soil or
rock, may be determined by analytical methods, conducting
field and laboratory tests and from the building codes. Soil
characteristics, position of water table, types of foundation and
their location are some of the factors which affect the bearing
capacity and the performance of a foundation.
The conventional theories on bearing capacity deal with
ideal situation. Inadequacies of these theories have been
experienced by many when met with situations, which deviate
from those assumed in these theories. When a locality is under-
developed and the foundation units are farther apart, the
adoption of conventional methods for computing the bearing
capacity is quite justified. But as the area goes on developing,
the proximity of the buildings to each other has a definite
influence on the bearing capacity and settlement characteristics
of footings. The interaction of pressure bulbs and failure
surfaces in closely placed footings change their bearing
capacity and settlement. This has provided the direction for
research on behaviour of interfering (adjacent) footings.
Model studies conducted on purely cohesionless soil by
Stuart [1] showed an increasing trend of bearing capacity with
decreasing spacing when pair of footings were brought closer
from large distance achieving a maximum at a spacing of about
1 to 1.5 times width of the footing. The failure surfaces were
also drawn and ultimate capacity for the pair was worked out.
The results of this theoretical investigation were not in close
agreement with the observed. Stuart [1] presented the results in
the form of non-dimensional charts. Stuart [1] was concerned
only with the interference between two footings. Mandel [2]
investigated a more general problem with structures on either
side of a footings. He developed the solution for an ideal soil
considering it as a weightless material. It is evident from his
curves that as the spacing between the footings decreases, the
bearing capacity increases. This is in general agreement to thework of Stuart [1]. Amir [3] obtained the tilt in case of hinged
footings and moments in the case of restrained footings from
the theoretical investigations on a pair of strip footings. Saran
and Aggarawal [4] conducted tests on sands and found that
bearing capacity of two interfering footings decreases rapidly
with the increase in spacing up to a spacing of 4.5 times width
of the footing beyond which it decreases slowly and attains
value of the bearing capacity of isolated footings. The extent of
failure surface decreases with the increase in spacing. Amir [5],
Kumar [6], Kumar and Saran [7], Kumar and Saran [8], Bohra
[9], Khan [10] and other investigators have also studied the
effect of interference between footings. Significant
improvement in bearing capacity computations have been made
through investigations on the effect of various factors including
interference of footings, which is not considered in the
conventional theories of bearing capacity. In practice, footings
may not be isolated due to the proximity of a nearby footing
leading to interference between them. In such cases effect of
interference should be taken into account. However, this fact is
usually not taken into consideration in design of foundations.
In brief it may be said that important changes in bearing
capacity and settlement characteristics occur when a footing is
placed in close proximity of a loaded footing. The centre to
centre spacing is the most significant parameter influencing the
ABSTRACT A model study has been conducted on the effect of interference of footings on bearing capacity and settlement of surface square,
circular and strip footings resting on sand. One footing was loaded to its safe bearing capacity and increments of load were
applied to an adjacent footing till complete failure of sand occurred. The efficiency of interfering footings have been compared
to that of the isolated footings having the same size from the considerations of bearing capacity and settlement characteristics.
The interference between footings was observed to cause an increase in bearing capacity and decrease in settlement with
reduction in spacing.
Keywords: Circular Footing and Strip Footing, Interference of Footings, Model Footings, Square Footing
015-023•interference 6/22/06 11:38 AM Page 15
8/9/2019 A Study on Interference of Surface Model Footings Resting on Sand
http://slidepdf.com/reader/full/a-study-on-interference-of-surface-model-footings-resting-on-sand 2/9
Journal - The Institution of Engineers, Malaysia (Vol. 67, No. 1, March 2006)
IQRAZ NABI KHAN, et al.
16
interference of footings. Other parameters that
affect the performance of adjacent footings are: type
of soil, density of soil, type of footing, roughness of
footing and depth of footing.
In this study one footing was loaded to its safe
bearing capacity and increments of load were
applied to an adjacent footing till complete failure
of sand occurred. The ultimate bearing capacity andsettlement characteristics of this adjacent footing
has been compared to that of the isolated footings
having the same size. Performance of the adjacent
footings has also been referred as performance of
group of footings.
2. DEVELOPMENT OF TESTPROGRAMME2.1 Soil Used
Dry sand was used for the study. Salient
properties of the sand are: 100% passing through 2
mm sieve, coefficient of uniformity cu = 1.5,
coefficient of curvature cc = 0.87, specific gravity G
= 2.66, proctor’s density = 16.57 kN/m3, minimum
density = 14.68 kN/m3, maximum density 17.2kN/m3, optimum moisture content = 11.63%,
density achieved for the study = 16.5 kN/m3, angle
of internal friction (dry) = 36˚, angle of internal
friction (submerged) = 33.5˚, permeability of sand =
0.453 x 10⁻³ mm/s and was classified as poorly
graded sand (SP), according to the classification
system of the Bureau of Indian Standards [11,12].
2.2 FootingsRough model footings of size 4 cm x 4 cm, 5 cm
x 5 cm, 7 cm x 7 cm, 15 cm x 6 cm and circular
footings of diameter 5 cm, 6 cm and 7 cm were
selected for the study. Model footings were moulded
from aluminium alloy. An emery cloth of extra-finegrade J298-EAwas pasted on the base of the footing
to make it rough. Arrangements were made for
normal transmission of the load.
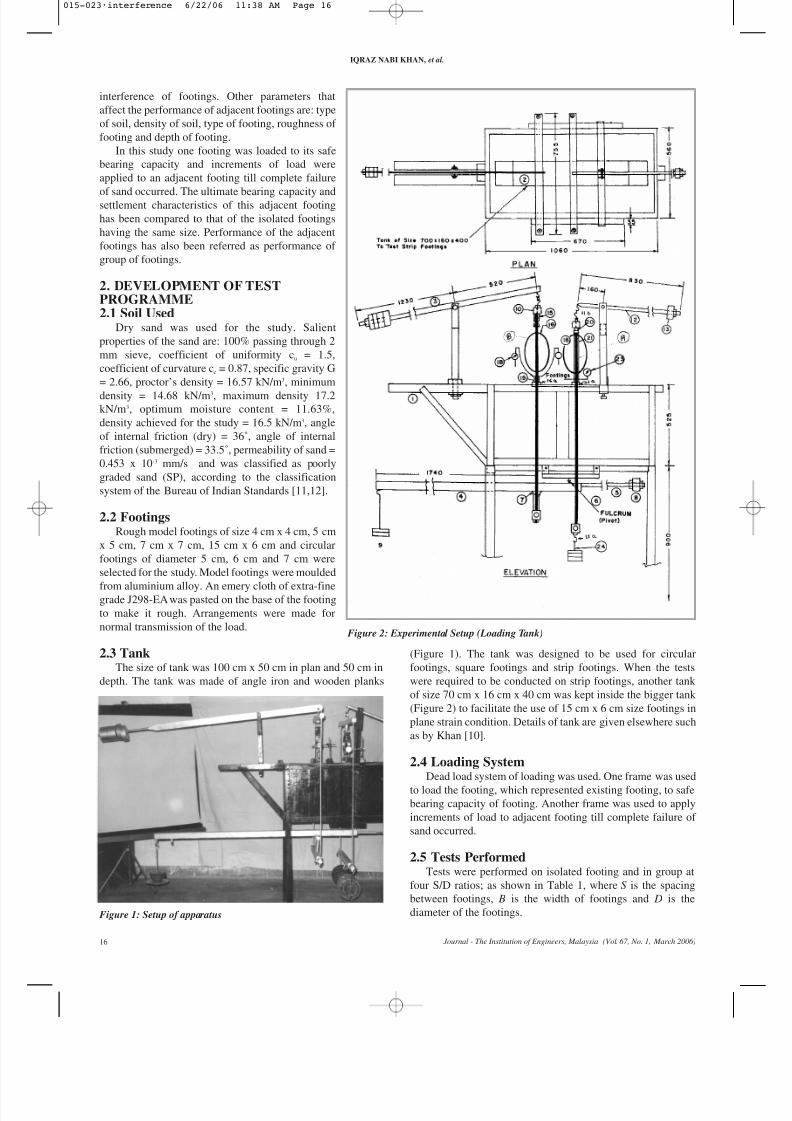
2.3 TankThe size of tank was 100 cm x 50 cm in plan and 50 cm in
depth. The tank was made of angle iron and wooden planks
(Figure 1). The tank was designed to be used for circular
footings, square footings and strip footings. When the tests
were required to be conducted on strip footings, another tank
of size 70 cm x 16 cm x 40 cm was kept inside the bigger tank
(Figure 2) to facilitate the use of 15 cm x 6 cm size footings in
plane strain condition. Details of tank are given elsewhere such
as by Khan [10].
2.4 Loading SystemDead load system of loading was used. One frame was used
to load the footing, which represented existing footing, to safebearing capacity of footing. Another frame was used to apply
increments of load to adjacent footing till complete failure of
sand occurred.
2.5 Tests PerformedTests were performed on isolated footing and in group at
four S/D ratios; as shown in Table 1, where S is the spacing
between footings, B is the width of footings and D is the
diameter of the footings. Figure 1: Setup of apparatus
Figure 2: Experimental Setup (Loading Tank)
015-023•interference 6/22/06 11:38 AM Page 16

8/9/2019 A Study on Interference of Surface Model Footings Resting on Sand
http://slidepdf.com/reader/full/a-study-on-interference-of-surface-model-footings-resting-on-sand 3/9
Journal - The Institution of Engineers, Malaysia (Vol. 67, No. 1, March 2006)
A STUDYON INTERFERENCE OF SURFACE MODELFOOTINGS RESTING ON SAND
17
2.6 Test ProcedureDry sand was compacted in layers of 15 cm thickness with
simultaneous working of two form vibrators fitted on a mild
steel plate for one minute, which gave a density of 16.5 kN/m3.
After compacting and levelling the sand, frames were fixed in
desired position and model footings were placed under the
proving ring suspended from the loading frames. A seating load
of 7 kN/m2 was applied and then released to ensure the contact
between the base of footing and surface of sand, which was in
accordance with the methods of Bureau of Indian Standards
[13]. Load was applied through steel ball and settlement of footing for each load increment was recorded using dial gauges.
Load was applied on the footings in increments till failure of
sand occurred. Each test was repeated for at least three times and
average load intensity-settlement curve was plotted for the tests.
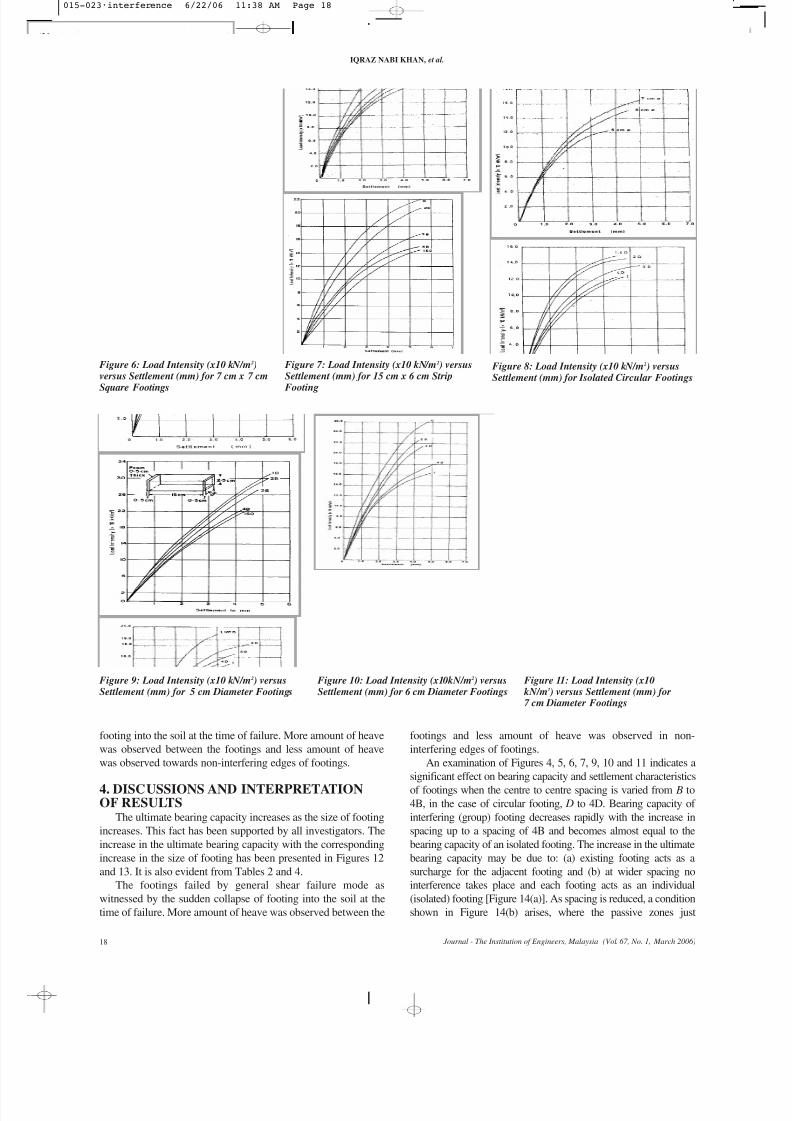
3. TEST RESULTSLoad intensity was plotted against the corresponding
settlement of the footings and an average curve was obtained for
each set. The curves, in general, show a linear variation in the
initial portion and become non-linear thereafter. Figure 3 shows
average load intensity-settlement curve for isolated square
footings. Load intensity-settlement curve for group of square
footings placed at different S/B ratios are given in Figures 4, 5
and 6. Figure 7 shows average load intensity-settlement curvefor isolated strip footing and group of strip footings placed at
different S/B ratios. Figure 8 shows average load intensity-
settlement curve for isolated circular footings. Load intensity-
settlement curve for group of circular footings placed at different
S/D ratios are given in Figures 9, 10 and 11. These plots were
used for interpretation and deriving conclusions. Three ultimate
load criteria i.e. tangent-intersection method, log-log plot
method and collapse load criteria, have been used. All these
criteria require that loading tests should be carried out to large
displacements. The ultimate bearing capacity for square, strip
and circular footings obtained by the above methods have been
presented in Tables 2, 3 and 4 respectively, where S is thespacing between footings, B is the width of footings and D is the
diameter of footings.
The ultimate bearing capacity obtained using tangent
intersection method, which is quite common in use due to
convenience, was adopted for evaluating interference factors.
The failure surfaces formed on sand at the time of collapse of
the footing were extended to about 2 to 3 times the width
(diameter) of isolated footings. The footings failed by general
shear failure mode as witnessed by the sudden collapse of
Table 1: Tests performed on model footings
S. No. Size of Footing S/B or S/D Ratio
1 4 cm x 4 cm 1.75, 2.5, 3, 4
2 5 cm x 5 cm 1.4, 2, 3, 4
3 7 cm x 7 cm 1, 2, 3, 4
4 15 cm x 6 cm 1, 2, 3, 4
5 5 cm diameter 1.4, 2, 3, 46 6 cm diameter 1.16, 2, 3, 4
7 7cm diameter 1, 2, 3, 4
Figure 3: Load Intensity (x 10 kN/m 2 ) v/s Settlement (mm) for Isolated Square Footings
Figure 4: Load Intensity (x10 kN/m 2 ) versus Settlement (mm) for 4 cm x 4 cm Square Footings
Figure 5: Load Intensity (x10 kN/m 2 ) versus Settlement (mm) for 5 cm x 5 cm Square Footings
015-023•interference 6/22/06 11:38 AM Page 17
8/9/2019 A Study on Interference of Surface Model Footings Resting on Sand
http://slidepdf.com/reader/full/a-study-on-interference-of-surface-model-footings-resting-on-sand 4/9
Journal - The Institution of Engineers, Malaysia (Vol. 67, No. 1, March 2006)
IQRAZ NABI KHAN, et al.
18
footing into the soil at the time of failure. More amount of heave
was observed between the footings and less amount of heave
was observed towards non-interfering edges of footings.
4. DISCUSSIONS AND INTERPRETATIONOF RESULTS
The ultimate bearing capacity increases as the size of footing
increases. This fact has been supported by all investigators. The
increase in the ultimate bearing capacity with the corresponding
increase in the size of footing has been presented in Figures 12
and 13. It is also evident from Tables 2 and 4.
The footings failed by general shear failure mode as
witnessed by the sudden collapse of footing into the soil at the
time of failure. More amount of heave was observed between the
footings and less amount of heave was observed in non-
interfering edges of footings.
An examination of Figures 4, 5, 6, 7, 9, 10 and 11 indicates a
significant effect on bearing capacity and settlement characteristics
of footings when the centre to centre spacing is varied from B to4B, in the case of circular footing, D to 4D. Bearing capacity of
interfering (group) footing decreases rapidly with the increase in
spacing up to a spacing of 4B and becomes almost equal to the
bearing capacity of an isolated footing. The increase in the ultimate
bearing capacity may be due to: (a) existing footing acts as a
surcharge for the adjacent footing and (b) at wider spacing no
interference takes place and each footing acts as an individual
(isolated) footing [Figure 14(a)]. As spacing is reduced, a condition
shown in Figure 14(b) arises, where the passive zones just
Figure 6: Load Intensity (x10 kN/m 2 )versus Settlement (mm) for 7 cm x 7 cmSquare Footings
Figure 8: Load Intensity (x10 kN/m 2 ) versusSettlement (mm) for Isolated Circular Footings
Figure 7: Load Intensity (x10 kN/m 2 ) versusSettlement (mm) for 15 cm x 6 cm Strip
Footing
Figure 9: Load Intensity (x10 kN/m 2 ) versusSettlement (mm) for 5 cm Diameter Footings
Figure 10: Load Intensity (x10kN/m 2 ) versusSettlement (mm) for 6 cm Diameter Footings
Figure 11: Load Intensity (x10 kN/m 2 ) versus Settlement (mm) for7 cm Diameter Footings
015-023•interference 6/22/06 11:38 AM Page 18

8/9/2019 A Study on Interference of Surface Model Footings Resting on Sand
http://slidepdf.com/reader/full/a-study-on-interference-of-surface-model-footings-resting-on-sand 5/9
Journal - The Institution of Engineers, Malaysia (Vol. 67, No. 1, March 2006)
A STUDYON INTERFERENCE OF SURFACE MODELFOOTINGS RESTING ON SAND
19
penetrate, however
there is no apparent
change in bearing
capacity value. If
spacing is further
reduced, passive zones
between the footings
start curtailing oneanother which results
in changes in stress
value and increase in
ultimate bearing
capacity of the group of
footings [Figure 14(c)].
Figures 15(a) to
15(c) show Interference
Efficiency Factor
‘Fγ ’(qultg /qulti) versus
S/B (or S/D) ratio for square, strip and circular model footings
respectively. Figures 16(a) to 16(c) show the average curve
between Interference Efficiency Factor ‘Fγ ’(qultg /qulti) and S/B
(or S/D) ratio for square, strip and circular model footings
respectively. Where qultg is the ultimate bearing capacity of a
footing placed in close proximity of an already loaded footing
to its safe bearing capacity and qulti is the ultimate bearing
capacity of an isolated footing, S is the centre to centre spacingbetween the footings of width B or diameter D. The ratio
qultg /qulti may be called as Interference Efficiency Factor ‘Fg’ for
bearing capacity. In order to predict the increased bearing
capacity of a square, strip and circular footings placed in a
group, the Interference Efficiency Factor ‘Fγ ’ can be introduced
in the Terzaghi’s bearing capacity equation (surface footings)
as below:
qult = 0.5 γ B Nγ Fγ (strip footing)
qult = 0.4 γ B Nγ Fγ (square footing)
qult = 0.3 γ B Nγ Fγ (circular footing) Figure 12: Load Intensity (x10 kN/m 2 )versus Width of Square Footings (cm)
Table 2: Failure load tables for square footings table 2a: collapse load criterion
4 cm x 4 cm 5 cm x 5 cm 7 cm x 7 cm
S/B Ratio Collapse Load (kN/m2) S/B Ratio Collapse Load (kN/m2) S/B Ratio Collapse Load (kN/m2)
1.75 157 1.4 186 1.0 220
2.0 135 2.0 180 2.0 200
2.5 123 3.0 165 3.0 167
4 116 4.0 145 4.0 150
Isolated 110 Isolated 135 Isolated 146
Table 2b: Log-log criterion
4 cm x 4 cm 5 cm x 5 cm 7 cm x 7 cm
S/B Ratio Ultimate Load (kN/m2) S/B Ratio Ultimate Load (kN/m2) S/B Ratio Ultimate Load (kN/m2)
1.75 130 1.4 151 1.0 190
2.0 107 2.0 140 2.0 155
2.5 98 3.0 130 3.0 150
4 92 4.0 109 4.0 133
Isolated 90 Isolated 107 Isolated 126
Table 2c: Tangent intersection criterion
4 cm x 4 cm 5 cm x 5 cm 7 cm x 7 cm
S/B Ratio Ultimate Load (kN/m2) S/B Ratio Ultimate Load (kN/m2) S/B Ratio Ultimate Load (kN/m2)
1.75 128 1.4 155 1.0 180
2.0 93 2.0 134 2.0 153
2.5 91 3.0 124 3.0 126
4 85 4.0 108 4.0 122
Isolated 82 Isolated 107 Isolated 116
Table 3: Failure load table for 15cm x 6 footings
S/B Ratio Failure Load (kN/m2)
Collapse Load Criterion Log-log Criterion Tangent Intersection Criterion
1.0 310 215 208
2.0 296 210 196
3.0 272 180 168
4.0 223 150 150
Isolated 220 145 147
015-023•interference 6/22/06 11:38 AM Page 19

8/9/2019 A Study on Interference of Surface Model Footings Resting on Sand
http://slidepdf.com/reader/full/a-study-on-interference-of-surface-model-footings-resting-on-sand 6/9
Journal - The Institution of Engineers, Malaysia (Vol. 67, No. 1, March 2006)
IQRAZ NABI KHAN, et al.
20
Where,
qult = Ultimate bearing capacity of adjacent footing (kN/m2),γ = Density of soil (kN/m3),
B = Diameter (width) of footing (m),
Nγ = Terzaghi’s bearing capacity factor and
Fγ = Interference Efficiency Factor.
Figures 17(a), 17(b) and 17(c) show the plots between non-
dimensional settlement ρg / ρi and S/B ratio at 30 kN/m2 load
intensity for square, strip and circular model footings, whereρg / ρi is
the ratio of the settlement of the adjacent footing at a given load
intensity to an identical isolated footing at the same intensity of
pressure; it may be referred as interference efficiency factor forsettlement Fρ. Figures 18(a), 18(b), and 18(c) show an average curve
between non-dimensional settlement ρg’/ ρi ’ (Fr) and S/B ratio at 30
kN/m2 load intensity for square, strip and circular footings.
The settlement behaviour of footing resting on sand shows that
the closely spaced footings stiffen the soil response and reduces the
settlement at a given load intensity.
The relationship between ρg’/ ρi ’ and S/B ratio for 1.0 mm, 2.0
mm and 3.0 mm settlement for average value of square footings
have been presented in Figure 19, where qg’ is pressure intensity of
Table 4: Failure load table for circular footingsTable 4a: Collapse load criterion
5 cm diameter 6 cm diameter 7 cm diameter
S/D Ratio Collapse Load (kN/m2) S/D Ratio Collapse Load (kN/m2) S/D Ratio Collapse Load (kN/m2)
1.4 148.0 1.16 198.0 1.0 245.0
2.0 142.0 2.0 169.0 2.0 220.0
3.0 131.0 3.0 155.5 3.0 205.0
4.0 123.0 4.0 149.0 4.0 165.0
Isolated 121.0 Isolated 142.0 Isolated 155.0
Table 4b: Log-log criterion
5 cm diameter 6 cm diameter 7 cm diameter
S/D Ratio Collapse Load (kN/m2) S/D Ratio Collapse Load (kN/m2) S/D Ratio Collapse Load (kN/m2)
1.4 140.0 1.16 190.0 1.0 230.0
2.0 136.0 2.0 170.0 2.0 192.0
3.0 122.0 3.0 147.5 3.0 180.0
4.0 96.0 4.0 135.0 4.0 147.0
Isolated 105.0 Isolated 121.0 Isolated 150.0
Table 4c: Tangent intersection criterion
5 cm diameter 6 cm diameter 7 cm diameterS/D Ratio Collapse Load (kN/m2) S/D Ratio Collapse Load (kN/m2) S/D Ratio Collapse Load (kN/m2)
1.4 124.0 1.16 149.0 1.0 164.5
2.0 116.0 2.0 127.0 2.0 139.0
3.0 100.0 3.0 118.0 3.0 130.0
4.0 97.0 4.0 109.0 4.0 118.0
Isolated 89.0 Isolated 106.0 Isolated 115.0
Figure 13: Load intensity (x10 kN/m 2 ) versus diameter (cm) of footings
Figure 14: The development of the failure surfaces as two rough based foundations approach each other on the surface of a cohesionless soil
Figure 15(a): Interference efficiency factor ‘Fγ ’ versus S/B ratio(square footings)
015-023•interference 6/22/06 11:39 AM Page 20

8/9/2019 A Study on Interference of Surface Model Footings Resting on Sand
http://slidepdf.com/reader/full/a-study-on-interference-of-surface-model-footings-resting-on-sand 7/9
Journal - The Institution of Engineers, Malaysia (Vol. 67, No. 1, March 2006)
A STUDYON INTERFERENCE OF SURFACE MODELFOOTINGS RESTING ON SAND
21
Figure 15(b): Interference efficiency factor ‘Fγ ’ versus S/B ratio(strip footings)
Figure 15(c): interference efficiency factor ‘Fγ ’ versus S/D ratio(circular footings)
Figure 16(a): Average interference efficiency factor ‘Fγ ’ versusS/B ratio (square footings)
Figure 16(b): Average interference efficiency factor ‘Fγ ’ versusS/B ratio (strip footings)
Figure 16(c): Average interference efficiency factor ‘Fγ ’ versusS/D ratio (circular footings)
Figure 17(a): Fρ ( ρ g / ρi) versus S/B ratio at 30 kN/m 2 intensity for square footings
Figure 17(b): Fρ ( ρ g / ρi) versus S/B ratio at 30 kN/m 2 intensity for strip footings
Figure 17(c): Fρ ( ρ g / ρi) versus S/B ratio at 30 kN/m 2 intensity for circular footings
015-023•interference 6/22/06 11:39 AM Page 21

8/9/2019 A Study on Interference of Surface Model Footings Resting on Sand
http://slidepdf.com/reader/full/a-study-on-interference-of-surface-model-footings-resting-on-sand 8/9
Journal - The Institution of Engineers, Malaysia (Vol. 67, No. 1, March 2006)
IQRAZ NABI KHAN, et al.
22
group of footings at constant settlement and qi’ is the pressure
intensity of isolated footing at same settlement. For constant value
of settlement, the pressure intensity ratio qg’/qi’ decreases as S/B
ratio increases. Similar trend was observed for strip and circular
model footings.
Figure 20 shows
settlement versus S/B
ratio at equal load
intensity for strip
footings. It is clear
from the figures that
for equal loading
intensity, settlement of footing decreases with
decrease in spacing
and for equal
settlement, the loading
intensity was found to
increase with a
decrease in spacing of
the footings. Similar
trend was observed for
square and circular
model footings.
5. CONCLUSION
1.Bearing capacity of model footings increases as the size of footing increases.
2.Bearing capacity of interfering footing is more than that of
isolated footing of the same size.
3.Bearing capacity of interfering footing increases as spacing
between them decreases.
4.For equal settlement, the loading intensity was found to
increase with decrease in spacing of the footings.
5.Settlement for a given load intensity decreases as the spacing
between the footings decreases.
6.In order to predict the increased bearing capacity of a square,
strip and circular footings placed in a group, the Interference
Efficiency Factor ‘Fg’ can be introduced in the Terzaghi’s
bearing capacity equation as under:
qult = 0.5 γ B Nγ Fγ (strip footing)
qult = 0.4 γ B Nγ Fγ (square footing)
qult = 0.3 γ B Nγ Fγ (circular footing)
Where, qult = Ultimate bearing capacity of adjacent footing
(kN/m3),
γ = Density of soil (kN/m3),
B = Diameter (width) of footing (m),
Nγ = Terzaghi’s bearing capacity factor and
Fγ = Interference Efficiency Factor.
REFERENCES
[1] J. G. Stuart, “Interference Between Foundations With
Special Reference to Surface Footings on Sand”,
Geotechnique, Vol. 12, No. 1, pp. 15-23, 1962.
[2] J. Mandel, “Interference Plastique de Foundations
Superficielles”, Proceedings of International Conference
on Soil Mechanics and Foundation Engineering,
Budapest, September 1963.
Figure 18(a): Average Fρ ( ρ g / ρi) versus S/B ratio at 30 kNm 2
intensity for square footings
Figure 18(c): Average Fρ ( ρ g / ρi) versus S/B ratio at 30 kNm 2
intensity for circular footings
Figure 19: qg/qi versus S/B Ratio for Average Value of Square Footings
Figure 18(b): Average Fρ ( ρ g / ρi) versus S/B ratio at 30 kNm 2
intensity for strip footings
Figure 20: Settlement versus S/B Ratio at Equal Load Intensity for Strip Footings
015-023•interference 6/22/06 11:39 AM Page 22
8/9/2019 A Study on Interference of Surface Model Footings Resting on Sand
http://slidepdf.com/reader/full/a-study-on-interference-of-surface-model-footings-resting-on-sand 9/9
Journal - The Institution of Engineers, Malaysia (Vol. 67, No. 1, March 2006)
A STUDYON INTERFERENCE OF SURFACE MODELFOOTINGS RESTING ON SAND
23
[3] J.M. Amir, “Interaction of Adjacent Footings”,
Proceedings of Third Asian Regional Conference on
Soil Mechanics and Foundation Engineering, 1967.
[4] S. Saran and V. C. Aggarawal, “Interference of Surface
Footings in Sands”, Indian Geotechnical Journal, 1974.
[5] A.A.A. Amir, “Interference Effect on the Behaviour of Footings”. Ph.D. Thesis, University of Roorkee,
Roorkee, India, 1992.
[6] A. Kumar, “Interaction of Footings Resting on
Reinforced Earth Slab”. Ph.D. Thesis University of
Roorkee, Roorkee, India, 1997.
[7] A. Kumar and S. Saran, “Closely Spaced Rectangular
Footings on Sand”. Journal of The Institution of
Engineers (India), Volume 84, pp 27-32, May 2003.
[8] A. Kumar and S. Saran, “Closely Spaced Footings on
Geo-grid-Reinforced Sand”. Journal of Geotechnical
and Geoenvironmental Engineering, ASCE, pp 660-664,
July 2003.
[9] K.C. Bohra, “Interference Between Circular Footings
Placed on Sand”, M.E. Dissertation, University of
Jodhpur, Jodhpur, Rajasthan, India, 1986.
[10] I. N. Khan, “Group Behaviour of Footings on Dune
Sand”, M.E. Dissertation, Department of Civil
Engineering, Faculty of Engineering, University of
Jodhpur, Jodhpur, Rajasthan, India 1986.
[11] IS:1498-1970, Indian Standard on Soil Classification
for General Engineering Purposes, Bureau of Indian
Standards, Delhi.
[12] IS:2720 (Part XIV-1968), Indian Standard Method of
Test for Soils, Bureau of Indian Standards, Delhi.
[13] IS:1888-1971, Indian Standard Method of Load Test on
Soils, Bureau of Indian Standards, Delhi.
015-023•interference 6/22/06 11:39 AM Page 23