Embed Size (px)
Citation preview

http://repository.osakafu-u.ac.jp/dspace/
TitleA Study on Innovative Optical Fibers for Large Capacity Transmission S
ystems
Author(s) 佐藤, 公紀
Editor(s)
Citation
Issue Date 2015-01
URL http://hdl.handle.net/10466/14533
Rights
A Study on Innovative Optical Fibers for Large
Capacity Transmission Systems
Kiminori Sato
January 2015
Doctorial Thesis at Osaka Prefecture University

A Study on Innovative Optical Fibers for Large
Capacity Transmission Systems
This research was made in Nippon Telegraph and Telephone Corporation and Fujikura Ltd., and submitted for the doctorial thesis of Osaka Prefecture University
Kiminori Sato
January 2015


Contents
1. Introduction 1
1.1 Background 1 1.2 Deployment History of Optical Fibers for 4
Telecommunication Network 1.2.1 Long-haul Network 4 1.2.2 Access Network 8
1.3 Technical Issues of Transmission Media for 11 the Future Networks 1.4 Structure of Doctoral Thesis 14
2. Ultra-low Loss and Long Length Photonic Crystal 17
Fiber
2.1 Introduction 17 2.2 Fiber Parameters and Fabrication 19 2.3 Optical Properties of Low-loss PCF 21 2.4 Trial of the PCF Water Peak Reduction 26 2.5 DWDM Transmission Experiment 28 2.6 Conclusion 30
3. Hole-assisted Type Photonic Crystal Fiber with 31
Good Bending Loss Performance
3.1 Introduction 31 3.2 Consideration of PCF Applied to Optical Wiring 33
3.2.1 Requirements for Indoor Optical Wiring 33 3.2.2 Structure of PCF for Indoor Optical Wiring 35 3.3 Optical Properties of HAPCF 37 3.3.1 Calculation Model 37 3.3.2 Near Field Pattern 38 3.3.3 Bending Loss Performance 39 3.4 Long-term Reliability 41 3.5 Connection Loss 44 3.6 Conclusion 46
4. Graded Index Two-mode Optical Fiber with Low 49
DMD, Large Aeff and Low Bending Loss
4.1 Introduction 49 4.2 Fiber Design 52 4.3 Characteristics of Fabricated Fiber 57 4.3.1 Refractive Index Profile 57 4.3.2 Optical Properties of Fabricated GI-TMF 58
4.3.2.1 Measurement Result of Cutoff 59 Wavelength
4.3.2.2 Measurement Result of Bending 60 Loss for LP11 Mode
4.3.2.3 Experimental Setup and Results 62 of DMD 4.4 Offset-launch Characteristics for TMF 65
4.4.1 Simulation for Offset -launch Characteristics 66 using FE-BPM
4.4.2 Fiber Sample and Experimental Setup 68 4.4.3 Results and Discussion 71 4.5 Conclusion 74
5. Summaries and Conclusions 75
Bibliography 79
Acknowledgements 87
List of Figures 89
List of Tables 91
List of Acronyms 93
Chapter 1
Introduction
1.1 Background
With the advantages of low attenuation, broad bandwidth, l ight
weight, and very small size , optical fiber had been considered to be
deployed in telecommunication network since Corning Glass Works
demonstrated a 20dB/km opt ical fiber in 1970 [1] following
Nishizawa’s idea regarding optica l waveguide and Kao’s prediction [2] .
In late 1970's , Nippon Telegraph Telephone Public Corporation (NTT)
considered to deploy optical fiber cables to t runk network, which was
expanded rapidly to accommodate growing telephone traffic , because
repeater spacing of optical fiber transmission system will be much
longer than that of coaxial and metallic cables.
At the initial stage of deployment of optical fiber transmission
system, the cost of an optica l f iber was very expensive and
manufacturing and splicing technologies were immature . Therefore, a
multimode opt ical fiber , which has a larger core diameter and easy to
splice, was selected even though it has bandwidth l imitation due to

2 Chapter 1
modal dispersion compared with a single -mode optical fiber. In 1981,
first commercial int roduction of graded -index (GI) multimode opt ical
fiber cables started. Then, progress of manufacturing and splic ing
technologies made it possible to int roduce single -mode optical fibers
(SMFs) to the long-haul network . SMFs were considered as the main
transmission media for backbone network instead of coaxial and
metallic wire.
On the other hand, deployment of opt ical fiber cables to access
network was not easy because cost of optical fiber t ransmission sys tem
was very expensive compared with that of metallic one . Fi rst
introduction of optical transmission system to access network was the
dedicated line for video t ransmission. In 1980's , NTT seriously
considered about fiber to the home (FTTH) for the next stage of access
network infrastructure towards multimedia era. NTT started informat ion
network system (INS) Model System Trial including real FTTH at
Mitaka area , suburbs of Tokyo in 1984. NTT announced VI&P (Visual,
Intelligent and Personal) concept in 1990 and energet ic research and
development for FTTH was started in NTT laboratories . The cost of
FTTH was dropped sharply and became the same level as metall ic cable
systems in 2000. First commercia l FTTH service started in 2 001 a t the
maximum speed of 10Mb/s with single -mode optical fiber cables .
In early 2000's single -mode f ibers were int roduced al l over the
telecommunicat ion networks from backbone to access networks.
Maximum transmission speed was expected to be more than 4 0Gb/s, and
with a wavelength division multiplexing (WDM) technology, total
capacity of one fiber was expected to exceed 10Tb/s. Many people
believed there will be no need for another transmission media .
However, the progress of video and computer technology, and
diffusion of high-speed internet will cause dramat ically increase of
telecommunicat ion traffic and the volume of traffic will reach a

Introduction 3
practica l l imit of single -mode optical fiber wi thin two decade s [3]. If
new t ransmission media are necessary from our experience, i t may take
more than 10 years f rom the star t of research to massive deployment.
Therefore , the research for innovative optica l fibers have started for the
ultra large capacity transmission systems , which will overcome the
capacity l imit of conventional single -mode fibers.
In this chapter , conventional optica l fibers deployed in
telecommunicat ion network and their l imitations of transmission
capacity are discussed through the deployment history of optical fibers
in Japan. Then, a st ructure of this thesis and the study items which are
described in chapters 2 -4 that aim at breaking the fundamental capacity
l imit of conventional single-mode optical fibers are briefly summarized.

4 Chapter 1
1.2 Deployment History of Optical Fibers
for Telecommunication Networks
1.2.1 Long-haul Network NTT has been developing optical fiber transmission systems for
the implementation of the comprehensive telecommunicat ions network
since early 1970's . At tha t t ime, manufactur ing technology of opt ical
fiber was poor and it was difficult to fabricate single-mode optical
fibers which have a smaller core diameter than mul timode optical fiber s.
It was also difficult to connect single-mode optical fibers with a low
splice loss. Therefore, in the first generation multimode optical f iber s
were focused on.
In 1981, a 32 Mb/s t ransmission system (F -32M system: 480
telephone circuits) using a graded-index (GI) multimode optical f iber
cable was introduced into the medium capacity intra -city transmission
lines. This system was the first optical fiber cable system implemented
by NTT. In this system, the opera ting wavelength was 0.85 µm and the
maximum repeater spacing was 10km . Since then, GI optical fiber
cables have also been used for F-100M and F-6M systems (which
correspond to 1 ,440 and 96 telephone ci rcuits, respectively) and the
opera ting wavelength was shi fted to 1.3 µm, where the attenuation of
optical f iber i s smaller than that of 0.85 µm and maximum repeater
spacing reached to 15km.
Transmission characteristics of the multimode optical fiber were
greatly influenced by a mode coupling between each propagation modes.
Discontinuities of mult imode optical fibers such as connecting and
bending points, core deformation along the longitudinal di rection will
Introduction 5
cause the mode coupling. The mode coupling is also influenced by
excitation conditions of l ight source. In the commercial test of GI
multimode opt ical fiber cable s, the mode coupling coeffi cient in the
deployed optical fiber cables were measured. Such results were
reflected to the economical bandwidth speci fications of GI optical fiber
cables.
As the coherence of l ight source and multimode optical fiber
cables improved, the mode coupling in multimode optical fiber cables
caused more fluctuation of output power in the transmission system.
This phenomenon is called modal noise and multimode optical fiber s for
higher bit rate and longer length transmission system in
telecommunicat ion network s was faced diff iculties at that t ime.
Therefore , a single-mode optical fiber cable wi th superior
transmission characteristics such as low optical loss and broad
bandwidth and free from modal noise has been int roduced with the
progress of manufacturing and splicing technologies of optical fiber s.
Commercial introduction of SMFs was started in 1983 as the Japan
transverse optical fiber cable t ransmission r oute , connect ing from
Asahikawa to Kagoshima and accomplished in 1985. This cable has
been applied to long-haul large-capacity t ransmission lines all over
Japan a long with an F-400M (5 ,760 telephone circuits) transmission
system and maximum repeater spacing of 40km [4]. Then, the sys tem
was upgraded to F-1.6G (23,040 telephone ci rcui ts) and that capacity
was enough to carry telephone traff ic and replace existing coaxial
transmission system with maximum capacity of 10,800 telephone
circuits (C-60M transmission system). However, NTT were annoyed by
the short t ime transmission system down under cable transfer work.
Because technicians unconsciously bend the fiber with a small bending
radius at the splicing points and this causes a huge macro bending loss
that i s over the loss budget of the transmission system.
Then late 1980's , transmission systems at the 1.55 m

6 Chapter 1
wavelength where attenuat ion of optical fiber i s lowest in sil ica based
optical fiber were noted because many optical fiber submarine cable
systems were scheduled to deploy all over the world and longer repeater
spacing was required. However , conventional single-mode fibers were
inappropria te for the 1.55 m wavelength optical transmission systems
at that t ime because the chromat ic dispersion and the macro bending
loss are large at the 1.55 µm wavelength region.
As mentioned above it moved to the research and development of
1.55 µm wavelength optical transmission system that can expand the
transmission distance by applying the SM fiber to 1.55 µm wavelength
region where the optical loss i s minimum.
Dispersion-shift fibers (DSFs) , which have l ow chromatic
dispersions and low losses in the 1.55 µm wavelength region, were
developed at the same time for the same purpose. In 1984, the
segmented core DSF [5] whose index profile has a ring outside a core
was proposed by Corning. Segmented core D SF has the larger MFD and
the lower bending loss by util izing the mode coupling between a core
and a ring.
In 1986, NTT proposed a new DSF with a dual shape core (DSC:
Dual Shape Core) [6] which is in no way inferior to the segmented core
DSF. DSC-DSF has the large MFD, low macro -bending loss and the
good dispersion controllabi li ty.
Figure 1-1 shows the typical index profile , optical loss and
chromatic dispersion characteristics of the developed dispersion shi fted
optical fiber . These opt ical f iber cables were introduced in to the almost
all backbone network of NTT with Synchronous Digita l Hierarchy
(SDH) optical transmission sys tem up to 2.5 Gb/s and realized
maximum repeater spacing of 80 km and 120 km at terrest rial and
submarine section , respectively [7].

Introduction 7
In 1990's , due to an invention of optical fiber ampli fiers [8], the
research and development of wavelength division mult iplex ing (WDM)
technologies as well as dispersion compensating fibers (DCF) have be en
advanced. Capacity of optica l fiber transmission system has
dramatically increased with util izing th ose WDM technologies. At
present , the maximum transmission speed of single channel wavelength
reached 40 Gb/s and 10 Gb/s x 80 wavelengths t ransmission system
with conventional dispersion shif ted fiber s has al ready int roduced in
the backbone network for a practical use .
0
20
10
-20
-10
1.1 1.2 1.3 1.4 1.5 1.60.1
10
1
14m
0.9 %
Index profileC
hrom
atic
dis
pers
ion
(ps/
km/n
m)
Fibe
r los
s (dB
/km
)
Wavelength (m)
Figure 1-1 Typical index profile , optical loss and chromat ic dispersion
characteristics of the dispersion-shifted optical fiber

8 Chapter 1
1.2.2 Access Network The configuration of an access network is shown in Fig. 1 -2. The
access network consists of four facili t ies, namely central of fice
facili t ies, feeder section fac ili t ies, distribution section facili t ies and
user section fac ili t ies from a central office to resident ial premises. I t i s
the most important that economical and efficient feeder and distribut ion
section facil i t ies for fiber -to-the-home (FTTH) will be const ructed. To
achieve this, less expensive and easily instal led optica l fiber cable
technologies for the feeder and distribut ion sections must be developed.
Terminat ion cable s terminate f ibers at a fiber termination module
(FTM) [9] or an integra ted distribution module (IDM) [10] placed in a
central office , and feeder cables are insta lled in a cable tunnel or a duct
located between the FTM or IDM in a central office and the dist ribut ion
point ( feeder point ) in the feeder section. Distribution cable s, which are
mainly insta lled be tween telecommunication poles, are connected to the
feeder and distributed cables between feeder points and access points
close to residentia l premises. Therefore , aerial sel f -supporting type
optical fiber cable s that can be easily installed are needed.
Figure 1-2 Access network configuration

Introduction 9
In 1982, subscriber optical fiber cable was first l y introduced to
small -scale leased l ines for video transmission services. NTT used
subscriber optical fiber cables , which contain maximum 100 GI opt ical
fibers, for 4 MHz video and digita l tran smission services up to 6.3 Mb /s,
since the transmission characteristics required for these services were
obtained at lower costs than those of single-mode optical fiber cables,
and easier fiber splicing can reduce the construction costs . In the
applicat ion to broadband leased l ines, the cable technology resembled
that for trunk networks.
However, a new comprehensive telecommunications network
serving widespread subscribers ( fi rst implemented as INS Model Sys tem
in 1984) has led to the development of cable technology suitable for the
subscriber area . As a result , NTT has developed a high density
subscriber opt ical fiber cable wi th a five -f iber ribbon structure and
slot ted rod, as well as related techniques such as mass-fusion splice and
multi -fiber optical connectors . Maximum fiber count was 200 and
increased to 600 in 1987 [11]. At this stage , for broadband services and
digital transmission services with a transmission speed of higher than
384 kb/s, optical fiber t ransmission systems were used since they are
cost -effective and free from cross - talk problems.
As the deployment of single -mode optical fiber cables in the
trunk network increased all over the world, the cost of single-mode
optical fiber dropped sharply. At the same time, spl ice loss of
multi -fiber fusion splice and connectors for single -mode optical fiber s
decreased because the core concentricit y error and cladding diameter
difference became smal l by the improvement of manufactur ing
technologies. In 1988, NTT int roduced single -mode optical fiber to an
access network and unify a ribbon structure with 4 fibers for the t runk
network.
In 1990, NTT announced VI&P (Visual , Intell igent & Personal)
Concept and clearly mentioned to deploy FTTH all over Japan until

10 Chapter 1
2015. To realize this target, cost reduction of FTTH deployment was the
most crit ica l i ssue for NTT because it was more than seven times higher
than the metallic ones . Therefore, NTT laborator ies have started
energetic research and development of FTTH technologies to reduce
cost of FTTH to the same level of metallic cable systems in 2000. As
the research and development made progress , the deployment cost of
FTTH decreased drast ically and the target was achieved . First
commercial FTTH service started in 2001 at the maximum speed of
10Mb/s uti l izing single -mode opt ical fiber cables. Since then, number
of FTTH subscriber has grown rapidly in Japan and now it has reached
more than 20 millions. Transmission speed was also enlarged to
maximum 100Mb/s and 1 Gb/s.
After start ing massive deployment of FTTH, NTT were annoyed
by handling problem of optical f ibers that also happened in long haul
network. Especially in house wiring, there are a lot of bending points
and customers didn 't understand the di fference between optical fiber
and metall ic cords. Technicians and customer s often bent optical f iber
in a small radius that cause big attenuat ion increase and in the worst
case fiber breaks.
Therefore , a new optical f iber that has a smaller minimum
bending radius with a smaller loss increase and sufficient reliabili ty at
a smaller minimum bending radius have to be developed. The photonic
crystal f iber (PCF) including a hole assisted type PCF (HAPCF) is
focused on because of very low bending loss compared to conventional
optical f ibers [12]. The HAPCF that has a negligible loss increase at a
minimum bending radius of 10 mm and a long -term reliabili t y has been
developed. Moreover , this fiber can use conventional connection
technology and reasonable attenuation can be obtained when connect ing
with conventional fibers.

Introduction 11
1.3 Technical Issues of Transmission Media
for the Future Networks
Many kinds of optical fibers ha ve been developed and deployed
in telecommunication network to sa tisfy system requirements for
transmission capacity, wavelength region, bending characteristics and
reliabil i ty. The traffic of backbone network has been increasing rapidly
corresponding to the growth of broadb and users in Japan. The capacity
of a fiber in backbone network was 1.6 Gb/s in 1987 and has increased
to 1.6 Tb/s in 2007.
On the other hand, as the information capaci ty increases by
about 40 % per year in Japan, a fiber which ca n carry the capacity of
Pb/s wi ll be needed in 2027.
However, recent study showed the conventional single-mode
fiber , most popularly used in telecommunicat ion network, was
approaching the capacity l imit imposed by the combination of
Shannon-Hartley theorem and nonlinear fiber effect [13] . Therefore , an
innovative optica l f iber to overcome the capacity l imit of conventional
single -mode f iber should be developed for future ultra large capacity
transmission system s that can accommodate the t raffic growth in
telecommunicat ion network .
According to Shannon-Hartley theorem, maximum channel
capacity i s propor tional to signal to noise ratio (SNR) and bandwidth of
the channel . There are two ways to increase SNR by transmission media .
One is to reduce the loss and the other i s to enlarge maximum input
power of transmission media . For an optical fiber, the former means the
low transmission loss and the latter means the large effective area for
reducing nonlinear effect and fiber fuse . Low t ransmission loss will
realize a transmission system with a long transmission distance.
Enlarged bandwidth in optica l transmission system means to extend the

12 Chapter 1
operating wavelength range. To fulfil l these in optical fiber , not only
low loss in the wide wavelength range but also dispersion
characteristics should be control led to reduce deterioration of signal
due to delay and nonlinear effect . In addition to these characteristics, i t
is learned in deployment history that low bending loss characteristics
are indispensable for a practical deployment .
Figure 1-3 summarizes the technical i ssues for innovative
optical fibers. The relationship between requirement s f rom t ransmission
system and required transmission characteristics of optical fibers will
be clarified.
Figure 1-3 Technical issues for optical fibers
In a convent ional single-mode fiber that has a simple refract ive
index profile between core and c ladding, the relationship between the
large effective area and the cutoff wavelength or bending loss shows a
tradeoff . Therefore , to enlarge the effect ive area while keeping
single -mode transmission and low bending loss characteristics, the new
refrac tive index profile for confin ing the l ight in the core of the opt ical

Introduction 13
fiber i s necessary. Realization of low transmission loss and flexible
chromatic dispersion character ist ics are anoth er challenging issue s for
the new type single-mode optica l f iber.
To get large effective area with a conventional method to
confining the l ight in the core of the optical f iber, multimode operat ion
at least in the opera ting wavelength should be considered. In such a
case, modal dispersion is normally much larger than chromatic
dispersion. Therefore, minimizing modal dispersion of the multimode
opera tion in the new optical fiber is indispensable.

14 Chapter 1
1.4 Structure of Doctoral Thesis
As described in the previous section, required t ransmission
characteristics of innovative optical fibers that overcome the capacity
l imit of the conventional single-mode fibers are low t ransmission loss ,
flexible chromatic dispersion , large effective area and low bending loss .
In those transmission characteristics, PCFs are very att ractive
transmission media since PCFs can provide unique dispersions and the
wavelength dependence of mode field diameter (MFD) that are not
obtainable in conventional single-mode fibers. The int rinsic loss i s
estimated to be less than that of the conventional single -mode fiber and
bending loss characteristics are superior to those of a conventional
single -mode fiber .
During the research and development of novel PCFs, an
immediate application is found for the indoor wiring of FTTH. Because
of ultra -low bending loss characterist ics, PCF is suitable to the opt ical
fiber wir ing used in the c ircumstance wi th many bend and possibly
handled like a metall ic wire with a small bending radius by technic ians
and customers.
Another alternative is to use mult imode optical fiber because it
has much large effective area compared with single -mode optical fibers
and mode division multiplexing (MDM) wil l add another dimension to
enlarge capacity of transmission system. In the deployment history,
multimode optical fiber was given up because of large modal dispersion
and modal noise problem. However, development of digita l signal
processing (DSP) technology make s it possible to uti l ize a fe w number
of multi -input multi -output (MIMO) processing in t ransmissi on systems
using the multimode fibers (MMFs) or few mode fibers (FMFs).
Therefore , a few-mode optical fiber that has a low differential modal
group delay (DMD), a large effec tive area and a low bending loss are

Introduction 15
focused on.
Figure 1-4 summarizes the st ructure and study items of three
kinds of innovative optical fibers studied in this doctoral thesis.
Figure 1-4 Study items of doctoral thesis
Chapter 2 describes the ult ra -low loss and long length photonic
crystal fiber to replace conventional single-mode optical fiber s. Fi rst ,
low loss PCF design parameters for reducing a confinement loss and the
fabrication technology for the long length PCF with a low loss are
described. Reducing the OH absorption loss of the PCF that i s really
necessary for WDM transmission system is also described . Moreover, i t
is clarified that the fabricated PCF can be appl ied to a dense
wavelength division mul tiplexing (DWDM) transmission experiment .
Chapter 3 describes a HAPCF with a good bending performance
for an opt ical wiring. Fi rst , the requirements of the mechanical

16 Chapter 1
properties , connection loss and long-term reliabi li ty for the indoor
optical wiring are clari fied and a type of PCF is selected for a practical
optical wiring use. Next , the HAPCF design is described. Then, the
long-term reliabili t y of the fiber i s calculated. Finally, connect ion loss
between the HAPCF and the conventional single -mode fiber i s measured.
It is clari fied that the HAPCF can be a promising candidate for indoor
wiring applications.
Chapter 4 descr ibes a graded index two-mode optical fiber
(TMF) with a low DMD, a large A e f f and a low bending loss. Fi rst , fiber
design for realizing the low DMD and low bending loss , and
maximizing Ae f f i s descr ibed . Next , the measured propert ies of
fabricated fiber are compared with the calculated ones . Finally, the
mode-launch characteristics for TMF are calculated by using the finite
element -beam propagation method (FE -BPM) and the calculated results
are compared wi th the experimental ones. It i s clar ified that GI-TMF
design is suitable to MDM systems and the proposed TMF has a
potential to reduce MIMO-DSP complexity.
Chapter 5 summarizes the results obtained in this study.

Chapter 2
Ultra-low Loss and Long Length
Photonic Crystal Fiber
2.1 Introduction
Optical fibers with sil ica -a ir microstructures called photonic
crystal f ibers (PCFs) are very att ractive transmission media since PCFs
can provide unique dispersions and mode field diameters that are not
obtainable in conventional single -mode f ibers [14], [15] . The intrinsic
loss of a PCF, which is composed of Rayleigh scattering and infrared
absorption losses, is estimated to be less than that of a t ypical
single -mode fiber since a PCF is composed only of a pure sil ica glass.
Since the f irst wave of PCFs, the optical a ttenuation has been
reduced rapidly in the past years [ 16]–[18] . The lowest loss ever
reported before this work was 0.58 dB/km and was achieved by
increasing the scale of the PCF st ructure [ 19]. The optical attenuation is
sti l l high compared with that of a conventional single-mode fiber and
the f iber length was limited to a few kilometers.
18 Chapter 2
In this chapter, the structural parameters o f PCF, hole diameter
and hole pitch are designed in order to realize low loss PCFs.
According to the design, PCFs are fabricated.
In Sec. 2.3, the loss spectra of fabricated PCFs are analyzed.
Based on the spect ral analysis of optical losses i n PCFs, the fabrica tion
technology during preform and drawing processes are improved to
reduce the optical loss. The ultra -low loss and long length PCF util izing
the improved fabrication technology are fabricated.
In Sec. 2.4, the possibi li ty of reducing the OH absorpt ion loss of
a PCF that is really necessary for WDM transmission system and to
replace conventional single-mode optical fiber by PCF is shown.
Moreover , in Sec . 2 .5, a dense wavelength division multiplexing
(DWDM) transmission experiment by using the fabricated PCF are
demonstrated.

Ultra-low loss and long length PCF 19
2.2 Fiber Parameters and Fabrication
In PCFs, l ight i s confined within a core region by holes. Light
will move away from the core if the confinement provided by the holes
is inadequate. This means the PCF st ructure as a hole diameter and a
hole pitch have to be properly designed in order to realize low loss
PCFs. The ra tio of the hole diameter (d) to the hole pi tch (Λ) i s chosen
to be large enough to confine light in the core. On the other hand, a
large d/Λ makes the PCF mul timode. By properly designing the
structure, the confinement loss of single-mode PCFs can be reduced to a
negligible level [20] . PCFs with 5 rings and 90 holes have been
fabricated to sufficiently reduce the confinement loss to the ignorable
level.
The high purity si l ica glass made with the vapor phase axial
deposit ion (VAD) technique was selected. The intr insic loss of the bulk
glass, which is composed of the Rayleigh scat tering and the infrared
absorption losses, i s estimated to be 0.14 dB/km at 1.55 µm wavelength
[21].
Early works have shown that PCFs have a high Rayleigh
scattering coefficient even though pure si l ica glass i s used [ 18]. The
reason for this high value ca n be attributed to the roughness of the hole
interior surface . When stacking the rods and capi llaries in the multi
capillary method, small scra tches and contamination can be introduced
on the surfaces. These cause additional loss. In order to reduce the
optical a ttenuation, the polishing and etching process i s improved.
Another useful technique is to increase the mode fie ld diameter so that
the surface roughness of the hole does not contribute to imperfect ion
loss.
The PCF preforms were drawn into the optical fiber with a
diameter of 125 µm in a carbon furnace . Fiber diameter fluctuat ion s

20 Chapter 2
during fiber drawing process were observed to be less than 1µm.

Ultra-low loss and long length PCF 21
2.3 Optical Properties of Low-loss PCF
Figure 2-1 shows the loss spectrum for a 10 -km length of the
fabricated low loss PCF. The optical loss was measured by the cutback
technique. The inset shows the f iber cross section. The PCF with 90
holes had a hole diameter d of 2.5 µm and a hole pitch Λ of 4 µm. The
hole diameters and hole pitches both at the starting and ending regions
were measured . The di fference of d and Λ between the starting and
ending regions of the PCF were within 1%. The optical t ime domain
reflectometry (OTDR) results show tha t there i s no discontinuity along
the entire length. The optica l at tenuation s at 1.31 µm and 1.55 µm
wavelengths were 0.37 and 0.71 dB/km , respectively.
Figure 2-1 Loss spect rum of fabricated low-loss PCF

22 Chapter 2
Chromatic d ispersion of the PCF was estimated from a
wavelength dependence of pulse delay using super continuum
picosecond pulses generated in an optical fiber [ 22] . Figure 2-2 shows
the chromat ic dispersion of the PCF with a length of 1 km. The zero
dispersion wavelength was 950 nm and the chromatic dispersion at 1 .55
µm wavelength was 76 ps/km/nm.
Figure 2-2 Chromatic dispersion charact eristics of fabricated low-loss
PCF
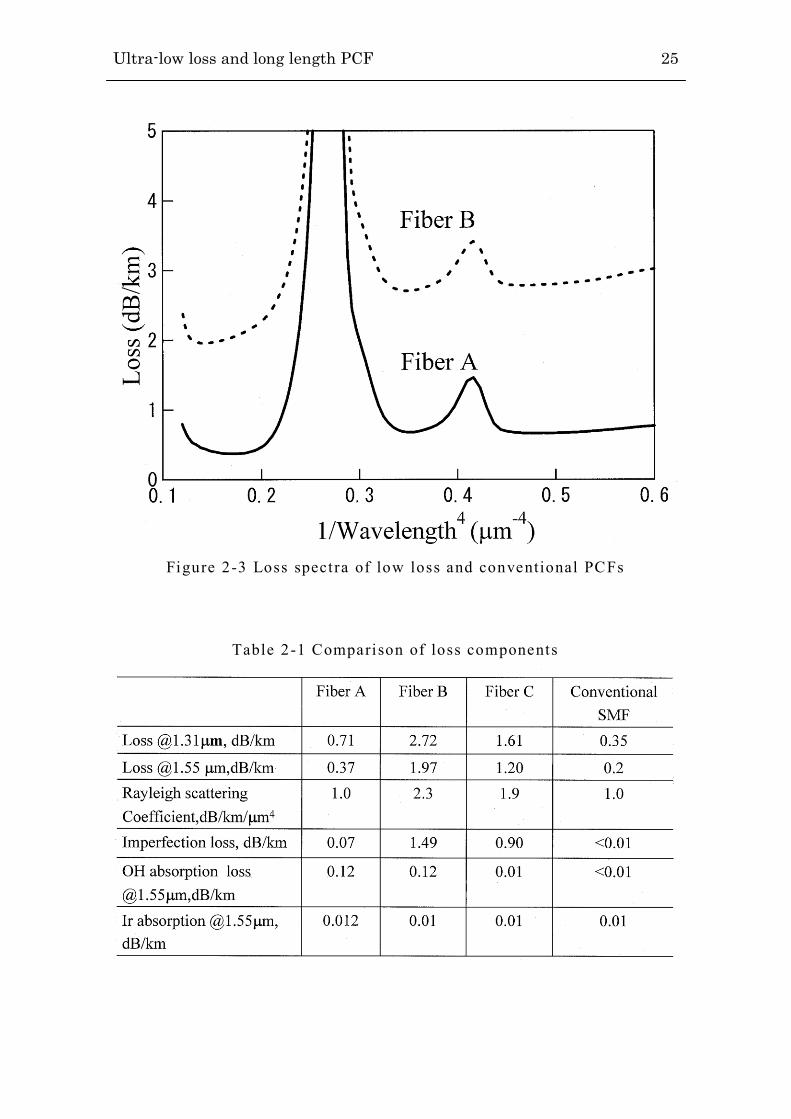
Several samples of PCF with the different surface roughness on
the inner wal l of the hole have fabricated. Each PCF has the same
dimension of the structural parameters d/Λ = 0.6 and Λ of 4 .0 µm. Each
fabricated PCF had a fiber length of over 10 km. The optical loss
spect ra of these two fibers are shown in Fig. 2-3. The improved
polishing and etching technique was applied to Fiber A to reduce the

Ultra-low loss and long length PCF 23
surface roughness of holes. In contrast , Fiber B was fabricated with
conventional t reatment of surface roughness . The resultant surface
roughness for Fibers A and B was est imated to be several nanometers
and several tens of nanometers respectively. It was clarified that the
different fabrica tion processes was responsible for the differences of
optical loss properties.
The confinement loss for these st ructures was calculated and it
was estimated to be 0.01 dB/km for a wavelength region between 1.0
and 1.7 µm. Fiber diameter fluctuations for these fabricated f ibers were
within 1 µm. The loss (dB/km) is well fi t ted to the following Eq.
(2-1)
IROHBAkmdB
4)/( (2.1)
where A and B denote Rayle igh scattering coefficient and the
imperfection loss, respectively. αO H and α I R are the OH absorption and
the infrared absorption losses, respectively.
Table 2-1 shows the comparison of loss components calculated
with a nonlinear fi t t ing technique. The infrared absorption loss
component for Fibers A and B, which is a part of th e int rinsic loss, was
almost equal to the int rinsic level.
From Table 2 -1, the main loss differences between Fibers A and
B were the Rayleigh scattering and imperfection losses. Another high
extrinsic loss was OH absorption loss. It has a peak at 1 .38 µm and
contr ibutes loss of 0.12 dB/km at 1.55µm. This is extremely high
compared with that of a convent ional single-mode fiber and obviously
affects the opt ical properties.
In order to further reduce the optical loss of the PCF, the
process has to be improved so as to avoid the inclusion of OH ion. The
optical loss of PCF will reduce to be 0.25 dB/km at 1.55µm if the OH

24 Chapter 2
ion can be removed .
By further improvement of the process such as reduction of
surface roughness, i t i s expected that the Rayleigh scattering a nd the
imperfection losses due to the roughness can be reduced. If these excess
losses can be eliminated, the optical loss of PCF becomes that of a
sil ica glass, which is less than that of a conventional single -mode fiber.
Ultra-low loss and long length PCF 25
Figure 2-3 Loss spect ra of low loss and conventional PCFs
Table 2-1 Comparison of loss components

26 Chapter 2
2.4 Trial of the PCF Water Peak Reduction
In the fiber, the major component of optical a ttenuation was OH
absorption loss. Several experiments were performed to improve the
dehydrat ion process. The OH impurities in a PCF are composed of the
inherent OH impurit ies in a raw si l ica glass and those on the surface of
the holes which diffuse into the core region of the PCF at high
temperature during fabrication process. Fi rst , a high purity si l ica glass
was selected . The high purity sil ica glasses used in the measurements
are made by the VAD technique. Special precautions were taken during
both the preform preparation and fabrication process to prevent the
water from enter ing the air hole. The OH absorption loss of the glass
preform at 1 .38 µm wavelength was determined to be less than 0.5
dB/km, which was estimated from the dehydration condi tion in the VAD
technique.
Figure 2-4 shows the loss spectrum of fabricated low OH
absorption PCF (Fiber C). The loss spectrum of Fiber B is shown in the
same figure . The st ructural parameters are the same as th ose of Fibers A
and B.
Fiber C has an OH absorption loss as low as 3 dB/km. The loss
value is almost hal f of that of previously reported PCF t o the best of
our knowledge in 2003 [23]. It is obvious that excluding water f rom the
holes, during the fabricat ion process i s essential to reduce the OH
absorption loss.
The optica l at tenuations of Fiber C at the 1.55µm wavelength
was 1.2 dB/km. Unfort unately, the PCF fabrication process has not been
fully optimized at this t ime. The high attenuation is caused mainly by
surface roughness of the hole along the ent ire f iber length. Further
reduction of the roughness in the process i s needed to reduce the optical
attenuat ion.

Ultra-low loss and long length PCF 27
Figure 2-4 Loss spect ra of low OH absorption and conventional PCFs

28 Chapter 2
2.5 DWDM Transmission Experiment
The fiber A was used to perform a 10 Gbit /s x 8 channel DWDM
transmission experiment . The experimenta l setup is shown in Fig. 2-5.
The e ight wavelength outputs from 192.7 to 193.4 THz with 100 GHz
channel spacing from external cavity lasers were multiplexed, and
simultaneously modulated using a LiNbO3 intensity modulator dr iven
by 211 - 1 non return-to-zero (NRZ), pseudorandom bi t s t ream. After
optical ampli fication, the transmitter output signal was launched into
the PCF. The output signal from the 10-km length PCF was
de-multiplexed to each channel and the bit -error ra te (BER) was
measured.
The BER measurement results for eight chan nels are shown in
Fig. 2-6. Power penalties for BER of 10 -1 1 were from 0.4 to 1.3 dB for
eight channels. No sign of an error f loor for any of the eight different
wavelength channels were observed.
Figure 2-5 DWDM transmission experiment set up

Ultra-low loss and long length PCF 29
Figure 2-6 BER measurement result of DWDM transmission experiment
30 Chapter 2
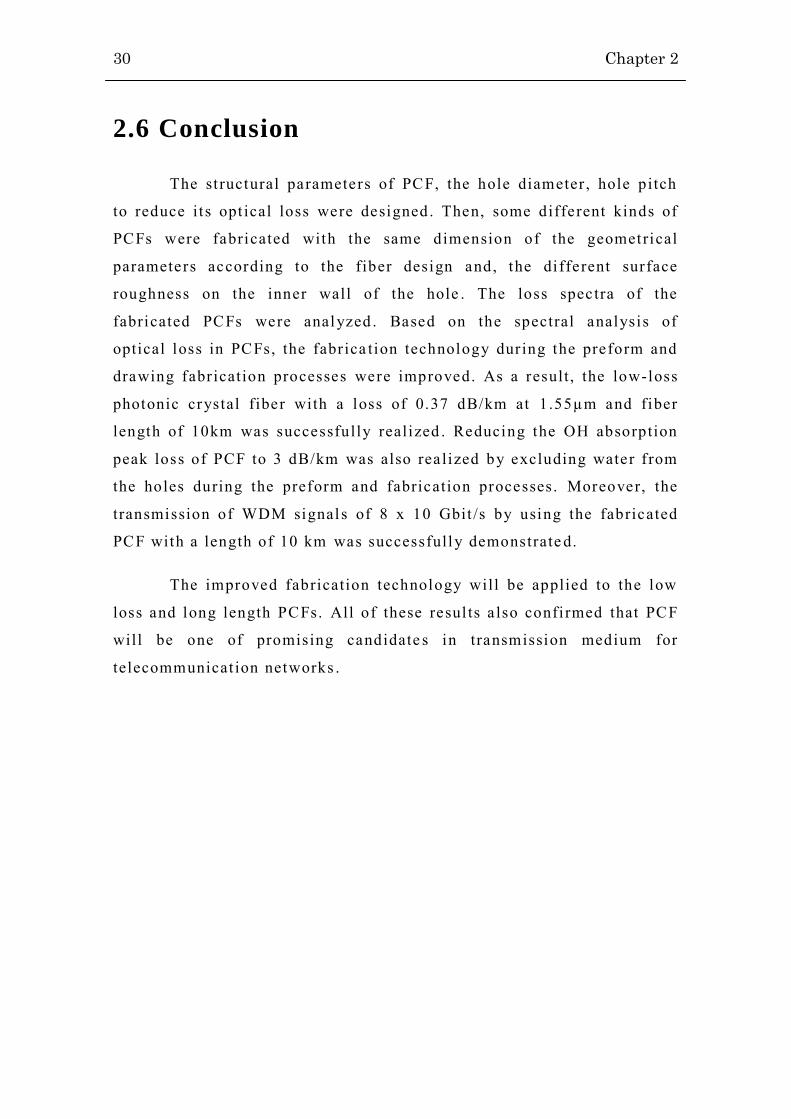
2.6 Conclusion
The st ructural parameters of PCF, the hole diameter , hole pitch
to reduce it s opt ical loss were designed . Then, some different kinds of
PCFs were fabricated with the same dimension of the geometrical
parameters according to the fiber design and, the di fferent surface
roughness on the inner wall of the hole . The loss spectra of the
fabricated PCFs were analyzed . Based on the spectral analysis of
optical loss in PCFs, the fabrica tion technology during the preform and
drawing fabrication processes were improved. As a result , the low-loss
photonic crystal fiber with a loss of 0.37 dB/km at 1 .55µm and fiber
length of 10km was successfully realized . Reducing the OH absorption
peak loss of PCF to 3 dB/km was also rea lized by excluding water f rom
the holes during the preform and fabrication processes. Moreover, the
transmission of WDM signal s of 8 x 10 Gbit /s by using the fabricated
PCF with a length of 10 km was successfully demonstrate d.
The improved fabrication technology will be applied to the low
loss and long length PCFs. All of these resul ts a lso confi rmed that PCF
will be one of promising candidate s in transmission medium for
telecommunicat ion networks .

Chapter 3
Hole-assisted Type Photonic Crystal
Fiber with Good Bending Loss
Performance
3.1 Introduction
In recent years, transmission capacity has increased rapidly due
to the introduction of various kinds of broadband services. Fiber To The
Home (FTTH) is the most promising approach for meeting the demand
for high-speed services because of i t s large transmission capacity and
symmetrical up-down speed. In 2002, NTT (Nippon Telegraph and
Telephone Corporation from 1985) launched an FTTH service named
B-FLETS in Japan, and FTTH is currently being widely spread. For the
installation of FTTH, indoor optical wiring is one of the most important
problems. This i s because indoor optical wiring provides a shorter
transmission line but has more connection and bending points. This
makes it necessary to choose a sui table optical f iber for this purpose .
Recently, a photonic crystal fiber (PCF) with a sil ica -air
microstructure has received increasing at tention because of i t s novel

32 Chapter 3
guiding propert ies, which suggest the possibili t y of diverse opt ical
transmission applications [24, 25] . Of i t s features, i ts low bending loss
is considered to make it suitable for use as an optical wiring in
resident ial and business premises.
In this chapter , applicabi li ty of the hole a ssisted type PCF
(HAPCF) to the indoor wiring i s s tudied. First , general requirements for
the indoor wiring are analyzed . Then, the st ructure of PCF that is
suitable to indoor wiring i s selected by taking into account the analysis.
In Sec . 3.3, bending loss characteristics of HAPCF is studied
because there are a lot of bending points in indoor wir ing and
attenuat ion of bending loss cannot be ignored. Calculation model of
HAPCF is defined and the near field pattern based on that model i s
calculated to confirm that near field pattern is confined in HAPCF
compared wi th the conventional single -mode optical fiber or not.
Furthermore, the bending characteristics of HAPCF are confi rmed by
calculations and measurements.
The long-term re liabil i ty of HAPCF is also investigated because
there are a lot of bending points and smal ler bending radius i s expected
in the indoor wiring.
To consider the actual deployment, connect ion between the
HAPCF to the conventional SMF will be necessary. The reasonably low
connection loss i s needed . The fusion splice and mechanical splice
connection loss character ist ics for HAPCF are measured.

HAPCF with Good Bending Loss Performance 33
3.2 Consideration of PCF Applied to Optical
Wiring
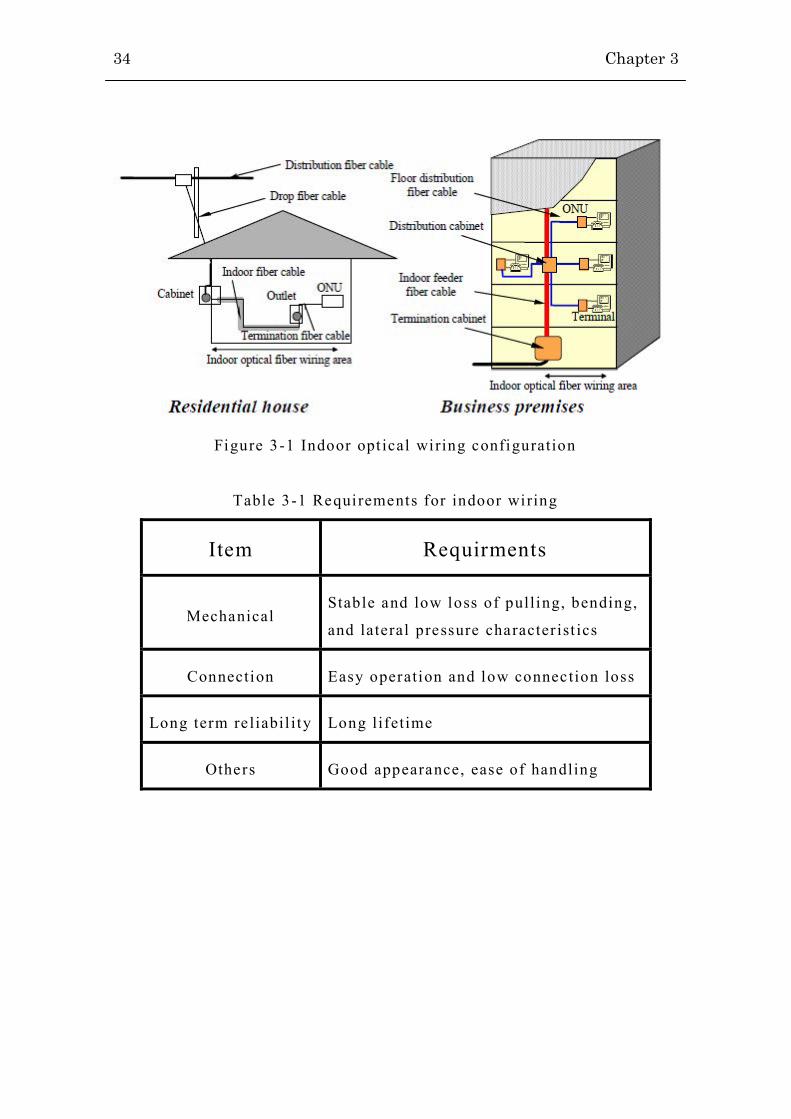
3.2.1 Requirements for Indoor Optical Wiring Figure 3-1 shows a t ypical indoor optical wir ing configuration.
This wiring covers the area from a cabinet to an optical network unit
(ONU) and is expected to extend to a user terminal. There are several
types of optical f iber cable used in this area, inc luding the indoor
optical fiber cable, the termination optical fiber cable, the indoor r iser
fiber cable, and the f loor distribut ion fiber cable .
The general requirements for the indoor optical wiring are l is ted
in Table 3-1. The fiber for the indoor optical wiring is expected to have
the same characteristics as the conventional optica l fiber, furthermore it
requires a smal ler bending loss against a smaller bending radius and
sufficient reliabili t y. Additionally, because there are more connection
points installed in the indoor wiring areas, i t must al so have good
connection performance.
34 Chapter 3
Figure 3-1 Indoor opt ical wiring configuration
Table 3-1 Requirements for indoor wiring
Item Requirments
Mechanical Stable and low loss of pulling, bending,
and lateral pressure character ist ics
Connection Easy operation and low connection loss
Long term re liabil i ty Long lifetime
Others Good appearance, ease of handling

HAPCF with Good Bending Loss Performance 35
3.2.2 Structure of PCF for Indoor Optical Wiring
PCFs have several di fferent kinds of structure and al l have
periodically arranged holes along the fiber. Table 3-2 shows three types
of PCF reported over the past years.
Type A is photonic band -gap type PCF (PBGF), which has an ai r
hole as i ts core and holes in i ts cladding arranged to form two
dimensional photonic crystals. PBGF guides l ight by th e photonic band
gap effect . Several years have passed since a true band -gap fiber was
fabricated [26] , but the optical loss of PBGF is sti l l too large for a
practica l use .
Type B [27] and Type C [28] are both index guiding type PCF
(IGPCF). Although these kinds of fiber are also called PCF, their
guiding properties do not rely on photonic band gap effect but on total
internal reflection (TIR) of the conventional mechanism. PCF of Type B
is made from mono materia l and Type C has a high refract ive index core.
Periodically arranged holes in the cladding reduce i ts effective
refrac tive index, and the refractive index of the core is la rger than that
of the c ladding so the l ight i s guided by the TIR effect.
It should be noted that Type C has a high refra ctive index core ,
so the ai r holes in the c ladding simply assist the control of the opt ical
properties. Because of this property, Type C is also called hole assisted
type PCF (HAPCF).
Recent PCF studies have mainly focused on IGPCF because the
strict periodic ity of the hole i s not required in order to rea lize
wave-guide . The lowest optical loss of 0 .37dB/km has been reported for
IGPCF [29] . For Type B, a large connection loss , equivalent to opt ical
attenuat ion of several km length of the fiber i s thought to be induced

36 Chapter 3
when the fusion splice method is used, because of the dest ruction of the
wave-guide st ructure . In contrast , the connection loss is expected to be
smaller than HAPCF because the air holes do not play a major role of
the wave-guide .
HAPCF is particular ly a ttractive for the indoor optical wiring
when taking the high bending loss performance, mass produc tivity and
low connection loss into consideration. In this chapter , the possibi li ty
of using HAPCF for the indoor opt ical wiring is mainly investigated .
Table 3-2 Photonic crystal fiber

HAPCF with Good Bending Loss Performance 37
3.3 Optical Properties of HAPCF
3.3.1 Calculation Model Figure 3-2 shows the cross -sectional structure of HAPCF. There
is a conventional high refractive index core in the cente r of the f iber
with a radius of a . Several holes of diameter d are formed periodically
in the cladding around the core , and the distance between the core
center and the hole ci rcumference is defined as c. The distance between
the fiber center and the hole center i s defined as r , and the fiber radius
is defined as r f .
Figure 3-2 Construction of HAPCF

38 Chapter 3
3.3.2 Near Field Pattern Figure 3-3 shows the calcula ted near field distribution of normal
single -mode fiber (SMF) and two types of HAPCF. All these fibers are
assumed to have the same dimensions (a=5μm, r f=62.5μm) and core
refrac tive index. The calculations were performed with the finite
element method (FEM) at a wavelength of 1550 nm. The HAPCF hole
positions c /a, ratio of core diameter a and the distance between the core
center and the hole ci rcumference c are 1.2 and 2 respect ively. The each
line in Fig. 3 -3 shows the equi -intensi ty of the near field pat tern. From
Fig. 3-3, i t i s clear that the near field pat tern is confined by the
existence of the holes.
Figure 3-3 Near field pat tern

HAPCF with Good Bending Loss Performance 39
3.3.3 Bending Loss Performance
The bending loss characteristics of HAPCF were investigated
both numerically [30] and experimentally. Actual effective refract ive
index at the hole area is parabolic . Here the effective refractive index at
a specified radius is simply approximated as the average of the
refrac tive index on the hole area. The inset in Fig . 3-4 shows the
effective refrac tive index profile of HAPCF, which is W -type index
profile .
Figure 3-4 shows the calculated bending loss characteristics for
SMF and two types of HAPCF at a wavelength of 1550 nm. It i s obvious
that the HAPCF with large hole (d=0.8a) and HAPCF with small hole
(d=0.4a) has lower bending loss than convent ional SMF for the same
bending radius . Furthermore, i t i s also found that an increase in the
hole size reduces the bending loss. The bending loss characteristics of
the fabricated HAPCF (c /a=1.2, c /a=2, a=5μm, d=2a) and conventional
SMF were measured. The bending loss experiments were performed
with a bending radius of 10 mm and 20 turns.
The measurement result s are shown in Fig. 3-5. This figure
shows that the optical loss of SMF increased more than 5 dB at the
wavelengths more than 1500 nm. In contrast , for HAPCF the loss
increase was negligible (<0.01 dB) over the whole wavelength range
from 1300 to 1600 nm. Thus the outstanding bending loss performance
of HAPCF was confi rmed by the measurement .

40 Chapter 3
Figure 3-4 Calculated bending loss
Figure 3-5 Measured bending loss

HAPCF with Good Bending Loss Performance 41
3.4 Long-term Reliability
Long-term re liabil i ty is an important i ssue as regards f iber for
practica l use . The flaw dist ribution on the air hole surface is assumed
to be the same as that on the fiber surface. T he fiber i s assumed to have
passed a proof test where the test stress and time are εp and tp ,
respectively. The cumulative failure probabili ty F after t ime T 0 can be
expressed by Eq. (3-1). [31][32][33]
dldtddn
mt
dr
nm
tTLNdrtTLNF
nN
Spnp
nfT
pnp
L
fpnp
p
h
2
011
2
1
2
01
0 100
00
2
100
421
22111
2/1exp
(3-1)
where Np is the failure number per unit length, L 0 is the length of the
fiber , r f i s the fiber radius, N and d are the number and diameter of the
hole , m is a constant related to the initial inert st rength dist ribution,
and n1 and n 2 a re constants determined by the mater ial and environment
of the fiber and hole surface , respectively.
ε f and ε h are the strains on the fiber and the hole surface ,
respectively. These strains are a combination of the cabling residual
stra in ε1 , construction strain ε 2 , construction residual strain ε 3 ,
temperature variation strain ε4 and bending stra in ε 5 . The value of each
type of strain, the strain length and time are shown in Table 3 -3.
The bending strain ε 5 on the fiber and ai r hole surfaces can be
expressed by Eqs. (3-2) and (3-3) respectively.
Rr
sin :surfacefiber 5 (3-2)
R
dN
Sr a
sin2
)1(2sin
: surface holeair
1
5
(3-3)
42 Chapter 3
where R is the bending radius and r i s the distance between the center
of the fiber and the center of the hole.
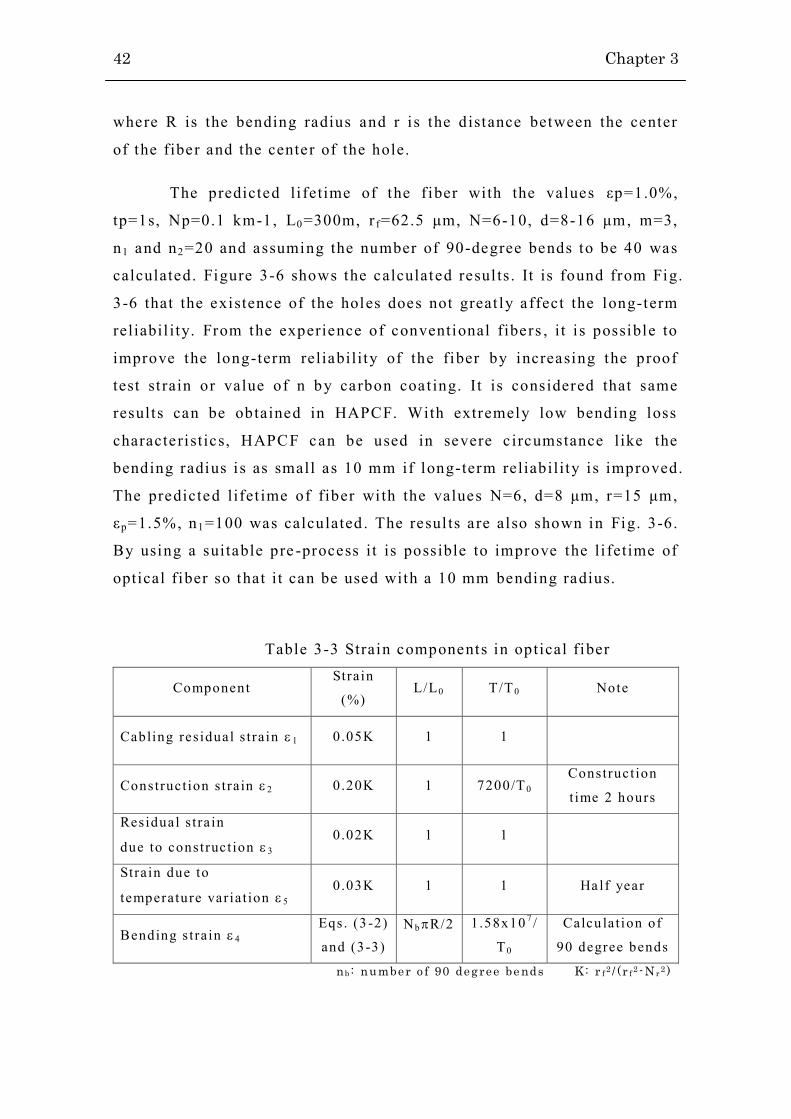
The predicted li fetime of the f iber with the values εp=1.0%,
tp=1s, Np=0.1 km-1, L0=300m, r f=62.5 μm, N=6-10, d=8-16 μm, m=3,
n1 and n2=20 and assuming the number of 90-degree bends to be 40 was
calculated. Figure 3-6 shows the calculated resul ts . It is found from Fig.
3-6 that the existence of the holes does not great ly affect the long-term
reliabil i ty. From the experience of conventional fibers , i t i s possible to
improve the long-term reliabili ty of the fiber by increasing the proof
test st rain or value of n by carbon coat ing. It is considered that same
results can be obtained in HAPCF. With extremely low bending loss
characteristics, HAPCF can be used in severe c ircumstance like the
bending radius i s as small as 10 mm if long-term reliabili ty i s improved.
The predicted lifet ime of fiber wi th the values N=6, d=8 μm, r=15 μm,
εp=1.5%, n1=100 was calculated . The resul ts are also shown in Fig. 3-6.
By using a suitable pre -process i t is possible to improve the l i fetime of
optical fiber so that i t can be used with a 10 mm bending radius.
Table 3-3 Strain components in optical fiber
Component Stra in
(%) L/L0 T/T 0 Note
Cabling res idual s t ra in 1 0 .05K 1 1
Construct ion s tra in 2 0 .20K 1 7200/T 0 Construct ion
t ime 2 hours
Residual s t ra in
due to construct ion 3 0 .02K 1 1
Stra in due to
temperature var ia t ion 5 0 .03K 1 1 Ha lf year
Bending s tra in 4 Eqs. (3 -2)
and (3-3) NbR/2 1 .58x10 7 /
T 0
Calcu lat ion of
90 degree bends
nb : number o f 90 degree be nds K: r f2 / (r f
2 -N r2 )

HAPCF with Good Bending Loss Performance 43
Figure 3-6 Relationship between predicted li fetime and bending radius

44 Chapter 3
3.5 Connection Loss
Another important characteristic, namely the connection loss
was also investigated . The fusion splice and mechanical splice
connection loss characteristics for HAPCF to HAPCF and HAPCF to
SMF connection were measured . The experimental results are shown in
Figs. 3-7 and 3-8. Here , the HAPCF has the st ructure shown in Fig . 3-2
where c=2a, d=2a, a=5μm and a lmost same MFD with conventional
single -mode fiber as shown in Fig. 3 -3 (b). The experiments with the
conventional SMF connection methods were performed and no special
modifications to the connection method or tool were made .
The measurement results show that the connection loss was no
more than 0.5 dB for both the fusion splice and mechanical splice
methods, and indicate that i t i s possible to connect the HAPCF with the
conventional connection methods and tools.
Figure 3-7 Fusion splice loss

HAPCF with Good Bending Loss Performance 45
Figure 3-8 Mechanical spl ice loss

46 Chapter 3
3.6 Conclusion
Applicabili ty of hole assisted type PCF (HAPCF) to the indoor
wiring was studied. General requirements for the indoor wiring were
analyzed and found that smaller bending loss against a smaller bending
radius and sufficient reliabili ty are absolutely necessary characterist ics .
Good connect ion performance is also required because there are many
connection points installed in the indoor wiring areas. Then, HAPCF
was selec ted as the suitable st ructure of PCF for the indoor wiring i n
consideration of those requirements.
In Sec. 3 .3 , bending loss characterist ics of HAPCF was studied .
Calculat ion model of HAPCF was defined and near field pattern was
calculated based on that model . It was confi rmed that near f ield pat tern
is confined in HAPCF compared to conventional single -mode opt ical
fibers. Furthermore , HAPCF is confi rmed to be superior bending loss
characteristics by calculation and measurements. T he loss increase for
SMF was more than 5 dB over the whole wavelength range from 1500 to
1600 nm with a bending radius of 10 mm and 20 turns . In contrast , the
loss increase for HAPCF was negligible (<0.01 dB) at the same
conditions .
In Sec. 3.4, l ong-term reliabili t y of HAPCF was investigated .
From the calculated results , i t was found that the existence of the holes
does not greatly affect the long-term reliabili t y. The predicted lifetime
of HAPCF was also calcula ted at the bending radius i s as small as 10
mm. The results showed that HAPCF is able to achieve more than 20
years l ifetime with a 10 mm bending radius by increasing the proof test
stra in or by carbon coating.
Finally, the fusion splice and mechanical splice con nection loss
characteristics for HAPCF to HAPCF and HAPCF to SMF connect ion
were measured . The connection loss measurement results suggest ed that

HAPCF with Good Bending Loss Performance 47
i t is possible to apply convent ional connection technology to HAPCF
with acceptable connection loss levels.
Based on the above results , i t was concluded that hole -assisted
type PCF could deploy for indoor optical wiring applications.

48 Chapter 3

Chapter 4
Graded Index Two-mode Optical Fiber
with Low DMD, Large Aeff and Low
Bending Loss
4.1 Introduction
The traffic of backbone network has been increasing rapidly
corresponding to the growth of broadband users in worldwide. It i s
reported that the current system util izing the conventional single-mode
optical fibers (SMFs) will approach the l imit of input power, which is
directly related to the transmission capacity in the wavelength division
multiplexing (WDM) system, because of the optical nonline ar effects
and the fiber fuse [ 34]. For next generation system, mode division
multiplexing (MDM) transmission system using a few -mode fiber (FMF)
has been studied actively [ 35-42].
In the MDM system, multiple -input -multiple -output (MIMO)
digital s ignal processing (DSP) can be applied to recover the
transmitted signals. However, i t i s known that differential modal group
delay (DMD) of FMF increases DSP complexity [ 35-39]. Then, FMF

50 Chapter 4
with low DMD would have advantage to be applied to MDM ut il izing
the MIMO. Low DMD in the wide wavelength range is required for the
WDM applications. Moreover, low bending loss of not only fundamental
mode but a lso higher order modes is essent ial . Furthermore,
enlargement of the effective area ( A e f f) is also desi rable for increasi ng
the launched power into the f iber, resulting in increase of the
multipl icity of WDM.
It i s known that FMF with a graded index (GI) profile minimizes
DMD [36, 38-40] . Reference [36] shows the FMF with both of low
DMD and low mode coupling, Reference [39] and [40] shows the
optimal value of Δ and α to minimize DMD. However, there has been no
report on FMF design optimizing DMD, bending loss and A e f f .
In this chapter, a fiber design which optimizes the DMD,
bending loss and A e ff in graded-index type few mode fibers as one of
the innovative optical fibers is investigated. The two mode fibers
(TMFs) with a GI index profile are fabricated and the transmission
characteristics of the fabrica ted TMFs are clarified. Moreover, mode
launching characteristics by numerical simulation to estimate the mode
coupling at a spl ice point with an offset is clarified.
In Sec 4.2, the suitable profile design of TMF with DMD = 0
ps/km, Ae f f ≥ 150 µm2 for LP01 mode, and bending loss for LP 11 mode ≤
0.01 dB/km at R = 40 mm at the wavelength of 1550 nm is clari fied .
Refractive index profile , A e ff , cutoff wavelength, attenuation of
LP0 1 mode, bending loss for LP 11 mode at R = 40 mm and chromatic
dispersion of the fabrica ted GI -FMF are measured .
From the experience of GI multimode fiber, mode coupling at
the splice point may degrade the t ransmission quality. Mode launch
characteristics for TMF is calculated by using fini te element -beam
propagat ion method (FE-BPM) and the validity and use fulness of the

GI-TMF with Low DMD, Large Aeff and Low Bending Loss 51
present approach are shown by comparing with experimental results.

52 Chapter 4
4.2 Fiber Design
Figure 4-1 shows the refractive -index profi le of the graded index
(GI) fiber. The GI profile is given by
(4-1)
n
n
n(r)
a-a 0
Figure 4-1 Refractive index profile of the graded index fiber
where n 1 and n2 a re the indices of the core and the cladding,
respectively, r i s the distance from the center of the core, a i s the core
radius, and α is the index profile parameter. Δ i s the relative -index
difference between the core and th e cladding, which is defined as
21
22
21
2nnn
(4-2)
Next the fiber parameters of TMF are designed . The
requirements of TMF that DMD = 0 ps/km, A e f f ≥ 150 µm2 for LP0 1
mode, and bending loss for LP 11 mode ≤ 0.01 dB/km at R = 40 mm at
the wavelength of 1550 nm are determined. Bending loss at R = 40 mm
is an equivalent condition for microbending loss in the cable [ 43]. This
value is the important factor to evaluate the cabl ing adaptabili t y of
optical fibers. In addition, bending loss was evaluated with simulat ion
)(rn2/1
1 ])/(21[ arn
2n0≦r≦a
r≧a {

GI-TMF with Low DMD, Large Aeff and Low Bending Loss 53
using f inite element method [ 44] and other characteristics were
calculated by multilayer division method [ 45].
Figure 4-2 shows the relationship between the normalized
frequency T and the calculated DMD at 1550 nm for the different α and
Δ. Here, DMD is defined as 1/vg 1 1- 1/vg 01 , where v g1 1 and vg0 1 are the
group velocities of LP 1 1 and LP0 1 modes, respect ively. Normal ized
frequency T is defined by
AkanT 21 (4-3)
where k is the wave number and A is a constant valu e depending on the
refrac tive index profile. Because Δ and wavelength are kept to be
constant in Fig.4-2, increase of T means an increase in the core radius.
The cutoff f requencies of LP11 and LP 21 (or LP 0 2) modes are calculated.
It i s known that the norma lized cutoff f requency of the LP 02 mode of
the GI fiber with α of 2 is smaller than that of the LP 2 1 mode and i t i s
also clear that the normalized cutoff frequencies of two modes depend
on the refract ive index profile. For the step -index fiber, the normali zed
cutoff frequency of LP 21 mode is smaller than that of LP 0 2 mode.
Moreover, as the di fference of the normalized cutoff frequency between
LP0 2 and LP 2 1 modes is very small , the two mode condition is described
in the paper where the cutoff frequency is sm aller than that of LP 2 1
mode. Since the cutoff f requencies T for GI fiber with di fferent α of
LP11 and LP2 1 modes are obtained to be 2.5 and 4.5, two -mode
propagat ion region is 2 .5 ≤ T <4.5. It was confirmed from Fig. 4-2 that
DMD is a lmost independent of Δ in the range of 0 .3% to 0.4% and that
two mode propagation with DMD of 0 ps/km is satisfied for α ≥ 2.2. In
addition, the smaller α is , the smaller DMD slope at the normal ized
frequency of zero DMD is. This means that the value of DMD can be
reduced in the whole C band as α become sm aller. Figure 4-3 shows the
maximum value of DMD for α over the enti re C band. It i s obvious that
the maximum DMD value become smaller as α is smaller. However,

54 Chapter 4
because the LP 2 1 mode would propagate in α ≤ 2.2, the appropriate
range of α is 2 .2 ≤ α ≤ 2.4.
-200
-100
0
100
200
3.5 4 4.5 5
Equivalent normalized frequency T
DM
D []
ps/k
m]
a=2.82.4
2.2
2.0
1.9
2.1
LP21 Cutoff
1550 nm=0.35%
=0.30%
=0.40%
Two-mode propagation
Normalized frequency T
Figure 4-2 DMD characteristics of GI at 1550 nm
0
20
40
60
80
100
2 2.2 2.4 2.6 2.8 3
Max
imum
DM
D in
the
C b
and
[ps/
km]
= 0.35%DMD = 0 ps/km at 1550 nm
LP21 Cutoff
Figure 4-3 Maximum value of DMD for α over the entire C band

GI-TMF with Low DMD, Large Aeff and Low Bending Loss 55
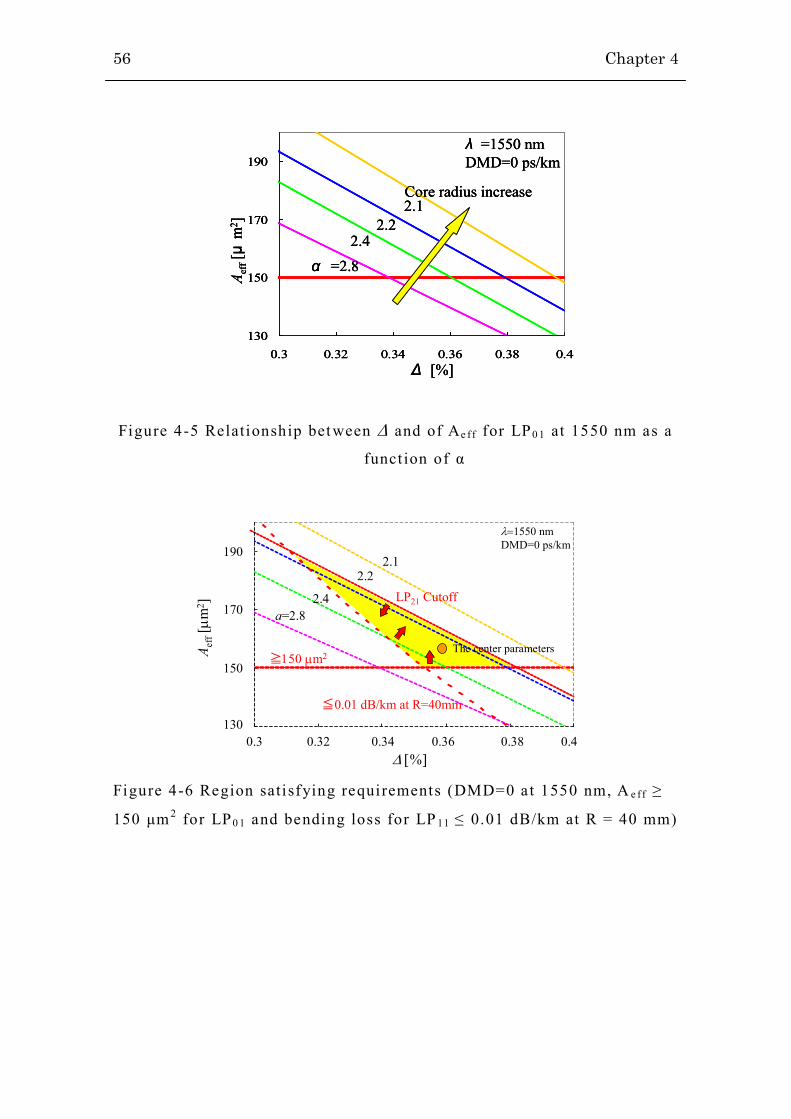
Figure 4-4 shows calculation results of bending loss for LP 11
mode at R = 40 mm at 1550 nm where DMD = 0 ps/km. It i s obvious
that the bending loss decreases as Δ increase . On the other hand, the
bending loss decreases as α decrease. The reason is that core radius at
the point of DMD = 0 ps/km increases as α decreases. Figure 4-5 shows
the calculation results of Ae ff for LP 01 mode at 1550nm and DMD = 0
ps/km. Ae f f increases as Δ and α decrease. According to the resul t of
Figs. 4-5, low DMD in the C band and good bending characteristics and
large Ae f f can be obtained by decreasing α keeping DMD = 0 ps/km.
With the calculat ion results from Figs. 4-2, 4-4 and 4-5, the region
satisfying our requirements, that i s DMD = 0, A e ff ≥ 150 μm2 for LP0 1
and bending loss for LP 11 ≤ 0.01 dB/km at R = 40 mm at 1550 nm, is
the hatched area in Fig. 4-6. The center of the hatched area is shown by
the ci rcle in Fig. 4-6. The fiber parameters on the center are Δ = 0.36%,
core radius a = 11.8 μm and α = 2.3. The DMD at 1550 nm is 0 ps/km.
0.30 0.32 0.34 0.36 0.38 0.40
2.12.2
2.4
α =2.8
Δ [%]
λ =1550 nmDMD=0 ps/km
Core radius increase
10-8
10-6
10-2
10-4
Ben
ding
loss
at R
=40
mm
[dB
/km
]
0.30 0.32 0.34 0.36 0.38 0.40
2.12.2
2.4
α =2.8
Δ [%]
λ =1550 nmDMD=0 ps/km
Core radius increase
10-8
10-6
10-2
10-4
Ben
ding
loss
at R
=40
mm
[dB
/km
]
Figure 4-4 Relationship between Δ and bending loss for LP 11 mode at
1550 nm as a funct ion of α
56 Chapter 4
130
150
170
190
0.3 0.32 0.34 0.36 0.38 0.4
A eff[μ
m2 ]
Δ [%]
α =2.82.4
2.22.1
λ =1550 nmDMD=0 ps/km
Core radius increase
130
150
170
190
0.3 0.32 0.34 0.36 0.38 0.4
A eff[μ
m2 ]
Δ [%]
α =2.82.4
2.22.1
λ =1550 nmDMD=0 ps/km
Core radius increase
130
150
170
190
0.3 0.32 0.34 0.36 0.38 0.4
A eff[μ
m2 ]
Δ [%]
α =2.82.4
2.22.1
λ =1550 nmDMD=0 ps/km
Core radius increase
Figure 4-5 Relationship bet ween Δ and of Ae f f for LP0 1 at 1550 nm as a
funct ion of α
A eff[
m2 ]
130
150
170
190
0.3 0.32 0.34 0.36 0.38 0.4
a=2.82.4
2.22.1
≧m
≦0.01 dB/km at R=40mm
LP21 Cutoff
1550 nmDMD=0 ps/km
The center parameters
130
150
170
190
0.3 0.32 0.34 0.36 0.38 0.4
Figure 4-6 Region satisfying requirements (DMD=0 at 1550 nm, A e f f ≥
150 μm 2 for LP0 1 and bending loss for LP 11 ≤ 0.01 dB/km at R = 40 mm)

GI-TMF with Low DMD, Large Aeff and Low Bending Loss 57
4.3 Characteristics of Fabricated Fiber
4.3.1 Refractive Index Profile
Figure 4-7 shows the refractive -index profile of the fabricated
GI-TMF measured by the refractive near fie ld pattern (RNFP) method
[46]. The broken l ine shows the fi t ted line to Eq. ( 4-1) with the least
square method of the fabricated GI -TMF. Table 4-1 summarizes the
structural parameters of the fabricated GI -TMF based on the fi t t ing
curve . Though a small central dip was formed, almost designed
structural parameters were obtained.
Radius [m]
-0.05
0.05
0.15
0.25
0.35
0 5 10 15
[%
]
Fitted
RNFP
Figure 4-7 Refractive index profile of fabrica ted GI -TMF measured by
RNFP. Broken line represents the f i t ted l ine by E q. (4-1) .
Table 4-1 Structural parameters of the fabricated GI -TMF
Δ[%] α a [μm]
GI-TMF 0.363 2.29 11.6

58 Chapter 4
4.3.2 Optical Properties of Fabricated GI-TMF
Table 4-2 shows optical properties of the GI-TMF at λ = 1550
nm. The properties of LP 0 1 mode were measured on bending to attenuate
only LP 11 mode power. The properties of LP 11 mode except for bending
loss were ca lculated using multi layer division method and the index
profile measured by RNFP. Attenuation for LP 0 1 was 0.196 dB/km. The
effective areas Ae f f of LP0 1 and LP11 modes were obtained to be about
150 μm 2 and over 200 μm2 , respectively.
Table 4-2 Optical properties of fabricated GI -TMF at λ = 1550 nm
Mode GI-TMF
Length
[m]
4870
Ae f f
[μm 2]
LP0 1 149.3
LP11* 201.2
Cutoff wavelength
[nm]
LP2 1 1495
LP11* 2315
Attenuation
[dB/km]
LP0 1 0.196
Bending loss at R = 40 mm
[dB/km]
LP0 1 0.00
LP11 0.016
Chromatic dispersion
[ps/km/nm]
LP0 1 20.9
LP11* 19.3
*calcula ted value

GI-TMF with Low DMD, Large Aeff and Low Bending Loss 59
4.3.2.1 Measurement Result of Cutoff Wavelength
Cutoff wavelength was measured with 2m bend reference
technique [47]. Measured spect ral loss i s shown in Fig. 4-8. Two peaks
were observed in the wavelength range between 1400 to 2400 nm. The
edges at longer wavelength of these peaks represent cutoff wavelengths
of LP 11 and LP2 1 modes because those cutoff wavelengths calculated
with the index profile measured by RNFP were 1520 and 2315 nm,
respectively. The cutoff wavelength of LP 2 1 and LP 11 modes were 1495
nm and over 2300 nm, respectively. That means the fabricated GI -TMF
can t ransmit only LP 0 1 and LP11 modes in C, L and U-band.
0
1
2
3
4
5
1400 1500 1600 1700 1800 1900 2000 2100 2200 2300 2400 [nm]
Am
plitu
de[d
B] C+L+U-band
Figure 4-8 Measured spect ral loss in bend reference technique

60 Chapter 4
4.3.2.2 Measurement Result of Bending Loss for
LP11 Mode
Figure 4-9 shows the schematic diagram of the experimental
setup. Bending loss for LP 11 mode was measured by exci ting only LP 11
mode using offset -connecting to SMF with a l ight source of 1550 nm
laser diode (LD) [48 -50]. Offset was about 16 μm and LP 11 mode power
was about 97% of the total input power. Bending loss of GI -TMF was
measured with and without bend of radius R 2 , under the bending
condition of bend radius R 1 to el iminate leaky mode. The reason why
bend radius R1 added is because sample f iber length is only 3m and
leaky mode can t ransmit such short length fiber. For the measurement of
bending loss, minimum loss change of 10 - 3 dB can be evaluated and
from a practical viewpoint, the maximum fiber length wound on the
bobbin is about 1 m. In this case , the f iber with length of 1 km have to
be wound on the bobbin with a radius of 40 mm but i t i s impossible.
Even if the bending loss for the length of 1 m is evaluated, the bending
loss at a radius of 40 mm is about 10 - 5 dB/km so that the bending loss
cannot be measured by the current measurement system as mentioned
above. Therefore, the bending loss is estimated by util izing the
well -known relationship between the logari thm of the bending loss in
dB and the bending radius. Measured value of bending loss of LP 11
mode for R 2= 15, 17 and 20 mm are shown by solid c ircles in Fig. 4-10.
Solid l ine shows the bending property ca lculated by finite element
method and the measured index profile . Calculated and measured results
are in good agreement. Therefore , the bending loss of LP 11 mode wi th a
radius of 40 mm can be estimated to be 0.016 dB/km from the
calculated results as shown in Fig. 4-10.

GI-TMF with Low DMD, Large Aeff and Low Bending Loss 61
Figure 4-9 Experimental setup of bending loss for LP 11 mode
measurement
1.E-04
1.E-02
1.E+00
1.E+02
1.E+04
0 10 20 30 40 50
Bending radius [mm]
10-4
10-2
0
102
104 MeasuredCalculated
Ben
ding
loss
at R
=40
mm
[dB
/km
]
design value : 0.01 dB/km
Figure 4-10 Measured result of bending loss for LP 11 at the radius of 15,
17 and 20 mm
LD
(1550 nm) GI - TMF (3 m) SMF
Power
-meter R
1 R 2

62 Chapter 4
4.3.2.3 Experimental Setup and Results of DMD
Figure 4-11 shows the experimental setup of the interference
method for DMD measurement [51]. To excite the LP0 1 and LP 11 modes,
TMF was spliced with a single-mode f iber at the offset of 6 .0 μm. Light
sources were LEDs with center wavelength at 1300 nm, 1450 nm, 1550
nm and 1650 nm. The intensity of the interference pattern depends on
the wavelength and is a nearly sinusoidal p at tern.
Here , the relationship between the D MD and the measured
wavelength period for FMFs are derived by following theoretical
treatment. When the e lectromagnetic fie lds of the LP 0 1 and LP 11 modes
coupled at z=0 is given by E 01 (z , t) and E11(z , t ), respectively, where z
is the distance downstream from the FMF’s entrance face, the wave
field at the FMF’s exit face is expressed as
LtjAtLE )(exp),( 010101 (4-4)
and
LtjAtLE )(exp),( 111111 (4-5)
where i s the center angular frequenc y of the l ight emitted from the
source , t is the t ime, A0 1 and A11 are the amplitudes, and 01() and
11() are the propagation constants for LP 0 1 and LP 11 modes t raversing
the FMF of length L , respectively. Focusing on phases 01=t 01()L
and 11=t 11()L of the guided modes, the phase difference ()
between 0 1 and 11 i s written as
L)()()( 11010111 (4-6)
Furthermore, the difference between (+) and () i s
approximated as follows,
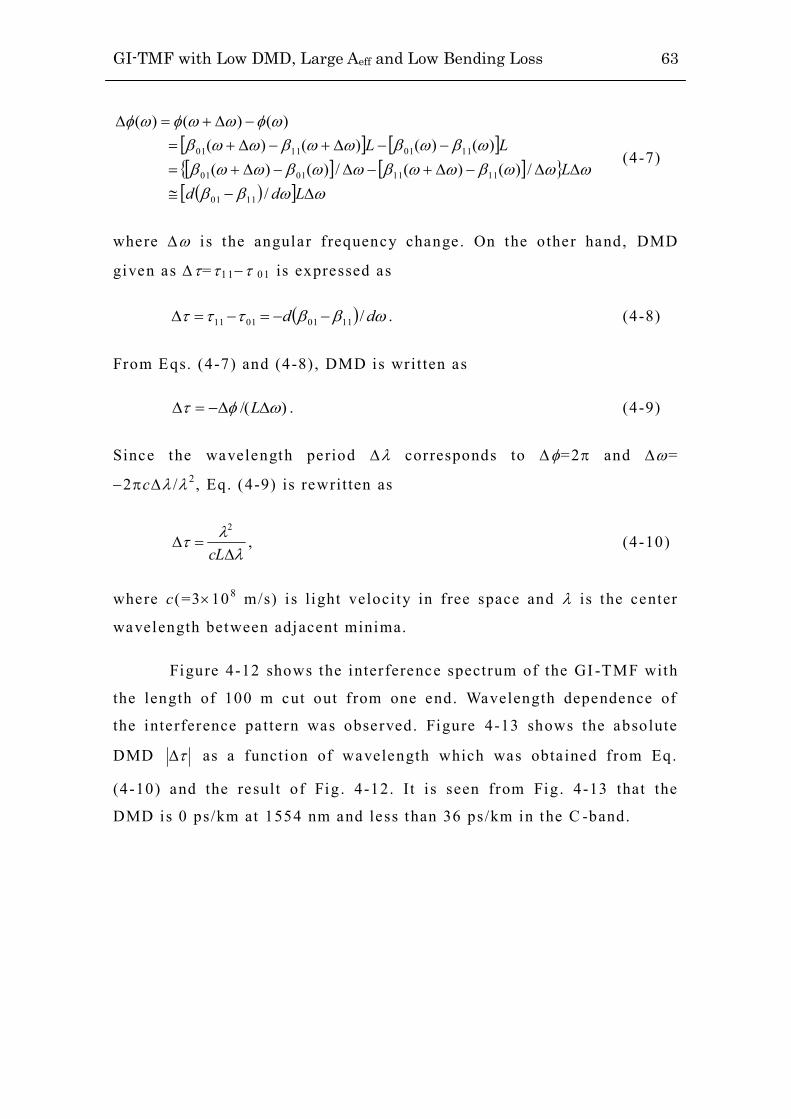
GI-TMF with Low DMD, Large Aeff and Low Bending Loss 63
LddL
LL
//)()(/)()(
)()()()()()()(
1101
11110101
11011101 (4-7)
where i s the angular f requency change. On the other hand, DMD
given as =11 01 is expressed as
dd /11010111 . (4-8)
From Eqs. (4-7) and (4-8) , DMD is written as
)/( L . (4-9)
Since the wavelength period corresponds to =2 and =
2c / 2 , Eq. (4-9) is rewritten as
cL
2
, (4-10)
where c(=3108 m/s) i s l ight velocity in free space and is the center
wavelength between adjacent minima.
Figure 4-12 shows the interference spectrum of the GI -TMF with
the length of 100 m cut out f rom one end. Wavelength dependence of
the interference pattern was observed. Figure 4-13 shows the absolute
DMD as a function of wavelength which was obta ined from Eq.
(4-10) and the result of Fig . 4-12. It i s seen from Fig. 4-13 that the
DMD is 0 ps/km at 1554 nm and less than 36 ps/km in the C -band.

64 Chapter 4
Figure 4-11 Experimental se tup of DMD measurement
4
4.8
5.6
1500 1520 1540 1560 1580 1600Wavelength [nm]
Am
plitu
de [d
B]
Figure 4-12 Interference spectrum of GI -TMF at 100 m
0
50
100
1500 1520 1540 1560 1580 1600wavelength [nm]
DM
D [p
s/km
]
C band
36 ps/km
Wavelength [nm] Figure 4-13 Absolute DMD property as a function of wavelength
L E D s
O pt i c a l s pe c t r um a n a l y z e r ( O S A)
G I - T M F ( 1 0 0 m) S M F

GI-TMF with Low DMD, Large Aeff and Low Bending Loss 65
4.4 Offset-launch Characteristics for TMF
Mode division mul tiplexing transmission system using
Few-Mode Fiber (FMF) has att racte d considerable attention [ 52-54] .
For the system, Multiple -Input -Multiple -Output digi tal signal
processing (MIMO-DSP) is applied to recover the signals which
degrade due to mode coupling. In addition, since MIMO -DSP
complexity increases with an increase of different ial modal group delay
(DMD) of FMF, DMD management l ine with below severa l ps/km has
been reported activity [ 54-57]. However, in the case of DMD
management l ine , there i s fear that mode coupling noise generates at the
splice point s. Though mode launch characteristics of multimode fiber at
the spl ice point s were reported appreciably [58, 59], that of FMF ha s
not been reported ever . In this chapter, Two-Mode Optical Fiber i s
focused and mode launch characterist ics for TMF is calculated by using
the finite element -beam propagation method (FE -BPM) and the validity
and usefulness of the present approach are shown by comparing with
experimental results.

66 Chapter 4
4.4.1 Simulation for Offset-launch
Characteristics using FE-BPM
Offset -launch characteristic was calculated by FE -BPM [44] ,
which is useful for complex refractive index profile analysis. Fig ure
4-14 shows hal f of a fiber cross -section, which is divided into elements.
Perfect elect rical conductor was set on the boundary of y=0 and six
perfectly matched layers were se t at the outer layer. The number of
node and element were 7685, 3765, respectively. Measured refrac tive
index profile data by RNFP were given to each element and the index
profile was supposed longitudinal ly constant . Next , Gaussian field data
with offset value was set into the suitable node fie ld data. After that,
propagated field dist ribution was sequential ly calculated by using
Crank- Nicolson method. Figure 4-15 shows the power at x = 0 and x =
xm, where the intensity of LP 0 1 and LP 1 1 modes maximize under steady
state condition, as a funct ion of propagation distance in the case of
TMF.
Figure 4-14 Element division profi le
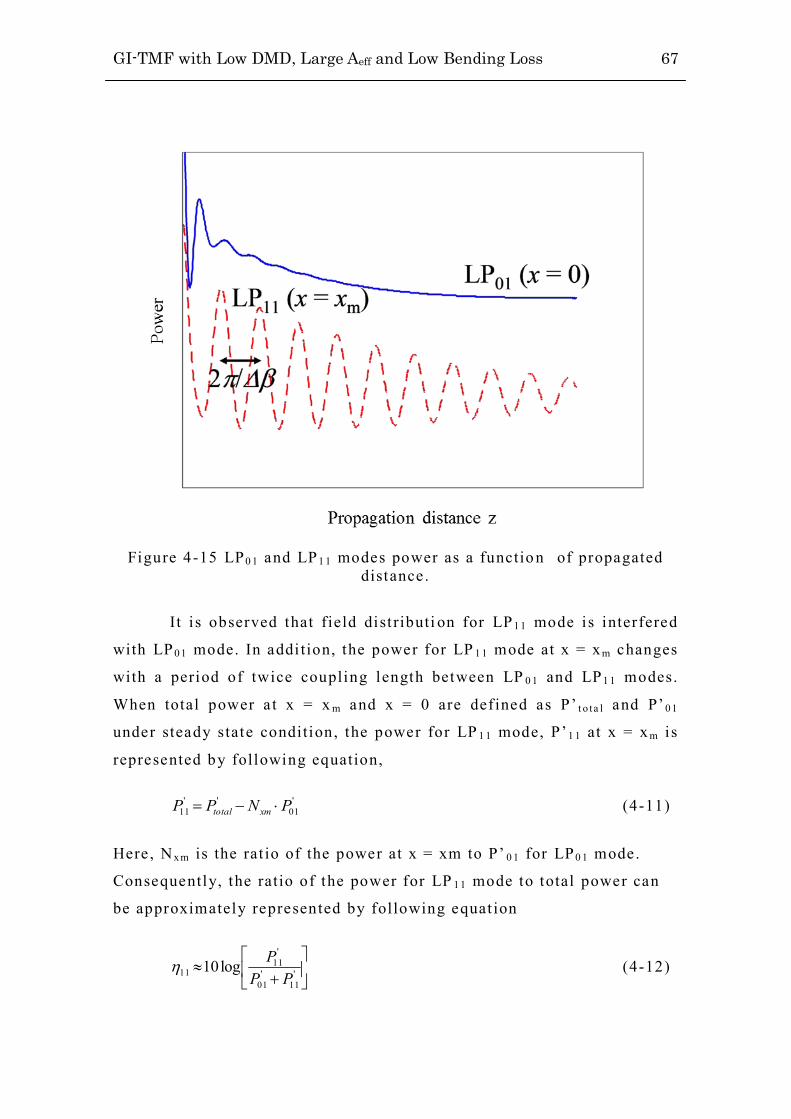
GI-TMF with Low DMD, Large Aeff and Low Bending Loss 67
Figure 4-15 LP0 1 and LP 1 1 modes power as a functio n of propagated
distance .
It i s observed that field dist ributi on for LP 11 mode is interfered
with LP 01 mode. In addi tion, the power for LP 1 1 mode at x = xm changes
with a period of twice coupling length between LP 0 1 and LP 1 1 modes.
When total power a t x = x m and x = 0 are def ined as P’ t o t a l and P’ 01
under steady state condition, the power for LP 1 1 mode, P’1 1 at x = x m i s
represented by following equation,
'01
''11 PNPP xmtotal (4-11)
Here , N xm is the rat io of the power at x = xm to P’ 0 1 for LP0 1 mode.
Consequently, the ratio of the power for LP 11 mode to total power can
be approximately represented by following equat ion
'
11'
01
'11
11 log10PP
P (4-12)

68 Chapter 4
4.4.2 Fiber Sample and Experimental Setup
In order to examine the validity for mode launch evaluation by
using FE-BPM, the power ratio of LP 01 and LP 11 modes for TMF under
offset -launch condi tion were measured. Table 4-3 shows optical
properties of TMF and SMF, which was used as mode launch fiber, at
the wavelength of 1550 nm.
Table 4-3 Propert ies of test fibers
SMF-1 SMF-2 SMF-3
Mode fie ld diameter(MFD)(m) LP 0 1 6 .9 10.4 11.3
LP 1 1 ― ― ―
Effect ive area (m2 ) LP 0 1 36.9 84.4 108.5
LP 1 1 *145.0
rad/m ― ― ― *9400
2 m ― ― ― *333
=1550nm *Calcu lated
The properties of LP 11 mode and ∆ β were estimated value by
using RNFP. Two kinds of SMF which have different mode f ield
diameter (MFD) were used in order to examine the dependence on MFD
of launch fiber. The TMF and SMF were based on a step index profile.
Figure 4-16 shows calculated fie ld distr ibution of TMF for LP 0 1 and
LP11 modes at the wavelength of 1550 nm.
Since the peak of fie ld dist ribution for LP 11 mode is about x = 4
µm, xm i s determined 4 µm. In addition, Nxm for LP 0 1 mode of 0.49 was
obtained from Fig. 4-16. Figure 4-17 shows the experimental se tup for
mode launch measurement. 1550 -nm LD was used as l ight source, and
offset value between TMF and SMF was controlled by fusion spl icer
with micro motion adjustment. Additionally, la rge bend, R 1 was added
to remove leaky mode. When the power under this condition is defined

GI-TMF with Low DMD, Large Aeff and Low Bending Loss 69
as PA, PA is represented by following equation.
1101 PPPA (4-13)
where P01 and P11 were the power of LP 0 1 and LP 11 modes, respect ively.
Next , the power with the other bend, R 2 which was attenuated only LP 11
mode is defined as PB. Since PB equals P 01 , P11 is represented by
following equation
A
BA P
PPlog1011 (4-14)
Therefore , the ratio of LP 0 1 and LP 1 1 modes power to total power, η 01
and η11 are represented by following equat ion
A
B
PPlog1001 (4-15)
A
BA
PPPlog1011 (4-16)

70 Chapter 4
Figure 4-16 Calculated field dist ribution of TMF for LP 01 and LP1 1
modes
Figure 4-17 Experimental setup for mode launching measurement

GI-TMF with Low DMD, Large Aeff and Low Bending Loss 71
4.4.3 Results and Discussion
Calculated parameters were determined following; 1) wavelength
λ = 1550 nm, 2 ) offset value d = 0, 2 , 4 , and 10 µm, 3) MFD of incident
l ight (with Gaussian f ield) 2W = 6.9 and 10.4 µm, 4) propagation step
size ∆ z = 8 µm. BPM calculation was continued unti l η 11 converged.
The power change for LP 11 mode of the similar tendency shown in Fig.
4-15 was obtained at the all offse t values, and the period of the power
change was about 660 µm, which value was in good agreement with
twice coupling length (333 µm) calculated by RNFP. This result also
means expressly that the power for LP 11 mode is included at x = 4 µm
in calculated f ield distr ibution.
Figure 4-18 shows the calculated η 11 as a function of
propagat ion distance at the various offset values. It i s confi rmed that
both results of η11 converged over the distance of 3 -4 mm. An offset
value which is given η 11 to 3 dB, that i s equivalent excitat ion between
LP0 1 and LP 11 modes, is about 2 -4 µm regardless of MFD of incident
l ight and it i s understood that the offse t value correspond to an area
where overlap between each fie ld distribution maximizes. In addition,
at the offset value from 0 to 2 µm, change ratio of η 11 was large. It
means that LP 11 mode may be launched easily even impercept ible offset
value .
Figure 4-19 shows comparison results for mode launch
characteristics between calcula ted and measured values. Solid and
dashed lines were calculated values, ci rcle and t riangular point were
measured values. The calculated values have the compatible properties
with the measured values so that i t i s clari fied that our approach can
estimate mode launch characterist ics. When the same field distribut ion
of LP 01 mode of TMF is input to TMF without offset enti rely, LP 11
mode is not generated theoretically ( η 11 → - ∞ ). However, i t is
considered f rom Fig. 4-19 that when offset value is within 1 µm, mod e

72 Chapter 4
coupling noise (generated LP 11 mode) of more than -20 dB at the splice
point may be generated.
Figure 4-18 Calculated value of η 1 1 as a function of propagation
distance at various offse t values
(a) SMF-1 (2W = 6.9 μm) (b) SMF-2 (2W = 10.4 μm)

GI-TMF with Low DMD, Large Aeff and Low Bending Loss 73
11
(dB
)5
0
-10
-5
0
-15
-20
5
-25
-3010 15 20
Offset value d (m)
CalculatedSMF1SMF2SMF1SMF2
Measured
Figure 4-19 Relationship between the offset value and the exci tation ratio 11

74 Chapter 4
4.5 Conclusions
The optimum fiber design of GI -TMF with a low DMD, large
effective area Ae ff , and low bending loss for LP 11 mode has been
investigated . The suitable fiber parameters for the GI-TMF has been
clarified to be of Δ = 0.36% and α = 2.3 from the area satisfying
requirements that are DMD = 0 ps/km, A e f f of more than 150 μm 2 and
bending loss for LP 11 mode of less than 0.01 dB/km at the wavelength
of 1550 nm. The GI-TMF with Δ = 0.363% and α = 2.29 according to
our fiber design was successfully fabricated . It has been confirmed
experimental ly that the fabricated GI -TMF had a large effective area
Ae f f of 150 μm 2 for LP 0 1 mode, and approximately 0.016 dB/km bending
loss for LP 11 mode a t R = 40 mm and real ized the DMD of less than 36
ps/km including zero in the C -band. It i s expected that our design
GI-TMF is suitable for MDM and has a potential to reduce MIMO -DSP
complexity.
The mode coupling of TMF at the spl ice point s has also been
investigated by using the finite element-beam propagation
method. It has been clar ified that mode coupling noise of more than
-20 dB at the splice point s may be generated when the offset value is
within 1 µm .

Chapter 5
Summaries and Conclusions
This chapter summarizes the results and achievements of this
thesis . The main object of this thesis i s to develop innovative optical
fibers for future ul tra large capacity transmission systems that
overcome the capaci ty l imit of the conventional single -mode f iber and
can accommodate the rapid traffic growth in telecommunication
network. As the main technical challenges of the novel optical fiber, an
innovative optical f iber with a low transmission loss , a large effec t ive
area, a f lexible chromatic dispersion and low bending loss
characteristics have been realized . The author focused on two ways to
realize the novel optical f iber that overcome those chal lenges. As for
one way, a new opt ical fiber has been developed for the optical wiring
util izing the di fferent mechanism to confine light in the core, which is
PCF. As for the other way, few mode optical fiber that has the low DMD
and the low bending loss has been designed and fabricated.
Chapter 2 proposed the PCFs as the novel optical fibers that
overcome the tradeoff between the large effective area and the cutoff
wavelength or the bending loss of the conventional single -mode fiber
util izing refractive index di fference between core and c ladding for

76 Chapter 5
confinement of l ight. Before this study, PCFs had rela tively high
optical attenuation and the fiber length was limited to a few kilometers
compared with that of a convent ional single -mode f iber because of the
complica ted manufacturing process . Therefore, PCFs were considered to
be used for the only special purpose and they were not widely deployed
as t ransmission media . A low loss PCF design to reduce the confinement
loss and the fabrica tion technology for fabricating the long length of
PCF was proposed, and the PCF with a loss of 0 .37 dB/km at 1.55µm
and the fiber length of 10km has been realized. The possibili ty of
reducing optical attenuation of PCF has been also shown by several
trial s for reducing the OH absorpt ion . With these result s, the following
work realized a 100 km-long PCF with a loss of 0 .3 dB/km at 1.55µm. A
dense wavelength division multiplexing (DWDM) t ransmission
experiment has been also shown by using the fabricated PCF.
Chapter 3 proposed a HAPCF with good bending performance
for the optical wiring because the optical fiber is instal led with many
bend and possibly handled like a metall ic wire with small bending
radius by technicians and customers . The optimal design of the HAPCF
has been clar ified and it has been confirmed that only a negligible loss
increase with a bending radius of 10 mm. It has been also shown that
the long-term rel iabili ty of HAPCF can be improved using an
appropriate pre -process. Moreover, i t has been also c lari fied that
connection loss by both conventional fusion splice and mechanical
splice methods to HAPCF were no more than 0.5 dB. Based on the
above results, indoor optical fiber cord with the HAPCF was speci fied
in NTT and had been deployed in indoor optical wiring applications in
many countr ies .
Chapter 4 proposed an optimized GI-TMF as a new multimode
optical fiber that has low DMD and low bending loss. It has been
clarified the suitable fiber parameters for the GI -TMF satisfying
requirements that are DMD = 0 ps/km, A e f f of more than 150 μm 2 and

Summaries and Conclusions 77
bending loss for LP 11 mode of less than 0 .01 dB/km at R = 40 mm and
1550 nm. It has been shown experimentally that the fabrica ted GI -TMF
had a Ae ff of 150 μm2 for LP0 1 mode, and approximately 0.016 dB/km
bending loss for LP 11 mode at R = 40 mm and 1550 nm. The evaluat ion
of mode coupl ing of TMF a t the splice point has been also proposed by
using finite element -beam propagation method. It has been clarif ied that
mode coupl ing noise of more than -20 dB at the splice point may be
generated when offset value is wi thin 1 µm. It has also been clari f ied
that our design of GI -TMF is suitable for MDM and has a potentia l to
reduce MIMO-DSP complexi ty.
The author had been re lated to R&D of opt ical fibers for more
than 30 years since the ini tial deployment of optical fibers to the
telecommunicat ion network in Japan. Research for innovat ive opt ical
fibers for ultra large capaci ty transmission systems that will overcome
the capacity l imit imposed by the combination of Shannon-Hart ley
theorem and nonlinear fiber effects had started util izing the knowledge
and experience of actual deployment . This study clari fied that novel
optical fibers that overcome the limiting factors of convent ional
single -mode fibers wi ll be able to contribute to realize the ultra large
capacity transmission systems to accommodate dramatically increas ing
traffic .

78 Chapter 5
79
Bibliography
[1] F. P. Kapron, D.B. Keck and R.D. Maurer, “Radiation losses in glass
optical waveguide,” Appl . Phys. Lett . , vol. 17, pp. 423 -425, 1970.
[2] K. C. Kao and G. A. Hockham, “Dielectric -fibre surface
waveguides for optical frequencies ,” IEE Proc . Optoelect ron. ,
vol. 133, pp. 1151-1158, 1966.
[3] T. Morioka, “New Generation opt ical infrast ructure technologies :
EXAT initiat ive towards 2020 and beyond, ” Proc . OECC2009, pp.
13-17, 2009.
[4] V. A. Bhagavatula, M. S. Spotz, and W. F. Love, “Dispersion-shifted
segmented-core single -mode fibers,” Opt . let . , vol.9, no. 5, pp.
186-188, 1984.
[5] T. Uenoya, “High-performance single mode optical f iber cable
covering Japan," Japan Tech. Rev., Vol .27, no. 2 , pp. 101-108,
1985.
[6] M. Ohashi, N. Kuwaki , C. Tanaka, N. Uesugi, and Y. Negishi ,
“Bend-optimised dispersion -shifted step-shape-index (SSI) fibres,”
Electron. Lett . , vol . 22, no. 24, pp. 1285 -1286, 1986.
[7] K. Uema, K. Sato, S. Takashima and H. Kasai , “Commercial
introduction results of 1.55 µm dispersion-shifted fiber submarine
cable,” Proc . IWCS '88, Nov. 1988 .
[8] K. Hagimoto, Y. Miyanaga, Y. Miyamoto, M. Ohashi , M. Ohhata, K.
Aida , and K. Nakagawa,” A 10 Gbit /s long -span fiber transmission
experiment employing optical ampli fication technique and
monolithic IC technology,” Trans. IEICE, vol. E73, no. 1 , pp. 27 -30,
1990.
[9] N. Tomita , H. Takasugi, N. Atobe, I. Nakamura, F. Takaesu, and S.
Takashima, “Design and performance of a novel automatic fiber l ine
80
testing system with OTDR for optical subscriber l oops,” J .
Lightwave Technol . , vol. LT-12, no. 5, pp. 717–726, 1994.
[10] N. Tomita , T . Hirahara, K. Hogari , and K. Niimi, “Optical f iber
cable related technologies focused on cost reduction,” NTT Review,
vol. 12, no. 2, pp. 90–99, 2000.
[11] H. Ishihara , F. Takaesu, and K. Sato , “Optical fiber fac ili t ies for
subscriber loops,” IEEE Journal on Selected Areas in
Communicat ions , vol. 4 , no 5, pp.714-718, 1986.
[12] T. A. Birks, P. J . Roberts, P. St. J . Russell , D. M. Atkins, and T. J .
Shepherd, “Full 2 -D photonic bandgaps in sil ica /a ir structures,”
Electron. Lett . , vol . 31, no. 22, pp. 1941-1943, 1995.
[13] R.-J . Essiambre , G. Kramer, P. J . Winzer , G. J . Foschini , and B.
Goebel, “Capacity l imits of optical fiber networks,” J . Lightwave
Technol . , vol. 28, no. 4, pp. 662–701, 2010.
[14] J . C. Knight , T. A. Birks, D. M. Atkin, and P. S. J .P. St. J . Russell ,
“Pure sil ica single -mode fiber with hexagonal photonic crystal
cladding,” Proc. OFC1996, PD3 , 1996.
[15] D. Mogilevtsev, T. A. Birks, and P. S. J .P. St. J . Russ ell ,
“Group-velocity dispersion in photonic crysta l fibers,” Opt . Lett . ,
vol. 23, no. 21, pp. 1662–1664, 1998.
[16] J . C. Knight, T. A. Birks, P. S. J .P. St . J . Russell , and D. M.
Atkin, “All sil ica single -mode opt ical fiber with photonic crystal
cladding,” Opt . Lett . , vol. 21, no. 19, pp. 1547–1549, Oct . 1996.
[17] H. Kubota, K. Suzuki , S. Kawanishi, M. Nakazawa, M. Tanaka,
and M. Fujita, “Low-loss, 2 km-long photonic crystal fiber wi th
zero GVD in the near ir suitable for picosecond pulse propagation
at the 800 nm band,” Proc. CLEO ’01, pp. 635–636, 2001.
[18] K. Tajima, K. Nakajima, K. Kurokawa, N. Yoshizawa, and M.
Ohashi, “Low-loss photonic crysta l fibers,” Proc. OFC2002, ThS3,
pp. 523–524, 2002.
[19] L. Farr, J . C. Knight, B. J . Mangan, and P. J . Ro berts, “Low loss
photonic crystal fiber,” Proc . ECOC2002, PD1.3, 2002.

81
[20] T. P. White, R. C. McPhedran, C. M. de Sterke, L. C. Botten, and
M. J . Steel, “Confinement losses in microst ructured optica l fibers,”
Opt . Let t . , vol. 26, no. 21, pp. 1660–1662, 2001.
[21] K. Tajima, M. Ohashi, K. Shiraki, M. Tateda, and S. Shibata , “Low
Rayleigh scattering P 2O5 -F-SiO2 glasses,” J . Lightwave Technol .,
vol. 10, no. 11, pp. 1532–1535, 1992.
[22] K. Mori , T. Morioka, and M. Saruwatari , “Group velocity
dispersion measurement using supercontinuum picosecond pulses
generated in an optical fiber ,” Electron. Lett . , vol . 29, no. 11, pp.
987–989, 1993.
[23] R. T. Bise, D. J . Trevor, E. Monberg, and F. Dimarcello , “ Impact
of perform fabrication and f iber draw on the optical pro perties of
microstructured fibers,” Proc. IWCS2002, pp. 339 –343, 2002.
[24] T.A. Birks, J .C. Knight, and P. St. J . Russel l , “Endlessly
single-mode photonic crystal fiber,” Opt. Lett . , vol. 22, no. 13,
pp. 961-963, 1997.
[25] A. Ferrando, E. Silvest re, P. Andrés, J . J . Miret , M.V. Andrés,
“Designing the properties of dispersion -flat tened photonic crystal
fibers ,” Opt ics Express, vol. 9 , no. 13, pp. 687-697, 2001.
[26] J .C. Knight , J . Broeng, T.A. Birks, and P. St. J . Russell , “Photonic
band gap guidance in optical fiber,” Science, vol . 282, no. 5387,
pp. 1476-1478, 1998 .
[27] T. A. Birks, P. J . Roberts, P. S. J . Russel l , D. M. Atkin, and T. J .
Shepherd , “Full 2-D photonic bandgaps in sil ica /a ir structures,”
Electron. Lett . , vol . 31, no. 22, pp. 1941-1943, 1995.
[28] T. Hasegawa, E. Sasaoka, M. Oonishi , M. Nishimura ,Y. Tsuji and
M. Koshiba , “Novel hole -assisted lightguide fibers exhibiting large
anomalous dispersion and low loss below 1dB/km ,” Proc . OFC2001,
PD5-1, 2001.
[29] K. Tajima, J . Zhou, K. Nakaj ima, and K. Sato, “Ult ra low loss and
long length photonic crystal fiber,” Proc. OFC2003, pp.
PD1-1-PD1-3, 2003.

82
[30] J . Sakai and T.Kimura, “Bending loss of propagation mode in
arbit rary index profile optica l fibers, ” Appl. Opt ., vol . 17, no. 10,
pp. 1499-1506, 1978.
[31] Y. Mitsunaga, Y. Katsuyama, H. Kobayashi and Y. Ishida, “Fai lure
prediction for long length opt ical fiber based on proof test ing,” J .
Appl. Phys. , vol .53, no.7, pp. 4847-4853, 1982.
[32] Y. Mitsunaga , Y. Katsuyama and Y. Ishida, “Reliabi li ty assurance
for long-length optical fibre based on proof testing ,” Electron.
Lett . , vol. 17, no. 16, pp. 567-571, 1981.
[33] Y. Miyaj ima, “Studies on high-tensile proof tests of optical
fibers ,” J . Lightwave Technol., vol. 1 , no 2. pp. 340-348, 1983.
[34] T. Morioka, Y. Awaji , R. Ryf, P. Winzer, D. Richardson, and F.
Pole tti , “Enhancing optica l communicat ions with brabd new
fibers,” IEEE Communications Magazine , vol . 50, no. 2, pp.
s31-s42, 2012.
[35] R. Ryf, Sebastian Randel, A. H. Gnauck, C. Bolle , A Sierra, S.
Mumtaz, M. Esmaeelpour , E. C. Burrows, R. Essiambre, P.J .
Winzer , D.W.Peckham, A.H. McCurdy, and R.Lingle Jr .,
“Mode-division mult iplexing over 96 km of few-mode f iber using
coherent 6×6 MIMO processing,” J . Lightwave Technol . , vol. 30,
no. 4 , 521-531, 2012.
[36] N. Bai , E. Ip , Y. Huang, E. Mateo, F. Yaman, M. Li , S. Bickham, S.
Ten, J . Liñares, C. Montero, V. Moreno, X. Prie to, V. Tse , K. M.
Chung, A. P. T. Lau, H. Tam, C. Lu, Y. Luo, G. Peng, G. Li, and T.
Wang, “Mode-division mult iplexed t ransmission wi th inline
few-mode fiber amplifier,” Optics Express , vol . 20, no. 3, pp.
2668-2680, 2012.
[37] T. Sakamoto, T. Mori, T Yamamoto, and S Tomita, “Differential
Delay Managed Transmission Line for wide -band WDM-MIMO
System,” Proc . OFC2012, OM2D.1 , 2012.
[38] L. Grüner -Nielsen, Y. Sun, J .W. Nicholson, D. Jakobsen, R. Lingle ,
and B. Palsdottir , “Few mode transmission fiber with low DGD,

83
low mode coupling and low loss,” Proc. OFC2012, PDP5A.1, 2012.
[39] R. Maruyama, N. Kuwaki , S. Matsuo, K. Sato and M. Ohashi ,
“Mode dispersion compensating optical transmission line
composed of two-mode optical f ibers,” Proc . OFC2012, JW2A.13,
2012.
[40] R. Maruyama, M. Ohashi, S. Matsuo, .K. Sato and N. Kuwaki ,
“Novel two-mode optical fiber wi th low DMD and large Aeff for
MIMO processing,” Proc . OECC2012, PDP2-3, 2012.
[41] K. Kitayama, Y. Kato, S. Seikai , and N. Uchida, “Structural
optimization for two-mode fiber : theory and experiment ,” J .
Quantum Elect ron., vol. 17, no. 6, pp. 1057-1063, 1981.
[42] L. G. Cohen, W. L. Mammel, C. Lin, and W.G. French.,
“Propagation characteristics of double-mode fibers,” The Bel l
System Technical Journal , vol . 59, no. 6, pp. 1061 -1072, 1980.
[43] M. Ohashi, N. Kuwaki, C. Tanaka, N.Uesugi and Y.Negishi ,
“Bend-optimized dispersion -shif ted step-shaped-index (SSI)
fibres,” Electron. Lett . , vol. 22, no. 24, pp. 1285-1286, 1986 .
[44] K. Saitoh, and M. Koshiba, “Full -vectoria l imaginary-distance
beam propagation method based on a fini te element scheme :
applicat ion to photonic crystal fibers,” J . Quantum Elect ron ., vol .
38, no. 7, pp. 927-933, 2002.
[45] Sakai and H. Niiro, “Confinement loss evaluation based on a
multilayer division method in Bragg fibers,” Opt ics Express , vol .
16, no. 13, pp. 1885-1902, 2008.
[46] K. I. White , “Practical application of refracted near -field technique
for measurement of optical fiber refractive index profile, ” Opt .
Quantum Elect ron., vol. 11, no. 2, pp. 185 -196, 1979.
[47] Z. Haas and M. A. Santoro, “Lightwave transmission system using
selected optica l modes,” US Patent no. 44318, 1993.
[48] L. Raddatz, I. H. White , D. G. Cunningham, and M. C. Nowell,
“Increasing the bandwidth -distance product of multimode fiber
using offset launch,” Elect ron. Let t . , vol . 33, pp. 232– 233, 1997.
84
[49] L. Raddatz, I. H. White , D. G. Cunningham, and M. C. Nowell,
“An experimental and theoretical study of the offset launch
technique for the enhancement of the bandwidth of multimode
fiber l inks,” J . Lightwave Technol., vol . 16, no. 3 , pp.324 -331,
1998.
[50] IEC60793-1-44
[51] N. Shibata, M. Tateda, S. Seikai , and N. Uchida, “Spatial
technique for measuring modal delay di fferences in a dual -mode
optical fiber ,” Appl. Opt . , vol . 19, no. 9, pp. 1489-1492, 1980.
[52] CV.A.J.M. Slei ffer, Y. Jung, V. Veljanovski , R.G.H. van Uden, M.
Kuschnerov, Q. Kang, L. Grüner -Nielsen , Y. Sun, D.J. Richardson,
S. Alam, F. Poletti , J .K. Sahu, A. Dhar, H. Chen, B. Inan, A.M.J.
Koonen, B. Corbett , R. Winfield, A.D. Ell is , and H. de Waardt ,
“73.7 Tb/s (96x3x256 -Gb/s) mode-division-mult iplexed
DP-16QAM transmission wi th inline MM-EDFA,” Proc. ECOC2012,
Th.3.C.4, 2012.
[53] N. Bai , E. Ip , Y. Huang, E. Mateo, F. Yaman, M. Li , S. Bickham, S.
Ten, J . Liñares, C. Montero, V. Moreno, X. Prieto, V. Tse, K. Man
Chung, A. Lau, H. Tam, C. Lu, Y. Luo, G. Peng, G. Li, T . Wang,
“Mode-division multiplexed t ransmission with inline few -mode
fiber amplifier ,” Opt. Express, vol . 20, no. 3, pp. 2668-2680, 2012.
[54] R. Ryf, A. Gnauck, M. Mestre , C. Schmidt, R. Essiambre , P.
Winzer , R. Delbue, P. Pupalaikis , A. Sureka, Y Sun, X. Jiang, R.
Lingle , “Mode-Multiplexed 6×20-GBd QPSK Transmission over
1200-km DGD-compensated Few-Mode Fiber ,” Proc.
OFC/NFOEC2012, PDP5C.5, 2012.
[55] T. Sakamoto, T. Mori , T. Yamamoto, S. Tomita , “Differential
mode delay managed t ransmission line for wide-band WDM-MIMO
system,” Proc. OFC/NFOEC2012, OM2D.1, 2012.
[56] M. Li , B. Hoover , S. Li , S. Bickham, S. Ten, E. Ip , Y. Huang, E.
Mateo, Y. Shao, and T. Wang , “Low delay and large effect ive area
few-mode fibers for mode-division mul tiplexing,” Proc. OECC2012,

85
5C3-2, 2012.
[57] R. Maruyama, N. Kuwaki, S. Matsuo, K. Sato, and M. Ohashi ,
“DMD free transmission l ine composed of TMFs with large
effective area for MIMO processing,” Proc. ECOC 2012, Tu.1.F.2,
2012.
[58] L. Raddatz, I.H. White, D.G. Cunningham, M.C. Nowell , “An
experimental and theoretical study of the offse t launch technique
for the enhancement of the bandwidth of mult imode f iber l inks,” J .
Lightwave Technol. , vol. 16, no. 3 , pp. 324-331, 1998.
[59] A. Amphawan, F. Payne, D. O'Brien, N. Shah, “Derivation of an
analytical expression for the power coupling coeffic ient for offse t
launch into multimode fiber ,” J . Lightwave Technol . , vol . 28, NO.
6, pp. 861-869, 2010.

86

87
Acknowledgements
The author would like to express sincere thanks to Prof.
Masaharu Ohashi for his many valuable advices and cont inuous
encouragement to summarize this study.
The auther a lso would like to thank Prof . Katsumi Yamashita,
and Prof . Makoto Yamada for their valuable guidance during my
Universit y years.
Fi rst half of this study had been condu cted on Access Network
Service Systems Laboratories, Nippon Telegraph and Telephone
Cooperat ion. The author grateful ly thanks to Mr. Hidetoshi Shirakawa,
Mr. Noboru Sato and Mr. Hiromichi Shinohara who provide the author
with opportunities to be engaged in this study.
To progress this study, the author had been provided useful
advices and discussions from Dr. Shigeru Tomita, Dr. Izumi Sankawa,
Dr. Katsusuke Taj ima, Dr. Kazuo Hogari , Dr. Kazuhide Nakajima and
Mr. Jian Zhou. They should be a lso acknowledged.
Second half of this study has been conducted on Fujikura Ltd.
The author gratefully thanks to Mr. Hideo Suzuki , Mr. Noboru
Sugiyama, Mr. Takashi Sato, Mr. Yoshikazu Nomura and Mr. Yoichi
Nagahama who provide the author with opportunities to be engaged in
this study.
The author also grateful ly thanks Dr. Nobuo Kuwaki , Dr.
Shoichiro Matsuo and Mr. Ryo Maruyama, as the collaborators of this
study, who has been supported experiments and calculations and
provided useful advices and discussions.
The author thanks again to all the people to help the author to

88
progress and summarize this paper.

89
List of Figures
Figure 1-1 Typical index profile, optical loss and chromatic dispersi on
characteristics of the dispersion-shifted optical fiber
Figure 1-2 Access network configuration
Figure 1-3 Technical issues for optical fibers
Figure 1-4 Study items of doctoral thesis
Figure 2-1 Loss spectrum of fabricated low-loss PCF
Figure 2-2 Chromatic dispersion characteristics of fabricated low-loss PCF
Figure 2-3 Loss spectra of low loss and conventional PCFs
Figure 2-4 Loss spectra of low OH absorption and conventional PCFs
Figure 2-5 DWDM transmission experiment set up
Figure 2-6 BER measurement result of DWDM transmission experiment
Figure 3-1 Indoor optical wiring configuration
Figure 3-2 Construction of HAPCF
Figure 3-3 Near field pattern
Figure 3-4 Calculated bending loss
Figure 3-5 Measured bending loss
Figure 3-6 Predicted lifetime of fiber
Figure 3-7 Fusion splice loss
Figure 3-8 Mechanical splice loss
Figure 4-1 Refractive index profile of the graded index fiber
Figure 4-2 DMD characteristics of GI at 1550 nm
Figure 4-3 Maximum value of DMD for α over the entire C band
Figure 4-4 Relationship between Δ and bending loss for LP11 mode at 1550 nm
as a function of α
Figure 4-5 Relationship between Δ and of Aeff for LP01 at 1550 nm as a
function of α
Figure 4-6 Region satisfying our requirements (DMD=0 at 1550 nm, A eff ≥ 150
μm2 for LP01 and bending loss for LP11 ≤ 0.01 dB/km at R = 40

90
mm)
Figure 4-7 Refractive index profile of fabricated GI-TMF measured by RNFP.
Figure 4-8 Measured spectral loss in bending method
Figure 4-9 Experimental setup of bending loss for LP11 mode measurement
Figure 4-10 Measured result of bending loss for LP11 at the radius of 15, 17
and 20 mm
Figure 4-11 Experimental setup of DMD measurement
Figure 4-12 Interference spectrum of GI-TMF at 100 m
Figure 4-13 Absolute DMD property as a function of wavelength
Figure 4-14 Element division profile
Figure 4-15 LP01 and LP11 modes power as a function of propagated distance
Figure 4-16 Calculated field distribution of TMF for LP01 and LP11
Figure 4-17 Experimental setup for mode launching measurement
Figure 4-18 Calculated value of η11 as a function of propagation distance at
various offset values (a) SMF-1 (2W = 6.9 μm) (b) SMF-2 (2W =
10.4 μm)
Figure 4-19 Relationship between the offset value and the excitation ratio η11

91
List of Tables
Table 2-1 Comparison of loss components
Table 3-1 Requirements for indoor wiring
Table 3-2 Photonic crystal fiber
Table 3-3 Strain components in optical fiber
Table 4-1 Structural parameters of the fabricated GI-TMF
Table 4-2 Optical properties of fabricated GI -TMF at λ = 1550 nm
Table 4-3 Properties of test fibers

92
93
List of Acronyms
Ae f f : e ffect ive area
BER: bit -error rate
DAC: dual shape core
DCF: dispersion compensating f iber
DMD: di fferentia l modal group delay
DSF: dispersion-shift fiber
DSP: digital signal processing
DWDM: dense wavelength division multiplexing
FE-BPM: finite element -beam propagation method
FEM: finite element method
FMF: few-mode fiber
FTM: fiber termination module
FTTH: fiber to the home
GI: graded index
HAPCF: hole assisted type PCF
IDM: integrated distribution module
IGPCF: index guiding type PCF
INS: information network system
LD: laser diode
LED: light emitting diode
LP: l inear polarisation
MDM: mode division mult iplexing
MFD: mode field diameter
MIMO: multi -input multi -output
MMF: multimode fiber
NRZ: non return -to-zero
NTT: Nippon Telegraph and Telephone Public Corporation
Nippon Telegraph and Telephone Corporation from 1985
ONU: optical network unit

94
OTDR: optical t ime domain reflectometry
PBGF: photonic band-gap type PCF
PCF: photonic crysta l f iber
PM: power meter
R&D: research and development
RNFP: refractive near field pattern
SDH: synchronous digital hierarchy
SMF: single-mode fiber
SNR: signal to noise ratio
TIR: total internal reflection
TMF: two mode fiber
VAD: vapor phase axial deposition
VI&P: visual, intell igent & personal
WDM: wave division multiplexing