Embed Size (px)
Citation preview
1
A STUDY ON IMPACT OF VALUE ADDED TAX (VAT) IMPLEMENTATION IN INDIA
DR.A.JAYAKUMAR., Ph.D
Associate Professor and Former Controller of Examinations Department of commerce
Periyar University Salem636011.
e.mail: [email protected]
2
ABSTRACT
Value added tax (VAT) is a type of indirect tax that is imposed on goods and services. Sometimes, when the government operates on a budget surplus or wants to increase its revenue in order to finance its budget deficit. A question that arises is whether value added tax has been a boon or misery for a developing country like India. Around 136 countries in Asia have recognized the importance of value added tax. In one of the most large scale reforms of the country’s public finances in over the past 50 years, India has finally agreed the launch of its much delayed value added tax from 1st April, 2005 at a rate of 12.5%. The tax rate is fixed by meeting of different state level Finance Minister, in New Delhi, designed to make accounting more transparent, to cut short trade barriers and boost tax revenues. According to Chanakya, “A government should tax its people like a shepherd shears a flock or a bee gets nectar from a flower”. The tax is levied not only on products but services that is the source of revenue for the government to plan for development activities in the country. Since, India is a developing country, the main source for revenue is generated through tax levied on the individual on the purchase of goods or services. The government imposes taxes and duty charges on the fellow people for fulfilling the infrastructural, technological, entrepreneurial demand of the country. Whether the imposition of high tax on the society is favorable or unfavorable in the present scenario to meet the technological and infrastructural demand? It has been identified that rural people are charged more tax than urban people due to subsidized rate provided to them in food products, transportation, electricity, water etc. for these facilities they are charged indirectly from their source of income like agricultural and allied activities. The question that arises is: do value added taxes promote prosperity and well being for the common men? VAT is omnipresent in all goods and services provided to the consumer. The paper aims at presenting the importance of value added tax in the Indian society, its impact and the future prospect for product and service industry in India. The data collected is secondary based from the governmental publications and standard for chartered accountants. Keywords: Value added taxes levied, socio-economic effects, implementations of tax, Indian society, and calculation of value added taxes.
3
1. INTRODUCTION
Indirect tax system plays an important role in the economic development of a country by influencing the rate of production and consumption. The Government of India has after committing to the World Trade Organization (WTO) regime, decided to modernize and streamline its indirect taxation, in the light of the experience of other WTO member countries. Value Added Tax (VAT) means the tax which is payable only on value-added. It is multi-point tax system but without the effect of double taxation. Value is added to the products, which an organisation buys from other organisations such as raw materials, partly finished goods etc. After buying the organisation applies its own labour and machine to manufacture the final products. VAT is a tax, which is imposed at every stage of production ie., from production level to retail level. Under VAT tax is calculated on value Added where value added is the difference between sales value and purchase value. The VAT as a system of tax, conceptually, has been of great interest among the early writers in public finance. In this research, project researcher try to explain the concept of VAT, their procedures, challenges among the Indian environment and opportunities, which are available under this regime. Initially, all states were to move to VAT system by 2000, but administrative problems and concern over the revenue implications of the change delayed the scheduled implementation. It was postponed five times before implementation. In fact, introduction of a full fledged VAT in India seem to present numerous administrative and constitutional difficulties, including the vexed question of Union-State relations. In addition to this, implementing VAT in India in context of economic reforms has paradoxical dimensions. On one hand economic reforms have led to more decentralization of expenditure responsibilities which in turn demands more decentralization of revenue raising powers if fiscal accountability is to be maintained. But on the other hand, the process of implementation of VAT can lead not only to revenue loss for the states but can also steal away the states‟ autonomy indicating more centralization. Thus, the need is to develop such a „Federal Friendly Model‟ of VAT (along with a suitable compensation package) that can be implemented in India without compromising federal principles.
2. STATEMENT OF THE PROBLEM
In today‟s world of rapidly changing technology, wholesale trade firms are essential to the economy, by channel of distribution. To meet this changing environment, the wholesalers sell the products to be used primarily for resale or for industrial use with the current Value Added Tax scheme. The study is focused on impact of value added among the wholesalers, Retailers, chartered accountant, Tax officials and consumers in India. The common objective of Value Added Tax is to simplify tax structure, to create uniform common market within the country which will bring down prices that would enable the producers of goods to reduce costs, face competition from abroad and to increase exports. Value Added Tax will help common people, traders and also the government.
4
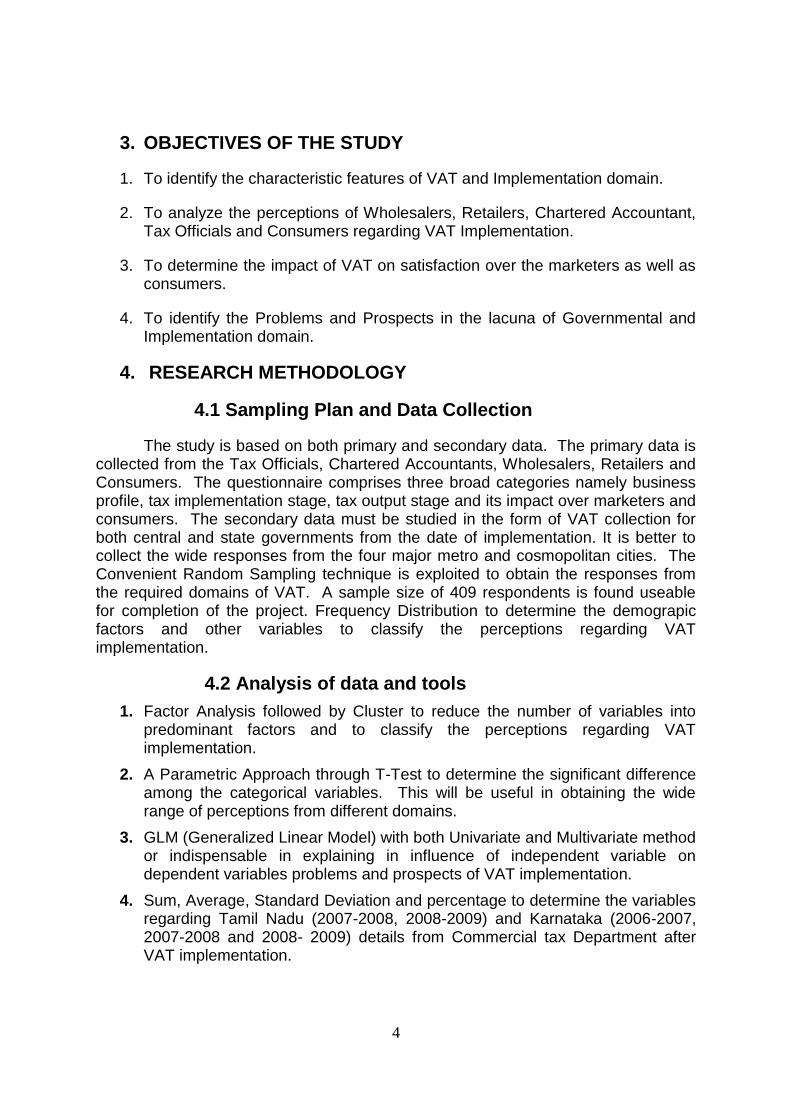
3. OBJECTIVES OF THE STUDY
1. To identify the characteristic features of VAT and Implementation domain.
2. To analyze the perceptions of Wholesalers, Retailers, Chartered Accountant, Tax Officials and Consumers regarding VAT Implementation.
3. To determine the impact of VAT on satisfaction over the marketers as well as consumers.
4. To identify the Problems and Prospects in the lacuna of Governmental and Implementation domain.
4. RESEARCH METHODOLOGY
4.1 Sampling Plan and Data Collection
The study is based on both primary and secondary data. The primary data is collected from the Tax Officials, Chartered Accountants, Wholesalers, Retailers and Consumers. The questionnaire comprises three broad categories namely business profile, tax implementation stage, tax output stage and its impact over marketers and consumers. The secondary data must be studied in the form of VAT collection for both central and state governments from the date of implementation. It is better to collect the wide responses from the four major metro and cosmopolitan cities. The Convenient Random Sampling technique is exploited to obtain the responses from the required domains of VAT. A sample size of 409 respondents is found useable for completion of the project. Frequency Distribution to determine the demograpic factors and other variables to classify the perceptions regarding VAT implementation.
4.2 Analysis of data and tools
1. Factor Analysis followed by Cluster to reduce the number of variables into predominant factors and to classify the perceptions regarding VAT implementation.
2. A Parametric Approach through T-Test to determine the significant difference among the categorical variables. This will be useful in obtaining the wide range of perceptions from different domains.
3. GLM (Generalized Linear Model) with both Univariate and Multivariate method or indispensable in explaining in influence of independent variable on dependent variables problems and prospects of VAT implementation.
4. Sum, Average, Standard Deviation and percentage to determine the variables regarding Tamil Nadu (2007-2008, 2008-2009) and Karnataka (2006-2007, 2007-2008 and 2008- 2009) details from Commercial tax Department after VAT implementation.
5
5. LIMITATIONS OF THE STUDY
1. The study was restricted to Tamil Nadu and Karnataka only.
2. Respondent‟s views and opinion may hold good for the time being and may vary in the future.
3. After Implementation of Value added tax data only taken for this study for Tamil Nadu (2007-2008 and 2008-2009) and Karnataka (2006-2007, 2007-2008 and 2008-2009).
6. REVIEW OF LITERATURE
Gurumurthi.S (1999) in his study outlined the experience gained in several federal economies, irrespective of the fact whether they are developed or developing, has established fairly beyond doubt the undesirability of subjecting commodity taxation to two levels, the federal and provincial, particularly in the context of introducing the VAT. While it is considered necessary to entrust the entire field of commodity taxation to the national government which is best equipped to implement the VAT, the redistribution of the powers of taxation between the central/federal government and the states will depend on the situation and circumstances prevailing in each country and that no generalization may be possible with regard to assignment of specific taxes to the states. International experience has shown that both personal and corporate income taxes are good candidates for partial assignment, particularly in large federations but the same cannot be said about a tax like the one on natural resources. Similarly, while property taxes have been traditionally assigned only to the sub national governments, the system is somewhat different in Brazil, where urban property is taxed at the municipal level, while the federal government levies and administers the tax on rural property. Therefore it may be necessary for each federal country to evolve its own system by applying the above principles.
Sukumar Mukhopadhyay (2001) in his study neutrality of VAT is no great virtue, that cascading effect can be removed zero-rating can be achieved by alternative methods, that VAT does not boost exports, we should reconsider the adoption of VAT even by promising a subsidy is an “ad hoc stepping stone to doom”. Genuine tax reforms are (a) three rates of duty in Central Excise, (b) three rates in retail sales tax, (c) reduction in exemptions drastically in excise and sales tax, (d) uniformity of sales tax floor rates, (e) reduction and ultimate removal of CST, (g) origin-based sales tax for inter-state sales, (h) giving more service tax to states by common consent, and (i) introduction of a proper audit set up. All this will constitute a much better reform.
Sukumar Mukhopadhyay (2003) in his study (a) VAT is not the best form of contention tax, especially in a development economy; (b) It is not suited for Indian federal. (c) An imperfect VAT would not serve the purpose for which VAT is better introduced; and (d) a better choice would be to combination of reformed CENVAT sales tax with uniform rates in all reduction in exemption CST.

6
K.Narayana (2005) in his study the state empower committee in India is planning to introduce VAT system at state level from 1st April 2005. As many as 21 states have reiterated their commitment to introduce value added tax (VAT) to replace sales tax from 1st April 2005. The remaining states i.e., U.P., tamilnadu and five other BJP ruled states have expressed their apprehension about the efficacy and revenue loss by introducing VAT. The VAT system of taxation does not encourage vertical integration of firms as it is independent of number of stages in the production and distribution channel. The experiences of many developing countries have shown that if properly designed and implemented the VAT may prove a better resources mobilizer than the present sales tax systems. The apprehensions of the 7 states are illogical and political rather than genuine economic reason.
Dr.S.B.Akash and Dr.K.Harishkumar (2006) in their study credit to recover the tax paid on their business inputs. As a result, the system is an effect applying tax only to the Value Added by each vendor. Since, only the tax that does not refund is the tax imposed on final consumption the tax is equivalent to the retail sales tax where value and purchase value. He concludes VAT is not burden to the manufacturer and it facilitates concession to manufacturer and it facilitates concession to manufacturer in an easier manner. The successes of value added system fully depends upon proper planning and preparation, sound accounting practices, systematic organizational audit, fully acceptance of people, trained manpower, sound ethical business practices in business and ethical government representatives.
7. THE IMPACT OF VAT IN INDIA
VAT is most certainly a more transparent and accurate system of taxation. The existing sales tax structure allows for double taxation thereby cascading the tax burden. For example, before a commodity is produced, inputs are first taxed, the produced commodity is then taxed and finally at the time of sale, the entire commodity is taxed once again. By taxing the commodity multiple times, it has in effect increased the cost of the goods and therefore the price the end consumer will pay for it. The transaction chain under VAT assuming that a profit of Rs 10 is retained during each sale.
TABLE NO.1
VAT CHAIN FOR SALE
SALE 'A' OF CHENNAI @ Rs. 100/-
„B‟ OF BANGALORE
SALE @ RS.114
„C‟ OF BANGALORE
SALE @RS.124/-
„D‟ OF BANGALORE
SALE @ Rs. 134/-
CONSUMER IN BANGALORE
7
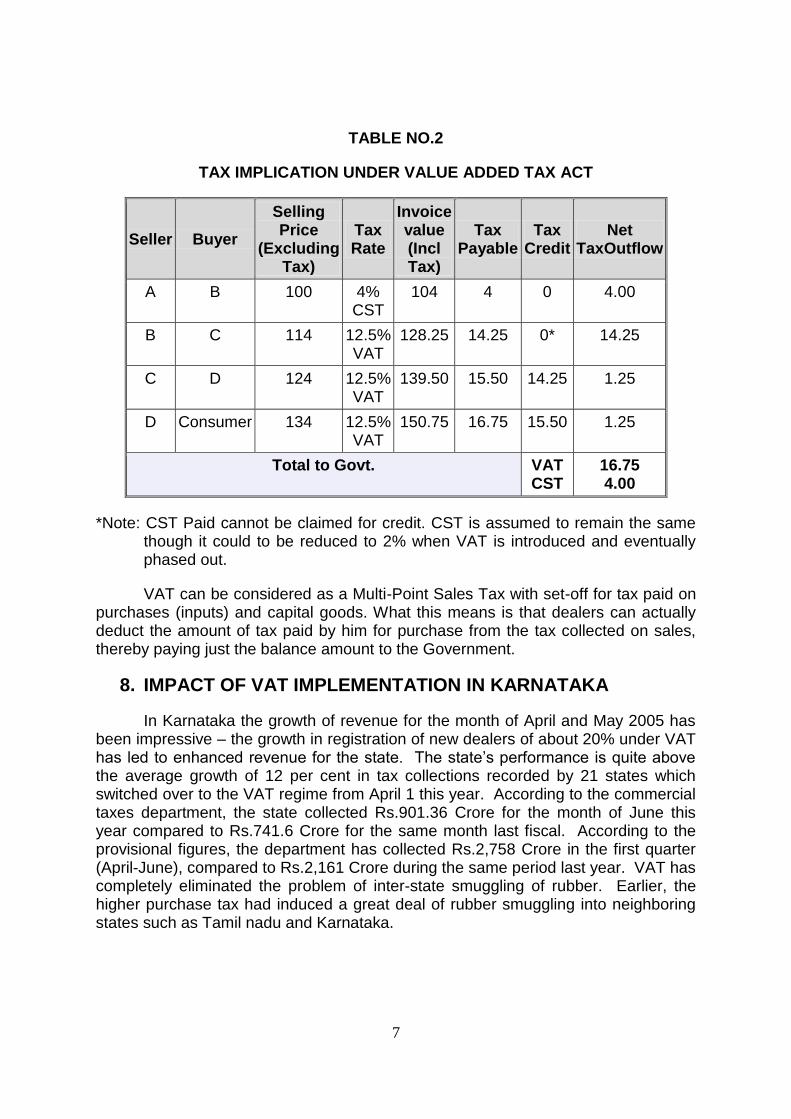
TABLE NO.2
TAX IMPLICATION UNDER VALUE ADDED TAX ACT
Seller Buyer
Selling Price
(Excluding Tax)
Tax Rate
Invoice value (Incl Tax)
Tax Payable
Tax Credit
Net TaxOutflow
A B 100 4% CST
104 4 0 4.00
B C 114 12.5% VAT
128.25 14.25 0* 14.25
C D 124 12.5% VAT
139.50 15.50 14.25 1.25
D Consumer 134 12.5% VAT
150.75 16.75 15.50 1.25
Total to Govt. VAT CST
16.75 4.00
*Note: CST Paid cannot be claimed for credit. CST is assumed to remain the same though it could to be reduced to 2% when VAT is introduced and eventually phased out.
VAT can be considered as a Multi-Point Sales Tax with set-off for tax paid on purchases (inputs) and capital goods. What this means is that dealers can actually deduct the amount of tax paid by him for purchase from the tax collected on sales, thereby paying just the balance amount to the Government.
8. IMPACT OF VAT IMPLEMENTATION IN KARNATAKA
In Karnataka the growth of revenue for the month of April and May 2005 has been impressive – the growth in registration of new dealers of about 20% under VAT has led to enhanced revenue for the state. The state‟s performance is quite above the average growth of 12 per cent in tax collections recorded by 21 states which switched over to the VAT regime from April 1 this year. According to the commercial taxes department, the state collected Rs.901.36 Crore for the month of June this year compared to Rs.741.6 Crore for the same month last fiscal. According to the provisional figures, the department has collected Rs.2,758 Crore in the first quarter (April-June), compared to Rs.2,161 Crore during the same period last year. VAT has completely eliminated the problem of inter-state smuggling of rubber. Earlier, the higher purchase tax had induced a great deal of rubber smuggling into neighboring states such as Tamil nadu and Karnataka.
8
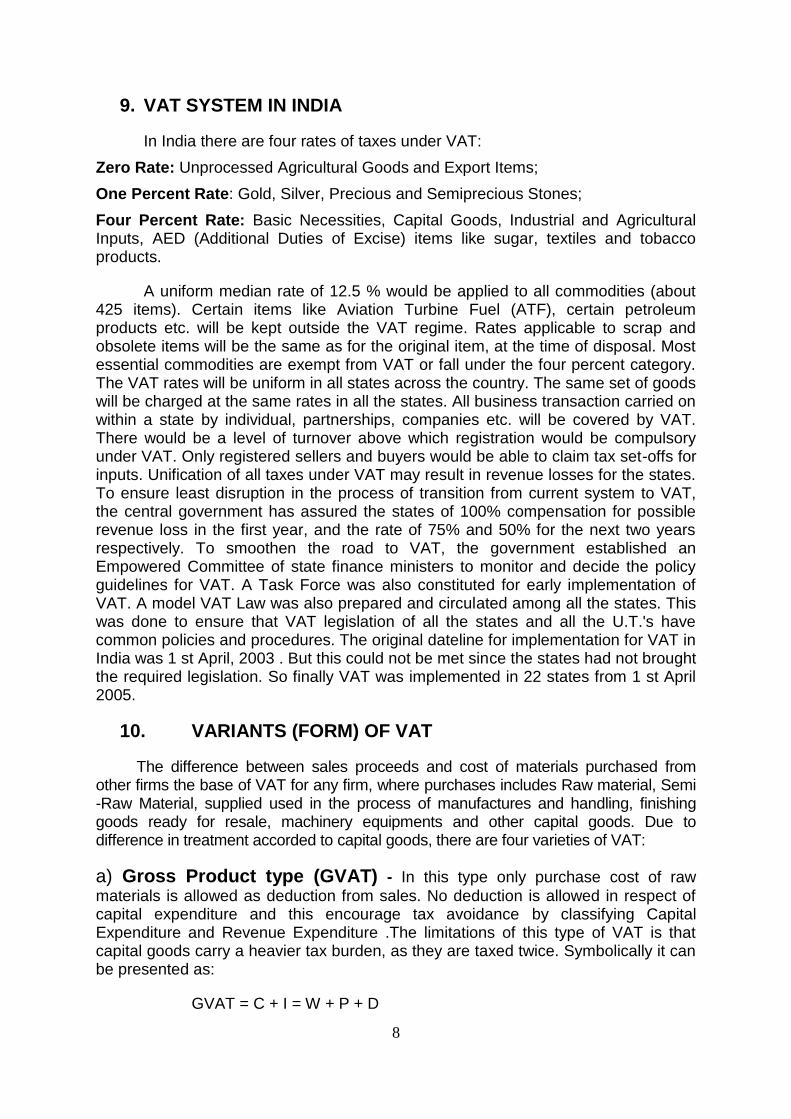
9. VAT SYSTEM IN INDIA
In India there are four rates of taxes under VAT:
Zero Rate: Unprocessed Agricultural Goods and Export Items;
One Percent Rate: Gold, Silver, Precious and Semiprecious Stones;
Four Percent Rate: Basic Necessities, Capital Goods, Industrial and Agricultural Inputs, AED (Additional Duties of Excise) items like sugar, textiles and tobacco products.
A uniform median rate of 12.5 % would be applied to all commodities (about 425 items). Certain items like Aviation Turbine Fuel (ATF), certain petroleum products etc. will be kept outside the VAT regime. Rates applicable to scrap and obsolete items will be the same as for the original item, at the time of disposal. Most essential commodities are exempt from VAT or fall under the four percent category. The VAT rates will be uniform in all states across the country. The same set of goods will be charged at the same rates in all the states. All business transaction carried on within a state by individual, partnerships, companies etc. will be covered by VAT. There would be a level of turnover above which registration would be compulsory under VAT. Only registered sellers and buyers would be able to claim tax set-offs for inputs. Unification of all taxes under VAT may result in revenue losses for the states. To ensure least disruption in the process of transition from current system to VAT, the central government has assured the states of 100% compensation for possible revenue loss in the first year, and the rate of 75% and 50% for the next two years respectively. To smoothen the road to VAT, the government established an Empowered Committee of state finance ministers to monitor and decide the policy guidelines for VAT. A Task Force was also constituted for early implementation of VAT. A model VAT Law was also prepared and circulated among all the states. This was done to ensure that VAT legislation of all the states and all the U.T.'s have common policies and procedures. The original dateline for implementation for VAT in India was 1 st April, 2003 . But this could not be met since the states had not brought the required legislation. So finally VAT was implemented in 22 states from 1 st April 2005.
10. VARIANTS (FORM) OF VAT
The difference between sales proceeds and cost of materials purchased from other firms the base of VAT for any firm, where purchases includes Raw material, Semi -Raw Material, supplied used in the process of manufactures and handling, finishing goods ready for resale, machinery equipments and other capital goods. Due to difference in treatment accorded to capital goods, there are four varieties of VAT:
a) Gross Product type (GVAT) - In this type only purchase cost of raw
materials is allowed as deduction from sales. No deduction is allowed in respect of capital expenditure and this encourage tax avoidance by classifying Capital Expenditure and Revenue Expenditure .The limitations of this type of VAT is that capital goods carry a heavier tax burden, as they are taxed twice. Symbolically it can be presented as:
GVAT = C + I = W + P + D
9
Where C is Consumption, I is Investment and W,P and C are Wages, Profits (after depreciation) and Depreciation, respectively.
b) Income type (IVAT) - Here both purchase cost of raw material and
depreciation will be allowed as deduction from sales. Symbolically it can be presented as:
IV A T=C+I.D=W+P
c) Wages type (WVAT) - This wage type VAT belongs to capital exemption
type of Value Added Taxes .It exempts either income from value added in producing the capital goods .It is also termed as investment earnings inclusion type of VAT. The important limitations of this type of VAT are that labour alone has to bear the entire burden of tax because of its regressively. Symbolically it can be presented as:
Yf-p= C+1-D-P=W
Where Yf = Net national income as a reward to factors of production
d) Consumption type (CVAT) - In this type of case all business purchase
including capital items are deducted in order to determine value added. Consumption type VAT is very popular and is adopted by most of the countries due to the following reasons: (1) It makes no clearance between capital intensive and labour intensive activities. (2) By making classification between capital goods purchases and revenue purchase tax avoidance can be avoided.(3) On account of credit method administration control becomes easy and quick. (4) Tax burden is always at the final stage e.g. at the consumption stage. Symbolically it can be presented as:
CVAT=W+P+D.I
11. PROBLEMS OF IMPLEMENTATION OF VALUE ADDED TAX IN INDIA
In this study it is found that there are number of problems to introduce Value Added Tax on commodities in different states in India, but in this paper only major problems have been taken which are facing by different states for imposing of VAT, as follows:
Billing: The main problem of VAT is billing because billing is essential for traders to get the rebate on inputs. Without billing it is difficult to get rebate on inputs .The billing of the commodities must be a separate entry of basic price and sales tax, so therefore traders gets the rebates but it is very difficult for the traders to pass the separate entry of basic price and sales tax.
Lack of Uniformity: In India there are number of state which had already implemented VAT, but some state are not agreed to impose VAT in their state. In this situation it is very difficult for inter- state transactions of the commodities, because those states, which are not implementing, VAT in their state they prefer to buy goods from those state that are not implementing VAT.

10
Concession for New Industry: Central Government announced concession for new Industries, which are to be established in rural areas. After establishment of industries in rural areas government does not given any concession for such an industries. Practically government does not make any provision for concession of such an industry. Government announced concession for new industries only in Air not in practically.
Number of Taxes imposed by the Government: The main problem of Value Added Tax are other taxes which are imposed by the State Government due to economic problems of the state. Although traders are ready to pay VAT but they are having demand that government should remove other taxes i.e. Entry tax, Octori, Toll tax, Local body tax etc.
Lack of infrastructure facilities: In VAT billing is essential for the traders but it is difficult to maintain the infrastructure, computers, etc. facilities for the same. In rural areas and even in urban areas do not have such sufficient infrastructure facilities because India is a developing country and have a scarcity of finance and technology etc.
Dealing in Variety of Goods: Most of the traders in India deals in variety of goods in their shops. Different commodity has different VAT rates. In that situation it is very difficult for a traders to maintain billing on VAT on their goods, for example a trader deals consumables items as well as durable items in their shop, a consumer purchase one item of both the Variety of both the items have separate rate of VAT in that situation it is very difficult in billing of VAT.
12. EVALUATION OF VALUE ADDED TAX IN INDIA
Value Added Tax is a tax on consumption. It is a multipoint levy collected in installments at each stage of production and distribution .The final and total burden of this tax is borne by the domestic consumers of goods and services. Being a tax on domestic consumption on VAT is charged on goods exported from the country. Value Added Tax is levied on the sellers of goods and services based on value added by their respective units. The base for VAT is determined by Value added at a particular stage of production or distributions .In other words inputs of a firm are not taxed at each point the firm is reimbursed the tax which it has already paid at the time of purchasing the inputs, thus there is no cascading effect.
Indirect system plays an important role in the economic development of a country by influencing the rate of production and consumption. The Government of India has after committing to the World Trade Organisation (WTO) regime, decided to modernize and streamline its indirect taxation, in the light of the experience of other WTO member countries. The government has availed of the services of the international management-consulting firm Authur Andersen for drafting of Rules, Procedures and Forms for introduction of VAT. Value Added Tax is prevalent in over 120 countries .In India, introduction of VAT would be a historic reforms of the domestic trade tax system. It is expected to facilitate the State and Union Territories to transit successfully from the Sellers, while sales tax system to a modern domestic tax system.
11
13. EFFECTIVENESS OF VAT ON CONSUMERS
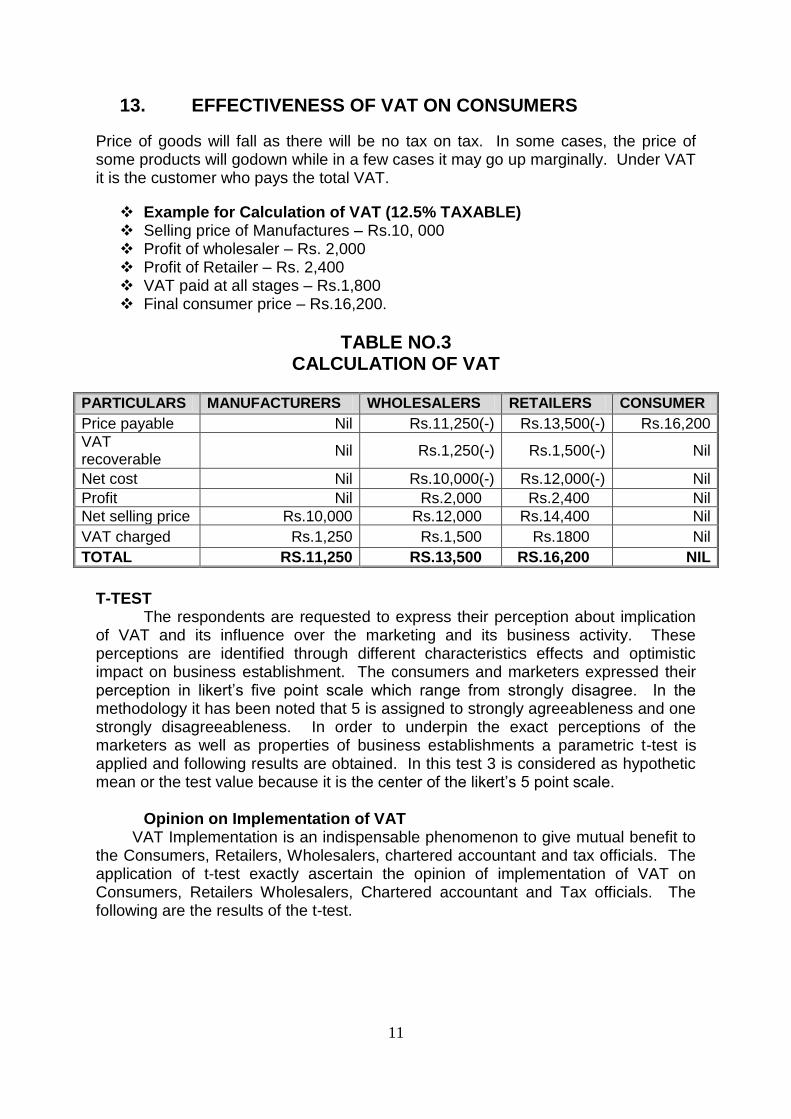
Price of goods will fall as there will be no tax on tax. In some cases, the price of some products will godown while in a few cases it may go up marginally. Under VAT it is the customer who pays the total VAT.
Example for Calculation of VAT (12.5% TAXABLE) Selling price of Manufactures – Rs.10, 000 Profit of wholesaler – Rs. 2,000 Profit of Retailer – Rs. 2,400 VAT paid at all stages – Rs.1,800 Final consumer price – Rs.16,200.
TABLE NO.3 CALCULATION OF VAT
PARTICULARS MANUFACTURERS WHOLESALERS RETAILERS CONSUMER
Price payable Nil Rs.11,250(-) Rs.13,500(-) Rs.16,200
VAT recoverable
Nil Rs.1,250(-) Rs.1,500(-) Nil
Net cost Nil Rs.10,000(-) Rs.12,000(-) Nil
Profit Nil Rs.2,000 Rs.2,400 Nil
Net selling price Rs.10,000 Rs.12,000 Rs.14,400 Nil
VAT charged Rs.1,250 Rs.1,500 Rs.1800 Nil
TOTAL RS.11,250 RS.13,500 RS.16,200 NIL
T-TEST
The respondents are requested to express their perception about implication of VAT and its influence over the marketing and its business activity. These perceptions are identified through different characteristics effects and optimistic impact on business establishment. The consumers and marketers expressed their perception in likert‟s five point scale which range from strongly disagree. In the methodology it has been noted that 5 is assigned to strongly agreeableness and one strongly disagreeableness. In order to underpin the exact perceptions of the marketers as well as properties of business establishments a parametric t-test is applied and following results are obtained. In this test 3 is considered as hypothetic mean or the test value because it is the center of the likert‟s 5 point scale.
Opinion on Implementation of VAT
VAT Implementation is an indispensable phenomenon to give mutual benefit to the Consumers, Retailers, Wholesalers, chartered accountant and tax officials. The application of t-test exactly ascertain the opinion of implementation of VAT on Consumers, Retailers Wholesalers, Chartered accountant and Tax officials. The following are the results of the t-test.
12
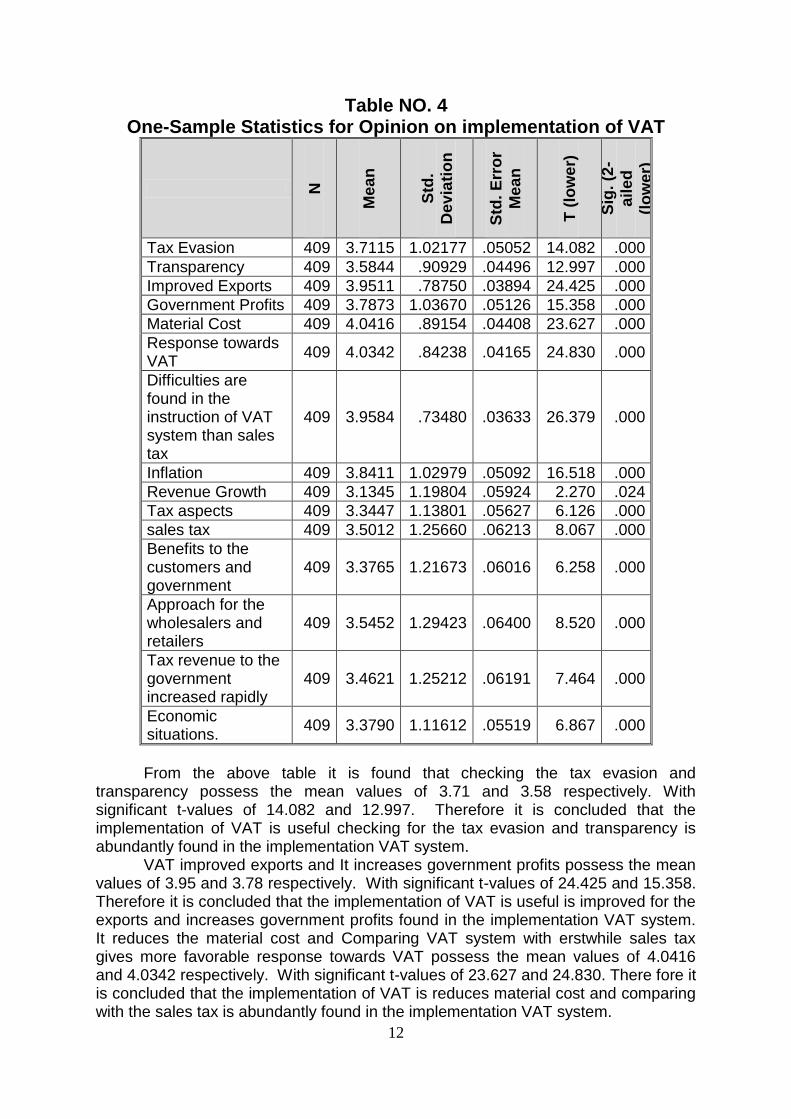
Table NO. 4 One-Sample Statistics for Opinion on implementation of VAT
N
Me
an
Std
.
Dev
iati
on
Std
. E
rro
r
Me
an
T (
low
er)
Sig
. (2
-
ail
ed
(lo
we
r)
Tax Evasion 409 3.7115 1.02177 .05052 14.082 .000
Transparency 409 3.5844 .90929 .04496 12.997 .000
Improved Exports 409 3.9511 .78750 .03894 24.425 .000
Government Profits 409 3.7873 1.03670 .05126 15.358 .000
Material Cost 409 4.0416 .89154 .04408 23.627 .000
Response towards VAT
409 4.0342 .84238 .04165 24.830 .000
Difficulties are found in the instruction of VAT system than sales tax
409 3.9584 .73480 .03633 26.379 .000
Inflation 409 3.8411 1.02979 .05092 16.518 .000
Revenue Growth 409 3.1345 1.19804 .05924 2.270 .024
Tax aspects 409 3.3447 1.13801 .05627 6.126 .000
sales tax 409 3.5012 1.25660 .06213 8.067 .000
Benefits to the customers and government
409 3.3765 1.21673 .06016 6.258 .000
Approach for the wholesalers and retailers
409 3.5452 1.29423 .06400 8.520 .000
Tax revenue to the government increased rapidly
409 3.4621 1.25212 .06191 7.464 .000
Economic situations.
409 3.3790 1.11612 .05519 6.867 .000
From the above table it is found that checking the tax evasion and transparency possess the mean values of 3.71 and 3.58 respectively. With significant t-values of 14.082 and 12.997. Therefore it is concluded that the implementation of VAT is useful checking for the tax evasion and transparency is abundantly found in the implementation VAT system.
VAT improved exports and It increases government profits possess the mean values of 3.95 and 3.78 respectively. With significant t-values of 24.425 and 15.358. Therefore it is concluded that the implementation of VAT is useful is improved for the exports and increases government profits found in the implementation VAT system. It reduces the material cost and Comparing VAT system with erstwhile sales tax gives more favorable response towards VAT possess the mean values of 4.0416 and 4.0342 respectively. With significant t-values of 23.627 and 24.830. There fore it is concluded that the implementation of VAT is reduces material cost and comparing with the sales tax is abundantly found in the implementation VAT system.
13
More difficulties are found in the instruction of VAT system than sales tax and Inflation increases due to VAT implementation programmes possess the mean values of 3.9584 and 3.8411 respectively. With significant t-values of 26.379 and 16.518. Therefore it is concluded that the implementation of VAT is more difficulties are found in the instruction of VAT system and increases inflation is abundantly found in the implementation VAT system. VAT implementation improves the revenue growth and VAT implementation increases the confidence of the customers on their tax aspects possess the mean values of 3.1345 and 3.3447 respectively. With significant t-values of 2.270 and 6.126. therefore it is concluded that the implementation of VAT improves the revenue growth and increases the confidence of the consumers on their tax aspects. It curtails sales tax at different stages and It gives mutual benefits to the customers and government possess the mean values of 3.5012 and 3.3765 respectively. With significant t-values of 8.067 and 6.258. Therefore it is concluded that the implementation of VAT is curtails sales tax at different stages and mutual benefits to the consumers and government.
It sets smooth approach for the wholesalers and retailers possess the mean value 3.5452. With significant t-value of 8.520. Therefore it is concluded that the implementation of VAT smooth approach for the wholesalers and retailers. The total collection of tax revenue to the government increased rapidly and It is more suitable for the Globalised Economic Situations possess the mean values of 3.4621 and 3.3790. With significant t-values of 7.464 and 6.867. Therefore it is concluded that the implementation of VAT is increases total collection of tax revenue and more suitable for the globalised economic situations.
14. Opinion on Suggestions for Effective Implementation of VAT
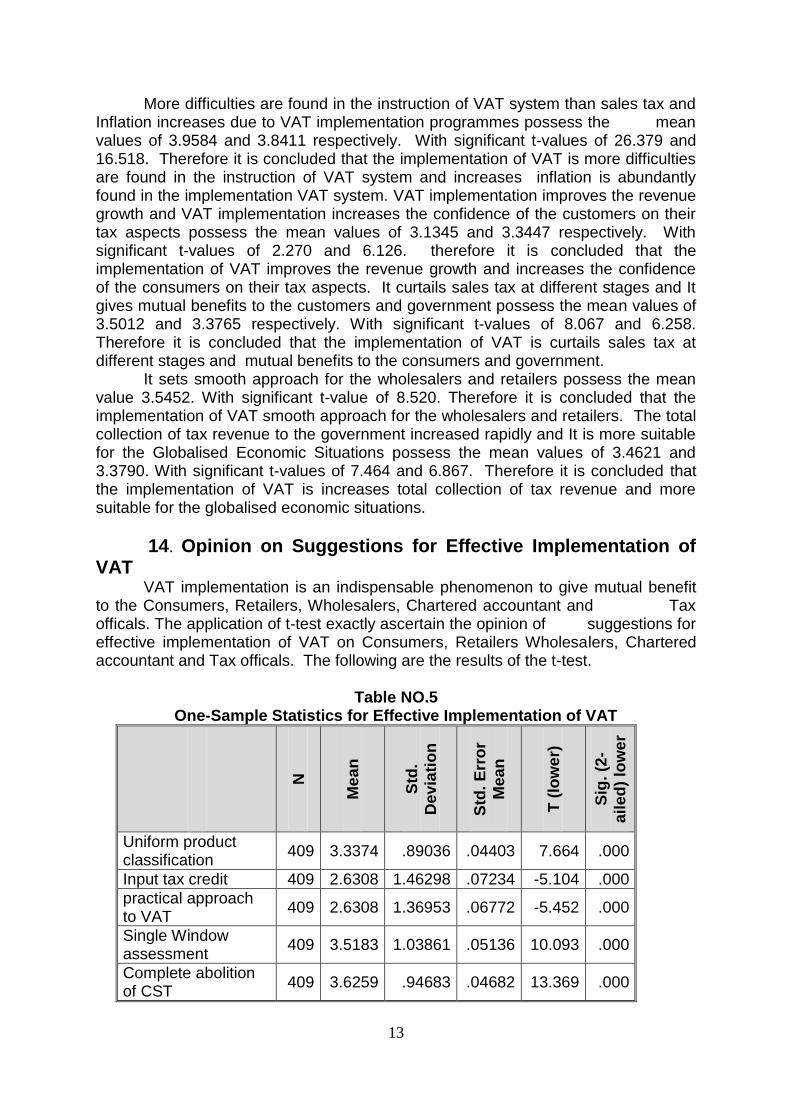
VAT implementation is an indispensable phenomenon to give mutual benefit to the Consumers, Retailers, Wholesalers, Chartered accountant and Tax officals. The application of t-test exactly ascertain the opinion of suggestions for effective implementation of VAT on Consumers, Retailers Wholesalers, Chartered accountant and Tax officals. The following are the results of the t-test.
Table NO.5 One-Sample Statistics for Effective Implementation of VAT
N
Me
an
Std
.
Dev
iati
on
Std
. E
rro
r
Me
an
T (
low
er)
Sig
. (2
-
ail
ed
) lo
we
r
Uniform product classification
409 3.3374 .89036 .04403 7.664 .000
Input tax credit 409 2.6308 1.46298 .07234 -5.104 .000
practical approach to VAT
409 2.6308 1.36953 .06772 -5.452 .000
Single Window assessment
409 3.5183 1.03861 .05136 10.093 .000
Complete abolition of CST
409 3.6259 .94683 .04682 13.369 .000
14
From the above table it is found that Introduction of uniform product classification across the country possess the mean value 3.3374. with significant t-value 7.664. therefore it is concluded that the implementation of VAT is uniform product across the country. Extension of input tax credit to central sales taxes also possess the mean value2.6308. with significant t-value -5.104. therefore it is concluded that the implementation of VAT is extends of input tax credit to central sales taxes. Adoption of a practical approach to VAT audits for assessment possess the mean value 2.6308. with significant t-value -5.452. Therefore it is concluded that the implementation of VAT practical approach to VAT audits for assessment. Introduction of single window assessment process for all taxes possess the mean value 3.5183. With significant t-value 10.093. Therefore is concluded that the implementation of VAT is single assessment process for all taxes.
15. FACTOR ANALYSIS Factor analysis by principle component method is used to reduce the variables into pre-dominant factors.
15.1 FACTORS OF VAT IMPLEMENTATION The VAT implementation comprises 15 variables pertaining to characteristics of VAT and its implementation consequences in the research the VAT implementation opinion is ascertained through 15 variables as stated the t-test. It is require to downsize these 15 variables into predominant factors. At this juncture factor analysis the principle component method is applied and the following results of ascertained.
15
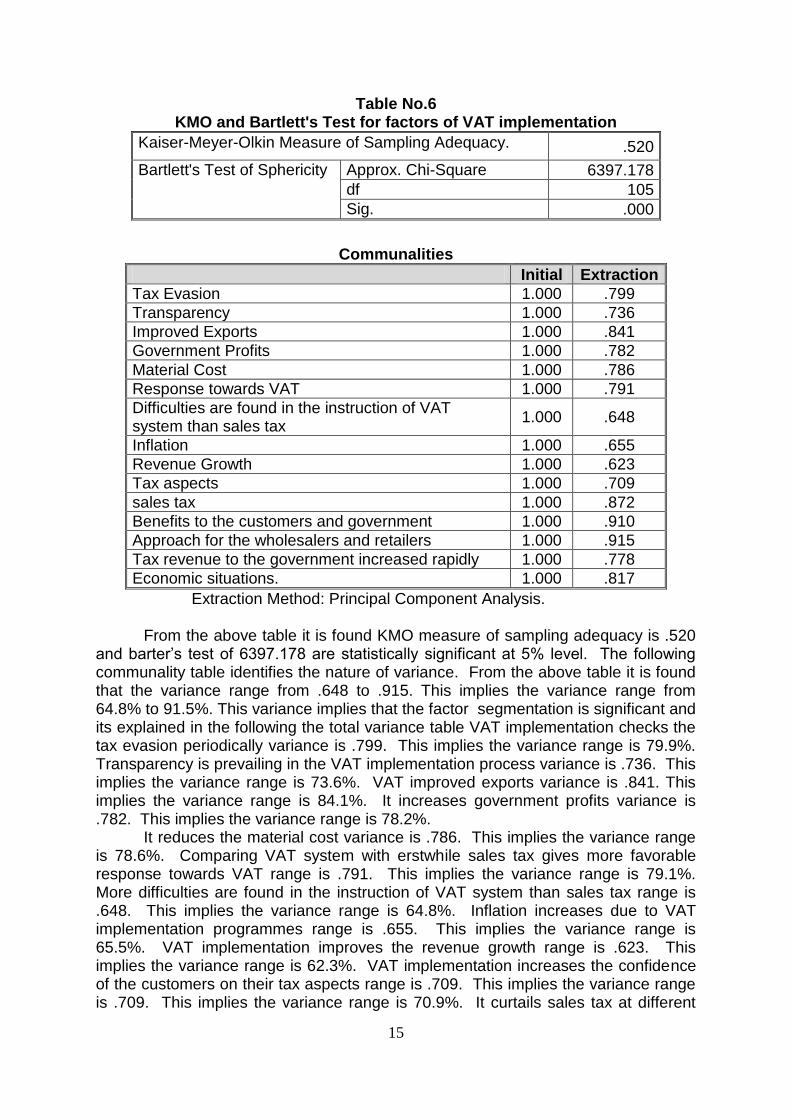
Table No.6 KMO and Bartlett's Test for factors of VAT implementation
Kaiser-Meyer-Olkin Measure of Sampling Adequacy. .520
Bartlett's Test of Sphericity Approx. Chi-Square 6397.178
df 105
Sig. .000
Communalities
Initial Extraction
Tax Evasion 1.000 .799
Transparency 1.000 .736
Improved Exports 1.000 .841
Government Profits 1.000 .782
Material Cost 1.000 .786
Response towards VAT 1.000 .791
Difficulties are found in the instruction of VAT system than sales tax
1.000 .648
Inflation 1.000 .655
Revenue Growth 1.000 .623
Tax aspects 1.000 .709
sales tax 1.000 .872
Benefits to the customers and government 1.000 .910
Approach for the wholesalers and retailers 1.000 .915
Tax revenue to the government increased rapidly 1.000 .778
Economic situations. 1.000 .817
Extraction Method: Principal Component Analysis. From the above table it is found KMO measure of sampling adequacy is .520 and barter‟s test of 6397.178 are statistically significant at 5% level. The following communality table identifies the nature of variance. From the above table it is found that the variance range from .648 to .915. This implies the variance range from 64.8% to 91.5%. This variance implies that the factor segmentation is significant and its explained in the following the total variance table VAT implementation checks the tax evasion periodically variance is .799. This implies the variance range is 79.9%. Transparency is prevailing in the VAT implementation process variance is .736. This implies the variance range is 73.6%. VAT improved exports variance is .841. This implies the variance range is 84.1%. It increases government profits variance is .782. This implies the variance range is 78.2%. It reduces the material cost variance is .786. This implies the variance range is 78.6%. Comparing VAT system with erstwhile sales tax gives more favorable response towards VAT range is .791. This implies the variance range is 79.1%. More difficulties are found in the instruction of VAT system than sales tax range is .648. This implies the variance range is 64.8%. Inflation increases due to VAT implementation programmes range is .655. This implies the variance range is 65.5%. VAT implementation improves the revenue growth range is .623. This implies the variance range is 62.3%. VAT implementation increases the confidence of the customers on their tax aspects range is .709. This implies the variance range is .709. This implies the variance range is 70.9%. It curtails sales tax at different
16
stages range is .872. This implies the variance range is 87.2%. It gives mutual benefits to the customers and government variance range is .910. This implies the variance range is 91.0%. It sets smooth approach for the wholesalers and retailers variance range is.915. This implies the variance range is 91.5%. The total collection of tax revenue to the government increased rapidly variance range is .778. This implies the variance range is 77.8%. It is more suitable for the globalised economic situations variance range is .817. This implies the variance range is 81.7%.
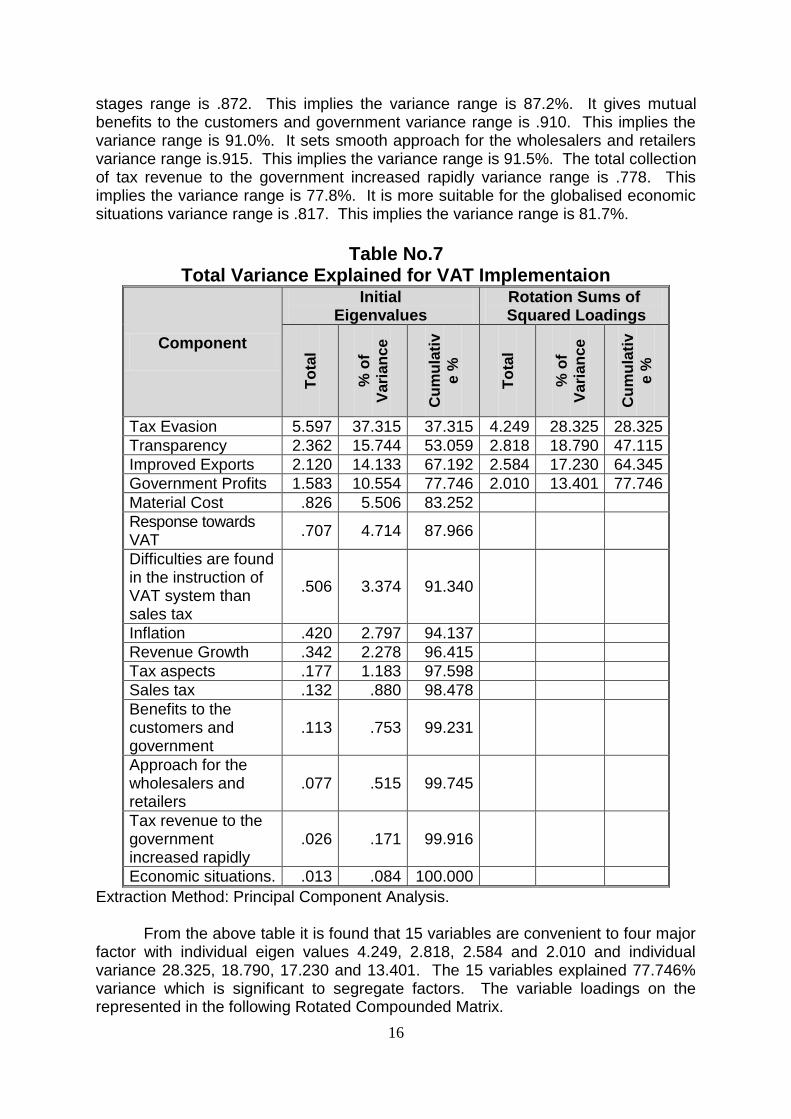
Table No.7 Total Variance Explained for VAT Implementaion
Component
Initial Eigenvalues
Rotation Sums of Squared Loadings
To
tal
% o
f
Vari
an
ce
Cu
mu
lati
v
e %
To
tal
% o
f
Vari
an
ce
Cu
mu
lati
v
e %
Tax Evasion 5.597 37.315 37.315 4.249 28.325 28.325
Transparency 2.362 15.744 53.059 2.818 18.790 47.115
Improved Exports 2.120 14.133 67.192 2.584 17.230 64.345
Government Profits 1.583 10.554 77.746 2.010 13.401 77.746
Material Cost .826 5.506 83.252
Response towards VAT
.707 4.714 87.966
Difficulties are found in the instruction of VAT system than sales tax
.506 3.374 91.340
Inflation .420 2.797 94.137
Revenue Growth .342 2.278 96.415
Tax aspects .177 1.183 97.598
Sales tax .132 .880 98.478
Benefits to the customers and government
.113 .753 99.231
Approach for the wholesalers and retailers
.077 .515 99.745
Tax revenue to the government increased rapidly
.026 .171 99.916
Economic situations. .013 .084 100.000
Extraction Method: Principal Component Analysis. From the above table it is found that 15 variables are convenient to four major factor with individual eigen values 4.249, 2.818, 2.584 and 2.010 and individual variance 28.325, 18.790, 17.230 and 13.401. The 15 variables explained 77.746% variance which is significant to segregate factors. The variable loadings on the represented in the following Rotated Compounded Matrix.
17
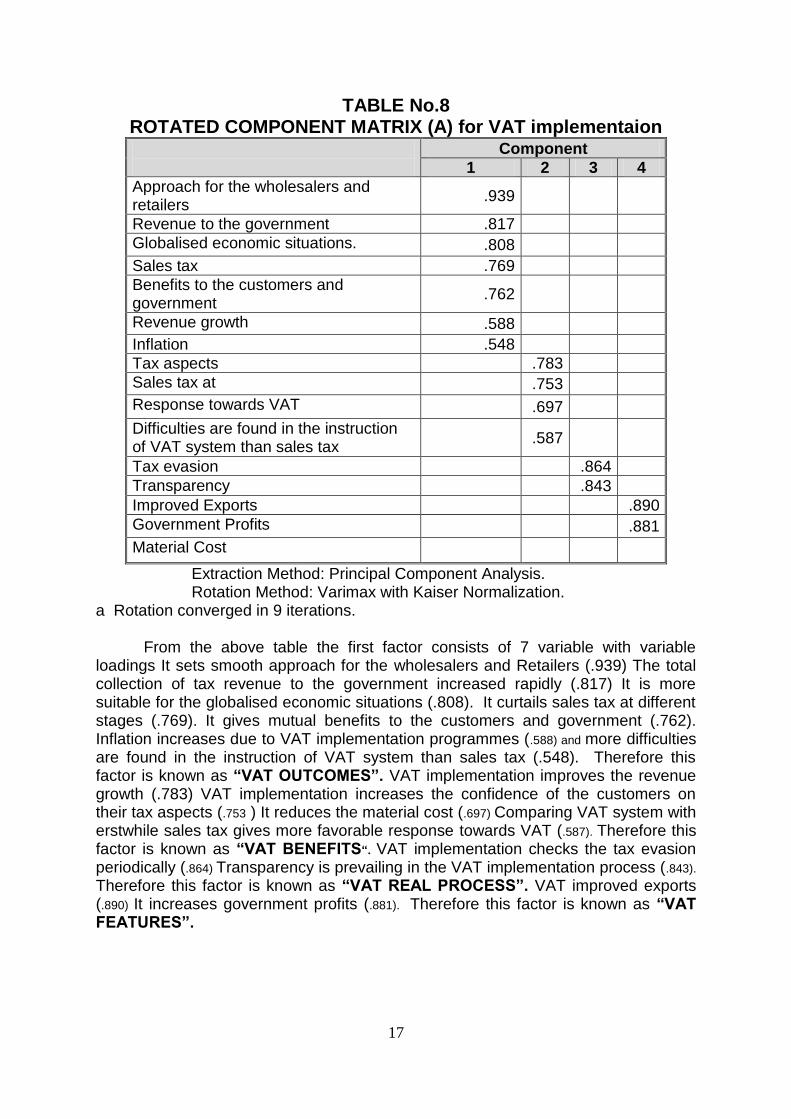
TABLE No.8 ROTATED COMPONENT MATRIX (A) for VAT implementaion
Component
1 2 3 4
Approach for the wholesalers and retailers
.939
Revenue to the government .817
Globalised economic situations. .808
Sales tax .769
Benefits to the customers and government
.762
Revenue growth .588
Inflation .548
Tax aspects .783
Sales tax at .753
Response towards VAT .697
Difficulties are found in the instruction of VAT system than sales tax
.587
Tax evasion .864
Transparency .843
Improved Exports .890
Government Profits .881
Material Cost
Extraction Method: Principal Component Analysis. Rotation Method: Varimax with Kaiser Normalization.
a Rotation converged in 9 iterations.
From the above table the first factor consists of 7 variable with variable loadings It sets smooth approach for the wholesalers and Retailers (.939) The total collection of tax revenue to the government increased rapidly (.817) It is more suitable for the globalised economic situations (.808). It curtails sales tax at different stages (.769). It gives mutual benefits to the customers and government (.762). Inflation increases due to VAT implementation programmes (.588) and more difficulties are found in the instruction of VAT system than sales tax (.548). Therefore this factor is known as “VAT OUTCOMES”. VAT implementation improves the revenue growth (.783) VAT implementation increases the confidence of the customers on their tax aspects (.753 ) It reduces the material cost (.697) Comparing VAT system with erstwhile sales tax gives more favorable response towards VAT (.587). Therefore this factor is known as “VAT BENEFITS“. VAT implementation checks the tax evasion periodically (.864) Transparency is prevailing in the VAT implementation process (.843).
Therefore this factor is known as “VAT REAL PROCESS”. VAT improved exports (.890) It increases government profits (.881). Therefore this factor is known as “VAT FEATURES”.
18
16. CONCLUSION VAT out comes and VAT benefits are analogs to each other. The VAT real process and its implementation are able to ascertained the exact VAT feature. The VAT implementation gives the maximum benefits to the customers and its features are tending towards benefits for the sellers and customers.
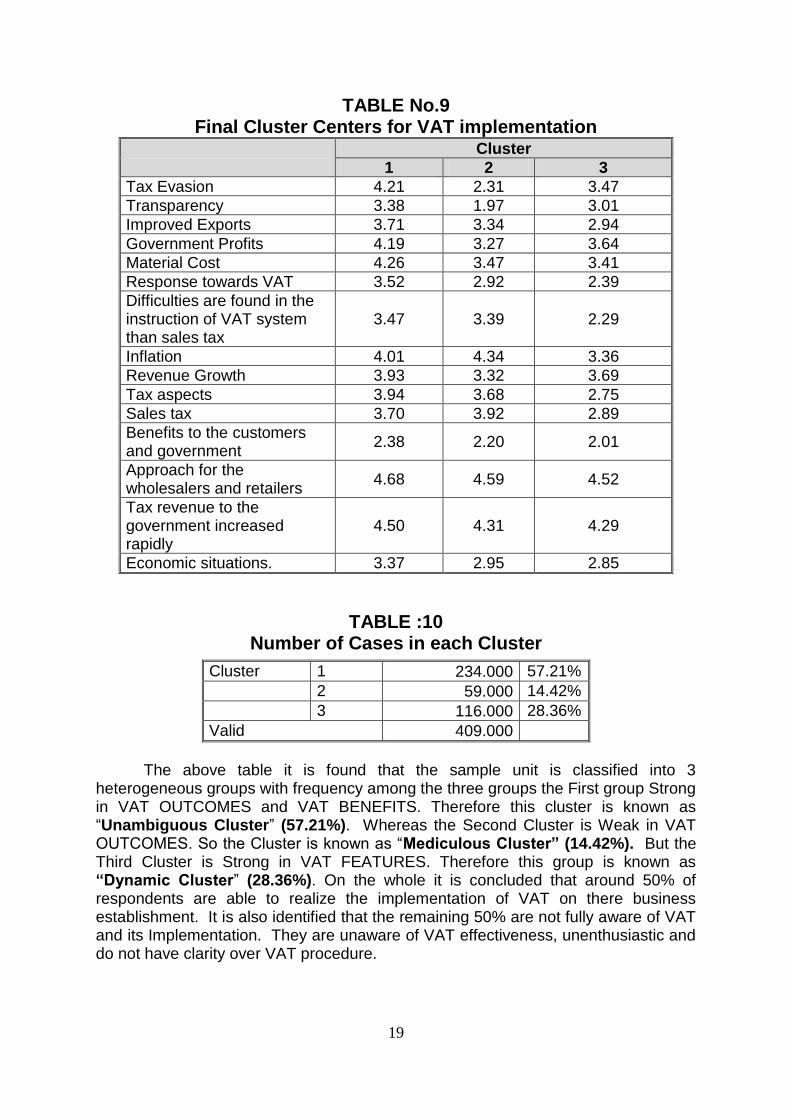
17. CLUSTER ANALYSIS There exist 3 clusters in the sample unit the first cluster as strong perceptions about VAT and its implication, so this cluster is called “Dynamic Cluster”. The third cluster moderately ascertained the implementation of VAT its consequences in the market. So there are called “Mediculous Cluster”. The third group of cluster is very week in the notaions regarding VAT. So this is known as “Unambitious Cluster”.
Classification of respondents based on perceptions of VAT and opinion on Implementation of VAT
The Research obtain 409 respondents from Tamil Nadu and Karnataka the respondents clearly expressed the opinion on VAT in likert‟s 5 point scale. There perceptional differences are identified through k-means cluster analysis. It identifies heterogeneity of respondent based on the scores of likert‟s 5 point scale. The following table presents the opinion of respondents based on the factors.
1. VAT Outcomes 2. VAT Benefits 3. VAT Real Process 4. VAT Features.
19
TABLE No.9 Final Cluster Centers for VAT implementation
Cluster
1 2 3
Tax Evasion 4.21 2.31 3.47
Transparency 3.38 1.97 3.01
Improved Exports 3.71 3.34 2.94
Government Profits 4.19 3.27 3.64
Material Cost 4.26 3.47 3.41
Response towards VAT 3.52 2.92 2.39
Difficulties are found in the instruction of VAT system than sales tax
3.47 3.39 2.29
Inflation 4.01 4.34 3.36
Revenue Growth 3.93 3.32 3.69
Tax aspects 3.94 3.68 2.75
Sales tax 3.70 3.92 2.89
Benefits to the customers and government
2.38 2.20 2.01
Approach for the wholesalers and retailers
4.68 4.59 4.52
Tax revenue to the government increased rapidly
4.50 4.31 4.29
Economic situations. 3.37 2.95 2.85
TABLE :10 Number of Cases in each Cluster
Cluster 1 234.000 57.21%
2 59.000 14.42%
3 116.000 28.36%
Valid 409.000
The above table it is found that the sample unit is classified into 3
heterogeneous groups with frequency among the three groups the First group Strong in VAT OUTCOMES and VAT BENEFITS. Therefore this cluster is known as “Unambiguous Cluster” (57.21%). Whereas the Second Cluster is Weak in VAT OUTCOMES. So the Cluster is known as “Mediculous Cluster” (14.42%). But the Third Cluster is Strong in VAT FEATURES. Therefore this group is known as “Dynamic Cluster” (28.36%). On the whole it is concluded that around 50% of respondents are able to realize the implementation of VAT on there business establishment. It is also identified that the remaining 50% are not fully aware of VAT and its Implementation. They are unaware of VAT effectiveness, unenthusiastic and do not have clarity over VAT procedure.
20
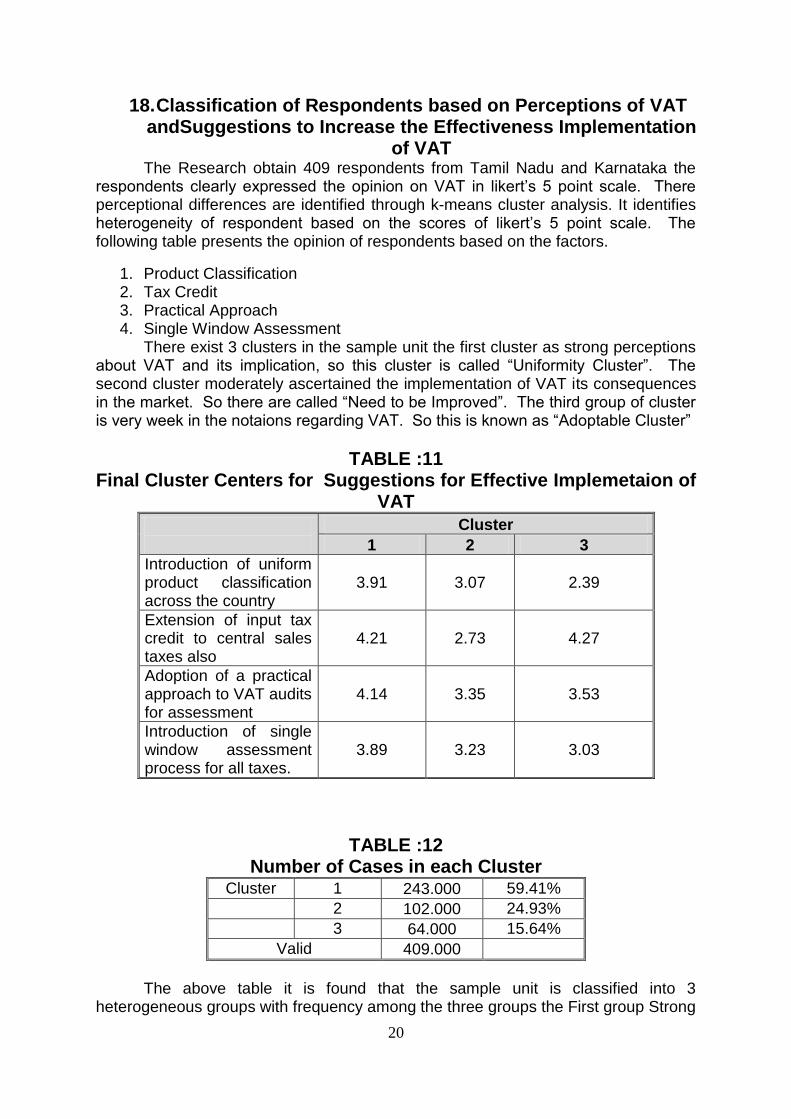
18. Classification of Respondents based on Perceptions of VAT andSuggestions to Increase the Effectiveness Implementation
of VAT The Research obtain 409 respondents from Tamil Nadu and Karnataka the
respondents clearly expressed the opinion on VAT in likert‟s 5 point scale. There perceptional differences are identified through k-means cluster analysis. It identifies heterogeneity of respondent based on the scores of likert‟s 5 point scale. The following table presents the opinion of respondents based on the factors.
1. Product Classification 2. Tax Credit 3. Practical Approach 4. Single Window Assessment
There exist 3 clusters in the sample unit the first cluster as strong perceptions about VAT and its implication, so this cluster is called “Uniformity Cluster”. The second cluster moderately ascertained the implementation of VAT its consequences in the market. So there are called “Need to be Improved”. The third group of cluster is very week in the notaions regarding VAT. So this is known as “Adoptable Cluster”
TABLE :11 Final Cluster Centers for Suggestions for Effective Implemetaion of
VAT
Cluster
1 2 3
Introduction of uniform product classification across the country
3.91 3.07 2.39
Extension of input tax credit to central sales taxes also
4.21 2.73 4.27
Adoption of a practical approach to VAT audits for assessment
4.14 3.35 3.53
Introduction of single window assessment process for all taxes.
3.89 3.23 3.03
TABLE :12 Number of Cases in each Cluster
Cluster 1 243.000 59.41%
2 102.000 24.93%
3 64.000 15.64%
Valid 409.000
The above table it is found that the sample unit is classified into 3
heterogeneous groups with frequency among the three groups the First group Strong
21
in Tax Credit and Practical Approach But moderate in Product Classification and Single Window Assessment. Therefore this cluster is known as “Uniformity Cluster”(59.41%). Whereas the Second Cluster is Weak in Tax Credit.
Moderate in product classification, practical approach and single window assessment. So the Cluster is known as “Need to be Improved”(24.93%). But the Third Cluster is Strong in tax credit of VAT. But weak in Product Classification. Therefore this group is known as “Adoptable Cluster”(15.64%). On the whole it is concluded that around 59% of respondents are very much effective implementation of VAT and its total output remaining 25% are not need to be improved as well as adoptable cluster 15.64% to possess the awareness of VAT.
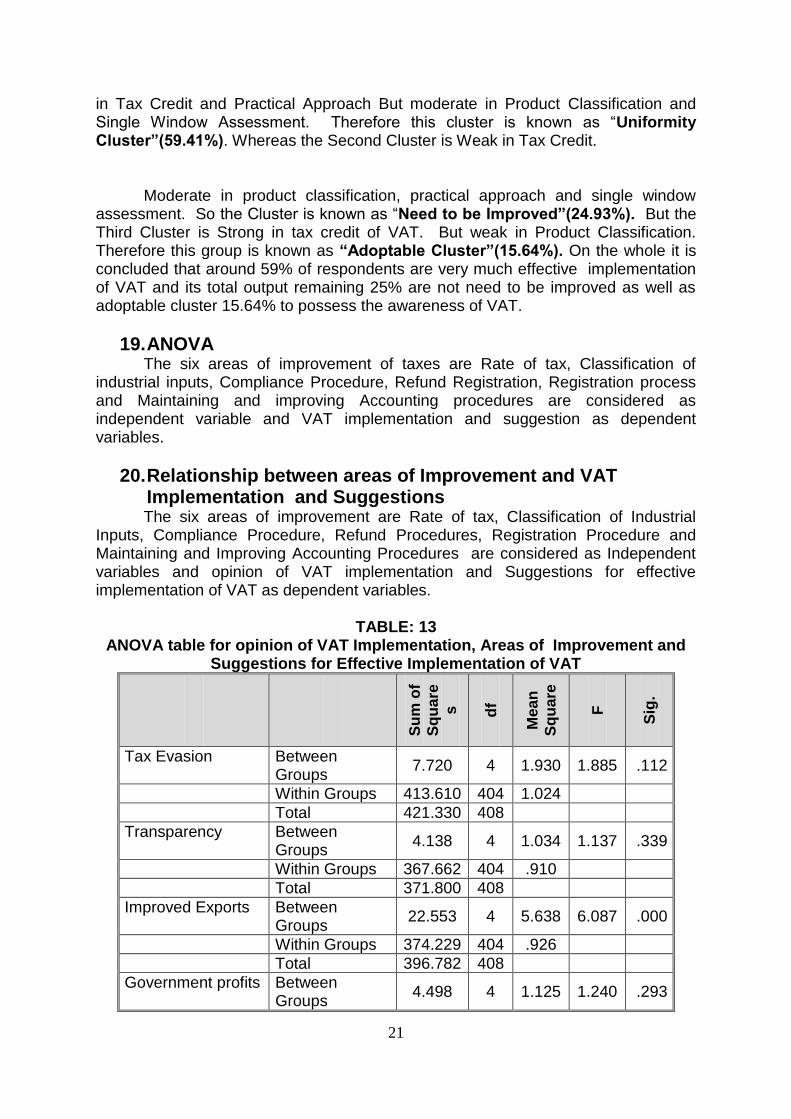
19. ANOVA The six areas of improvement of taxes are Rate of tax, Classification of industrial inputs, Compliance Procedure, Refund Registration, Registration process and Maintaining and improving Accounting procedures are considered as independent variable and VAT implementation and suggestion as dependent variables.
20. Relationship between areas of Improvement and VAT Implementation and Suggestions The six areas of improvement are Rate of tax, Classification of Industrial
Inputs, Compliance Procedure, Refund Procedures, Registration Procedure and Maintaining and Improving Accounting Procedures are considered as Independent variables and opinion of VAT implementation and Suggestions for effective implementation of VAT as dependent variables.
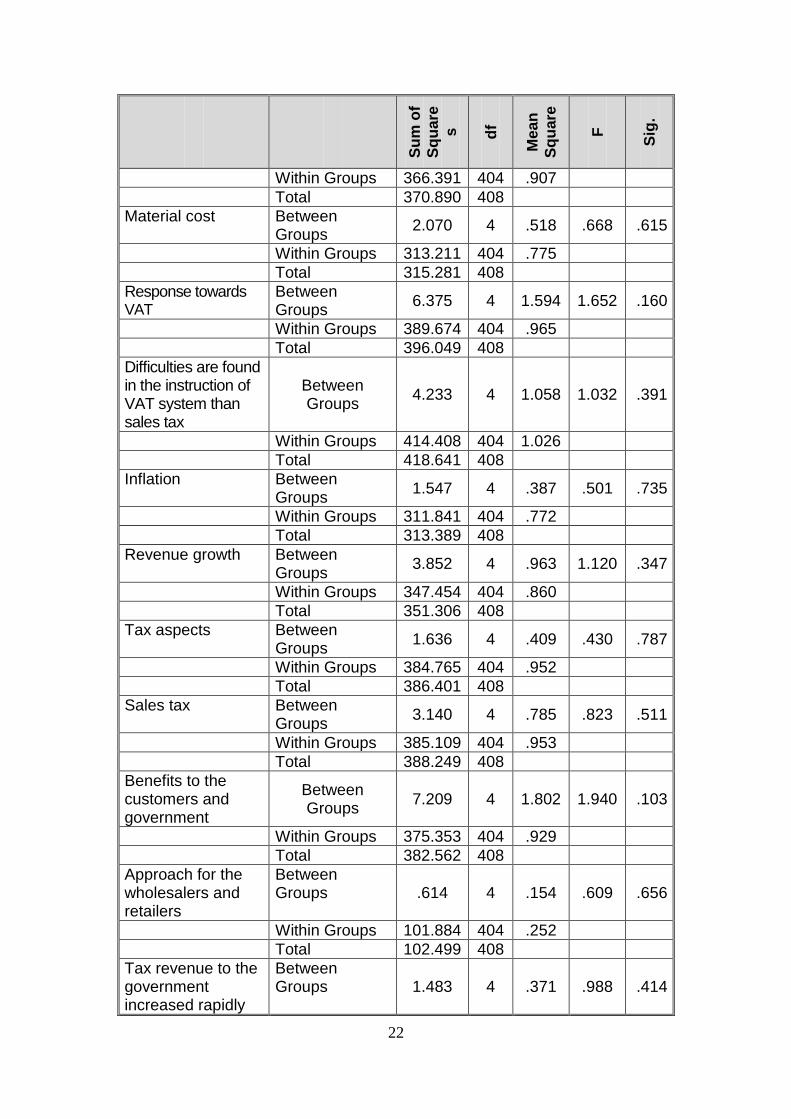
TABLE: 13
ANOVA table for opinion of VAT Implementation, Areas of Improvement and Suggestions for Effective Implementation of VAT
Su
m o
f
Sq
uare
s
df
Mean
Sq
uare
F
Sig
.
Tax Evasion Between Groups
7.720 4 1.930 1.885 .112
Within Groups 413.610 404 1.024
Total 421.330 408
Transparency Between Groups
4.138 4 1.034 1.137 .339
Within Groups 367.662 404 .910
Total 371.800 408
Improved Exports Between Groups
22.553 4 5.638 6.087 .000
Within Groups 374.229 404 .926
Total 396.782 408
Government profits Between Groups
4.498 4 1.125 1.240 .293
22
Su
m o
f
Sq
uare
s
df
Mean
Sq
uare
F
Sig
.
Within Groups 366.391 404 .907
Total 370.890 408
Material cost Between Groups
2.070 4 .518 .668 .615
Within Groups 313.211 404 .775
Total 315.281 408
Response towards VAT
Between Groups
6.375 4 1.594 1.652 .160
Within Groups 389.674 404 .965
Total 396.049 408
Difficulties are found in the instruction of VAT system than sales tax
Between Groups
4.233 4 1.058 1.032 .391
Within Groups 414.408 404 1.026
Total 418.641 408
Inflation Between Groups
1.547 4 .387 .501 .735
Within Groups 311.841 404 .772
Total 313.389 408
Revenue growth Between Groups
3.852 4 .963 1.120 .347
Within Groups 347.454 404 .860
Total 351.306 408
Tax aspects Between Groups
1.636 4 .409 .430 .787
Within Groups 384.765 404 .952
Total 386.401 408
Sales tax Between Groups
3.140 4 .785 .823 .511
Within Groups 385.109 404 .953
Total 388.249 408
Benefits to the customers and government
Between Groups
7.209 4 1.802 1.940 .103
Within Groups 375.353 404 .929
Total 382.562 408
Approach for the wholesalers and retailers
Between Groups .614 4 .154 .609 .656
Within Groups 101.884 404 .252
Total 102.499 408
Tax revenue to the government increased rapidly
Between Groups 1.483 4 .371 .988 .414
23
Su
m o
f
Sq
uare
s
df
Mean
Sq
uare
F
Sig
.
Within Groups 151.686 404 .375
Total 153.169 408
Economic situations
Between Groups
1.110 4 .278 .346 .847
Within Groups 324.239 404 .803
Total 325.350 408
Uniform product classification
Between Groups
3.258 4 .814 1.034 .390
Within Groups 318.326 404 .788
Total 321.584 408
Input tax credit Between Groups
.493 4 .123 .161 .958
Within Groups 308.109 404 .763
Total 308.601 408
practical approach to VAT
Between Groups
.980 4 .245 .339 .852
Within Groups 292.315 404 .724
Total 293.296 408
Single window assessment process for all taxes
Between Groups
.605 4 .151 .215 .930
Within Groups 284.207 404 .703
Total 284.812 408
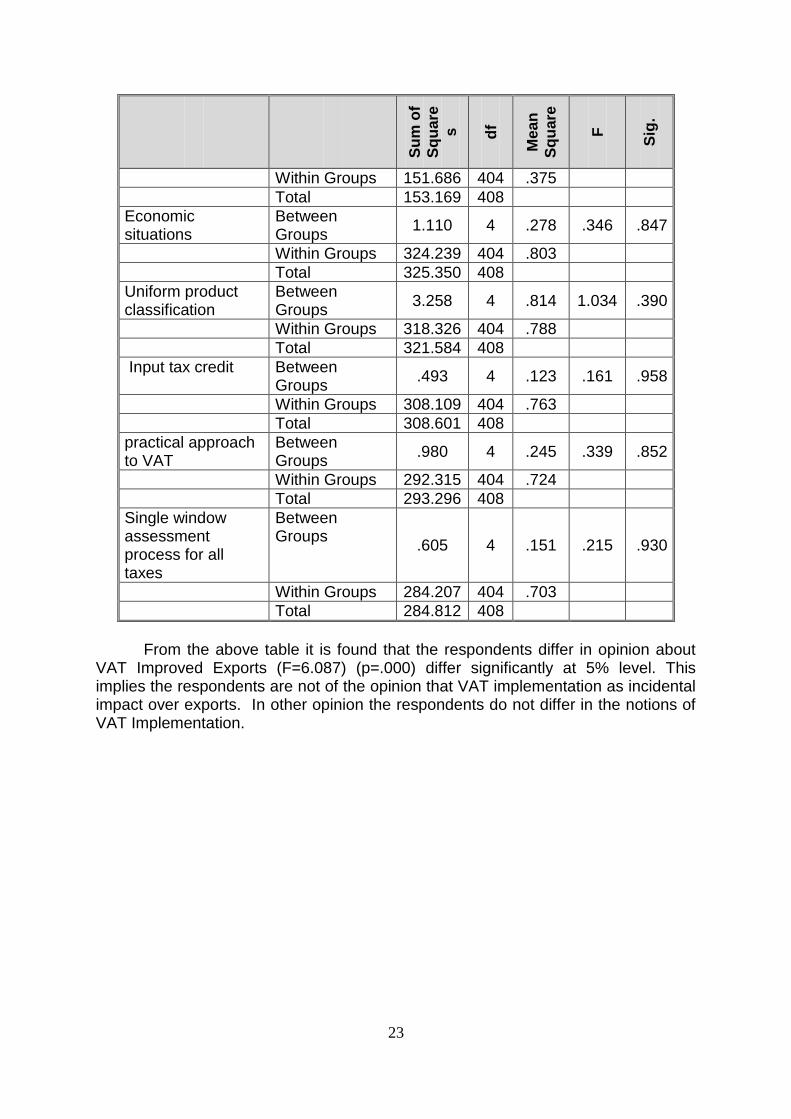
From the above table it is found that the respondents differ in opinion about
VAT Improved Exports (F=6.087) (p=.000) differ significantly at 5% level. This implies the respondents are not of the opinion that VAT implementation as incidental impact over exports. In other opinion the respondents do not differ in the notions of VAT Implementation.
24
Type of Customer
Location
Status of business
Age of the
Business
Educational
Qualficiation
Industry
Experience in the
field
Awarness
Know about VAT
Annual Turnover
Publicity
Implications
F=2.46
F=2.267
F=2.609
F=2.430
F=1.744
F=1.205
F=1.027
F=0.733
F= 7.821
F= 0.822
F= 1.234
F= 0.751
F= 1.356
State
VAT
IMPLEMENTATION
1. VAT OUTCOMES
2. VAT BENEFITS
3. VAT REAL PROCESS
4. VAT FEATURES
VAT Implementation
TAX Rates
VAT Rates
Filling monthly
Return
E-filling
Relaxation /
consession
Computer & Internet
Connection
F= 1.942
F= 1.308
F= 2.385
F= 0.859
F= 1.157
F= 2.810
F= 1.938
SUGGESTIONS FOR
EFFECTIVE
IMPLEMENTATION OF VAT
1. PRODUCT
CLASSIFICATION
2. TAX CREDIT
3. PRACTICAL APPROACH
4. SINGLE WINDOW
ASSESSMENT
25
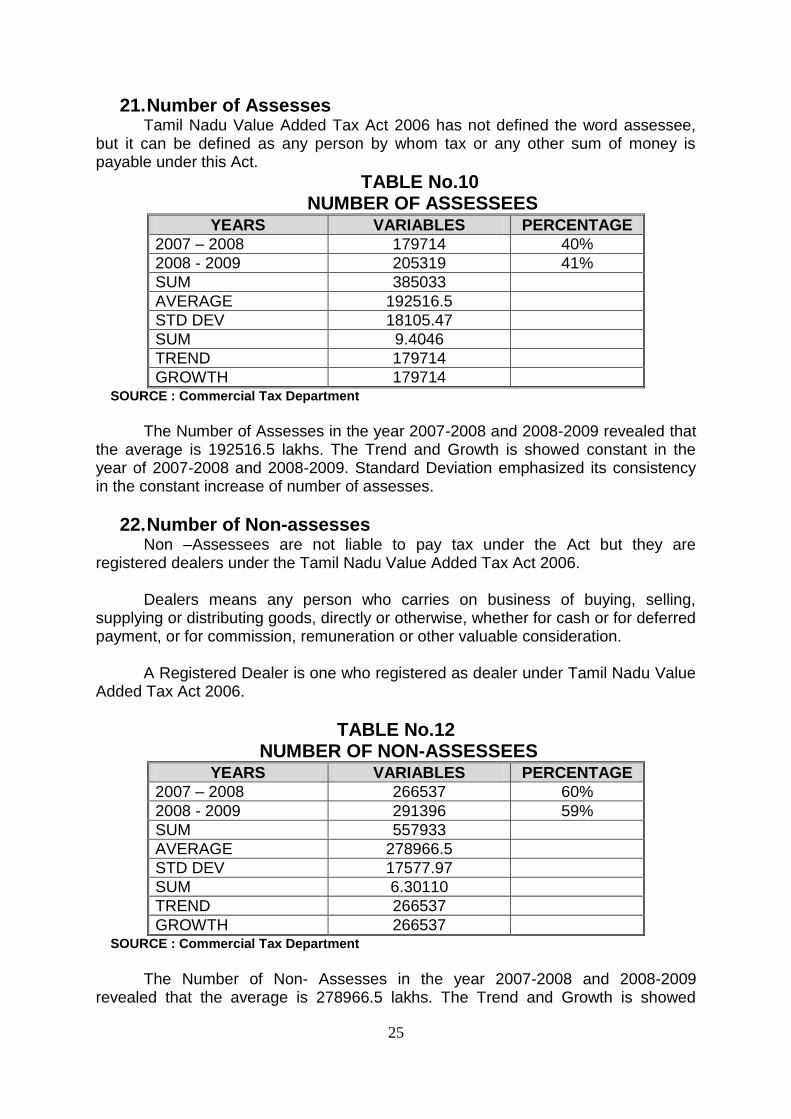
21. Number of Assesses Tamil Nadu Value Added Tax Act 2006 has not defined the word assessee, but it can be defined as any person by whom tax or any other sum of money is payable under this Act.
TABLE No.10 NUMBER OF ASSESSEES
YEARS VARIABLES PERCENTAGE
2007 – 2008 179714 40%
2008 - 2009 205319 41%
SUM 385033
AVERAGE 192516.5
STD DEV 18105.47
SUM 9.4046
TREND 179714
GROWTH 179714 SOURCE : Commercial Tax Department
The Number of Assesses in the year 2007-2008 and 2008-2009 revealed that
the average is 192516.5 lakhs. The Trend and Growth is showed constant in the year of 2007-2008 and 2008-2009. Standard Deviation emphasized its consistency in the constant increase of number of assesses.
22. Number of Non-assesses Non –Assessees are not liable to pay tax under the Act but they are
registered dealers under the Tamil Nadu Value Added Tax Act 2006. Dealers means any person who carries on business of buying, selling,
supplying or distributing goods, directly or otherwise, whether for cash or for deferred payment, or for commission, remuneration or other valuable consideration.
A Registered Dealer is one who registered as dealer under Tamil Nadu Value
Added Tax Act 2006.
TABLE No.12 NUMBER OF NON-ASSESSEES
YEARS VARIABLES PERCENTAGE
2007 – 2008 266537 60%
2008 - 2009 291396 59%
SUM 557933
AVERAGE 278966.5
STD DEV 17577.97
SUM 6.30110
TREND 266537
GROWTH 266537 SOURCE : Commercial Tax Department
The Number of Non- Assesses in the year 2007-2008 and 2008-2009
revealed that the average is 278966.5 lakhs. The Trend and Growth is showed
26
Constant in the year of 2007-2008 and 2008-2009. Standard Deviation emphasized its consistency in the constant increase of number of Non-Assesses.
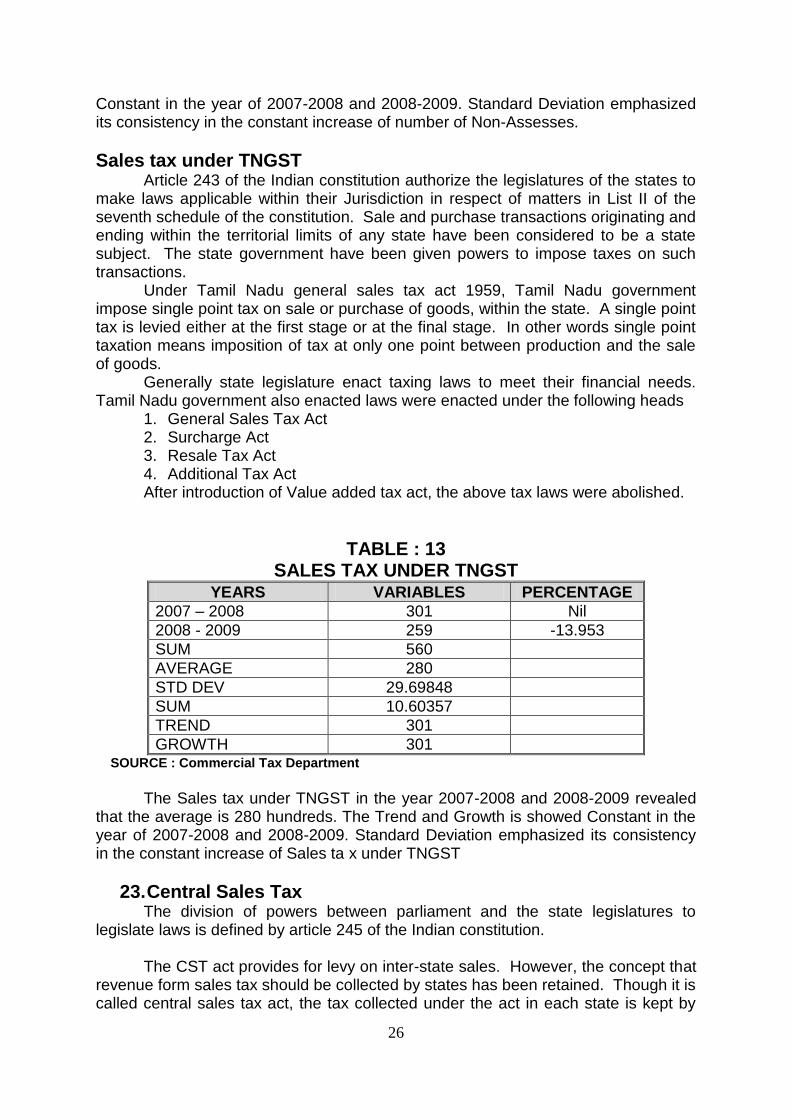
Sales tax under TNGST Article 243 of the Indian constitution authorize the legislatures of the states to make laws applicable within their Jurisdiction in respect of matters in List II of the seventh schedule of the constitution. Sale and purchase transactions originating and ending within the territorial limits of any state have been considered to be a state subject. The state government have been given powers to impose taxes on such transactions.
Under Tamil Nadu general sales tax act 1959, Tamil Nadu government impose single point tax on sale or purchase of goods, within the state. A single point tax is levied either at the first stage or at the final stage. In other words single point taxation means imposition of tax at only one point between production and the sale of goods.
Generally state legislature enact taxing laws to meet their financial needs. Tamil Nadu government also enacted laws were enacted under the following heads
1. General Sales Tax Act 2. Surcharge Act 3. Resale Tax Act 4. Additional Tax Act After introduction of Value added tax act, the above tax laws were abolished.
TABLE : 13 SALES TAX UNDER TNGST
YEARS VARIABLES PERCENTAGE
2007 – 2008 301 Nil
2008 - 2009 259 -13.953
SUM 560
AVERAGE 280
STD DEV 29.69848
SUM 10.60357
TREND 301
GROWTH 301 SOURCE : Commercial Tax Department
The Sales tax under TNGST in the year 2007-2008 and 2008-2009 revealed
that the average is 280 hundreds. The Trend and Growth is showed Constant in the year of 2007-2008 and 2008-2009. Standard Deviation emphasized its consistency in the constant increase of Sales ta x under TNGST
23. Central Sales Tax The division of powers between parliament and the state legislatures to legislate laws is defined by article 245 of the Indian constitution.
The CST act provides for levy on inter-state sales. However, the concept that revenue form sales tax should be collected by states has been retained. Though it is called central sales tax act, the tax collected under the act in each state is kept by
27
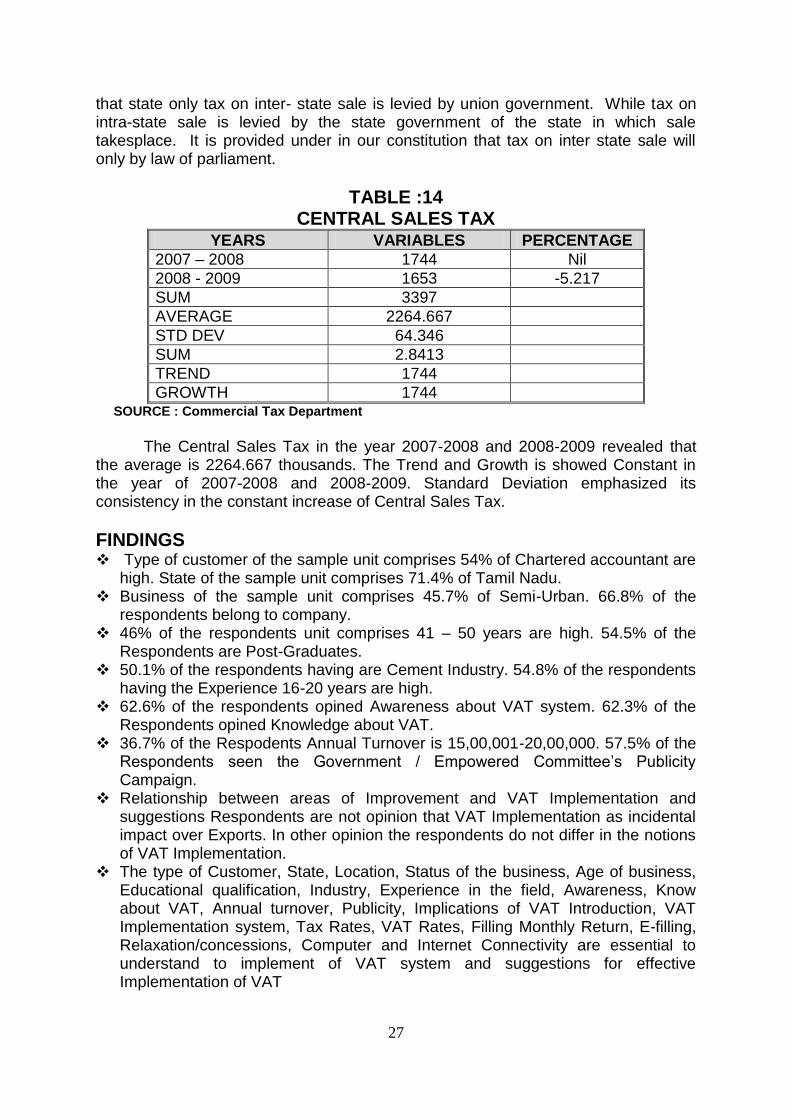
that state only tax on inter- state sale is levied by union government. While tax on intra-state sale is levied by the state government of the state in which sale takesplace. It is provided under in our constitution that tax on inter state sale will only by law of parliament.
TABLE :14 CENTRAL SALES TAX
YEARS VARIABLES PERCENTAGE
2007 – 2008 1744 Nil
2008 - 2009 1653 -5.217
SUM 3397
AVERAGE 2264.667
STD DEV 64.346
SUM 2.8413
TREND 1744
GROWTH 1744 SOURCE : Commercial Tax Department
The Central Sales Tax in the year 2007-2008 and 2008-2009 revealed that
the average is 2264.667 thousands. The Trend and Growth is showed Constant in the year of 2007-2008 and 2008-2009. Standard Deviation emphasized its consistency in the constant increase of Central Sales Tax.
FINDINGS Type of customer of the sample unit comprises 54% of Chartered accountant are
high. State of the sample unit comprises 71.4% of Tamil Nadu. Business of the sample unit comprises 45.7% of Semi-Urban. 66.8% of the
respondents belong to company. 46% of the respondents unit comprises 41 – 50 years are high. 54.5% of the
Respondents are Post-Graduates. 50.1% of the respondents having are Cement Industry. 54.8% of the respondents
having the Experience 16-20 years are high. 62.6% of the respondents opined Awareness about VAT system. 62.3% of the
Respondents opined Knowledge about VAT. 36.7% of the Respodents Annual Turnover is 15,00,001-20,00,000. 57.5% of the
Respondents seen the Government / Empowered Committee‟s Publicity Campaign.
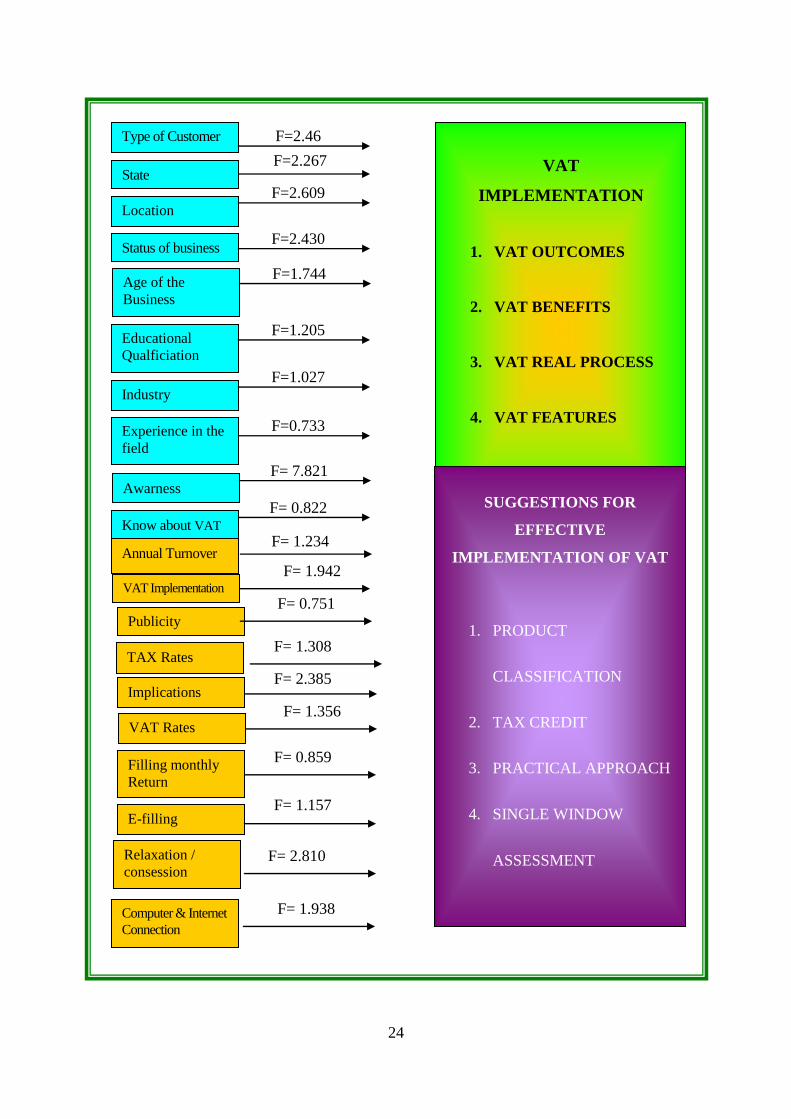
Relationship between areas of Improvement and VAT Implementation and suggestions Respondents are not opinion that VAT Implementation as incidental impact over Exports. In other opinion the respondents do not differ in the notions of VAT Implementation.
The type of Customer, State, Location, Status of the business, Age of business, Educational qualification, Industry, Experience in the field, Awareness, Know about VAT, Annual turnover, Publicity, Implications of VAT Introduction, VAT Implementation system, Tax Rates, VAT Rates, Filling Monthly Return, E-filling, Relaxation/concessions, Computer and Internet Connectivity are essential to understand to implement of VAT system and suggestions for effective Implementation of VAT
28
Number of Assesses for Tamil Nadu Trend and Growth is showed constant in the year of 2007-2008 and 2008-2009. Number of Non-Assesses for Tamil Nadu standard deviation emphasized its consistency in the constant increase in the year of 2007-2008 and 2008-2009.
The Sales Tax under TNGST in the year 2007-2008 and 2008-2009 revealed that the average is 280 Crores for Tamil Nadu. Central Sales Tax for Tamil Nadu the Trend and Growth is showed Constant in the year of 2007-2008 and 2008-2009.
The VAT Revenue in the year 2007-2008 and 2008-2009 revealed that the average is 278966.5 Crores. In the year 2007-2008 the Tax Slab Wise Assesses revealed that -12.827% is decreased in the particular range from Rs.5,000-10,000 it is also found that a conspicuous increase is noticed in the year 2007-2008 in the Slab Rs.50 crs and above is 271.428%.
In the year 2008-2009 distribution of assesses by turnover and tax slab (Rs.100-200 crores) is 200% which is decreased in the particular range from Rs.1-5 lakhs it is also found that a conspicuous increase is noticed in the year 2008-2009 in the slab Rs.10-50 lakhs and above is 666.666% on the Average in the year 2008-2009 is 15.636 crores have been obtained as VAT. It is also found a moderate variation is found in the slab Rs.10000-50000 is 300%. A moderate variation is found in the slab Rs.1-10 Crores is 350% for Distribution of assesses by turnover and tax slabs in 2008-2009 (Rs.200- 300 crores).
In the year 2007-2008 distribution of tax revenue by turnover and tax slab (Rs.300-400 crores) is 222.846% which is decreased in the particular range from Rs.50-100 lakhs it is also found that a conspicuous increase is noticed in the year 2007-2008 in the slab Rs.1-10 crores is 4989.508%. It is also found a moderate variation is found in the slab Rs.20-30 crores is 178.598% (Rs.400-500 crores).
On the Average in the year 2007-2008 is 203036.833 crores have been obtained as VAT (Rs. 500 and above).
The CT Revenue and Net State Domestic Product (NSDP) in the year 2007-2008 and 2008-2009 revealed that the average is 21261.5 thousands.
The own tax revenue of Tamil Nadu in the year 2007-2008 and 2008-2009 revealed that the average is 33826.5 thousands.
NSDP at current prices of Tamil Nadu in the year 2007 -2008 and 2008-2009 revealed that the average is 271230.5 lakhs.
Statewise sales tax and state‟s own tax revenue of Tamil Nadu in the year 2007–2008 and 2008-2009 revealed that the average is 17991 thousands.
Central sales tax of Tamil Nadu in the year 2007 -2008 and 2008-2009 revealed that the average is 1698.5 thousands.
For Karnataka Standard Deviation emphasized its consistency in the constant increase of number of assesses.
The Number of non-Assesses in the year of Karnataka is from 2006-2007 to 2008-2009 revealed that the average is 297135.3 lakhs.
Sales tax in the year of Karnataka is from 2006-2007 to 2008-2009 revealed that the average is 335.333 Crores.
The Central Sales tax of Karnataka is from 2006-2007 to 2008-2009 revealed that the average is 1573 thousand.
The revenue of Karnataka in the year from 2006-2007 to 2008-2009 revealed that the average is 16416 thousand.
29
SUGGSETIONS 1. Since the Consumers and Retailers are Unaware of certain Implementation
process of Value added tax. It is suggested the government should come with transparent norms to enlighten the retailers and consumers.
2. The study ascertained maximum benefit to the government through Value Added Tax system. So it is strongly recommended to have innovative slab system suitable for Wholesalers, Retailers and Consumers.
3. Factor Analysis revealed the Implementation of Value Added Tax is predominant among the Retailers as well as Consumers. A separate system must be transisly implemented for the mutual benefit of purchasers and sellers.
4. VAT features are highly competent to allot benefit to the government. So the channel of distribution and flow of VAT must be reformed.
5. A transparent approach Rate of Tax, Refund Procedure, Maintaining and improving accounting procedure are the immediate need for an hour.
6. It is strongly recommended that the tax consultant and the government should periodically to monitor the procedure.
CONCLUSION The Value Added Tax makes an evasive attempt on Implementation level as well as execution level. The study revealed the requirement of transparency in VAT in all the states of India. It is found that equal channel of distribution of VAT is found among Wholesalers, Retailers and Consumers. The tax applicability and e-filing plays a vital role in the VAT system. It gives mutual benefits to the Consumers and Government. Service tax, sales tax and other taxes can be easily vivid due to its Implementation process. But the transparency is required at all the level in order to obtain effective functioning in the VAT system in all the states of India. The introduction of Uniform Product Classification across the country is required to exhibit the Implementation process with effective return. The adoption benefits of purchasers and sellers equally. The single window system and Abolition of CST are indispensable to obtain the cent percent success of VAT.

30
References
BOOKS
Chittora B.K. (2005), VAT (VALUE ADDED TAX), Mark Publishers Jaipur (INDIA).
Kul Bhushan (2005), How to deal with VAT – (First Indian Print 2005), Pearson Education (Singapore) Pte. Ltd.
Lectures on value added tax act & CST act 2008, V.Subiah Naidu, Sitaraman & Co., Pvt.Ltd TNCTJ‟S the tamilnadu value added tax act, 2006, Tamil Nadu act No. 32 of 2006 as amended by Tamil Nadu act no.21 of 2007, second edition, K.T.Nagabhushan Swamy, Naags Publications Chennai, sep.2007.
Nagabhushan swamy K.T. (2007), TNCTJ‟S value added tax rates in Tamil Nadu, Fourth Edition, Naags Publications.
Nagabhushan Swamy K.T. (2008), TNCTJ‟S value added tax practice and procedure in Tamil Nadu, First Edition Nags Publications.
Dr. Parameswaran (2005), Principles of taxation (Revised Edition 2005) –, Prasanna publishers, Chennai.
Raja J.Chelliah, Pawan K.Aggarwal (2001), Mahesh C.Purohit and R.Kavita Rao, Primer on value added tax (2001) –National Institute of Public Finance and Policy, HAR – Anand Publications Pvt Ltd., New Delhi.
Raveendran B. (2006), Tamil Nadu VAT Act, 2006, C.Sitaraman and Co. Source commentary on TNVAT Act 2006 and central sales tax Act 1956
Ravi Subramaniyan (2008), Commentary on TNVAT act 2006 and CST ACT 1956, The Law‟s Interception, Inspection, Search Seizure and Confiscation under VAT Regime in India, M.R.V. Rao and M.S. Raman.
Sekar G. (2007), Padhuka‟s TNVAT ready Reckoner C.Sitaraman & Co.Pvt.Ltd, Second Edition B.Saravana prasath, g.saimukundhan, june.2007.
Srinivasan (2009), A Hand Book on TNVAT Act 2006, SC.Sitaraman & Co (p) Ltd Srivasan S. (2006), A Handbook on the Tamil Nadu Value added Tax act 2006
(Tamil Nadu act 32 of 2006) and the Tamil Nadu value added tax rules, 2007 with notes, case laws, schedules and forms,c.sitaraman & Co.Pvt.Ltd, Second Edition
Value Added Tax in India A Progress Report (May 1997), National Institute of Public Finance and Policy, New Delhi, CENTAX Publications Pvt. Ltd, New Delhi – 110 003.
31
JOURNALS Agarwal N.P and Sonia Agarwal (March.2003), “Fundamental Aspects and
Scope of Value Added Tax in India”, The Management Accountant, Vol.38, No.3 Agrawal.B.N and Abin Sarkar (November.2006),“Value Added Tax”, The
Management Accountant, Vol. 41, No.11 Ajitava Raychaudhuri, Udip kumar Sinha and Poulomi Roy (May 2007), “Is the
value added tax reform in India poverty – improving? An analysis of data from two major states”, [email protected]
Akash S.B. and A.S. Shiralashett (April.1 & 15, 2005), “Value Added Tax : A Swot Analysis”, Southern Economist, Vol.43, No.23&24
Akash. Dr.S.B and Dr.K.Harishkumar (March.2006), “Value Added Tax : A Birds-Eye-View, Kisan World, Vol. 33, No. 03
Arindam Das – Gupta (September.3, 2005), “Will State VAT Deliver”, Economic and Political Weekly, Vol.XL, No.36
Chanchawat.K.L (December.2004), “Value Added Tax – Some Key Aspects”, The Chartered Accountant, Vol.53, No.6
Dilip Kumar Mukherjee (April.2003), “Introducing Value Added Tax (VAT) in India”, Dilip Kumar Mukherjee, The Management Accountant, Vol.38, No.4
Ganapathi Dr.R.and S.Sannasi (March.2008), “VAT Effect : Taxation Made Less Taxing”, Business and Economic Facts for You, Vol.28, No.06
Gurumurthi.S (1999), “Fiscal Federalism Towards an Appropriate VAT System for a Federal Economy”, Economic and Political Weekly”, Vol.XXXIV, No.40, Ocober.2,1999
James Hines, Jr., Michigan (November 17, 2005), “Value Added taxes and international Trades : The Evidence”, Business School, law.umich.edu, Thursday,
Kamashetty Dr.S.B, “Value Added Tax (VAT) Need to Strenghthen the Teeth”, The Economic Challenger, No.8, Issue 30, January-March 2006
Kamashetty S.B (February.15, 2005), “ Value Added Tax : Need to Move on Right Path”, Southern Economist, Vol.43, No.20
Kavita Rao (June.26, 2004), R, “Impact of VAT on Central and State Finances”, Economic and Political Weekly, Vol.XXIX, No.26
Krishna Kumar Verma (November.1, 2005), “VAT in Tax Reforms: Problems and Prospects”, Southern Economist, Vol.44, No.13
Kulbhushan Chandel Dr.S.S.Narta and Sudhanshusood (April. 2006), “An Integrated Approach to Value Added Tax in the Emerging Economic Scenario”, Indian Journal of Marketing, Vol.XXXVI, No.4
Narayana.K (july.15,2005), “Implications of VAT and its application in India, vol.44, no.16
National Institute of Public Finance and Policy July, 2002), “Harmonizing Taxation of Inter-State Trade under a Sub-National VAT Lessons from International Experience Discussion Paper No.8.
Noronha Dr.M.R (January – March 2006), “VAT- A Instrument to Liberalize the Economy Further”, The Economic Challenger, No.8, Issue 30
32
Prof.Sunil Gupta and Dr.Kulbhushan (December. 2003), “VAT and Unfair Trade Practices–An Evaluation, Indian Journal of Marketing, Vol.XXX111, No.12
Ramesh Kumar D.R. (Jan.15, 2006), “VAT Scenario in India : An analysis”, Southern Economist, Vol.44, No.18
Ramesh Kumar D.R.(Jan.15, 2006), “VAT Scenario in India : An analysis”, Southern Economist, Vol.44, No.18
Satheeskumar.L and Dr.V.Selvaraj (January-march 2009), “Implications of VAT”, the economic challenger, NO.11, Issue.42
Sathish Kumar.A (Aug.1.2004), “Value Added Tax Enigma”, Southern Economist, Vol.43, No.7
SelvaKumar Dr.M. and C.Thina (October 2008), “VAT : Some Practical Issues", , The Management Accountant, Vol. 43, No.10
Selvakumar Dr.M.and P.G.Kathiravan (April 2009), “VAT: some practical issues”, business and economic facts for you, vol.29, No.7
Shuangllin LIN(June 2008), “China‟s value- added tax reform, capitl accumulation, and welfare implications”, china economic review, volume 19, issue 2, , pages 197-214, www.science direct.com,.
Sitaram Agarwal (May.2005), “Value Added Taxation in India”, The Management Accountant, Vol.40, No.5
Sivamurgun.C and Dr.V.Anbumani (January – March 2007) “Value Added Tax : Experiences in India”, The Economic Challenger, No.9, Issue. 34, January – March 2007, P.No. 57 to 63.
Somanth mukherjee (June.2005), “VAT audit”, the management accountant, Vol.40, No.6
Sukumar Mukhopadhyay (February.17, 2001),“VAT : A Closer Look”, Sukumar Mukhopadhyay, Economic and Political Weekly, Vol.XXXVI,No.7
Sukumar Mukhopadhyay (May.10,2003), “VAT in an Impasse”, Economic and Political Weekly, Vol.XXXVIII, No.19
Sukumar Mukhopadhyay (September.7, 2002), “Value Added Tax How Implementation Is Going Wrong”, Economic and Political Weekly, Vol.XXXVII, No.36
33
WEBSITES Finance.indiamart.com/taxation/valule-added-tax.html www.rediff.com/money/2003/apr/12 vat.htm www.dateyvs.com/salestax.vat.htm Rediff.com/money/2004/jul/12 guest.htm mpra.ub.uni-muenchen.de/206/1/MPRA- paper-206.pdf en.wikipedia.org/wiki/talk : value – added – tax www.law.umich.edu/center sand programs/olin/workshops.htm www.worldjute.com/wj-vat .htm Ramesh Chandra (Member Secretary- Empowered Committee of State Finance
Ministers). www.rediff.com/money/2003/apr/12vat.htm www.solarnaigator.net/ venture-capital/VAT.htm. www.worldjute.com allindiantaxes.com/vat-karnataka.php www.knowledgebible.com/forum/showthre www.houseofaccountants.com Business.gov.in/taxation/vat.php www.tnvat.gov.in/English/downform.htm “Evaluation of Value Added Tax in India”, Dr.S.K.Khatik, ejournalmdr.com “CETMA meet to study VAT implications” , Richa Mishra NEW DELHI, Jan. 22. “A Value-Added Tax (VAT) in Thailand: who wins and who loses?, Shantayanan
devarajan, Somchai jitsuchon and Chalongphob sussangkarn, www.tdri.or.th “Value Added taxes and international Trades : The Evidence”, James Hines, Jr., Michigan Business School, law.umich.edu, Thursday, November 17, 2005 “Value Added Tax (VAT)”, 2008 (India), www.worldjute.com “VAT - Boon or Bane?” “Impact of VAT in Central and State Finances an Assessment, Kavita Rao. “Beware the value added tax”, Daniel J. Mitchell, Ph.D, www.heritage.org “Is the value added tax reform in India poverty – improving? An analysis of data
from two major states”, Ajitava Raychaudhuri, Udip kumar Sinha and Poulomi roy, May 2007, [email protected]
“VAT Survey 2006”, www.pwc.com “China‟s value- added tax reform, capitl accumulation, and welfare implications”,
china economic review, volume 19, issue 2, June 2008, pages 197-214, www.science direct.com, shuangllin LIN.