Embed Size (px)
Citation preview

A STUDY ON FOREIGN DIRECT INVESTMENT
INFLOWS INTO INDIA
A thesis submitted to BHARATHIDASAN UNIVERSITY for the award of the degree of
DOCTOR OF PHILOSOPHY IN
ECONOMICS
By
G. PANNEERSELVAM [Reg. No. 014973/Ph.D.2/Economics/Part-Time/July 2008]
Research Supervisor:
Dr. P. NATARAJAN Assistant Professor
POST GRADUATE AND RESEARCH DEPARTMENT OF ECONOMICS RAJAH SERFOJI GOVERNMENT COLLEGE (Autonomous)
[Affiliated to Bharathidasan University, Tiruchirapalli]
THANJAVUR-613 005 - TAMIL NADU - INDIA
AUGUST 2011

Dr.P. NATARAJAN, M.A., M.Phil., M.Ed., Ph.D., M.B.A., P.G. and Research Dept. of Economics, Assistant Professor, Rajah Serfoji Govt. College (Autonomous), Thanjavur -613 005.
Date:
CERTIFICATE
This is to certify that the thesis entitled A STUDY ON FOREIGN
DIRECT INVESTMENT INFLOWS INTO INDIA submitted to Bharathidasan
University, Tiruchirapalli, for the award of the degree of DOCTOR OF
PHILOSOPHY IN ECONOMICS is a bonafide record of research work carried
out by Thiru G. PANNEERSELVAM, under my guidance and supervision in the
P.G. and Research Department of Economics, Rajah Serfoji Government College
(Autonomous), Thanjavur, Tamil Nadu, India.
I further certify that no part of the thesis has been submitted anywhere else
for the award of any degree, diploma, associateship, fellowship or other similar
titles to any candidate.
(P. NATARAJAN) Research Adviser

DECLARATION
I hereby declare that the work embodied in this thesis has been originally
carried out by me under the supervision of Dr. P. NATARAJAN, Assistant
Professor, P.G. and Research Department of Economics, Rajah Serfoji
Government College (Autonomous), Thanjavur and this work has not been
submitted either whole or in part for any other degree or diploma at any university.
Date:
(G. PANNEERSELVAM) Research Scholar

ACKNOWLEDGEMENTS
At the outset, I wish to express my gratitude to Dr. P. Natarajan, M.A.,
M.Phil., M.Ed., Ph.D., M.B.A., Assistant Professor of Economics, Rajah Serfoji
Government College (Autonomous), Thanjavur, for his excellent guidance and
invaluable help throughout the study. Mere words would not sufficient to
explain his persistent encouragement, advice and help to complete this research.
It is a great pleasure and excellent experience to work under his guidance.
I thank Prof. C. Ramakrishnan, M.Sc., M.Phil., Principal, Rajah Serfoji
Government College (Autonomous), Thanjavur, for having granted permission
to me to do Ph.D. programme.
I sincerely thank Ms. A.C. Vijayakumari, M.A., M.Phil., H.O.D., and
Mr.V.Durairaj, M.A., M.Phil., M.B.A., Associate Professor, P.G. and Research
Department of Economics, Rajah Serfoji Government College (Autonomous),
Thanjavur, for their timely help and moral support.
I sincerely thank Dr. R. Rajendran, Associate Professor of Economics,
Government Arts College (Men), Kumbakonam, for acted as Doctoral Committee
Member and help me for my research work.
I thank Mr. P. Nadimuthu, Assistant Professor of Economics, A.V.V.M. Sri
Pushpam College (Autonomous), Poondi, Mr. G. Santhakumar and
Mr. S. Thennarasu, Research Scholars in Economics, P.G. and Research
Department of Economics, for their help for the successful completion of this
work.
I thank Mr. C. Ravindran, Research Scholars, P.G. and Research
Department of Economics, R.S.G. College (Autonomous), Thanjavur, for his
continuous effort and help for the successful completion of this research work.

I express my sincere thanks to Mr. V. Murugesan, Assistant Professor of
Statistics, R.S.G. College (Autonomous), Thanjavur, for his help in Statistical
application in my research work.
I am thankful to the Librarian and staff members of libraries of Rajah
Serfoji Government College, Bharathidasan University, IFMR, Chennai, M.K.
University, Madurai, for their timely help to collect theories and review of
literature.
Last but not least I owe a great deal to my parents, my wife, daughter and
son, sister and brother, for their selfless and constant help. And I express my
heartfelt thanks to all the colleagues and friends for their valuable help.
My sincere thanks are due to M/s. Nagu Computers, Thanjavur, for neat
execution and perfect preparation of the thesis.
G. Panneerselvam

LIST OF TABLES
Table No.
Title Page
5.1. Foreign investments in India 155
5.2. Foreign Direct Investments 158
5.3. Foreign Portfolio Investments 161
5.3a. Correlation Analysis 164
5.4. Share of Top Investing countries FDI Inflows 165
5.5. Sectors Attracting Highest FDI inflow 168
5.6. Foreign Direct Investments (Including Advances and Loan) 171
5.7. Monthly FDI inflows During the Financial year 2009-10 174
5.8. Month wise FDI Inflows for the year 2010-2011 177
5.9. Foreign Technology Transfer Approvals 180
5.10. Foreign Technological Transfer Approvals (State-wise) 183
5.11. Foreign Technological Transfer Approvals (Sectors-wise) 186
6.1. Revised FDI Inflows (Equity + additional components of FDI) 190
6.2. Foreigner’s Foreign Direct Investment 193
6.3. Foreign Direct Investment 196
6.3a. Correlation Analysis 199
6.4. RBI’S regional offices-wise FDI inflows 200
6.5. Foreign Investment in Insurance Companies in India 204
6.6. Distribution of FDI by Region for the years 1980-2005 208
6.7. Summary of survey result (concluded) (Per cent of responses to UNCTAD survey) 211
6.8. Distribution of FDI inflows among economics by range, 2010 – Asia 212

Table No.
Title Page
6.9. Top 15 countries FDI, by factors favouring investment, 2009-2011 (Per cent of all responses for a given country) 213
6.10. FDI inflows of select Asian countries 215
6.11. FDI inflows into Asia 217
6.12. Distribution of FDI inflows into Developing countries 220
6.13. Global Distribution of Global FDI inflows 223

LIST OF FIGURES
Figure No.
Title Page
1. Foreign investment in India 157
2. Foreign Direct Investment 160
3. Foreign Portfolio Investment 163
4. Share of Top Investing Countries FDI inflows 167
5. Sectors Attracting Highest FDI inflow 170
6. Foreign Direct Investment (including Advances and Loans) 173
7. Monthly FDI inflows during the financial year 2009-10 176
8. Monthly FDI inflows 179
9. Foreign Technology Transfer Approvals 182
10. Foreign Technology Transfer Approvals (State-wise) 185
11. Foreign Technological Transfer Approvals (Sector-wise) 188
12. Revised FDI Inflows 192
13. Foreigner’s Foreign Direct Investment 195
14. Foreign Direct Investment 198
15. Decadal Distribution of FDI by Region 210
16. FDI Inflows into Asia 219

LIST OF ABBREVIATIONS
AIIP - Annual Incremental Increase in Percentage
BITS - Bilateral Investment Treaties
BOP - Balance of payments
CAD - Current account deficit
CIS - Commonwealth of Independent States
CMIE - Centre for Monetary Indian Economy
CSO - Control Statistical Organisation
DCA - Department of Company Affairs
DEA - Department of Economic Affairs
DIPP - Department of Industrial Policy and Promotion
DIPP - Department of Industrial Promotion and Policy
ECBS - External commercial borrowings
ECD - Exchange Control Department
EMES - Emerging market economics
EPZ - Export Processing Zones
EXIM - Export-Import
FDI - Foreign Direct Investment
FEMA - Foreign Exchange Management Act
FERA - Foreign Exchange Regulation Act
FII - Foreign investment in India
FIPB - Foreign Investment Promotion Board
FPI - Foreign Portfolio Investment
FTC - Foreign Technical Collaboration
GDP - Gross domestic product
GDRs - Global Depository Receipts
ICRIER - Indian Council for Research on International Economic Relations
IEM - Industrial Entrepreneur’s Memorandum
IIMS - Indian Institutes of Management

IITS - Indian Institutes of Technology
IT - Information Technology
ITES - Information technology enabled services
MIGA - Multilateral Investment Guarantee Agency
MNCs - Multinational Companies
MNES - Multinational enterprises
NIC - National Information Centre
NIES - Newly Industrialized Economics
NRI - Non-Resident Indian
OCB - Overseas Corporate Body
OGL - Open General License
QIP - Qualified institutional placement
RBI - Reserve Bank of India
REER - Real effective exchange rates
RIB - Resurgent India Bond
SEBI - Security Exchange Board of India
SEE - South East Europe
SEZs - Special Economic Zones
SIA - Secretarial for Industrial Assistance
TMG - Technical Monetary Group
TNCs - Transnational Corporations
UKTI - United Kingdom Trade and Investment
UNCTAD - United Nation Conference Trade and Development
US - United States
WIR - World Investment Report

CONTENTS
CHAPTER PAGE
I INTRODUCTION 1
II REVIEW OF LITERATURE 20
III ECONOMICS OF FOREIGN DIRECT INVESTMENT 80
IV THEORIES AND POLICY OF FDI IN INDIA 111
V DATA ANALYSIS 154
VI DATA ANALYSIS – CONTINUATION 189
VII FINDINGS, SUGGESTIONS AND CONCLUSIONS 226
BIBLIOGRAPHY i
APPENDIX
Contributions by the Research Scholar

Chapter - I
Introduction

Chapter - II
Review of Literature

Chapter - III
Economics of Foreign Direct Investment

Chapter - IV
Theories and Policy of
FDI in India

Chapter - V
Data Analysis

Chapter - VI
Data Analysis - Continuation

Chapter - VII
Findings, Suggestions and Conclusions

Bibliography

Appendix
Contributions By the Research Scholar

Chapter I
INTRODUCTION
Foreign Direct Investment is a component of a country’s
national financial accounts. Foreign direct investment is the
investment of foreign assets into domestic structures, equipment, and
organizations. It does not include foreign investment into the stock
markets. Foreign direct investment is thought to be more useful to a
country than investments in the equity of its companies because
equity investments are potentially “hot money” which can leave at
the first sign of trouble, whereas FDI is durable and generally useful.
FDI motivate economic growth for every stage of development of a
country. Developing countries experience both strong capital
accumulation and technology transfer through FDI.
Now-a-days well accepted that both economic growth and
development are highly dependent on improving not just the
availability of capital, but also access to technological capabilities,
infrastructure and resources. This has gone hand-in-hand with an
increasing economic liberalization of most developing countries. The
role of the MNE as a viable source of both capital and technology is
one of the key features of this new openness. Foreign direct
investment is that investment, which is made to serve the business
interests of the investor in a company, which is in a different nation
distinct from the investor’s country of origin. A parent business

2 enterprise and its foreign affiliate are the two sides of the FDI
relationship.
Foreign direct investment (FDI) in India has played an
important role in the development of the Indian economy. FDI in
India has – in a lot of ways – enabled India to achieve a certain
degree of financial stability, growth and development. This money
has allowed India to focus on the areas that may have needed
economic attention, and address the various problems that continue
to challenge the country. India has continually sought to attract FDI
from the world’s major investors. In 1998 and 1999, the Indian
national government announced a number of reforms designed to
encourage FDI and present a favourable scenario for investors.
Statement of the problem
Foreign direct investment, which is inward, is a typical form
of what is termed as ‘inward investment’. Here, investment of
foreign capital occurs in local resources. The factors propelling the
growth of inward FDI comprises tax breaks, relaxation of existent
regulations, loans on low rates of interest and specific grants. The
idea behind this is that, the long run gains from such a funding far
outweights the disadvantage of the income loss incurred in the short
run. Flow of inward FDI may face restrictions from factors like
restraint on ownership and disparity in the performance standard.
Foreign direct investment, which is outward, is also referred to as
“direct investment abroad”. In this case it is the local capital, which
is being invested in some foreign resource. Outward FDI may also

3 find use in the import and export dealings with a foreign country.
Outward FDI flourishes under government backed insurance at risk
coverage.
Foreign direct investment may be classified by their set target.
The areas here are Greenfield investment and Acquisitions and
Mergers. Greenfield investments involve the flow of FDI for either
building up of new production capacities in the host nation or for
expansion of the existent production facilities of the host country.
The plus points of this come in form of increased employment
opportunities, relatively high wages, R&D activities and capacity
enhancement.
The flip side comes in the form of declining market share for
the domestic firm and repatriation of profits made to a foreign
country, which if retained within the country of origin could have led
to considerable capital accumulation for the nation. Multinationals
mostly rely on mergers to bring in FDI. Until 1997 mergers and
acquisitions does not render any long run advantage to the economy
of the host nation as under Greenfield investments. Consistent
economic growth, de-regulation, liberal investment rules, and
operational flexibility are all the factors that help increase the inflow
of Foreign Direct Investment.
FDIs can be broadly classified into two types: outward FDIs
and inward FDIs. This classification is based on the types of
restrictions imposed, and the various prerequisites required for these

4 investments. An outward-bound FDI is backed by the government
against all types of associated risks. This form of FDI is subject to
tax incentives as well as disincentives of various forms. Risk
coverage provided to the domestic industries and subsidies granted
to the local firms stand in the way of outward FDIs, which are also
known as ‘direct investments abroad.’ Different economic factors
encourage inward FDIs. These include interest loans, tax breaks,
grants, subsidies, and the removal of restrictions and limitations.
Factors detrimental to the growth of FDIs include necessities of
differential performance and limitations related with ownership
patterns.
Though the services sector in India constitutes the largest
share in the Gross Domestic Product, still it has failed to some extent
in attracting more funds in the forms of investments.
Foreign direct investments in India are approved through two
routes
1. Automatic approval by RBI
The reserve Bank of India accords automatic approval within a
period of two weeks to all proposals and permits foreign equity up to
24%; 50%; 51%; 74% and 100% depending on the category of
industries and the sectoral caps applicable. The lists are
comprehensive and cover most industries of interest to foreign
companies. Investments in high-priority industries or for trading

5 companies primarily engaged in exporting are given almost
automatic approval by the RBI.
2. The FIPB Route – Processing of non-automatic approval cases
FIPB stands for Foreign Investment Promotion Board which
approves all other cases where the parameters of automatic approval
are not met. Normal processing time is 4 to 6 weeks. Its approach is
liberal for all sectors and all types of proposals, and rejections are
few. It is not necessary for foreign investors to have a local partner,
even when the foreign investor wishes to hold less than the entire
equity of the company. The portion of the equity not proposed to be
held by the foreign investor can be offered to the public.
The spillovers from foreign direct investment through
multinational enterprises have attracted considerable attention in
recent times. Existing empirical studies on FDI spillovers largely
look at the productivity enhancing effects and horizontal spillovers
of foreign firms in the same industry sector ignoring the possibility
of spillovers through buyer-supplier or backward linkages. Increased
competition in the domestic market post-liberalisation through sales
of foreign firms is forcing domestic firms to look for export markets.
The domestic firms are not benefited in improving their export
performance through any buyer-supplier linkages with the MNEs.

6 The extent of globalisation of a country’s economy is usually
evaluated from its trade and investment relations with the rest of the
world, especially the volume and growth of trade from that country.
Exports help firms to achieve greater efficiency in production
through economies of scale due to increased market size. Studies
point out that exports may also improve the innovative activities of
the firm, with new varieties of products and new methods of delivery
to be competitive in quality and to stay in the business. For an
exporter to be successful in a foreign market requires good
knowledge about the foreign market conditions such as foreigners;
preferences, regulations, distribution channels and other market
characteristics. However, collecting information on some of the
above-mentioned variables may usually be costly and this may deter
entry of firms into the foreign market. There can be substantial
reduction in sunk entry cost with various types of foreign contacts
since such contacts may provide knowledge on foreign conditions.
There are different channels through which foreign contacts can take
place, the most important is through the foreign direct investment
(FDI) by multinational enterprises (MNEs).
MNEs typically have a presence in many markets, making
them a potential source of information about foreign markets,
consumers and technology. Therefore, higher foreign equity
participation by MNEs may lead to higher export performance. This

7 impact on exports of domestic firms is through direct contact with
the multinationals. Sometimes, the presence of MNEs in the
domestic market itself would increase the export performance of
domestic firms. The information with the MNEs on foreign markets
may leak out to the domestic firms even if they do not participate in
joint ventures with foreign firms. This externality is one type of
“spillovers” from FDI. Spillovers can also take place when the
presence of MNEs improves the productive efficiencies of domestic
firms, making their products competitive in price and quality in the
international market, thus improving their export performance. These
types of spillovers are known as “horizontal spillovers” since they
occur to domestic firms in the same industry group of foreign firms
through competition. Similarly, the multinational buyers of
intermediate goods may provide information about other possible
international purchasers of those products, so that the domestic
intermediate goods producers can expand their production and
achieve the economies of scale that will in fact reduce the price of
their products. This aspect of spillover from foreign firms arising
through buyer-supplier linkages are mostly known as “backward
spillovers”.
The literature classifies FDI based on MNE’s market strategy
into domestic market-seeking and export-oriented. Most of the
developing countries (China, Malaysia, Indonesia, Thailand, etc.) are

8 now mostly looking at export-oriented FDI to strengthen their export
competitiveness. Export-oriented FDI can be expected to generate
strong links with the local economy compared to local market-
oriented FDI in the host country specifically because it is motivated
to exploit the location advantages offered by the host country such as
low-cost labour, raw materials, components and parts, among others.
The presence of export-oriented FDI and the interaction with them
may induce the domestic firms to diversity into export market when
information on foreign markets brought in by foreign firms spill over
to them. While local market-oriented FDI may crowd out domestic
firms and investments, export-oriented FDI can stimulate investment
by generating demands for intermediate goods. The experience of
China and Mexico shows that these countries were able to increase
their international market shares mostly by attracting export-oriented
FDI (UNCTAD 2002). Therefore, it is expected that spillover effects
will be large from the presence of export-oriented MNEs compared
to domestic market-seeking ones.
However, such type of growth-led, efficiency seeking and
export-oriented FDI can be materialized only if the regulatory
regime facilitates greater freedom to the MNEs in their operations.
The protected markets are more likely to attract tariff-jumping FDI
which are, therefore, likely to be more domestic market-seeking.
Economic liberalisation through opening up of the economy will

9 force the tariff-jumping, market-seeking type of MNEs to restructure
their strategies due to increased competition from imports, new
foreign firms and diligent indigenous firms. The existing MNE-
affiliates would have to look at technology upgradation either
through technology imports or through research and development (R
& D) activities to strengthen their competitiveness. The MNEs
would also have to look at external markets to maintain their growth
and profitability. Therefore, economic liberalisation would not only
attract more efficiency-seeking, export-oriented FDI but also force of
existing MNEs to reframe their strategies. The presence of foreign
firms with their sales, international marketing exposure and expertise
are expected to increase the competitiveness and export orientation
of domestically owned firms in developing countries through either
“horizontal spillovers” or “backward spillovers”.
INDIAN INVESTMENT TREATY PROGRAMME IN THE
LIGHT OF GLOBAL EXPERIENCES
An exponential growth in bilateral investment treaties,
accompanied by an increasing number of investor-state investment
disputes has given rise to two global issues. One, the relationship
between the number of such treaties and investment inflows, and
two, concerns over the compromise of regulatory discretion due to
obligations imposed. In the Indian context the most important
regulatory framework on foreign investment.

10 There is no comprehensive multilateral treaty framework to
regulate global investment flows. Instead, there exists a scattered and
fragmented regulatory regime to regulate global investment flows in
the form of bilateral investment treaties (BITS). BITS – often
perceived as admission tickets to investments – are agreements
signed between two countries under which each country binds itself
to offer treaty-based protection to investments and investors of the
other country. This treaty-based protection includes the condition of
not expropriating or nationalizing foreign investment unless or until
there is a public purpose and is accompanied by due compensation;
not discriminating between foreign and domestic investment and
between foreign investments from different counties; treating
investors and investments in a fair and equitable manner; allowing
free repatriation of profits and other investment-related funds. Above
all, it includes a provision on investor-state dispute settlement
system with the power to enforce arbitral awards. Under this, an
individual foreign investor can directly bring a case at an
international arbitral tribunal without the consent of the state and in
many cases without exhausting the local remedies in the host
country, if it is of the view that the host country has violated the BIT.
In the last two decades, there has been an exponential growth of
BITS – from about 500 in 1990 to more than 2,500 by the end of
2008 (UNCTAD 2009). This exponential growth in BITS has also
been accompanied by an increasing number of investor-state

11 investment disputes – from a mere 14 disputes reported in 1987-98
to 317 till the end of 2008.
This exponential growth in the number of BITS and disputes
has given rise to two important issues. The first issue relates to
whether there is a direct co-relationship between a country signing
BITS and investment inflows in the light of the fact that many
countries are entering into BITS to presumably attract investment.
The second issue is related to the concerns expressed over the
compromise of regulatory discretion of host countries due to the
obligations imposed by BITS as evident from the disputes involving
the scrutiny of impact of regulatory discretion on investments. The
purpose of this note is to look at the gigantic Indian investment
treaty (BIT) programme in light of these two important global issues.
However, before these two issues are discussed, it will be pertinent
to offer a couple of disclaimers followed by a brief outline of the
Indian BIT programme. The two disclaimers are as follows – first,
this note looks at the Indian BITS from the perspective of India
being a host nation and not from the perspective of India being a
capital exporting country; and second, the limited space available
makes it impossible to discuss all the issues raised in the note, in
great detail.

12 Important sectors of the Indian Economy attracting more
investments into the country are as follows:
Electrical Equipments (including Computer Software and
Electronic)
Telecommunications (radio paging, cellular mobile, basic
telephone service)
Transportation industry
Services Sector (financial and non-financial)
Fuels (Power + Oil Refinery)
Chemical (other than fertilizers)
Food Processing Industries
Drugs and Pharmaceuticals
Cement and Gypsum products
The arrival of new and existing models, easy availability of
finance at relatively low rate of interest are key catalysts of growth in
the globalised economy, particularly for emerging market
economies. The role of Foreign Direct Investment in the present
world is noteworthy. It acts as the lifeblood in the growth of the
developing nations. Flow of the FDI to the countries of the world
truly reflects their respective potentiality in the global scenario. Flow
of FDI truly reflects the country’s both economic and political
scenario.
A larger Foreign Direct Investment Inflows require for the
development of multi various activities in different sectors like
agriculture, health, education, energy, national highways, industries,

13 infrastructure and employment generation. The FDI inflows play a
peculiar role in the development of the economy. In a globalised
economy the FDI inflows is must for the development of the
economy. The present study brings about an economic analysis of
the Foreign Direct Investment inflows into India.
Objectives of the study
The following are the objectives of the present study.
To analyse the trends of FDI inflow into India from 1991-92
to 2009-2010.
To analyse the FDI openness of Select Asian Countries.
To analyse the sectors attracting highest FDI inflows into
India.
To analyse the Foreign Technology Transfer.
To analyse the share of top investing countries FDI inflow.
Hypotheses
The following are the hypotheses of the study
FDI inflows into India since 1991 shows an increasing trend.
FDI openness of select Asian countries show the positive
trends.
Foreign Technology Transfers shows the Green signal to the
growth and development of the Economy.
Methodology
The present study completely relies upon the secondary data
published by the Reserve Bank of India (RBI), United Nations
Conference for Trade and Development (UNCTAD), Secretariat for

14 Industrial Assistance (SIA), Centre for Monitoring Indian Economy
(CMIE), Central Statistical Organisation (CSO) and Economic
Survey of Government of India. The secondary data relating to
various dimensions of FDI such as inflow of FDI into India, FDI
openness of Select Asian countries, the sectors attracting highest FDI
inflows into India etc. have all been collected for economic analysis.
Such statistical tools like, percentage, simple growth rates,
mean average, frequency tables, correlation have been used in the
study. For data illustration suitable diagrams and trend lines have
also been used. The collected data have been classified, tabulated
and analysed.
Limitations
There are certain limitations in the present study namely,
1. Lack of continuous time series data in the RBI Bulletin and
other sources of publication, so some tables have been framed
only with available data.
2. Since the non-availability of some data for some years under
the study period more number of statistical applications could
not be given.
3. Ph.D. theses on FDI is very rare in our Universities; Hence the
more review from theses could not be given.
Period of the study
The present study covers the period of 19 years from 1991-92
to 2009-2010. In addition to it, monthly FDI inflows and revised FDI
inflows have also been analysed for the year 2010-2011.

15 CONCEPTS
Foreign Direct Investment
FDI is the process whereby residents of one country (the home
county) acquire ownership of assets for the purpose of controlling
the production, distribution and other activities of a firm in another
country (host country).
Private Debt Flows
Private Debt Flows composed of bonds, bank loans and other
credits issued or acquired by private enterprise without any public
guarantee. Official Development Finance (ODF) consists of
development assistance and other flows.
Portfolio Investment
Portfolio investment is guided by the speculative gain and
involves in acquiring financial assets such as equities, bonds and
debentures. As a matter of fact what has become highly mobile
across the world is not productive capital, but financial capital,
especially in the form of hot money.
Equity Capital
Equity Capital refers to the foreign investors’ purchase of
shares of an enterprise in a country other than its own.

16 Re-invested Earnings
Re-invested Earning comprise the direct investors’ share of
earnings not distributed dividends by affiliates or earning not
remitted to the direct investors. Such retained profits of affiliates are
invested.
Vertical Mergers
Vertical Mergers implies merger of firm involved in different
stages of the production of a single final report.
Horizontal Mergers
Horizontal Mergers implies the merger of two or more firm
engaged in similar activities in the same industry.
Conglomerate Mergers
Conglomerate mergers involves merger of firms engaged in
unrelated activities.
Horizontal FDI
Horizontal FDI is undertaken to produce the similar goods
abroad as in the home country.
Vertical FDI
Vertical FDI is undertaken for either to exploit raw materials
(backward vertical FDI) or to be nearer to the customers through the
acquisition of distribution outlets (forward vertical FDI).

17 Conglomerate FDI
Conglomerate FDI involves both horizontal and vertical FDI.
Import-Substituting FDI
Import-substituting FDI involves production of goods
previously imported by the host country. This type of FDI is
determined by the market size of the host country.
Export-increasing FDI
Export-increasing FDI is motivated by the desire to seek new
sources of input. It helps to increase the export of the host country.
Government-initiated FDI
Government-initiated FDI is a type attracted by the incentive
offered by the government in an attempt to eliminate balance of
payment crisis.
Forms of Investments
Foreign Direct Investment (FDI) is permited as under the
following forms of investments
Through financial collaborations.
Through joint ventures and technical collaborations.
Through capital markets via Euro issues.
Through private placements or preferential allotments.

18 Forbidden Territories
FDI is not permitted in the following industrial sectors:
Arms and ammunition.
Atomic Engery.
Railway Transport.
Coal and lignite.
Mining of iron, manganese, chrome, gypsum, sulphur,
gold, diamonds, copper, zinc.
Foreign Investment through GDRs (Euro Issues)
Indian companies are allowed to raise equity capital in the
international market through the issue of Global Depository Receipt
(GDRs). GDR investments are treated as FDI and are designated in
dollars and are not subject to any ceilings on investment. An
applicant company seeking Government’s approval in this regard
should have consistent track record for good performance for a
minimum period of 3 years. This condition would be relaxed for
infrastructure projects such as power generation, telecommunication,
petroleum exploration and refining, ports, airports and roads.
Clearance from FIPB
There is no restriction on the number of Euro-issue to be
floated by a company or a group of companies in the financial year.
A company engaged in the manufacture of items covered under

19 Annex-III of the New Industrial Policy whose direct foreign
investment after a proposed Euro issue is likely to exceed 51% or
which is implementing a project not contained in Annex-III, would
need to obtain prior FIPB clearance before seeking final approval
from Ministry of Finance.
Use of GDRs
The proceeds of the GDRs can be used for financing capital
goods imports, capital expenditure including domestic
purchase/installation of plant, equipment and building and
investment in software development, prepayment or scheduled
repayment of earlier external borrowings, and equity investment in
JV/WOSs in India.
Chapterisation
Chapter I is introductory, presenting the statement of the
problem, objectives, hypotheses, methodology and
chapter scheme.
Chapter II presents the review of literature of the earlier studies.
Chapter III presents the theoretical background on Economics of
Foreign Direct Investment.
Chapter IV presents the theories and policy of FDI in India.
Chapter V deals with the data analysis relating to Foreign Direct
Investment Inflows into India.
Chapter VI continuation of the data analysis.
Chapter VII Findings, suggestions and conclusions.

Chapter II
REVIEW OF LITERATURE
Liberalisation of foreign policy of India since 1991 has played
a vital role in the reform perspective of Indian Economy and has
increased the volume of investment, level of production,
improvement of technology, higher level of employment generation
and thereby increase access in the Global market. The policy now
allows 100 per cent foreign ownership in a number of industries and
obtaining permission has greatly been simplified. Industries are
eligible for automatic approval upto some extend of foreign equity
viz. 55, 74 and 100 per cent the potential foreign investors can invest
within these limit in India and register with the Reserve Bank of
India. For higher level than the automatically permitted listed
industries can directly apply to the Foreign Investment Promotion
Board of India (FIPB) which may be immediately considered for
their investment in India. In 1993, foreign institutional investors had
been allowed to purchase the shares of listed Indian companies in the
stock markets. These types of activities have created a highly
competitive environment in Indian industries since 1991.
A large numbers of research papers and articles have been
published about Foreign Direct Investment in India. Reviews of a

21 selected authors are discussed here which may be very useful for the
understanding of the present study.
Changing contours of capital flows to India
According to Mohan (2007) the Indian experience with
capital flows during the period 1950s to the first decade of this
century reveals a paradigm shift from a prolonged period of capital
scarcity to one of surplus. The key structural aspects volatile pattern
of inflows. The key structural aspects include a significant shift from
official to private capital flows and from debt to non-debt flows.
Non-resident Indian deposits show considerable sensitivity to
interest and exchange rate fluctuations. The corporate preference for
overseas borrowings is predominantly influenced by domestic
activity; but the persistence of interest rate arbitrate and global credit
market shocks also have a significant impact. Foreign institutional
investment inflows and stock prices have a bidirectioal causal
relationship with a time varying nature of the stock price volatility.
Volatile capital flows rather than trade flows seem to drive real
exchange rate movements with consequences for the real economy.
The trade channel was considered as the traditional mode of
the integration of the global economy. However, international
mobility of capital, particularly since the 1970s, has provided a new
dimension to the concept of openness and economic integration. The

22 liberalization of India’s external sector and increasing integration
into the global economy in the 1990s and the current decade have
resulted in the relative dominance of the financial channel over the
conventional trade channel. While the aggregate trade flows
increased from 10 per cent of the gross domestic product (GDP) in
the 1970s to 28 per cent in the first decade of the 2000s, gross capital
flows (inflows + outflows) increased sharply from 4 per cent of GDP
to 30 per cent during the same period. These developments were
underpinned by a sustained momentum in domestic real activity,
corporate sector restructuring, a positive investment climate, a long-
term view of India as an investment destination and favourable credit
conditions in the global market. However, the absorption of capital
flows has remained low with a moderate level of the current account
deficit (CAD) in the 1990s and the current decade and the
consequent build-up of foreign exchange reserves.
Against the above backdrop, large capital inflows have
implications for the real sector of the economy through interest and
exchange rate channels. The excessive capital inflows beyond the
absorptive capacity, in conjunction with workers remittances and
software exports, could have the potential for creating an overvalued
exchange rate and the consequent erosion of long-term
competitiveness of the traditional goods and services sectors – the
Dutch disease phenomenon. It is argued that given the employment

23 dimensions of the traditional sectors of the economy, the Dutch
disease syndrome is managed by way to reserve management and
sterilization, the former preventing excessive nominal appreciation
and the latter preventing higher inflation (Mohan, 2007). Some of the
concerns emanating from the expansionary phase of the capital flow
cycle have abated with a reversal in the cycle since the mid-2008.
However, a sudden shift from expansionary to contractionary phase
of the capital flows cycle to emerging market economies (EME’s)
and India has potential costs in terms of financial market instability
and an adverse impact on investment and the real sector of the
economy. Thus, the rapid movement of capital flows and high
volatility associated with capital flows is a challenging issue for
macroeconomic management.
The literature on international capital flows reveals that
mobility of flows is associated with various benefits and costs. In
terms of benefits to the financial markets, the increased mobility of
capital contributes to the development of markets in terms of
liquidity and price discovery. At the same time, as evident from
various crises across countries during the 1990s, an increase in
volatility of capital flows poses several risks to the financial markets
and the real economy. The surges in capital flows to the EME’s and
the associated overshooting of the exchange rate and the currency
crises have led to the proliferation of literature on the subject. It

24 broadly focuses on two major implications of volatile capital flows,
i.e., for macroeconomic stability and financial stability. Short-term
volatile capital flows have a significant influence on asset prices,
exchange rate, interest rate, consumption, investment, trade and thus,
the aggregate demand, rendering some of the earlier anchors of
monetary policy formulation possibly obsolete. The aggregate
demand, in turn, affects output and prices, the two key policy
objectives.
Policy Shifts, Magnitude and Composition of Capital Flows
A historical account of the policy approach to international
capital flows to India suggests that begging with the 1950s, a
complex maze of controls was imposed on all external transactions
between residents and non-residents independent of trade or other
policies. In fact, a significant part of the control regime to subserve
the developmental efforts of the planning era was built upon the
framework of war-related controls, which was put into a more
rigorous framework through legislation in 1973 due to fears of
capital flight (Reddy, 2000). Thus, external financing was done
dominantly through reliance on official flows from the 1950s
through the 1970s. The decade of the 1980s, however, heralded a
regime shift in capital flows to India with ascendancy of private
capital flows in the form of external commercial borrowings
(ECBS), non-resident Indian (NRI) deposits and short-term trade

25 credit. The liberalization of the foreign investment regime in the
1990s heralded a further shift in the capital flows to India,
particularly the equity flows. In the aftermath of the balance of
payments (BOP) crisis of 1991, policy actions were initiated as a par
of the overall macroeconomic management to achieve stabilisation
and structural changes.
The external sector policies designed to progressively open up
the Indian economy formed an integral part of the structural reforms.
In the 1990s, the lessons drawn from managing the crisis led to
external sector policies that emphasized consolidation of external
debt and a policy preference for non-debt creating capital flows. The
key policy responses to capital flows have been in the form of a
strong hierarchy in the sources and types of flows, liberalization of
inflows relative to outflows, but freeing up of all the outflows
associated with inflows and a shift from administrative or quantity-
based controls to price-based measures. The anatomy of the
instruments of controls reveals that restrictions on capital inflows are
a mix of both quantity and price, taking into consideration the
hierarchy of capital flows. However, the controls on outflows are
mainly quantity-based. The gradual withdrawal of restrictions on
capital inflows and the liberalization of outflows seem to have
reinforced capital inflows.

26 The current global financial crisis has, however, highlighted
the strong sensitivity of global capital flows to financial shocks and
swift changes in the perception of risk towards EME’s. The sudden
reversal in the capital flow cycle to India led policy responses in the
form of an upward adjustment of the interest rate ceiling on NRI
deposits, substantial relaxation in the ECB’s regime for corporates,
allowing access to ECB’s to non-banking financial companies and
housing finance companies and relaxation in the interest rate ceilings
for trade credit. Thus, the emphasis shifted from the policy dealing
with consequences of heavy inflows to sudden reversals of such
flows and the potential volatility. Thus, the inherent volatile nature
of capital flows to EMES underlines the importance for an active
capital account management.
Shift from Official to Private Debt Flows
Mikesell (1968) it is argued that foreign aid can facilitate
economic and social transformation by overcoming temporary
shortages in specific human and material resources, promoting
strategic activities, inducing and facilitating critical government
policies and providing working capital for carrying out programmes
involving a transformation of the structure of the economy. A time
series analysis of several countries in Asia, including India, Pakistan
and China, suggests that aid contributed to growth both in poor and
middle income countries (Krueger, 1978; Islam, 1992). There is no
27 evidence to suggest that countries that received a large amount of
external aid have performed poorly (apart from countries suffering
from civil or external conflicts) and the empirical evidence that high
aid levels exert an independent negative impact on governance is
unconvincing (World Bank, 2003). It is often argued that
governments of the aid-receiving countries divert foreign aid from
intended purposes to various unproductive uses and/or to support
general government expenditure. Various studies have indeed found
fungibility of foreign aid. Despite differing viewpoints, the role of
external assistance in the development process of developing
countries cannot be overemphasized.
External assistance in the form of concessional, non-market-
based finance from bilateral and multilateral sources remained as a
mainstay of the capital account of India’s BOP till the early 1980s.
Towards the end of the 1970s, the concessionality in the aid flows
dwindled. Thus, with the rising external financing requirements in
the 1980s and the recognition that reliance on external assistance was
not favourable, there was a shift in the overall approach towards aid
flows. In the recent decades, the policy towards management of
external liabilities has changed and the initiative is towards attracting
private capital flows, especially non-debt creating direct investment
inflows. Thus, the share of official assistance in total capital flows to

28 India has consistently declined from 33 per cent in the 1970s to
about 6 per cent in the first decade of this century.
In the 1980s, a widening CAD, increasing financing
requirements and diminishing role of official aid led to a shift in the
policy choice towards commercial borrowings from international
capital markets. The recourse to commercial borrowings by the
Indian corporates, though began in the 1970s, remained modest due
to the dominance of external aid. The commercial borrowings were,
however, regulated by an approval procedure subject to conditions
on cost, maturity, end use and ceiling. In the second half of the
1980s, financial institutions and public sector undertakings increased
their participation in the international bonds market, consequently
the share of ECB’s in net capital flows to India more than doubled to
27 per cent in the 1980s from that in the 1970s. Following the BOP
crisis of 1991 and downgrading of sovereign ratings, firms’ access to
global markets virtually dried up.
Thus, a prudent external debt management policy was pursued
to bring the external debt to a comfortable level. The ECBS rose
significantly in the latter half of the 1990s responding to the strong
domestic investment demand, favourable global liquidity and credit
rating, lower risk premia on EME bonds and an expansionary phase
of the global capital flow cycle. During this period, ECBS

29 constituted about 30 per cent of net capital flows to India. In the
subsequent period (late 1990s and the early years of this decade), the
demand for ECB’s remained subdued due to a host of factors such as
the global economic slowdown, reversal of the cycle of capital flows
to EMES and moderate domestic demand. The period beginning
2003 marked the resumption of debt flows to EMES, which was a
combined outcome of a higher interest rate differential, robust
growth expectations and a low risk perception. During this period,
Indian corporates also increased their resource to ECB’s, which
contributed to about 25 per cent of the net capital flows to India.
Capital Account Management and Sterilisation
The literature suggests that initial policy response to deal with
volatile capital flows has been market intervention combined with
sterilization. Sterilisation is found to have either halted or delayed
appreciation of the domestic currency, but not effectively check
inflows, mainly due to the persistence of interest rate differential.
Direct controls on portfolio inflows in particular have been found to
be effective only in limited cases, that too for a short period and
circumvented through financial engineering. Therefore, capital
controls have been interpreted as a short-term palliative within the
gamut of policy options. While the mature and well developed
financial markets absorb the risk associated with exchange rate
fluctuations with limited spillover to the real activity, the developing

30 countries with underdeveloped financial markets and lack of
resilience to absorb the shocks have inherently higher volatility
arising of external shocks. Thus, large swings in capital flows over a
very short period of time impose significant adjustment costs and
large output and employment losses on the EMES (Mohan, 2009).
Exchange rate volatility arising of volatile capital flows has
significant adverse consequences, particularly for countries which
specialize in labour-intensive and low-intermediate technology
products in an intensively competitive global market.
During the expansionary cycle of capital inflows to India, a
clear movement of higher trade deficit and appreciating real effective
exchange rates (REER) was evident. Particularly since 2004-05,
despite a large trade deficit, a rise in capital inflows led to
appreciation of the real exchange rate. Capital flows have emerged
as the key driver of the REER movements rather than the movements
in the trade or current account. The contractinoary phase of capital
inflows has been associated with a depreciating REER. Thus, the
volatile movement in capital flows to India, beyond its implications
for monetary management, poses challenges for trade
competitiveness and the real economy.
The analysis of capital flows to India from the 1950s to the
first decade of this century reveals a structural shift in the 1980s

31 from the dominance of external assistance to the primacy of private
capital flows. The consequent effects of the expansionary phase in
capital flows were evident in the overall movement in the REER
driven by capital flows rather than the trade deficit, the expansion in
domestic liquidity and associated sterilization costs. A sudden shift
in the risk perception to EMES emanating from the global financial
crisis was evident in the reversal of the capital flow cycle to India in
2008 with challenges of large inflows giving way to the concerns of
sharp reversals and their implications for the domestic financial
market stability and the real sector. Second, the decline in debt flows
reflected the policy-induced changes in the composition of the
capital account in favour of non-debt flows. Reflecting the service-
led growth of the economy and the comparative advantage in trade in
services, FDI inflows to India have been increasingly concentrated in
the services sector. Another key feature is that such inflows have
displayed stability even during the various episodes of major global
financial shocks.
Third, responding to the policy changes in favour of
progressive liberalization of outward investment, Indian corporates
have expanded with an increasing concentration into trading and
non-financial services – a shift from the manufacturing. Fourth, FII
investments are characterised by higher volatility and sudden
reversals. The causality analysis showed that FII flows and the stock

32 market have a bi-directional causal relationship with time varying
nature of the stock price volatility. Fifth, while the overseas
commercial borrowings are significantly influenced by the pace of
domestic activities, interest rate arbitrage also plays an important
role. However, the current global financial crisis shows that the
global credit market shocks have a significant impact on raising
ECBS. Sixth, NRI deposits display a sensitivity to interest and
exchange rate expectations, which builds in an element of instability
to such inflows.
Gupta, in his book “Post reform India; emerging trends”
mentioned that Foreign Direct Investment generates employment,
foreign exchange and taxable income for the host county. In addition
to that the presence of foreign investment in the county could raise
the productivity of locally owned firms.
According to Prof. Nasim A. Zaidi one of the problem
associated with foreign capital in India in recent year is that large
amount of capital is coming in the form of portfolio investment
rather than in the form of foreign direct investment. As far as the
aspect of disciplining foreign capital is concerned only legislation is
not adequate to achieve the objective. The state requires economic
power – a production base and command over capital. Public sector
should fulfill, at least, three major requirement. Namely (i)

33 Productive Efficiency (ii) To generate a re-investible surplus and (iii)
most important of all, it should become instrument in the hand of the
state to demonstrate how capital under social control can be
mobilized. These are the ways to discipline capital and this is how
China is dealing with foreign capital.
According to Goel for attracting more Direct Foreign
Investments like China, India has to intensify reforms process so that
it will percolate down to lower levels of geographical units like
districts and mandals. In this context it is pertinent to note that the
leader of Japaneese delegation visited India. Conceded that there is a
“great gap” between the average Japaneese business man’s
perspective of India and the prevailing reality. To attract more FDI
the government should also introduce reforms in public
administration to cut short bureaucratic hurdles to be eliminated so
that it will be possible for India to get higher foreign direct
investments. Upgradation of production technologies are the top
priorities of foreign direct investments and this exercise is to be
taken in the primary, secondary and tertiary sectors of India on
higher scale, which will benefit in creasing employment prospects in
India. Ultimately the causal factors of growth are valued added
activities, upgradation of technologies in the sectoral economies and
better environment for attracting higher foreign direct investments.

34 FDI in Higher Education – Official Vision Needs Correction
Rajesh Kumar Sharma discusses that the decision of the
government of India to allow foreign direct investment in higher
education is based on a consultation paper prepared by the commerce
ministry, which is marked by Shobby arguments, perverse logic and
forced conclusions. This article raises essentially four issues which
need critical attention: the objectives of higher education, its
contextual relevance, the prevailing financial situation and the
viability of alternative to FDI.
The first issue is addressed in the light of four requirements
one of - which strangely - is improved literacy. A link is suggested
between “market-complementary arrangements in education” in the
developed countries and the high levels of literacy that obtain there.
Improved literacy has all along been tagged with better primary
education, yet the consultation paper expects to somehow raise the
literacy levels with FDI in higher education.
The second requirement is to contain the outflow of money to
other countries in the shape of fees and related expenditure. The
paper does not, however, rely on any data based study of the courses
and institutions chosen by the Indian students abroad. It does
confront the reality that a very large number of students go abroad to
work and earn not to get education at some internationally reputed

35 university. It is also silent on how the fees received by foreign-based
universities in India will be utilized.
The third requirement, based on a McKinsey-NASSCOM
study, is the need to train a large number of graduates to handle the
expected bonanza of offshore business and to work for multinational
companies. Most of these “millions” of jobs will be in the
information technology (IT) and information technology enabled
services (ITES) sectors and will certainly not require Harvard-
standard education. Moreover, let us not expect a few Harvard and
Oxford-like satellite campuses in India to turn out graduates in
millions over the next five or six years.
The fourth requirement arises from the dubious ambition to
join the league of education-exporting countries like the US, UK and
Australia. The idea that we will import education as just another
commodity. Also, we should not forget that the best universities in
the west do not treat education as a business and may not be
interested to come to India “to do business”. In the name of the best,
let us not open our gates to unscrupulously mercenary corporate
interests. In any case, have we given a chance to our own universities
to perform at their best? The Indian Institutes of Technology (IITs)
and Indian Institutes of Management (IIMs) did come up without
FDI.

36 To say the least, these four requirements only constitute short-
term objectives and are formulate in terms of current trends in world
business. But higher education also needs long-term objectives and a
broad vision in tune with the projected future of the country and the
world. Its contextual relevance in the case of India has to be
conceived in terms of our civilisational history and the contribution
we wish to make to the future of humanity. Unfortunately, the
consultation paper makes no efforts to understand the peculiarities of
the Indian situation in the national and global contexts.
Nagarajan (2005) says in his paper the government needs to
clarify the confusion surrounding the promoter holding in private
banks. It is ironical that when the government is thinking of 74 per
cent FDI in private banks the Reserve Bank of India has issued draft
norms restricting promoter holding to 10 per cent. RBI recently
proposed that no single entity or a group could hold more than 10 per
cent of the paid-up capital in a private Indian bank. It has also
capped the holding of one private bank, including foreign ones
present in India, in another private bank at 5 per cent, besides asking
promoters to reduce their holding to 10 per cent in three years. If
banks were to follow the first draft guidelines, a number of private
banks would have to realign their shareholding pattern. The United
Forum of Bank Union has threatened to go on strike to protest
centre’s map for banking sector reform. The forum in its recent

37 Bangalore meeting, expressed its concern that allowing 74 per cent
FDI would result would result in foreign capital taking over
country’s private banks and controlling their huge resources.
Indian government keep abreast of global changes through
initiation of prompt reform measures, attracting FDI on par with
other developed and developing nations become a difficult task,
especially in competing with country like China which is number
one most favoured and ultimate destination for foreign direct
investment, and loosing its pride as a number three on FDP map.
Therefore in a clear infrastructure was most critical area where huge
injection of funds was required. In order to gain momentum, banking
sector should take a view of uniform legislation for the public and
private sector banks. While public sector banks are ruled by the
National Banking Act, SBI by the SBI Act and private sector banks
by the companies Act, there is need to have uniform act which is
applicable to all. The blue print to the banking sector reforms should
also address the issue of more autonomy to the public sector banks
especially in relation to opening of branches, says Kohli Chairman
and MD of Punjab National Bank.
Narayana (2006) says in his paper inflow of FDI in
Karnataka that no consistent trend either increasing or decreasing is
evident between FDI and economic growth and between FDI and

38 exports, during 1993-94 to 2003-04. However, a positive correlation
is evident between FDI inflows and economic growth since 2001-02
and between FDI inflows and total exports before 2001-02. This
suggests a need for periodization for the study of relationship
between FDI and economic growth and FDI and exports, in the State
since 1991.
FDI inflows, along with exports, have been contributing to the
process of economic globalization. This process is mainly driven by
the ICT sector. In general, the remarkable performance of ICT sector
is accountable for (a) availability of low cost, highly skilled,
communicative and mobile technical manpower, (b) globally
competitive management and practices, (c) promotional and
developmental policies and progrmames by way of providing fiscal
and financial incentives and concession. Provision of infrastructure
facilities and good governance measures and (d) historical and
natural cluster of ancillary industries in electronic and electrical
sector. Thus, these factors need to be strengthened as strategies for
attraction of larger FDI inflows in future.
Karnataka’s experiences in building databases, identifying
investment opportunities, formulating investment promotion
programmes under the general and sector-specific industrial and
infrastructure policies, constructing performance indicators for

39 competitive attraction and deriving implications on regional
economic growth, exports and globalization are of relevance and
applicability for other states in India. In the same way, subject to the
comparability of economic structures, Karnataka’s experiences are
relevant for sub-national FDI promotion policies in other developing
countries. In fact, the relevance and applicability above establish a
basis for comparative studies between Karnataka and other regions
in India and elsewhere in the developing world.
Kaur Mandeep et al. (2004) said in their paper that FDI has
always been a subject of intense debate. About a decade back FDI
was not easily welcomed by developing countries. Developed
countries have been experiencing inflow but in recent times there is
sudden increase in the level of the FDI inflow. The case and
consequences of FDI inflow indicates that large part of economic
growth of developed countries is attributed to the level of FDI
inflows. In a most liberalized economic environment, the flow of
foreign direct investment appears to follow a law of gravitation. i.e.
free flow of capital from capital surplus country to capital deficient
country. Given the intense competition among the countries for
attracting FDI inflows in the recent period, the ability of South Asian
countries as a group to expand their share in developing world is
indeed commendable. However, much of the increase in the inflows
to the region has been accounted for my India. This is because of the

40 policy reforms in 1991, though India has experienced a declining
trend in 1998 and 1999. Nepal has received modest magnitudes of
FDI inflows in 1990s. In 1999, FDI inflows to Nepal jumped to US$
132 million from US$ 12 million in 1998. With a view of changing
pattern of investment in the world. Economic restricting programme
of the governments of India Nepal reflect the efforts to attract FDI
for the countries.
Foreign Direct Investment in Retail
EAS Sharma (2005) says in his paper “Need for Caution in
Retail FDI” though the government has been considering opening up
the retail business to foreign direct investment for some time, it must
first examine the constraints faced by traditional retailers in the
supply chain and institute a package of safety nets as Thailand has
done, India should also draw lessons from the restrictions placed on
the expansion of organized retailing, in terms of sourcing capital
requirement, zoning, etc., in other Asian countries. This article
comments on the retail FDI report that was commissioned by the
department of consumer affairs and suggests the need for a more
comprehensive study.
India’s retail trade is largely in the hands of the unorganized
sector. Only recently, large supermarkets, departmental stores and
luxury shopping malls have started making their entry in some cities.
41 These are owned and managed by Indian promoters, though some
foreign retailers have made a backdoor entry through franchises and
export oriented whole sale activity.
For some time, the government has been considering opening
up the retail business to foreign direct investment (FDI). FDI is
indeed a sacrosanct world, the most frequently chanted mantra of
economic reform in India since 1991. While many other sectors have
already been exposed to FDI, due to opposition from the Left and the
various trade associations, the retail sector has had to wait for quite
some time. It is perhaps against this background that the department
of consumer affairs promptly commissioned. Indian Council for
Research on International Economic Relations (ICRIER) to carry out
a study on foreign investment in the retail sector. So that the
government may take a early decision. The outcome of that study is
the report on FDI in the retail sector. The report contains several
recommendations of FDI in the retail sector. The major
recommendation is that the India retail sector should be opened up to
49 per cent FDI straightaway and 100 per cent later on. The strategy
of opening up should be checked up by appropriate reform measures
in other sectors. Within the WTO framework, unilateral
liberalization should precede multilateral commitments. Evidently,
these recommendations will have far-reaching implications for the
traditional retailers in the country.

42 To appreciate the arguments in support of the
recommendations, one need to understand the nature of retailing in
India and consider the inputs and the analysis that went into the
different chapters of the report. A person selling fruits and
vegetables on a cart or a more stationary wayside shopkeeper selling
grocery articles and food items represents the majority of retail
traders in India. Each of these vendors usually occupies not more
than 30-40 square feet of space at best, less than the parking lot
appropriated by a customer’s automobile in the sprawling frontage of
a modern departmental store. But, these faceless, voiceless small-
time traders, around 15 million in all, constitute 98 per cent of the
country’s retail business, contribute around 10 per cent of GDP and
account for 6-7 per cent of total employment. Had all the rules and
regulations relating to land use, workers rights, quality standards,
taxation, etc. been strictly enforced, these small traders would never
have survived. Being unorganized, they have no access to bank loans
and are constantly under threat of eviction from the petty
bureaucracy of the government.
It is against the above background that the report and its
recommendations need to be evaluated. Since 98 per cent of retailing
in India is in the unorganized sector, the department of consumer
affairs or any other concerned ministry should commission a more
detailed study of that sector and analyse the impact of expansion of

43 the organized sector, as well as the implications of the entry of
foreign players for both organized and unorganized sectors within
the country. The study should focus on the direct and indirect
employment potential of each of these sectors, in relation to the
magnitudes of investments required. The employment and
investment implications may vary from sector to sector, region to
region and rural to urban. Such a study should necessarily over all
segments of the supply chain, so that the government may have a
better appreciation of the total benefits and costs, in the short term as
well as in the long-term. Before opening up the retail sector, the
regulatory structures in the related sectors need to be strengthened,
as otherwise, foreign players as well as the larger domestic retailers
could exploit the traditional retailers. It may not be desirable to open
up retailed to FDI until reforms in the related sectors are undertake
and competitiveness of domestic retailers in enhanced.
Meanwhile, the government should examine the constraints
face by traditional retailers and other players in the supply chain and
institute safety nets as has been done in Thailand and other countries
in Asia. Most Asian countries have put in place restriction in terms
of sourcing, capital requirement zoning etc. in order to regulate the
expansion of organized retailing. India should draw lessons from
this.

44 The retail sector is a highly sensitive one because of its
immense contribution to the economy. Decisions regarding FDI in
this sector should not therefore be taken in haste.
Foreign Direct Investment
India has been ranked at the second place in global foreign
direct investments in 2010 and will continue to remain among the
top five attractive destinations for international investors during
2010-12, according to United National Conference on Trade and
Development (UNCTAD) in a report on world investment prospects
titled, ‘World Investment Prospects Survey 2009-2012.
The 2010 survey of the Japan Bank for International
Cooperation released in December 2010, conducted among Japanese
investors, continues to rank India as the second most promising
country for overseas business operations.
A report release in February 2010 by Leeds University
Business School, commissioned by UK Trade and Investment
(UKTI), ranks India among the top three countries where British
companies can do better business during 2012-14.
India is ranked as the 4th most attractive foreign direct
investment (FDI) destination in 2010, according to Ernst and

45 Young’s 2010 European Attractiveness Survey. However, it is
ranked the 2nd most attractive destination following China in the next
three years.
Moreover, according to the Asian Investment Intentions
survey released by the Asia Pacific Foundation in Canada, more and
more Canadian firms are now focusing on India as an investment
destination. From 8 per cent in 2005, the percentage of Canadian
companies showing interest in India has gone up to 13.4 per cent in
2010.
India attracted FDI equity inflows of US$ 1,274 million in
February 2011. The cumulative amount of FDI equity inflows from
April 2000 to February 2011 stood at US$ 128.642 billion, according
to the data released by the Department of Industrial Policy and
Promotion (DIPP).
The services sector comprising financial and non-financial
services attracted 21 per cent of the total FDI equity inflow into
India, with FDI worth US$ 3,274 million during April-February
2010-11, while telecommunications including radio paging, cellular
mobile and basic telephone services attracted second largest amount
of FDI worth US$ 1,410 million during the same period. Housing
and Real Estate industry was the third highest sector attracting FDI

46 worth US$ 1,109 million followed by power sector which garnered
US$ 1,237 million during April-December 2010-11. The Automobile
sector received FDI worth US$ 1,320 million.
During April-February 2010-11, Mauritius has led investors
into India with US$ 6,637 million worth of FDI comprising 42 per
cent of the total FDI equity inflows into the country. The FDI equity
inflows from Mauritius is followed by Singapore at US$ 1,641
million and the US with US$ 1,120 million, according to data
released by DIPP.
The Government has approved 14 FDI proposal amounting to
US$ 288.05 million, based on the recommendations of Foreign
investment Promotion Board (FIPB) in its meeting held on March
11,2001. These include:
Kolkata based Dhunseri Investments got approval for FDI
worth US$ 159.62 million.
Mauritius based Ghir Investments got the approval of the
Board for induction of foreign equity in an investing company.
The company had proposed to get FDI worth US$ 118.36
million.
Unihom India Pvt. Ltd. got approval for issue and allotment of
partly paid up Rights Equity shares to carry out the business of

47
technical and engineering consultants, advisors, planners,
engineering for construction of roads, airports and bridges.
PCRD Services Pvt. Limited, Singapore, got approval to
increase the foreign equity percentage in an investing
company,
G+J International Magazines GmbH, Germany, got clearance
for induction of foreign equity to carry out the business of
publication and sale of speciality and life style magazines in
India.
Kyuden International Corporation, Japan got approval for
setting up a joint venture (JV) company that will make
downstream investments in the business of developing and
establishing renewable power projects.
The total merger and acquisitions (M and A) and private
equity (PE) (including qualified institutional placement (QIP))
deals in the month of February 2011 were valued at US$ 8.27
billion (76 Deals) as compared to US$ 1.95 billion (84 Deals)
in the corresponding month of 2010, according to the monthly
deals data released by Grant Thornton India.
External Commercial Borrowings (ECBs)
The higher net inflows of US$ 3,999 million of ECBs in 1997-98
compared to US$ 2,848 million in 1996-97 reflected lower
amortization. Disbursements in 1997-98 stood at U.S.$ 7,371

48 million, which was marginallylower than U.S.$ 7,571 million
recorded in 1996-97. ECB approvals in 1997-98 have been placed at
U.S.$ 8,712 million which is slightly higher than the level in 1996-
97. Regarding sectoral allocation, power accounted for the highest
approvals of U.S.$ 3 billion, followed by telecom with U.S.$ 1.5
billion. In 1998-99 up to 23.12.98, approvals have been placed at
U.S.$3,804 million. The reduced attractiveness of ECB of the
corporate sector has been underscored by a very steep decline in
actual disbursements to U.S.$ 1.6 billion in the first two quarters of
1998-99 compared to U.S.$ 4.3 billion in the same period last year.
Increase in cost of ECB funds has come about due to a general
increase in the risk premium for emerging market borrowers,
downgrades by international credit rating agencies and the rise in
forward premia. After several years of unchanged or slightly
improving ratings, major rating agencies started to re-examine our
ratings in early 1997. Both the deteriorating external environment
and persistent large fiscal deficits have been cited as the main
reasons for downgrading.
ECB is approved by the Government within an annual ceiling
that is consistent with prudent debt management, keeping in view the
balance of payments position. The existing ECB policy was
reviewed in 1998-99 in light of the financial needs of various sectors
and the impact on international markets of both the East Asian crisis

49 and economic sactions. Regarding the sectoral requirements,
infrastructure and exports continue to be accorded high priority in
ECB allocation.
Non Resident Deposits
The Resurgent India Bond (RIB) scheme, launched in the
current financial year, was upon to both NRIs/OCBs and the banks
acting in fiduciary capacity on behalf of them. The scheme, that
opened on August 5, 1998 and closed on August 24, 1998, mobilized
U.S.$ 4.2 billion. The interest rates on these five year bonds were
7.75 per cent for U.S. dollar, 8 per cent for Pound Sterling, and 6.25
per cent for Deutsche Mark. Other features of RIBs include joint
holding with Indian residents, allowing them to be gifted to Indian
residents, easy transferability, loanability, premature encashment
facility, and tax benefits 45. Net inflows under non-resident deposits
declined from U.S.$ 3,314 million in 1996-97 to U.S.$ 1,119 million
in 1997-98. The outflow under FCNRA continued due to redemption
payment. Also, the relative rates of return and the perceived risk
premium on emerging market debt has influenced the flows into
these accounts. Some of the domestic policy-related factors which
seem to have contributed towards subdued net flows include
imposition of incremental cash reserve ratio of 10 per cent on non-
resident deposits and the linking of interest rates under FCNR(B)
with LIBOR, which had the effect of lowering interest rates offered

50 under this scheme, and thereby reducing its attractiveness. In order to
encourage mobilization of long-term deposits, and concomitantly to
discourage short-term deposits, the interest rate ceiling on FCNR(B)
deposits of one year and above was raised and the ceiling on such
deposits below one year was reduced in April 1998, 46. As at the end
of March 1998, outstanding balances under various non-resident
deposits schemes stood at U.S.$ 20,367 million. Comparison of
estimated net flows under non-resident deposits during April-
November 1998 vis-à-vis the corresponding period in 1997 shows a
compositional shift in favour or Rupee denominated accounts in
response to policy initative undertaken in 1997-98. Net inflows
under non-residents deposits (excluding redemption payments under
FCNRA which had since been discontinued) at US$ 367 million
during April-November, 1998 were substantially lower than those of
US$ 2266 million in the same period of 1997. Positive flows have
been recorded only in the NR(E)RA and NR(NR)RD schemes. The
initiatives in terms of freeing of interest rates and removal of
incremental CRR, may have acted as incentives to attract deposits in
these accounts.
Lass (1993), Coase (1987) in their work about the growing
importance of FDI throughout the world, argued that with certain
transaction cost the firm’s internal procedures are better suited than
the market to organise transaction. Mundell (1957) has also

51 concluded on the same line that foreign direct investment should
ultimately flow into those countries that are importing goods from
abroad. Because of market imperfection; such as tariffs and quotas,
foreign forms will find it attractive to produce locally in order to
satisfy domestic demand.
The economists like Rosenstein Rodan (1961), and Chenery
and Strout (1966) in the early 1960s show that foreign capital
inflows have a favourable effect on economic efficiency and growth.
Chenery and Strout (1966) have also stated that external finances
could enhance growth prospects of recipient countries by
augmenting domestic availability of investable surpluses. In the
above framework, external financial inflows are presumed to result
in a virtuous circle of growth. This stands out in sharp contrast to an
earlier study by Haavelmo (1965), who observed that domestic
savings in recipient countries could be negative, if capital inflows
became large enough, implying thereby that external finance did not
necessarily supplement, but might actually replace domestic savings.
Experts like Schmitz and Helmberger (1970) as well as
Dunning and Norman (1983) (quoted in Stephen et al., 1993)
contend that foreign direct investment creates vertically integrated
production units and therefore increases the amount of trade.
Numerous factors have compelled many developing economies to

52 change their earlier versions of trade, industrialisation and foreign
direct investment. This has been because, FDI inflows do not have
many of the costs previously associated with it and that many
developing countries have managed to industrialise successfully with
FDI. The most appropriate examples are of East Asian Economic or
newly industrialized economies (NIEs).
A number of studies show the central role played by
technology diffusion in the process of economic growth Nelson and
Phelps, 1966; Grossman and Helpman, 1991 and Barro and Sala-
I-Martin, 1955. Endogenous growth models look at FDI as an
important vehicle for the transfer of technology and knowledge
(Balasubramanyam et al., 1996) and show that FDI can have long-
run effects on growth by generating increasing returns in production
via externalities and productivity spillovers. Aitken, Hansen and
Harrison (1997) show the spillover effect of FDI on exports with the
example of Bangladesh, where the entry of a single Korean
multinational in garment exports led to the establishment of a
number of domestic export firms, creating the country’s largest
export industry. Moreover, FDI can contribute more to growth than
domestic investment when there is sufficient absorptive capacity
available in the host country (Borensztein et al., 1998). This is
because FDI flows today are not confined to the primary sectors of
developing countries but to modern manufacturing.
53 To make their operations more productive and efficient,
transnationals take with them high levels of technology. In 1913 the
primary sector accounted for more than half of FDI flows to
developing countries and the manufacturing sector only 10 per cent,
in 1990 about 40 per cent of FDI went to manufacturing, 50 per cent
to services and only 10 per cent to primary sector (Dutt, 1997;
Bahaduri, 1996). Thus FDI can lead to higher growth by
incorporating new inputs and techniques (Feenstra and Markusen,
1994). Thus FDI can lead to higher growth by incorporating new
inputs and techniques (Feenstra and Markusen, 1994), Kathuria
(1998) finds that technology spillovers from FDI in Indian
manufacturing have significant benefits. Wei (1996) uses urban data
to show that FDI produces technological spillovers in China and
explains growth differentials among Chinese urban areas. There are
good theoretical reasons to show that the growth consequences of
FDI depend on what kinds of sectors receive FDI and that the change
in sectoral flows strengthen the positive effects and weaken the
negative ones (Dutt, 1997).
FDI is also an important source of human capital
augmentation and provides specific productivity increasing labour
training and skill acquisition through knowledge transfers. De Mello
and Sinclair (1995) show that FDI can promote knowledge transfers
even without significant capital accumulation as in the case of

54 licensing and start-up arrangements, management contracts and joint
ventures in general.
The idea of trade-related international knowledge spillovers
developed by Grossman and Helpman (1992) is extended by Walz
(1997) to FDI to show that FDI is accompanied by interregional
spillovers of knowledge from the more to less advanced countries.
Policies leading to an inflow of FDI therefore speed up the growth
process and anything from investment controls for TNCs to specific
taxes on their repatriation of profits hurts the international growth
process and thereby the consumers in the developing country. Thus,
theoretically speaking, the main avenues by which FDI can affect
growth are productivity spillovers, human capita augmentation and
technological change, though it becomes very difficult to incorporate
these in empirical studies as these are not easy to measure.
The dependency theorists believe that FDI can have a
favourable short-term effect on growth. In the long-run, however, as
FDI accumulates, it can have negative effect on the rest of the
economy due to the intervening mechanisms of dependency, in
particular, “decapitalization and “disarticulation” (lack of linkages;
see Stoneman, 1975; Bornschier, 1980).

55 Doukas and Travelos (1988) found positive abnormal returns
as a result of foreign acquisition in countries in which the firms were
not operating before. Goldberg and Klein (1998) identified a clear
relation between real exchange rates and FDI from Japan and the
United States into Southeast Asian Countries (Indonesia, Malaysia,
the Philippines and Thailand). Crutchley, Guo and Hansen and Chen,
Hu and Shieh examined the effect of joint venture announcements on
stock price with reference to investment in Japan and China
respectively. Both studies showed positive abnormal returns about (1
per cent in the case of Japan and 52 per cent in the case of China) as
a result announcements. However, in an examination of 136 foreign
investment announcements during the period (1971-86) around the
world, Pradhan, wort and Strickland (1991) found significant excess
negative returns for firms making such decisions. The study by
Pradhan and Wort examined the wealth effect for shareholders by
classifying foreign investments by geographical boundaries into
Asian markets and rest of the world. The results of their study
indicate insignificant positive abnormal returns for investments in
Asian market, while indicating significant negative abnormal return
for rest of the world.
Research by Brainard (1997) and Ekholin (1998) shows that
greater distance from producing countries actually encourages
domestic market-oriented investment, since the cost of exporting is

56 more than cost of producing there. However, Hymer (1970),
Kindelberger (1970), Vernon (1966) and Caves (1971) argue that
oligopolistic structure of markets, international integration, imports
and the level of foreign direct investment are complementary. In a
world of perfect markets transnational corporations (TNCs) would
not have existed and all activities would have been carried out
through free trade (Kindleberger, 1969). Knicker Backer (1973)
found that FDI prosper in oligopolistic type market condition. FDI
by one firm in an oligopolistic environment might trigger similar
activities by other firms. Showing the importance of export-oriented
FDI, Sach and Warner (1995) indicated that export-oriented FDI
links the local economy to the international economy. Openness to
both imports and exports has been shown to be powerful force for
growth and growth has so far been the only credible means of
alleviating absolute poverty.
Bajpai and Sachs (1997) in their study concluded that in the
current global scenario, it is possible for India to achieve very
dynamic growth based upon labour-intensive manufacturing that
combines the vast supply of Indian labour including skilled
managerial and engineering labour, with foreign capital technology
and markets. However, from the long-term development point o
view, we are of the view that India has tremendous growth prospects
through export-led growth and that export-led growth involves a

57 broad range of sectors, both traditional and new (Bajpai and Sachs,
1998). The most interesting by far of the new sectors is software and
information technology.
A comprehensive study by Bosworth and Collins (1999)
provides evidence on the effect of capital inflows on domestic
investment for 58 developing countries during 1978-95. The sample
covers nearly all of Latin America and Asia, as well as many
countries in Africa. The authors distinguish among three types of
inflows: FDI, Portfolio investment, and other financial flows
(Primarily bank loans).
Bosworth and Collins find that an increase of a dollar in
capital inflows is associated with an increase in domestic investment
of about 50 cents. They conclude that the benefits of financial
inflows (FDI) were sufficient to offset the evident risks of allowing
markets to freely allocate capital across the border of developing
countries. Borensztein, De Gregorio, and Lee (1998) find that FDI
increases economic growth when the level of education in the host
country-a measure of its absorptive capacity is high.
Mello (1999) considered that FDI affects growth through the
accumulation of capital as well as by the transfer of knowledge.
These hypotheses were tested with time series and panel data. The

58 time series results were not conclusive. The panel data showed that
FDI has a positive effect upon growth as a result of the transfer of
knowledge in OECD countries, but not in the rest. The effect upon
the accumulation of capital was only manifested in the non-OECD
countries. This indicates that the end result depends on the
complementarity or substitution of foreign and domestic investment.
Agarwal (2000) analysed economic impact of FDI in South
Asian Countries: India, Pakistan, Bangladesh, Sri Lanka and Nepal
and found that FDI inflows in South Asia were associated with a
manifold increase in the investment by national investors, suggesting
that there exist complemenarity and linkage effects between foreign
and national investment. The impact of FDI inflows on growth rate
of GDP is found to be negative prior to 1980, mildly positive for
early eighties and strongly positive over the late eighties and early
nineties. Hence, FDI is more likely to be beneficial in the more open
economies.
Bailliu (2000) analysed the impact of private capital flows,
financial development and economic growth in 40 developing
countries during 1975-95 and found that capital inflows faster higher
economic growth, above and beyond any effects n the investment
rate, but only for economies where the banking sector has reached a
certain level of development.

59 The several results obtained by Lipsey (2000) allows us to
infer that the effect of FDI on growth is positive, but reduced, and
depends strongly on the interaction with the level of schooling in the
host country. Soto (2000), working with panel data for developing
countries for the 1986-97 period, concluded that FDI contributes
positively to growth through the accumulation of capital and the
transfer of technology.
Global Development Finance (2001) report summarizes the
findings of several other studies on the relationships between private
capital flows and growth, and also provides new evidence on these
relationships. Both economic theory and recent empirical evidence
suggest that FDI has a beneficial impact on developing host
countries.
Wang (2001) examined the impact of FDI inflows on 12
Asian economies: Bangladesh, China, Hong Kong, India, Indonesia,
Korea, Malaysia, Pakistan, Philippines, Singapore, Thailand and
Taiwan during the period 1987-97 and found that FDI in
manufacturing sector has a significant and positive impact on
economic growth in the host economies.
A causality test between FDI and product growth was
proposed by Nair-Reichert and Weinhold (2001), based on panel

60 data for 24 developing countries between the years of 1971 and
1985. The main conclusion here was that the relation between
investments, whether foreign or domestic, and product growth was
strongly heterogeneous, and that FDI efficiency was positively
influenced by a country’s degree of trade openness.
Buckley and others (2002) used panel data for several regions
in China for the 1989-98 period. In the first place, the author points
out that if the rate of growth of FDI has positive effect upon GDP
growth, the reverse does not hold true. Secondly, no evidence was
found to support the hypothesis according to which the efficiency of
FDI depends on a minimum level of human capital. Contrastingly,
human capital is more significant in less developed provinces, while
FDI stimulates growth notably in the more developed provinces.
India’s neighbours that are relying heavily on FDI, such as
China, Indonesia, Malaysia, and Thailand, have been pulling far
ahead of India in economic growth, income levels and productivity,
while also increasing their security and geopolitical influence in the
world community. According to world investment report 2003
(UNCTAD), “Foreign Investors regard both China and India as a
hub for relocation of labour intensive activities. In India, the
relocation has been confined to the services, particularly information

61 and communication technology. In China, about 2/3rd of FDI flows
flow into a diverse range of manufacturing industries.”
Pradhan Jaya Prakash (2003) while empirically verifying
the role of FDI in the growth process of developing countries found
that the growth effect of domestic investment is relatively more
sensitive than FDI to the level of human development. For
developing countries with higher human development, the impact of
domestic investment on growth is not only positive but also
statistically significant, whereas, it has no significant impact in the
case of developing countries with lower human development. The
study found that the international linkages has a major role in the
growth process, if the country has a lower human development than
a country with a higher human development.
The research paper of Shalini Sharma and Ruchi Sharma
(2003) developed two alternative econometric models to examine the
degree of relationship between FDI inflows and GDP. The study
used the data of 29 countries and related directly to development, as
measured by income, in order to provide a scientific base to the oft-
repeated commonsense speculation about the role of FDI in
development. But no evidence was found to support the thesis that
the rates of growth of GDP and FDI are related.

62 The study of Nawal Kisor (2003) expressed that FDI has
helped in accelerating the economic growth of many countries.
According to the study, the importance of FDI is more in case of
developing countries, which require capital, capital is more
significant in less developed provinces, while FDI stimulates growth
notably in the more developed provinces.
India’s neighbous that are relying heavily on FDI, such as
China, Indonesia, Malaysia, and Thailand, have been pulling far
ahead of India in economic growth, income levels and productivity,
while also increasing their security and geopolitical influence in the
world community. According to world investment report 2003
(UNCTAD), “Foreign Investors regard both China and India as a
hub for relocation of labour intensive activities. In India, the
relocation has been confined to the services, particularly information
and communication technology. In China, about 2/3rd of FDI flows
flow into a diverse range of manufacturing industries.”
A very recent study on “Impact of foreign direct investment
on Indian economy since economic liberalization” by Mohd. Firoz
Alam (2005) reveals that the FDI is an important avenue through
which investment takes place in a country. The importance of FDI
extends beyond the financial capital that flows into the country.

63 It is clear from the above discussion that the FDI flows can
induce economic activity and growth in various ways. However,
Singer (1950) argues that FDI has a detrimental effect on developing
countries and leads to uneven global development. This is based on
the premise that FDI going to developing countries is mainly in the
primary sector. However, Singer (1975) modifies his views by
focusing on differences between countries rather than commodities.
Griffing (1970) and Weisskopf (1972) also support the view that
FDI from developed to developing countries does not have beneficial
effects.
The empirical studies of Karikari (1992) and Saltz (1992)
also do not find support for a positive relationship between FDI and
economic growth. Karikari (1992) tests for causality using data for
Ghana and finds that FDI does not affect output. In a cross-sectional
study of developed and less developed countries, Saltz (1992) finds a
negative correlation between FDI and economic growth.
Despite the evidence presented in recent studies, other work
indicates that developing countries should be cautious about taking
too uncritical an attitude towards the benefits of FDI. Hausmemn and
Fernandez-Arias (2000) point to reasons why a high share of FDI in
total capital inflows may be a sign of host country’s weakness rather
than its strength.

64 In the 1970s, an important contribution was the doctoral thesis
of Hymer (1976), where he came out with the industrial organization
explanations of DI, and argued that the capital-arbitrage hypothesis
of international capital movement was inconsistent with the obvious
motives and patterns of multinational companies’ investment. As per
Hymer, the organizations investing abroad should possess certain
ownership advantages, or firm specific advantages, to compete with
the domestic firms of another country. This study open new ways of
looking at FDI and the determinants of FDI. Later Caves (1982,
1996) made significant contributions to this school of thought.
The 1970s also witnessed other developments in explaining
FDI. For instance, Buckley and Casson (1976), proposed the
application of internalization theory to explain the FDI based on the
theory of transaction costs. Later on, in a comprehensive framework
Dunning (1993a, 1993b, 1998) has synthesized the explanations of
the past researchers to suggest three conditions for FDI: O-wnership
advantages, L-ocation advantages, popularly known as OLI.
The significance of this OLI framework was explored by most
of the studies on inward FDI in the 1980s and evening the late
1990s. Given the nature of FDI and the fact that the main source of
FDI is the developed countries in the world, the existence of
ownership advantages is a foregone conclusion. That shifts the entire

65 focus on the location advantages and related determinants, for the
inflows of FDI. The locational advantages for FDI arise due to the
existence of certain pull factors in the recipient countries, like large
and growing markets, low wage rates, export orientation, a fair
degree of regionalization of markets, political stability, economic
and fiscal policies conducive to foreign investment, liberalized and
market driven economies, state-of-the-art infrastructure, etc. The
studies based on such indicators and employing multivariate
techniques sought to establish the statistically significant
determinants of inward FDI.
Based on a review of the past studies, we summarize below
selected findings on significant determinants of inward FDI.
Host country markets as a determinant has two facets, market
size and market growth rate. In spite of the strong theoretical base
for the importance of these variables, empirical results have been
observed to vary. Clegg (1995) (quoted in Castro (2000) found in his
study with data for 40 years (1951-90) that when the data for the
entire period was taken, market size and growth rate, were in
significant. Later, when he split the data into two periods 1951-72
and 1973-90, market size was significant in the earlier period and the
growth rate in the later period. So, he concluded that new investment
sought a big market and subsequent investment sought growing

66 market. This may be said to be in accord with a priori reasoning.
Subsequent studies (Hill and Munday, 1992 and Lucas, 1993), for
instance confirm that market size is a significant determinant of FDI.
More recently Chen Chunlai (1997) also found the market size is a
significant determinant of FDI, in his study of 33 developing
countries.
Causality can also run from the state of the economy to FDI
because economic activity itself may be determinant of FDI. This
would be the case if higher economic activity or growth leads to a
larger market size that can increase the attractiveness of a country for
multinationals. The market size may enable investors to exploit
potential economies of scale. Further, foreign investors may be
attracted to a country where technology is changing fast since
technological progress can provide opportunities to increase profits.
Holland and others (2000) reviewed several studies for
Eastern and Central Europe, producing evidence of the importance of
market size and growth potential as determinants of FDI. Tsai
(1994) analysed the decades of 1970 and 1980 and addressed the
endogeneity problem between FDI and growth by developing a
system of simultaneous equations. Also, FDI was alternatively
measured as a flow, and as a stock. Market size turned out to be
more important for FDI flows than growth. The trade surplus

67 presents a negative sign and is significant for FDI, while the flow of
FDI decreases as the nominal wage decreases. On the other hand, the
impact of FDI on economic growth is quite limited.
Campos and Kinoshita (2003) use panel data to analyse 25
transition economies between 1990 and 1998. They reached the
conclusion that for said set of countries FDI is influenced by
economy clusters, market size, the low cost of labour, and abundant
natural resources. Besides all these factors, the following variables
presented significant results: sound institutions, trade openness, and
lower restrictions to FDI inflows.
Internalisation theory introduced the determinant Physical and
Cultural Proximity in the studies of FDI. The physical distance is
expected to increase the cost of intra-firm coordination and factor
input transfers, for example. Cultural distance may inhibit FDI.
Veugelers (1991) (quoted in Castro (2000)) concluded that shared
language and neighbourhood increase FDI. The study of Moore
(1993) also supported the neighbourhood phenomenon.
Political risk has always been ranked high among the
determinants of FDI by most of the studies. Lucas (1993) suggested
events that generate political instability do reduce the flow of FDI,
but they have a short-run impact. The studies of Achinivu (1990) and

68 Soon (1990), concluded that political stability was a significant
determinant of FDI. The difficulty in studying this variable is that
political risk generally is a matter of perception of the country where
the FDI originates. A friendly host country government may still
attract FDI into the country in spite of political risk. Also, the firms
seeking a portfolio balancing effect of their investment across the
world, may be willing to invest in high risk country.
Some economists have studied the effect of variables
(determinants) that determine the flow of FDI. Caves (1982)
concluded that the shortcomings in the availability of intangible
assets such as knowledge, technology, managerial and marketing
skills may lead to the formation of MNCs. Whereas Culem (1988)
reports a positive impact of population upon foreign investment
within developed countries. Economists like Lucas (1990), considers
Political risk as one of the major reasons why capital doesn’t flow
form wealthy to poor nations as freely as predicted by neo-classical
theorists. Aharoni (1966, 1973) in his studies reinforced that
although managers attempt to avoid risk in their investment
decisions, many dimensions of risk are difficult to measure. Thus,
the political risk associated with FDI has a high subjective content.
Considering Exchange Rate volatility and BOP position is
extremely important, when the stake of fixed capital in the
69 investment is high (Dunning, 1993a). Goldberg and Kolstad (1995)
provided a model to explain the impact of exchange rate volatility on
the location of MNEs. Achinivu (1993) found the access to foreign
exchange to be a significant variable a also the ease in repatriation.
Lucas (1993) found a positive association between FDI and the level
of foreign exchange reserves, although the causation here can be
from FDI to reserves as well. Grosse and Trevino (1996) (quoted in
Castro (2000)) suggested that exchange rates were one of the most
significant factors in explaining FDI in US. However, Moore (1993)
found to evidence that German investors favour countries with fixed
exchange rates with deutsche mark.
Infrastructure is an obvious requirement for any investment,
more so with FDI. Loree and Guisinger (1995) studying the
determinants of foreign direct investment by United States in 1977
and 1982 (both towards developed countries as well as toward
developing countries), concluded that variables related to hose
country policy were significant in developed countries only when
infrastructure was an important determinant in all regions. Munteanu
(1991), in his studies found that multinational corporation desires to
operate within a developed nation, possessing a reliable
infrastructure because that will result in more efficient distribution
system. Wheeler and Mody (192) too have shown “Well developed
infrastructure” as a determinant of capital investment by

70 multinationals. The shifts in the determinants of FDI as observed by
the UNCTAD World Investment Report 1998 confirm that created
assets in the form of infrastructure can definitely influence the inflow
of FDI. Macro-economic factors, legal framework and structural
reforms are among the important determinants of FDI. A very recent
paper authored by Venkateswarlu and Kameshwar Rao (2004) brings
into focus the determinants of FDI. The level of per capital GDP and
growth rate of GDP were found as the determinants of FDI.
Fundamental economic factors, e.g., inflation rate, are of not much
value for obtaining FDI. They are useful for portfolio investment.
Garibaldi and others (2001), based on a dynamic panel of 26
transition economics between 1990 and 1999, analysed a large set of
variables that were divided into macro-economic initial conditions,
and risk analyse. The results indicated that macro-economic
variables, such as market size, fiscal deficit, inflation and exchange
regime, risk analysis, economic reforms, trade openness, availability
of natural resources, barriers to investment and bureaucracy all had
the expected signs and were significant.
Review
Following the analysis of Donald-MacDougall and Paul
Streetan (1960), Gerald Meier (1996) observes in their analysis
that, from the stand point of national economic benefit, the essence

71 of the case for encouraging an inflow of capital is that the increase in
real income resulting from the act of investment is greater than the
resultant increase in the income of the investor. If the value added to
output by the foreign capital is greater than the amount appropriated
by the investor, social returns exceed private returns. As long as
foreign investment raises productivity, and this increase is not
wholly appropriated by the investor, the greater product must be
shared with others, and there must be some direct benefits to other
income groups such as domestic labour, consumers, government, and
external economies.
In fact, the effects of FDI on the host country can be classified
into economic, political and social effects. The basic presumption
that is found in the literature, which is based on the principles of
neoclassical economies, is that FDI raises income and social welfare
in the host country unless the optimum conditions are significantly
distorted by protection, monopoly and externalizes (Lalls and
Streetten, 1977).
The economic effects of FDI can also be classified into macro-
effects and micro-effects. The usual convention in analyzing the
macro-effects of FDI is to treat it as a rise in foreign borrowing if
there is unemployment and capital shortage (as it is typically the case
in developing countries). Such borrowing leads to a rise in output

72 and income in the host country. FDI will, under these conditions,
have a beneficial effect on the balance of payments but an
indeterminate effect on the terms of trade (depending on whether the
impact of increased output falls on import substitutes or exports).
The micro-effects of FDI pertain to structural changes in the
economic and industrial organization. For example, an important
issue is whether FDI is conducive to the creation of a more
competitive environment or conversely to a worsening of the
monopolistic and / or oligopolistic elements in the host economy. In
general, the micro-effects pertain to individual firms and individual
industries, particularly those that are closely exposed to and
associated with FDI.
Borenstein and other (1995) tested the effects of FDI on
economic growth in across-country regression framework, utilizing
data on FDI flows from industrial countries to 96 developing
countries over two decades. Their results suggest the following
conclusions:
i) FDI is an important vehicle for the transfer of technology,
contributing relatively more to growth than domestic
investment.
ii) For FDI to produce higher productivity than domestic
investment, the host country must have a minimum
threshold stock of human capital.

73
iii) FDI has the effect of increasing total investment in the
economy more than proportionately, which suggests the
predominance of complementary effects with domestic
firms.
There is relationship between investment and employment. In
the General Theory, Keynes (1936) suggested the existence of a
direct relationship between investment and employment. However,
there is still considerable divergence in views among economists
about the employment effect of FDI. Baldwin (1995) argues that this
debate encompasses three key issues: (i) the extent to which FDI
substitutes for domestic investment, (ii) the extent to which FDI
stimulates increase of exports of intermediate goods and capital
goods and, (iii) whether FDI involves the construction of new plants
or simply the acquisition of existing facilities. In general, the
employment effects of FDI may be summarized as follows:
i) FDI is capable of increasing employment directly, by
setting up new facilities or indirectly by stimulating
employment in distribution.
ii) FDI can preserve employment by acquiring and
restructuring ailing firms.
iii) FDI can reduce employment through divestment and the
closure of production facilities.

74
The balance of payments effect is more important for
developing countries than for developed countries. This is because
foreign exchange is regarded as scarce resource affecting growth
through the foreign exchange gap. Hence, any effect of FDI may
mitigate or worsen the constraints imposed by the balance of
payments on the attainment of macro-economic objectives pertaining
to growth and employment. In general, FDI is often blamed for its
balance of payments effect: the investing country faces a sudden
deficit when the FDI occurs, whereas the host country faces a small
perpetual deficit as a result of profit repatriation. After all, a
profitable FDI project with profits repatriated in foreign currency
must necessarily result in greater, balance of payments outflows that
a similar project financed locally.
Productivity is likely to rise and unit cost is likely to decline if
(i) FDI is export promoting and the products of the subsidiary are
destinated for the large world markets, and (ii) the underlying
conditions and policies allow the installation of plants designed to
achieve the full economies of scale. On the other hand, if FDI is
import substituting and the size of the market is too small to allow
the installation of the optimum plant size, then productive efficiency
may not be achieved. There are, however, some reasons for believing
that productive inefficiency may not be important. First, the
empirical evidence indicates that unit costs of operating a plant

75 smaller than the optimum size are not significantly higher than those
of the most efficient scale. Secondly, even if investment was mainly
import substituting, any scope for some exports leads ot an increase
in the size of the market and allows the utilization of a higher capital
intensity technology.
According to Industry Minister (ex) Mr. Murasoli Maran,
“foreign investment is not considered only as a stock of capital but as
something that provides modern technology, modern management
practices, employment opportunities and a new market for products
produced in India. Moreover, it is essential. We have a gap between
our savings and investment rates. The gap can only by filled by
FDI.” MNCs offer the capital, international market access, and
technology that India lacks, and are therefore vital to remolding
India as a strong and rapidly growing economy. The FDI has proved
to be resilient during financial crises. For instance, in East Asian
Countries, such investment was remarkably stable during the global
financial crises of 1997-98. In sharp contrast, other forms of private
capital flows-portfolio equity and debt flows, and particularly short-
term flows-were subject to large reversals during the same period
(Lipsey, 2001). This resilience of FDI during financial crises was
also evident during the Mexican crises of 1994-95.

76 In nutshell important advantages of FDI may include the
following:
1. It helps increase the investment level and thereby the income
and employment in the host country.
2. FDI facilities transfer of technology to the recipient country.
3. It may kindle managerial revolution in the recipient country
through professional management and the employment of
highly sophisticated management techniques.
4. Foreign capital may enable the country to increase its exports
and reduce import requirements.
5. Foreign investments may stimulate domestic enterprises
because to support their own operations, the foreign investors
may encourage and assist domestic suppliers and consuming
industries.
6. Foreign investment may also help increase competition and
break domestic monopolies.
The role of FDI in the export performance of host country
industries has received considerable attention in recent years,
especially in the context of liberalisation and globalisation. A cross-
country analysis of 52 countries by the UNCTAD (1999) found that
there is a positive relationship between FDI and manufactured
exports, and the relationship is stronger for developing countries than
for developed countries and in high and low-tech industries than in
medium-tech ones. Aitken et al. (1997) conducted a study on

77 Mexican manufacturing firms for the period 1986-90 and found that
export decision of Mexican firms is positively related to the presence
of foreign firms; which is measured using two separate variables –
MNEs’ production and their exports. They found that the presence of
MNEs with their production and export activities positively
influence the export performance of Mexican firms. Kokko et al
(2001) examined the association between FDI spillovers and the
export behaviour of domestic firms in Uruguay using a cross-
sectional firm level data. They found that domestic firms are more
likely to export if they operate in sectors where the presence of
foreign firms is relatively high. Their study also pointed out that the
type of trade regime (controlled or liberalized) may influence the
ability of MNEs in generating positive export spillovers.
Sjoholm (1999) examined the various types of foreign
contacts that influenced as well as enabled the establishments to
become exporters in the Indonesian manufacturing sector. Taking
three types of foreign contacts – foreign ownership, imports, and
spillovers from regional presence of FDI – the study found that while
the first two types of foreign contacts (ownership and imports) have
a positive effect on the propensity to become an exporter, there are
no export spillovers from a large regional presence of FDI.
Greenaway et al (2004), using a two-step Heckman selection model
to determine the influence of FDI spillovers on the export decision of

78 domestic firms, found positive FDI spillovers on the export decision
of domestic firms, found positive FDI spillovers on the probability of
a United Kingdom firm being an exporter. They found that the most
important channel of export spillovers is the increased competition
resulting from foreign firms.
A number of studies have attempted to analyse the impact of
FDI on the export performance of Indian industries. In India, earlier
studies for the period of restrictive policy regimes could not find any
significant difference in the export performance of foreign and
domestic firms (Kumar and Siddharthan, 1994). However, a
number of studies for the post-1991 liberalisation period suggest that
foreign firms have shown significantly higher export performance as
compared to domestic firms (Aggarwal, 2002; Kumar and
Pradhan, 2003) compared the export performance of MNE affiliates
and domestic firms in Indian manufacturing after the 1991
liberalisation by analyzing the determinants of their export
intensities. The study examined the relationship between FDI and
export performance using the Tobit model for 916 Indian
manufacturing firms for the period 1996-2000. Aggarwal found that
the liberalisation measures of the 1990s enhanced the export role of
MNE affiliates, especially in the late 1990s. However, she could not
find any evidence of a positive relationship between foreign equity
share and export performance of firms.

79 Kumar and Pradhan (2003) looked at the important factors
that influence the export competitiveness of Indian manufacturing
firms with an emphasis on knowledge-based industries. They found
that younger firms drive export competitiveness in the high and low
technology industries whereas older firms are more competitive in
the medium technology industries. The study also found that foreign
affiliates are better achievers on the export front compared to their
domestic counterparts in Indian manufacturing. The study concluded
that the liberalisation policies of the 1990s have definitely improved
the export competitiveness of Indian manufacturing, especially in the
technology-intensive segments. Banga (2003) also found a
significant impact of FDI on the export intensity of non-traditional
export industries in India.
Most of these studies examined the role of foreign equity
participation in the export decision of firms in Indian manufacturing
and merely compared the export performance of domestic and
foreign firms without looking into the possibilities of export
spillovers from foreign firms. This study attempts to anlayse the
effect of FDI spillovers on the export performance of Indian firms in
a liberalized framework.
Having presented a review of literature of earlier studies on
Foreign Direct Investment, the next chapter presents the theoretical
background of economics of Foreign Direct Investment.

Chapter III
ECONOMICS OF FOREIGN DIRECT INVESTMENT
Introduction
Foreign Direct Investment (FDI) is the investment made by
one country to other country for the purpose of developing industrial
activities. FDI provided mutual help to both the countries. For the
home country, it is an investment-generating income and a source for
spreading business operations globally, and for the host country, it is
source of capital for the development of infrastructure, which is the
corner-stone for economic development. Infrastructure development
is needed for the growth of domestic trade, foreign trade for reducing
imports and external borrowings and for correcting the fiscal deficit.
Developing nations are perpetual victims of a resource crunch. They
find it hard to develop basic infrastructure which is badly needed for
industrial development.
The FDI should be taken in the righter perspective. There is no
danger in increasing flow of FDI in India. It is need of the hour that
huge investment of FDI should be allowed in most of the sectors of
the economy for long-term economic development of the country.
Indian Government’s resources are very much limited to overcome
the problem of unemployment, modernization of industries including
agriculture industry and numerous related problems. The best

81 solution for this has been found that the large investment of FDI
should be allowed. The Economic and Social Survey: 2001 by the
World Bank shows that out of $207 billion in FDI flows to
developing countries, $40 billion went to China as compared to $2.1
billion for India.
Within the Asian region, Malaysia, Singapore, Korea and
Thailand have received much more FDI than India. Because from the
point of view of foreign investors, apart from rapid liberalization,
other things are also important in determining the choice of
destination. In this the share of China is 19.32 per cent while India’s
share is only 1 per cent. The above information suggests that there is
no need to be afraid that India economy will go in the hands of
foreign investors, if the larger investment is allowed. For rapid
growth and development, there is need to increase the flow of FDI in
coming years by further liberalizing FDI policy so as to make the
Indian economy more free and competitive in the global market.
For a long period of time India too much depended on Foreign
aids considering it cheapest source of having foreign exchange. Most
of us do not known that aid is nothing but a loan. It is concessional
loan as the rate of interest to be paid on aids is slightly lower than
other loans and the duration of payment is usually longer during
which it is to be repaid. This practice was raising the amount of

82 interest to be paid rapidly and country had to face difficulties in
making the payment of interest for which foreign exchange was
needed. Therefore to come out from such a situation the country had
introduced economic reforms in 1991 and allowed on large scale
inflow of foreign direct investment in most of the sectors of the
economy. The policy has successfully controlled the crisis of foreign
exchange since 1991. However, the progress of FDI is still not
satisfactory when it is compared with the other developing countries
of the world such as China, Singapore, Malaysia and Korea etc.
India has recently opened up more sectors, including defense,
to foreign direct investment. But many developing countries have
liberalized their economies even more in the past. The measures
undertaken by them have included the rules regarding procedures of
investment approvals, removing the controls on foreign exchange
transactions, reducing performance requirement and increasing
access to sectors as well as the extent of foreign ownership. But only
few countries have managed to get huge FDI flows. Multinationals
are interests in coming to a country which has a big market because
they want to internationalize their operations. They also want to
access natural resources and raw materials. Thirdly, they are
interested in the quality and cost of labour of the host country, its
growth prospects as well as its polices.

83 High growth prospects are responsible for the biggest chunk of
FDI going to China which has had an average GDP growth of 9 per
cent over the last two decades. China also has a skilled population
which has caused invested heavily in China. Non-Resident Indians
too can bring more FDI to India except that they are scattered thinly
across the globe and unlike the non-resident chineese who live close
to China, most NRIs are not near India. They do not also have as
much investable resources because most are professionals. many are
also not happy with the existence of corruption and procedural
delays in India. India has got a great potentiality for attracting more
inflow of FDI.
For capital-scare developing economies, foreign direct
investment (FDI) implies access to not only capital, but also
advanced technology and know-how, managerial expertise, global
marketing networks and best-practice systems of corporate
government. FDI inflows are not-debt creating and more stable than
portfolio flows that are guided by short-term risk-return pay offs and
are prone to quick reversals in the event of adverse expectations.
Thus, following withdrawal of most restrictions on cross-border
movement of capital in a globalized Economy, almost all developing
countries have adopted liberal policies towards FDI for exploiting
the virtuous aspects of such flows. Inspite of enabling policies,

84 however, success in attracting FDI has widely varied between
countries.
Trade has been traditionally considered to be an “Engine of
Growth”, a source of competitive pressure on domestic industries
and a force of integration bringing national economies closer
together. Foreign Direct Investment is increasingly assuming the
same role. In fact, FDI become more important than trade as a
vehicle for international economic transactions. The role of FDI have
changed their views. Most of the countries have liberalized their FDI
regulations since the early 1980s. Host countries are actively trying
to encourage foreign direct investment to participate in their
production activities. They also expect the benefits of FDI to
dominate the cost of foreign ownership of local factors of
production. However, the attitudes of host countries towards
Multinational Corporation (MNCs) have been mixed, although the
proponents of FDI seem to have gained the upper hand during 1990s.
The subject of private foreign investment in less-developed countries
(LDCs) has received only a less sustained any systematic attention in
terms of data collection and analysis than many other aspects of
economic development.
Marxist considered the private capital and private investment
as a natural consequence of maturing capitalism and the last

85 manifestation of a doomed system before it collapse. However, this
prediction has been proved not true. Most developing countries have
moved to market oriented, the private sector led economies. This is
widespread reduction and removal of trade barriers, regulation of
internal markets, privatization and liberalization of technology and
investment flows at national level. In this context, Multinational
Corporation (MNCs) have occupied a importantrde in the world
economy and the development process. Hence, there is a growing
competition among world countries to attract foreign direct
investment. Countries are offering several packages of incentives to
multinational corporations to make their country a lucrative place for
investment. It leads competition to attract FDI to become pervasive,
and the result is described as a “cutthroat bidding war”.
The most important reason why countries try to attract foreign
direct investment is perhaps the prospect of acquiring modern-
technology, interpreted broadly to include both product, process and
distribution of technology, as well as management and marketing
skills. In spite of increasing importance of foreign direct investment
in the economy of developing countries, it is not free from criticisms.
It is criticized for the increasing private activities and reducing
state activities in a welfare state like India. It is necessary to point
out that the liberalization and resultant foreign direct investment has

86 not necessarily diminished the role of the state. It has only refined
the state’s role by expanding it in some areas and reducing it in some
other. It tried to provide an optional mix of “Market and state”.
However, the global shift in policy to market orientation and the
liberal economic policies have swept aside many east while
conventions, hesitation and resultant criticisms that formerly
governed inward FDI flows. It resulted in the tremendous increase in
international capital mobility during 1990’s. The private capital flow
dominates with official flows reduced to a trickle. Therefore,
production activities comprise a large and increasing important part
of Globalised Economy. Hence, studying foreign direct investment
becomes more important.
Significance of Foreign capital
The role of FDI has undergone tremendous changes since
1991. It is evident from the changing composition of the foreign
capital flow into India. When the whole world is marching ahead
toward the “New Order”, India is of no exception to this
phenomenon in a globalized and well-integrated world. India’s
approach to development witnesses a gradual shift from the inward
oriented import-substitution approach to the outward looking
approach during the late 1980’s and specifically after experiencing a
severe crisis during 1990-91. It ultimately resulted in decontrol,
delicensing and pursuance of a more liberal and investment friendly

87 ‘open door’ policy towards FDI. In this context, private foreign
capital in general and FDI in particular has been widely recognized
as an imperative input for sustainable development. In the process of
global integration and Co-operation, the promotion and
diversification of trade and FDI assumed greater importance in
Indian economy.
The FDI policy change in India attracted controversial
opinions not only from the political dais but also from the sphere of
intellectuals. Some thinkers have been constantly expressing their
worries and concern about the FDI policy of India. For them FDI in
India seems to be the road map ultimately end up with emergence of
colonialism though not political but economic. This may possible
because of India’s past experience of trade-led political colonialism.
In spite of the fear expressed by the few, the mainstream economics
strongly believe that the flow of FDI into India is of immense
importance since it provides a package of capital, foreign exchange,
technology, managerial expertise, skills and other inputs considered
essential for the development of an emerging economy like India.
Moreover it is also important to understand that Indian can not stand
alone while the world is shrinking to become a global village with
the absence of impediments for the flow of trade and investment
across the countries. No country can prosper keeping itself outside
the global stream and India is of no exception to this. However, India
has to evolve a suitable policy to play carefully in the international
economics so as to reap the benefits of investment flow. It seems that

88 the “leftist” who strongly opposed for FDI into India earlier, still
believe that there is over emphasis on FDI in India. With these
backgrounds India has already spent 20 years of her ‘open-door’
policy for FDI since 1991.
Hence, it is inevitable to analyse various dimensions of FDI in
India such as trends, comparative performance, determinants, impact
of FDI on Indian Economy, to provide a reasonable base to evolve
and execute the best policies for the benefits of Indian economy as a
whole.
Indian economy has underwent radical changes in 1990s
because of the introduction of new economic policy and
liberalization in this juncture. The free inflow of capital and Foreign
Direct Investment enabled our economy to improve and too
enhanced and sophisticated methods and means of production. More
specifically, the part played by FDI in promoting the progress of
India Economy and Employment opportunity and the inevitable part
and parcel of the LPG. The real fruits of Economic reforms not only
promoting the welfare of individuals, but also it shows its significant
strides in the progress of economy. Policy makers and planners
attention is to attract more and huge quantity of Foreign Direct
Investment. In a crux the Foreign Direct Investment and role of
Foreign Institutional Investors (FII) played an integral part in our
economy. The present study through light a synoptic looks about the
Foreign Direct Investment and its importance in India it also deals

89 the various facts and aspects of Foreign Direct Investment and its
impact on Indian Economy.
Capital is stated as the engine of economic growth. This
statement has gained more importance in the recent times.
Traditionally, the various sources of capital for developing countries
were–either the demand of their output (raw material) by industrial
countries or foreign aid or loans from foreign banks. However, now-
a-days, the official development assistance flows are steadily
declining. Beside others, Foreign Direct Investment as a source of
funds has gained very high importance, in recent years.
Foreign Direct Investment (FDI) is an investment involving a
long-term relationship and reflecting a lasting interest and control of
a resident entity in one economy in an enterprise resident in an
economy other than that of the foreign direct investor. Individuals as
well as business entities may undertake FDI. Such investment
involves both the initial transaction between the two entities and all
subsequent transactions between them and among foreign affiliates.
FDI flows comprise equity and non-equity forms of investment. The
equity capital flows comprise the foreign direct investor’s purchase
of shares of an enterprise and also include the foreign direct
investor’s share in reinvested earnings. Besides, the equity form of
FDI also includes short or long-term intra-company loans and debt

90 transactions between foreign direct investor and the affiliates. The
non-equity forms of FDI include investments through such activities
as sub-contracting, management contracts, turnkey arrangements,
franchising and licensing and products sharing.
Foreign Direct Investment involves the ownership and control
of a foreign company in a foreign country. In exchange for this
ownership, the investing country usually transfers some of its
financial, technical, managerial, trademark and other resources to the
recipient country. The international transfer of funds need not be
prerequisite for this exchange. The Government of India, in March
2003 revised the FDI definition in line with international practices.
The revised FDI data now includes ‘equity capital’ including that of
unincorporated entities, non-cash acquisition against technology
transfer, plant and machinery, goodwill, business development,
control premium, and non-competition fees. It also includes ‘re-
invested earnings’ including that of incorporated entities,
unincorporated entities and reinvested earnings of indirectly held
direct investment enterprises.
Besides, ‘other capital’ including short-term and long-term
inter-corporate borrowings, trade-credit, supplier credit, financial
leasing, financial derivatives, debt securities, land and buildings are
factored in. FDI is seen as a mean to supplement domestic

91 investment for achieving a higher level of economic growth and
development. FDI offer benefits to domestic industry as well as to
the consumer by providing opportunities for technological up-
gradation, access to global managerial skills and practices, optimal
utilization of human and natural resources, making industry
internationally competitive, opening up exports market, providing
backward and forward linkages and access to international quality
goods and services.
Foreign investment and technology play an important role in
the economic development of a nation. The economic health of the
transition countries in Eastern Europe, Russia and Central Asia is
well-off due to these inputs. Even the communist countries like
China have welcomed the foreign investment to make their
economies better. Most of the advanced countries of today developed
due to the foreign investment, which played a vital role in making
them high-income countries. Economic growth is proportional to the
capital formation. Less developed countries having less income and
low saving have not been able to take their economies to take-off
stage. Hence, domestic resources are supplemented with foreign
investment to make the development plan ongoing for better and
healthier economy.

92 Foreign investment gives the facility of imports of capital
goods, raw materials and technical knowledge for the growth of an
economy. If investment is made in export-oriented industries it
promotes exports of host countries and facilitates imports to a large
extent. If it is in cost reducing industries, customers get cheaper
products which results in general increase in the real incomes of the
people. The investments, if used, for structural development leads to
the development and growth of all other kinds of industries. Besides
giving a general boost up to the industrial development, increased
FDI leads favourable impact on the balance of payment position of a
country.
International Financial Markets have got a higher degree of
strength in liberalization. Globalization has opened the doors almost
all over the world for utilizing international financial flows, which
have been outpacing the flow of goods and services among trading
countries. Developing countries are the recipients of funds from the
international markets due to in time availability of external finance in
the required amount for their development.
World Investment Report, 1995 prepared by United
National Conference on Trade and Development and Published by
UN, New York and Geneva is based on Annual review of the trends
in FDI in various places. It shows that international investment by

93 transnational corporations supersedes trade and is the best
mechanism for international business integration. It has become a
major engine in global growth of the economies.
Flow of foreign investment started in India in 1980.
Government of India released the policy in respect of oil exporting
developing countries (OECD) with a good package of following
exemptions:
(i) Countries can invest upto 40 per cent in equity of new
ventures without linking to technology transfer.
(ii) Non-resident Indians’ (NRIs) investments were allowed in
Indian Industrial Units under defined conditions.
Considerable interest is now being shown in measures that
might promote FDI and allow it to make a greater contribution to the
development of the recipient countries. In determining the flow of
foreign capital controls exercised by the host country over the
conditions of entry of foreign capital, regulations of the operation of
foreign capital and restrictions on the remittance of profits and the
repatriation of capital are far more decisive.
The central problem now is for the recipient country to devise
policies that will succeed in both encouraging a greater inflow of
FDI and ensuring that it makes the maximum contribution feasible

94 towards the achievement of the country’s development objectives.
The task of development requires both more effective government
activity and more investment on the part of international private
enterprises. Foreign Direct Investors must be aware of the
developmental objectives and the priorities of the host country and
understand how their investments fit into the countries development
strategy. The contribution of FDI has to be interpreted in terms
beyond private profit. At the same time, the government must realize
that if risks are too high or the return on investment is too low,
international direct investment will be inhibited from making any
contribution at all. Development planning requires the government to
influence the performance of FDI, but in doing this, the government
should appreciate fully the potential contribution of this investment
and should devise policies that will meet the mutual interests of
foreign direct investors and host country. This calls for most
intensive analysis of the consequences of FDI and for more thought
and ingenuity in devising approaches that favour the mobilization of
FDI while ensuring its most effective “Planned performance” in
terms of the country’s development programme.
At present, the policies taken by the developing countries
reveal a mixed picture of restrictions and incentives. On the one
hand, the foreign investors’ freedom of action may be restricted by a
variety of governmental regulations that exclude FDI from certain

95 “Key” sectors of the economy, impose limitations on the extent of
foreign participation in ownership or management, specify
conditions for the employment of domestic and foreign labour, limit
the amount of profits and impose exchange controls on the remission
of profits and the repatriation of profits. On the other hand, a
progressive liberalization of policy toward FDI has occurred during
recent years. Many countries now recognize that an inflow of FDI
may offer some special advantages over public capital and a number
of investment incentive measures have been adopted recently or are
under consideration.
Foreign capital played an important role in the early states of
industrialization of most of the advanced countries of today, like the
countries of Europe (including the Russia) and North America.
Though the problems of development of developing countries of
today are not very much similar to those faced by the advanced
countries in the past, there is a general view that foreign capital, if
properly directed and utilized, can assist the development of the
developing countries.
Economic growth is a function of, among other things, capital
formation. In the developing countries, the per capita income and
savings rate being very low, domestic capital formation is inadequate
to give a ‘big push’ to the economy to take it to the ‘take-off’ stage.

96 Hence the domestic resources may be supplement with foreign
capital to achieve the critical minimum investment to break the
vicious circle of “low-income-low savings-low investment-low
income.”
Another way by which foreign capital helps accelerate the
pace of economic growth is by facilitating essential imports required
for carrying out development programmes, like capital goods, know-
how, raw materials and other inputs and even consumer goods. The
machinery, the know-how, and other inputs needed may not be
indigenously available. Further, the demand spurt created by large-
scale investments may necessitate import of consumer goods. When
the export earnings are insufficient to finance such vital imports,
foreign capital should help reduce the foreign exchange gap.
Foreign investments may also help increase a country’s export
and reduce the import requirements if such investments take place in
export-oriented and import competing industries.
In the sphere of international economics, one of the most
significant developments of twentieth century has been the growth of
the so called multinational or transnational corporations (TNCs). A
TNC is usually so called because while it has production or
distribution affiliates located all over the globe, management control

97 of its operations is usually centralized. Though these TNCs existed
even in the 19th century, the present century has witnessed their
phenomenal growth. In a pioneering work, Barnett and Muller
(1974) have attempted to document the growth of these TNCs.
Though there are differences over the precise definition of these
corporations, there is little doubt that today these TNCs control about
40 per cent of world production and probably an even larger
percentage of world trade. Sales of foreign affiliates of TNcs were in
excess of about $4.8 trillion in 1991 which was about twice the level
in the early eighties and slightly more than the world exports of
goods and services (World Investment Report, 1994). To a large
extent this growth has been a natural outcome of the increasing
internationalization of all economies consequent to the spread of
instant global communications. This rapid expansion of FDI in the
last decade or so has been fueled by the privatization programmes of
many developing economies (particularly in East Europe) and the
generally favourable foreign investment policies in Asia and other
developing regions. What has been of particular interest to analysts
has been a study of the nature of investment flows of these TNCs
often referred to as foreign direct investment (FDI).
Internationalization, in the form of FDI began in the late
nineteenth century. The Victorian and Edwardian era saw the
creation of many of the great vertically integrated multinationals that

98 we would recognize today – colonial plantation companies such as
lever Brothers (now Unilever) investing in West African vegetable
oil plantations, Cadbury’s in cocoa, Dunlop in rubber. Britain, as the
great imperial power of the time, dominated world international
business, with over 45 per cent of the world’s total stock of FDI in
1914. Thus it is clear that the philosophy of FDI is not the product of
new scenario, but its origin lies in the late nineteenth century.
Definition of Foreign Direct Investment
Foreign direct investment is used to create or purchase
facilities for undertaking direct production, usually jointly with an
Indian partner. Foreign direct investment provides investment capital
as well as modern technology, increasing the growth rate of GDP
and employment. Export oriented foreign direct investment is
particularly useful as it provides automatic access to world markets
and boosts domestic export (as well as employment) through
backward linkages with the domestic economy.
Foreign direct investment (FDI) is a term used to denote the
acquisition abroad of physical assets, such as plant and equipment,
with operational control ultimately residing with the parent company
in the home country. It may take a number of different forms
including.

99
The establishment of a new enterprise in an overseas country –
either as a branch or as a subsidiary.
The expansion of an existing overseas branch or subsidiary.
The acquisition of an overseas business enterprise or its assets.
At the very outset it is necessary to define the forms which
foreign participation can take. TNCs can interact with host countries
via FDI, portfolio investment, exports or licensing of technology and
patents. FDI has a very special meaning in that it refers to flows of
equity capital into a subsidiary where the foreign investor (or TNC)
has a controlling interest. Traditionally, this is defined as the TNCs
share of total equity capital exceeding 10 per cent or 25 per cent.
However, the basic issue is to attempt to distinguish FDI flows from
portfolio investment. While the former is considered long-term
investment the latter is typically guided by short-term considerations
of speculative gains. On the other hand, a TNC export to a host
country and then switches to domestic production when entry
barriers (like tariffs) make exports uncompetitive or when such a
move is necessary to internalize certain owner-specific advantages.
However, it is clear that the essential criteria should be
‘controlling interest’ and ‘long-term interest’. Thus licensing or sale
of a technology without any financial flows can also give the foreign
investor control of the recipient firms’ decision process. From the

100 point of view of LDCs, in particular, the relevant factor is
technology inflows and this inflow can take place without any
corresponding financial inflows of capital. There is, therefore, no
necessary link between technology flows and capital flows (see,
Casson and Pierce, 1987). In this light, for example, it would seem
wise to include in the concept of FDI is that it must involve ‘control’
by the foreign interest and ‘long-term’ considerations.
Thus in nut shell it may be said that FDI is used for purchasing
facilities to undertake direct production, usually in partnership with
an enterprise from the host country. The FDI flows increase the
growth rate of GDP and employment. It also brings in capital
investment and modern technology. The export oriented MNCs
increase export of the host country which reduces the crises of
foreign exchange. The MNCs choose a country for FDI where
usually low cost of labour and vast market is available so that the
profit can be maximized or rate of return is more attractive and safe
than other countries as well as the export procedure is simple.
The scope for Foreign Direct Investment
Some of the chief industries, especially export industries, of
underdeveloped countries have been built up largely by direct
foreign investment. Leading examples are the oil industries of the
Middle East and Venezuela; the rubber estates and tin mines of

101 Malaya and Indonesia; the tea estates of India and Ceylong; the
sugar estates of Cuba and the British West Indies; the banana estates
of Central America and the copper mines of Northern Rhodesia and
Chile. In some countries, direct foreign investment has played a
leading part also in the field of railways, electric power, and other
public utilities, and in international trade.
While the inflow of capital in any form supplements the
inadequate savings of low-income counties, direct investment has
various advantages over loans (including export credits). Loans leave
an aftermath of interest charges and repayments, which often become
a serious burden on the budgets and foreign-exchange reserves of the
borrowing countries. It is true that loans could be spent in ways
which increase output, taxable capacity and export earnings, but
often they are not; they may be used for what seems an urgently-
needed expansion of social services or to tide over a deficit in the
balance of payments which turns out to be a long-period rather than a
temporary deficit, so that the loans merely postpone the need to
reduce levels of consumption. Direct investment leaves no such
aftermath. The Government of the country incurs no obligation to
make payments if the industry goes through a lean period it is the
foreign shareholders who suffer.

102 Direct investment has other advantages also. It often
introduces new industries or improved methods. It provides
employment and some times specialized technical training for local
workers. It contributes to local public revenue; for instance by
paying income tax and in many cases export duties. If it establishes
or expands export industries it increases exports and thereby foreign-
exchange earnings. A number of large foreign companies (notably
those owning estates) provide housing and social services for their
workers.
Most underdeveloped countries, however, are very
nationalistic. Against these advantages of foreign direct investment
is the great disadvantage, from their standpoint, that it places control
over part of their economic activity in the hands of foreigners. Some
countries feel that large foreign companies may interfere in their
political and economic life, introducing an element of foreign
domination or, in the case of ex-colonies, re-introducing
‘colonialism’ through the back door. Moreover, most
underdeveloped countries are socialistic in their outlook and consider
that certain key industries, such as public utilities and steel mills,
should be owned by the state rather than by private capital, whether
foreign or local. Owing to these attitudes the scope for foreign direct
investment has been substantially reduced during the middle of the
20th century. But now all countries – developed, developing and

103 underdeveloped are encouraging flow of FDI with incentive
packages.
More directly, many countries have come to realize that an
inflow of foreign capital can offer some unique qualitative
advantages. For no problem of productive use arises with foreign
direct investment: by its very nature, a foreign investment
necessarily entails the identification of an economic opportunity, the
formulation of a productive project, and its efficient implementation.
Especially significant is the merit that foreign direct investment has
in carrying with it an integral ingredient of technical assistance-the
managerial and technical knowledge which are usually in even
shorter supply than capital. As an instrument for transmitting
technical and organizational change, integrating technical and
financial assistance, and helping to overcome the skill and
management limitations in development, the private foreign
investment has a distinct advantage over foreign public capital.
To provide an analytical basis for understanding the rationale
and effects of foreign investment policies in the host countries, we
should weigh the benefits of foreign investment against its costs.
After assessing what difference the presence of foreign owned
capital might make to the real income of the recipient country, we
may then appraise existing policies.

104 Some concerns regarding foreign direct investment are as
follows: One, it can stifle the growth of domestic firms. While this
may happen in a few cases, foreign direct investment usually
promotes investment and growth of domestic firms through joint
production, as can be seen from the experience of our automobile
industry. Two, foreign direct investment can possibly make
excessive returns in highly protective markets when domestic prices
are significantly higher than international prices. This is largely
mitigated by our high corporate tax rates. Nevertheless, if we want to
use foreign direct investment on a large scale, we should continue to
reduce our tariffs and quantitative restrictions on imports, especially
those on consumer goods, and usher vigorous competition by
allowing many multinational companies in a sector that it opened to
foreign direct investment (rather than creating foreign monopolies,
such as Maruti until recently). Three, foreign direct investment can
lead to foreign domination. This concern is outdated and
exaggerated. China, Malaysia and Singapore, some of the largest
recipients of foreign direct investment, are subject to no more (in fact
less) pressures than India. Foreign direct investment can earn profits
only when the particular investment is profitable. Thus it does not
create the kind of economic crisis that poorly managed foreign debt
has created in many developing countries. Since foreign direct
investment is often used to finance imports of capital and other

105 inputs, its contribution to domestic inflation or currency appreciation
is usually marginal.
Benefits of FDI
The inflow of private capital contributes to the recipient
country’s development programme in two general ways by helping
to reduce the shortage of domestic savings and by increasing the
supply of foreign exchange. To this extent, the receipt of private
foreign investment permits a more rapid expansion in real income,
eases the shortage of foreign exchange, and removes and necessity of
resorting to a drive toward self-sufficiency and the deliberate
stimulation of import-substitution industries out of deference to
foreign exchange considerations. Beyond this initial contribution, the
essence of the case for encouraging foreign investment is that in
time, as the investment operates, the increase in real income resulting
from the act of investment is greater than the resultant increase in the
income of the foreign investor. There is a national economic benefit
if the value added to output by the foreign capital is greater than the
amount appropriated by the investor: social returns exceed private
returns. As long as foreign investment raises productivity, and this
increase is not wholly appropriated by the investor, it follows that
the greater product must be shared with others, and there must be
some direct benefits to other income groups. These benefits can
accrue to (1) domestic labour in the form of higher real wages, (2)

106 consumers by way of lower prices, and (3) the government through
expanded revenue. In addition, and of most importance in many
cases, there are likely to be, (4) indirect gains through the realization
of external economies.
Some benefits from foreign investment may also accrue to
consumers. When the investment is cost-reducing in a particular
industry, there may be a gain not only to the suppliers of factors in
this industry through higher factor prices but also to consumers of
the product through lower product prices. If the investment is
product-improving or product-innovating, consumers may then enjoy
better quality products or new products.
In order that labour and consumers might gain part of the
benefit from the higher productivity in foreign enterprises, the
overseas withdrawal by the investors must be less than the increase
in output. But even if the entire increase in productivity accrues as
foreign profits, there will still be a national benefit when the
government taxed these profits or receives royalties from concession
agreements.
From the standpoint of contributing to the development
process the major benefits from foreign investment are likely to arise
in the form of external economics. Besides bring to the recipient

107 country physical and financial capital, direct foreign investment also
includes non-monetary transfers of other resources-technological
knowledge, market information, managerial and supervisory
personnel, organizational experience, and innovations in products
and production techniques-all of which are in short supply. By being
a carrier of technological and organizational change, the foreign
investment may be highly significant in providing “private technical
assistance” and “demonstration effects” that are of benefit elsewhere
in the economy. New techniques accompany the inflow of private
capital, and by the example they set, foreign firms promote the
diffusion of technological advance in the economy. Technical
assistance may also be provided to suppliers and customers of the
foreign enterprise. In addition, foreign investment frequently leads to
the training of labour in new skills, and the knowledge gained by
these workers can be transmitted to other members of the labour
force, or the newly trained workers might be later employed by local
firms.
Arguments in Support of Foreign Direct Investment
The arguments in favour of FDI grow largely out of the
traditional neo-classical analysis of the determinants of economic
growth. Foreign private investment (as well as foreign aid) is
typically seen as a way of filling in gaps between the domestically
available supplies of savings, foreign exchange, government

108 revenue, and management skills and the desired level of these
resources necessary to achieve growth and development targets. If
the nation can fill this gap with foreign financial resources (either
private or public), it will better be able to achieve its target rate of
growth. Therefore, the first and most often cited contribution of
private foreign investment to national development i.e., when this
development is defined in terms of GNP growth rates-an important
implicit conceptual assumption is its role in filling the resource gap
between targeted or desired investment and locally mobilized
savings. This ultimately increases the growth of the GNP and
employment.
A second contribution, analogous to the first, is its
contribution to filling the gap between targeted foreign exchange
requirements and those derived form net export earnings plus net
public foreign aid. This is the so-called foreign exchange or trade
gap. An inflow of private foreign capital can not only alleviate part
or all of the deficit on the balance of payments current account but it
can also function to remove that deficit over time if the foreign
owned enterprise can generate a net positive flow of export earnings.
Unfortunately, as we discovered in the case of import substitution,
the overall effect of permitting MNCs to establish subsidiaries
behind protective tariff and quota walls is often a net worsening of
both the current and capital account balances. Such deficits usually

109 result both from the importation of capital equipment and
intermediate products (normally from an overseas affiliate and often
at inflated prices) and the outflow of foreign exchange in the form of
repatriated profits, management fees, royalty payments, and interest
on private loans. The third gap said to be filled by foreign investment
is the gap between targeted governmental tax revenues and locally
raised taxes. Hence taxing MNCs increases tax revenues of the
government at various levels.
Fourth and finally there is the gap in management,
entrepreneurship, technology, and skill presumed to be partially or
wholly filled by the local operations of private foreign firms.
Multinationals not only provide financial resources and new factories
to poor countries, they also supply a “package” of needed resources
including management experience, entrepreneurial abilities, and
technological skills that can then be transferred to their local
counterparts by means of training programmes and the process of
“learning by doing”. Moreover, according to this argument MNCs
can educated local managers about how to establish contacts with
overseas banks, locate alternative sources of supply, diversity market
outlets, and in general, become better acquainted with international
marketing practices. Finally, MNCs bring with them the most
sophisticated technological knowledge about production processes
while transferring modern machinery and equipment to capital-poor

110 Third World countries. Such transfers of knowledge, skills, and
technology are assumed to be both desirable and productive for the
recipient nations.
Having presented a brief theoretical background of economics
of Foreign Direct Investment, the next chapter presents the Theories
and Policy of Foreign Direct Investment in India.

Chapter IV
THEORIES AND POLICY OF FDI IN INDIA
The existing theories Government policies of FDI will help us
to clearly understand the role of FDI in economic process. Theories
of FDI assert that the basis for such investment lies in the transaction
cost of transferring technical and other knowledge, and market
imperfections. The four FDI theories are briefly discussed below.
Hymer-Kindleberger Theory
According to the Hymer-Kindleberger theory (1969), the
foreign owned firm would make an investment in the host country
only if it possesses some compensating indigenous firms. This is
however, not a sufficiency condition of FDI since the firms has the
option of licensing the advantage (technology) to an indigenous
producer or exporting the product to host country. Clearly certain
other conditions have to be satisfied for FDI flows to arise. Three
such conditions are:
(i) The advantage is internally transferable (it can be exploited
by a subsidiary of the parent firm, without any additional
cost to the parent firm or to the subsidiaries already
exploiting it);
(ii) It is more profitable for the foreign owned firm to exploit
the advantage itself than to license an indigenous producer

112
(because of imperfections in the market for knowledge, and
heavy to heavy firm to firm transfer costs of the
advantage); and
(iii) Exporting the product to the host country is not possible or
unprofitable due to tariff or transport cost barriers.
General Theory
The general theory of Transnational Corporations (TNCs)
traces their emergence to internationalization of markets (1991). The
theory is based on the three simple postulates as given below:
(i) Firms maximize profits in a world of imperfect markets;
(ii) When markets in intermediate products are imperfect, there
is an incentive to by-pass them by creating internal markets
(within the firm); and
(iii) Internationalization of markets across national boundaries
generates MNCs.
It is argued that the location strategy of a vertically integrated
firm is determined mainly by the interplay of comparative advantage,
barriers to trade and regional incentives to internalize. The firm will
be multinational whenever these factors make it optimal to locate
different stages of production in different countries.

113
This theory predicts that unless either transport costs are very
low, returns to scale (at the plant level) are high, or the comparative
advantage of one location is very significant, the international
acquisition and exploitation of knowledge will normally involve
international production through a world-wide network of basically
similar plants. Thus, prior to Second World War, multi-nationality
was a by-product of the internationalization of intermediate product
markets in a multistage production process, and in post-war period it
is a by-product of internationalization of markets in knowledge.
Kojima Theory
The Kojima theory (1960-1970) argues that Japanese type
FDI would upgrade the industrial structures of both Japan and the
host country, or play the role of initiator or tutor in the
industrialization of less developed countries. Lots of Japanese small
and medium firms in the host countries were expected to provide
production and technological linkages with local firms. Thus, the
theory presents the triple effect viz., investment, trade and industrial
restructuring with mutual benefit. The triple effect can be seen in the
textile industry typically, but not so much in the automobiles and
electrical appliances industries, which contributed to upgrade local
industry ‘to some extent’ but much lesser in the exports of these
manufacturers.
114 Dunning’s Electric Theory
Dunning’s electric theory of international production (1988)
explains both the ways in which overseas markets are served by
enterprises of different nationalities and the industrial and
geographical composition of such activities. According to this
theory, a firm will make a direct investment in a foreign country if
following three conditions are satisfied.
(i) It possesses same ownership advantage vis-à-vis firms of
other nationalities in serving particular markets;
(ii) It is more beneficial for the firm to use the advantage itself
than to sell or lease them to foreign firms; and
(iii) It is profitable to the enterprise to utilize these advantages
in conjunction with at least some factor inputs outside the
home country. The greater the ownership advantage of the
enterprise, the more the incentive to exploit these
themselves. The more the economies of production and
marketing favour a foreign location, the greater is the
inducement of FDI.
Location specific or country specific advantages have an
important bearing on FDI. Such advantages of particular host
countries make FDI in themselves preferable to not only other
potential host countries, but also to domestic investment. An
important determinant of FDI is the ability of the firm to generate

115 ownership advantages, which are best exploited by the firm in
foreign rather than in domestic investment. This way, the electric
theory is able to provide an explanation for differences in the
industrial pattern of outward FDI of different industrialized
countries. While the electric theory provides a good explanation of
the decisions of firms to invest abroad, it seems that the theory does
not cover the competitive FDI, induced by trade restrictions, when a
country imposes restrictions on imports of a particular industrial
product there is obviously inducement to multinational firms of the
industry to invest in that country. If one or two firms invest, the other
must also do so to counter competition and ensure their market share,
even if the returns to investment are negligible, particularly for late
entrants. Multinationals may also enter a market today even if it is
not profitable to do so, because they foresee future growth and want
to have the first entrant advantage.
The rich literature on FDI flows, causes and effects suggests
that the applicable theories lend themselves to organization into three
schools – the two traditional schools of development thinking are the
dependency and the modernization school and the third is the
integrative school. They are discussed here in detail.

116 The Dependency School
The dependency school, which flourished between 1960s and
1980s, seeks to achieve more equal wealth, income and power
distributions through self-reliant and collective action of developing
nations.
Dependency theories see the cause of underdevelopment
primarily in exploitation by the industrialized nations. The
dependency school’s major contribution to the FDI field is its focus
on the development models. Two sets of theories within the
dependency school have emerged to explain the causes of
underdevelopment and dependency:
(i) the dependency sub-school; and
(ii) structuralist sub-school
i) The dependency sub-school
The dependency sub-school states that developing countries
are exploited either through international trade which leads to
deteriorating terms of trade or through multinational corporations
(MNCs) transferring profits out of developing economies.
ii) The structuralist sub-school
The structuralist sub-school posits that international
(industrialized) centers and domestic centers (national capital)

117 extract resources from the peripheries (namely the poor countries or
local countryside). It does not criticize capitalism outright but rather
points out that peripheries don’t gain from capitalism as much as the
center does.
The solution for underdevelopment (offered by dependency
theorists) encompasses various strategies of closing developing
countries to international investment and trade. However, today it’s
widely accepted that FDI is indispensable for economic growth and
development and thus dependency theory is no longer a state
doctrine. Nonetheless, fears of domination through foreign capital
continue to be expressed in complex regulations, rent seeking and
lagging implementation of investment reforms.
The Modernization School
This school was developed before the dependency school, and
it remains widely influential to the present day. Modernization
theorists proclaim that there is a natural order through which
countries ascend to what is seen as higher developmental stages. The
theorists recommend that developing countries follow the footsteps
of developed countries and overcome endogenous barriers to
exogenously motivated development through industrialization,
liberalization and opening up of economy. The ability to overcome

118 these barriers will depend how endowed the country is with
production factors such as labour; capital and natural resources.
The modernization school views FDI as a prerequisite and
catalyst for sustainable growth and development. For FDI to fulfill
its crucial role, economies have to be freed from distorting state
interventions and opened to trade and foreign investment.
The Integrative School
The integrative school attempts to transform categorical
thinking on FDI by analysing it from the perspective of host
countries as well as investors. It integrates those dependency and
modernization concepts that are applicable to current FDI analysis.
An integrative FDI theory considers macro, micro and meso-
economic variables that determine FDI. The macro-level envelops
the entire economy, the micro-level denotes firms, and the meso-
level represents institutions linking the two, for example government
agencies issuing investment policy to enterprises.
What distinguishes integrative FDI theory from its
predecessors is that it accords more importance than previous
theories to the meso-level, the sphere where macro and micro-
variable meet, and public and private sector interact. It is the arena

119 that public policies are established and implemented. Thus, the
meso-level is pivotal to the successful implementation of public
policies. It is at the meso-level where day-to-day challenges in FDI
policy implementation occur and structural rigidities are revealed.
Structural rigidities such as corruption that can be eradicated through
measures such as appropriate training and pay for public servants.
Despite its importance, the meso-level, has not received the attention
it deserves, because theorists are not always aware of the daily
challenges that developing countries encounter in implementing
economic and investment reforms. At the same time the policy-
makers often hesitate to speak out due to local sensibilities.
Theories of Foreign Direct Investment
Stands of the modern theory of TNCs can be traced back to
the writings of coase (1937) and more particularly, to the literature
on barriers to entry of Bain, (1956). The essential core of the modern
theory is the proposition that foreign entrants are disadvantaged
relative to local firms because of their inherent unfamiliarity with
local conditions. To offset this, it is posited that the entrants must
have a ‘compensating’ advantage which is internationally
transferable. Since in a perfectly competitive framework no foreign
firms could exist, this compensating advantage must exist in a
scenario of market imperfections. As Kindleberger noted
(Kindelberger, 1969, pp.13-14). Kindleberger listed four possible

120 imperfections: in the goods market (product differentiation), in the
factor market including access to patented knowledge, internal and
external economies of scale and government intervention.
In another approach, Aliber (1971) views TNCs as a currency
area, phenomena. Here the advantage accrues not to any firm but to
all firms within a currency area. The basic idea is that investors value
all the assets of a TNC in the currency of the home country. Given
risk aversion, investors would demand a premium for bearing the
exchange rate risk. Further, investors have a bias in the application
of the currency premium. Consequently, source country firms are
able to borrow at the lowest rates. Aliber’s theory explains broad
trends in FDI: US expansion after the war followed by expansion of
German and Japanese FDI in the ‘seventies’ and ‘eighties’.
However, the assumption of investors myopia is untenable in a
longer time horizon. Further, the theory fails to explain the industrial
distribution of FDI and the phenomena of cross-FDI among the DCs
in particular (Buckley and Casson, 1976; Dunning, 1971).
In another industrial organization approach, Knickerbocker
(1973) viewed TNC investment as a defensive oligopolistic reaction.
In an empirical study of US multinationals, he found a bunching of
entry by firms into a market: the greater the seller concentration the
quicker the entry of a leader into a market is followed by others.

121 Theoretical justification for the contention that some entry
modes should consistently outperform others is based on previous
entry mode research in the contingency tradition. The Eclectic
Theory of international production (Dunning 1988) is used as a
general point of departure for developing the argument that mode
selection has an impact on subsidiary performance. Within this
framework, ownership, location, and international direct investment
choices. Ownership advantages are tangible and intangible assets in
the focal firm’s possession that lead to a competitive advantage:
proprietary products or technologies, specialized know-how about
production, and marketing expertise. Rhizobium and D intensity,
advertising intensity, international experience, product diversity and
firm size are resource-based concepts that have been empirically
linked to the choice of wholly-owned modes (Agarwal and
Ramaswami 1992, Caves and Mehra 1986, Kogut and Singh
1986, Kogut and Zander 1993). The ability to innovate (meta-
knowledge) may itself be a further, second-order form of knowledge
(Buckley and Casson 1976), even more intangible and difficult to
transfer, but no less important in many industries. These variables
are operationalization of the assets possessed by a firm, or the
necessary assets required to compete effectively in a given industry.
They were used in these studies to explain the intensity with which
companies seek unambiguous control, or alternatively, their
propensity to seek local partners.

122 The most important idea in developing theories of FDI is that
firms engaging international production are at a disadvantage
compared to local firms. This is generally assumed to be so because
of their unfamiliarity with local market conditions. The operation of
a subsidiary in foreign market probably requires a greater
commitment of time, attention and control compared to operating a
subsidiary in the home market. Additional costs are incurred in
terms, for example, of communication, administration and
transportation. For FDI to be successful, multinationals must,
therefore, possess certain advantages not available to existing or
potential local competitors. The conditions required for multinational
to compete successfully with local firms in host country
environments is discussed by Hymer (1960). He observes that
foreign firms must possess advantages over local firms to make such
investment viable and, usually, the market for the sale of the product
or service is imperfect. FDI is motivated by market imperfections
which permit the multinational to exploit its monopolistic
advantages in foreign markets.
This view is elaborated further by Kindleberger (1969), who
suggests that a market imperfections offer multinationals
compensating advantages of a magnitude that exceeds the
disadvantages due to their lack of origins within a host environment,
and it is the financial effects of this that underpin FDI. Again, FDI is

123 a direct outcome of imperfect markets. Market imperfections may
arise in one or more of several areas – for example, product
differentiation, marketing skills, proprietary technology, managerial
skills, better access to capital, economies of scale and government
imposed market distortions, to name but a few. Such advantages give
multinational has secured internally transferable advantages. These
enable it to overcome its lack of knowledge of local conditions in
host environments and to compete with local firms successfully.
Market imperfections, created by the existence of an oligopolistic
advantage for the multinational, may become a driving force for FDI.
Multinational firms are typically oligopolistic. Virtually all
multinationals enjoy considerable market power. The market in
which they operate is usually one of international oligopoly with
shades of monopolistic competition. May be this is because of the
sizeable set up costs involved in establishing an overseas plant. Only
large firms may be willing to incur this entry cost. In a British study,
Dunning (1985) identified oligopoly as a distinguishing feature of
markets in which multinationals operate, confirming many other
investigators findings.
Many of the insights into the role of market imperfections in
impelling foreign direct investment derive from the work of Hymer
(1960). In pursuing foreign direct investment, it would seem that an
organization must possess a specific advantage to such an extent that

124 this outweighs its fear, in terms of language, culture, physical
distance and so on, of doing business in an environment where local
practices are different from the home market. The argument goes
that this advantage must be sufficient to offset the presumed
potential of competition from locally situated organization in order
for foreign investment to occur. Such specific advantages may reside
in barriers to entry. Caves (1982) makes the point that the most
powerful source of specific advantage is product differentiation
through, for example, a patented product or via production
technology or marketing investment in branding, styling, distribution
and/or service. But other sources are significant in creating
competitive advantage – for example, economies of scale, access to
capital and raw materials, integration backward or forwards, skills
such as managerial know-how, research and development and so on.
Market imperfections may be created in a number of ways.
1. Internal of external economies of scale often exist, possibly
due to privileged access to raw materials or to final markets,
possibly from the exploitation of firm-specific knowledge
assets, possibly from increases in physical production. The
oligopolies which may result do not react as would firms in
perfectly competitive markets. For example, Knickerbocker
(1973) has shown that oligopolistic competitors tend to follow

125
one another into individual foreign markets-behaviour which
may not always be justified by pure profit potential.
2. Effective differentiation-not only to products and processes
but also to marketing and organizational skills-may create
substantial imperfections.
3. Government policies have an impact of fiscal and monetary
matters, on trade barriers and so on. Multinationals are often
able to borrow at lower rates than indigenous firms. Due to
their stronger credit ratings, multinationals may often borrow
funds in international markets at favourable rates when host
government policies make domestic capital expensive or
unavailable for indigenous firms. And multinationals are able
to build efficient portfolios of FDI - thus reducing the risk
involved in any one host’s intervention. This may not be
available to more regional competitors.
Market imperfections enable firms to use the power of their
specific advantage to close markets and obtains superior rents on
their activities. To quote Hymer (1960), multinationals are propelled
for monopolistic reasons ‘to separate markets and prevent
competition between units’. Clearly, if markets were open and
efficient, organizations would not be able to sustain monopolistic
advantages and perhaps, the amount of FDI would be less.
Essentially then, theories of international investment based on the

126 existence of market imperfections, suggest that foreign investment is
undertaken by those firms that enjoy some monopolistic or
oligopolistic advantage. This is because, under perfect market
conditions, foreign firms would be non-competitive due to the cost
of operating from a distance, both geographically and culturally.
Presumably, the firm that invests abroad has some unique advantage,
whether it be in terms of product differentiation, marketing or
managerial skills, proprietary technology, favourable access to
finance or other critical inputs. Oligopoly theory may also explain
the phenomenon of defensive investment, which may occur in
concentrated industries to prevent competitors from gaining or
enlarging advantages that could then be exploited globally.
FOREIGN DIRECT INVESTMENT POLICY IN INDIA
There has been a growing recognition in India that any
credible attempt towards economic reforms must involve up-
gradation of technology, scale of production and linkages to the
increasingly integrated globalize production system chiefly through
the participation of transnational corporations. Neglected in India’s
development strategy before 1991, the Government is now pursuing
a pro-active policy to attract foreign direct investment. The industrial
policy of 1991 provides a fairly liberalized policy framework to
attract foreign direct investment into the country. India has a number
of advantages to offer to potential foreign investors. Among these

127 are: political stability in a democratic polity, an economy
characterized by steady growth and a single digit inflation rate, a vast
domestic market, a large and growing pool of trained manpower, a
strong entrepreneurial class, fairly well developed social and
physical infrastructure, a vibrant financial system including a rapidly
expanding capital market and a diversified industrial base. Foreign
direct investment (FDI) has gained importance globally as an
instrument of international economic integration. Foreign direct
investment policies along with trade policies have, in fact, become
the focus of liberalization efforts in almost every country.
Liberalized trade regime along with an open door foreign investment
policy creates pressures to achieve higher levels of efficiency and
flexibility at the firm level.
The Government of India’s policy towards foreign direct
investment of ‘foreign collaboration’ as it is most commonly referred
to in official statements has evolved from cautious promotion in the
late 1940s to a brief period of near “open door” in the 1950s, to a
policy of rigorous selectivity in the late 1960s and 1970s and to a
policy of increasing liberalization in the 1980s. These policy swings
have reflected the socio-economic-cum-political objectives of the
Government.

128 Governments Policy towards FDI since Independence (1948-
1979)
Soon after independence, India embarked on a strategy of
import substituting industrialization in the framework of
development planning with a focus on development of total
capability in heavy industries including the machinery
manufacturing sector. The scope of import substitution extended
literally to almost everything that could be manufactured in the
country (Bhagwati and Desai, 1970). The domestic industry was
accorded considerable protection in the form of high tariffs and
quantitative restrictions on imports. In order to channel country’s
scarce investible resources (the savings rate was just over 10 per cent
in 1950) according to plan priorities, an industrial approval
(licensing) system was put into place in the country that regulated all
industrial investments beyond a certain minimum. A number of key
industries were earmarked for further development in the public
sector either in view of their strategic nature or anticipated lack of
initiative in the private sector because of large capital requirements.
As a part of the development plans large investments were made in
human resources creating activities such as expansion of education,
especially the technical and engineering, facilities and creation of a
scientific and technological infrastructure in the form of a network of
national and regional laboratories in the country. The government
also made investments in development of institutional infrastructure
129 for industrial development such as term lending and capital markets
development. As the domestic base of ‘created’ assets, viz.,
technology, skills, entrepreneurship was quite limited, the attitude
towards FDI was sought on mutually advantageous terms though the
majority local ownership was preferred. Foreign investors were
assured of no restrictions on the remittances of profits and dividends,
fair compensation in the event of acquisition, and were promised a
national treatment. The foreign exchange crisis of 1957-58 led to
further liberalization in the government’s attitude towards FDI. In a
bid to attract foreign investment to finance foreign exchange
component of projects, a host of incentives and concessions were
extended. The protection accorded to local manufacture acted as an
important locational advantage encouraging market seeking FDI. A
large number of foreign enterprises serving Indian market through
exports started establishing manufacturing affiliates in the country.
This (viz., late 1950s and early 1960s) was the period when western
multinational enterprises started showing real interest in India.
Expect for the large oil companies and as well will see later
on, the tea plantations, the policy towards FDI was quite pragmatic
and flexible. This is clear from the statements made by Pt.
Jawaharlal Nehru in the floor of Parliament (Ministry of Finance,
1969). Nehru, in particular, clearly recognised the role TNCs could
play in India’s industrialization. In fact, except for FERA companies,

130 there has been no discrimination between Indian and foreign
controlled companies from the point of view of laws and taxation. In
1965 and 1972 the FTZs were set up in Kandla, Gujarat and Santa
Cruz, Bombay. Like in other Asian countries, a host of tax and other
concessions were given to companies investing here for the export
market. The concessions ranged from liberal depreciation allowances
to complete tax exemptions. The main problem was that the policy
towards FDI was being determined on a case by case basis. Except in
the case of the oil companies, the view was that the 1956 IPR was
unfavourable to FDI. However, as the foreign exchange crisis
developed towards the late ‘fifties, some degree of pragmatism came
in as TNCs began to be viewed as owners of technology and net
foreign exchange earners through exports.
In 1969 a more precise police towards FDI was evolved. This
consisted of setting out three groups of industries where (i) there
would be FDI without technical collaboration, (ii) only technical
collaboration, and (iii) no foreign participation. Second, the foreign
exchange crisis precipitated FERA particularly article 29 which
specified that any foreign owned firm with more than 40 per cent of
equity held abroad had to apply to the Reserve Bank of India for
approval in cases relating to expansion, mergers, purchase of share in
other firms etc. FERA came into force in 1974 and all applications
had been dealt with by 1979.

131 Investment made in machinery fabrication facilities,
manpower development, scientific and technological infrastructure
made in the previous period had led to development of certain
‘created’ assets in the country. For instance, certain capabilities for
process and product adaptations had been built up in the country. A
number of local design engineering and project management
consultants had accumulated considerable expertise while acting as
subcontractors for western prime consultants. A considerable plant
fabrication capability had been built up in the country by late 1960s.
The share of imported machinery and equipment as a proportion of
gross domestic capital formation had gone down from 69 per cent in
1950 to under 25 per cent by 1968-69. However, locally available
skills and capabilities were needing some sort of infant industry
protection as these were not able to stand competition from more
established industrialized country sources. Constraints on local
supply of capital and entrepreneurship had begun to ease somewhat.
On the other hand outflow on account of remittances of dividends,
profits, royalties, and technical fees, etc., abroad on account of
servicing of FDI and technology imports from the earlier period had
grown sharply and had become a significant proportion of the
foreign exchange account of the country.
All these factors together prompted the government to
streamline the procedures for foreign collaboration approvals and

132 adopts a more restrictive attitude toward FDI. Restrictions were put
on proposals of foreign direct investments unaccompanied by
technology transfer and those seeking more than 40 per cent foreign
ownership. The government listed industries in which FDI was not
considered desirable in view of local capabilities. The permissible
range of royalty payments and duration of technology transfer
agreements with parent companies were also specified for different
items. The guidelines evolved for foreign collaborations required
exclusive use of Indian consultancy services wherever available. The
renewals of foreign collaboration agreements were restricted. From
1973 onwards the further activities of foreign companies (along with
those of local large industrial houses) where restricted to a select
group of core of high priority industries. In the same year a new
Foreign Exchange Regulation Act (FERA) came into force which
required all foreign companies operating India to register under
Indian corporate legislation with up to 40 per cent foreign equity.
Exceptions from the general limit of 40 per cent were made only for
companies operating in high priority or high technology sectors, tea
plantations, or those producing predominantly for exports.
The government also issued the Industrial Policy of 1973. For
one the policy specified the precise areas in which non-FERA
companies could operate. It is clear that the idea was to restrict
foreign firms to sectors producing basic intermediate and capital

133 goods. In particular, foreign firms were kept out of consumer goods.
However, realizing the need for larger foreign involvement, the
policy allowed for up to 49 per cent foreign equity in high
technology, priority sectors which usually involved large
investments. But here foreign participation was restricted to joint
ventures with the government. In general, the government feeling
was that the India private sector was ill-equipped to handle the large
TNCs.
How successful was FERA? In actuality there were a lot of
exemptions from FERA. For one, in the case of firms exporting more
than 60 per cent of output, 74 per cent of equity could be held
abroad. Second up to 51 per cent foreign equity was permissible if
60 per cent of the firms turnover was in core sector activities and it
exported 10 per cent of production. The same level applied to firms
exporting more than 40 per cent of their turnover. For a 100 per cent
export oriented firm, 100 per cent foreign equity was permitted.
The period from 1970-80 can be then considered the most
restrictive from the point of view of FDI mainly because
implementation of FERA was the principal item on the agenda of
policy makers. However, in terms of the general attitude towards
FDI we can really think of the whole period from 1949 as one of
cautious encouragement followed by strong reaction. The main

134 drawback of the system of control through FERA was that it failed to
control the large TNCs for whom it was intended. At the same time
it sent negative signals to prospective investors thus perpetuating the
monopoly control of foreign and local capital. Like the Industrial
Licensing system FERA was an instrument of control rather than an
incentive.
1980s: Government’s Initiatives for Cautious Deregulation
Towards the end of the 1970s India’s failure to significantly
step up the volume and proportion of her manufactured exports in
the background of the second oil price shock began to worry the
policy-makers. It led to the realization that international
competitiveness of Indian goods had suffered from growing
technological obsolescence and inferior product quality, limited
range, and high cost which in turn were due to the highly protected
local market. Another limiting factor for Indian manufactured
exports lay is the fact that marketing channels in the industrialised
countries were substantially dominated by MNCs. The government
intended to deal with the situation by putting emphasis on the
modernization of industry with liberalized imports of capital goods
and technology, exposing the Indian industry to foreign competition
by gradually liberalizing the trade regime, and assigning a greater
role to MNCs in the promotion of manufactured exports. This
strategy was reflected in the policy pronouncements that were made

135 in the 1980s. These covered liberalization of industrial licensing
(approval) rules, a host of incentives, and exemption from foreign
equity restrictions under FERA to 100 per cent export-oriented units.
Four more Export processing Zones (EPZ) were set up in addition to
the two existing ones, namely, those at Kandla (set up in 1965) and a
Santacruz (set up in 1972) to attract MNEs to set up export-oriented
units. The trade policies gradually liberalized the imports of raw
materials and capital goods by gradually expanding the list of items
on the Open General License (OGL). Between 1984-85 alone, 150
items and 200 types of capital goods were added to OGL list. Tariffs
on imports of capital goods were also slashed. Imports of designs
and drawings and capital goods were permitted under a liberalized
Technical Development Fund Scheme.
The liberalization of industrial and trade policies was
accompanied by an increasingly receptive attitude towards FDI and
foreign licensing collaborations. Approval systems were streamlined.
A degree of flexibility was introduced in the policy concerning
foreign ownership, and exceptions from the general ceiling of 40 per
cent on foreign equity were allowed on the merits of individual
investment proposals. The rules and procedures concerning
payments of royalties and limp sum technical fees were relaxed and
withholding taxes were reduced. The approvals for opening liaison
offices by foreign companies in India were liberalized. New

136 procedures were introduced enabling direct application by a foreign
investor even before choosing an Indian partner. A ‘fast channel’
was set up in 1988 for expediting clearances of FDI proposals from
major investing countries, viz., Japan, Germany, the US and the UK.
1990s: Full-scale Liberalization and Integration with World
Economy
In June 1991, the Indian government initiated a programme of
macro-economic stabilization and structural adjustment supported by
the IMF and World Bank. As a part of this programme a New
Industrial Policy (NIP) was announced on July 24, 1991 in the
parliament which has started the process of full scale liberalization
and intensified the process of integration of India with the global
economy. The NIP and subsequent policy amendments have
liberalized the industrial policy regime in the country, especially, as
it applies to FDI beyond recognition. The industrial approval system
in all industries has been abolished except for 18 strategic or
environmentally sensitive industries. In 34 high priority industries
FDI up to 51 per cent is approved automatically if certain norms are
satisfied. FDI proposals do not necessarily have to be accompanied
by technology transfer agreements. Trading companies engaged
primarily in export activities are also allowed up to 51 per cent
foreign equity. To attract MNEs in the energy sector, 100 per cent
foreign equity was permitted in power generation. International

137 companies were allowed to explore non-associated natural gas and
develop gas fields including laying down pipelines and setting up
liquefied petroleum gas projects. A new package for 100 per cent
export-oriented projects and companies in export processing zones
was announced. A Foreign Investment Promotion Board (FIPB)
authorized to provide a single window clearance has been set up in
the prime minister’s office to invite and felicitate investments in
India by international companies. The existing companies are also
allowed to raise foreign equity levels to 51 per cent for proposed
expansion in priority industries. The use of foreign brand names for
goods manufactured by domestic industry which was restricted has
also been liberalized. India became a signatory to the Convention of
the Multilateral Investment Guarantee Agency (MIGA) for
protection of foreign investments. The Foreign Exchange Regulation
Act of 1973 has been amended and restrictions placed on foreign
companies by the FERA have been lifted. Companies with more than
40 per cent of foreign equity are now treated on par with fully Indian
owned companies. New sectors such as mining, banking,
telecommunications, highways construction and management have
been thrown open to private, including foreign owned, companies.
These relaxations and reforms of policies have been accompanied by
active courting of foreign investors at the highest level. The
international trade policy regime has been considerably liberalized

138 too with lower tariffs on most types of importables and sharp
pruning of negative list for imports.
Although the time period is too short for any analytical study
some inferences can be drawn. For one, reduction of bureaucratic
procedures is not enough to attract FDI. This is evidenced by the fact
that foreign investors have not been making use of the automatic
approval route for FDI. The difference in the automatic and the non-
automatic route lies in the industries covered and the extent of
foreign ownership permissible. It is clear that if foreign control is the
principal requirement of foreign investors, then 51 per cent
ownership is adequate even in closely held companies. What is
probably the greater deterrent to foreign investors is that the list of
industries where automatic approval is permissible excludes
consumer goods. It is thus clear that a major motivating factor
behind FDI is the size of the domestic market. The Economic Survey
for 1993/94 notes that 80 per cent of approvals have been in the
priority sectors. These include power equipment and similar
infrastructural facilities where the domestic demand is expected to
show phenomenal growth. Second, it is also clear that export markets
are not a major attraction despite the low costs of the Indian
operations. Finally, the flows of FDI in the form of portfolio capital
are still dominant. Since portfolio capital flows are short-term,
speculative flows and may not lead to an increase in productive

139 capacity, and hence cannot be of as much benefit to India as FDI
flows in the form of long-term equity.
As is clear from the above, the policy towards FDI is still
restrictive although the restriction on the level of foreign equity is
likely to be done away with. However, this may not be enough as it
is clear that a major attraction for FDI is the domestic market.
Second, the obsession with export oriented FDI continues as also
restrictions on large volume of FDI in the form of equity. Given that
foreign exchange is no longer a constrain it is unclear why this
obsession continues. Presumably, import substituting FDI can save
as much foreign exchange as export oriented FDI; Hence, the
continued restrictions on FDI catering to the domestic consumer
goods market are difficult to understand. Finally, the restrictions on
high levels of FDI (the FIPS route) have also been carried over from
the past. This was precisely the problem in the past: such a policy
allowed foreign investors a mode of involvement in the Indian
economy in which they had little at stake.
FDI Policy and Prospects
The cumulative approval of FDI since 1991 adds up to
approximately US $ 46 billion (excluding GDRs) and the total
inflows up to December, 1998 are nearly US $ 13.30 billion
(excluding GDRS) giving a success rate of around 29%. To bridge

140 the Investment Saving gap (of 3 to 4 per cent) in order to achieve a
sustained growth of 6 to 7 per cent, FDI of the order of US $ 10
billion or more per annum is required. It is in this light that FDI is
invited as a measure to supplement domestic efforts, especially
because assistance from multi-lateral and bilateral sources is either
stagnant or declining in comparison to private capital flows. Even in
the private capital flows, the short-term foreign capital flows are
prone to quick reversal in terms of investors’ perception on how the
domestic economy is shaping. FDI, which is a long-term investment
is, therefore, of crucial importance. FDI is the most desirable form of
external funding not only for the long-term additional capital it
brings in, but also for the technology up gradation and modern
production and management practices that accompany it.
Recent policy initiative taken by the Government are as
follows:
Requirement of prior/final approval by RBI for binging in
foreign investment/allotment of shares against proposals duly
approved has been dispensed with. New companies will only
have to file the required documents with the RBI regional
office within 30 days of issue of shares;
The Reserve Bank of India has delegated powers to its
regional offices for granting Automatic Approval in respect of
Foreign Collaboration;

141
Foreign Equity up to 100 per cent in the power sector for
electric generation, transmission and distribution has been
made eligible for automatic approval (barring atomic-reactor
plants) provided foreign equity does not exceed Rs.1500 crore;
In case of shortfall in NRI contributions in private sector
banks, multilateral financial institutions would be allowed to
contribute foreign equity to the extent of the shortfall in NRI
contributions within the overall limit of 40 per cent;
Select infrastructure projects of Rs.100 crore and above are
taken up for detailed monitoring to remove bottlenecks and
expedite implementation; and
Two additional activities, namely, “Credit Card Business” and
“Money Changing Business” have been included in approved Non
Banking Financial activities for FDI and minimum capitalization
norms have been dispensed with, in respect of non-fund based Non
Banking Financial activities.
The measures introduced by the Government to liberalize
provisions relating to FDI have been consolidated and further
expanded into new areas. The Government is committed to promote
increased inflow of FDI and its intended benefits such as better and
high technology, modernization, increased opportunity of exports
and providing products and services of international standards to
Indian consumers.

142 To achieve these objectives, it is the Government’s continuing
endeavour not only to provide greater transparency in the policy and
procedures but also to enable a more dynamic and investor friendly
policy framework. With this end in view high priority sectors with
50/51/74/100% foreign equity are already under Automatic Approval
Route. To provide greater transparency to the approval process, the
Government has issued a set of guidelines for the consideration of
proposals by the Foreign Investment Promotion Board (IFPB) so as
to make prospective investors aware of the issues, which are
considered by the FIPB while deciding proposals.
Some of the initiatives taken by the Secretariat for Industrial
Assistance (SIA) are
In line with the economic reform policy inter alia aimed at
deregulation and decontrol of industry, three more industries
have been delicensed, namely: (i) coal and Lignite, (ii)
Petroleum (other than crude) and its distillation products, and
(iii) Sugar Industry. With this the list of industries requiring
compulsory licensing has been reduced to 6 on the basis of
environmental, strategic and safety considerations;
The Ministry has taken up a consultative exercise with
Administrative Ministries concerned for bringing in further
clarity in the sectoral policies concerning FDI. Foreign Equity
up to 100 per cent in Power Sector for electric generation,

143
transmission and distribution as also roads & highways, ports
& harbours, and vehicular tunnels and bridges has been made
eligible for automatic approval provided foreign equity does
not exceed Rs.1500 crore;
Requirement of prior approval by RBI for binging in
FDI/NRI/OCB investment and issue of shares to foreign
investors after FIPB/Government approval has been done
away with. New companies will have to file the required
documents with the concerned regional office of the RBI
within 30 days of issue of shares. However, they are also
required to intimate RBI of receipt of inward remittances
within 30 days.
The Reserve Bank of India has delegated powers to its
Regional offices for granting Automatic Approval in respect
of Foreign Technical Collaboration (FTC);
As per new procedure, the applications for setting up Export
Oriented Units in Export Processing Zones are to be submitted
to the Development Commissioner of Export processing
Zones directly for approval. However, induction of foreign
equity would require Foreign Investment Promotion
Board/Government approval and applications for foreign
equity are to be routed through SIA.
The facility available to EOU/EPZ units in regard to automatic
approval for payment of lump sum fee and royalty for foreign

144
technical collaboration have now been made at par with the
general facility available to non-EOU/EPZ units i.e., lump
sum fee up to US $ two million and royalty payments up to
8% on exports and 5% on sales/DTA sales over a period of 5
years from the date of commercial production;
Development commissioners have been delegated with powers
to permit disposal of obsolete capital goods (used for less than
five years) on payment of applicable duties, up to maximum
limit of Rs. 10 lakh in each financial year for an EOU/EPZ
unit; to permit import of office equipment not exceeding 20
per cent of the total capital goods value, subject to EXIM
policy up to a maximum limit of Rs.25 lakh; and to permit
merger of two or more EOU/EPZ units, provided the unit falls
within the jurisdiction of the same Development
Commissioner and the same Commissioner of Central Excise
and Customs;
Procedure for filling of Industrial Entrepreneur’s
Memorandum (IEM) in composite form has also been
streamlined. Amendments/Modifications allowed to the
Entrepreneurs with reference to the status/ regulations/
notifications issued by the Central/State Governments from
time to time;

145
Two additional activities namely “Credit Card Business” and
“Money Changing Business” have been included in the
approved activities FDI;
Minimum Capitalization Norm has been dispensed with in
respect of non-fund based NBFC activities;
Foreign Direct Investment up to 40 per cent by multilateral
financial institutions allowed in the case of Private Sector
Banks, within the overall limit of 40 per cent of FDI, including
NRI Investment;
Proposals for manufacture of cigarettes with FDI up to 100 per
cent are now allowed. Such approvals shall be subject to the
provisions relating to compulsory licensing under the
Industries (Development and Regulation) Act, 1951;
For Foreign Collaboration and Industrial License, a revised
composite form has been prescribed;
To encourage investment by Non Resident Indians
(NRIs)/OCBs can now invest in a listed company up to 5 per
cent of its equity (up from 1 per cent); the aggregate
investment limit for all NRI/OCB investment is to be
increased from 5 per cent to 10 per cent;
As announced by the Hon’ble Prime Minister the FIPB is
making all efforts to give a firm ‘Yes’ or ‘No’ to FDI
proposals within a stipulated time frame;

146
A Project Monitoring Unit has been set up within the
Department to monitor and facilities smooth implementation
of large FDI projects having foreign equity of Rs.100 crore
and above; and
Foreign financial/technical collaborators with past/existing
joint ventures to seek Foreign Investment Promotion
Board/Government approval in case of setting up new joint
ventures in the same or allied activities.
Major Initiatives to Attract FDI
In pursuance of Government’s commitment to further
facilitate Indian industry to engage unhindered in various activities,
Government has permitted, except for a negative list, access to the
automatic route for Foreign Direct Investment. The automatic route
means simply that foreign investors need to inform the Reserve Bank
of Indian within 30 days of bringing in their investment, and again
within 30 days of issuing any shares. The negative list includes the
following.
All proposals that require an industrial license because the
activity is licensable under the Industries (Development and
Regulation) Act, 1951, cases where foreign investment is more than
24% in the equity capital of units manufacturing items reserved for
small scale industries, and all activities that require an industrial

147 license in terms of the locational policy notified by Government
under the Industrial Policy of 1991.
All proposals in which the foreign collaborator has a previous
venture/tie-up in India;
All proposals relating to acquisition of shares in an existing
Indian company in favour of a foreign/Non-Resident Indian
(NRI)/Overseas Corporate Body (OCB) investor; and All proposals
falling outside notified sectoral policy/caps or under sectors in which
FDI is not permitted and/or whenever any investor chooses to make
an application to the Foreign Investment Promotion Board and not to
avail of the automatic route.
Non-Banking Financial Companies may hold foreign equity
upto 100 per cent if these are holding companies. However, their
subsidiaries, which are operating companies, may hold only up to 75
per cent foreign equity. To facilitate the setting up and operation of
such subsidiaries, Government has further allowed holding
companies with a minimum capital of US $ 50 million, to set up 100
per cent downstream subsidiaries to undertake specific Non-Banking
Financial activities with minimum capital of US $ 5 million. Such a
subsidiary, however, would be required to disinvest its equity of the
minimum extent of 25% through a public offering only, within a
period of 3 years.
148 In the process of liberalization of FDI policy, Government has
further announced the following policy changes:
100 per cent FDI permitted for B to B e-commerce;
Condition of Dividend Balancing on 22 consumer items
removed forthwith;
Removal of cap of foreign investment in the Power sector; and
100 per cent FDI permitted in oil-refining.
Automatic Route is available to proposals in the Information
Technology sector, even when the applicant company has a previous
joint venture or technology transfer agreement in the same field.
Automatic Route of FDI upto 100 per cent is allowed in all
manufacturing activities in Special Economic Zones (SEZs), except
for the following activities: Arms and ammunition, explosives
and allied items of defence equipment, defence aircraft and warships;
Atomic substances;
Narcotics and psychotropic substances and hazardous
chemicals;
Distillation and brewing of alcoholic drinks; and
Cigarettes/cigars and manufactured tobacco substitutes.
FDI upto 100 is allowed with some conditions for the
following activities in Telecom sector:

149 ISPs not providing gateways (both for satellite and submarine
cables);
Infrastructure Providers providing dark fiber (IP Category I);
Electronic Mail; and
Voice Mail
Payment of royalty upto 20 on exports and 1 per cent on
domestic sales is allowed under automatic route on use of trademarks
and brand name of the foreign collaborator without technology
transfer.
Payment of royalty upto 8 per cent on exports and 5 per cent
on domestic sales by wholly owned subsidiaries to off-shore parent
companies is allowed under the automatic route without any
restriction on the duration of royalty payments.
Off-shore Venture Capital Funds/Companies are allowed to
invest in domestic venture capital undertakings as well as other
companies through the automatic route, subject only to SEBI
regulations and sector specific caps on FDI.
Existing companies with FDI are eligible for automatic route
to undertake additional activities covered under automatic route.

150 FDI upto 26 per cent is eligible under the automatic route in
the Insurance sector, as prescribed in the Insurance Act 1999, subject
to their obtaining licence from Insurance Regulator and
Development authority.
Capital Flows and FDI
The new institutional framework will promote free flow of
capital and foreign investment, both direct as well as portfolio.
Capital rich nations will seek out investment destinations generating
higher returns. This trend will be reinforced by rising income levels
and the again of the OECD population, which will swell the size of
pension, insurance and mutual funds, resulting in a continuous
increase in international capital flows in search of secure and
attractive returns. At the same time, large manufacturing companies
will increasingly move from national to global production strategies,
resulting in further shifting of production and direct investment in
countries or regions in which markets exist or in which production
costs are lowest (Vision 2020).
The enlargement of the international capital market will open
up increasing opportunities for India to attract foreign direct and
institutional investment. Foreign direct investment (FDI) expanded
globally from $ 59 billion in 1991 to $ 1,270 billion in 2000, but
with an increasing proportion of these flows moving between

151 developed nations. During this period, FDI flows to India increased
six fold to $ 2.3 billion, which represents less than 0.12 per cent of
global FDI. The amount of capital globally available will continue to
grow, but improvements in infrastructure and elimination of
bureaucratic barriers will be major determinants of India’s success in
attracting a greater share of FDI flows. The size and prosperity of
China’s non-resident population has been a vital link for the
channeling of technology, investment and business back to the
mainland. A similar mobilization of India’s expatriate population
could have momentous impact on the inflow of FDI in 2020.
Likewise, multinational investments in India should be encouraged,
especially in technology intensive sectors where they can supplement
and strengthen India’s technological capabilities (Vision 2020).
Indian’s Trade and FDI policies
India’s economic policy after independence was one of
national self-sufficiency that stressed the importance of government
regulation of the economy and planned industrialization. Its
economic policy was considered as inward looking and highly
interventionist. The salient features of the policy included import
protection, complex industrial licensing requirements and substantial
public ownership of industries, especially heavy industries, among
other (Topalova 2004). India’s trade policy was characterized by
high tariffs and pervasive import restrictions. These restrictive

152 policies continued till the 1970s. However, amidst growing
dissatisfaction over its results, there was a gradual shift in the focus
of India’s development strategy towards export-led growth during
the 1980s. Seeing the experience of many east Asian countries in
achieving high growth and poverty reduction and encouragement of
the private sector, several liberalization measures were adopted
during the 1980s and 1990s. Industrial licensing was eased and
import restrictions were brought down. The 1991 liberalisation
included major structural reforms including trade and foreign
investment liberalisation. Telising the importance of FDI through
MNEs in improving productivity, exports and overall economic
growth, a number of policy decisions were undertaken to attract
more FDI. This has resulted in increased inflow of FDI. The FDI
inflow has increased from a mere $ 97 million in 1990-91 to $
34,362 million in 2007-08 (RBI 2009).
Along with the foreign investment policies, there was
tremendous reduction in tariffs and non-tariffs barriers and also in
the protection to Indian industries (Ahluwalia 2002). The consistent
trade reform polices ushered in through various export-import policy
plans helped India to increase its share in world exports from 0.5 per
cent in the half of the 1990s to 0.7 per cent in 2000-01, and to 1 per
cent in 2005-06. This share in world exports remained the same at 1
per cent till 2007-08. The ratio of total exports to the gross domestic
153 product (GDP) rose from 5.8 per cent in 1990-91 to 12.2 per cent in
2004-05, and grew further to 14 per cent 2006-07 (GOI 2008).
Merchandise exports from India increased rapidly from $ 18,145
million in 1990-91 to $ 162,983.90 million in 2007-08, with almost
70 per cent of the export contribution coming from the
manufacturing sector (GOI 2009).
Having presented the Theories and Policy of Foreign Direct
Investment in India, the next two chapter deals with data analysis on
Foreign Direct Investment inflows into India.

Chapter V
DATA ANALYSIS
The data analysis has been done on the following lines. It has
been presented in two chapters viz., Chapter V and Chapter VI.
Chapter V has been divided into eleven sections relating to,
1. Foreign Investment in India
2. Foreign Direct Investments
3. Foreign Portfolio Investments
4. Share of Top Investing countries FDI Inflows
5. Sectors Attracting Highest FDI inflow
6. Foreign Direct Investment (Advance and Loans)
7. Monthly FDI inflows for the year 2009-2010
8. Monthly FDI Inflows for the year 2010-2011
9. Foreign Technology Transfers (Country-wise)
10. Foreign Technological Transfer Approvals (State-wise)
11. Foreign Technological Transfer Approvals (Sector-wise)

155 5.1. Foreign Investment in India
The following table presents the Foreign Investment inflows
into India both Foreign Direct Investment and Foreign portfolio
Investment for the years 1991-92 to 2009-10.
Table 5.1
Foreign investments in India
S. No.
00Year00 Direct
Investment Portfolio
Investment Total Foreign
Investment AIIP
1. 1991-92 316 10 326 -
2. 1992-93 965 748 1,713 425.46
3. 1993-94 1,838 11,188 13,026 660.42
4. 1994-95 4,126 12,007 16,133 23.85
5. 1995-96 7,172 9,192 16,365 1.43
6. 1996-97 10,015 11,758 21,773 33.05
7. 1997-98 13,220 6,794 20,014 -8.08
8. 1998-99 10,358 -257 10,358 -48.25
9. 1999-2000 9,338 13,112 22,450 116.74
10. 2000-01 18,406 12,609 31,015 38.15
11. 2001-02 29,235 9,639 38,874 25.34
12. 2002-03 24,367 4,738 29,105 -25.13
13. 2003-04 19,860 52,279 72,139 147.86
14. 2004-05 27,188 41,854 69,042 -4.29
15. 2005-06 39,674 55,307 94,981 37.57
16. 2006-07 103,367 31,713 135,080 42.22
17. 2007-08 140,180 109,741 249,921 85.02
18. 2008-09 161,536 -63,618 161,536 -35.36
19. 2009-10 176,304 153,511 329,815 104.17
Source: RBI Bulletin (for the relevant years except percentage) http://www.rbi.org.in. AIIP : Annual Incremental Increase in Percentage

156 The following are the deduction from the table 5.1, total Foreign
Investments in India
The total Foreign Investment inflows into India in absolute
term has increased from Rs.326 crore to Rs.329815 crore for the
years 1991-92 to 2009-10. It represents an increase of 1012 times.
The annual incremental increase in percentage shows the mixing
trends of increasing and decreasing over the study period. The
maximum annual average growth rate viz. 660.42 per cent was
recorded in the year 1993-94 and the minimum annual average
growth rate viz. 1.43 per cent was recorded in the year 1995-96. In
some years the annual average growth rate shows the negative
trends. The declining and negative growth rate may be caused by the
money value, climatical condition, political stability and other
foreign policies of the host countries and the home country. However
the Foreign Investment plays a peculiar role in the development of
Indian Economy. It is noteworthy to note that immediately after the
liberlisation process of 1991, the annual growth rate of foreign
investment inflown recorded a highest growth rate namely 425.46
per cent in 1992-93 and 660.42 per cent in 1993-94.
The following figure 1 showing the trends of Foreign
Investment inflows into India for the years 1991-92 to 2009-2010.

Fig.1
Foreign investment in India
-100
0
100
200
300
400
500
600
70019
91-9
2
1992
-93
1993
-94
1994
-95
1995
-96
1996
-97
1997
-98
1998
-99
1999
-200
0
2000
-01
2001
-02
2002
-03
2003
-04
2004
-05
2005
-06
2006
-07
2007
-08
2008
-09
2009
-10
Year
Ann
ual I
ncre
men
tal i
ncre
ase
in p
erce
ntag
e
157

158 5.2. Foreign Direct Investment
The following table presents the Foreign Direct investment
inflows into India for the years 1991-92 to 2009-2010
Table 5.2
Foreign Direct Investments
S. No. 00Year00 Direct Investment AIIP
1. 1991-92 316 -
2. 1992-93 965 205.38
3. 1993-94 1,838 90.47
4. 1994-95 4,126 124.48
5. 1995-96 7,172 73.82
6. 1996-97 10,015 39.64
7. 1997-98 13,220 32.00
8. 1998-99 10,358 -21.64
9. 1999-2000 9,338 -9.85
10. 2000-01 18,406 97.12
11. 2001-02 29,235 58.83
12. 2002-03 24,367 -16.65
13. 2003-04 19,860 -18.49
14. 2004-05 27,188 36.89
15. 2005-06 39,674 45.92
16. 2006-07 103,367 160.54
17. 2007-08 140,180 35.61
18. 2008-09 161,536 15.23
19. 2009-10 176,304 9.14
Source: RBI Bulletin (for the relevant years except percentage) http://www.rbi.org.in. AIIP : Annual Incremental Increase in Percentage

159 The following are the inferences of the table 5.2, Foreign Direct
Investment
The Foreign Direct Investment inflows into India in absolute
term has increased from Rs.316 crore to Rs.1,76,304 crore for the
years 1991-92 to 2009-10. It represents an increase of 558 times. The
trends of Foreign Investment inflows into India shows the increasing
trends over the year except a few years. The highest annual growth
rate viz. 205.38 per cent was recorded in the year 1992-93 and the
lowest annual growth rate viz. 9.14 per cent recorded in the year
2009-10. In some of the years under the study periods shows the
negative growth rate. It is interesting to note that the liberalisation
process motivated higher FDI inflows into India, the highest growth
rate of FDI inflow viz. 205.38 per cent was recorded in 1992-93.
The following bar diagram (Fig.2) showing the Foreign Direct
Investment inflows into India for the years 1991-92 to 2009-2010.

Fig.2 Foreign Direct Investment
-50
0
50
100
150
200
25019
91-9
2
1992
-93
1993
-94
1994
-95
1995
-96
1996
-97
1997
-98
1998
-99
1999
-200
0
2000
-01
2001
-02
2002
-03
2003
-04
2004
-05
2005
-06
2006
-07
2007
-08
2008
-09
2009
-10
Year
Ann
ual I
ncre
men
tal i
ncre
ase
in p
erce
ntag
e
160

161 5.3. Foreign Portfolio Investment
The following table presents the Foreign portfolio Investment
inflows into India for the years 1991-92 to 2009-10.
Table 5.3
Foreign Portfolio Investments
S. No. 00Year00 Portfolio Investment AIIP
1. 1991-92 10 -
2. 1992-93 748 7380
3. 1993-94 11,188 1395.72
4. 1994-95 12,007 7.32
5. 1995-96 9,192 -23.44
6. 1996-97 11,758 27.92
7. 1997-98 6,794 -42.22
8. 1998-99 -257 NA
9. 1999-2000 13,112 NA
10. 2000-01 12,609 -3.83
11. 2001-02 9,639 -30.81
12. 2002-03 4,738 -50.85
13. 2003-04 52,279 1003.39
14. 2004-05 41,854 -19.94
15. 2005-06 55,307 32.14
16. 2006-07 31,713 -42.66
17. 2007-08 109,741 246.04
18. 2008-09 -63,618 NA
19. 2009-10 153,511 NA
Source: RBI Bulletin (for the relevant years except percentage) http://www.rbi.org.in. AIIP : Annual Incremental Increase in Percentage

162 The following are the inferences of the table 5.3 Foreign portfolio
investment inflows into India for the years 1991-92 to 2009-10
The Foreign portfolio investments inflows into India in
absolute amount has increased from Rs.10 crore to Rs.1,53,511 crore
for the years 1991-92 to 2009-10. It represents an increase of 15351
times. The highest annual growth rate viz., 7380 per cent was
recorded in the year 1991-92 and lowest annual growth rate viz.,
7.32 per cent recorded in the year 1994-95. In some of the years
under the study period shows the negative growth rate. It is
noteworthy to note that the highest annual growth rate viz., 7380 per
cent was recorded in the year 1992-93, because of the liberalization
of Foreign Policy of India in the Reform measure of 1991-92.
The following diagram (Fig.3) showing the Foreign Portfolio
Investment into India for the years 1991-92 to 2009-2010.

Fig.3
Foreign Portfolio Investment
-100000
-50000
0
50000
100000
150000
200000
1991
-92
1992
-93
1993
-94
1994
-95
1995
-96
1996
-97
1997
-98
1998
-99
1999
-200
0
2000
-01
2001
-02
2002
-03
2003
-04
2004
-05
2005
-06
2006
-07
2007
-08
2008
-09
2009
-10
Year
For
eign
Por
tfol
io I
nves
tmen
ts
163

164 5.3a. Correlation Analysis – Foreign Direct Investment
The following table 5.3a presents the correlation, co-efficient
of determination, standard error and probable error between Foreign
Direct Investment and Portfolio Investment.
Hypothesis 1: FDI inflows into India since 1991 shows an
increasing trend.
Table 5.3a
Correlation Analysis
Correlation between Foreign Direct Investment and Portfolio Investment (r)
0.9238
Co-efficient of determination (r2) 0.8533
Standard Error 0.3365
Probable Error 0.2269
The above table reveals that the value of correlation
(r = 0.9238) between Foreign Direct Investment and Portfolio
Investment is very high during the study period and its r2 value (r2 =
0.8533) is also equally good. Hence, Foreign Direct Investment and
Portfolio Investment have very high positive relationship. It has also
been confirmed by another statistical test namely Standard Error (SE
= 0.3365) and Probable Error (PE = 0.2269). Both of these SE value
and PE values is less than the r value, the positive relationship
between the said two variable is confirmed and the hypothesis 1, FDI
inflows into India since 1991 shows an increasing trend is proved.

165 5.4. Share of Top Investment Countries
The following table presents the share of top investing
countries cumulative FDI inflows in to India for the years 1991 to
2010
Table 5.4
Share of Top Investing countries FDI Inflows
(Rs. in crores)
Rank Country 1991 – 2010 Percentage
1 Mauritius 243,322 49.36
2 U.S.A. 48,909 9.92
3 Singapore 48,854 9.91
4 U.K 35,809 7.26
5 Cyprus 25,043 5.08
6 Netherlands 24,604 4.99
7 U.A.E 23,646 4.80
8 Japan 20,445 4.15
9 Germany 15,185 3.07
10 France 7,175 1.46
Total 492992 100
Source: RBI Bulletin (for the relevant years) http://www.rbi.org.in.

166 The following are the findings of the table 5.4, the share of the
top investing countries cumulative inflows into India for the
years 1990-91 to 2009-10
The highest investment viz. Rs.2,43,322 crore was invested by
Mauritius in India which covers 49.36 per cent of the total
investment of top 10 investing countries in India. The lowest
investment viz. Rs.7,175 crore was invested by France in India
which covers 1.46 per cent of the total investment of the top ten
investing countries in India for the year 1990-91 to 2009-10. United
States of America and Singapore have invested Rs.48.909 crore and
Rs.48,854 crore respectively. UK, Cyprus and Netherland have
invested Rs.35,809 crore, Rs.25043 crore and Rs.24,604 crore
respectively. U.A.E., Japan and Germany have invested Rs.23,646
crores, Rs.20,445 crore and Rs.15,185 crores respectively. It is
interesting to note that Mauritius Investment in India viz.
Rs.2,43,322 is more or less equal to the investment viz. Rs.2,49,670
crore of other nine top level investing countries in India. The
difference between the Investment of Mauritius and other nine
countries of top ten investing countries in India is only Rs.6348
crore; Hence Mauritius has occupied a vital role in Foreign
Investment in India.
The following bar diagram (Fig.4) showing the share of top
ten investing countries in India for the years 1991 to 2010.

Fig.4 Share of Top Investing Countries FDI inflows
0
50000
100000
150000
200000
250000
In C
rore
s
Mau
riti
us
U.S
.A.
Sin
gapo
re
U.K
.
Cyp
rus
Net
herl
ands
U.A
.E.
Japa
n
Ger
man
y
Fra
nce
167

168 5.5. Sectors Attracting Highest FDI
The following table presents the sectors attracting highest FDI
inflows into India for the years 1991-92 to 2009-2010.
Table 5.5
Sectors Attracting Highest FDI inflow
(Rs. in crore)
Rank Sector 1991 – 2010 Percentage
1 Services Sector 127,138 29.79
2 Electrical Equipments 59,344 13.91
3 Telecommunications 47,877 11.22
4 Housing and Real Estate 45,748 10.72
5 Construction Activities 45,656 10.70
6 Power 27,727 06.50
7 Metallurgical Industry 22,138 05.19
8 Automobile Industry 21,664 05.07
9 Chemical 16,236 03.80
10 Petroleum and Natural Gas 13,223 03.10
Total 426751 100
Source: RBI Bulletin (for the relevant years) http://www.rbi.org.in.

169 The following are the inferences of table 5.5 the sectors
attracting highest FDI inflows into India
The highest investment viz. 1,27,138 crore was invested in the
service sector which covers 29.79 per cent of the ten sectors
attracting highest FDI inflow into India. The lowest investment viz.
Rs.13,223 crore was invested in petroleum and natural Gas sector
which covers 3.10 per cent of the top ten sectors attracting
investment in India. Rs.59,344 crore was the investment in Electrical
Equipments, Rs.47,877 crore was invested in table communication
sector. Rs.45,748 crore was invested in Housing and Real Estate
(Real Estate only for the NRI Investment), Rs.45,656 crore was
invested in construction activities, Rs.27,727 crore was invested in
power sector, Rs.22,138 crore was invested in Metallurgical
Industry, Rs.21,664 crore was invested in Automobile Industry and
Rs.16,236 crore was invested in chemical industry. It is noteworthy
to note that the highest attracting sector investment is in service
sector, this in because of the liberalization foreign policy of India in
1991 reform measures.
The following bar diagram (Fig.5) showing the top ten sectors
attracting highest FDI inflows into India for the years 1991-92 to
2009-2010.

Fig.5 Sectors Attracting Highest FDI inflow
0
20000
40000
60000
80000
100000
120000
140000In
Cro
res
Ser
vice
s S
ecto
r
Ele
ctri
cal
Equ
ipm
ents
Tel
ecom
mun
icat
ions
Hou
sing
and
Rea
lE
stat
e
Con
stru
ctio
nA
ctiv
itie
s
Pow
er
Met
allu
rgic
alIn
dust
ry
Aut
omob
ile
Indu
stry
Che
mic
al
Pet
role
um a
ndN
atur
al G
as
170

171 5.6. Foreign Direct Investment (Advance and Loans)
The following table 5.6 presents the Foreign Direct Investment
including advances and loans for the years 1991-92 to 2990-10.
Table 5.6
Foreign Direct Investments (Including Advances and Loan)
(Rs. in Crore)
S. No. 00Year00 Foreign Direct Investments AIIP
1. 1991-92 408 -
2. 1992-93 1,094 168.14
3. 1993-94 2,018 84.46
4. 1994-95 4,312 113.68
5. 1995-96 6,916 60.38
6. 1996-97 9,654 39.58
7. 1997-98 13,548 40.34
8. 1998-99 12,343 -8.89
9. 1999-2000 10,311 -16.46
10. 2000-01 12,645 22.64
11. 2001-02 19,361 53.11
12. 2002-03 14,932 -22.88
13. 2003-04 12,117 -18.85
14. 2004-05 17,138 41.44
15. 2005-06 24,584 43.45
16. 2006-07 56,390 129.38
17. 2007-08 98,642 74.93
18. 2008-09 123,025 24.72
19. 2009-10 123,120 0.08 Source: RBI Bulletin (for the relevant years except percentage) http://www.rbi.org.in. AIIP : Annual Incremental Increase in Percentage

172 The following are the deductions of the table 5.6. Foreign Direct
Investment includes advances and loans
The FDI includes advances and loan into India in absolute
amount has increased from Rs.408 crore to 123120 crore for the
years 1991-92 to 2009-10. It represents an increase of 302 times. The
overall growth rate in terms of percentage comes to 30076. The
annual average growth rate comes to 1504 per cent, which is not
realistic, since none of the years annual growth rate exceeds 168.17;
Hence the annual average growth rate is obtained in a different way
by adding the individual years annual growth rate and dividing it by
number of years, thus the figure obtained 43.65 per cent which is
realistic. It is important to note that the highest annual growth rate of
FDI inflows includes advances and loan viz. 168.14 per cent and
129.38 per cent was recorded in 1992-93 and 2006-07 respectively.
The following diagram (Fig.6) showing the Foreign Direct
Investment including advances and loans in India for the years 1991-
92 to 2009-2010.

Fig.6 Foreign Direct Investment (including Advances and Loans)
-50
0
50
100
150
20019
91-9
2
1992
-93
1993
-94
1994
-95
1995
-96
1996
-97
1997
-98
1998
-99
1999
-200
0
2000
-01
2001
-02
2002
-03
2003
-04
2004
-05
2005
-06
2006
-07
2007
-08
2008
-09
2009
-10
Year
Ann
ual I
ncre
men
tal i
ncre
ase
in p
erce
ntag
e
173

174 5.7. Monthly FDI Inflows
The following table presents the Monthly FDI inflows into
India in 2009-10.
Table 5.7
Monthly FDI inflows During the Financial year 2009-10
(Rs. in Crore)
S. No Month – Year Amount of FDI Percentage
1. April – 2009 11,706 9.49
2. May – 2009 10,168 8.24
3. June – 2009 12,335 9.99
4. July – 2009 17,045 13.82
5. August – 2009 15,796 12.80
6. September – 2009 7,326 5.94
7. October – 2009 10,895 8.83
8. November – 2009 8,081 6.55
9. December - 2009 7,185 5.82
10. January – 2010 9,386 7.61
11. February – 2010 7,955 6.45
12. March – 2010 5,497 4.46
Total 2009 – 10 123,377 100
Source: RBI Bulletin (for the relevant years except percentage) http://www.rbi.org.in.

175 The following are the deductions deducted from the table 5.7
Monthly FDI inflows into India during the last year of the study
period, 2009-10
The highest monthly FDI inflows into India viz. Rs.17,045
crore was recorded in July-2009 which covers 13.82 per cent of the
total FDI inflows into India in 2009-2010 and the lowest monthly
FDI inflows into India viz. Rs.5,497 crore which covers only 4.46
per cent of the total FDI inflows into India in 2009-2010 was
recorded in March-2010. There was a mixing trends of increasing
and decreasing of monthly FDI equity inflows into India from April
2009 to March 2010. The total FDI equity inflows into India from
April-2009 to March-2010 was Rs.1,23,377 crore which was the
sizable foreign investment in India.
The following bar diagram (Fig.7) showing the monthly FDI
inflows into India for the year 2009-2010.

Fig.7 Monthly FDI inflows during the financial year 2009-10
0
2000
4000
6000
8000
10000
12000
14000
16000
18000
In C
rore
s
Apr
-09
May
-09
Jun-
09
Jul-
09
Aug
-09
Sep
-09
Oct
-09
Nov
-09
Dec
-09
Jan-
10
Feb
-10
Mar
-10
176

177 5.8. Monthly FDI Inflows
The following table 5.8 presents the monthly FDI inflows into
India for the year April 2010 to March 2011.
Table 5.8
Month wise FDI Inflows for the year 2010-2011
(Rs. in crore)
S. No Finance Year FDI inflows Percentage
1. April – 2010 9,697 10.95
2. May – 2010 10,135 11.45
3. June – 2010 6,429 7.26
4. July – 2010 8,359 9.44
5. August – 2010 6,196 6.99
6. September – 2010 9,754 11.02
7. October – 2010 6,185 6.98
8. November – 2010 7,328 8.28
9. December - 2010 9,094 10.27
10. January – 2011 4,725 5.34
11. February – 2011 5,785 6.54
12. March – 2011 4,833 5.46
88,520 100.00
Source: RBI Bulletin (for the relevant years except percentage) http://www.rbi.org.in

178 The following are the deductions of the table 5.8, month wise
FDI inflows for the years April 2010 to March 2011
The highest FDI inflows into India in 2010-11 viz. Rs.10,135
crore was recorded in May 2010, the monthly average FDI inflows
comes to 11.45 per cent. The lowest FDI inflows into India in 2010-
11 viz. Rs.4.725 crore was recorded in January 2011. The monthly
average FDI inflow comes to 5.34 per cent. The FDI inflows into
India for the years 2010-2011 shows the mixing trends of increasing
and decreasing over the years. It is noteworthy to note that Four
month FDI inflow viz., May 2010. September-2010, April-2010 and
December-2010 is percentage are significant all other months FDI
inflows in the year shows only the single digit percentage to the total
FDI received in 2010-2011.
The following bar diagram (Fig.8) showing the month-wise
FDI inflows for the year April 2010 to March 2011.

Fig.8 Monthly FDI inflows
0
2
4
6
8
10
12In
per
cent
age
Apr
-10
May
-10
Jun-
10
Jul-
10
Aug
-10
Sep
-10
Oct
-10
Nov
-10
Dec
-10
Jan-
11
Feb
-11
Mar
-11
179

180
5.9. Foreign Technology Transfers – (Countrywise)
The following table presents the country wise Foreign
Technology Transfer Approvals in India for the years 1991-92 to
2009-2010.
Table 5.9
Foreign Technology Transfer Approvals
Rank Country No. of Technical Collaborations
approved
Percentage with Total Tech approval
(%)
1 U.S.A 1,841 22.71
2 Germany 1,116 13.77
3 Japan 880 10.86
4 U.K 876 10.81
5 Italy 489 6.03
6 Other countries 2,904 35.82
Total of all country 8,106 100.00
Source: RBI Bulletin (for the relevant years except percentage)

181 The following are the inferences of the table 5.9, the country-
wise foreign Technology transfer Approvals in India for the
years 1991 – 2009
United State of America (USA) has occupied a vital role with
22.71 percentage of the total with 1841 Technological collaborations
approvals with first rank followed by Germany with 13.77% of the
total with 1,116 technological collaborations approvals. Japan and
UK got 880 and 876 technological collaborations with 10.86 per cent
and 10.81 per cent respectively. Italy got 489 technological
collaborations with 6.03 per cent and the remaining countries got
2,904 technological collaborations with 35.82 per cent.
The following bar diagram (Fig.9) showing the foreign
technology transfer approvals of the countries in India.

182
Fig.9
Foreign Technology Transfer Approvals
U.S.A.
22.71
Germany
13.77
Japan
10.86U.K.
10.81
Italy
6.03
Other
countries
35.82

183
5.10. Foreign Technology Transfers (State-wise)
The following table 5.10 presents the state-wise Foreign
Technology Transfer Approvals in India for the years 1991-92 to
2009-2010.
Table 5.10
Foreign Technological Transfer Approvals (State-wise)
Rank State No. of Technical Collaborations
approved
Percentage with Total Tech approval
(%)
1 Maharashtra 1,397 17.23
2 Tamil Nadu 683 8.43
3 Gujarat 634 7,82
4 Karnataka 529 6.53
5 Haryana 369 4.55
6 Other state 4,494 55.44
Total 8,106 100.00
Source: RBI Bulletin (for the relevant years except percentage)

184 The following are the inferences of the table 5.10 state-wise
Foreign Technology Transfer Approvals in India for the years
1991-92 to 2009-2010
Maharashtra got the highest percentage of Foreign
Technological collaborations of 1,397 with 17.23 per cent followed
by Tamil Nadu viz., 683 Approvals with 8.43 per cent. Gujarat,
Karnataka and Haryana got 634, 529 and 369 approvals with 7.82
per cent, 6.53 per cent and 4.55 per cent respectively. The remaining
states got 4,494 approvals with 55.54 per cent. A total of 8,106
Technological collaborations received by various states in India for
the years 1991-92 to 2009-2010.
The following pie diagram (Fig.10) showing state-wise
foreign technology transfer approvals in India for the years 1991-92
to 2009-2010.

185
Fig.10
Foreign Technology Transfer Approvals (State-wise)
Maharashtra
17.23
Tamil Nadu
8.43
Gujarat
7.82
Karnataka
6.53
Haryana
4.55
er state
55.44

186
5.11. Foreign Technological Transfers (Sector-wise)
The following table presents the sector-wise Foreign
Technological Transfer approvals in India for the year 1991-92 to
2009-2010.
Table 5.11
Foreign Technological Transfer Approvals (Sectors-wise)
Rank Sector No. of Technical Collaborations
approved
Percentage with Total
Tech approval (%)
1 Electrical Equipments (Including computer software electronics)
1,263 15.58
2 Chemicals (other than fertilizer)
905 11.16
3. Industrial Machinery 872 10.76
4 Transportation Industry 760 9.38
5 Miscellaneous Mechanical Engineering Industry
444 5.48
6 Other sectors 3,862 47.64
Total of all sectors 8,106 100.00
Source: RBI Bulletin (for the relevant years except percentage) http://www.rbi.org.in.

187 The following are the inferences of the table 5.11 sector-wise
Foreign Technology Transfer approval in India for the years
1991-92 to 2009-2010
The Electrical Equipments sector including computer software
electronics got 1,263 approvals with 15.58 per cent. Chemical other
than Fertilizer and Industrial Machinery got 905 and 872 approvals
with 11.16 per cent and 10.76 per cent respectively. The
Transportation Industry and Misc, Mach Engineering Industry got
760 and 444 approvals with 9.38 per cent and 5.48 per cent
respectively. The remaining sectors got 3,862 approvals with 47.64
per cent. A total of 8,106 Foreign Technological Collaboration
received in various sectors in India for the years 1991-92 to 2009-
2010.
Hypothesis 3: Foreign Technology Transfers shows the green signal
to the growth and development of the economy is proved.
The following pie diagram (Fig.11) showing the sector-wise
foreign technological transfer approvals in India for the years 1991-
92 to 2009-2010.

188
Fig.11
Foreign Technological Transfer Approvals (Sector-wise)
1
15.58
2
11.16
3
10.76
4
9.385
5.48
6
47.64
1. Electrical Equipments (including computer software electronics) 2. Chemicals (other than fertilizer) 3. Industrial machinery 4. Transportation industry 5. Miscellaneous mechanical engineering industry 6. Other sectors

Chapter VI
DATA ANALYSIS – CONTINUATION
Here the data analysis has been done on the following lines,
falling under thirteen sections.
1. Revised FDI Inflows
2. Foreigner’s Foreign Direct Investment
3. NRI’s Foreign Direct Investment
4. RBI’s regional offices-wise FDI inflows
5. Foreign Investment in Insurance Companies in India
6. Distribution of FDI by Region for the years 1980-2005
7. Summary of UNCTAD Survey result
8. Distribution of FDI inflows among economics by range
2010 – Asia.
9. Top 15 countries FDI by factors favouring investment,
2009-2011
10. FDI inflows of select Asian countries
11. FDI inflows into Asia
12. Distribution of FDI inflows into Developing countries
13. Global distribution of FDI inflows

190 6.1. The following table presents the revised FDI inflows into India
for the years 1991-92 to 2010-2011.
Table 6.1
Revised FDI Inflows (Equity + additional components of FDI)
S. No.
Year Equity Re-
invested earning
Other capital
Total FDI inflows
AIIP
1. 1991-92 129 NA NA 129 - 2. 1992-93 315 NA NA 315 144.193. 1993-94 586 NA NA 586 86.03 4. 1994-95 1,314 NA NA 1,314 124.235. 1995-96 2,144 NA NA 2,144 63.17 6. 1996-97 2,821 NA NA 2,821 31.58 7. 1997-98 3,557 NA NA 3,557 26.09 8. 1998-99 2,462 NA NA 2,462 -30.789. 1999-00 2,155 NA NA 2,155 -12.4710. 2000-01 2,400 1,350 279 4,029 86.96 11. 2001-02 4,095 1,645 390 6,130 52.15 12. 2002-03 2,764 1,833 438 5,035 -17.8613. 2003-04 2,229 1,460 633 4,322 -14.1614. 2004-05 3,778 1,904 369 6,051 40.00 15. 2005-06 5,975 2,760 226 8,961 48.09 16 2006-07 16,481 5,828 517 22,826 154.7317. 2007-08 26,864 7,679 292 34,835 52.61 18. 2008-09 28,031 9,030 777 37,838 8.62 19. 2009-10 27,149 8,669 1945 37,763 -0.19 20. 2010-11 20,087 6,703 234 27,024 -28.44
Source: RBI Bulletin (for the relevant years except percentage) http://www.rbi.org.in. AIIP : Annual Incremental Increase in Percentage

191 The following are the deductions deducted from table 6.1.
The revised FDI inflows into India including equity and
additional components in absolute amount has increased from 129
US $ million to 27,024 US $ million for the years 1991-92 to 2010-
11. It represents an increase of 209 times. The incremental increase
in percentage shows the mixing trends of increasing and decreasing
over the study period. The maximum annual average growth rate
viz.154.73% was recorded in the year 2006-07, and the minimum
annual average growth rate viz.8.62% was recorded in the year 2008-
09. In some years the annual average growth rate shows the negative
trends.
The equity components of the revised FDI inflows in absolute
term has increased from 129 US $ million to 20,087 US $ million for
the years 1991-92 to 2010-11. It represents an increase of 155.71
times. The overall growth rate of equity components of FDI inflow
in terms of percentage comes to 15471.32. The annual average
growth rate comes to 773.57%. The re-investment components of
FDI inflow in absolute amount has increased from 1350 US $
million in 2000-01 to 6,703 US $ million in 2010-11. It represents an
increase of 4.97 times. The overall growth rate in terms of
percentage comes to 396.52 and the annual average growth rate
comes to 36.05%.
The following diagram (Fig.12) showing the revised FDI
inflows into India for the years 1991-92 to 2010-2011.

Fig.12 Revised FDI Inflows
-50
0
50
100
150
20019
91-9
2
1992
-93
1993
-94
1994
-95
1995
-96
1996
-97
1997
-98
1998
-99
1999
-200
0
2000
-01
2001
-02
2002
-03
2003
-04
2004
-05
2005
-06
2006
-07
2007
-08
2008
-09
2009
-10
2010
-11
Year
Ann
ual I
ncre
men
tal i
ncre
ase
in p
erce
ntag
e
192

193 6.2. The following table 6.2 presents the Foreigner’s Foreign Direct
Investment inflows into India excludes of NRI investment.
Table 6.2
Foreigner’s Foreign Direct Investment (US $ million)
S. No. Year Foreigner Investment AIIP
1. 1991-92 66 -
2. 1992-93 264 300.00
3. 1993-94 369 39.77
4. 1994-95 872 136.31
5. 1995-96 1,429 63.88
6. 1996-97 2,057 43.95
7. 1997-98 2,956 43.70
8. 1998-99 2,000 -2.77
9. 1999-00 1,581 -20.95
10. 2000-01 3,600 127.70
11. 2001-02 5,214 44.83
12. 2002-03 4,119 -21.00
13. 2003-04 53,587 -12.92
14. 2004-05 5,121 42.77
15. 2005-06 6,728 31.38
16. 2006-07 14,928 121.88
17. 2007-08 17,708 18.62
18. 2008-09 17,182 -2.97
19. 2009-10 15,177 -11.67
Source: RBI Bulletin (for the relevant years except percentage) http://www.rbi.org.in. AIIP : Annual Incremental Increase in Percentage

194 The revival FDI inflows of Foreigner’s Foreign Investment
into India excludes of NRI investment in absolute amount has
increased from 66 US $ million to 15,177 US $ million for the years
1991-92 to 2009-10. It represents an increase of 230 times. The
incremental increase in percentage shows the mixing trends of
increasing and decreasing over the study period. The maximum
annual average growth rate viz., 300 per cent was recorded in the
year 1992-93 and the minimum annual average growth rate viz.,
18.62 per cent was recorded in the year 2007-08. In some years the
annual average growth rate shows the negative trends.
Te following diagram (Fig.13) showing the foreigner Direct
Investment into India for the years 1991-92 to 2009-2010.

Fig.13 Foreigner’s Foreign Direct Investment
-50
0
50
100
150
200
250
300
350
1991
-92
1992
-93
1993
-94
1994
-95
1995
-96
1996
-97
1997
-98
1998
-99
1999
-200
0
2000
-01
2001
-02
2002
-03
2003
-04
2004
-05
2005
-06
2006
-07
2007
-08
2008
-09
2009
-10
Year
Ann
ual I
ncre
men
tal i
ncre
ase
in p
erce
ntag
e
195

196 6.3. The following table 6.3 presents the NRI’s Foreign Direct
Investments in India for the year 1990-91 – 2009-10.
Table 6.3
Foreign Direct Investment
(US $ million)
S. No. Year NRI Investment AIIP
1. 1991-92 63 -
2. 1992-93 51 -19.05
3. 1993-94 217 325.49
4. 1994-95 442 103.29
5. 1995-96 715 61.7
6. 1996-97 364 -29.09
7. 1997-98 601 65.11
8. 1998-99 462 -23.13
9. 1999-00 574 24.24
10. 2000-01 429 -25.26
11. 2001-02 916 113.52
12. 2002-03 916 00.00
13. 2003-04 735 -19.76
14. 2004-05 930 26.53
15. 2005-06 2,233 140.11
16. 2006-07 7,151 220.24
17. 2007-08 17,127 139.50
18. 2008-09 17,998 5.09
19. 2009-10 18,990 5.51
Source: RBI Bulletin (for the relevant years except percentage) http://www.rbi.org.in. AIIP : Annual Incremental Increase in Percentage
197 The revival FDI inflows of NRIs investment into India in
absolute amount has increased from 63 US $ million to 18,990 US $
million for the year 1991-92 to 2009-10. It represent an increase of
301 times. The incremental increase in percentage shows the mixing
trends of increasing and decreasing over the study period. The
maximum annual average growth rate viz., 325.49% was recorded in
the year 1993-94 and minimum annual average growth rate viz., 0%
was recorded in the year 2002-03. In some years the annual average
growth rate shows the negative trends.
The following diagram (Fig.14) showing the NRI’s investment
on FDI into India for the years 1991-92 to 2009-2010.

Fig.14 Foreign Direct Investment
-50
0
50
100
150
200
250
300
35019
91-9
2
1992
-93
1993
-94
1994
-95
1995
-96
1996
-97
1997
-98
1998
-99
1999
-200
0
2000
-01
2001
-02
2002
-03
2003
-04
2004
-05
2005
-06
2006
-07
2007
-08
2008
-09
2009
-10
Year
Ann
ual I
ncre
men
tal i
ncre
ase
in p
erce
ntag
e198

199 6.3a. Correlation Analysis
The following table 6.3a presents the correlation, co-efficient
of determination, standard error and probable error between
Foreigner’s Foreign Investment and Non-Residential Indian’s
(NRIs).
Table 6.3a
Correlation Analysis
Correlation between Foreigner’s Direct Investment and NRIs Foreign Direct investment (r)
0.3853
Co-efficient of determination (r2) 0.1484
Standard Error 0.1953
Probable Error 0.1318
The above table reveals that the value of correlation
(r = 0.3853) between Foreign Investment of Foreigners and NRI’s is
very low. It has also confirmed by another statistical tools such as
coefficient of determination (r2 = 0.1484), Standard Error
(SE = 0.1953) and Probable Error (PE = 0.1318), all these values are
less than the value of correlation; the low positive relationship
between the said two variable is confirmed.
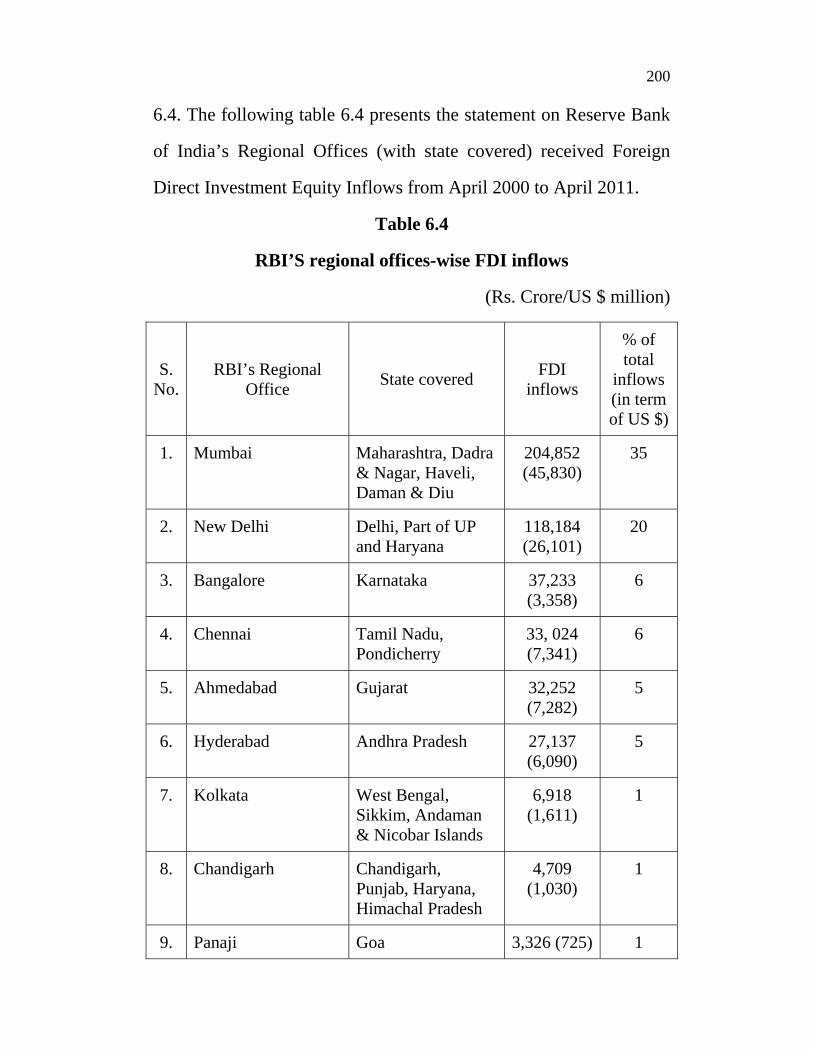
200 6.4. The following table 6.4 presents the statement on Reserve Bank
of India’s Regional Offices (with state covered) received Foreign
Direct Investment Equity Inflows from April 2000 to April 2011.
Table 6.4
RBI’S regional offices-wise FDI inflows
(Rs. Crore/US $ million)
S. No.
RBI’s Regional Office
State covered FDI
inflows
% of total
inflows (in term of US $)
1. Mumbai Maharashtra, Dadra & Nagar, Haveli, Daman & Diu
204,852 (45,830)
35
2. New Delhi Delhi, Part of UP and Haryana
118,184 (26,101)
20
3. Bangalore Karnataka 37,233 (3,358)
6
4. Chennai Tamil Nadu, Pondicherry
33, 024 (7,341)
6
5. Ahmedabad Gujarat 32,252 (7,282)
5
6. Hyderabad Andhra Pradesh 27,137 (6,090)
5
7. Kolkata West Bengal, Sikkim, Andaman & Nicobar Islands
6,918 (1,611)
1
8. Chandigarh Chandigarh, Punjab, Haryana, Himachal Pradesh
4,709 (1,030)
1
9. Panaji Goa 3,326 (725) 1

201
S. No.
RBI’s Regional Office
State covered FDI
inflows
% of total
inflows (in term of US $)
10. Bhopal Madhya Pradesh, Chattisgarh
3,011 (654) 0.5
11. Jaipur Rajasthan 2,453 (521) 0.4
12. Kochi Kerala, Lakshadweep
1,926 (428) 0.3
13. Bhubaneshwar Orissa 1,297 (281) 0.2
14. Kanpur Uttar Pradesh, Uttranchal
1,059 (233) 0.2
15. Guwahati Assam, Arunachal Pradesh, Manipur, Meghalaya, Mizoram, Nagaland, Tripura
316 (72) 0.1
16. Patna Bihar, Jharkhand 27 (6) 0
17. Region not indicated 116,844 (26,273)
20
Total 594,569 (132,837)
100
Source: RBI Bulletin (for the relevant years except percentage) http://www.rbi.org.in.
202 The following are the deductions of the table 6.4, RBI’s
regional office-wise (with state covered) FDI inflows.
The total region-wise FDI inflows into India was recorded
viz., Rs.5,94,569 crore for the years 2000 to 2011. In terms of
American dollar it comes to 1,32,837 US $ million. The RBI’s
Regional Offices with state covered is given in the table 5.4. Among
the various RBI’s Regional Offices, the highest FDI inflows Viz.
Rs.204,852 crore was recorded in Mumbai Regional Offices with a
coverage of 35% of the total FDI inflows of all region. New Delhi
Regional office placed second with FDI inflows of Rs.37,233 crore
with 20% of the FDI inflow of all regions. The lowest FDI inflow of
Rs.27 crore was received in Patna Regional Office which covered
the states Bihar and Jharkhand. Mumbai Regional office which
covered the states, Maharashtra, Dadra, Nagar Haveli, Daman and
Diu and New Delhi Regional office, which covered the states, Delhi
part of UP and Haryana in Mumbai and New Delhi Regional offices
covered 55% of the FDI inflows among all the regional offices and
states, while all other regional offices FDI inflow coverage is only
single digit percentage to the total inflows of all regions. It is
noteworthy to note that seven states in Mumbai and Delhi Regional
office recorded the major FDI inflow of 55 per cent.

203 6.5. FDI IN INSURANCE COMPANIES IN INDIA
Foreign Insurance Companies were also allowed to run
business in collaboration with an Indian insurer, which witnessed a
number of Joint Venture Insurance companies in India. The Foreign
Direct Investment limit only to the extent of 26 per cent of the equity
share capital in any insurance company. There were only two Indian
Private Life Insurance Companies without the involvement of
Foreign Insurers i.e. Reliance Life (formerly, AMP Sanmer) and
Sahara India Life Insurance Company limited as for as non life
insurer is concerned, Reliance General Insurance Company Limited
is the only non life private insurer without the participation of
Foreign promoters. Thus, liberalization brought Foreign Direct
Investment to the tune of 3314.89 crores which is nearly 20.32 per
cent share in the total equity capital of Insurance sector in life
insurance sector alone 22.95 per cent of capital i.e. 1809.75 crores
were pumped in the form of FDI.
The non-life insurance sector alone covers 18.69 per cent of
capital in Rs.337.24 crores were pumped in the form of Foreign
Direct Investment. In health insurance sector Rs.53.64 crores were
invested by the Foreign Promoters. The LIC continues with the
equity share capital of 5 crores entirely subscribed by the
Government of India. Though a sum of 100 crores is the minimum
amount of share capital that an insurance company should possess, it

204 cannot be raised to a higher limit unless the LIC Act is amended.
Though the public sector companies do not bring any amount in the
form of FDI, their role in the nation building is very much
appreciable and needed; Hence an attempt is made to analysis the
role of FDI in Insurance companies in India.
Table 6.5
Foreign Investment in Insurance Companies in India
S. No.
INSURERS Indian Foreign Total FDI
Percentage
1. AVIVA Indian Insuracne Co. Pvt.Ltd.
743.33 261.17 1004.5 26.00
2. Bajaj Allianz Life Insurance Co. Ltd.
111.53 39.18 150.71 26.00
3. Bharati AXA Life Insurance Co. Ltd.
284.75 81.38 366.11 22..22
4. Birla Sun Life Insurance Co. Ltd.
943.13 331.37 1274.5 26.00
5. Future Generali 137.82 47.18 185 25.50
6. HDFC Standard Life Insurance Co. Ltd.
940.54 330.46 1271 26.00
7. ICICI-Prudential Life Insurance Ltd.
1037.48 363.63 1401.11 25.50
8. IDBI Fortis 148 52 200 26.00
9. ING Vysya Life Insurance Ltd.
584.6 205.4 790 26.00
10. Kotak Mahindra Life Insuracne Ltd.
355.40 124.87 480.27 26.00
11. Max New York Life Insurance Ltd.
764 268.43 1032.43 26.00
12. Met Life Indian Insurance Co. Ltd.
563.2 197.88 761.08 26.00

205
S. No.
INSURERS Indian Foreign Total FDI
Percentage
13. SBI Life Insurance Co. Ltd.
740 260 1000 26.00
14. Shriram Life Insurance Co. Ltd.
92.5 32.5 125 26.00
15. TATA-AIG Life Insurance Co. Ltd.
643.8 226.2 870 26.00
Total (life) 8922.58 2821.63 11744.21
24.03
1. Bajaj Alli Gen. Insurance Co.
81.57 28.66 110.23 26.00
2. Cholamandalam General Insurance Co.
105.05 36.91 141.96 26.00
3. Future Generali Insurance
111.75 38.25 150 25.50
4. HDFC General Insurance
111 39 150 26.00
5. ICICI Lombard General Insurance Co.
279.47 97.89 377.36 25.94
6. IFFCO-TOKIO General Insurance Co.
162.8 57.2 220 26.00
7. Royal Sundram Alliance Insurance Ltd.
125.8 44.2 170 26.00
8. TATA-AIG Life Insurance Co. Ltd.
166.5 58.5 225 26.00
9. Universal Sompo Insurance Ltd.
111 39 150 26.00
Total (non-life) 1254.94 439.61 1694.55 25.94
Total (life + non-life) 10177.52 3261.24 13438.76 24.27
Source: IRDA Annual Report 2007-08.

206 The following are the deductions of the table 6.5 Foreign
Investment in Insurance Companies in India for the year 2007-2008.
It can be observed from the table that the maximum
permissible limit of 26 per cent Foreign Direct Investment was
received by most of the Indian Insurance Companies in the year
2007-2008 both in life insurance and non-life insurance companies.
Out of the total investment in Indian Life Insurance Companies of
Rs.11,744.21 crore, Rs.2821.63 was Foreign Direct Investment
which covers 24.03 per cent of the total investment in Life Insurance
Companies of India. The total of Indian Investment in Life Insurance
by Fifteen companies was Rs.8922.58 crores which covers 75.97 per
cent of the total investment.
The total investment of Nine Non-life Indian Insurance
Companies was Rs.1694.55 crore out of which Rs.439.61 crore was
was Foreign Direct Investment which covers 25.95 per cent of the
total investment in Indian Non-life Insurance Companies. The
highest Foreign Direct investment viz. Rs.363.63 crore was received
by ICICI presidential Life Insurance Company Ltd. while the lowest
Foreign Investment viz. Rs.32.5 crore was received by Shriram Life
Insurance Company in India. Among the Nine Non-life Insurance
Companies in India, the highest Foreign Investment viz. Rs.97.89
crore was received by ICICI. Lombared General Insurance Company
while the lowest Foreign Investment viz. Rs.28.66 crore was

207 received by Bajaj Alli General Insurance Company in India. The
total insurance companies investment (both life and non-life
insurance) was 13,438.76 crores, out of which Rs.439.61 crore was
Foreigner Investment, which covers 24.27 per cent of the total
Investment in India Insurance Companies.

208 6.6. The following table presents the region-wise distribution of FDI
in the world
Table 6.6
Distribution of FDI by Region for the years 1980-2005
(Percentage)
S. No.
Year Developed countries
Developing countries
World (Total)
1. 1980 75.6 24.4 100
2. 1990 79.3 20.7 100
3. 2000 68.5 30.3 100
4. 2005 72.8 27.2 100
Source: UNCTAD, FDI/TNC database http/www.unctad.org/fdi.statistics.
The follow are the deduction of the table 6.6. Regionwise
distribution of FDI in the world is given in percentage. Developed
countries received 75.6 per cent of the FDI inflows and developing
countries received 24.4 per cent of the FDI in 1980. In 1990 it was
recorded as 79.3 per cent in developed countries and 20.7 per cent in
developing countries. In 2000, it was recorded as 68.5 per cent in
developed countries and 30.3 per cent in developing countries. In
2005, was recorded as 72.8 per cent in developed countries and 27.2

209 per cent in developing countries. It is noteworthy to note the
developed countries received the highest percentage of FDI from the
year 1980 to 2005.
The following pie diagram (Fig.15) showing the decadal
distribution of FDI by region.

210
Fig.15
Decadal Distribution of FDI by Region
1980
Developed
countries
75.6
Developing
countries
24.4
Developed
countries
79.3
Developing
countries
20.7
2000
Developed
countries
68.5
Developing
countries
30.3

211 6.7. The following are the survey report of UNCTAD on summary of
survey result (concluded) per cent of responses for the years 2009-
2011
Table 6.7
Summary of survey result (concluded)
(Per cent of responses to UNCTAD survey)
Country Top six destinations for FDI in
2009-2011
China 56
United States of America 47
India 34
Brazil 25
Russian Federation 21
United Kingdom 18
Source: UNCTAD Survey.
It can be observed from the above table that among the top six
destinations for FDI in 2009-11, China placed first with 56 per cent
of responses followed by United States of America with 47 per cent
responses, India with 34 per cent responses, Brazil with 25 per cent
responses, Russian Federation with 21 per cent responses and United
Kingdom with 18 per cent responses.

212 6.8. The following table 6.8 presents the distribution of FDI inflows
among economies by range, 2010 – Asia
Table 6.8
Distribution of FDI inflows among economics by range,
2010 – Asia
Range Countries
Above $ 50 billion China, Hong Kong (China)
$ 10 to 49 billion Singapore, India and Indonesia
$1.0 to $ 9.9 billion Malaysia, Vietnam, Korea, Thailand,
Islamic Republic of Iran, Macao (China),
Taiwan Province of China, Pakistan,
Philippines and Mangolia.
Below $ 0.1 billion Afghanistan, Nepal, Democratic People’s
Republic of Korea and Bhutan.
Source: UNCTAD Survey, World Investment Report.
The followings are the observation of the table 6.8 distribution
of FDI inflows among economies by range 2010 in Asia.
The range of FDI inflows of China, Hong Kong (China) was
above $50 billion. The range of FDI inflows Singapore, India and
Indonesia was $10 to $49 billion. The range of FDI inflows of
Malaysia, Vietnam, Korea, Thailand, Islamic, Republic of Iran,
Macao (China), Taiwan Province of China, Pakistan, Philippines and
Mangolia was $1.0 to $ 9.9 billion, and the last but not least range of
FDI inflows viz., below $0.1 billion was received by Afghanistan,
Nepal, Democratic People’s Republic of Korea and Bhutan.

6.9. The following table presents the factors favouring investment for top 15 countries for the years 2009-2011
(Per cent of all responses).
Table 6.9
Top 15 countries FDI, by factors favouring investment, 2009-2011 (Per cent of all responses for a given country)
Presence of
suppliers and
partners
Follow your competitors
Availability of skilled labour and
talents
Cheap labour
Size of local
market
Access to International/
regional markets
Growth of
market
Access to natural
resources
Access to
capital market
(finance)
Government effectiveness Incentives Quality of
infrastructure
Stable and business-friends/
environment
China 10 6 7 11 19 9 21 2 2 3 3 3 4 United States
11 5 10 1 17 8 9 3 7 7 1 9 13
India 11 5 11 13 19 9 24 1 1 1 1 1 3 Brazil 10 3 6 9 20 10 19 3 2 2 4 3 8 Russian Federation
11 7 1 2 31 9 31 3 - - 3 1 1
United Kingdom
9 4 12 - 17 10 9 2 7 6 - 11 14
Germany 12 5 13 - 21 11 7 1 3 5 1 12 11 Australia 9 3 4 1 14 8 9 12 4 9 3 11 12 Indonesia 10 5 7 13 16 10 20 15 - 2 - - 3 Canada 10 3 9 - 19 6 12 4 6 7 1 9 14 Vietnam 10 6 6 16 14 6 22 2 2 4 4 2 8 Mexico 9 2 12 9 19 16 16 5 - - 2 2 7 Poland 8 5 5 5 24 11 26 5 - 3 3 3 3 France 13 4 11 - 18 9 11 2 - 4 2 13 11 Thailand 10 - 10 10 8 12 20 2 4 - 6 10 8
World Average
10 5 8 6 17 10 16 4 3 5 2 6 9
Source: UNCTAD Survey. 213

214 The following are the observations of the table 6.9, top 15
countries for FDI, by factors favouring investment, for the year
2009-2011. India placed II in FDI inflows and placed III in FDI
outflow. Thirteen factors (Presence of suppliers and partners, Follow
your competitors, Availability of skilled labour and talents, Cheap
labour, Size of local market, Access to International/ regional
markets, Growth of market, Access to natural resources, Access to
capital market (finance), Government effectiveness, Incentives,
Quality of infrastructure, Stable and business-friends/ environment)
which determined Foreign Investment both inflow and outflow have
been analysed. As far as India is concerned five factors namely
(Presence of suppliers, Availability of skilled labour and talents,
Cheap labour, Size of local market, Growth of market) and favouring
investment in India and having more than world average level. Other
eighth factors favouring investment in India but having less than or
equal to world average level. It is noteworthy to note that India has
played a vital role in size of local market and growth of market in the
global economy.

215 6.10. The following table presents the FDI inflows of select Asian
countries for the years 1991-92 to 2009-2010
Table 6.10
FDI inflows of select Asian countries (US $ million)
Years India China Korea Asian
countries (Total)
1991-92 129 4366 1130 25,769
1992-93 315 11,008 563 36,247
1993-94 586 27,515 539 57,692
1994-95 1,314 33,767 788 69,979
1995-96 2,144 37,521 1,250 82,491
1996-97 2,821 41,726 2,012 96,663
1997-98 3,557 45,257 2,640 1,09,155
1998-99 2,462 45,463 5,040 99,650
1999-00 2,155 40,319 8,591 1,27,440
2000-01 4,029 40,715 3,692 1,59,125
2001-02 6,130 46,878 2,975 1,18,545
2002-03 5,035 52,743 3,785 1,03,018
2003-04 4,322 53,505 7,687 1,11,482
2004-05 6,051 60,630 2,668 1,56,980
2005-06 8,961 72,406 6,600 1,74,000
2006-07 22,826 69,468 6,462 2,15,000
2007-08 34,855 1,08,312 6,761 3,31,400
2008-09 35,180 1,03,000 NA 3,37,800
2009-10 37,182 1,11,000 NA 2,41,500 Source: UNCTAD Survey.
The following are the deductions of the table 6.10 FDI inflows
of select Asian countries.

216 The FDI inflows in absolute amount has increased from 129
US $ million to 37,182 US $ million for the years 1991-92 to 2009-
10, it represents an increase of 288 times. The overall growth rate in
terms of percentage comes to 28723.25. The annual average growth
rate comes to 1511.75 per cent.
The FDI inflows into China in absolute amount has increased
from 4366 US $ million to 1,11,000 US $ million for the years 1991-
92 to 2009-10. It represents an increase of 25.42 times. The overall
growth rate in terms of percentage comes to 2442.37. The annual
average growth rate comes to 128.55%.
The FDI inflow into Korea in absolute amount has increased
from 1130 US $ million to 6761 US $ million for the year 1991-92
to 2007-08. It represents an increase of 5.98 times. The overall
growth rate in terms of percentage comes to 498.32. The annual
average growth rate comes to 27.67 per cent.
The FDI inflows into Asian countries in absolute amount has
increased from 25,769 US $ million to 241500 US $ million for the
years 1991-92 to 2009-10. It represents an increase of 93.72 times.
The overall growth rate in terms of percentage 837.17. The annual
average growth rate comes to 44.06 per cent.
Hypothesis 2: FDI openness of select Asian countries show the
positive trend is proved.

217 6.11. The following table presents the FDI inflows into Asia for the
years 1991-92 to 2010-2011
Table 6.11
FDI inflows into Asia
(US $ million)
Year Asian FDI inflows AIIP 1991-92 25,769 - 1992-93 36,247 40.66 1993-94 57,692 59.16 1994-95 69,979 21.30 1995-96 82,491 17.88 1996-97 96,663 17.18 1997-98 1,09,155 12.92 1998-99 99,650 -8.71 1999-00 1,27,440 27.89 2000-01 1,59,125 24.86 2001-02 1,18,454 -25.56 2002-03 1,03,018 -13.03 2003-04 1,11,482 8.22 2004-05 1,56,980 40.81 2005-06 1,74,000 10.84 2006-07 2,15,000 23.56 2007-08 3,31,400 54.14 2008-09 3,37,800 1.93 2009-10 2,41,500 -28.51 2010-11 2,99,700 24.10
Source: RBI Bulletin (for the relevant years except percentage) http://www.rbi.org.in. AIIP : Annual Incremental Increase in Percentage
The following are the deduction of the table 6.11 FDI inflows
in Asian countries.

218 The FDI inflows into Asian countries in absolute amount has
increased from 25,769 US $ million to 2,41,500 US $ million for the
year 1991-92 to 2009-10. It represents an increase of 93.72 times.
The overall growth rate in terms of percentage comes to 837.17, the
annual average growth rate comes to 44.06 per cent.
The following diagram (Fig.16) showing the FDI inflows into
Asian countries for the years 1991-92 to 2010-2011.

Fig.16 FDI Inflows into Asia
-40
-30
-20
-10
0
10
20
30
40
50
60
7019
91-9
2
1992
-93
1993
-94
1994
-95
1995
-96
1996
-97
1997
-98
1998
-99
1999
-200
0
2000
-01
2001
-02
2002
-03
2003
-04
2004
-05
2005
-06
2006
-07
2007
-08
2008
-09
2009
-10
Year
Ann
ual I
ncre
men
tal i
ncre
ase
in p
erce
ntag
e
219

220 6.12. The following table 6.12 presents the distribution of FDI
inflows into Developing countries for the years 1991-92 to 2009-
2010.
Table 6.12
Distribution of FDI inflows into Developing countries
(US $ million)
Year India Argentina Brazil Mexico China Korea Developing countries
1991-92 129 2,439 1,102 4761 4,366 1,130 43,951
1992-93 315 4,431 2,061 4,393 11,008 563 54,872
1993-94 586 2,791 1,291 4,389 27,515 539 80,420
1994-95 1,314 3,635 2,150 10.973 33,767 788 1,05,141
1995-96 2,144 5,609 4,405 9,526 37,521 1,250 1,17,544
1996-97 2,821 6,949 10,792 9,185 41,726 2,012 1,51,746
1997-98 3,557 9,160 18,993 12,830 45,257 2,640 1,91,764
1998-99 2,462 7,291 28,856 12,360 45,463 5,040 1,86,626
1999-00 2,155 1,418 32,779 16,781 40,319 8,591 2,32,507
2000-01 4,029 2,166 22,457 27,635 40,715 3,692 2,53,179
2001-02 6,130 2,149 16,590 15,129 46,878 2,975 2,17,845
2002-03 5,035 1,887 10,144 11,373 52,743 3,785 1,55,528
2003-04 4,322 4,254 18,166 16,602 53,505 7,687 1,75,138
2004-05 6,051 7,000 14,000 16,500 60,630 2,668 2,83,030
2005-06 8,961 1,500 27,000 19,700 72,406 6,600 3,14,316
2006-07 22,826 1,570 25,000 20,420 69,468 6,462 3,79,070
2007-08 34,835 NA NA NA 1,08,312 6,761 5,12,200
2008-09 35,180 NA NA NA 1,03,000 NA 5,49,100
2009-10 37,182 NA NA NA 1,11,000 NA NA
Source: UNCTAD, Survey Report.

221 The following are the deductions of the table 6.12, distribution
of FDI inflows in developing countries.
The FDI inflows into India in absolute amount has increased
from 129 US $ million to 37,182 US $ million for the year 1991-92
to 2009-10. It represents an increase of 288 times. The overall
growth rate in terms of percentage comes to 28723.25. The annual
average growth rate is 1511.75 per cent.
The FDI inflows into Argentina in absolute amount has
increased from 2439 US $ million to 1570 US $ million for the year
1991-92 to 2006-07. It represents an increase of 5.37 times. The
overall growth rate in terms of percentage comes to 5.37. The annual
average growth rate comes to 0.34 per cent.
The FDI inflows into Brazil in absolute amount has increased
from 1102 US $ million to 25,000 US $ million for the year 1991-92
to 2006-07. It represents an increase of 22.68 times. The overall
growth rate in terms of percentage comes to 2168.6. The annual
average growth rate comes to 135.54 per cent.
The FDI inflows into Mexico in absolute amount has
increased from 4,761 US $ million to 20,420 US $ million for the
years 1991-92 to 2006-07. It represents an increase of 4.28 times.

222 The overall growth rate in terms of percentage comes to 328.9. The
annual average growth rate comes to 20.56 per cent.
The FDI inflows into China in absolute amount has increased
from 4366 US $ million to 1,11,000 US $ million for the years 1991-
92 to 2009-10. It represents an increase of 25.42 times. The overall
growth rate in terms of percentage comes to 2442.37. The annual
average growth rate is 128.55 per cent.
The FDI inflows into Korea in absolute amount has increased
from 1130 US $ million to 6761 US $ million for the year 1991-92
to 2007-08. It represents an increase of 5.98 times. The overall
growth rate in terms of percentage comes to 498.32. The annual
average growth rate is 27.67 per cent.
The FDI inflows into developing countries in absolute amount
has increased from 43,951 US $ million to 5,49,100 US $ million for
the year 1991-92 to 2008-09. It represents an increase 12.49 times.
The overall growth rate in terms of percentage comes to 1147. The
annual average rate comes to 63.73 per cent.

223 6.13. The following table presents the global distribution of FDI
inflows for the years 1991-92 to 2008-2009.
Table 6.13
Global Distribution of Global FDI inflows
(US $ million)
Year Developed countries
Developing countries
FDI inflows in SEE
AND CIS
World (Total)
1991-92 117092 43951 235 161278
1992-93 112583 54872 1783 119238
1993-94 144004 80420 3270 227694
1994-95 151828 105141 2500 259469
1995-96 218738 117544 4804 341086
1996-97 234868 151746 6308 392922
1997-98 284013 191764 12101 487878
1998-99 503851 186626 10647 701124
1999-00 849052 232507 10493 1092052
2000-01 1134293 253179 9067 1396539
2001-02 596305 217845 11775 825925
2002-03 54778 155528 12822 716128
2003-04 371887 175138 10844 557869
2004-05 439121 283030 19992 742143
2005-06 593536 314316 37943 945795
2006-07 871219 379070 55563 1305852
2007-08 1341800 512200 86900 1940900
2008-09 1001800 549100 107600 1658500 Source: UNCTAD, Survey Report. www.unctad.org.in SEE – South East Europe, CIS – Commonwealth of Independent States.

224 The followings are the deduction of the table 6.13, distribution
of Global FDI inflows.
The FDI inflows into developed countries in absolute amount
has increased from 117092 US $ million to 1001800 US $ million
for the years 1991-92 to 2008-2009. It represents an increase of 8.56
times. The overall growth rate in terms of percentage comes to
755.57. The annual average growth rate comes to 41.98 per cent.
The FDI inflows into developing countries in absolute amount
has increased from 43951 US $ million to 549100 US $ million for
the years 1991-92 to 2008-09. It represents an increase of 12.49
times. The overall growth rate in terms of percentage comes to
1149.35. The annual average growth rate comes to 63.85 per cent.
The FDI inflows into South East Europe and Commonwealth
of Independent states in absolute amount has increased from 235 US
$ million to 107600 US $ million for the year 1991-92 to 2008-09. It
represents an increase of 457.87 times. The overall growth rate in
terms of percentage comes to 45687.23. The annual average growth
rate comes to 2538.17 per cent.

225 The Global total FDI inflows in absolute amount has increased
from 161278 US $ million to 1658500 US $ million for the years
1991-92 to 2008-09. It represents an increase of 10.28 times. The
overall growth rate in terms of percentage comes to 928.35. The
annual average growth rate comes to 51.57 per cent.
Having completed the data analysis on Foreign Direct
Investment inflows into India, the last chapter presents the leading
Findings of the present study and suggestions for the further studies.

Chapter VII
FINDINGS, SUGGESTIONS AND CONCLUSIONS
The followings are the leading findings and conclusions of the
study and suggestions for the further study.
The total Foreign Investment inflows into India in absolute term
has increased from Rs.326 crore to Rs.329815 crore for the years
1991-92 to 2009-10. It represents an increase of 1012 times. The
annual incremental increase in percentage shows the mixing
trends of increasing and decreasing over the study period. The
maximum annual average growth rate viz. 660.42 per cent was
recorded in the year 1993-94 and the minimum annual average
growth rate viz. 1.43 per cent was recorded in the year 1995-96.
In some years the annual average growth rate shows the negative
trends. The declining and negative growth rate may be caused by
the money value, climatical condition, political stability and other
foreign policies of the host countries and the home country.
However the Foreign Investment plays a peculiar role in the
development of Indian Economy. It is noteworthy to note that
immediately after the liberlisation process of 1991, the annual
growth rate of foreign investment inflows recorded a highest
growth rate namely 425.46 per cent in 1992-93 and 660.42 per
cent in 1993-94.

227
The Foreign Direct Investment inflows into India in absolute term
has increased from Rs.316 crore to Rs.1,76,304 crore for the
years 1991-92 to 2009-10. It represents an increase of 558 times.
The trends of Foreign Investment inflows into India shows the
increasing trends over the year except a few years. The highest
annual growth rate viz. 205.38 per cent was recorded in the year
1992-93 and the lowest annual growth rate viz. 9.14 per cent
recorded in the year 2009-10. In some of the years under the
study periods shows the negative growth rate. It is interesting to
note that the liberalisation process motivated higher FDI inflows
into India, the highest growth rate of FDI inflow viz. 205.38 per
cent was recorded in 1992-93.
The Foreign portfolio investments inflows into India in absolute
amount has increased from Rs.10 crore to Rs.1,53,511 crore for
the years 1991-92 to 2009-10. It represents an increase of 15351
times. The highest annual growth rate viz., 7380 per cent was
recorded in the year 1991-92 and lowest annual growth rate viz.,
7.32 per cent recorded in the year 1994-95. In some of the years
under the study period shows the negative growth rate. It is
noteworthy to note that the highest annual growth rate viz., 7380
per cent was recorded in the year 1992-93, because of the
liberalization of Foreign Policy of India in the Reform measure of
1991-92.

228
The highest investment viz. Rs.2,43,322 crore was invested by
Mauritius in India which covers 49.36 per cent of the total
investment of top 10 investing countries in India. The lowest
investment viz. Rs.7,175 crore was invested by France in India
which covers 1.46 per cent of the total investment of the top ten
investing countries in India for the year 1990-91 to 2009-10.
United States of America and Singapore have invested Rs.48.909
crore and Rs.48,854 crore respectively. UK, Cyprus and
Netherland have invested Rs.35,809 crore, Rs.25043 crore and
Rs.24,604 crore respectively. U.A.E., Japan and Germany have
invested Rs.23,646 crores, Rs.20,445 crore and Rs.15,185 crores
respectively. It is interesting to note that Mauritius Investment in
India viz. Rs.2,43,322 is more or less equal to the investment viz.
Rs.2,49,670 crore of other nine top level investing countries in
India. The difference between the Investment of Mauritius and
other nine countries of top ten investing countries in India is only
Rs.6348 crore; Hence Mauritius has occupied a vital role in
Foreign Investment in India.
The highest investment viz. 1,27,138 crore was invested in the
service sector which covers 29.79 per cent of the ten sectors
attracting highest FDI inflow into India. The lowest investment
viz. Rs.13,223 crore was invested in petroleum and natural Gas
sector which covers 3.10 per cent of the top ten sectors attracting
investment in India. Rs.59,344 crore was the investment in

229
Electrical Equipments, Rs.47,877 crore was invested in table
communication sector. Rs.45,748 crore was invested in Housing
and Real Estate (Real Estate only for the NRI Investment),
Rs.45,656 crore was invested in construction activities, Rs.27,727
crore was invested in power sector, Rs.22,138 crore was invested
in Metallurgical Industry, Rs.21,664 crore was invested in
Automobile Industry and Rs.16,236 crore was invested in
chemical industry. It is noteworthy to note that the highest
attracting sector investment is in service sector, this in because of
the liberalization foreign policy of India in 1991 reform
measures.
The FDI includes advances and loan into India in absolute
amount has increased from Rs.408 crore to 123120 crore for the
years 1991-92 to 2009-10. It represents an increase of 302 times.
The overall growth rate in terms of percentage comes to 30076.
The annual average growth rate is 43.65 per cent. It is important
to note that the highest annual growth rate of FDI inflows
includes advances and loan viz. 168.14 per cent and 129.38 per
cent was recorded in 1992-93 and 2006-07 respectively.
The highest monthly FDI inflows into India viz. Rs.17,045 crore
was recorded in July-2009 which covers 13.82 per cent of the
total FDI inflows into India in 2009-2010 and the lowest monthly
FDI inflows into India viz. Rs.5,497 crore which covers only 4.46
per cent of the total FDI inflows into India in 2009-2010 was

230
recorded in March-2010. There was a mixing trends of increasing
and decreasing of monthly FDI equity inflows into India from
April 2009 to March 2010. The total FDI equity inflows into
India from April-2009 to March-2010 was Rs.1,23,377 crore
which was the sizable foreign investment in India.
The highest FDI inflows into India in 2010-11 viz. Rs.10,135
crore was recorded in May 2010, the monthly average FDI
inflows comes to 11.45 per cent. The lowest FDI inflows into
India in 2010-11 viz. Rs.4.725 crore was recorded in January
2011. The monthly average FDI inflow comes to 5.34 per cent.
The FDI inflows into India for the years 2010-2011 shows the
mixing trends of increasing and decreasing over the years. It is
noteworthy to note that Four month FDI inflow viz., May 2010.
September-2010, April-2010 and December-2010 is percentage
are significant all other months FDI inflows in the year shows
only the single digit percentage to the total FDI received in 2010-
2011.
United State of America (USA) has occupied a vital role with
22.71 percentage of the total with 1841 Technological
collaborations approvals with first rank followed by Germany
with 13.77% of the total with 1,116 technological collaborations
approvals. Japan and UK got 880 and 876 technological
collaborations with 10.86 per cent and 10.81 per cent
respectively. Italy got 489 technological collaborations with 6.03

231
per cent and the remaining countries got 2,904 technological
collaborations with 35.82 per cent.
Maharashtra got the highest percentage of Foreign Technological
collaborations of 1,397 with 17.23 per cent followed by Tamil
Nadu viz., 683 Approvals with 8.43 per cent. Gujarat, Karnataka
and Haryana got 634, 529 and 369 approvals with 7.82 per cent,
6.53 per cent and 4.55 per cent respectively. The remaining states
got 4,494 approvals with 55.54 per cent. A total of 8,106
Technological collaborations received by various states in India
for the years 1991-92 to 2009-2010.
The Electrical Equipments sector including computer software
electronics got 1,263 approvals with 15.58 per cent. Chemical
other than Fertilizer and Industrial Machinery got 905 and 872
approvals with 11.16 per cent and 10.76 per cent respectively.
The Transportation Industry and Misc, Mach Engineering
Industry got 760 and 444 approvals with 9.38 per cent and 5.48
per cent respectively. The remaining sectors got 3,862 approvals
with 47.64 per cent. A total of 8,106 Foreign Technological
Collaboration received in various sectors in India for the years
1991-92 to 2009-2010. The revised FDI inflows into India
including equity and additional components in absolute amount
has increased from 129 US $ million to 27,024 US $ million for
the years 1991-92 to 2010-11. It represents an increase of 209
times. The incremental increase in percentage shows the mixing

232
trends of increasing and decreasing over the study period. The
maximum annual average growth rate viz.154.73% was recorded
in the year 2006-07, and the minimum annual average growth rate
viz.8.62% was recorded in the year 2008-09. In some years the
annual average growth rate shows the negative trends.
The equity components of the revised FDI inflows in absolute
term has increased from 129 US $ million to 20,087 US $ million
for the years 1991-92 to 2010-11. It represents an increase of
155.71 times. The overall growth rate of equity components of
FDI inflow in terms of percentage comes to 15471.32. The annual
average growth rate comes to 773.57%. The re-investment
components of FDI inflow in absolute amount has increased from
1350 US $ million in 2000-01 to 6,703 US $ million in 2010-11.
It represents an increase of 4.97 times. The overall growth rate in
terms of percentage comes to 396.52 and the annual average
growth rate comes to 36.05%.
The revival FDI inflows of Foreign Investment into India
excludes of NRI investment in absolute amount has increased
from 66 US $ million to 15,177 US $ million for the years 1991-
92 to 2009-10. It represents an increase of 230 times. The
incremental increase in percentage shows the mixing trends of
increasing and decreasing over the study period. The maximum
annual average growth rate viz., 300 per cent was recorded in the
year 1992-93 and the minimum annual average growth rate viz.,

233
18.62 per cent was recorded in the year 2007-08. In some years
the annual average growth rate shows the negative trends.
The revival FDI inflows of NRIs investment into India in
absolute amount has increased from 63 US $ million to 18,990
US $ million for the year 1991-92 to 2009-10. It represent an
increase of 301 times. The incremental increase in percentage
shows the mixing trends of increasing and decreasing over the
study period. The maximum annual average growth rate viz.,
325.49% was recorded in the year 1993-94 and minimum annual
average growth rate viz., 0% was recorded in the year 2002-03. In
some years the annual average growth rate shows the negative
trends.
The total region-wise FDI inflows into India was recorded viz.,
Rs.5,94,569 crore for the years 2000 to 2011. In terms of
American dollar it comes to 1,32,837 US $ million. The RBI’s
Regional Offices with state covered is given in the table 5.4.
Among the various RBI’s Regional Offices, the highest FDI
inflows Viz. Rs.204,852 crore was recorded in Mumbai Regional
Offices with a coverage of 35% of the total FDI inflows of all
region. New Delhi Regional office placed second with FDI
inflows of Rs.37,233 crore with 20% of the FDI inflow of all
regions. The lowest FDI inflow of Rs.27 crore was received in
Patna Regional Office which covered the states Bihar and
Jharkhand. Mumbai Regional office which covered the states,

234
Maharashtra, Dadra, Nagar Haveli, Daman and Diu and New
Delhi Regional office, which covered the states, Delhi part of UP
and Haryana in Mumbai and New Delhi Regional offices covered
55% of the FDI inflows among all the regional offices and states,
while all other regional offices FDI inflow coverage is only single
digit percentage to the total inflows of all regions. It is
noteworthy to note that seven states in Mumbai and Delhi
Regional office recorded the major FDI inflow of 55 per cent.
It can be observed from the table that the maximum permissible
limit of 26 per cent Foreign Direct Investment was received by
most of the Indian Insurance Companies in the year 2007-2008
both in life insurance and non-life insurance companies. Out of
the total investment in Indian Life Insurance Companies of
Rs.11,744.21 crore, Rs.2821.63 was Foreign Direct Investment
which covers 24.03 per cent of the total investment in Life
Insurance Companies of India. The total of Indian Investment in
Life Insurance by Fifteen companies was Rs.8922.58 crores
which covers 75.97 per cent of the total investment.
The total investment of Nine Non-life Indian Insurance
Companies was Rs.1694.55 crore out of which Rs.439.61 crore
was was Foreign Direct Investment which covers 25.95 per cent
of the total investment in Indian Non-life Insurance Companies.
The highest Foreign Direct investment viz. Rs.363.63 crore was
received by ICICI presidential Life Insurance Company Ltd.

235
while the lowest Foreign Investment viz. Rs.32.5 crore was
received by Shriram Life Insurance Company in India. Among
the Nine Non-life Insurance Companies in India, the highest
Foreign Investment viz. Rs.97.89 crore was received by ICICI.
Lombared General Insurance Company while the lowest Foreign
Investment viz. Rs.28.66 crore was received by Bajaj Alli
General Insurance Company in India. The total insurance
companies investment (both life and non-life insurance) was
13,438.76 crores, out of which Rs.439.61 crore was Foreigner
Investment, which covers 24.27 per cent of the total Investment
in India Insurance Companies.
The follow are the deduction of the table 6.6. Regionwise
distribution of FDI in the world is given in percentage. Developed
countries received 75.6 per cent of the FDI inflows and
developing countries received 24.4 per cent of the FDI in 1980. In
1990 it was recorded as 79.3 per cent in developed countries and
20.7 per cent in developing countries. In 2000, it was recorded as
68.5 per cent in developed countries and 30.3 per cent in
developing countries. In 2005, was recorded as 72.8 per cent in
developed countries and 27.2 per cent in developing countries. It
is noteworthy to note the developed countries received the highest
percentage of FDI from the year 1980 to 2005.
It can be observed from the above table that among the top six
destinations for FDI in 2009-11, China placed first with 56 per

236
cent of responses followed by United States of America with 47
per cent responses, India with 34 per cent responses, Brazil with
25 per cent responses, Russian Federation with 21 per cent
responses and United Kingdom with 18 per cent responses.
The range of FDI inflows of China, Hong Kong (China) was
above $50 billion. The range of FDI inflows Singapore, India and
Indonesia was $10 to $49 billion. The range of FDI inflows of
Malaysia, Vietnam, Korea, Thailand, Islamic, Republic of Iran,
Macao (China), Taiwan Province of China, Pakistan, Philippines
and Mangolia was $1.0 to $ 9.9 billion, and the last but not least
range of FDI inflows viz., below $0.1 billion was received by
Afghanistan, Nepal, Democratic People’s Republic of Korea and
Bhutan.
India placed II in FDI inflows and placed III in FDI outflow.
Thirteen factors, such as Presence of suppliers and partners,
Competitors, Availability of skilled labour and talents, Cheap
labour, Size of local market, Access to International/ regional
markets, Growth of market, Access to natural resources, Access
to capital market (finance), Government effectiveness, Incentives,
Quality of infrastructure, Stable and business-friends/
environment, which determined Foreign Investment both inflow
and outflow have been efficient. As far as India is concerned five
factors namely Presence of suppliers, Availability of skilled
labour and talents, Cheap labour, Size of local market and
Growth of market are favouring investment in India and having

237
more than world average level. Other eighth factors favouring
investment in India but having less than or equal to world average
level. It is noteworthy to note that India has played a vital role in
size of local market and growth of market in the global economy.
The FDI inflows in absolute amount has increased from 129 US $
million to 37,182 US $ million for the years 1991-92 to 2009-10,
it represents an increase of 288 times. The overall growth rate in
terms of percentage comes to 28723.25. The annual average
growth rate comes to 1511.75 per cent.
The FDI inflows into China in absolute amount has increased
from 4366 US $ million to 1,11,000 US $ million for the years
1991-92 to 2009-10. It represents an increase of 25.42 times. The
overall growth rate in terms of percentage comes to 2442.37. The
annual average growth rate comes to 128.55%.
The FDI inflow into Korea in absolute amount has increased from
1130 US $ million to 6761 US $ million for the year 1991-92 to
2007-08. It represents an increase of 5.98 times. The overall
growth rate in terms of percentage comes to 498.32. The annual
average growth rate comes to 27.67 per cent.
The FDI inflows into Asian countries in absolute amount has
increased from 25,769 US $ million to 241500 US $ million for
the years 1991-92 to 2009-10. It represents an increase of 93.72
times. The overall growth rate in terms of percentage 837.17. The
annual average growth rate comes to 44.06 per cent.

238
The FDI inflows into Asian countries in absolute amount has
increased from 25,769 US $ million to 2,41,500 US $ million for
the year 1991-92 to 2009-10. It represents an increase of 93.72
times. The overall growth rate in terms of percentage comes to
837.17, the annual average growth rate comes to 44.06 per cent.
The FDI inflows into India in absolute amount has increased from
129 US $ million to 37,182 US $ million for the year 1991-92 to
2009-10. It represents an increase of 288 times. The overall
growth rate in terms of percentage comes to 28723.25. The
annual average growth rate is 1511.75 per cent.
The FDI inflows into Argentina in absolute amount has increased
from 2439 US $ million to 1570 US $ million for the year 1991-
92 to 2006-07. It represents an increase of 5.37 times. The overall
growth rate in terms of percentage comes to 5.37. The annual
average growth rate comes to 0.34 per cent.
The FDI inflows into Brazil in absolute amount has increased
from 1102 US $ million to 25,000 US $ million for the year
1991-92 to 2006-07. It represents an increase of 22.68 times. The
overall growth rate in terms of percentage comes to 2168.6. The
annual average growth rate comes to 135.54 per cent.
The FDI inflows into Mexico in absolute amount has increased
from 4,761 US $ million to 20,420 US $ million for the years
1991-92 to 2006-07. It represents an increase of 4.28 times. The

239
overall growth rate in terms of percentage comes to 328.9. The
annual average growth rate comes to 20.56 per cent.
The FDI inflows into China in absolute amount has increased
from 4366 US $ million to 1,11,000 US $ million for the years
1991-92 to 2009-10. It represents an increase of 25.42 times. The
overall growth rate in terms of percentage comes to 2442.37. The
annual average growth rate is 128.55 per cent.
The FDI inflows into Korea in absolute amount has increased
from 1130 US $ million to 6761 US $ million for the year 1991-
92 to 2007-08. It represents an increase of 5.98 times. The overall
growth rate in terms of percentage comes to 498.32. The annual
average growth rate is 27.67 per cent.
The FDI inflows into developing countries in absolute amount
has increased from 43,951 US $ million to 5,49,100 US $ million
for the year 1991-92 to 2008-09. It represents an increase 12.49
times. The overall growth rate in terms of percentage comes to
1147. The annual average rate comes to 63.73 per cent.
The FDI inflows into developed countries in absolute amount has
increased from 117092 US $ million to 1001800 US $ million for
the years 1991-92 to 2008-2009. It represents an increase of 8.56
times. The overall growth rate in terms of percentage comes to
755.57. The annual average growth rate comes to 41.98 per cent.
The FDI inflows into developing countries in absolute amount
has increased from 43951 US $ million to 549100 US $ million

240
for the years 1991-92 to 2008-09. It represents an increase of
12.49 times. The overall growth rate in terms of percentage
comes to 1149.35. The annual average growth rate comes to
63.85 per cent.
The FDI inflows into South East Europe and Commonwealth of
Independent states in absolute amount has increased from 235 US
$ million to 107600 US $ million for the year 1991-92 to 2008-
09. It represents an increase of 457.87 times. The overall growth
rate in terms of percentage comes to 45687.23. The annual
average growth rate comes to 2538.17 per cent.
The Global total FDI inflows in absolute amount has increased
from 161278 US $ million to 1658500 US $ million for the years
1991-92 to 2008-09. It represents an increase of 10.28 times. The
overall growth rate in terms of percentage comes to 928.35. The
annual average growth rate comes to 51.57 per cent.
CONCLUSION
In a globalised economy, the world marked is reduced as a
village market. There is a wider transactiosn of goods and services
between the countries in the world. Each and every country in the
world has necessarily to depend other countries in the world for the
development of their economy. FDI inflows and outflows create
higher level of employment generation in the world, because of the
MNCs there is no questions of unemployment in the world in

241 general, the Developing countries in particular but there is only a
question of unemployability. The impact of FDI inflows into India in
recent years is highly significant.
SUGGESTIONS
Due to non-availability of time series data on FDI in RBI
bulletin, Economic Survey and UNCTAD Survey report and other
sources of publication in web searching, the continuous time serious
analysis could not be analysed in all the dimensions of FDI, in India.
Due to time limitations, FDI inflows into India alone could be
analysed here.
In further research world level FDI inflows and outflows can
be analysed with complete data.

BIBLIOGRAPHY
Aczel, Amir, D., and Sounder Pandian. Complete Business Statistics. 5th
edition, Tata McGraw Hill, New Delhi (2002).
Agrawal, D. Foreign Capital Inflows: Long Run Desirability and Short
Run Management (1994).
Ahmad, Rais. Is Foreign Direct Investment in India Really Increasing?
Monthly Commentary on Indian Economic Conditions, IIPO, New
Delhi.
Ali, Abbas, J. Globalisation of Business Practice and Theory, Global
Business Environment (2001).
Aliber, R.Z. The Multinational Enterprise in a Multiple Currency World.
London (1971).
Anderson, Sweeney and Williams. Statistics for Business and Economics.
Thomson: South-Western Eighth Edition (2000).
Areskony, Key. “Private Foreign Investment and Capital Formation in
Developing Countries.” Economic Development and Cultural
Change, vol.24 (1969).
Arumugan, S., and Thangapandi, A. Statistics. New Gamma Publishing
House (1999).
Audretsch, D. Innovation and Industry Evolution. Cambridge, MIT Press
(1995).
Barro, R., Sala, I., Martino, X. Economics Growth. McGraw-Hill,
Cambridge, Massaehusetts, USA (1995).

ii Beri, G.C. Statistics for Management. Tata McGraw Hill Publishing
Company Limited, New Delhi (2003).
Bhalla, V.K. Fundamentals of Investment Management, S. Chand and
Company Ltd., New Delhi (2006).
Bhatt, P.R. “India-Asian Investment Flows: Policies and Trends.” The
Asian Economic Review, vol.42 (2000).
Bhattacharya, B. “FDI Vs Bureaucratic Subjectivism”. The Economic
Times, 29.6.1996, New Delhi (1996).
Bhattacharya, B., and Satinder Palana. Policy Implements to Trade and
FDI in India, IIFT (1996).
Biswanath Golder and Etsuro Ishigami . “FDI in Asia.” Economic and
Political Weekly, vol.34 (1998).
Blomstrom, M. Transnational Corporation and Manufacturing Exports
from Developing Countries, New York (1990).
Bosworth and Collins. FDI in India: Past Trends and Future Prospects,
New Age International Publishers (1996).
Buckley, P.J., and Casson, M. The Future Multinational Enterprise,
McMillan, London (1991).
Calapathi Roa, K.S., and Murthy, M.R. “Foreign Direct Investment in the
Post-Liberalisation Period: An Overview.” Journal of Indian
School of Political Economy, vol.11 (1999).
Castro, Franciso, B. FDI in the European Periphery: The Competitiveness
of Portugal, Ph.D. Thesis, University of Wales (July 2000).

iii Caves, R.F. Multinational Enterprise and Economic Analysis. Cambridge
University Press, New York (1982).
Chanchal Chopra. Foreign Investment in India. Deep and Deep
Publication, New Delhi.
Charu Neelam, Fransis. Business Environment. Himalaya Publishing
House (2004).
Chenery. Redistribution with Growth. Oxford University Press, London
(1974).
Chunlai Chen. “The Impact of FDI and Trade”, In Yanruiwu, FDI and
Economics Growth in China, Edward Elgar, USA (1999).
Damodar, N. Gujarati. Basic Econometrices. IV edn., Second Reprint,
Tata McGraw Hill Publishing Co. Ltd., New Delhi (2004).
Das, T. Liberalization of Foreign Investment Policy in India: Some
Observations, Vikalpa (1998).
Dunning, John, H. Studies in Direct Investment, George Allen and Unwin,
London (1970).
Economic Survey of India (2008-09), Ministry of Finance, Government of
India.
Gaurav Datt and Ashwani Mahajan. Indian Economy, S. Chand and
Company Ltd., New Delhi (2011).
Gerald Meier. Leading Issues in Economics Development. Oxford
University Press, London (1970).
Global Development Finance (2009), World Bank.

iv Golder, Bishwanath. “Foreign Direct Investment in Asia”. EPW, May 30,
1999, Hindustan Times, 14.5.2001, New Delhi.
Grossman, G., and Helpmen, E. Innovation and Growth in the Global
Economy, MIT Press, Cambridge, Massaehusetts (1991).
Hood, N., and Young, S. The Economic Multinational Enterprise,
Longman, London (1979).
Hymer, S.H. The International Operations of National Firms: A Study of
Direct Investment, MIT Press, Cambridge (1976).
Indu Bala. Foreign Resources and Economic Development, Deep and
Deep Publications, New Delhi (2003).
Iqbal Bader Alam. Foreign Direct Investment inflows to India, Ajanta
Publication (1998).
Jain, P.K., Peyrard Josette, Yadav, Surender, S. International Finance
Management, McMillan India Ltd. (1999).
John D. Daniels and Lee, H. Raelebaugh. International Business
Environment and Operation, Addision Wesley (1998).
Kindleberger, C.P. American Business Abroad, Yale University Press,
New Havens (1969).
Knicker Backer, F.T. Oligopolistic Reaction and Multinational
Enterprise. Boston: Division of Research, Harvard University,
Graduate School of Business Administration.
Kohnli. “Capital Flows and Domestic Financial Sector in India.”
Economic and Political Weekly, vol.38 (2003).

v Kojima, K. FDI – A Japanese Model of Multinational Business
Operation, London (1978).
Kumar, D. FDI and Retail Sectors in India. Dominant Publishers and
Distributors, New Delhi (2008).
Kumar, N. Globalisation, Foreign Direct Investment and Technology
Countries, London and New York (1998).
Lall, Sanjaya. Changing Proportions of FDI in Development Published in
a Book edited by P.K. Thakran et al. Internal Trade and Foreign
Investment, MacMillan Press, London.
Lerner, Adda, P. The Economics of Control. The MacMillan Company,
New York (1994).
Lipsey. Internationalisation Production in World Output. University of
Chicago Press, Chicago (1998).
Mackiraju. Business Environment. New Age International Private
Limited, New Delhi (2004).
Meier Garalad, M. Leading Issues in Economics Development. Oxford
University Press, London (1970).
Obstfeld, Maurice. “Risk Taking Global Diversification and Growth.”
American Economic Review, vol.84 (1994).
Pradhan Jaya Prakash. Foreign Investment and India Fragile Economy.
Osmania University, Hyderabad (1996).
Radha Prameswaran, Dr., Nedunchezhien, Dr. Investment Management,
Prasanna Publisher, Chennai (2006).

vi Rais Ahmed . Foreign Direct Investment in India, A Mittal Publication,
New Delhi (2008).
RBI Annual Report (2006-07).
RBI Bulletin in India (2008).
RBI Hand Book of Statistics on Indian Economy 2003-04 and 2004-05.
Sharma. “Globalisation, FDI and Development.” Business Perspective,
vol.5 (2003).
Singer, M. The Strategy of International Development, International Arts
and Science Press (1975).
“Trend in Investment.” Economic and Political Weekly, vol.20.
Usha Bhati. Foreign Direct Investment, Contemporary Issues, Deep and
Deep Publications, New Delhi.
Vernon, R. “Review Transnational Corporations, Market Structure and
Competitive Policy.” Economic Development and Cultural Change
(1999).
Vyuptakesh Sharan. India’s External Sector Reforms, Oxford University
Press (1999).
Yasheng. Foreign Direct Investment in China, Level of FDI may indicate
serious Economic Problems.
WEBSITES
www.rbi.org.in
www.unctad.org/fdi/statistics.in
www.indiabudget.org.in