Embed Size (px)
Citation preview

A Project Report on
A study on Analysis of mutual fund performance at Ascent
Consultancy Service Pvt. Ltd
BY
GUNASHEKHARA I S
1NH15MBA54
Submitted to
DEPARTMENT OF MANAGEMENT STUDIES
NEW HORIZON COLLEGE OF ENGINEERING,
OUTER RING ROAD, MARATHALLI,
BANGALORE
In partial fulfillment of the requirements for the award of the degree of
MASTER OF BUSINESS ADMINISTRATION
Under the guidance of
INTERNAL GUIDE ETERNAL GUIDE
Dr. A. R. Sainath Rajeeth Das
NHCE Ascent Consultancy Service Pvt. Ltd
2015-2017

CERTIFICATE
This is to certify that Gunashekhara I s bearing 1NH15MBA54 is a confide student of Master
of Business Administration course of the Institute 2016-17, autonomous program, affiliated to
Visvesvaraya Technological University, Belgaum. Project report on ‘ANALISIS OF
MUTUAL FUND PERFORMANCE AT ASCENT CONSULTANCY SERVICE
PVT.LTD’ is prepared by him under the guidance of Dr. Sainath, Professor, in partial
fulfillment of requirements for the award of the degree of Master of Business Administration of
Visvesvaraya Technological University, Belgaum Karnataka.
Signature of Internal Guide Signature of HOD Signature of principal

DECLARATION
I, Gunashekhara , hereby declare that the Internship report entitled ‘Analysis of Mutual
fund performance at ascent consultancy service Pvt. Ltd’ prepared by me under
the guidance of Dr. Sainath, Professor, of M.B.A Department, New Horizon College of
Engineering.
I also declare that this mini project work is towards the partial fulfillment of the university
regulations for the award of the degree of Master of Business Administration by Visvesvaraya
Technological University, Belgaum.
I have undergone a project for a period of sixteen weeks. I further declare that this project is
based on the original study undertaken by me and has not been submitted for the award of a
degree/diploma from any other University / Institution.
Signature of Student
Place:
Date:

ACKNOWLEDGEMENT
I express my deep sense of gratitude to chairman DR. MOHAN MANGHNANI and
Principal DR. MANJUNATHA, New Horizon College Of Engineering, for giving the
opportunity of being the part of this institution and for generous help to complete the
project.
I am extremely thankful and pay my gratitude to head of the department DR. SHEELAN
MISRA for her valuable guidance and support on completion of this project in its presently.
I express my special thanks to my internal guide Dr A R SAINATH, professor for him
valuable guidance, support, motivation and inspirations at every stage throughout the
period of my project work.
I would like to thank Mr. RANJEETH DAS. and the Management staff of the ASCENT
CONSULTENCY SERVICE PVT LTD, Bangalore for giving me opportunity to conduct
to study and to be associated with the company.
Finally, I wish to thank my Parents, Friends and to all who helped me in the
successful completion of this project.
GUNASHEKHARA I S
USN NO: 1NH15MBA54
INDEX
Chapter 1
1.1 Topic chosen for the study ……………………….1
1.2 Need for the study ……………………………......3
1.3 Objective of the study……………………………..3
1.4 Scope of the study………………………………....4
1.5 Research methodology…………………………….4
1.6 Review of literature………………………………..5
1.7 Limitation of the study…………………………….8
Chapter 2
2.1 Company profile…………………………………….9
2.2 Vision & Mission……………………………………10
2.3 Key attributes……………………………………......11
2.4 Service……………………………………………....12
Chapter 3
3.1 mutual fund in India …………..……………………14
3.2 advantages and disadvantages of mutual fund ….....15
3.3 types of mutual fund scheme……………………......16
3.4 mutual fund structure in India..............................…...20
3.5 mutual fund operation flow chart …………………..25
3.6 Best mutual fund in India …………………………...26
3.7 Some facts growth for the mutual fund India……….27
3.8 Role of mutual fund in stock exchange………………..28

Chapter 4
Analysis and interpretation of data………………………...42
Chapter 5
5.1 Findings……………………………………………..60
5.2 Suggestions……………………………………….....61
5.3 Conclusion…………………………………………..62
Bibliography
Annexure

List of Tables
Titles Page
No.
4.1 Table showing on what kind of investment options respondents
prefer
28
4.2 Table showing Investment avenues 30
4.3 Table showing investment portfolio 32
4.4 Table showing awareness of mutual fund 34
4.5 Table showing proportion of amount invest in mutual fund 36
4.6 Table showing interest to the area investor in mutual fund 38
4.7 Table showing Investors opinion of open ended and close
ended scheme.
40
4.8 Table showing on schemes preferred by the investors 42
4.9 Table showing Table showing on while buying a mutual fund. 44
4.10 Table showing Number of investor contact while investing. 46
4.11 Table showing Number of investor deals with different
scheme.
48
4.12 Table showing Trade option Preferred by investor 50
4.13 Table showing Objective behind trading in Mutual Fund. 52
4.14 Table showing percentage of return expect in Mutual Fund. 53
4.15 Table showing Investor willing to take Risk. 54
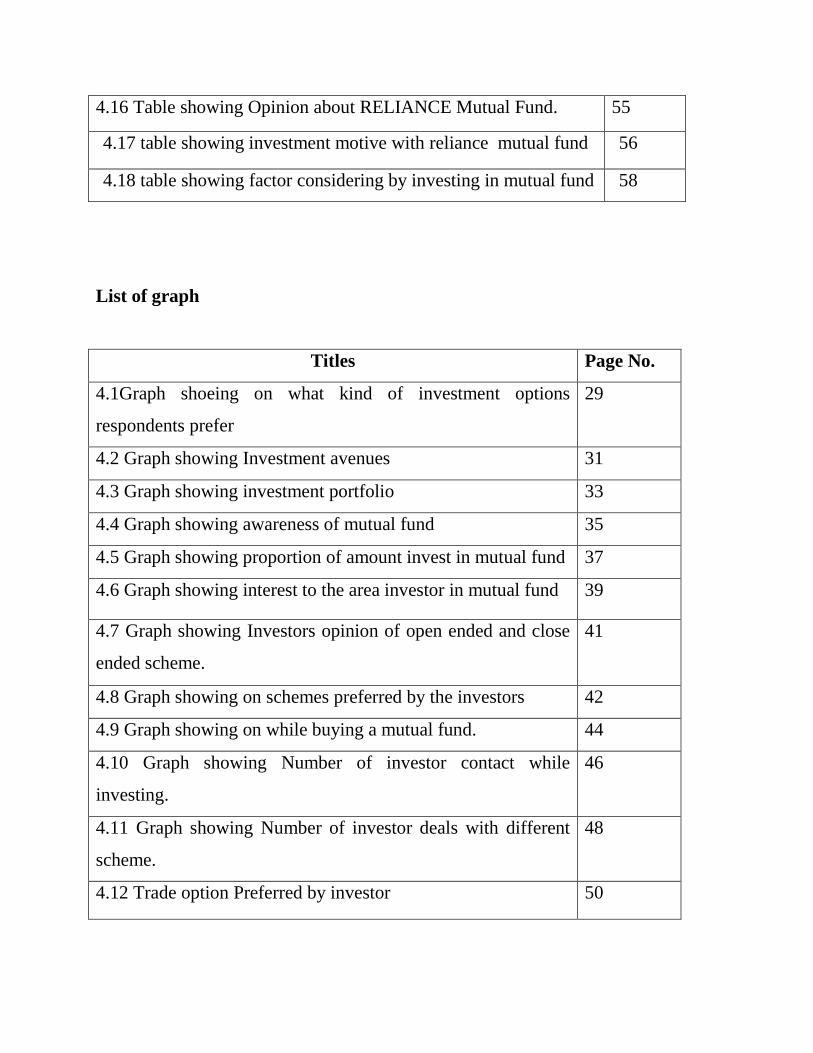
4.16 Table showing Opinion about RELIANCE Mutual Fund. 55
4.17 table showing investment motive with reliance mutual fund 56
4.18 table showing factor considering by investing in mutual fund 58
List of graph
Titles Page No.
4.1Graph shoeing on what kind of investment options
respondents prefer
29
4.2 Graph showing Investment avenues 31
4.3 Graph showing investment portfolio 33
4.4 Graph showing awareness of mutual fund 35
4.5 Graph showing proportion of amount invest in mutual fund 37
4.6 Graph showing interest to the area investor in mutual fund 39
4.7 Graph showing Investors opinion of open ended and close
ended scheme.
41
4.8 Graph showing on schemes preferred by the investors 42
4.9 Graph showing on while buying a mutual fund. 44
4.10 Graph showing Number of investor contact while
investing.
46
4.11 Graph showing Number of investor deals with different
scheme.
48
4.12 Trade option Preferred by investor 50

4.13 Graph showing behind trading in Mutual Fund. 51
4.14 Graph showing percentage of return expect in Mutual
Fund.
53
4.15 Graph showing Investor willing to take Risk. 54
4.16 Graph showing Opinion about RELIANCE Mutual Fund. 55
4.17 Graph showing investment motive with reliance mutual
fund
57
4.18 Graph showing factor considering by investing in mutual
fund
59

EXECUTIVE SUMMARY
Financial market’s main function is to facilitate transfer of funds from surplus sectors to
deficit sectors. A financial market consists of investor or buyers, sellers, dealers and does not
refer to physical location. Indian financial system consists of two markets, viz. money and
capital market. The core of money market is the inter-bank call money market. It has two
components - organised and unorganised.
Capital market provides the framework in which savings and investments take place. On
one hand it enables companies to raise resources from the investing community and on the other,
it facilitate households to invest their savings in industrial or commercial activities. The capital
market consists of primary and secondary segments. In primary market it deals with the issue of
new instruments by the corporate sector such as equity shares, preference shares, and debentures.
The secondary market or stock exchanges where existing Securities are traded. Capital market
plays a major role in Indian financial system.
So, Equities & mutual fund is the part of capital market. Mutual fund industry in India
began with setting up of Unit Trust of India (UTI) in 1964 by the government of India. Now a
day mutual fund is playing very important role in the industry. Investors will get the benefit of
return, capital appreciation, tax benefits and safety to their investment and companies will get
the capital for their growth. Recently they have also started Systematic Investment Plan(SIP)
with the help of this even small investors (minimum of Rs. 100)can start investing, by this even
students can also invest in this fund. So, we came to know how this mutual fund works. .
The saving of an individual are spread through different means of investment one of them
is mutual fund which is a growing investment now a days because of diversified risk and lack of
time to look after their money.

1
Chapter 1
INTRODUCTION
1.1 About the topic
FINANCE
Finance is regarded as „life blood of enterprise‟. This is because in the Modern Money-Oriented
Economy, Finance is one of the basic foundations for all kinds of economic activities; it is the
master key which provides access to all the sources for being employed in Manufacturing and
Merchandising activities.” Finance is also called the “wheel, marrow of bones and spirit of trade,
commerce and industry.”
The word finance comes from the Latin word “finis”, under Roman law contracts was not
completed until there was a binding contract for monetary/ credit agreements
FINANCIAL MANAGEMENT
Financial management Emerged as a distinct field of study at the time of 20th
century. When one
goes through history of financial management it is clear that in the past the scope of financial
management has limited to certain activities , with a focus mainly on certain episodic events like
formation instance of capital , major expansion , merger, recognition and liquidation in the life
cycle of firm. Financial management is descriptive and institutional in nature. In the past, greater
emphasis was given on day – to-day problems faced by financial managers were responsible only
for maintaining financial records, preparing reports on the company‟s status, performance and
arranging funds needed by the company. Their special services were utilized only when required
via, problem with dearth of funds and to procurement of additional funds.
Driven by growing trend of globalization, the revolutionary developments in information
technology and emergence of the digital era, one can witness phenomenal changes in the world
of finance. Today modern corporate finance is changing from domestic funding to multi currency
funding. Financial control is changing from simple accounting to integrated control systems
based on enterprise resource planning.

2
Investment management is shifting from simple equity and debt products to complex derivatives
products like options, futures, and swaps. Financial services like banking &insurance are getting
geared up for virtual delivery in a seamless digital world. These far reaching developments in the
world of finance have redefined the role of financial manager. The fiancé manager‟s, therefore
concerned with all financial activities of planning of fund raising, allocation and controlling but
not with just any one of them besides, he has handle such financial problems that are
encountered by a firm at the time of incorporation, liquidation , consolidation ,recognition and
the like situations that occur frequently. The finance managers of today are called upon to evolve
financial strategies that dovetail with the firms competitive business strategies. In a competitive
environment, access to the cheapest funds is a key element of competitiveness. A finance
manager needs to evaluate his firms cash needs and decide, for example whether to use debt or
equity funding, whether to have fixed or floating debt, whether to borrow in rupees or in foreign
currency, whether to do currency and / or interest swaps to reduce its funding cost, whether to
issue GDR‟S (Global Depository Receipts) ADR‟s (American Depository Receipts) or to go for
a local secondary issue and so on. For each alternative or combination of alternatives, he needs to
evaluate his net costs, the risk involved, the timing issue and so on. For this finance manger
should have analytical bent of mind and intellectuality in various financial concepts.
SPECIFIC AREA OF THE TOPIC CHOSEN
MUTUAL FUND
A Mutual Fund is a trust that pools the savings of a number of investors who share a common
financial goal. The money thus collected is then invested in capital market instruments such as
shares, debentures and other securities. The income earned through these investments and the
capital appreciations realized are shared by its unit holders in proportion to the number of units
owned by them. Thus a Mutual Fund is the most suitable investment for the common man as it
offers an opportunity to invest in a diversified, professionally managed basket of securities at a
relatively low cost.

3
Definition of Mutual Fund-
The SEBI (MF) Regulations, 1993 defines mutual fund as “A fund established in the form
of a trust by a sponsor to raise monies by the trustees through the sale of units to the public under
one or more schemes for investing in securities in accordance with these regulations
1.2 NEED FOR THE STUDY
The project has been undertaken with the aim of Analysing the Mutual funds of the. And
also to analyse how the operation has been undertaken to communicate with the client & how the
services is offered by the company. These operations may involve the following problems
The operations involved in India Info line Ltd.
Differences between Equities & Mutual funds operations and
Mutual understanding between company & its clients.
1.3 OBJECTIVES OF THE STUDY
The research is undertaken with an objective to know the following aspects:
To study the investment pattern by the respondents in Mutual Funds
To know the perception of investors for investing in a Mutual Fund Scheme
To identify the most demandable scheme of mutual fund
To find whether investment in Equities is better or mutual fund is better
To identify the risk & return involved in Equities and Mutual funds
1.4 SCOPE OF THE STUDY
The study conducted on “Analysis of Mutual fund performance in India” swith reference to
ascent consultancy in the real world has wider scope. The economic activity concerned with
great fluctuations in the economic system. Nowadays the business people are interested to invest
in the mutual funds and equities. They are giving a much importance to this particular field,
which leads to study more about this area. By conducting study in this specified field can
understand how the risk and return involved in the future time with the past experience. The
study brings light in various segment, they are,
To gain new and valid ideas.
4
To know the current issues as regards to the research area.
To gain more knowledge, by direct and personal experience.
To broaden the perspective and set the work in context.
To know the actual importance of this research.
To spot the areas which have not been researched
1.5 RESEARCH METHODOLOGY:
A Research design is a method and procedure for acquiring information needed to solve
the problem. A research design is the basic plan that helps in the data collection or analysis. It
specifies the type of information to be collected the sources and data collection procedure.
The present study is descriptive and it is a fact finding investigation with adequate
interpretation. It is undertaken in many circumstances. When the researcher is interested in
knowing, the characteristics of certain groups such as age, educational level, occupation or
income, interested in knowing the proportion of in a given population who have behaved in
particular manner, making the projections of certain things, or determining the relationships
between two or more variables, descriptive study may be necessary. Descriptive data are
commonly used as directed bases of marketing decisions, these studies are well structured.
DATA COLLECTION
In order to information from the respondent survey method has been adopted. A neatly
constructed questionnaire was prepared to collect information from the respondents regarding
information about the mutual fund. It contains both open-ended and close-ended questionnaire.
Primary Data.
Primary data is the first hand data collected by the researcher directly it‟s the fresh data.
The sources of primary data from this study purpose are as follows :
Observation
Interviews
Questionnaires

5
Secondary Data:
Secondary data is the already available information collected someone hence For their own
study purpose and it is the published sources of information. The secondary data sources
for this study purpose are:
Text books
Company broachers , documents & other related materials
Websites
1.6 REVIEW OF LITERATURE
Any scholars‟ Researchers and writers have done the study on “Analysis of mutual fund
performance in India”. Where the objectives were completely different on the basis of the
needs they had as on when it got a raised. The researchers hear as viewed all such work on the
same, for the purpose of these study but the objectives of the researcher on this area on
completely different than that of those and the need two is also having variation is it. As to
increase the knowledge on the same by getting some sort of the practiced exposure
Literature on mutual fund performance evaluation is enormous. A few research studies
that have influenced the preparation of this paper substantially are being followed. Sharpe,
William F. (1966) suggested a measure for the evaluation of Mutual fund
performance. Drawing on results obtained in the field of portfolio analysis,
economist Jack L. Treynor‟s has suggested a new predictor of mutual fund performance,
one that differs from virtually all those used previously by incorporating the volatility of
a fund's return in a simple yet meaning fulmanner. Michael C. Jensen (1967)
derived a risk-adjusted measure of portfolio performance (Jensen‟s alpha) that
estimates how much a manager‟s forecasting ability contributes to fund‟s returns. As indicated
by Stat man (2000), the e SDAR of a fund portfolio is the excess return of the portfolio over the
return of the benchmark index, where the portfolio is leveraged to have the benchmark index‟s
standard deviation.S.Narayan Rao, et. al., evaluated performance of Indian mutual funds in a
bear market through r e l a t i v e p e r f o r m a n c e i n d ex , r i s k - r e t u r n a n a l ys i s ,
T r e yn o r ‟ s r a t i o , S h a r p e ‟ s r a t i o , S h a r p e ‟ s measure , Jensen‟s measure, and Fame‟s
measure. The study used 269 open-ended schemes (out of total schemes of 433) for computing
6
relative performance index. Then after excluding funds whose returns are less than risk-free
returns, 58 schemes are finally used for further analysis. The results of performance measures
suggest that most of mutual fund schemes in the sample of 58were able to satisfy investor‟s
expectations by giving excess returns over expected returns based on both premium for
systematic risk and total risk. Bijan Roy, etc. all cond ucted an empirical study on
conditional performance of Indian mutual funds. This paper measures the performance
of various mutual funds with both unconditional and conditional f o r m o f T r e y n o r ‟ s -
M a g u e y m o d e l a n d H e n d r i c k s o n - M e r t o n m o d e l . T h e e f f e c t
o f i n c o r p o r a t i n g l a g g e d i n f o r m a t i o n v a r i a b l e s i n t o t h e e v a l u a t i o n o f
m u t u a l f u n d m a n ag e r s ‟ performance is examined in the Indian context. The results
suggest that the use of conditioning lagged information variables improves the performance of
mutual fund schemes, causing alphas to shift towards right and reducing the number of
negative timing coefficients. Mishrl, etal., (2002) measured mutual fund performance
using lower partial moment.
Jack Treynor (1965) developed a methodology for performance evaluation of a mutual fund
that is referred to as reward to volatility measure, which is defined as average excess return on
the portfolio. This is followed by Sharpe (1966) reward to variability measure, which is average
excess return on the portfolio divided by the standard deviation of the portfolio.
Sharpe (1966) developed a composite measure of performance evaluation and imported superior
performance of 11 funds out of 34 during the period 1944-63.
Michael C. Jensen (1967) conducted an empirical study of mutual funds in the period of 1954-
64 for 115 mutual funds. The results indicate that these funds are not able to predict security
prices well enough to outperform a buy the market and hold policy. The study ignored the gross
management expenses to be free. There was very little evidence that any individual fund was
able to do significantly better than which investors expected from mere random chance.
Jensen (1968) developed a classic study; an absolute measure of performance based upon the
Capital Asset Pricing Model and reported that mutual funds did not appear to achieve abnormal
performance when transaction costs were taken into account.
Carlsen (1970) evaluated the risk-adjusted performance and emphasized that the conclusions
drawn from calculations of return depend on the time period, type of fund and the choice of
benchmark. Carlsen essentially recalculated the Jensen and Shape results using annual data for
7
common stock funds over the 1948-67 periods. The results contradicted both Sharpe and Jensen
measures.
Fama (1972) developed a methodology for evaluating investment performance of managed
portfolios and suggested that the overall performance could be broken down into several
components.
John McDonald (1974) examined the relationship between the stated fund objectives and their
risks and return attributes. The study concludes that, on an average the fund managers appeared
to keep their portfolios within the stated risk. Some funds in the lower risk group possessed
higher risk than funds in the most risky group.
James R.F. Guy (1978) evaluated the risk-adjusted performance of
UK investment trusts through the application of Sharpe and Jensen measures. The study
concludes that no trust had exhibited superior performance compared to the London Stock
Exchange Index.
Henriksson (1984) reported that mutual fund managers were not able to follow an investment
strategy that successfully times the return on the market portfolio. Again Henriksson (1984)
conclude there is strong evidence that the funds market risk exposures change in response to the
market indicated. But the fund managers were not successful in timing the market.
Grinblatt and Titman (1989) concludes that some mutual funds consistently realize abnormal
returns by systematically picking stocks that realize positive excess returns.
Richard A. Ippolito (1989) concluded that mutual funds on an aggregate offer superior returns.
But expenses and load charges offset them.
This characterizes the efficient market hypothesis.
Ariff and Johnson (1990) made an important study in Singapore and found that the performance
of Singapore unit trusts spread around the market performance with approximately half of the
funds performing below the market and another half performing above the market on a risk-
adjusted basis.
Cole and IP (1993) investigated the performance of Australian equity trusts. The study found
evidence that portfolio managers were unable to earn overall positive excess risk-adjusted
returns.
8
Vincent A. Warther(1995) in the article entitled “aggregate mutual fund flows and security
returns” concluded that aggregate security returns are highly correlated with concurrent
unexpected cash flows into MFs but unrelated to concurrent expected flows. The study resulted
in an unexpected flow equal to 1 percent of total stock fund assets corresponds to a 5.7 percent
increase in stock price index. Fund flows are correlated with the returns of the securities held by
the funds, but not the returns of other types of securities. The study found an evidence of positive
relation between flows and subsequent returns and evidence of a negative relation between
returns & subsequent flows.
Bansal’s book (1996) “mutual fund management & working” included a descriptive study of
concept of mutual funds, Management of mutual funds, accounting & disclosure standards,
Mutual fund schemes etc.
This study is mainly based on to know perception towards different schemes of mutual
fund to invest.
1.7 Limitations of the Study:
The limitations of the study are as follows:
Sample size is only 100 out of the entire population.
The study concentrated only on the Mutual Funds .
Time constraint.
Study area is Bangalore city only.

9
CHAPTER 2
PROFILE OF THE INDUSTRY AND COMPANY
2.1 Company Profile
Ascent Consulting Pvt Ltd established in the year of 2003.
People Management is a key business function that has a direct impact on competitiveness,
efficiency of operations, and long-term profitability of an organization. Which is why,
organizations have been investing enormous time and resources in the HR function, which
diverts focus from the organization‟s core business.
Ascent Consulting precisely addresses this anomaly through its 360 degree HR Management
Solutions that transform the HR service delivery. While these solutions accomplish cost
reduction, greater efficiencies and improved quality, our larger effort is aimed at improving
organizational efficiency and not just creating incremental change.
Ascent has achieved this by building the right mix of skills and knowledge required for an
effective Outsourced HR Management function. Our solutions employ a matrix of technology,
domain expertise, streamlined business workflow, and highly skilled people to create tangible,
measurable, performance improvements throughout the client‟s organization.
Ascent is recognized as one of the most trusted partners in this business by clients around the
world. We work as an extension of our client‟s business. Our management and delivery teams
are passionate about building efficiencies in our clients‟ business.
Our bespoke technology solutions for HR needs are unique in the industry and are backed by the
best of industry practices in Data management, Information Security, Data Privacy, anywhere
access and very user friendly processes.
10
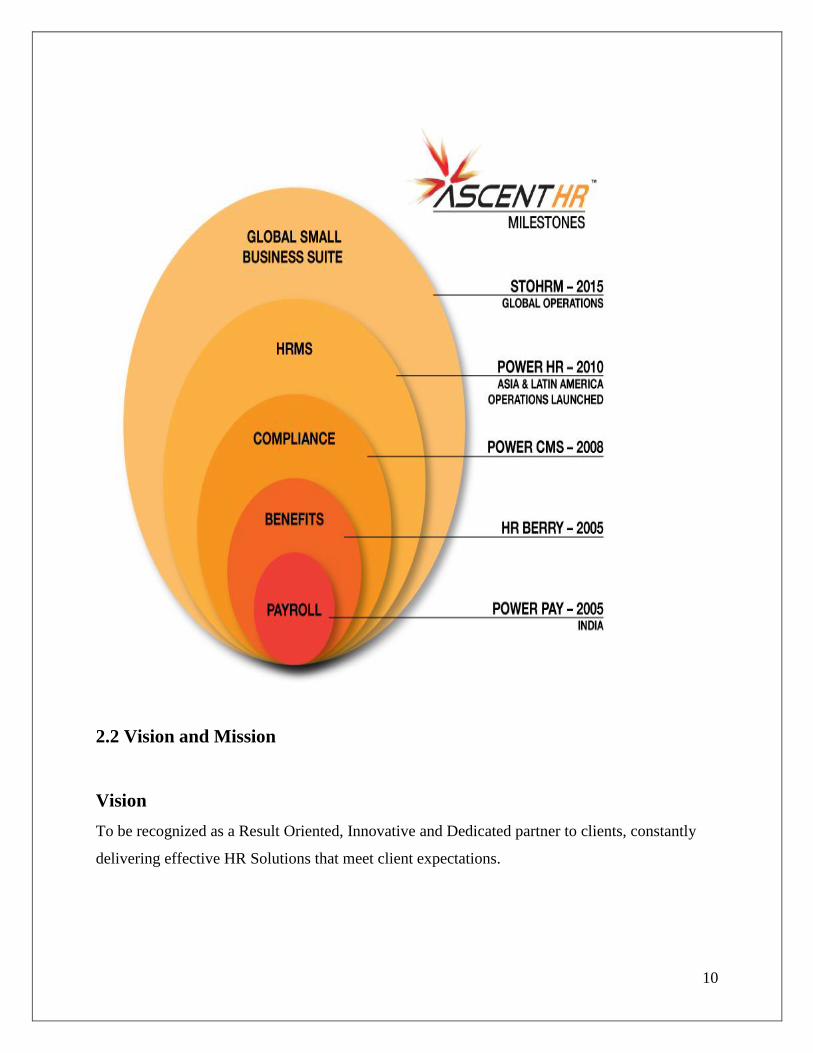
2.2 Vision and Mission
Vision
To be recognized as a Result Oriented, Innovative and Dedicated partner to clients, constantly
delivering effective HR Solutions that meet client expectations.

11
Mission
To partner our clients to create a competitive edge by providing the best talent and HR Solutions,
thereby enabling them to focus on their core business.
Key Attributes
Extensive and proven track record in Executive Search, Recruitment and Selection Assignments.
Strong database and domain Knowledge.
Quick turnaround time, planning and execution.
Ability to provide recruitment solutions at any operating level in the client organization.

12
Around 25 Senior Recruitment specialists on board.
Commitment to quality and perfection in every assignment undertaken.
Highest level of confidentiality maintained at all levels.
2.4 Services
1. HR Outsourcing:
As an emerging global leader in the HR Outsourcing space, Ascent provides intuitive and
customized solutions to any enterprise irrespective of its size / scale. Our solutions address the
needs from integrated HR outsourcing solutions or complicated multi country Payroll services to
handling benefits and Compliance services across the world.
Payroll & Compliance
Payroll processing is a mundane, repetitive and data-intense activity which can be a drain on the
productivity, resource utilization and costs, in the HR function of any organization.
Benefits Consulting
Our decade-long experience has helped us develop and deliver tax-efficient Flexible Benefit
structures that meet both the employee‟s needs as well as organizational needs.
Labour Compliances

13
While designing these solutions, we are cognizant of the fact that every enterprise must be
treated differently when it comes to labour relations.
HR Consulting
Ascent has the knowledge and ability to provide HR consulting solutions across the value chain,
right from acquisition planning to cost optimization to separation management design.
Training Support
Extensive training plans for clients to ensure better management of HR services, compensation
planning, benefits planning, and compliance.
2. HR AUTOMATION
Ascent‟s HR Automation suite comprises five different applications, built over a knowledge base
of vast experience and real life scenarios.
14
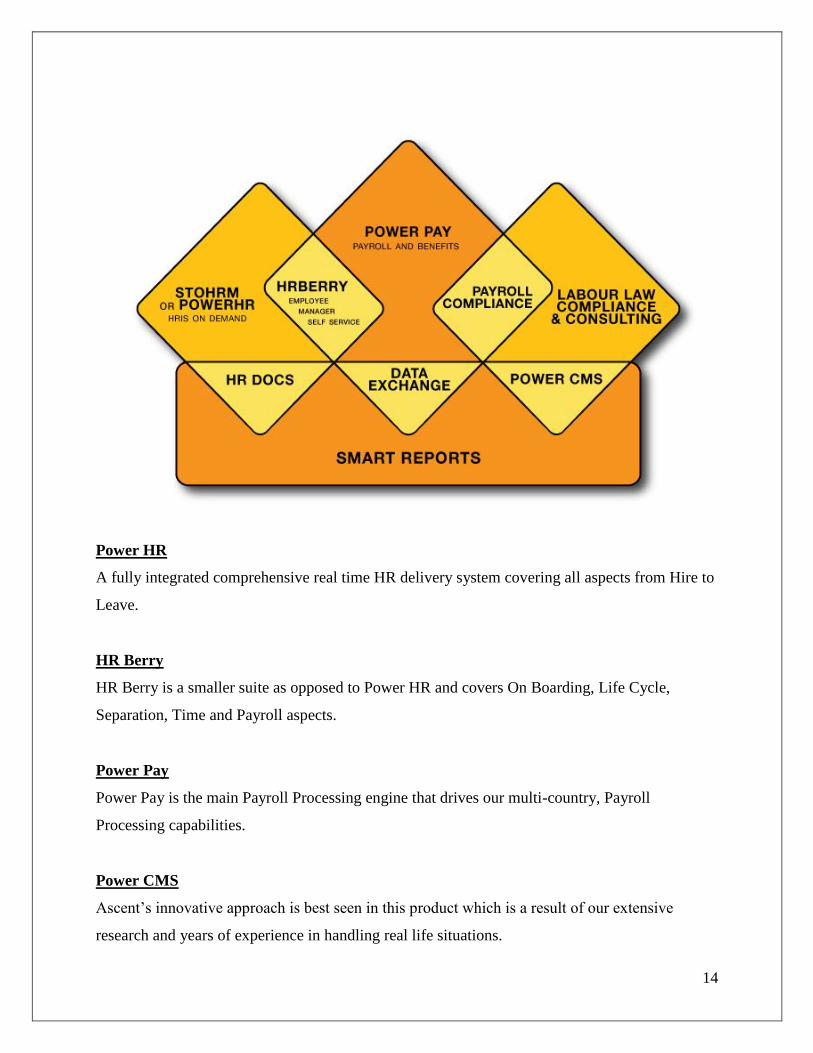
Power HR
A fully integrated comprehensive real time HR delivery system covering all aspects from Hire to
Leave.
HR Berry
HR Berry is a smaller suite as opposed to Power HR and covers On Boarding, Life Cycle,
Separation, Time and Payroll aspects.
Power Pay
Power Pay is the main Payroll Processing engine that drives our multi-country, Payroll
Processing capabilities.
Power CMS
Ascent‟s innovative approach is best seen in this product which is a result of our extensive
research and years of experience in handling real life situations.

15
Chapter 3
Theoretical background
3.1 MUTUAL FUND IN INDIA
Concept of mutual fund entered Indian financial scene way back in 1964 that was famous unit 64
later earned famed under name of US 64 had a near monopoly status for more that 2 decades.
This fund was a public sector closed ended fund that list of fund holdings are allocation of total
assets amongst various assets statements was never known to the investing public. It was only at
economic liberalization process that began after 1991 that Indian financial sector began opening
up. This it was in year 1993 the first privet sector open-ended mutual fund was launched by the
Kothari pioneer asset management company. This blue chip fund and prima fund (both equity
funds) provided first hand of competition to Unit Trust of India. Suddenly, Indian investor had
wide range of invest opportunity, were not available in pre-reforms era between 1997 to 2001
tremendous growth of Indian Mutual Fund Industry with number of players increasing and
balanced funds. Between years 1998-2001 boom in Indian stock market was led by InfoTech
companies. Huge project margins saw an unprecedented rise share prices. This was time when
some AMC launched IT sector mutual fund.
SEBI Regulations On Mutual Funds
The Government brought Mutual Funds in the Securities market under the regulatory
framework of the Securities and Exchange board of India (SEBI) in the year 1993. SEBI issued
guidelines in the year 1991 and comprehensive set of regulations relating to the organization and
management of Mutual Funds in 1993.

16
3.2 ADVANTAGES AND DISADVENTAGE OF MUTUAL FUND
ADVANTAGES OF MUTUAL FUND:
1. Portfolio Diversification: Mutual Funds invest in a well-diversified portfolio of
securities which enables investor to hold a diversified investment portfolio (whether the
amount of investment is big or small).
2. Professional Management: Fund manager undergoes through various research works
and has better investment management skills, which ensure higher returns to the investor
than what he can manage on his own.
3. Less Risk: Investors acquire a diversified portfolio of securities even with a small
investment in a Mutual Fund. The risk in a diversified portfolio is lesser than investing in
merely 2 or 3 securities.
4. Low Transaction Costs: Due to the economies of scale (benefits of larger volumes),
mutual funds pay lesser transaction costs. These benefits are passed on to the investors.
5. Flexibility: Investors also benefit from the convenience and flexibility offered by
Mutual Funds. Investors can switch their holdings from a debt scheme to an equity
scheme and vice-versa. Option of systematic (at regular intervals) investment and
withdrawal is also offered to the investors in most open-end schemes.
6. Safety: Mutual Fund industry is part of a well-regulated investment environment where
the interests of the investors are protected by the regulator. All funds are registered with
SEBI and complete transparency is force
DISADVANTAGES OF MUTUAL FUND
1. Cost control not in the Hands of an Investor: Investor has to pay investment
management fees and fund distribution costs as a percentage of the value of his
investments (as long as he holds the units), irrespective of the performance of the fund.
2. No Customized Portfolios: The portfolio of securities in which a fund invests is a
decision taken by the fund manager. Investors have no right to interfere in the decision
making process of a fund manager, which some investors find as a constraint in achieving
their financial objectives.
17
3. Difficulty in Selecting a Suitable Fund Scheme: Many investors find it difficult to
select one option from the plethora of funds/schemes/plans available
3.3 Types of Mutual Fund schemes-
A. Schemes according to Maturity Period:
A mutual fund scheme can be classified into open-ended scheme or close-ended scheme
depending on its maturity period.
Open-ended Fund/ Scheme
An open-ended fund or scheme is one that is available for subscription and repurchase on
a continuous basis. These schemes do not have a fixed maturity period. Investors can
conveniently buy and sell units at Net Asset Value (NAV) related prices which are declared on a
daily basis. The key feature of open-end schemes is liquidity.
Close-ended Fund/ Scheme
A close-ended fund or scheme has a stipulated maturity period e.g. 5-7 years. The fund is
open for subscription only during a specified period at the time of launch of the scheme.
Investors can invest in the scheme at the time of the initial public issue and thereafter they can
buy or sell the units of the scheme on the stock exchanges where the units are listed. In order to
provide an exit route to the investors, some close-ended funds give an option of selling back the
units to the mutual funds NAV related prices. SEBI Regulations stipulate that at least one of the
two exit routes is provided to the investor i.e. either repurchase facility or through listing on
stock exchanges. These mutual funds schemes disclose NAV generally on weekly basis.
B. Schemes according to Investment Objective:
A scheme can also be classified as growth scheme, income scheme, or balanced scheme
considering its investment objective. Such schemes may be open-ended or close-ended schemes
as described earlier. Such schemes may be classified mainly as follows.
18
1 Equity Funds-
Equity funds are considered to be the more risky funds as compared to other fund types,
but they also provide higher returns than other funds. It is advisable that an investor looking to
invest in an equity fund should invest for long term i.e. for 3 years or more. There are different
types of equity funds each falling into different risk bracket. In the order of decreasing risk level,
there are following types of equity funds:
Growth Funds - Growth Funds also invest for capital appreciation (with time horizon of 3
to 5 years) but they are different from Aggressive Growth Funds in the sense that they
invest in companies that are expected to outperform the market in the future. Without
entirely adopting speculative strategies, Growth Funds invest in those companies that are
expected to post above average earnings in the future.
Sector Funds: Equity funds that invest in a particular sector/industry of the market are
known as Sector Funds. The exposure of these funds is limited to a particular sector (say
Information Technology, Auto, Banking, Pharmaceuticals or Fast Moving Consumer
Goods) which is why they are more risky than equity funds that invest in multiple sectors.
Mid-Cap or Small-Cap Funds: Funds that invest in companies having lower market
capitalization than large capitalization companies are called Mid-Cap or Small-Cap Funds.
Market capitalization of Mid-Cap companies is less than that of big, blue chip companies
(less than Rs. 2500 crores but more than Rs. 500 crores) and Small-Cap companies have
market capitalization of less than Rs. 500 crores. Market Capitalization of a company can
be calculated by multiplying the market Price of the company's share by the total number
of its outstanding shares in the market. The shares of Mid-Cap or Small-Cap Companies
are not as liquid as of Large-Cap Companies which gives rise to volatility in share prices of
these companies and consequently, investment gets risky.
Equity Linked Saving Scheme- These funds are well diversified and reduce sector-specific
or company-specific risk. However, like all other funds diversified equity funds too are
exposed to equity market risk. One prominent type of diversified equity fund in India is
Equity Linked Savings Schemes (ELSS). As per the mandate, a minimum of 90% of
investments by ELSS should be in equities at all times. ELSS investors are eligible to claim
deduction from taxable income (up to Rs 1 lakh) in the past.

19
Dividend Yield Funds -The objective of Equity Income or Dividend Yield Equity Funds is
to generate high recurring income and steady capital appreciation for investors by investing
in those companies, which issue high dividends. Equity Income or Dividend Yield Equity
Funds are generally exposed to the lowest risk level as compared to other equity funds.
Gold Fund- The objective of this fund is accumulating the money at the gold rate according
to the units held by the investors. This is one of the new funds introduced. Here all the
investors will invest for the pool account of mutual fund and that amount is invested in the
gold. And according to the fluctuation of the rates of gold in the market, fund manager
invest when rates are in good rates like this profit earned from this gold fund is distributed
according to the units held by the investors
2. Debt funds-
Funds that invest in medium to long-term debt instruments issued by private
companies, banks, financial institutions, governments and other entities belonging to various
sectors (like infrastructure companies etc.) are known as Debt / Income Funds. Debt funds are
low risk profile funds that seek to generate fixed current income (and not capital appreciation) to
investors. In order to ensure regular income to investors, debt (or income) funds distribute
large fraction of their surplus to investors. Although debt securities are generally less risky than
equities, they are subject to credit risk (risk of default) by the issuer at the time of interest or
principal payment. To minimize the risk of
Default, debt funds usually invest in securities from issuers who are rated by credit rating
agencies and are considered to be of "Investment Grade". Debt funds that target high returns are
more risky. Based on different investment objectives, there can be following types of debt funds:
Diversified Debt Funds - Debt funds that invest in all securities issued by entities belonging
to all sectors of the market are known as diversified debt funds. The best feature of
diversified debt funds is that investments are properly diversified into all sectors which
results in risk reduction. Any loss incurred, on account of default by a debt issuer, is shared
by all investors which further reduces risk for an individual investor.

20
High Yield Debt funds - Understand the risk of default is present in all debt funds, and
therefore, debt funds generally try to minimize the risk of default by investing in securities
issued by only those borrowers who are considered to be of "investment grade". But, High
Yield Debt Funds adopt a different strategy and prefer securities issued by those issuers who
are considered to be of "below investment grade". The motive behind adopting this sort of
risky strategy is to earn higher interest returns from these issuers. These funds are more
volatile and bear higher default risk, although they may earn at times higher returns for
investors.
Assured Return Funds - Although it is not necessary that a fund will meet its objectives or
provide assured returns to investors, but there can be funds that come with a lock-in period
and offer assurance of annual returns to investors during the lock-in period. Any shortfall in
returns is suffered by the sponsors or the Asset Management Companies (AMCs). These
funds are generally debt funds and provide investors with a low-risk investment opportunity.
Fixed Term Plan Series - Fixed Term Plan Series usually are closed-end schemes having
short-term maturity period (of less than one year) that offer a series of plans and issue units
to investors at regular intervals. Unlike closed-end funds, fixed term plans are not listed on
the exchanges. Fixed term plan series usually invest in debt / income schemes and target
short-term investors. The objective of fixed term plan schemes is to gratify investors by
generating some expected returns in a short period.
3. Balanced Fund-
A balanced fund is one that has a portfolio comprising debt instruments, convertible
securities, and Preference equity shares. Their assets are generally held in more or less equal
proportions between debt/money market securities and equities. By investing in a mix of this
nature, balanced funds seek to attain the objectives of income, moderate capital appreciation
and preservation of capital, and are ideal for investors with a conservative and long-term
orientation.
.
21
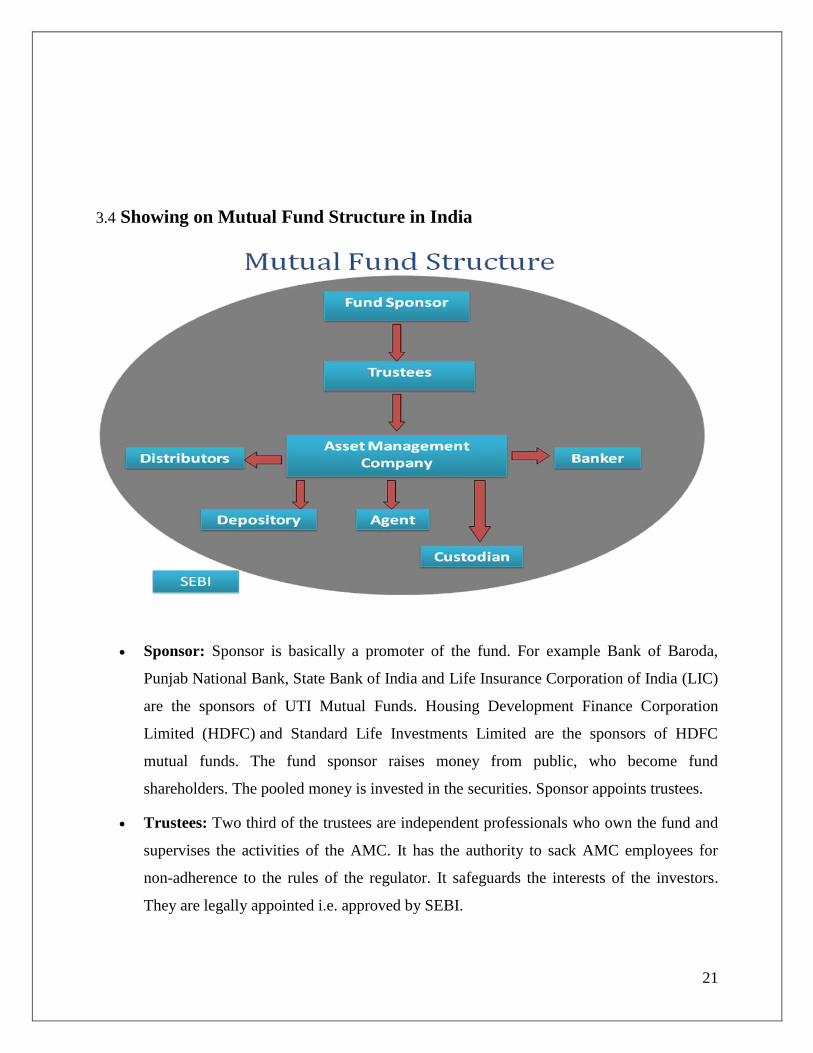
3.4 Showing on Mutual Fund Structure in India
Sponsor: Sponsor is basically a promoter of the fund. For example Bank of Baroda,
Punjab National Bank, State Bank of India and Life Insurance Corporation of India (LIC)
are the sponsors of UTI Mutual Funds. Housing Development Finance Corporation
Limited (HDFC) and Standard Life Investments Limited are the sponsors of HDFC
mutual funds. The fund sponsor raises money from public, who become fund
shareholders. The pooled money is invested in the securities. Sponsor appoints trustees.
Trustees: Two third of the trustees are independent professionals who own the fund and
supervises the activities of the AMC. It has the authority to sack AMC employees for
non-adherence to the rules of the regulator. It safeguards the interests of the investors.
They are legally appointed i.e. approved by SEBI.
22
AMC: Asset Management Company (AMC) is a set of financial professionals who
manage the fund. It takes decisions on when and where to invest the money. It doesn‟t
own the money. AMC is only a fee-for-service provider.
The above 3 tier structure of Indian mutual funds is very strong and virtually no chance
for fraud.
Custodian: A Custodian keeps safe custody of the investments (related documents of
securities invested). A custodian should be a registered entity with SEBI. If the promoter
holds 50% voting rights in the custodian company it can‟t be appointed as custodian for
the fund. This is to avoid influence of the promoter on the custodian. It may also provide
fund accounting services and transfer agent services. JP Morgan Chase is one of the
leading custodians.
Transfer Agents: Transfer Agent Company interfaces with the customers, issue a fund‟s
units, help investors while redeeming units. Provides balance statements and fund
performance fact sheets to the investors.
Flow of operation:
A Mutual Fund is a trust that pools the savings of a number of investors who share a
common financial goal. The money thus collected is then invested in capital market instruments
such as shares, debentures and other securities. The income earned through these investments
and the capital appreciation realised are shared by its unit holders in proportion to the number of
units owned by them. Thus a Mutual Fund is the most suitable investment for the common man
as it offers an opportunity to invest in a diversified, professionally managed basket of securities
at a relatively low cost. The flow chart below describes broadly the working of a mutual fund

23
3.5 Showing on Mutual Fund operation flow chart
Mutual fund schemes may be classified on the basis of:
By its maturity and
By its investment objective
By Maturity:
Open-ended Funds:
An open-end fund is one that is available for subscription all through the year. These do
not have a fixed maturity. Investors can conveniently buy and sell units at Net Asset
Value ("NAV") related prices. The key feature of open-end schemes is liquidity.
24
Closed-ended Funds:
A closed-end fund has a stipulated maturity period which generally ranging from 3 to 15
years. The fund is open for subscription only during a specified period. Investors can
invest in the scheme at the time of the initial public issue and thereafter they can buy or
sell the units of the scheme on the stock exchanges where they are listed.
In order to provide an exit route to the investors, some close-ended funds give an option
of selling back the units to the Mutual Fund through periodic repurchase at NAV related
prices. SEBI Regulations stipulate that at least one of the two exit routes is provided to
the investor.
Interval Funds
Interval funds combine the features of open-ended and close-ended schemes. They are
open for sale or redemption during pre-determined intervals at NAV related prices.
By Investment Objective:
Growth Funds:
The aim of growth funds is to provide capital appreciation over the medium to long-
term. Such schemes normally invest a majority of their corpus in equities. It has been
proven that returns from stocks, have outperformed most other kind of investments held
over the long term. Growth schemes are ideal for investors having a long-term outlook
seeking growth over a period of time.
Income Funds:
The aim of income funds is to provide regular and steady income to investors. Such
schemes generally invest in fixed income securities such as bonds, corporate debentures
and Government securities. Income Funds are ideal for capital stability and regular
income.
Balanced Funds:
The aim of balanced funds is to provide both growth and regular income. Such schemes
periodically distribute a part of their earning and invest both in equities and fixed income
securities in the proportion indicated in their offer documents. In a rising stock market,
the NAV of these schemes may not normally keep pace, or fall equally when the market

25
falls. These are ideal for investors looking for a combination of income and moderate
growth.
Money Market Funds:
The aim of money market funds is to provide easy liquidity, preservation of capital and
moderate income. These schemes generally invest in safer short-term instruments such as
treasury bills, certificates of deposit, commercial paper and inter-bank call money.
Returns on these schemes may fluctuate depending upon the interest rates prevailing in
the market. These are ideal for corporate and individual investors as a means to park their
surplus funds for short periods.
Tax Saving Schemes:
These schemes offer tax rebates to the investors under specific provisions of the Indian
Income Tax laws as the Government offers tax incentives for investment in specified
avenues. Investments made in Equity Linked Savings Schemes (ELSS) and Pension
Schemes are allowed as deduction u/s 88 of the Income Tax Act, 1961. The Act also
provides opportunities to investors to save capital gains u/s 54EA and 54EB by investing
in Mutual Funds.
Index funds: :
Index Funds invest their corpus on the specified index such as BSE Sensex, NSE index,
etc. as mentioned in the offer document. They try to mimic the composition of the index
in their portfolio. Not only are the shares, even their weight age replicated. Index funds
are a passive investment strategy and the fund manager has a limited role to play here.
The NAVs of these funds move along with the index they are trying to mimic save for a
few points here and there. This difference is called tracking error.
Special schemes:
These schemes invest only in the industries specified in the offer document. Examples
are InfoTech funds, FMCG funds, pharmacy funds, etc These scheme are mean for
aggressive and well-informed investors.
RISK V/S REWARD
Volatility in the market activity can be referred to as the risk in the mutual fund

26
investment. The sudden upward and downward sentiments of the markets and individual issues
can be attributed to several key factors. These factors comprise:
Inflation
Interest rate changes
General economic scenario
The aforementioned factors are the main cause of worry amongst the investors. Most of the
investors fear that the value of the stock they have invested will fall considerably. However, it is
here one can notice its reward angle. It is this element of volatility that can also bring them
substantial long-term return in comparison to a savings account.
3.6 BEST MUTUAL FUNDS IN INDIA
Before knowing about the best mutual fund in India. It is important to know the
factors that actually decide their fate in the market. In order to get an actual ideal of the best
performing mutual funds in the market, one need to track its current Net Asset Value or NAV.
NAV stands for the latest market value of the holdings of a fund that brings down the fund's
liabilities, which are generally indicated in terms of per share amount. On a daily basis, most of
the funds' NAV is decided. This is determined after the trade closes on certain financial
exchanges. The net asset value of the mutual funds is ascertained at the end of the trading day.
An increase in NAV signifies rise in the holdings of the shareholder. The Fund Firm will then do
the transaction on the shares along with the sales fees. While open-ended net asset value of the
mutual funds is issued daily, the close-ended NAV of the mutual fund is released on a weekly
basis. You can calculate net asset value of the mutual fund easily. Track the latest market value
of the net assets of the fund and then subtract that by the number of outstanding shares.
Top mutual funds in India
Here are some of the top mutual funds in India that are listed below:
Reliance Mutual Fund.
The DSP ML Tiger Fund.
SBI Magnum Contra Fund.
HDFC Equity Fund.

27
Prudential ICICI mutual Fund.
SBI Mutual Fund.
3.7 Some facts for the growth of mutual fund industry in India:
a) 100% growth in the last 6 years.
b) Numbers of foreign AMC‟s are in the queue to enter the Indian markets like Fidelity
Investments, US based, with over US$1trillion assets under management worldwide.
c) Our saving rate is over 23%, highest in the world. Only channelizing these savings in
mutual funds sector is required.
d) We have approximately 37 mutual funds which are much less than US having more than
800. There is a big scope for expansion.
e) 'B' and 'C' class cities are growing rapidly. Today most of the mutual funds are
concentrating on the 'A' class cities. Soon they will find scope in the growing cities.
f) Mutual fund can penetrate rural like the Indian insurance industry with simple and
limited products
g) SEBI allowing the MF's to launch commodity mutual funds.
h) Emphasis on better corporate governance.
i) Trying to curb the late trading practices.
j) Introduction of Financial Planners who can provide need based advice.
The Indian mutual funds business is expected to grow significantly in the coming years
due to a high degree of transparency and disclosure standards comparable to anywhere in the
world, though there are many challenges that need to be addressed to increase net mobilization of
funds in this sector, as said by Mr. A.P. Kurian, Chairman of the Association of Mutual Funds of
India.

28
Indian Mutual fund industry exhibited 200% growth in the last 10 yrs from Rs.470 billion to
Rs1400 billion in terms of assets under management. The Mutual Funds industry is expected to
jump sharply from its present share of 6% of GDP to 40% in the next 10yrs provided the
country‟s growth rate is consistently above 6%. The growing investor preference for mutual
funds has resulted in the assets under management of mutual funds growing 8-folds in last 5 yrs.
Number of foreign AMC's are in the queue to enter the Indian markets like US based Fidelity
Investments, with over US$1trillion assets under management worldwide. Our saving rate is over
23%, highest in the world. Only channelling these savings in mutual funds sector is required.
There is a big scope for expansion as we have 37 mutual funds which is much less than US
having more than 800.
3.8 Role of mutual fund in stock exchange:
Mutual funds are an ideal vehicle for investment by retail investors in the stock market for
several reasons.
a) It pools investments of small investors together increasingly thereby the participation in the
stock market.
b) Mutual funds being institutional investors, can invest in market analysis generally not
available or accessible to individual investors, providing therefore informed decisions to
small investors.
c) Mutual fund can diversify the portfolio in better way as compared with individual investors
due to the expertise and availability of funds.
29
Chapter 4
ANALYSIS AND INTERPRETATION OF DATA
The analysis and interpretation of data covers an overview of the Mutual fund segment, other
related data with percentage and narrative data, supported by charts and tables form the
information collected during the project study.
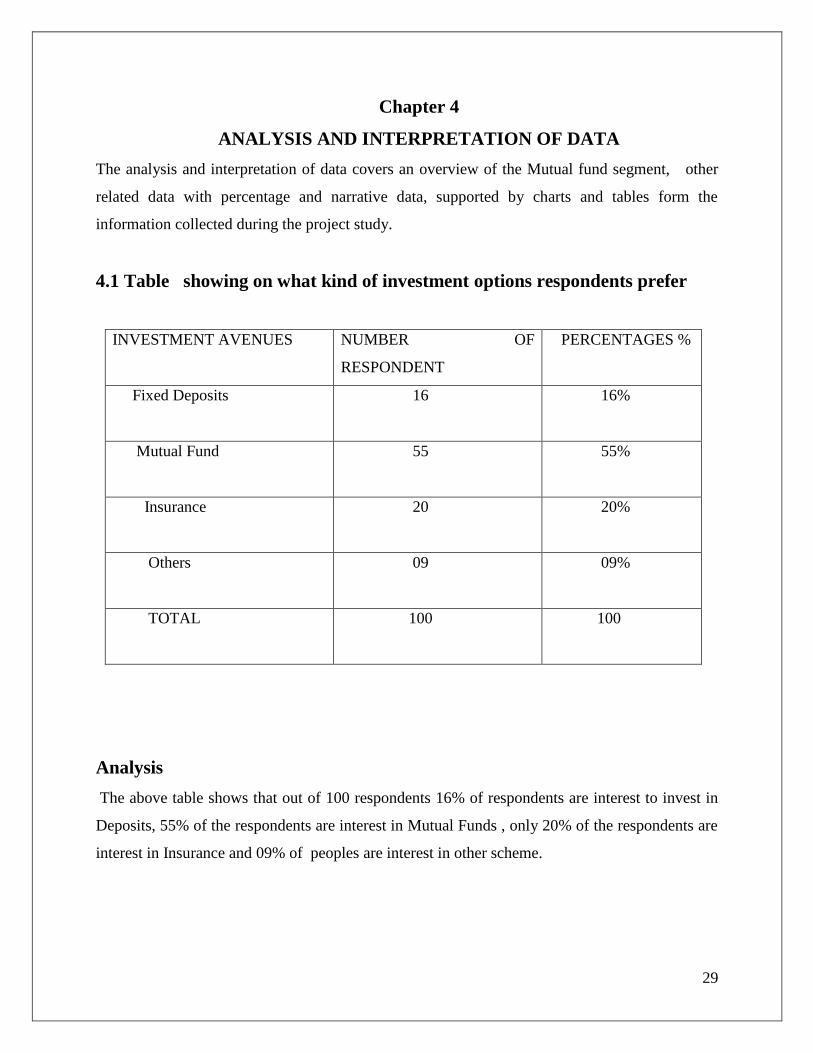
4.1 Table showing on what kind of investment options respondents prefer
INVESTMENT AVENUES
NUMBER OF
RESPONDENT
PERCENTAGES %
Fixed Deposits
16 16%
Mutual Fund
55 55%
Insurance
20 20%
Others
09 09%
TOTAL
100 100
Analysis
The above table shows that out of 100 respondents 16% of respondents are interest to invest in
Deposits, 55% of the respondents are interest in Mutual Funds , only 20% of the respondents are
interest in Insurance and 09% of peoples are interest in other scheme.
30
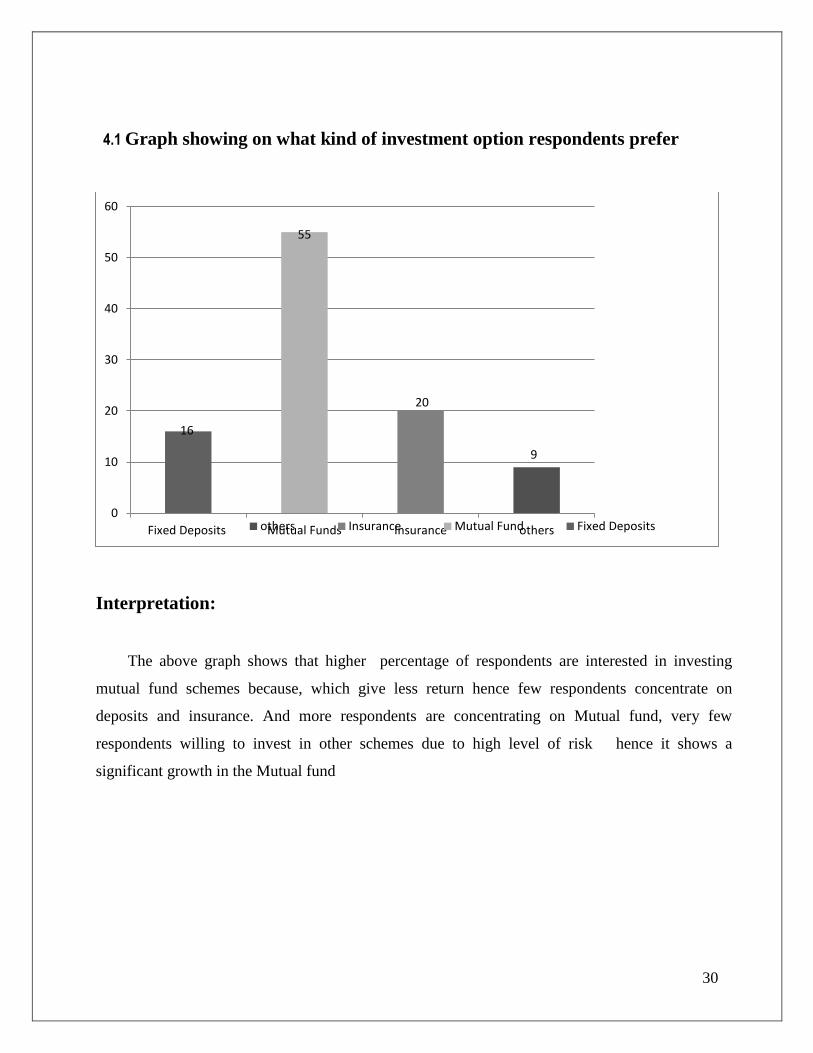
4.1 Graph showing on what kind of investment option respondents prefer
Interpretation:
The above graph shows that higher percentage of respondents are interested in investing
mutual fund schemes because, which give less return hence few respondents concentrate on
deposits and insurance. And more respondents are concentrating on Mutual fund, very few
respondents willing to invest in other schemes due to high level of risk hence it shows a
significant growth in the Mutual fund
16
55
20
9
0
10
20
30
40
50
60
Fixed Deposits Mutual Funds Insurance othersothers Insurance Mutual Fund Fixed Deposits
31
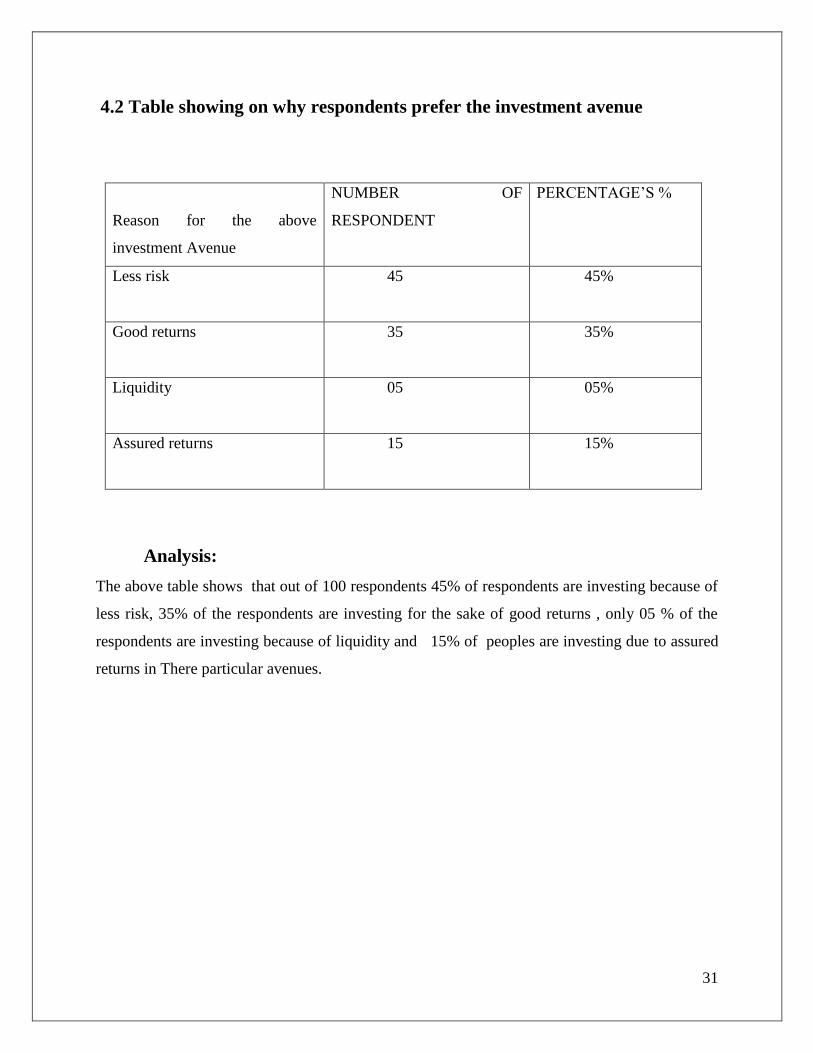
4.2 Table showing on why respondents prefer the investment avenue
Reason for the above
investment Avenue
NUMBER OF
RESPONDENT
PERCENTAGE‟S %
Less risk
45 45%
Good returns
35 35%
Liquidity
05 05%
Assured returns
15 15%
Analysis:
The above table shows that out of 100 respondents 45% of respondents are investing because of
less risk, 35% of the respondents are investing for the sake of good returns , only 05 % of the
respondents are investing because of liquidity and 15% of peoples are investing due to assured
returns in There particular avenues.
32
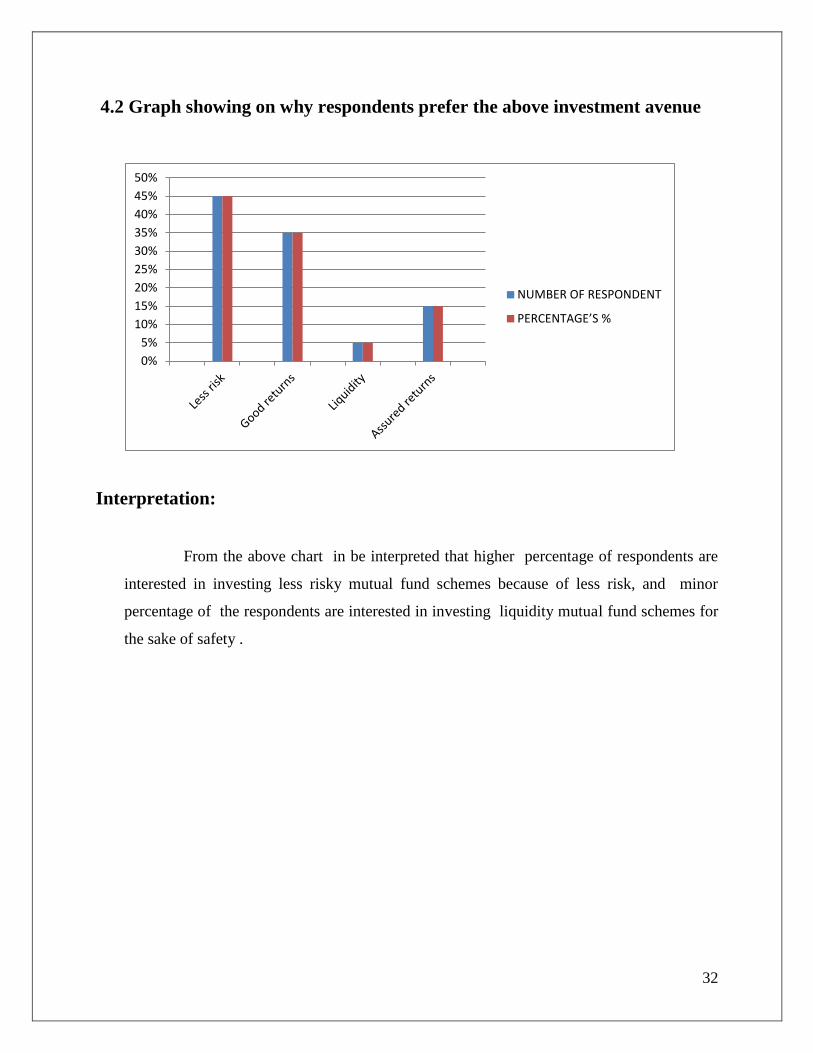
4.2 Graph showing on why respondents prefer the above investment avenue
Interpretation:
From the above chart in be interpreted that higher percentage of respondents are
interested in investing less risky mutual fund schemes because of less risk, and minor
percentage of the respondents are interested in investing liquidity mutual fund schemes for
the sake of safety .
0%
5%
10%
15%
20%
25%
30%
35%
40%
45%
50%
NUMBER OF RESPONDENT
PERCENTAGE’S %

33
4.3 Table showing current investment portfolio:
Current portfolio
NUMBER OF
RESPONDENTS
PERCENTAGE‟S %
Govt. securities and Bonds
30 30%
Mutual funds & fixed deposits 52 52%
Equity
13 13%
Other options
05 05%
Analysis :
The above table shows that 52% of mutual fund & fixed deposits respondents received
good return in equity and 30% of govt securities and bonds respondents are not received good
return in equity 13%. So the opinion of the customers relating to the company is good. The
company as to give more importance to satisfaction of the customers.

34
4.3 Graph showing on current investment portfolio:
Interpretation:
From the above chart shows that higher percentage of respondents are interested in investing
in less risky mutual fund schemes because of mutual fund fixed deposits, and minor percentage
of the respondents are interested in investing other options mutual fund schemes for the sake of
safety

35
4.4 Table showing on the awareness of mutual funds.
AWARENES OF MUTUAL
FUND
NUMBER OF
RESPONDENT
PERCENTAGES %
Yes
85 85%
No
15 15%
Total
100 100
Analysis:
From the above table showing mutual fund awareness of the respondents out of 100%. Most
of them are known about the mutual Fund, 85% of the respondents are having knowledge about
mutual fund only few people are not aware of mutual Fund i.e. only 15%

36
4.4 Graph showing on the awareness of mutual funds.
Interpretation
From the above chart showing Mutual Fund awareness of the respondents while conducting
survey was choose most of the post graduate and graduate since all those people having good
knowledge of mutual fund. Hence chart shows majority of the respondents are having aware of
mutual fund and remaining respondents are not aware of mutual funds.
0
10
20
30
40
50
60
70
80
90
YesNo
85
15 Yes
No
37
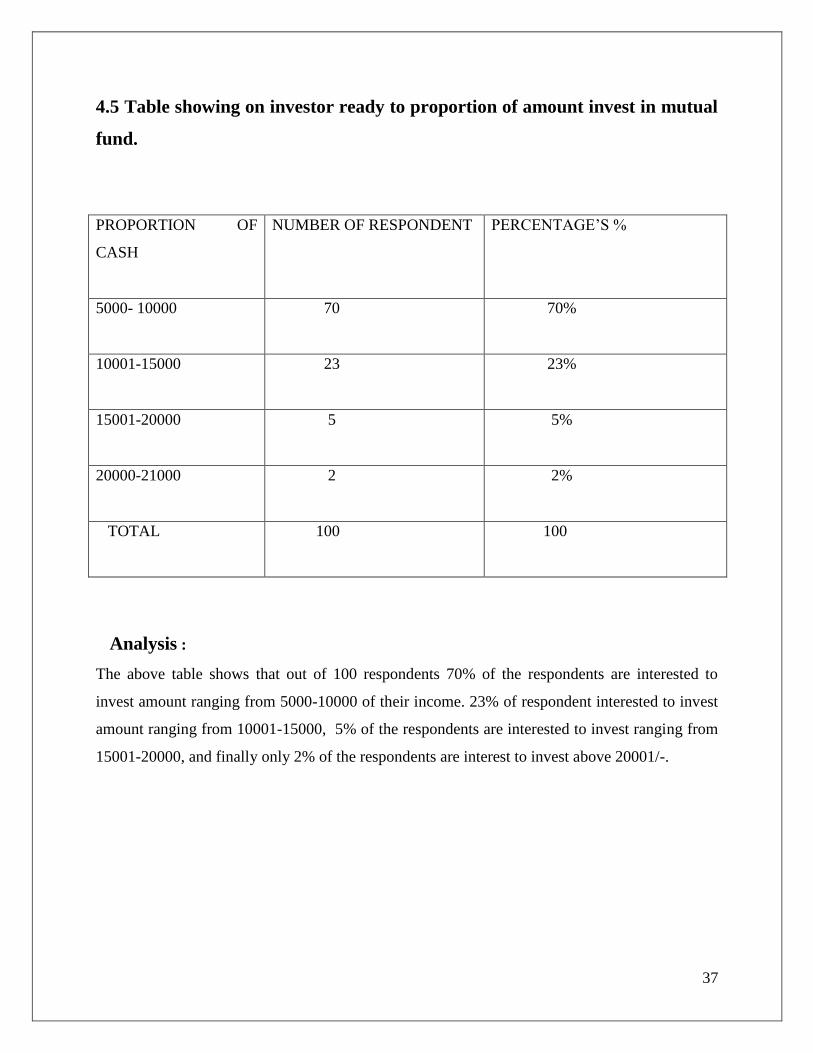
4.5 Table showing on investor ready to proportion of amount invest in mutual
fund.
PROPORTION OF
CASH
NUMBER OF RESPONDENT PERCENTAGE‟S %
5000- 10000
70 70%
10001-15000
23 23%
15001-20000
5 5%
20000-21000
2 2%
TOTAL
100 100
Analysis :
The above table shows that out of 100 respondents 70% of the respondents are interested to
invest amount ranging from 5000-10000 of their income. 23% of respondent interested to invest
amount ranging from 10001-15000, 5% of the respondents are interested to invest ranging from
15001-20000, and finally only 2% of the respondents are interest to invest above 20001/-.

38
4.5 Graph showing on Investor ready to proportion of amount invests in
Mutual fund.
Interpretation:
From the above chart showing a graph shows maximum that is 70
respondents are interested to invest the amount ranging from 5000-10000, And some
others are interested ranging from 10001-15000, and very few i.e. 5 the respondents are
interest to invest ranging from 15001-20000, and finally 2 the respondents are interest to
invest above 20001/-.
70
23
5 2
0
10
20
30
40
50
60
70
80
5000-10000 10001-15000 15001-20000 20001-Above
20001-Above
15001-20000
10001-15000
5000-10000

39
4.6 Table showing respondent’s interest to the area investor in mutual fund.
INVESTMENT
NUMBER OF RESPONDENT PERCENTAGES %
Yes
68 68%
No
32 32%
Total
100 100
Analysis:
The above table shows that out of 100 respondents 68% of the respondents are invested in
various mutual fund schemes, only 32% of the respondents have not made their investment in
mutual funds.

40
4.6 Graph showing respondent’s interest to the area investor in mutual fund.
Interpretation:
From the above graph shows maximum that is majority of respondents are interested to invest
the amount interest to the area investor in mutual fund And some others are interested in mutual
fund, and very higher of the respondents are interest to invest. Very few of the respondents are
interest to invest in mutual fund.
41
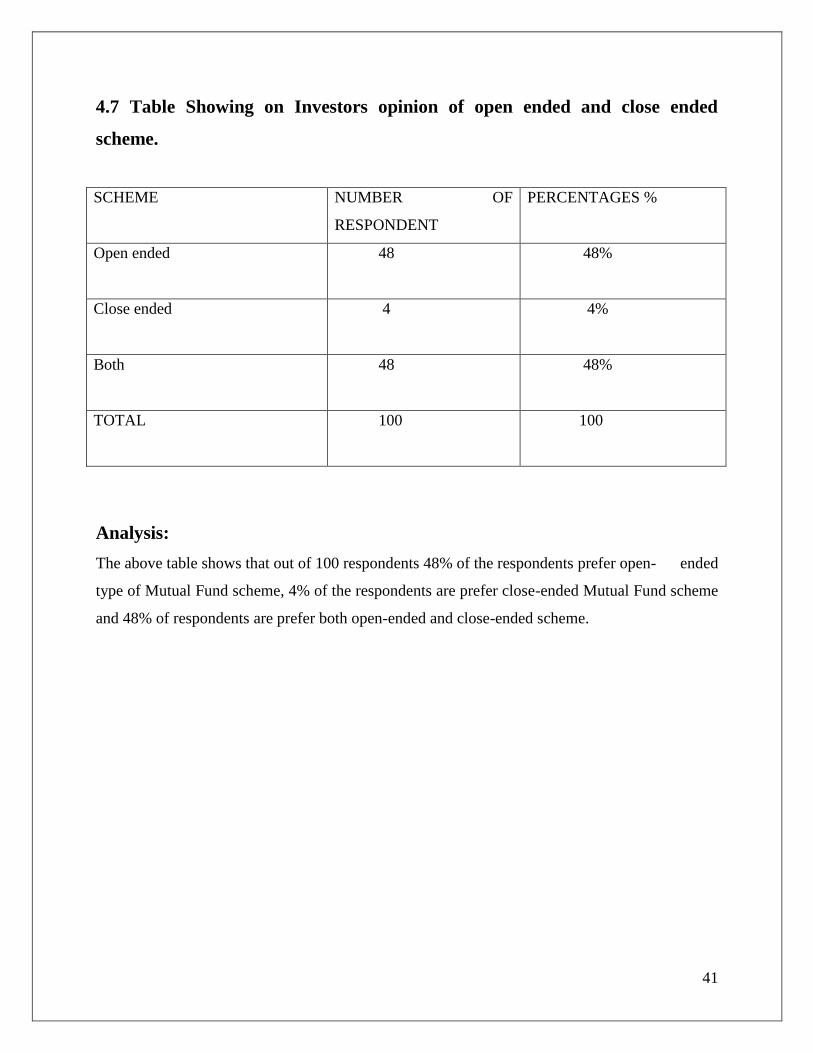
4.7 Table Showing on Investors opinion of open ended and close ended
scheme.
SCHEME
NUMBER OF
RESPONDENT
PERCENTAGES %
Open ended
48 48%
Close ended
4 4%
Both
48 48%
TOTAL
100 100
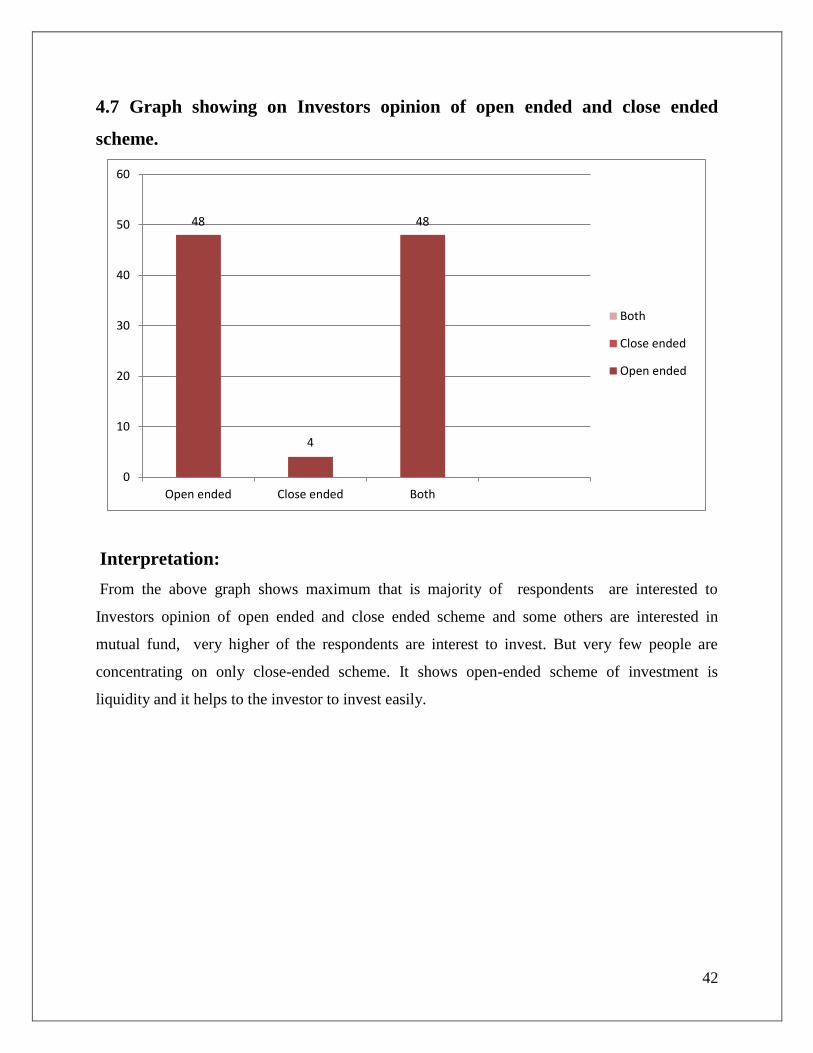
Analysis:
The above table shows that out of 100 respondents 48% of the respondents prefer open- ended
type of Mutual Fund scheme, 4% of the respondents are prefer close-ended Mutual Fund scheme
and 48% of respondents are prefer both open-ended and close-ended scheme.
42
4.7 Graph showing on Investors opinion of open ended and close ended
scheme.
Interpretation:
From the above graph shows maximum that is majority of respondents are interested to
Investors opinion of open ended and close ended scheme and some others are interested in
mutual fund, very higher of the respondents are interest to invest. But very few people are
concentrating on only close-ended scheme. It shows open-ended scheme of investment is
liquidity and it helps to the investor to invest easily.
48
4
48
0
10
20
30
40
50
60
Open ended Close ended Both
Both
Close ended
Open ended

43
4.8 Table showing on schemes preferred by the investors:
SCHEME
NUMBER OF
RESPONDENT
PERCENTAGES %
Equity
36 36%
Debt
24 24%
Balanced
40 40%
TOTAL
100 100
Analysis:
The above table shows that out of 100 respondents 36% of the respondents prefer Equity type of
scheme, 24% of the respondents are prefer Debt scheme and 40% of respondents are prefer
Balanced scheme.

44
4.8 Graph showing this graph showing on schemes preferred by the investors:
Interpretation:
From the above chart showing It is clear from the out of 100 respondents 36 the respondents
prefer Equity type of scheme, 24 the respondents are prefer Debt scheme and 40 of respondents
are prefer Balanced scheme.
4.9 Table showing on while buying a mutual fund.
SCHEME
NUMBER OF
RESPONDENT
PERCENTAGES %
YES
90 90%
NO
10 10%
TOTAL 100 100
Series1
Series2
0
5
10
15
20
25
30
35
40
1 2 3 4 5 6
36
24
40
Series1
Series2

45
Analysis:
The above table shows that out of 100 respondents for making an investment 90% of the
respondents prefer the brand name to invest, only 10% of the respondents do not prefer brand
name for making an investment.
4.9 Graph showing on while buying a Mutual Fund.
Interpretation:
From the above chart showing high 90 by respondents prefer brand name by denoted buying
decision mutual fund and equity share prefer more and more brand it is level 10 of the
respondent‟s mutual funds I have to discuss about mutual currier growth. Brand which is
acquired good brand investor.

46
4.10 Table showing on Number of investor contact while investing.
PARTICULAR
NUMBER OF
RESPONDENT
PERCENTAGES %
Personal Banker
18 18%
Online Trader
33 33%
Stock Broker
22 22%
Deals directly
27 27%
TOTAL
100 100
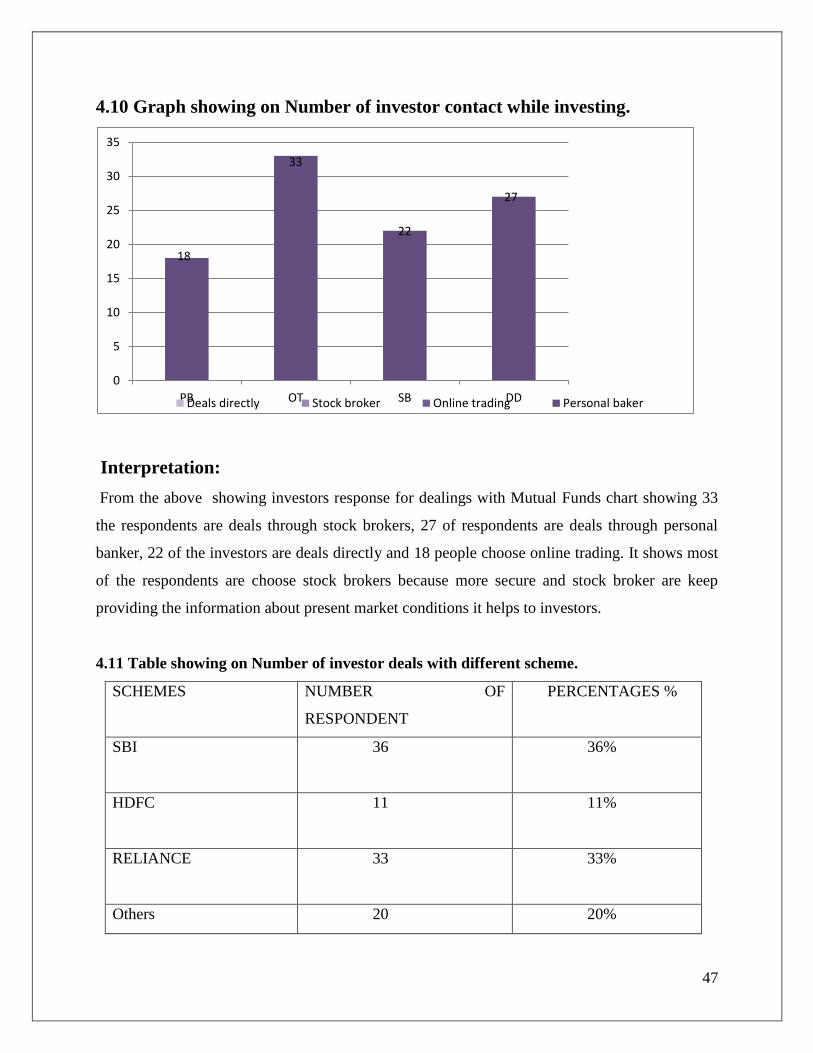
Analysis :
From the above table showing investors response for while deals with Mutual Fund out of 100
people 18% of the respondent are deals through personal banker, 33% of the respondents are
deals through online trading, 22% are deals through stock brokers and 27% people are deals
directly.
47
4.10 Graph showing on Number of investor contact while investing.
Interpretation:
From the above showing investors response for dealings with Mutual Funds chart showing 33
the respondents are deals through stock brokers, 27 of respondents are deals through personal
banker, 22 of the investors are deals directly and 18 people choose online trading. It shows most
of the respondents are choose stock brokers because more secure and stock broker are keep
providing the information about present market conditions it helps to investors.
4.11 Table showing on Number of investor deals with different scheme.
SCHEMES
NUMBER OF
RESPONDENT
PERCENTAGES %
SBI
36 36%
HDFC
11 11%
RELIANCE
33 33%
Others 20 20%
18
33
22
27
0
5
10
15
20
25
30
35
PB OT SB DDDeals directly Stock broker Online trading Personal baker

48
TOTAL
100 100
Analysis :
From the above table showing the different scheme of Mutual Fund out 100 respondents 36%
of the investor choose SBI Mutual Fund, and 33% are choose Reliance mutual funds, 20% of the
respondents are choose Others MF, and 11% of the investors are choose HDFC.

49
4.11 Graph showing on Number of investor deals with different scheme
Interpretation:
From the above chart clearly showing most of the investors are preferred to invested in SBI
Mutual Fund i.e. 36, And 33 of the investor are prefer to invest in RELIANCE Mutual Fund.
20 of the respondents prefer other Mutual Fund. And finally 11 of the respondents are
concentrate on HDFC Mutual Funds when we analyze these data it shows more number of
investor are prefer to invest SBI and RELIANCE because it shows Brand Name as well as good
returns and liquidity.
0
5
10
15
20
25
30
35
40
SBIHDFC
RELIANCE Others
36
11
33
20
Others
RELIANCE
HDFC
SBI
50
4.12 Table showing on Trade option Preferred by investor
Analysis:
From the above table it is provide that out of 100 respondents. 46% of respondents are long term
investor, 38% of the respondent is medium term investor, and finally 16% of respondent are
short term investor.
TRADE OPTION
NUMBER OF
RESPONDENT
PERCENTAGES %
Short term
16 16%
Medium term
38 38%
Long term
46 46%
TOTAL
100 100

51
4.12 Graph showing on Trade option Preferred by investor.
Interpretation:
From the above chart shows that most of the respondents are long term investor i.e. 46, and 38
the respondents are medium term investors And only few i.e. 16 are short term investor.
4.13 Table showing on Objective behind trading in Mutual Fund.
OBJECTIVE
NUMBER OF
RESPONDENT
PERCENTAGE %
For diversified the portfolio
28 28%
For Higher return
36 36%
Monthly Income
16 16%
Tax Benefit
20 20%
16
38
46
TRADE OPTION
Short term
Mediumterm

52
TOTAL
100 100
Analysis :
From the above table shows why investors are trade or choose mutual fund as a best scheme of
investment out of 101 respondents. 36% respondents are prefer to mutual fund for high return,
28% of the respondents are prefer mutual fund for diversified the income, and 20% of the
respondents are prefer for tax benefit and finally 16% of the respondents are prefer for monthly
Income.
4.13 Graph showing on Objective behind trading in Mutual Fund.
28
36
16
20
0
5
10
15
20
25
30
35
40
DP HR MI TB
Tax benefit
Monthly income
High return
Diversifide portfolio

53
Interpretation:
Form the above chart showing why investor is choosing mutual fund as a good option of
investment. It is clearly showing more number of investor is interested to invest in Mutual Fund
because of high return i.e.36. and 28 of investor are prefer to invest in Mutual Fund for
diversified the portfolio of their income, 20 of the respondents prefer for tax benefit. And finally
16 of the respondents are choosing Mutual fund because of monthly income.
4.14 Table showing on percentage of return expect in Mutual Fund.
INCOME EXPECT NUMBER OF RESPONDENT PERCENTAGES %
10% -15%
56 56%
16%-20%
21 21%
21%-25%
15 15%
26 & Above
8 8%
TOTAL
100 100
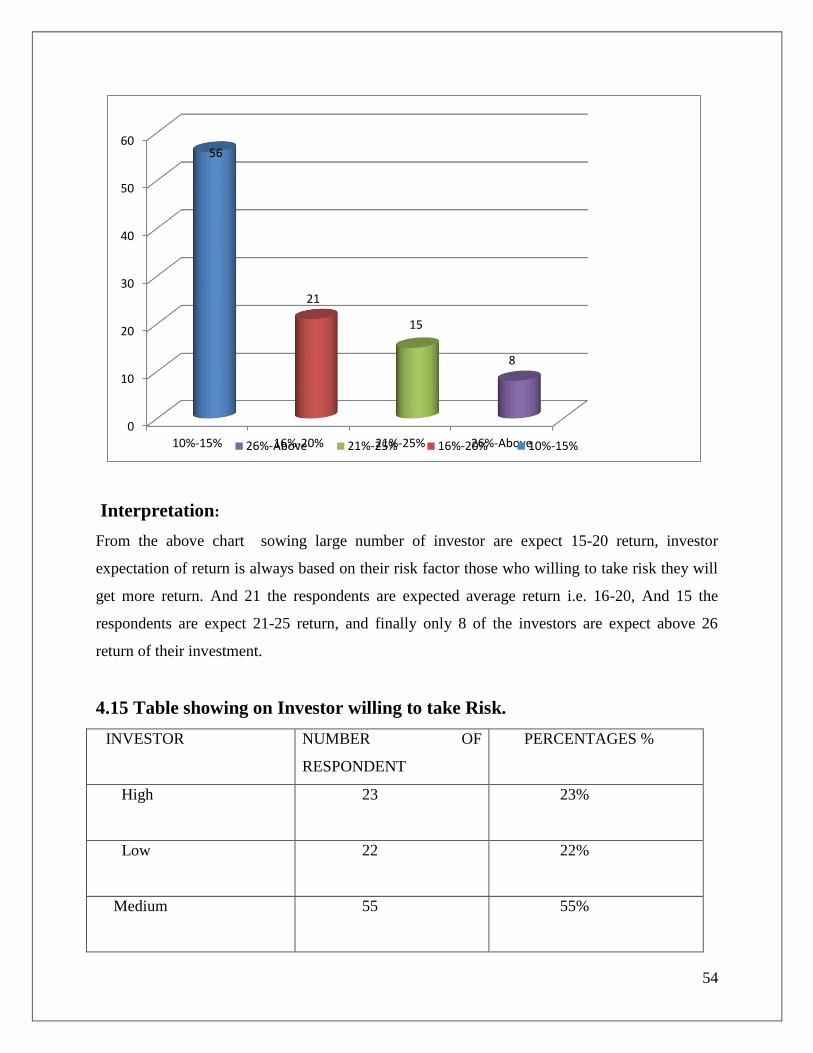
Analysis:
The above table showing investor expectation or return of the mutual fund. 56% of respondents
are expect 10% - 15% return, , and 21% of the respondents are expect 16%-20% return, and 15%
of the respondents are expect 21%-25% of return. And finally only 8% of respondents are expect
above 26% of return.
4.14 Graph showing on percentage of return expect in Mutual Fund.
54
Interpretation:
From the above chart sowing large number of investor are expect 15-20 return, investor
expectation of return is always based on their risk factor those who willing to take risk they will
get more return. And 21 the respondents are expected average return i.e. 16-20, And 15 the
respondents are expect 21-25 return, and finally only 8 of the investors are expect above 26
return of their investment.
4.15 Table showing on Investor willing to take Risk.
INVESTOR
NUMBER OF
RESPONDENT
PERCENTAGES %
High
23 23%
Low
22 22%
Medium
55 55%
0
10
20
30
40
50
60
10%-15% 16%-20% 21%-25% 26%-Above
56
21
15
8
26%-Above 21%-25% 16%-20% 10%-15%

55
TOTAL
100 100
Analysis:
The above table shows risk factor of the investor, out 100 respondents 23% of the respondents
are high risk‟s taker , 55% of the medium risk‟s taker, and 22% of respondents are low risk‟
4.15 Graph showing on Investor willing to take Risk.
Interpretation:
From the above chart showing large number of investors are take medium risk i.e. 55, And 23 of
investor are willingly ready to take risk these persons will get more return. And 22 of the
respondents are takes low risk
23
22
55
RISK FACTOR
High Risk
Low Risk
Medium Risk

56
4.16 Table showing on Opinion about RELIANCE Mutual Fund.
OPINION
NUMBER OF
RESPONDENT
PERCENTAGE %
Excellent
3 3%
Good
53 53%
Moderate
27 27%
Not aware
17 17%
TOTAL
100 100
Analysis :
From the above table showing investors opinion of the RELIANCE MUTUAL FUND. 3% of
investor are saying excellent, 53% of the respondents are say‟s good, 27% of the respondents are
say‟s moderate, And 17% of the respondents are not aware of mutual fund

57
4.16 Graph showing on Opinion about RELIANCE Mutual Fund.
Interpretation
From the above chart showing investor opinion with RELIANCE Mutual fund. While investor
investing with reliance MF they rates the Securities. 3 respondents are rates excellent. Most of
the respondents are rates good, and 55 the respondents are rates fair, And 18 of the respondents
thought poor securities.
4.17 Table showing on Investment motive with Reliance Mutual fund.
INVESTMENT MOTIVE
NUMBER OF
RESPONDENT
PERCENTAGES %
Excellent
3 3%
Good
55 55%
Fair
40 40%
0
0.2
0.4
0.6
0.8
1
1.2
1 2 3 4 5 6 7 8 9
3%
53%
27%
17%
PERCENTAGE %
NUMBER OFRESPONDENT
OPINION

58
Poor
2 2%
TOTAL
100 100
Analysis :
From the above table showing investment motive with RELIANCE MF. 3% of the respondents
are rates excellent securities, 55% of the respondents are rates good, 40% of the respondents
rates fair, and finally 2% of the respondents are rates poor.
4.17 Graph showing on Investment motive with Reliance mutual fund.
Interpretation:
From the above chart showing investor motive with RELIANCE Mutual fund. While investor
investing with reliance MF they rates the Securities. 3 respondents are rates excellent. most of
the respondents are rates good, and 40 the respondents are rates fair, And 2 the respondents
thought poor security
0
10
20
30
40
50
60
Excellent Good Fair Poor
3
55
40
2
Poor Fair Good Excellent
59
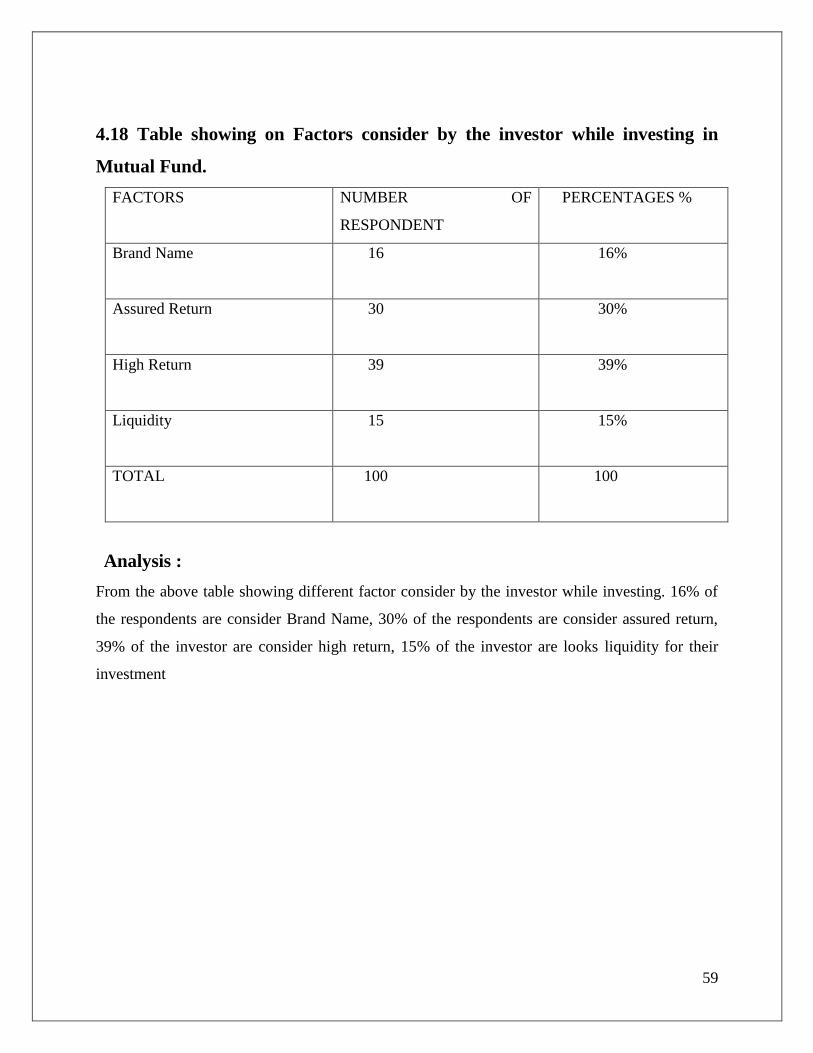
4.18 Table showing on Factors consider by the investor while investing in
Mutual Fund.
FACTORS
NUMBER OF
RESPONDENT
PERCENTAGES %
Brand Name
16 16%
Assured Return
30 30%
High Return
39 39%
Liquidity
15 15%
TOTAL
100 100
Analysis :
From the above table showing different factor consider by the investor while investing. 16% of
the respondents are consider Brand Name, 30% of the respondents are consider assured return,
39% of the investor are consider high return, 15% of the investor are looks liquidity for their
investment

60
4.18 Graph showing on Factors consider by the investor while investing in
Mutual Fund
Interpretation:
From the above chart showing most number of the investor are consider high return while they
are investing i.e. 39 the respondents. And 30 the respondents are considered assured return, and
16 the respondents are considered brand name, and few respondents are considered liquidity. 15
the investor are looks liquidity for their investment
While investing in Mutual Fund most of the respondents are looks High Return its common but
high returns is always depend on risk factor. Some others are considered Assured Return, Brand
Name, and Liquidity.
16
30
39
15
0
5
10
15
20
25
30
35
40
45
BN AR HR LTLiquidity Hihg Return Assured Return Brand Name

61
Chapter 5
FINDINGS CONCLUSION & SUGGESTIONS:
5.1 FINDINGS:
16% of respondents are interested to invest in fixed Deposits, 55% of the respondents are
interested in Mutual Funds, only 20% of the respondents are interested in Insurance and
09% of peoples are interested in other scheme.
45% of respondents are investing because of less risk, 35% of the respondents are
investing for the sake of good returns , only 05 % of the respondents are investing
because of liquidity and 15% of peoples are investing due to assured returns in There
particular avenues.
In that case higher percentage of respondents are interested in investing in less risky
mutual fund schemes because of mutual fund fixed deposits, and minor percentage of
the respondents are interested in investing other options mutual fund schemes for the sake
of safety
most of the respondents know about the mutual Fund, 85% of the respondents are
having knowledge about mutual fund only few people are not aware of mutual Fund i.e.
only 15%
70% respondents are interested to invest the amount ranging from 5000-10000, And
some others are interested ranging from 10001-15000, and 5 the respondents are interest
to invest ranging from 15001-20000, and finally 2 the respondents are interest to invest
above 20001/-.
68% of the respondents have invested in various mutual fund schemes,
48% of the respondents prefer open- ended type of Mutual Fund scheme, 4% of the
respondents are prefer close-ended Mutual Fund scheme and 48% of respondents are
prefer both open-ended and close-ended scheme.
36% of the respondents prefer Equity type of scheme, 24% of the respondents are prefer
Debt scheme and 40% of respondents are prefer Balanced scheme.
Investment 90% of the respondents prefers the brand name to invest, only 10% of the
respondents do not prefer brand name for making an investment.

62
Out of 100 people surveyed 33% the respondents are deals through stock brokers, , 27%
of respondents are deals through personal banker, 22% of the investors are deals directly
and 18% people choose online trading.
It is found that from the preference towards mutual funds is more towards ICICI and SBI
as many investors are selected for their investment ICICI and SBI scheme.
46% are long term investor and 38% the respondents are medium term investors and
only 16% are short term investor.
Out of 100 people surveyed 36% respondents are prefer to mutual fund for high return,
28% of the respondents are prefer mutual fund for diversified the income, and 20% of the
respondents are prefer for tax benefit and finally 16% of the respondents are prefer for
monthly Income.
56% of respondents are expect 10% - 15% return, , and 21% of the respondents are
expect 16%-20% return, and 15% of the respondents are expect 21%-25% of return. And
finally only 8% of respondents are expect above 26% of return.
During conduct survey investor are choose Mutual Fund scheme is best avenue because
of less risk very less respondents are concentrate on debenture.
Out of 100 people surveyed RELIANCE MUTUAL Fund. 3% of investor are saying
excellent, 53% of the respondents are say‟s good, 27% of the respondents are say‟s
moderate, And 17% of the respondents are not aware of mutual fund
16% of the respondents are consider Brand Name, 30% of the respondents are consider
assured return, 39% of the investor are consider high return, 15% of the investor are
looks liquidity for their investment

63
5.2 CONCLUSION:
The study on analysis of mutual fund performance in India”. From the study it can be concluded
that most of the investors are aware of the Reliance mutual fund.
It can be conclude that the mutual fund is still in infant stage. The growth is still vast. Since
Indian investors are very sensitive towards investing in high risk funds. Investment in mutual
funds is still not reached into the hands of all investors. Most of the investors are not having a
clear picture of the mutual fund‟s benefits. But this trend is slowing down in a gradual process.
More and more investors are showing much interest towards the mutual funds the coming year
are going to be ruled by the mutual funds.
5.3 SUGGESTIONS:
• The institute should try to create awareness of the new product and new schemes of the
existing products as some of the respondents are unaware of new scheme and new products. So
seminar, presentations participating in fairs and exhibition, hosting local events prove to be the
best way for promoting itself.
• As print media is very popular among the Govt, employees. So the bank should try to use
this media to create awareness of its existence and about the new product available in the market.
• Free consultation counters should be provided in the bank. So as to attract more
customers and also to build good customer relations, this is key to success.
• The bank should first try to introduce its products and services to the consultants of the
city. So that many later suggestions the same clients. The bank can also influence these
consultants by giving them its franchise.
• Excellent advertisement can be entertained so that people will get interest in Mutual
Fund.
• Good campaigns can be arranged so that people will know more about Mutual Fund and
will tend to invest in it.
• As the study shows more people are able to take moderate risk so this time the company
should promote risk products in to the market.

64

BIBLIOGRAPHY
Books Referred:
1 S.Anand and Dr. V. Murugaiah, Mutual Funds In India, JIMS 8M, September 2004
2 Cooper and Schindler, Business Research Methods, eighth edition
3 Frank K. Reilly and Keith C. Brown, Investment Analysis and Portfolio Management
Websites:
https://www.ascent-online.com
www.amfiindia.com
www.mutualfundsindia.com
www.mutualfundanalysis.com
www.investsmartindia.com
www.personalfn.com
www.finance.yahoo.com

ANNEXURE
QUESTIONNAIRE
Dear Sir/Madam,
I am Gunashekhara I S a student of “New Horizon College of Engineering” - MBA Program,
final year MBA (Finance) doing a project in Ascent Consulting Pvt. Ltd., Bangalore which is
an important part of my curriculum.
The topic of my project is “A Study on analysis of mutual fund performance in India with
reference to Ascent Consulting Pvt. Ltd.”
I need some important information from you for the completion of my project.
Would you please spare sometime to answer my queries. I assure you that your answers will be
kept confidential and will be used for the academic purpose only.
1. Name of the responding ………………………………………………………………..
2. Address and phone no………………………………………………………………
……………………………………………………………………………………….
3. Age group.
21-30( ), 31-45( ), 45-60( ),
4. What kind of investment options you prefer?
A) Fixed Deposit ( )
B) Mutual Fund ( )
C) Insurance ( )
D) Other ( )
5. Why you prefer the available option ?
A) Less Risk ( )

B) Good Returns ( )
C) Liquidity ( )
D) Assured Returns ( )
6. You current investment portfolio includes majority of Govt.
A) Securities and Bonds ( )
B) Mutual funds & fixed deposits ( )
C) Equity shares ( )
D) Others ( )
7. What percentage of your income do you invest ?
A) 5000-10000 ( )
B) 10001-15000% ( )
C) 15001-20000 ( )
D) 20001 & above ( )
8. Are you an investor in mutual fund?
A) Yes ( )
B) No ( )
9. If answer is No, why you are not investing in mutual fund ?
A) Awareness ( )
B) Risky ( )
C) Returns not assured ( )
10. If answer is yes, why do you prefer mutual fund?
A) Less risky ( )
B) Professional mgt. ( )
C) Fast appreciation ( )
11. What kind of mutual fund you prefer?
A) Open ( )

B) Closed-ended ( )
C) Both ( )
12. What type of scheme do you prefer?
A) Equity ( )
B) Debt ( )
C) Balance ( )
13. Whom do you contact when you plan for such an investment?
A) Personal Banker ( ),
B) Online Trading ( ),
C) Stock Broker ( ),
D) Deals directly ( ),
14. Trade option Preferred by investor
A) Long term ( )
B) Short term ( )
C) Medium term ( )
15, Have you heard of Reliance mutual fund and its scheme?
A) Yes ( ) B) No ( )
16. If you an investor of MF, which company you prefer?
A) UTI ( )
B) Reliance ( )
C) HDFC ( )
D) Others ( )
17. What is your basic motive/objective behind trading in Mutual Fund?
A) For diversified the portfolio ( )
B) For Higher return ( )
C) Monthly income ( )
D) Tax benefit ( )