Embed Size (px)
DESCRIPTION
A Study of Toxic Chemicals in Washingtonians. A project of the Toxic-Free Legacy Coalition: Breast Cancer Fund, Healthy Building Network, People For Puget Sound, Washington Physicians for Social Responsibility, Washington State Nurses Association, Washington Toxics Coalition, WashPIRG, - PowerPoint PPT Presentation
Citation preview

A project of the Toxic-Free Legacy Coalition:Breast Cancer Fund, Healthy Building Network, People For Puget Sound, Washington Physicians for Social
Responsibility, Washington State Nurses Association, Washington Toxics Coalition, WashPIRG,and more than 40 other organizations working together to eliminate persistent toxic chemicals in Washington State.
A Study of Toxic Chemicals in Washingtonians

The Toxic-Free Legacy Coalition
and more than 40 other organizations in Washington State
working together to eliminate persistent toxic chemicals

About Our Study

Study Participants
• Pam Tazioli
• Sen. Bill Finkbeiner
• Karen Bowman, RN
• Rev. Ann Holmes Redding
• Sen. Lisa Brown
• Laurie Valeriano
• Dr. Patricia Dawson
• Denis Hayes
• Allyson Schrier
• Deb Abrahamson

Chemicals Tested
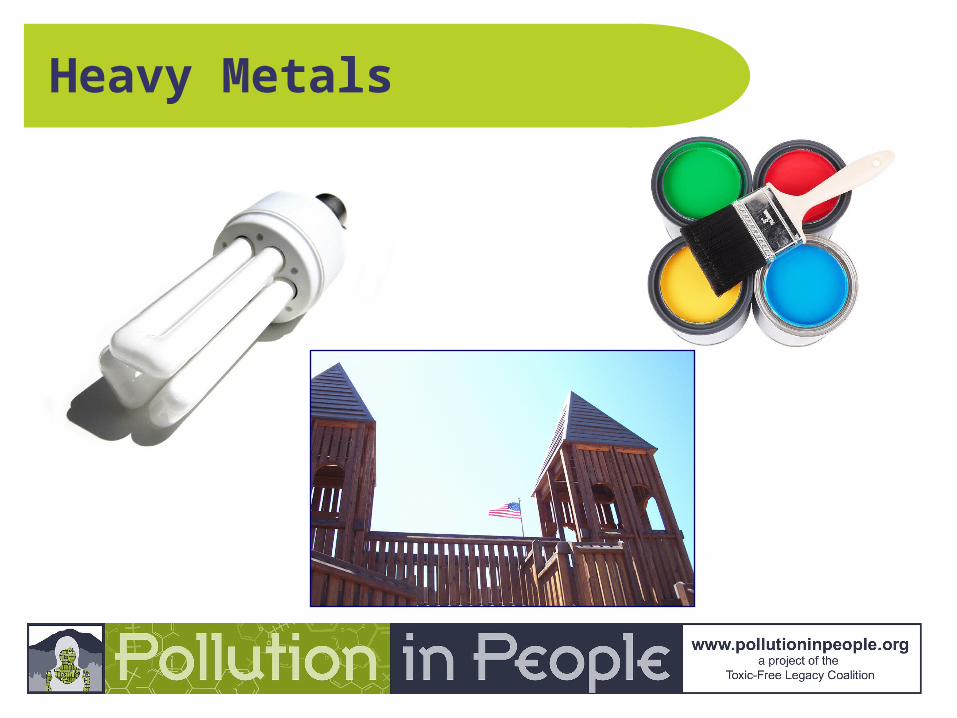
• Phthalates• PBDEs• Heavy metals - lead, arsenic, and mercury• PFCs (perfluorinated compounds)• Pesticides• DDT & PCBs

Phthalates

PBDEs
Heavy Metals

PFCs

Pesticides
DDT/PCBs

• Toxic pollution in the people of Washington is widespread and unavoidable
• Participants had from 26 to 39 toxic chemicals
What We Found

Toxic Chemicals Found
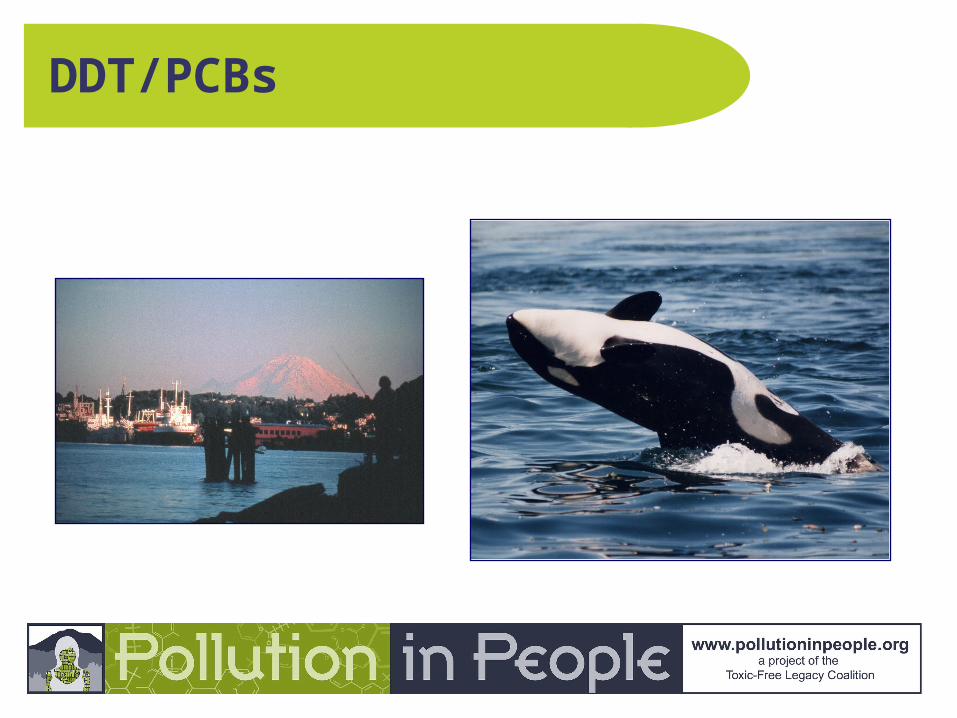
PFOA Exposure
Figure 5. PFOA Levels in Ten Washingtonians
0
1
2
3
4
5
6
7
8
Ann H
olmes
Red
ding
Patri
cia D
awso
n
Pam
Taz
ioli
Denis
Hayes
Lisa
Brown
Bill Fi
nkbe
iner
Laur
ie V
aler
iano
Deb A
brah
amso
n
Allyso
n Sch
rier
Karen
Bow
man
in p
pb
NationalMedianRange

Presence of Pesticides
Figure 6. Pesticide Exposures in Ten Washingtonians
0.00
1.00
2.00
3.00
4.00
5.00
Ann H
olm
es R
eddi
ng
Patricia
Daw
son
Pam
Taziol
i
Denis H
ayes
Lisa
Bro
wn
Bill Fin
kbei
ner
Laur
ie V
aler
iano
Deb A
brah
amso
n
Allyso
n Sc
hrie
r
Kare
n Bow
man
# o
f p
est
icid
e m
eta
boli
tes
dete
cted

Carbaryl Exposures
• Carbaryl a likely carcinogen
• Marker found in five participants

Phthalates - DEHP Exposure
Figure 1: Levels of DEHP Metabolites in Ten Washingtonians
0
100
200
300
400
500
600
Ann H
olm
es R
edding
Patri
cia D
awso
n
Pam
Taz
ioli
Denis
Hayes
Lisa
Bro
wn
Bill F
inkb
eine
r
Laur
ie V
aler
iano
Deb A
brah
amso
n
Allyso
n Sch
rier
Karen
Bow
man
pp
b
MEHHP
MEOHP
MEHP

PCB Exposures
Figure 8. PCB Levels in Ten Washingtonians
0
0.5
1
1.5
2
2.5
Ann H
olm
es R
eddi
ng
Patric
ia D
awso
n
Pam T
azio
li
Denis
Hayes
Lisa
Bro
wn
Bill Fin
kbei
ner
Laur
ie V
aler
iano
Deb A
brah
amso
n
Allyso
n Sch
rier
Karen
Bow
man
PC
Bs
in p
pb
NationalMedianRange
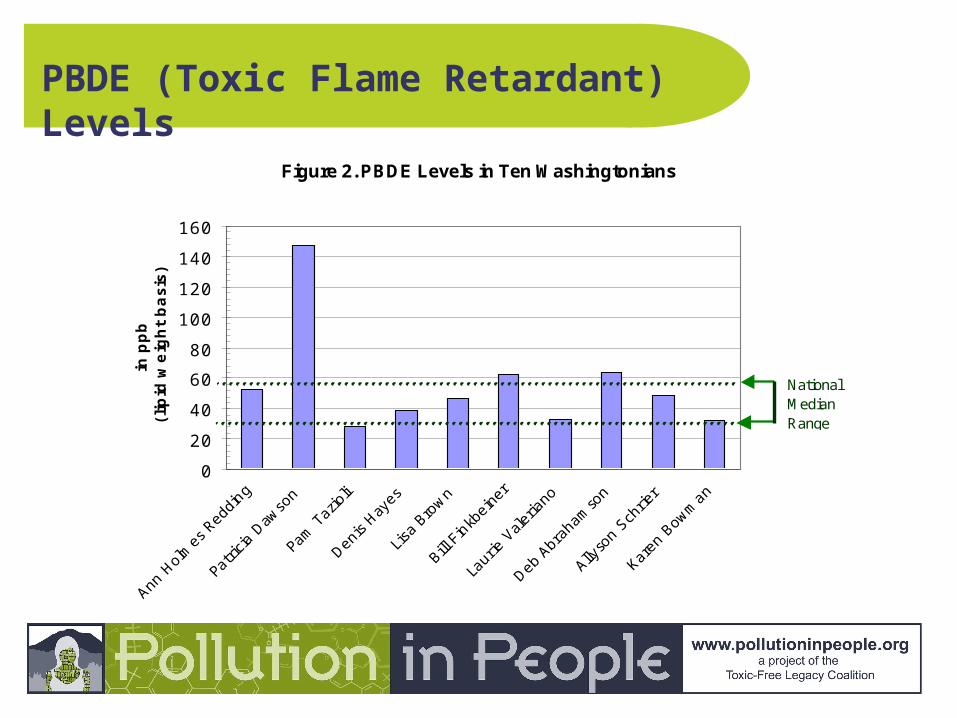
PBDE (Toxic Flame Retardant) Levels
Figure 2. PBDE Levels in Ten Washingtonians
0
20
40
60
80
100
120
140
160
Ann H
olm
es R
edding
Patri
cia D
awso
n
Pam
Taz
ioli
Denis
Hayes
Lisa
Bro
wn
Bill F
inkb
eine
r
Laur
ie V
aler
iano
Deb A
brah
amso
n
Allyso
n Sch
rier
Karen
Bow
man
in p
pb
(lipid
weig
ht
basis
)
NationalMedianRange

Mercury Levels
Figure 3. Mercury Levels in Ten Washingtonians
0
500
1000
1500
2000
2500
Ann H
olm
es R
eddi
ng
Patri
cia D
awso
n
Pam
Taz
ioli
Denis
Hayes
Lisa
Bro
wn
Bill Fink
bein
er
Laur
ie V
aler
iano
Deb A
brah
amso
n
Allyso
n Sch
rier
Karen
Bow
man
in p
pb
NationalMedianRange

Cause for Concern?
• At or near harmful levels
• Multiple exposures
• Timing of exposure
• We know enough to act

The System is Broken
• Data Gap
• Safety Gap
• Technology Gap
• Responsibility Gap

Data Gap
Toxic Substances Control Act (TSCA) of 1976
Encourage and require industry to develop adequate data on the health and environmental effects of chemicals.

Data Gap: Few of Highest Volume Chemicals Tested
0 10 20 30 40 50 60 70 80 90 100
Percentage Tested
Acute Toxicity
Environmental Fate
Ecotoxicity
Mutagenicity
Chronic Toxicity
ReproductiveToxicity
Full Set of BasicToxicity Tests
7% Full Set of Basic Toxicity Tests

Safety Gap: For EPA to Act
Prove it! Weigh Costs/Benefits Action

Safety Gap-Result
Photos from Environmental Working Group www.ewg.org

Safety Gap-Result
PBDE Example
1970 PBDE Production Begins1980 First Evidence of Negative Health Effects1981 First Evidence of PBDEs Building Up in Fish1990s First Evidence PBDEs in Food Chain1994 Research shows penta form mimics hormones
1997 Swedish breast milk studies/PBDEs increasingEuropean Action to Reduce PBDEs
2002 Research showing neurotoxic effects2003 EU Bans PBDEs in electronics2004 Industry voluntary agreement on penta/octaToday Science builds, deca form still on market!

Technology Gap

Companies Moving Forward
• Kaiser Permanente: reducing reliance on carcinogens, reproductive toxicants
• Herman Miller: zero hazardous waste, emissions by 2020; using safer materials
• Dell: phased out PBDEs, chemical use policy
• Cascadian Farm: now leading processor
• The Body Shop: eliminating phthalates

Current State Action
Washington’s PBT Program– Limited number of chemicals
– Lengthy process to develop Chemical Action Plans– Phaseouts or bans require legislative action
– No process to assess chemicals prior to release into the marketplace and our environment

What’s going wrong?
• Washington state - highest rates of breast cancer
• Childhood brain cancer on the rise
• 17% of school-aged children have learning disabilities

Costs of Environmental Diseases
from “Economic Costs of Diseases and Disabilities Attributable to Environmental Contaminants in Washington State” July 2005 by Kate Davies, Antioch University http://washington.chenw.org/RIgroup/
Childhood Diseases
Best Estimate - Proportion of Disease Attributable to
Environmental Contaminants
Asthma
Cancer
Lead Exposure
Birth Defects
Neurobehavioral Disorders
30%
5%
100%
2.5%
10%

Costs of Environmental Diseases
in 2004 dollars, see Kate Davies’ study online at http://washington.chenw.org/RIgroup/
Conclusions from the WA state economic study…
• $1.9 billion = annual cost of these 5 childhood diseases attributable to environmental contaminants
• If adult and childhood costs are combined,total = $2.7 billion annually
• this accounts for almost 5% of total health expenditures in Washington state
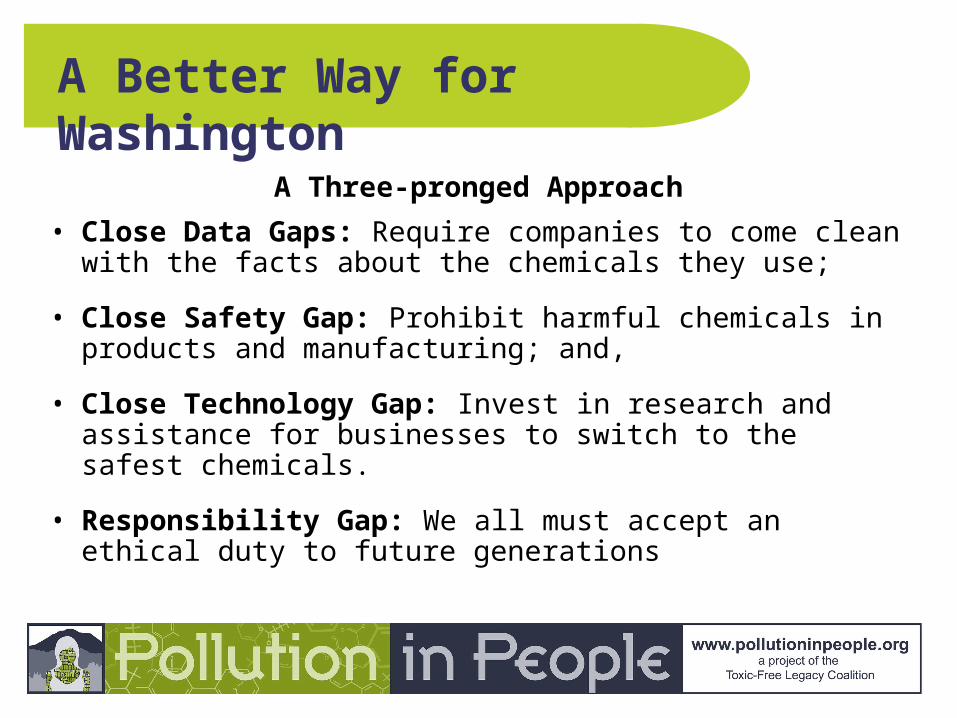
A Better Way for Washington
A Three-pronged Approach
• Close Data Gaps: Require companies to come clean with the facts about the chemicals they use;
• Close Safety Gap: Prohibit harmful chemicals in products and manufacturing; and,
• Close Technology Gap: Invest in research and assistance for businesses to switch to the safest chemicals.
• Responsibility Gap: We all must accept an ethical duty to future generations

Learn more from our web site
www.pollutioninpeople.orglink
• Complete report online and in pdf format• Participant profiles• Toxic Chemicals: how you’re exposed & health effects• Safer Alternatives for Food and Consumer Products• Ways to Take Action

We Can Do It—Together!