Embed Size (px)
Citation preview

Ple
ase
note
that
this
is a
n au
thor
-pro
duce
d P
DF
of a
n ar
ticle
acc
epte
d fo
r pub
licat
ion
follo
win
g pe
er re
view
. The
def
initi
ve p
ublis
her-a
uthe
ntic
ated
ver
sion
is a
vaila
ble
on th
e pu
blis
her W
eb s
ite
1
Composite Structures Volume 76, Issues 1-2 , October 2006, Pages 34-46 http://dx.doi.org/10.1016/j.compstruct.2006.06.006 © 2006 Elsevier Ltd All rights reserved
Archimer, archive institutionnelle de l’Ifremerhttp://www.ifremer.fr/docelec/
A study of the non-linear behaviour of adhesively-bonded composite assemblies
J.Y. Cognarda,*, P. Daviesb, L. Sohierc and R. Créac’hcadeca
aMechanics of Naval and Offshore Structures, ENSIETA, 2 rue F. Verny, 29806 Brest, France bMaterials and Structures group, IFREMER Brest Centre, 29280 Plouzané, France cLaboratoire d’Ingénierie Mécanique et Electrique, UBO, 29285 BREST Cedex, France *: Corresponding author : Tel.: +33 2 98 34 88 16; fax: +33 2 98 34 87 30; [email protected]
Abstract
The objective of this study is to define a reliable tool for dimensioning of adhesively bonded assemblies, particularly for marine and underwater applications. This paper presents experimental and numerical results, which describe the non-linear behaviour of an adhesive in a bonded assembly for various loadings. A modified Arcan fixture, well-suited for the study of the behaviour of bonded metal–metal assemblies, was developed in order to focus on the analysis of the behaviour of the adhesive in thin films. The edge effects are minimised by using an appropriate design of the substrates so that experimental results give reliable data. To analyze the kinematics of the deformation of the adhesive joint non-contact extensometry techniques were employed. Thus, various characteristics of the non-linear behaviour of the adhesive were observed. The results obtained for mixed assemblies (steel, aluminium, composite substrates) show similar behaviour of the adhesive using the proposed procedure. Furthermore, quality controls by DSC, and studies of curing by DMA have been performed to verify the bonding procedure.
Keywords: Adhesion; Composite; Marine structures; Arcan fixture; Finite element; Non-linear behaviour
A STUDY OF THE NON-LINEAR BEHAVIOUR OF ADHESIVELY-B ONDED COMPOSITE ASSEMBLIES
J.Y. Cognard 1∗, P. Davies 2, L. Sohier 3, R. Créac’hcadec 1 1 Mechanics of Naval and Offshore Structures, ENSIETA, 2 rue F. Verny, 29806 Brest, France
2 Materials and Structures group, IFREMER Brest Centre, 29280 Plouzané, France 3 Laboratoire d’Ingénierie Mécanique et Electrique, UBO, 29285 BREST Cedex, France
Abstract: The objective of this study is to define a reliable tool for dimensioning of adhesively bonded assemblies, particularly for marine and underwater applications. This paper presents experimental and numerical results which describe the non linear behaviour of an adhesive in a bonded assembly for various loadings. A modified Arcan fixture, well-suited for the study of the behaviour of bonded metal-metal assemblies, was developed in order to focus on the analysis of the behaviour of the adhesive in thin films. The edge effects are minimised by using an appropriate design of the substrates so that experimental results give reliable data. To analyze the kinematics of the deformation of the adhesive joint non-contact extensometry techniques were employed. Thus various characteristics of the non-linear behaviour of the adhesive were observed. The results obtained for mixed assemblies (steel, aluminium, composite substrates) show similar behaviour of the adhesive using the proposed procedure. Furthermore, quality controls by DSC, and studies of curing by DMA have been performed to verify the bonding procedure. Keywords: Adhesion, Composite, Marine structures, Arcan fixture, Finite Element, Non-
linear behaviour.
1. Introduction This study is concerned with increasing the performance of composite structures by the
use of adhesive bonded joints. The applications are particularly related to the marine field (composite sailing boats…) and underwater structures. Adhesively bonded joints offer many advantages for the design of such structures, but a lack of confidence limits the current use of this technology [1-4]. The industrial applications concerned, in particular adhesively bonded mixed joints (composite joining metal), are characterized by the use of joints of relatively thick adhesive, about 0.5 mm. Moreover, these joints can have a non-constant thickness because of the geometry and the large dimensions of the parts to be assembled.
The long term objective is to define a reliable tool for dimensioning of adhesive bonded joints of composite structures, together with quality control methodologies in order to guarantee mechanical performance. The strategy consists of defining an experimental fixture making it possible to characterize the thin film adhesive in an assembly, then to quantify the influence of the construction parameters for naval structures.
There is a standardized test which makes it possible to determine the full stress-strain curve, a shear test with thick substrates [5]. However, this test allows only shear loading. For the adhesive which interests us (Redux 420), few mechanical properties are provided by the manufacturer [6]. These data are thus not sufficient for the dimensioning of adhesive bonding assemblies. Therefore the characterization of the non-linear behaviour of the adhesive under different loadings is necessary, under the conditions encountered in a boatyard environment (joining of large-sized parts, simple preparation of surfaces and cure at a low temperature).
∗ Corresponding author: [email protected] - Tel : 33 2 98 34 88 16 - Fax : 33 2 98 34 87 30
In a first study, an experimental methodology was proposed enabling the adhesives of interest to be characterized up to failure [7]. A metal-metal assembly with a special geometry of the substrates (a beak) was proposed to limit the edge effects [7, 8]. In order to be able to study the behaviour of the adhesive as a function of the normal stress component a modified Arcan fixture [7] has been developed, which enables compression or tension to be combined simultaneously with shear loads.
This paper presents the proposed strategy and the results of the analysis of the non-linear behaviour of the adhesive under various loadings (monotonous, cyclic, complex…). To analyse the kinematics of the deformation of the adhesive joint of we chose to use a non-contact measurement system by image correlation. The direct study of displacements in the adhesive is difficult because of its non-planar geometry at the periphery, its very low thickness and of the presence of the beak. Thus we analyse, by a technique of optimization, the evolution of displacements of the two substrates with time. Tests carried out for proportional loadings show various characteristics of the visco-elasto-plastic behaviour of the adhesive.
An analysis of the stress distribution in the bonded joint allows us to define the fracture envelope in the normal stress–shear stress plane for the epoxy resin Vantico Redux 420. We note that compression increases the shear stress at failure significantly. The results obtained with steel or aluminium substrates and with mixed assemblies involving composites show similar behaviour of the adhesive using the procedure suggested. Finally, the influence of fabrication conditions on the adhesive have been studied through modulated differential scanning calorimetry (MDSC) analysis and dynamical mechanical analysis (DMA).
2. The experimental fixture 2.1. Design of the experimental fixture
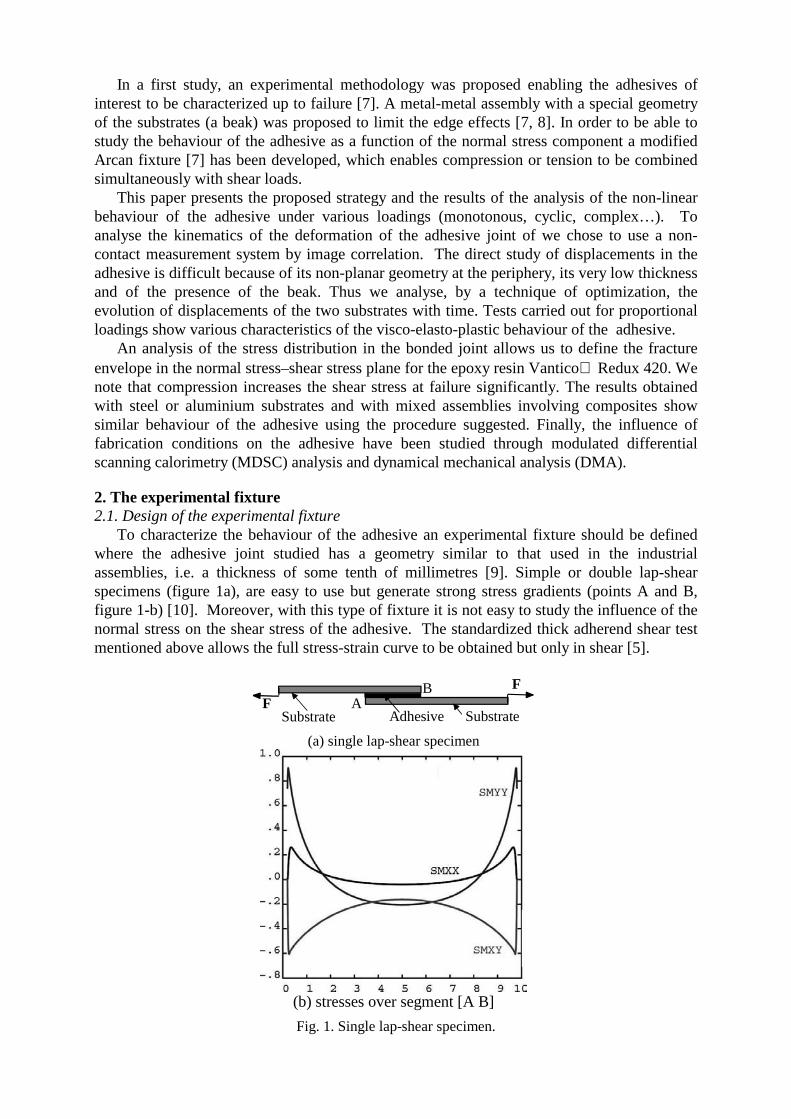
To characterize the behaviour of the adhesive an experimental fixture should be defined where the adhesive joint studied has a geometry similar to that used in the industrial assemblies, i.e. a thickness of some tenth of millimetres [9]. Simple or double lap-shear specimens (figure 1a), are easy to use but generate strong stress gradients (points A and B, figure 1-b) [10]. Moreover, with this type of fixture it is not easy to study the influence of the normal stress on the shear stress of the adhesive. The standardized thick adherend shear test mentioned above allows the full stress-strain curve to be obtained but only in shear [5].
Substrate Adhesive
BF
SubstrateA
F
(a) single lap-shear specimen
(b) stresses over segment [A B]
Fig. 1. Single lap-shear specimen.

In order to be able to study the behaviour of the adhesive as a function of the normal stress component and to use a traditional tensile testing machine, a modified Arcan fixture [11] has been developed, which enables compression or tension to be combined with shear loads (Figure 2). Numerical simulations in linear elasticity, for bi-material structures show that the use of a special geometry for the substrate (a beak close to the adhesive joint) strongly reduces the contribution of the singularities due to edge effects [7, 8] (figure 3).
Support
A dhes ive
u
v γ
SubstrateF
F
(a) Classical Arcan type fixture
u
v
F
γF
(b) Modified Arcan type fixture
Fig. 2. Principles of Arcan type fixture.
Fig. 3. Geometry of the substrates with the beak.
1 - support of the Arcan fixture 2 - bonded specimen 3 - clamping system 4 - support of the clamping system
(a) Arcan fixture (b) Mounting of the bonded specimen Fig. 4. Main parts of proposed Arcan fixture.
Two important points were studied when designing this assembly. First, the generation of
a stress field in the adhesive joint which is as uniform as possible with a maximum stress in the centre of the joint. This is important in order to limit the influence of defects. Second, the system fixing the substrates on the supporting fixture has to be designed in order to prevent pre-loading of the adhesive joint. The optimisation of the complete fixture was made using three-dimensional non linear simulations taking into account the fixing system, with refined
meshes in order to be able to analyse the possible edge effects [7, 12]. Moreover, in order to be as realistic as possible the finite element models used take into account the contacts with friction and the assembly procedures.
A specimen with rectangular section (section of 70 x 10 mm) was proposed by taking into account the constraints involved in machining (figure 3). The beak is machined with an angle of 45° and a blending radius of 0.8 mm. The definition of a beak with a sharp angle leads to manufacturing and handling problems. Simulations showed that an extra thickness of about 0.2 mm on the beak did not change the stress field in the adhesive joint.
Figure 4 presents the assembly of the bonded specimen in the Arcan fixture. The clamping system participates in the positioning of the bonded specimen with respect to the Arcan fixture and holds it in position.
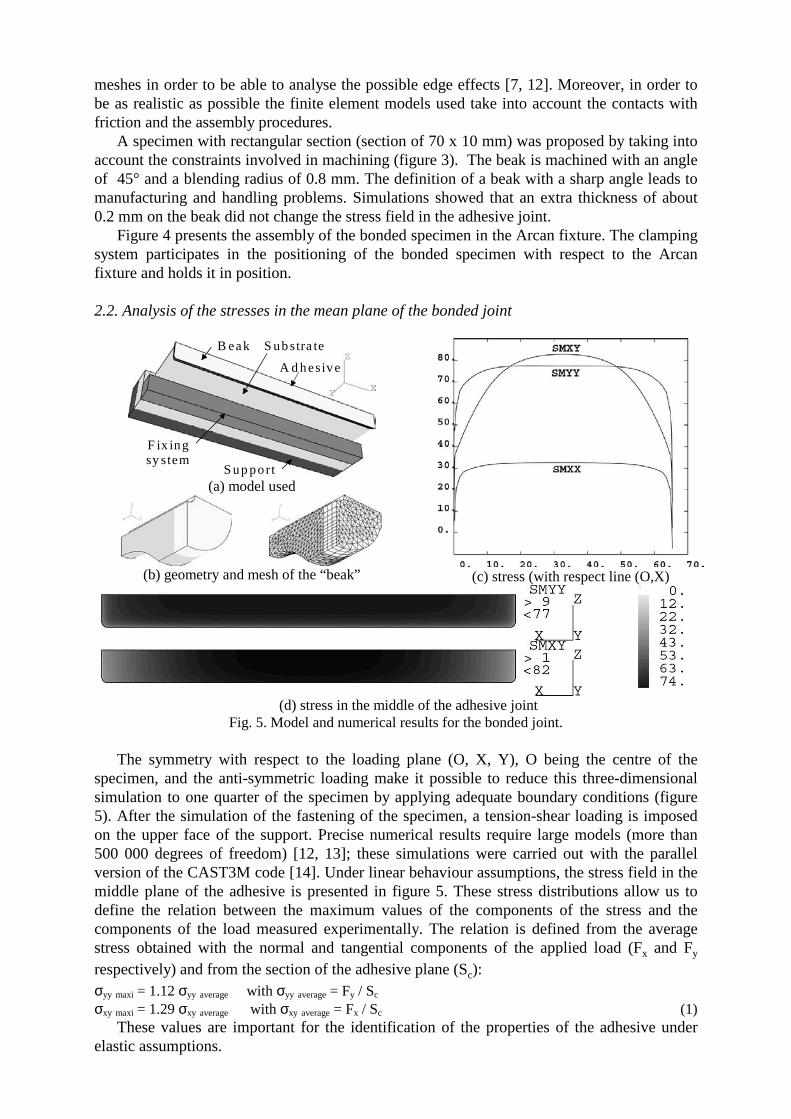
2.2. Analysis of the stresses in the mean plane of the bonded joint
F ix ingsy stem
Sup port
A d hesive
S ubstra teB eak
(a) model used
(b) geometry and mesh of the “beak”
(c) stress (with respect line (O,X)
(d) stress in the middle of the adhesive joint
Fig. 5. Model and numerical results for the bonded joint. The symmetry with respect to the loading plane (O, X, Y), O being the centre of the
specimen, and the anti-symmetric loading make it possible to reduce this three-dimensional simulation to one quarter of the specimen by applying adequate boundary conditions (figure 5). After the simulation of the fastening of the specimen, a tension-shear loading is imposed on the upper face of the support. Precise numerical results require large models (more than 500 000 degrees of freedom) [12, 13]; these simulations were carried out with the parallel version of the CAST3M code [14]. Under linear behaviour assumptions, the stress field in the middle plane of the adhesive is presented in figure 5. These stress distributions allow us to define the relation between the maximum values of the components of the stress and the components of the load measured experimentally. The relation is defined from the average stress obtained with the normal and tangential components of the applied load (Fx and Fy respectively) and from the section of the adhesive plane (Sc): σyy maxi = 1.12 σyy average with σyy average = Fy / Sc σxy maxi = 1.29 σxy average with σxy average = Fx / Sc (1)
These values are important for the identification of the properties of the adhesive under elastic assumptions.

Different finite element analyses have been performed in order to examine the influence of geometrical defects on the stress in the bonded joint [7]. In order to obtain reliable results precise positioning of the different parts of the Arcan fixture is required; for example, a bonding fixture has been developed in order to control the thickness of the joint and the positioning of the two substrates during assembly [7].
3. Analysis of the kinematics of the bonded joint deformation
(a) initial image & studied zones
(b) just before rupture (zoom)
(c) displacement measured for the two substrates
(d) evolution of different values with time
Fig. 6. Analysis of the kinematics of the bonded joint deformation (shear loading).
To analyse the kinematics of the bonded joint deformation we chose to use a non-contact extensometry system based on image correlation [15]. The direct study of displacements and strains in the bonded joint is difficult due to the presence of the beaks and because its geometry is not flat at the edges of the specimen. The thickness is also low (of the order of 0.5 mm), so we study the displacements of both substrates instead; in order to obtain accurate displacements, a zone of approximately 1 cm x 1 cm is analysed with images of 1280 pixels x 1024 pixels. Figure 6a presents the experimental system used in the case of a shear test of the adhesive (90° loading). For this test the crosshead displacement rate of the tensile testing machine is 0.5 mm/min and an image is recorded every second. The zone studied is taken to be symmetric with respect to the adhesive joint to allow an analysis of the displacement of both substrates. Then, after obtaining the displacement fields in both studied zones by image correlation, an optimisation technique is used to obtain the best displacement field of the substrates. This technique was used both with a rigid body displacement model for the substrates and with a model taking into account the strains of the substrates associated with tension and shear stresses. The stresses of the aluminium substrates being relatively low both approaches give similar results for the relative displacements of both ends of the adhesive joint.
Displacement (mm)
0
0,1
0,2
0,3
0,4
0,5
0,6
0,7
0,8
1 21 41 61 81 101 121
Time (s)
U1
V1
U2
V2
0
0,2
0,4
0,6
0,8
1
1,2
1 21 41 61 81 101 121
Time (s)
Displacement (mm)
Measured load (25 kN)
DT (mm)

For example, using the properties of small rigid body displacement of the substrates the displacement field (URi, VRi) is required at a prescribed time, at each point Mi (Xi, Yi) of a zone, in the following form: URi = U0 – Ω Yi VRi = V0 + Ω Xi (2) where U0 and V0 are the displacement components of the origin and Ω represents the rotation of the rigid body. The three unknowns U0,V0, Ω are obtained by the minimization of the difference between the modelled values of displacements and the values measured for the points Mi: (UMi, VMi). The values of measured displacements are known for N pixels of the zone of study. By solving the following problem: Minimization of Σ(i=1,N) (URi - UMi)
2 + (VRi - VMi)2 (3)
the unknowns are the solutions of a linear problem with three equations for each time:
N 0 −Σ(Y i)
0 N Σ(X i)
−Σ(Y i) Σ(X i) Σ(X i)2 + Σ(Y i)2
U0
V0
Ω =
Σ(Ui)
Σ(V i) Σ(X i Vi) − Σ( Yi Ui)
(4)
In fact, for each image we obtain the displacement of the two substrates. Thus one obtains a representation of the time evolution of the displacements of the substrates [8].
4. Behaviour of the bonded joint 4.1. Behaviour under monotonic shear loading
We denote by DN and DT the relative displacements of both ends of the adhesive joint respectively in the normal and tangential directions in the mean plane of the adhesive joint. FN and FT represent the components of the applied load in the normal and tangential directions to the mean plane of the adhesive joint.
Figures 6-a and 6-b present, for a shear test, the images at the initial moment and just before failure. The figure 6-c presents the evolution with time of the horizontal displacement (Ui) and vertical displacement (Vi) of the centres of both analysed zones. It is important to note that the horizontal displacements are very small for this shear loading test, which underlines the good behaviour of the experimental fixture. Finally, figure 6-d gives the evolution with time of the displacement imposed by the cross-head of the tensile testing machine, the measured load on the specimen and the tangential displacement DT of the adhesive joint. The displacement imposed by the cross-head of the tensile testing machine does not correspond directly to the displacement of the adhesive joint; indeed, there is deformation of the Arcan fixture and of the connections to the tensile machine (special pins are used in order to limit parasite loadings).
In the case of a shear test under monotonic loading (figure 6d) we can note two main zones in the adhesive behaviour:
(a) a first zone which we can consider as “elastic” characterised by a linear relation
between the applied load and the displacement DT; this zone is associated with a weak
evolution of the strain in the adhesive,
(b) a second zone with a non-linear behaviour characterised by an important evolution
of the strain in the adhesive joint.
On figure 6-b, it is possible to visualize the strains of the adhesive; indeed, “grooves” at 45° appear in a homogeneous way from the beginning of the non-linear behaviour of the adhesive and the relative displacement of both substrates is directly perceptible on the images. On the other hand, for low loads the relative displacement of both substrates is not directly observable.
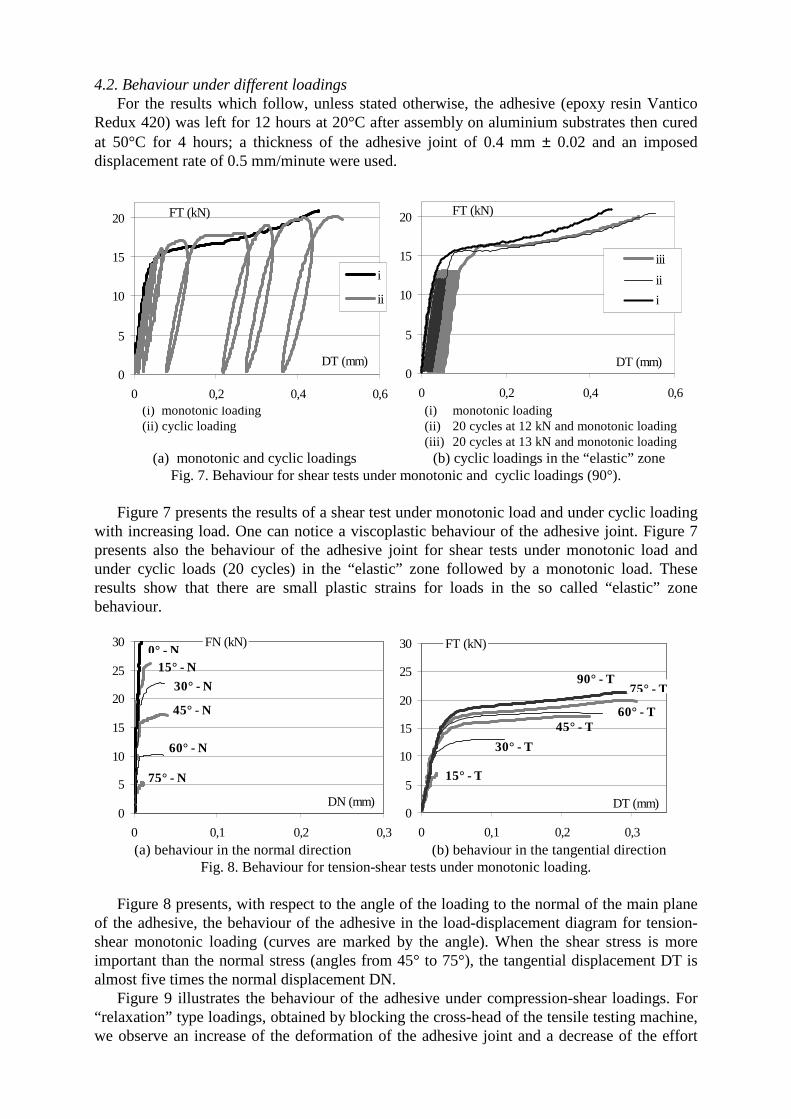
4.2. Behaviour under different loadings For the results which follow, unless stated otherwise, the adhesive (epoxy resin Vantico
Redux 420) was left for 12 hours at 20°C after assembly on aluminium substrates then cured at 50°C for 4 hours; a thickness of the adhesive joint of 0.4 mm ± 0.02 and an imposed displacement rate of 0.5 mm/minute were used.
(i) monotonic loading (ii) cyclic loading
(a) monotonic and cyclic loadings
(i) monotonic loading (ii) 20 cycles at 12 kN and monotonic loading (iii) 20 cycles at 13 kN and monotonic loading
(b) cyclic loadings in the “elastic” zone Fig. 7. Behaviour for shear tests under monotonic and cyclic loadings (90°).
Figure 7 presents the results of a shear test under monotonic load and under cyclic loading
with increasing load. One can notice a viscoplastic behaviour of the adhesive joint. Figure 7 presents also the behaviour of the adhesive joint for shear tests under monotonic load and under cyclic loads (20 cycles) in the “elastic” zone followed by a monotonic load. These results show that there are small plastic strains for loads in the so called “elastic” zone behaviour.
(a) behaviour in the normal direction (b) behaviour in the tangential direction Fig. 8. Behaviour for tension-shear tests under monotonic loading.
Figure 8 presents, with respect to the angle of the loading to the normal of the main plane
of the adhesive, the behaviour of the adhesive in the load-displacement diagram for tension-shear monotonic loading (curves are marked by the angle). When the shear stress is more important than the normal stress (angles from 45° to 75°), the tangential displacement DT is almost five times the normal displacement DN.
Figure 9 illustrates the behaviour of the adhesive under compression-shear loadings. For “relaxation” type loadings, obtained by blocking the cross-head of the tensile testing machine, we observe an increase of the deformation of the adhesive joint and a decrease of the effort
FT (kN)
0
5
10
15
20
0 0,2 0,4 0,6
DT (mm)
i
ii
FT (kN)
0
5
10
15
20
0 0,2 0,4 0,6
DT (mm)
iii
ii
i
FN (kN)
0
5
10
15
20
25
30
0 0,1 0,2 0,3
DN (mm)
15° - N
45° - N
75° - N
0° - N
30° - N
60° - N
FT (kN)
0
5
10
15
20
25
30
0 0,1 0,2 0,3
DT (mm)
45° - T
75° - T
15° - T
30° - T
60° - T
90° - T
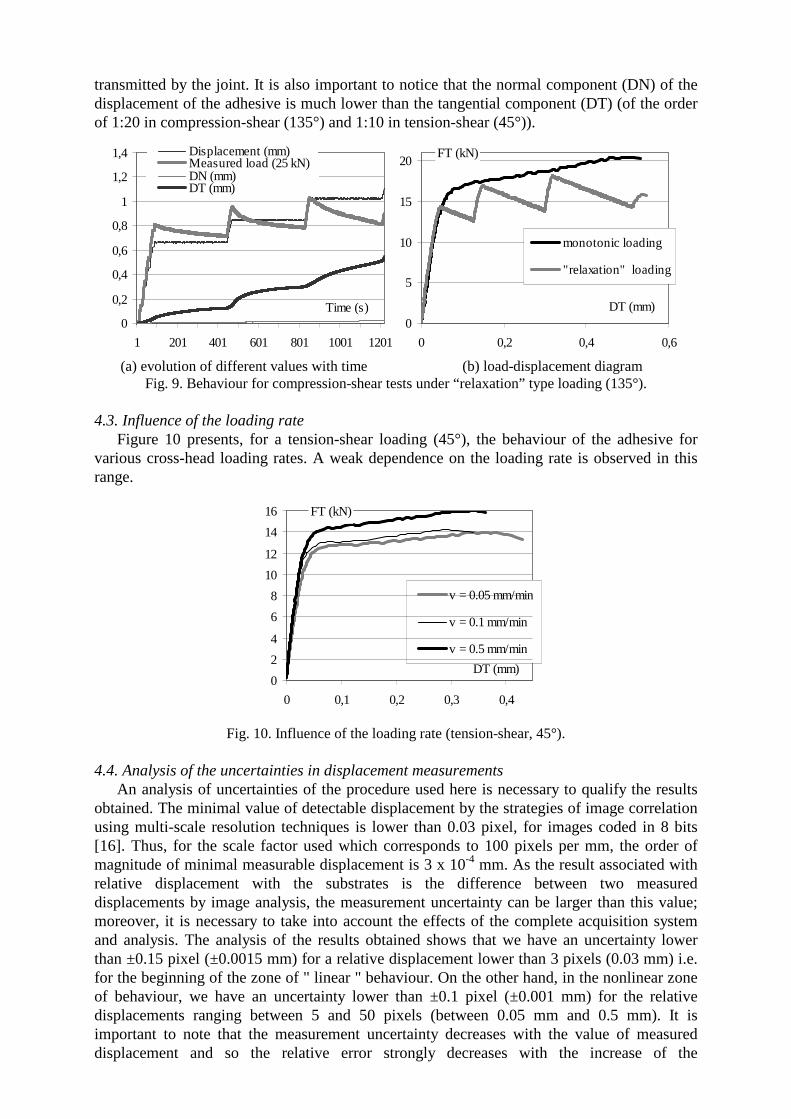
transmitted by the joint. It is also important to notice that the normal component (DN) of the displacement of the adhesive is much lower than the tangential component (DT) (of the order of 1:20 in compression-shear (135°) and 1:10 in tension-shear (45°)).
(a) evolution of different values with time (b) load-displacement diagram Fig. 9. Behaviour for compression-shear tests under “relaxation” type loading (135°).
4.3. Influence of the loading rate
Figure 10 presents, for a tension-shear loading (45°), the behaviour of the adhesive for various cross-head loading rates. A weak dependence on the loading rate is observed in this range.
Fig. 10. Influence of the loading rate (tension-shear, 45°).
4.4. Analysis of the uncertainties in displacement measurements An analysis of uncertainties of the procedure used here is necessary to qualify the results
obtained. The minimal value of detectable displacement by the strategies of image correlation using multi-scale resolution techniques is lower than 0.03 pixel, for images coded in 8 bits [16]. Thus, for the scale factor used which corresponds to 100 pixels per mm, the order of magnitude of minimal measurable displacement is 3 x 10⁻⁴ mm. As the result associated with relative displacement with the substrates is the difference between two measured displacements by image analysis, the measurement uncertainty can be larger than this value; moreover, it is necessary to take into account the effects of the complete acquisition system and analysis. The analysis of the results obtained shows that we have an uncertainty lower than ±0.15 pixel (±0.0015 mm) for a relative displacement lower than 3 pixels (0.03 mm) i.e. for the beginning of the zone of " linear " behaviour. On the other hand, in the nonlinear zone of behaviour, we have an uncertainty lower than ±0.1 pixel (±0.001 mm) for the relative displacements ranging between 5 and 50 pixels (between 0.05 mm and 0.5 mm). It is important to note that the measurement uncertainty decreases with the value of measured displacement and so the relative error strongly decreases with the increase of the
0
0,2
0,4
0,6
0,8
1
1,2
1,4
1 201 401 601 801 1001 1201
Time (s)
Displacement (mm)Measured load (25 kN)DN (mm)DT (mm)
FT (kN)
0
5
10
15
20
0 0,2 0,4 0,6
DT (mm)
monotonic loading
"relaxation" loading
FT (kN)
0
2
4
6
8
10
12
14
16
0 0,1 0,2 0,3 0,4
DT (mm)
v = 0.05 mm/min
v = 0.1 mm/min
v = 0.5 mm/min
displacement. For small loads the special connection, used to ensure the isostaticity of the assembly, can generate small perturbations related to friction which are added to measurement scatter.
A very careful preparation of the test (quality of the coating, lighting, …) can reduce uncertainties. Overall the strategy used requires relative displacements of the substrates greater than 1 pixel to obtain good quality results. The quality of the results can be improved by the use of a larger scaling factor (smaller studied zone or more precise camera) and by the use of images coded in more than 8 bits (more precise camera).
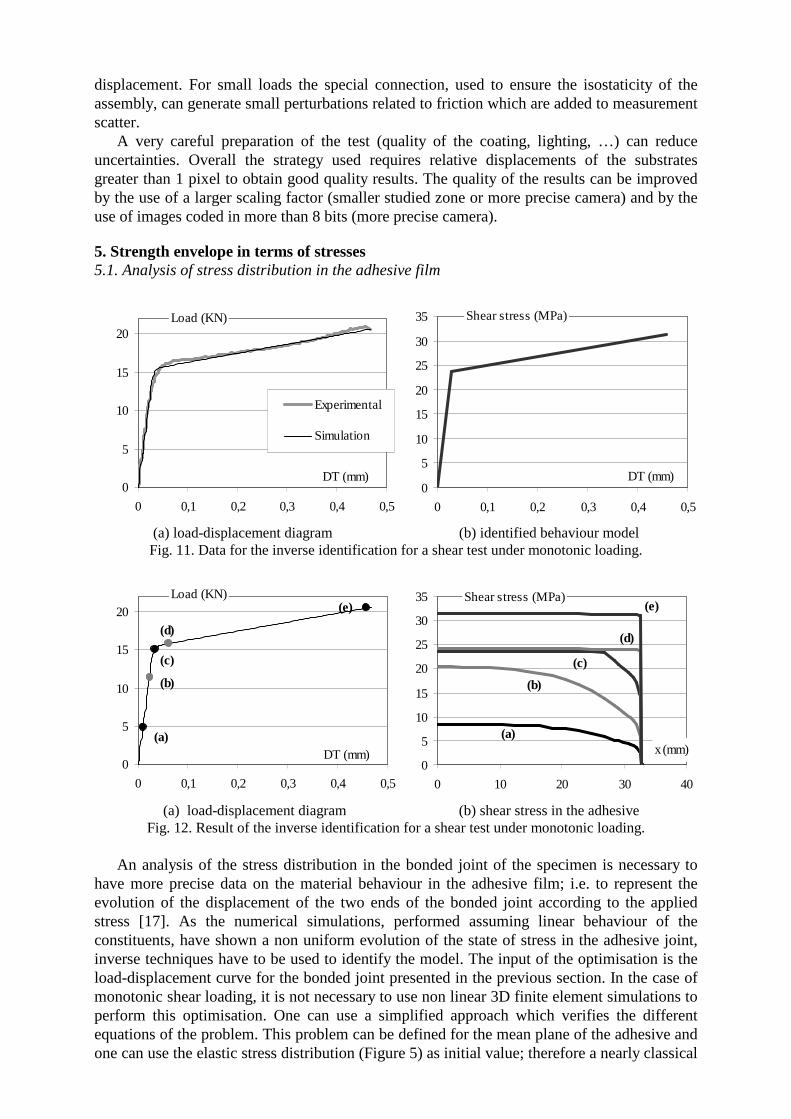
5. Strength envelope in terms of stresses 5.1. Analysis of stress distribution in the adhesive film
(a) load-displacement diagram
(b) identified behaviour model Fig. 11. Data for the inverse identification for a shear test under monotonic loading.
(a) load-displacement diagram
(b) shear stress in the adhesive Fig. 12. Result of the inverse identification for a shear test under monotonic loading.
An analysis of the stress distribution in the bonded joint of the specimen is necessary to
have more precise data on the material behaviour in the adhesive film; i.e. to represent the evolution of the displacement of the two ends of the bonded joint according to the applied stress [17]. As the numerical simulations, performed assuming linear behaviour of the constituents, have shown a non uniform evolution of the state of stress in the adhesive joint, inverse techniques have to be used to identify the model. The input of the optimisation is the load-displacement curve for the bonded joint presented in the previous section. In the case of monotonic shear loading, it is not necessary to use non linear 3D finite element simulations to perform this optimisation. One can use a simplified approach which verifies the different equations of the problem. This problem can be defined for the mean plane of the adhesive and one can use the elastic stress distribution (Figure 5) as initial value; therefore a nearly classical
Shear stress (MPa)
0
5
10
15
20
25
30
35
0 0,1 0,2 0,3 0,4 0,5
DT (mm)
Load (KN)
0
5
10
15
20
0 0,1 0,2 0,3 0,4 0,5
DT (mm)
Experimental
Simulation
Shear stress (MPa)
0
5
10
15
20
25
30
35
0 10 20 30 40
x (mm)
(d)
(e)
(c)
(b)
(a)
Load (KN)
0
5
10
15
20
0 0,1 0,2 0,3 0,4 0,5
DT (mm)(a)
(b)
(c)
(d)
(e)

non linear time dependent problem has to be solved. The first tests have been performed for the case of shear tests under monotonic loading. For such loadings, plastic behaviour with isotropic hardening (Figure 11-b) gives good results: figure 11-a presents the experimental and numerical curves. Figure 12-b represents the shear stress with respect to the segment [OX] (figure 5) for different values of the loading defined on figure 12-a. The response is elastic for a low load (a,b), a nearly uniform stress field is observed before failure (d, e) and an intermediate distribution is obtained in the transition part (c).
5.2. Strength envelope in terms of stresses
(a) fracture envelope (b) “elastic” and fracture envelopes Fig. 13. Tension/compression-shear fracture and “elastic” envelopes, Vantico Redux 420.
The strength envelopes are obtained from monotonic loading tests. For each angle between
5 and 10 tests have been performed. Figure 13-a presents, in the normal stress–shear stress plane, the fracture envelope obtained for the epoxy resin Vantico Redux 420. The previous analysis of the non-linear response of the bonded joint shows that near failure the stress is nearly constant in the middle plane of the adhesive joint. Thus the fracture envelope is plotted with the average stresses. The behaviour observed is interesting, the strength (based on maximum stress) under normal tension is close to and even slightly higher than that under shear loading. Compression increases the shear stress of the adhesive joint at failure significantly, which is very important for underwater applications (figure 13-b). The examination of fracture surfaces shows an adhesive (failure at the adhesive-substrate interface) and cohesive (failure within the adhesive) type failure when the normal stress is dominant and a mixed-cohesive type failure (failure at interfaces linked by cracks through the adhesive perpendicular to the mean plane) when the shear stress is dominant. For practical use of the strength envelope in terms of stresses it may be more useful to determine the “elastic” domain in the case of monotonic loading; this is plotted with the maximum stress values computed under elastic assumptions (equation (1)).
From a practical point of view it is important to note that the maximum performance is obtained with adhesive bonding just after opening of new adhesive containers. When laboratory tests are carried out with adhesive prepared several days after the first opening of the pots, the scatter in results obtained is thus higher than that obtained in a boatyard
Normal stress (MPa)
-40
-30
-20
-10
0
10
20
30
40
0 10 20 30 40 50
Shear stress (MPa)
Normal stress (Mpa)
-40
-30
-20
-10
0
10
20
30
40
0 10 20 30 40 50
Shear stress (MPa)
rupture (average)
"elastic" limit
environment where large quantities of adhesive are employed. This will be illustrated in the section on the influence of fabrication conditions below.
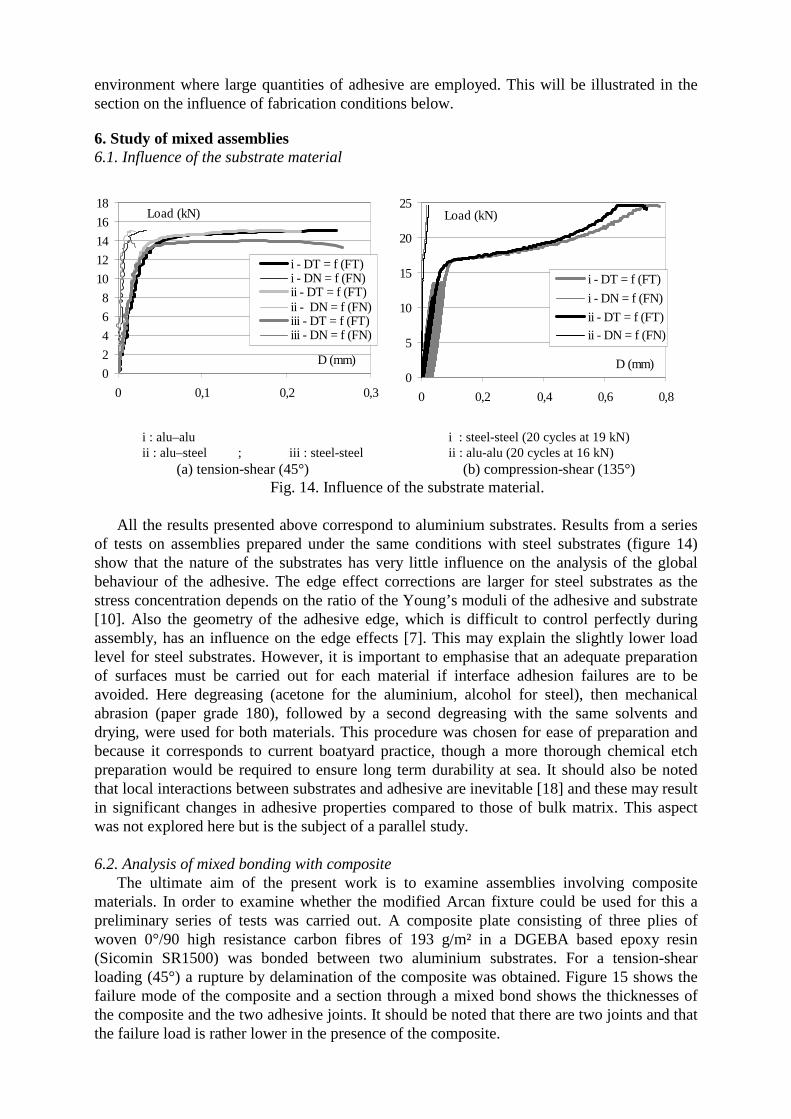
6. Study of mixed assemblies 6.1. Influence of the substrate material
i : alu–alu ii : alu–steel ; iii : steel-steel
(a) tension-shear (45°)
i : steel-steel (20 cycles at 19 kN) ii : alu-alu (20 cycles at 16 kN)
(b) compression-shear (135°) Fig. 14. Influence of the substrate material.
All the results presented above correspond to aluminium substrates. Results from a series
of tests on assemblies prepared under the same conditions with steel substrates (figure 14) show that the nature of the substrates has very little influence on the analysis of the global behaviour of the adhesive. The edge effect corrections are larger for steel substrates as the stress concentration depends on the ratio of the Young’s moduli of the adhesive and substrate [10]. Also the geometry of the adhesive edge, which is difficult to control perfectly during assembly, has an influence on the edge effects [7]. This may explain the slightly lower load level for steel substrates. However, it is important to emphasise that an adequate preparation of surfaces must be carried out for each material if interface adhesion failures are to be avoided. Here degreasing (acetone for the aluminium, alcohol for steel), then mechanical abrasion (paper grade 180), followed by a second degreasing with the same solvents and drying, were used for both materials. This procedure was chosen for ease of preparation and because it corresponds to current boatyard practice, though a more thorough chemical etch preparation would be required to ensure long term durability at sea. It should also be noted that local interactions between substrates and adhesive are inevitable [18] and these may result in significant changes in adhesive properties compared to those of bulk matrix. This aspect was not explored here but is the subject of a parallel study.
6.2. Analysis of mixed bonding with composite
The ultimate aim of the present work is to examine assemblies involving composite materials. In order to examine whether the modified Arcan fixture could be used for this a preliminary series of tests was carried out. A composite plate consisting of three plies of woven 0°/90 high resistance carbon fibres of 193 g/m² in a DGEBA based epoxy resin (Sicomin SR1500) was bonded between two aluminium substrates. For a tension-shear loading (45°) a rupture by delamination of the composite was obtained. Figure 15 shows the failure mode of the composite and a section through a mixed bond shows the thicknesses of the composite and the two adhesive joints. It should be noted that there are two joints and that the failure load is rather lower in the presence of the composite.
Load (kN)
0
2
4
6
8
10
12
14
16
18
0 0,1 0,2 0,3
D (mm)
i - DT = f (FT)i - DN = f (FN)ii - DT = f (FT)ii - DN = f (FN)iii - DT = f (FT)iii - DN = f (FN)
Load (kN)
0
5
10
15
20
25
0 0,2 0,4 0,6 0,8
D (mm)
i - DT = f (FT)
i - DN = f (FN)
ii - DT = f (FT)ii - DN = f (FN)
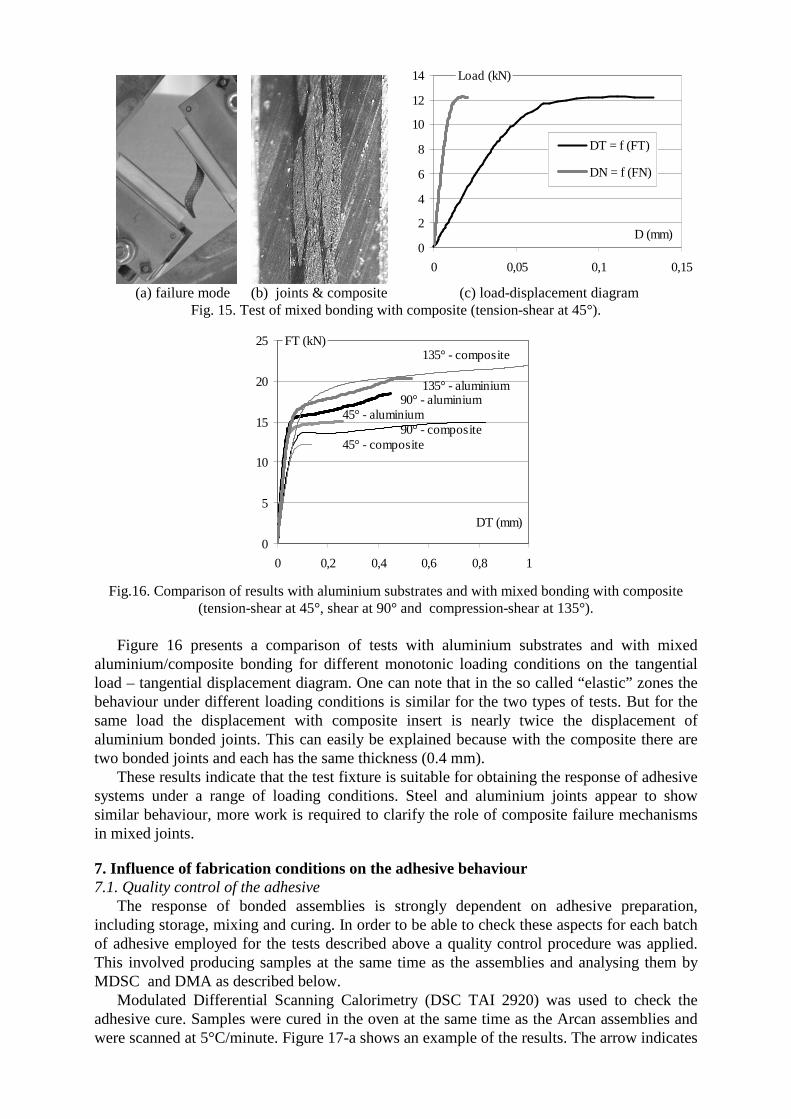
(a) failure mode (b) joints & composite (c) load-displacement diagram Fig. 15. Test of mixed bonding with composite (tension-shear at 45°).
Fig.16. Comparison of results with aluminium substrates and with mixed bonding with composite (tension-shear at 45°, shear at 90° and compression-shear at 135°).
Figure 16 presents a comparison of tests with aluminium substrates and with mixed
aluminium/composite bonding for different monotonic loading conditions on the tangential load – tangential displacement diagram. One can note that in the so called “elastic” zones the behaviour under different loading conditions is similar for the two types of tests. But for the same load the displacement with composite insert is nearly twice the displacement of aluminium bonded joints. This can easily be explained because with the composite there are two bonded joints and each has the same thickness (0.4 mm).
These results indicate that the test fixture is suitable for obtaining the response of adhesive systems under a range of loading conditions. Steel and aluminium joints appear to show similar behaviour, more work is required to clarify the role of composite failure mechanisms in mixed joints.
7. Influence of fabrication conditions on the adhesive behaviour 7.1. Quality control of the adhesive
The response of bonded assemblies is strongly dependent on adhesive preparation, including storage, mixing and curing. In order to be able to check these aspects for each batch of adhesive employed for the tests described above a quality control procedure was applied. This involved producing samples at the same time as the assemblies and analysing them by MDSC and DMA as described below.
Modulated Differential Scanning Calorimetry (DSC TAI 2920) was used to check the adhesive cure. Samples were cured in the oven at the same time as the Arcan assemblies and were scanned at 5°C/minute. Figure 17-a shows an example of the results. The arrow indicates
Load (kN)
0
2
4
6
8
10
12
14
0 0,05 0,1 0,15
D (mm)
DT = f (FT)
DN = f (FN)
FT (kN)
0
5
10
15
20
25
0 0,2 0,4 0,6 0,8 1
DT (mm)
135° - composite
90° - composite45° - composite
45° - aluminium90° - aluminium
135° - aluminium
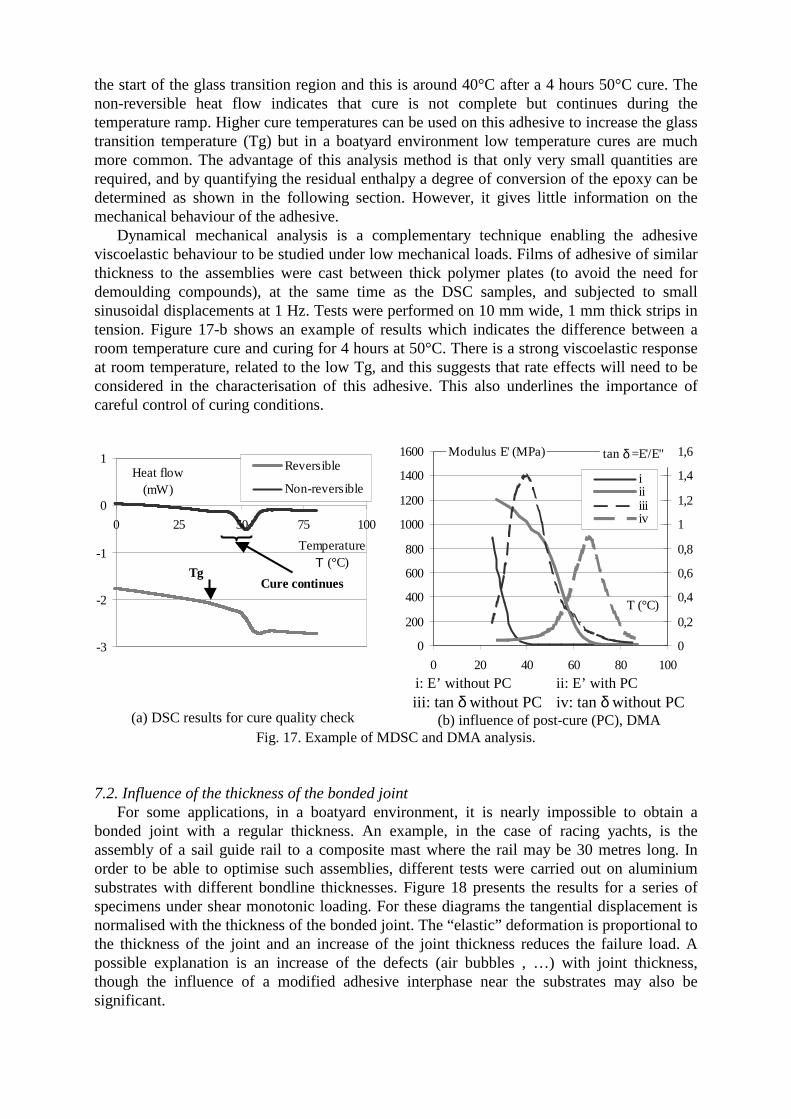
the start of the glass transition region and this is around 40°C after a 4 hours 50°C cure. The non-reversible heat flow indicates that cure is not complete but continues during the temperature ramp. Higher cure temperatures can be used on this adhesive to increase the glass transition temperature (Tg) but in a boatyard environment low temperature cures are much more common. The advantage of this analysis method is that only very small quantities are required, and by quantifying the residual enthalpy a degree of conversion of the epoxy can be determined as shown in the following section. However, it gives little information on the mechanical behaviour of the adhesive.
Dynamical mechanical analysis is a complementary technique enabling the adhesive viscoelastic behaviour to be studied under low mechanical loads. Films of adhesive of similar thickness to the assemblies were cast between thick polymer plates (to avoid the need for demoulding compounds), at the same time as the DSC samples, and subjected to small sinusoidal displacements at 1 Hz. Tests were performed on 10 mm wide, 1 mm thick strips in tension. Figure 17-b shows an example of results which indicates the difference between a room temperature cure and curing for 4 hours at 50°C. There is a strong viscoelastic response at room temperature, related to the low Tg, and this suggests that rate effects will need to be considered in the characterisation of this adhesive. This also underlines the importance of careful control of curing conditions.
(a) DSC results for cure quality check
i: E’ without PC ii: E’ with PC iii: tan δ without PC iv: tan δ without PC
(b) influence of post-cure (PC), DMA Fig. 17. Example of MDSC and DMA analysis.
7.2. Influence of the thickness of the bonded joint For some applications, in a boatyard environment, it is nearly impossible to obtain a
bonded joint with a regular thickness. An example, in the case of racing yachts, is the assembly of a sail guide rail to a composite mast where the rail may be 30 metres long. In order to be able to optimise such assemblies, different tests were carried out on aluminium substrates with different bondline thicknesses. Figure 18 presents the results for a series of specimens under shear monotonic loading. For these diagrams the tangential displacement is normalised with the thickness of the bonded joint. The “elastic” deformation is proportional to the thickness of the joint and an increase of the joint thickness reduces the failure load. A possible explanation is an increase of the defects (air bubbles , …) with joint thickness, though the influence of a modified adhesive interphase near the substrates may also be significant.
Heat flow(mW)
-3
-2
-1
0
1
0 25 50 75 100
Temperature Τ (°C)
Reversible
Non-reversible
TgCure continues
Modulus E' (MPa)
0
200
400
600
800
1000
1200
1400
1600
0 20 40 60 80 100
T (°C)
0
0,2
0,4
0,6
0,8
1
1,2
1,4
1,6
i iiiiiiv
tan δ =E'/E"
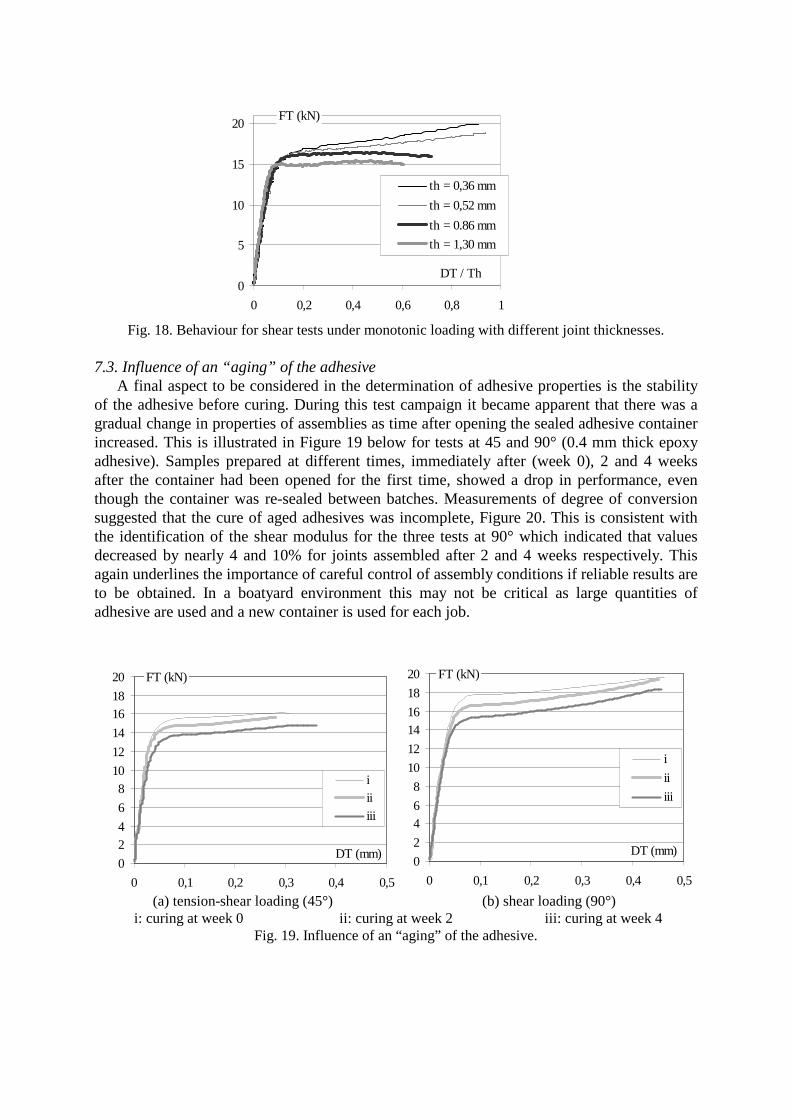
Fig. 18. Behaviour for shear tests under monotonic loading with different joint thicknesses. 7.3. Influence of an “aging” of the adhesive
A final aspect to be considered in the determination of adhesive properties is the stability of the adhesive before curing. During this test campaign it became apparent that there was a gradual change in properties of assemblies as time after opening the sealed adhesive container increased. This is illustrated in Figure 19 below for tests at 45 and 90° (0.4 mm thick epoxy adhesive). Samples prepared at different times, immediately after (week 0), 2 and 4 weeks after the container had been opened for the first time, showed a drop in performance, even though the container was re-sealed between batches. Measurements of degree of conversion suggested that the cure of aged adhesives was incomplete, Figure 20. This is consistent with the identification of the shear modulus for the three tests at 90° which indicated that values decreased by nearly 4 and 10% for joints assembled after 2 and 4 weeks respectively. This again underlines the importance of careful control of assembly conditions if reliable results are to be obtained. In a boatyard environment this may not be critical as large quantities of adhesive are used and a new container is used for each job.
(a) tension-shear loading (45°)
(b) shear loading (90°) i: curing at week 0 ii: curing at week 2 iii: curing at week 4
Fig. 19. Influence of an “aging” of the adhesive.
0
5
10
15
20
0 0,2 0,4 0,6 0,8 1
DT / Th
FT (kN)
th = 0,36 mm
th = 0,52 mm
th = 0.86 mm
th = 1,30 mm
FT (kN)
0
24
6
810
12
14
1618
20
0 0,1 0,2 0,3 0,4 0,5
DT (mm)
iiiiii
FT (kN)
0
2
46
8
10
12
1416
18
20
0 0,1 0,2 0,3 0,4 0,5
DT (mm)
i
ii
iii

Fig. 20. Degree of conversion of adhesive, MDSC, 50°C cure.
8. Conclusion The objective of this study is to develop tools able to predict the behaviour of adhesively
bonded assemblies for marine structures. The development of an Arcan type fixture, with modified edge geometry using a beak, making it possible to limit the edge effects, coupled with non-contact extensometry techniques allows a reliable analysis of the kinematics of the deformation of the joint of the adhesive in an assembly. Experimental results are presented, for a 0.4 mm thick epoxy adhesive prepared under the conditions encountered in a boatyard environment. They show a strong positive influence of compression on assembly strength. The tension/compression-shear fracture envelope has been determined and various aspects of the non-linear behaviour of the adhesive were observed for radial loadings of the fixture. In particular, creep or relaxation conditions have a large influence on the behaviour of the joint for this low glass transition temperature adhesive. The results obtained for mixed assemblies seem to show that the behaviour of the adhesive obtained by the procedure suggested is relatively independent of the type of metallic substrate. The influence of fabrication conditions of the adhesive joint (cure procedure, thickness of the joint …) have also been studied. This work is continuing to develop a full non-linear stress-displacement behaviour model [19, 20], in order to allow us to analyse the behaviour of industrial adhesively bonded assemblies for marine structures.
Acknowledgements The authors acknowledge the Bretagne Region of France for supporting this work.
References [1] Adams, R.D., Comyn, J., Wake, W.C, Structural adhesives joints in engineering, Chapman &
Hall, 2nd edition, 1997. [2] Davies, P. and Sargent, J.P., “Fracture Mechanics tests to characterize bonded glass/epoxy
composites : application to strength prediction in structural assemblies”, Proc. 3rd ESIS conference, Elsevier 2003.
[3] Penado F.E., Analysis of singular regions in bonded joints, Int. J. Fracture. 2000:105; 1-25. [4] Tong, L., Steven, G.P., Analysis and design of structural bonded joints, Kluwer, 1999. [5] American Society for Testing and Materials, ASTM D5656-95, Standard Test Method for Thick-
Adherend Metal Lap-Shear Joints for Determination of the Stress-Strain Behavior of Adhesives in Shear by Tension Loading, Annual Book of ASTM. 1995; 473-478.
[6] Vantico Ltd, Aerospace – Adhesive and Syntactics, Publication n° A307c-GB. [7] Cognard, J.Y., Davies, P., Gineste, B., Sohier, L., Development of an improved adhesive test
method for composite assembly design, Composite Science and Technology. 2005; 65: 359-368. [8] Cognard, J.Y., Davies, P., Sohier, L., Design and Evaluation of bonded composite assemblies,
4th European Congress on Computational Methods in Applied Sciences and Engineering, Jyvaskyla, Finland, cdrom, 2004, IBSN 951-39-1868-8, 20 pages.
Degree of conversion
0
0,1
0,2
0,3
0,4
0,5
0,6
0,7
0,8
0,9
1
0 25 50 75 100 125 150
Time (minutes)
"New" adhesive"Old" adhesive

[9] M. Fischer, M. Pasquier, 1989, Shear behaviour of structural adhesives in the bondline, Construction & Building Materials. 1989; 3: 31-34.
[10] Leguillon, D., Sanchez-Palancia, E., Computation of singular solutions in elliptic problems and elasticity, Editions Masson, Paris, 1987.
[11] Arcan, L., Arcan, M., Daniel, I., SEM fractography of pure and mixed mode interlaminar fracture in graphite/epoxy composites, ASTM Tech. Publ. 1987; 948: 41-67.
[12] Cheikh M., Coorevits P., Loredo A., Modelling the stress vector continuity at the interface of bonded joints, Int. J. Adhesion & Adhesives. 2001; 22: 249-257.
[13] Magalhães, A.G., De Moura, M.F.S.F., Goncalves, J.P.M., Evaluation of stress concentration effects in single-lap bonded joints of laminate composite material, Inter. J. Adhesion et Adhesives. 2005; 25: 313-319.
[14] Cognard J.Y., Thomas F., Verpeaux P., An integrated approach to solving mechanical problems on parallel computers, Advances in Engineering Software. 2000; 31: 885-899.
[15] Correlated Solutions Inc., Vic2D/Vic3D software, http://correlatedsolutions.com, 2002. [16] Claire D., Roux S., Hild F., Identification of thermal conductivities and elastic properties by field
analyses, Mécaniques & Industries. 2003; 4: 655-665. [17] Allix, O. and Corigliano, A., Geometrical and interfacial non-linearities in the analysis of
delamination in composites, Int. J. of Solids and Structures. 1999; 36: 2189-2216. [18] Bouchet J., Roche A.A., Hamelin P., Internal stresses, Young’s modulus and practical adhesion
of organic coatings applied onto 5754 aluminium alloy, Thin Solid Films, 355-356, 1999: 270-276.
[19] Chaboche J.L., Thermodynamic formulation of constitutive equations and application to the viscoplasticity and viscoelasticity of materials and polymers, Int. J. of Solids and Structures. 1997; 18: 2239-2259.
[20] Remond Y., Constitutive modelling of viscoelastic unloading of short glass fibre-reinforced polyethylene, Composite Science and Technology. 2005; 65: 421-428.