Embed Size (px)
Citation preview

INOM EXAMENSARBETE BIOTEKNIK,AVANCERAD NIVÅ, 30 HP
, STOCKHOLM SVERIGE 2017
A Study of the Microbial Biodegradation of a Lignin Monomer
CAROLINE NEHVONEN
KTHSKOLAN FÖR BIOTEKNOLOGI

www.kth.se


i
Author: Caroline Nehvonen
Main supervisor: Gunnar Henriksson
External supervisor: Sandra A. I. Wright, University of Gävle
Examiner: Qi Zhou
A study of the microbial biodegradation of a lignin monomer
En studie om mikrobiell nedbrytning av en ligninmonomer
Degree Project in Biotechnology, second cycle, BB200X, 30 credits
School of Biotechnology
KTH Royal Institute of Technology
This project was conducted at the University of Gävle.

ii

iii
Abstract Lignin is a polymer found in all vascular plants. This polymer can create problem during
utilization of lignocellulosic material due to its recalcitrance to degradation. Lignin can be
degraded with chemicals in the pulp and paper industry. In nature, there are microorganisms
with the ability to degrade this polymer. Research on how microorganisms degrade lignin has
been conducted for decades, but the pathways for lignin biodegradation are still not completely
understood. Lignin is a complex molecule so in this research, a lignin-derived substance called
vanillin has been used. The aim of this study was to investigate the possible biodegradation
pathway for vanillin. The study was conducted at the University of Gävle where a red yeast
(strain FMYD002) was cultivated in a liquid minimal medium supplemented with either 0.04
g/L (0.27 mM) or 0.12 g/L (0.77 mM) of vanillin. Samples were collected every 12 hours, from
0 h until 95 h. By studying the growth over time, it was illustrated that vanillin exhibits some
toxically effect where it slightly delays the lag phase for this strain of yeast. With TLC and
HPLC analyses, the results suggest that after 34 h, the yeast had transformed all vanillin and
presumably formed its alcohol derivate, vanillyl alcohol. At the highest, 0.10 g/L (0.6 mM)
vanillyl alcohol was produced from 0.12 g/L vanillin. When the yeast was cultivated in the
presence of vanillin, higher cell concentrations were obtained than when it was cultivated in the
absence of vanillin, suggesting that the yeast could transform the toxic vanillin and metabolize
the formed vanillyl alcohol. These results propose a potential role for the yeast in industrial
applications and perhaps in nature, in situations where lignin has been partially degraded, and
vanillin or other toxic degradation products of lignin have formed. The yeast continues the
biological transformation, in situations when other microorganisms would not survive.
Keywords: Yeast, vanillin, growth curve, quantification, vanillyl alcohol

iv
Sammanfattning Lignin är en polymer som återfinns i vaskulära växter. Lignin kan skapa problem vid
användning av material som innehåller lignocellulosa på grund av att lignin är tålig mot
nedbrytning. Lignin kan brytas ned med hjälp av kemikalier i massa- och pappersindustrin. I
naturen finns det mikroorganismer som innehar förmåga att bryta ner denna polymer. Forskning
om hur mikroorganismer bryter ned lignin har genomförts i årtionden men nedbrytningsvägarna
för lignin är fortfarande inte förstådda till fullständighet. Lignin är en komplex molekyl så i
denna studie valdes en substans som påvisats som nedbrytningsprodukt från lignin, nämligen
vanillin att arbetas med. Syftet med denna studie var att undersöka en möjlig
bionedbrytningsväg för vanillin. Studien utfördes på Högskolan i Gävle, där en röd jäst (stam
FMYD002) odlades i ett flytande minimalt medium tillsammans med antingen 0,04 g/L (0,27
mM) eller 0,12 g/L (0,77 mM) av vanillin. Var 12:e timme under 95 timmar togs prover från
odlingar. Genom att studera tillväxten över tid, illustrerades att vanillin uppvisar viss toxisk
effekt, där den fördröjer lag-fasen för denna jäststam. Från TLC- och HPLC-analyser visades
att efter 34 timmar hade jästen omvandlat vanillinet och troligen bildat vanillylalkohol. Som
högst producerades 0,10 g/L (0,6 mM) vanillylalkohol från 0,12 g/L vanillin. När jästen odlades
tillsammans med vanillin uppmättes högre cellkoncentrationer än när den odlades utan vanillin,
vilket indikerar att jästen innehar möjlighet att transformera det toxiska vanillinet och
metabolisera den bildande vanillylalkoholen. Dessa resultat föreslår en potentiell roll för jästen.
Jästen skulle kunna användas inom industrin och kanske ha en roll i naturen i situationer där
lignin delvis nedbrutits och vanillin eller andra toxiska nedbrytningsprodukter av lignin bildats.
Den fortsätter då den biologiska nedbrytningen, i lägen där andra mikroorganismer ej skulle
överleva.
Nyckelord: Jästsvamp, vanillin, tillväxtkurva, kvantifiering, vanillylalkohol

Table of Contents
1 Introduction ........................................................................................................................ 2
2 Materials and Methods ....................................................................................................... 4
2.1 Yeast strain and cultivation media ............................................................................... 4
2.2 Cultivation of the yeast in the presence of vanillin ..................................................... 4
2.3 Analytical methods ...................................................................................................... 5
2.3.1 Cell growth ........................................................................................................... 5
2.3.2 Thin-Layer Chromatography (TLC) .................................................................... 5
2.3.3 High-Performance Liquid Chromatography (HPLC) .......................................... 6
2.4 Experiment 1 ................................................................................................................ 6
2.5 Experiment 2 ................................................................................................................ 7
2.6 Experiment 3 ................................................................................................................ 7
2.7 Experiment 4 ................................................................................................................ 7
3 Results ................................................................................................................................ 8
3.1 Growth over time for FMYD002 ................................................................................. 8
3.2 Vanillin biodegradation by the yeast strain FMYD002 ............................................. 10
4 Discussion ........................................................................................................................ 17
4.1 Cultivation of strain FMYD002 in the presence of vanillin ...................................... 17
4.2 Biodegradation of vanillin ......................................................................................... 18
4.3 Applications and future prospects ............................................................................. 20
5 Acknowledgements .......................................................................................................... 21
6 References ........................................................................................................................ 22
Appendix 1 – LiBa (Lilly and Barnett) medium preparation ................................................... 26
Appendix 2 – Equation used for calculations ........................................................................... 27
Appendix 3 – Experiment 1 ..................................................................................................... 28
Appendix 4 – Experiment 2 ..................................................................................................... 29
Appendix 5 – Experiment 3 ..................................................................................................... 31
Appendix 6 – Experiment 4 ..................................................................................................... 32
Appendix 7 – Absorbance vs. cell concentration ..................................................................... 33
Appendix 8 – White colonies ................................................................................................... 34
Appendix 9 – Standard curves for HPLC ................................................................................. 36
Appendix 10 – HPLC default reports ....................................................................................... 38
Appendix 11 – HPLC chromatograms ..................................................................................... 41

2
1 Introduction In the cell walls of vascular plants, the polymers cellulose, hemicellulose, and lignin are located
[1] [2]. Depending on the material, the proportion of these polymers may differ, depending on
the specific need [3]. Lignin is the focus of this report. It is synthesized by polymerization of
mainly three phenolic monomers called p-coumaryl alcohol, coniferyl alcohol, and sinapyl
alcohol. The lignin present in plants and wood contain different ratios of these components,
making lignin a highly heterogeneous molecule. [1]. Lignin is distributed inside and between
the cell walls of lignified wood and serves the purpose of binding the wood fibers to create
rigidity of the cell walls. Other functions that lignin serve are the internal transport of water [4]
and acting as a protective substance against microbial degradation [5].
Lignin is considered to be a promising renewable feedstock [6] but due to the large
heterogeneity of lignin, Experimental research on lignin and lignification can be complex [5].
Cellulose, hemicellulose, and lignin can store the energy acquired by photosynthesis which can
be accessed by man - for example - when burning wood or in bioconversion processes
(enzymatic conversion for example). Uses for lignocellulose contents include the production of
bio-ethanol (after that first have been converted to glucose and other fermentable sugars) and
paper. [7]. An essential aspect in the production of paper and bioethanol is the removal of lignin.
[8]. However, the removal can be considered an obstacle, due to the toughness of lignin and
that it is extremely recalcitrant to degradation [7]. In the pulping industry, most of the removed
lignin is burned [9]. The technical removal of lignin from wood can be performed by several
methods, where two examples are Kraft pulping and sulphite process [10]. The Kraft pulping
process is the main method in paper production, accounting for around 85 % of the total lignin
production worldwide [11] [12]. After the processes of lignin removal, some lignin is still
present. Depending on the amount of remaining lignin, the quality of the paper may differ [13].
In nature, the lignin present in wood can be degraded by several microorganisms.
Biodegradation of lignin has been thoroughly studied. It is accomplished by specific groups of
wood decay fungi, named white rot, brown rot, and soft rot. One of the groups most efficient at
degrading lignin is the white rot fungi [14], which has received its name from the bleaching
process that occurs throughout the degradation of wood by fungi [15]. The fungus is a
basidiomycete and is predominantly responsible for wood decay in forests containing
hardwood. [14] [16]. There are several white rot fungi with the ability to degrade wood and
they use different approaches. To degrade lignin, the white rot fungi use a combination of
ligninolytic enzymes, mediators, organic acids, and accessory enzymes [16]. To initiate the
depolymerization of lignin, three kinds of extracellular enzymes have been found; lignin
peroxidases, manganese peroxidase, and laccase. [17]. This process for which white rot fungi
can degrade lignin has been studied for decades to act as a model for biotechnological
application regarding for example the pulp and paper industry and bioethanol production [18].
Much focus has been laid on fungal degradation of lignin due to their high biological activity
[19]. The well-studied white-rot fungus, Phanerochaete chrysosporium has been used as a
model for lignin degradation [15] [20]. Fungi is not the sole microorganism to degrade lignin,
several bacteria isolated from soil have also been observed to metabolize lignin. Examples of
bacteria include Nocardia sp. [21], and bacteria belonging to the genera Pseudomonas and
Flavobacterium [22].
Even though there are large amounts of studies, the pathways for biodegradation of lignin into
different intermediates are not fully understood [7]. One substance that has been demonstrated
as a degradation product by microorganisms from lignin model components [23] [24] [25] and

3
used as a model component in lignin degradation studies is 4-Hydroxy-3-methoxybenzaldehyde
[7] [26] [27].
4-Hydroxy-3-methoxybenzaldehyde (Figure 1), more commonly known as vanillin, is an
aromatic compound [28] with a sweetish smell [29]. The primarily use for vanillin include
flavoring of food and beverages, and in the pharmaceutical industry. Fragrance companies also
use this aromatic compound [30]. Vanillin is typically produced via chemical synthesis [31].
Vanillin can also be produced from lignin [32] where Kraft lignin is an example used for this
purpose [33].
Moreover, vanillin has been ascribed antifungal activity and inhibits the growth of several
yeasts [34]. Saccharomyces cerevisiae, Zygosaccharomyces bailii and Zygosaccharomyces
rouxii are yeasts whose growth was inhibited when cultured in the presence of vanillin. Vanillin
did not completely inhibit the growth, due to the ability of the to bioconvert the vanillin into
compounds with a reduced antifungal activity. [35]. Some frequently identified
biotransfrmeation products of vanillin, produced by fungi are vanillyl alcohol (Figure 1) and
vanillic acid [35] [36]. Bioconversion of vanillin into these compounds are not limited to fungi.
The bacterium Klebsiella pneumoniae formed vanillyl alcohol and it accounted for 43.5 % of
the vanillin added [37] and the bacterium Rhodococcus jostii transformed vanillin into vanillic
acid [38].
Figure 1: A: The chemical structure of vanillin. B: The chemical structure of vanillyl alcohol.
This study will focus on one strain of yeast (named FMYD002), which was collected from old
wooden houses. The yeast has not been designated to a species. During growth, the culture
obtains a pink colour. Yeasts carrying this pigment are collectively called red yeasts and the
color can be explained by their production of carotenoids [39]. The yeast strain studied has
illustrated the ability to grow on microbial media supplemented with lignin (Wright and
Rönnander, personal communication). In order to further analyze the relationship of this yeast
to lignin, the lignin-derived chemical vanillin was selected as a model component. By
cultivating the yeast in the presence of vanillin, its ability to biodegrade vanillin will be
examined. Different degradation products for vanillin have been suggested in literature, such
as vanillic acid and vanillyl alcohol. At the University of Gävle (Rönnander and Wright), a
working hypothesis was that vanillyl alcohol could be the major vanillin biodegradation product
formed by this yeast, but at the same time, not excluding the possible formation also of vanillic
acid. This study will further investigate this proposal and has also examine the amount of
vanillin that is being reduced into the proposed vanillyl alcohol. A growth curve was produced
to acquire an understanding of how the yeast grow in the presence of vanillin and to observe
the potential inhibitory effect that vanillin may have on this microorganism.
A B

4
2 Materials and Methods
2.1 Yeast strain and cultivation media The yeast strain FMYD002 was isolated from old wooden houses on the Faroe Islands by Jonas
Rönnander, PhD student at the University of Gävle.
The yeast was grown in two different media, one solid medium and one liquid medium.
The solid medium, called yeast extract-peptone dextrose (YEPD) medium contained yeast
extract (3 g/L), peptone (10 g/L), glucose (10 g/L), and bacteriological agar (20 g/L) and was
prepared according to a given recipe [40]. It was used for maintaining the yeast culture and for
viable count analyses.
Lilly-Barnett medium (will be abbreviated to LiBa medium in this report) was used for
cultivation in liquid condition. The LiBa medium was composed of asparagine (2 g), glucose
(10 g), KH2PO4 (1 g), MgSO4 x 7H2O (0.5 g), FeSO4 x 7H2O (1 mg), ZnSO4 x 7H2O (0.87 g),
MnSO4 x H2O (0.3 g), biotin (0.01 g), thiamine (0.01 g), and Milli Q water [41]. The full recipe
and instructions for the preparation of LiBa medium is presented in Appendix 1.
2.2 Cultivation of the yeast in the presence of vanillin The yeast was streaked on a YEPD-plate to obtain isolated colonies and was allowed to grow
in room temperature for 48 h. A single colony of the yeast was placed in 20 mL LiBa in a 100-
mL culture flask the flask was subsequently and placed on an orbital shaker (ES-20, Biosan) at
230 rpm, 25˚C for 24 h. This was a so-called pre-culture. A control consisting of 20 mL LiBa
in a culture flask was also placed on the orbital shaker. The contents of the pre-culture were
poured into a Falcon tube, from which 100 µL were pipetted into an Eppendorf tube containing
900 µL LiBa medium. From the Eppendorf tube, 10 µL were transferred and mixed with 10 µL
methylene blue in a new Eppendorf tube. With a pipette, 10 µL were placed on a hemocytometer
slide and the number of cells was determined by counting of single cells in a microscope. Dead
cells were stained blue and the living cells had no color. An application in the mobile phone
called HemocyTap (v 1.1, Raul Garcia Villalba, London) was used to calculate the cell
concentration in the pre-culture. The Falcon tube was centrifuged (Z 380, HermLe) at 3400 rpm
for 5 min. The supernatant was discarded and new LiBa was added in order to concentrate cells
in the pre-culture by 10x.
A stock solution of vanillin was prepared by dissolving 0.15 g vanillin with a few drops of 96%
ethanol. When it had dissolved, LiBa medium was added up to a volume of 10 mL, creating a
0.1 M stock solution of vanillin.
The initial yeast cell concentration of the main culture was adjusted to 6 x 10⁶ CFU/mL. The
equation used to calculate the necessary volume to be transferred from the pre-culture to the
main culture is presented in Appendix 2. The cultivation was subsequently carried out in a 500-
mL culture flask, and consisted of yeast suspension from pre-culture, 0.15 g/L (1 mM) vanillin
from the stock solution, and LiBa medium. The volume of the culture was 80 mL and when the
three components had been added, the flask was placed in an orbital shaker at 230 rpm, 25˚C
for 95 h.
Three controls were made in 100-mL culture flasks where the first contained 20 mL LiBa
medium, the second control consisted of 20 mL LiBa medium supplemented with 0.15 g/L

5
vanillin, and the final control was LiBa medium inoculated with the same aliquot of cell
suspension from the pre-culture. The controls were also placed on the orbital shaker.
2.3 Analytical methods During the cultivation of yeast in the presence of vanillin, a sample was collected from the main
culture every 12th hour. The sample was collected by pouring 5 mL from the culture flask into
a Petri dish. From that Petri dish, the sample was distributed and analyzed with several methods.
The distributed sample was kept on ice when not analyzed.
2.3.1 Cell growth
Cell growth was studied by using three methods of observation; measuring the absorbance,
counting the cells in the hemocytometer, and counting cells by viable count.
Prior to measuring the absorbance in the spectrophotometer (Shimadzu UV Visible
Spectrophotometer, UV-mini 1240), a baseline was performed with a cuvette containing 900
µL LiBa medium. After the baseline had been completed, the absorbance of each sample was
determined by transferring 1 mL of the sample from a Petri dish to a cuvette by a pipette and
measuring the absorbance at 620 nm.
To calculate the cell concentration with a hemocytometer, the same procedure was performed
as described in 4.2, with the exception that in some cases one more dilution of sample and LiBa
medium was performed.
The viable count began by diluting 100 µL of sample in 900 µL of autoclaved tap water in an
Eppendorf tube. Serial dilution was made in Eppendorf tubes, from which 100 µL were taken
from five of the dilutions and spread on YEPD-plates. For one of the dilutions, two plates were
spread with 100 µL each. The plates were allowed to grow in room temperature for four days
until single colonies appeared and could be counted.
2.3.2 Thin-Layer Chromatography (TLC)
From a collected sample of the main culture, 3 mL was distributed into three Eppendorf tubes
that was centrifuged (Heraeus Biofuge Fresco) at 5000 rpm for 5 min. The supernatant was
filter sterilized with a 5 mL syringe through a syringe filter (0.2 µm Cellulose Acetate
Membrane, VWR) into new Eppendorf tubes, which were placed in a freezer (-20 ˚C). At the
time for TLC analysis, 2 mL of each sample (0-95 h) was defrosted and pipetted to separate
glass centrifuge tubes. The pH was then set to ~2 by adding 100 µL 0.5 N HCl. To each
centrifuge tube, 800 µL of ethyl acetate was added and the tubes were vortexed carefully for 1
minute. The tubes were then centrifuged (Thermo Scientific, Jouan) for 5 min at 8000 min-1.
After the centrifugation, 500µL of the upper phase was transferred into a small glass tube. The
ethyl acetate was evaporated with nitrogen gas for around 15 min and 20 µL of additional ethyl
acetate was added to the glass tubes. Screw caps were used to seal the small glass tubes
immediately after the ethyl acetate had been added. The tubes were then carefully rotated to
obtain all the sample. From each sample, 20 µL were transferred to the TLC plate (Merck
KGaA, TLC Silica gel 60 F254). The addition of sample to the TLC plate was performed by
pipetting a small drop on the plate, drying the drop with a hair dryer and then adding a new
drop on the same place as the first drop had dried. This procedure was repeated until the whole
volume had been loaded onto the TLC plate.

6
Standards of 10 mM vanillin, 5 mM vanillic acid, 10 mM vanillyl alcohol, 1 mM Catechol, and
5 mM protocatechuic acid had been prepared by dissolving in ethyl acetate, and 10 µL of each
standard was added onto the TLC plate.
When the TLC plate contained all the samples and standards, it was placed in a TLC tank
containing toluene, ethylacetate, and, formic acid, in a 4:5:1 proportion.
When the TLC had run to completion (after 1 h and 15 min), the plate was taken out of the tank
and when it was dry, the plate was observed under UV light (254 nm). The plate was then
stained with 0.5% MBTH (3-Methyl-2-benzothiazolinone hydrazine) and was placed in an oven
at 120 ˚C for 30 minutes.
2.3.3 High-Performance Liquid Chromatography (HPLC)
The HPLC system consisted of TotalChrom v6.2.0.0.1 with LC instrument control
(PerkinElmer series 200) and a Brownlee analytical C18 column 100x4.6 mm (3 µm). The
solvent flow was 1.0 mL/min and the elution was monitored by UV/VIS detector (PerkinElmer
series 200) at 254 nm.
The mobile phase used for HPLC contained methanol and Milli Q water and was prepared by
mixing the two liquids in a flask and filter-sterilizing (Thermo Scientific, Nalgene Rapid-Flow)
the solution. Prior to the HPLC analysis, the mobile phase was de-aerated in a UV bath and the
mobile phase was allowed to run through the HPLC system for 15 min.
Standard curves for vanillin and vanillyl alcohol were generated. Six concentrations (0.075,
0.125, 0.25, 0.5, 1, and 2 mM) were prepared by dissolving vanillin in LiBa medium. The
standards were analyzed in triplicates in the HPLC. The ratio of methanol and Milli Q water
was 30/70 in the mobile phase during the production of standard curves.
When a sample from the main culture was collected, 1 mL of the collected sample was
transferred into an Eppendorf tube and centrifuged at 5000 rpm for 5 min. The supernatant was
then filter-sterilized by using a syringe equipped with a filter (0.2 µm), and placed in a new
Eppendorf tube, which was subsequently placed in a freezer (at -20 ˚C). The day of analysis,
the samples from the freezer were placed on ice. At the time for a sample to be analyzed, that
sample was defrosted. Directly after the sample had defrosted, around 70 µL was collected with
a 100 µL syringe and loaded into the manual injector, where 1 µL was taken up by the HPLC
for analysis. The ratio of methanol and water was 20/80 in the mobile phase during the entire
run. New batches of the mobile phase had to be made during analysis.
2.4 Experiment 1 The protocol above (section 4.3) was followed with some modifications. The yeast had been
growing on a YEPD-plate for 10 days before collecting single colonies for a pre-culture. The
pre-culture started by collecting two colonies and dissolving them in two culture tubes
containing 5 mL LiBa medium. A control was made by pipetting 5mL LiBa medium into a
culture tube. All three tubes were placed in a shaker for 24 h. After 24 h, two small culture
flasks were prepared by pipetting 2 mL from the culture tubes and 18 mL LiBa medium. These
two culture flasks were placed on an orbital shaker at 230 rpm at 25oC for 24h. The vanillin
stock solution was made by dissolving vanillin in only LiBa medium. To start a main culture,
one 500 mL cultivation flask containing LiBa medium and 0.04 g/L vanillin (according to
HPLC results for Experiment 2) was started from the pre-culture. The controls used for the
main cultivation were cultivated in Falcon tubes. Two controls were made, one with only LiBa

7
medium and one with LiBa medium supplemented with vanillin. No HPLC analysis was
performed for this Experiment
2.5 Experiment 2 The protocol from section 4.3 was followed with some modifications. Four single colonies of
strain FMYD002, which had been growing on a YEPD-plate were used to initiate a pre-culture
in four 100 mL culture flasks. They were allowed to grow for 48 h on an orbital shaker. The
control for the pre-culture was cultivated in a Falcon tube. The contents of the pre-culture were
used to start up two cultivations in 500 mL culture flasks (i.e. the main culture). One flask
contained 0.04 g/L vanillin (according to HPLC results) and the other flasks only contained the
LiBa medium. The same stock solution of vanillin which had been prepared for Experiment 1
was also used in this Experiment. The controls used for the main cultivation were utilized in
Falcon tubes. Two controls were prepared, one with only LiBa medium and one with LiBa
medium supplemented with vanillin. No TLC analysis was performed for this Experiment.
2.6 Experiment 3 The protocol from section 4.3 was followed with some modifications. Three 100 mL culture
flasks with single colonies of strain FMYD002 and 20 mL of LiBa medium in each flask were
shaken for 48 h in an orbital shaker. A control was made in a Falcon tube containing 5 mL
LiBa. A new stock solution of vanillin was prepared by dissolving vanillin in LiBa. The
contents of the pre-culture were used to start one cultivation in a 500 mL culture flask
containing 0.01 g/L vanillin (according to HPLC results).
2.7 Experiment 4 The protocol from section 4.3 was followed, with the exception that no viable count was
performed. The pre-culture started by collecting 10 colonies and dissolving them in 10 small
culture flasks containing 20 mL LiBa medium. A control was prepared by pouring 20 mL of
LiBa medium into one small culture flask. The pre-culture was placed on the orbital shaker for
24 h. The contents of the pre-culture were used to start four main cultures in 500 mL culture
flasks (replicates named A, B, C, and D), where each contained 0.12 g/L of vanillin (according
to HPLC results) from a new stock solution of vanillin. After 47 h of cultivation, a sterile wire
loop of cultivation broth from each replicate was taken and streaked onto four YEPD-plates.
The plates were placed in room temperature.
TLC analysis was performed for two of the replicates, A and B.

8
3 Results This study has involved four Experiments (1, 2, 3, and 4) where the yeast strain FMYD002 was
cultivated in LiBa medium supplemented with vanillin and monitored for approximately 95 h.
At every 12th hour during cultivation, a sample was collected and analyzed by measuring the
absorbance and determining the cell concentration via both viable count and with a
hemocytometer. In addition, cell free extracts were subjected to TLC analyses, to monitor the
biodegradation over time and to HPLC analyses to quantify the degradation products.
3.1 Growth over time for FMYD002
The absorbance, viable count, and hemocytometer analyses were performed to study the growth
for FMYD002. Viable count was not performed in Experiment 4. The raw data for Experiment
1, 2, 3, and 4 are presented in Appendix 3, 4, 5, and 6, respectively.
In Experiment 2, one main culture containing 0.04 g/L vanillin and one culture which only
contained the medium for the yeast to grow in, were cultivated simultaneously. This was the
only Experiment with this setup. A comparison of the growth events over time for these
cultivations can be seen in Figure 2. The values used are the mean from the viable count and
the hemocytometer. A delay in entering the log (exponential) phase was observed when vanillin
was present. However, the cell concentration was calculated to higher values in the vanillin
culture (maximum 113.5 x 10⁶ CFU/mL) compared to the LiBa medium culture (the highest
obtained value was 21.25 x 10⁶ CFU/mL).
Figure 2: Growth curves for FMYD002 over time when cultivated only in LiBa medium (x) and in 0.04 g/L vanillin (●). The
values represent the mean value obtained from viable count and hemocytometer. The standard deviation is included.
The procedure for measuring the absorbance was faster as compared to viable count and
hemocytometer analyses. It was explored if the absorbance and cell concentration were
correlated to each other in a way where the absorbance analysis could replace the other methods
for a faster analysis. By plotting the absorbance against the cell concentration, it was considered
that the absorbance could give an appropriate assumption of the cell concentration when
FMYD002 is cultivated with vanillin. It was also seen in the growth curves made from the
absorbance and the growth curves made from the cell concentration that they matched each
other in terms of the time events. This can be seen in Figure 3 where the growth curves for
Experiment 4 is used as a representative.
0
20
40
60
80
100
120
140
160
0 20 40 60 80 100 120
Ce
ll co
nc.
(1
06
CFU
/mL)
Incubation time (h)
LiBa Vanillin

9
Figure 3: Growth curves for FMYD002 over time when cultivated with 0.12 g/L vanillin. The values represent a mean of the
results obtained from the four replicates in Experiment 4. The error bars correspond to the standard deviation. The line
represents a trendline of moving average (2 period). A: The absorbance over time measured at 620 nm. B: The cell
concentration over time.
Several of the plates during viable count did not only contain pink colonies of strain FMYD002.
They also contained some white colonies, see Figure 4. The white colonies appeared in all
Experiments when viable count was performed (Experiment 1, 2, and 3), but with different
frequencies. The number of white colonies on each plate used for viable count can be seen in
Appendix 8. The white colonies were not included when counting the colonies in the viable
count.
0
0,2
0,4
0,6
0,8
1
1,2
1,4
0 20 40 60 80 100 120
OD
620
nm
Incubation time (h)
0
10
20
30
40
50
60
0 20 40 60 80 100 120
Ce
ll co
nc.
(1
06
CFU
/mL)
Incubation time (h)
A
B

10
Figure 4: Picture photographed through a microscope displaying the white colonies that emerged in some cases during
viable count. The arrows indicate the observed white colonies.
The possible contamination was thought to be absent in the main culture due to no differences
in cells were noticed when performing the hemocytometer analyses. Some suggestions of where
the contamination entered involves the tap water used for the serial dilutions, or failures in
keeping everything sterile. For Experiment 3, these factors were assumed to be eliminated to
avoid contamination. The white colonies emerged nevertheless. Another suggestion for the
reason for contamination was that when performing the dilution series, autoclaved Eppendorf
tubes were used and when their lids were to be closed, the inside of the lid was inadvertently
touched sometimes, and those times may have contaminated the contents of the tube.
No viable count was performed in Experiment 4. However, after 47 h of cultivation, one loop
from each replicate was steaked onto YEPD-plates. No white colonies emerged on any of these
plates which presents more evidence that the contamination was not present in the main
cultures. Pictures of these plates is presented in Appendix 8.
3.2 Vanillin biodegradation by the yeast strain FMYD002
To study the biodegradation of vanillin, TLC and HPLC analyses were performed. TLC was
carried out for Experiment 1, 3 and 4. However, samples from a whole series cultivation (0-95
h) was done only for Experiment 4, in replicates A and C. The TLC for replicate A and C can
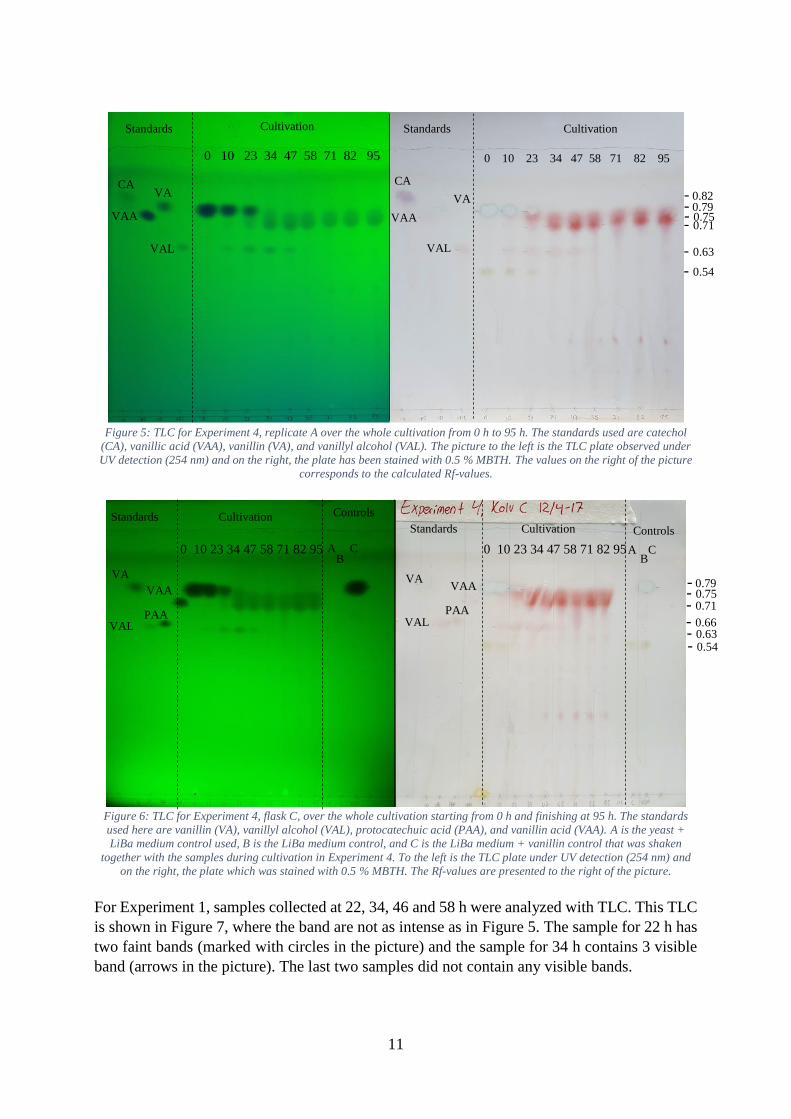
be seen in Figure 5 and 6 where at time 0, only one band is visible (Rf-value 0.79). This band
is the vanillin, which is present at the strat of the cultivation. When observing the presence of
this band over time, it is evident that after 34 h, the band is no longer visible, which might
suggest that the vanillin has been biotransformed by the yeast. The yellow bands in Figure 5
and 6 (Rf-value 0.54) are suggested to correspond to a substance from the LiBa medium.
11
Figure 5: TLC for Experiment 4, replicate A over the whole cultivation from 0 h to 95 h. The standards used are catechol
(CA), vanillic acid (VAA), vanillin (VA), and vanillyl alcohol (VAL). The picture to the left is the TLC plate observed under
UV detection (254 nm) and on the right, the plate has been stained with 0.5 % MBTH. The values on the right of the picture
corresponds to the calculated Rf-values.
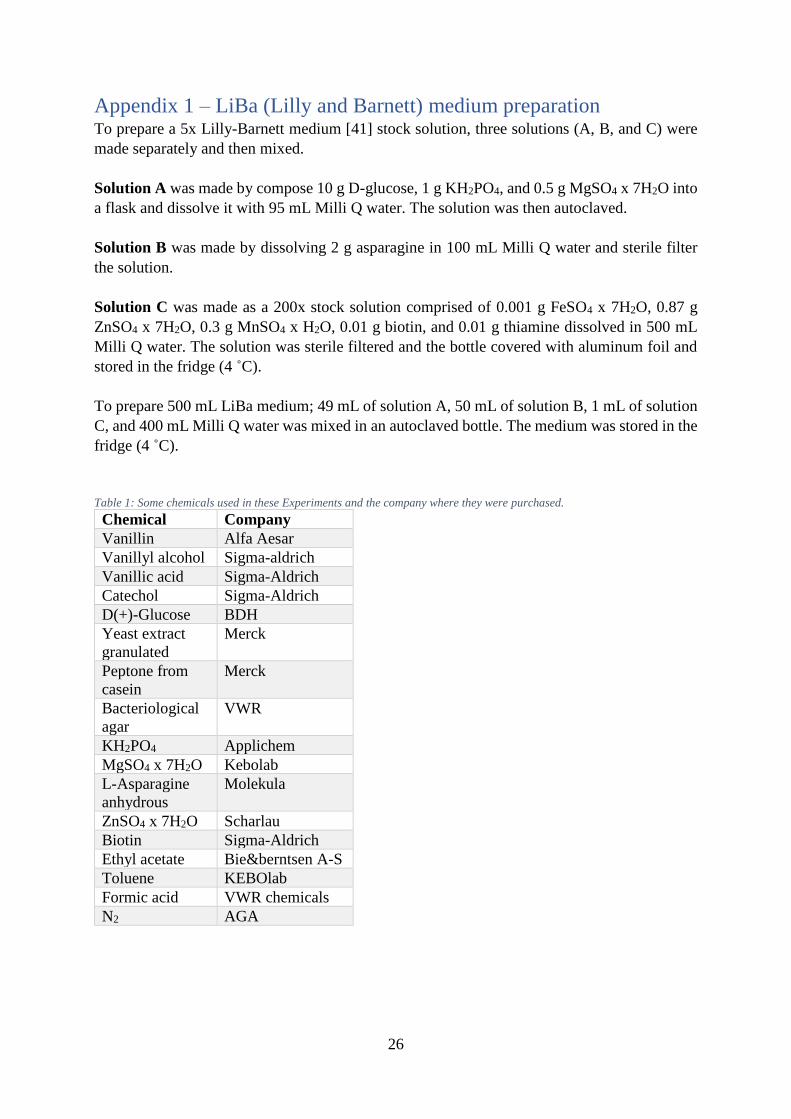
Figure 6: TLC for Experiment 4, flask C, over the whole cultivation starting from 0 h and finishing at 95 h. The standards
used here are vanillin (VA), vanillyl alcohol (VAL), protocatechuic acid (PAA), and vanillin acid (VAA). A is the yeast +
LiBa medium control used, B is the LiBa medium control, and C is the LiBa medium + vanillin control that was shaken
together with the samples during cultivation in Experiment 4. To the left is the TLC plate under UV detection (254 nm) and
on the right, the plate which was stained with 0.5 % MBTH. The Rf-values are presented to the right of the picture.
For Experiment 1, samples collected at 22, 34, 46 and 58 h were analyzed with TLC. This TLC
is shown in Figure 7, where the band are not as intense as in Figure 5. The sample for 22 h has
two faint bands (marked with circles in the picture) and the sample for 34 h contains 3 visible
band (arrows in the picture). The last two samples did not contain any visible bands.
CA
VAA
VA
VAL
CA
VAA
VA
VAL
Standards Cultivation Standards Cultivation
0 10 23 34 47 58 71 82 95 0 10 23 34 47 58 71 82 95
Cultivation Cultivation Standards
Standards Controls
Controls
0 10 23 34 47 58 71 82 95 0 10 23 34 47 58 71 82 95
VA
VAL PAA
VAA VAA
PAA VAL
VA
C A A B B
C
- 0.82 - 0.79 - 0.75 - 0.71
- 0.63
- 0.54
- 0.79 - 0.75
- 0.66 - 0.63
- 0.71
- 0.54

12
Figure 7: TLC for Experiment 1 for sample corresponding to 22 h, 34 h, 46 h, and 58 h. The standards used here are vanillin
(VA), Vanillyl alcohol (VAL), and Vanillic acid (VAA). To the left, the plate has been stained with 0.5 % MBTH and on the
right, the TLC plate is visualized under UV (254 nm). The Rf-values are presented to the right of the picture.
The last TLC conducted was that for Experiment 3, where four samples were chosen for
analysis, see Figure 8. These samples corresponded to 0, 10, 23, and 34 h of cultivation. In this
TLC, the vanillin spot (Rf-value 0.55) is decreasing in intensity over time.
Figure 8: TLC for Experiment 3 with samples from 0 h to 34 h of cultivation. The standards used here are vanillin (VA) and
vanillyl alcohol (VAL). To the left is the TLC plate under UV detection (254 nm) and on the right, is the plate that has been
stained with 0.5 % MBTH. The Rf-values are presented to the right of the picture.
The biodegradation of vanillin was also analyzed with HPLC. The HPLC analyses were
performed for Experiment 2, 3, and 4. From HPLC, it was observed that the concentration of
vanillin was decreasing over time. With the use of a standard curve (Appendix 9), the initial
concentration in each Experiment and the change in concentration over time could be
calculated, see Table 1. According to calculations based on the area under the peak in HPLC,
the initial concentration of vanillin in Experiment 2 was 0.04 g/L (0.27 mM), Experiment 3 had
0.01 g/L (0.07 mM) and Experiment 4 contained 0.12 g/L (0.77 mM). The vanillin in
VA
VAL
VA
VAL
Cultivation Cultivation
Cultivation Cultivation
Standards Standards
Standards Standards
VA
VAL
VAA VA
VAL
VAA 22 34 47 58 22 34 47 58
0 10 23 34 0 10 23 34
- 0.72 - 0.69
- 0.59
- 0.55 - 0.53
- 0.44 - 0.36

13
Experiment 2 and 3 had disappeared after 23 h, but in Experiment 4 some vanillin was still
present at that time point. For Experiment 4, all vanillin had been removed after 34 h. The
default reports from the HPLC analyses are presented in Appendix 10.
Table 1: The concentration of vanillin at different times during cultivation of FMYD002 in Experiment 2, 3, and 4.
The concentrations are calculated from the chromatograms obtained from HPLC.
Hours of
cultivation
Experiment 2
[g/L]
Experiment 3
[g/L]
Experiment 4
[g/L]
0 0.04 0.01 0.12
10 0.03 0.006 0.10
23 0 0 0.03
34 0 0 0
When vanillin began to biodegrade, a new substance was formed. The results obtained for
Experiment 4 from both TLC (Figure 5 and 6, Rf-value 0.63) and HPLC (Table 2) shows that
this compound is observed after 10 h and disappeared after 47 h. The identity of this compound
is suggested to be vanillyl alcohol. A Standard of vanillyl alcohol was always included in TLC
analyses and also with HPLC analyses (Appendix 11). The newly formed compound during
cultivation showed similarities with the standard of vanillyl alcohol, which provides a
suggestion that vanillyl alcohol is a possible biodegradation product from vanillin by this yeast
strain. Quantification of this substance in the four Experiments was performed as if it were
vanillyl alcohol that had formed. In Experiment 4, the highest concentration of what is
presumed to be vanillyl alcohol was observed, where 0.01 g/L (0.6 mM) vanillyl alcohol had
formed after 34 h. The formed vanillyl alcohol accounted for 83% of vanillin added. In
Experiment 2, 0.01 g/L vanillyl alcohol was formed (which corresponds to 25 % of the vanillin
added) and 0.05 g/L was formed in Experiment 3 from 0.01 g/L of vanillin.
Table 2: The concentration of vanillyl alcohol (VAL) at different time points during cultivation of FMYD002 compared to the
concentration of vanillin (VA) at each time point. The concentrations are calculated from the chromatograms obtained from
the HPLC analyses.
Hours of
cultivation
Experiment 2
[g/L]
Experiment 3
[g/L]
Experiment 4
[g/L]
VA VAL VA VAL VA VAL
0 0.04 0 0.01 0 0.12 0
10 0.03 0.003 0.006 0.01 0.10 0.02
23 0 0.01 0 0.05 0.03 0.07
34 0 0.003 0 0.03 0 0.1
47 0 0 0 0 0 0.06
The graph seen in Figure 9 displays the change in concentration over time for vanillin and
vanillyl alcohol according to the HPLC. Chromatograms from Experiment 4 representing
cultivation times 0, 23, and 34 h show the disappearance of vanillin and the formation of vanillyl
alcohol, as seen in Figure 10.

14
Figure 9: Graph displaying the time course of biodegradation of vanillin (▲) with the subsequent formation of vanillyl
alcohol (●) according to HPLC analyses. The result represents the mean of the obtained values from Experiment 4.
0
0,02
0,04
0,06
0,08
0,1
0,12
0,14
0 10 20 30 40 50 60 70
Co
nc.
[g/
L]
Time [h]
VA VAL

15
Figure 10: Chromatograms from HPLC analysis showing the disappearance of vanillin (VA) and the subsequent formation of
vanillyl alcohol (VAL) at 0 h (A), 23 h (B), and 34 h (C). The chromatograms represent three time points from replicate C of
Experiment 4.
A
B
C
VA
VAL
8.18
3.32 7.96
3.32
120
60
85
65
82
62
Res
po
nse
[m
V]
Time [min]
VA
VA
VAL
7.78
0 14

16
When studying the TLC spots and HPLC peaks, there also seems to be other compounds
formed, besides the one assumed to be vanillyl alcohol. By studying the chromatograms
obtained from HPLC, two other peaks (called compound X and compound Y) becomes visible
after 58 h with similar retention times as vanillyl alcohol. An example of these peaks is
presentedin Appendix 11. These compounds are probably the additional spots visible in the
TLC analyses. For example, when studying the TLC plate for Experiment 4 (Figure 5 and 6),
one new compound seems to be formed as soon as after 10 h of cultivation (Rf-value 0.75).
To obtain an overall picture for the events during cultivation of strain FMYD002 in the presence
of vanillin, the growth curve for Experiment 4, which was based on hemocytometer counts, was
placed on top of the TLC image for Experiment 4, replicate A (Figure 11). By comparing these,
it is evident that after 23 h, when most of the vanillin has been biotransformed, the microbial
growth starts to take off. The suggested biodegradation product, vanillyl alcohol, is mostly
formed during the log (exponential) phase of the growth curve. When the concentration of
vanillyl alcohol is being diminished (58 h), the growth entered stationary phase.
Figure 11: Growth curve based on hemocytometer counts obtained for Experiment 4 in relation to the time course
biodegradation events seen in TLC-image for Experiment 4, replicate A.
0
10
20
30
40
50
0 20 40 60 80 100
Cel
l co
nc.
(1
06
CFU
/mL)
Incubation time (h)

17
4 Discussion This study has involved four Experiments to investigate the biodegradation of vanillin by the
yeast strain FMYD002. The yeast was cultivated for 95 h in a liquid medium called LiBa, to
which vanillin was added. Every 12 hours during cultivation, a sample was removed and
analyzed by measuring the absorbance and the cell concentration to investigate the growth
pattern over time for this yeast strain. The samples were also analyzed by TLC and HPLC, and
in both cases, the biodegradation of vanillin could be observed.
4.1 Cultivation of strain FMYD002 in the presence of vanillin The experimental setup for cultivation was aimed to be as similar as possible to that used by
others researcher working on this yeast strain at the University of Gävle. The general
methodology of this study was carried out to completion (without flaws) only for Experiment
4. This is because after each Experiment, the correct or improved techniques were applied. After
Experiment 1, it was decided that the yeast was supposed to always grow for 48 h on the YEPD-
plate as a standardized time of growth. The pre-cultures were handled differently in Experiment
1 as compared to subsequent experiments. The same stock solution of vanillin was used in
Experiment 1 and 2. After Experiment 2, a new stock solution of vanillin was made it was used
in Experiment 3. During Experiment 3, it was decided that the controls should be prepared in
100 mL culture flasks instead of in Falcon tubes, since it was more similar to how the cultures
were grown, and after Experiment 3, yet another stock solution of vanillin was prepared, in
which vanillin was dissolved in ethanol first, prior to addition of LiBa medium.
Two different methods were used to measure the cell concentration during cultivation; viable
count and hemocytometer counts. When comparing the results obtained from these methods,
some differences were observed. The hemocytometer counts predominately gave a higher cell
concentration than the viable count analyses (can be seen in the raw data from Experiment 1,
2, and 3). This may be due to human error, in which deciding if a cell is blue (a dead cell) or
not blue (living cell), or inherent errors in the method meaning inefficient staining and/or
mobile phone application. Another explanation could be that during viable count, the
contamination might have interfered with the growth of strain FMYD002. Since both these
methods contain possible errors, a mean value was calculated from both methods when
generating the growth curve in Figure 2.
The method for measuring the absorbance was performed to generate a standard curve of
absorbance and CFU/mL, in order to save time during further work on strain FMYD002, so that
absorbance could be measured instead of cell concentration when performing time course
experiments. In Appendix 7, the absorbance has been plotted against CFU/mL for Experiment
1, 2 and 3, in which a somewhat straight line was obtained in each graph. By also studying the
growth curves obtained from the absorbance and the cell concentration over time (Figure 3),
they follow each other over time until the entry into stationary phase, for which the absorbance
keeps on increasing, whereas CFU/mL does not. This result indicates that by measuring only
the absorbance, a sufficiently good approximation of cell concentration is obtained over time
up until the onset of stationary phase.
Vanillin has been shown to display antifungal activity. This was evident in Experiment 2, where
two main cultures were cultivated simultaneously, one contained LiBa medium supplemented
with 0.04 g/L vanillin and the other only the LiBa medium. In Figure 2, it was observed that
the yeast entered the log (exponential) phase at a later time point than when the yeast was
growing in pure LiBa medium. It was also evident that the cell concentration reached higher

18
values when strain FMYD002 was cultivated in the presence of a small amount of vanillin
compared to when it was cultivated only in LiBa medium. The highest cell concentration in the
vanillin cultivation measured was 114 x 106 CFU/mL and in the LiBa cultivation it was 21 x
106 CFU/mL. The initial concentration of vanillin was shown to be lower in Experiment 1 and
2, compared to Experiment 3 (according to TLC result) and 4. By comparing the growth curves
for these experiments, it is evident that higher cell concentrations were obtained in Experiment
1 and 2. The reason for this could be that a higher concentration of vanillin provides a more
toxic effect on the yeast that will inhibit the growth. They yeast do, however, have the ability
to overcome this toxicity in Experiment 3 and 4.
4.2 Biodegradation of vanillin To investigate the biodegradation of vanillin, TLC and HPLC were the methods of choice. The
HPLC analyses were performed in a machine that had a leakage between the site of injection
and column. This leakage was not present the first it was used, when the standard curves were
generated. The ratio of methanol and water in the mobile phase for HPLC were different for
creating the standard curves (ratio 30/70) and when analyzing the samples (ratio 20/80). The
reason was that when the standard curves had been generated and samples were run in the 30/70
mobile phase, the separation of peaks was not satisfactory. This issue was sought to be fixed by
changing the ratio to 20/80.
The desired initial concentration of vanillin in all Experiments was 0.15 g/L (1 mM). However,
according to HPLC analyses, none of the four Experiments contained the correct initial
concentration of vanillin. The HPLC showed that Experiment 2 contained 0.04 g/L (0.27 mM),
Experiment 3 had 0.01 g/L (0.07 mM), and Experiment 4 contained 0.12 g/L (0.77 mM) of
vanillin. No HPLC analysis was performed for Experiment 1 due to lack of sample (the samples
were used in the TLC analysis), but the same vanillin stock solution was used in Experiment 1
and 2, so one might suggest that these two had similar start concentrations of vanillin. In the
TLC for Experiment 1 (Figure 7), no visible band was observed for vanillin. This result also
reveals that the initial concentration of vanillin was too low.
The HPLC analysis of Experiment 3 had suggested that it only contained 0.01 g/L vanillin at
the outset of cultivation, but this fact was questioned, so a TLC analysis (see Figure 8) was
performed. The TLC for Experiment 3 was carried out 2.5 month after the cultivation. During
this time, the samples were in the freezer. By studying the TLC obtained from Experiment 4
(Figure 5) and comparing it to the one from Experiment 3, it was concluded that the cultivation
during Experiment 3 should have contained more vanillin at the beginning than the HPLC data
showed. The reason for these differences in results might be explained by at the day for HPLC
analyses (7th April), all samples that were to be analyzed for Experiment 3 were taken out from
the freezer in the morning and placed on ice until the afternoon, when they were analyzed. The
samples had then been defrosted at the time of analysis, which might have led to some
degradation of the substances in the samples. The samples from Experiment 3 were the last
samples that were run on that day.
When comparing the TLC and HPLC results for Experiment 4, they match each other regarding
the time events for bioconversion of vanillin. By observing Figure 5 and Fig. 10, it can be noted
that after 34 h, there seem to be no or barely no vanillin left.
When vanillin starts to become transformed, the growth starts to take off and reaches a high
cell concentration as mentioned previously. During this decrease in vanillin concentration, a

19
new compound is formed. This compound was thought to be vanillyl alcohol, due to several
studies present in the literature, demonstrating that some microorganisms can chose to
transform vanillin into vanillyl alcohol [35] [36] [37]. Standards of vanillyl alcohol were
prepared for TLC and HPLC (Appendix 11) which matched the Rf-values of spots (TLC) and
retention times of peaks (HPLC) of the compound in the culture, thus giving some support to
the notion that the formed compound was, in fact, vanillyl alcohol. The compound believed to
be vanillyl alcohol was formed during the exponential phase of growth, and that is when the
highest concentration (0.1 g/L) of vanillyl alcohol was obtained, at 34 h, which was also the
time when the vanillin had disappeared. The results may suggest that the inhibition of growth
of strain FMYD002 by vanillin is overcome through its transformation of vanillin into vanillyl
alcohol. This suggestion has also been made for the yeasts Saccharomyces cerevisiae,
Zygosaccharomyces bailii and Zygosaccharomyces rouxii which have been found to degrade
vanillin and mostly convert the vanillin into vanillyl alcohol and that the transformed vanillyl
alcohol does not inhibit the growth of the yeasts [35]. This was also evident in Nishikawa et.
Al (1988) [37], where the bacterium Klebsiella pneumoniae transformed vanillin into vanillyl
alcohol, and it accounted for 43.3 % of the original vanillin. In the present study, strain
FMYD002 metabolized vanillin into what is presumed to be vanillyl alcohol, which accounted
for 83 % of vanillin added (Experiment 4). This number may, however, be lower due to the
possible masking of peaks in the HPLC analyses, due to other compounds formed.
By studying Figure 11 where the growth curve is placed over TLC image presenting the
biotransformation events, it can be suggested that strain FMYD002 transforms vanillin to
overcome its toxicity. When vanillin then is transformed into vanillyl alcohol, the yeast might
utilize and metabolize this compound which would explain the high cell concentration.
When observing the TLC and HPLC analyses, other compounds can be observed besides the
one assumed to be vanillyl alcohol. In the TLC, one of the new compounds is present after 23
h, which is not visible in the HPLC at that time. When the HPLC shows the presence of other
compounds, they have retention times similar to that of vanillyl alcohol. These may therefore
be masked in the peak of vanillyl alcohol already after 23 h. In that case, the calculated
concentration of the alcohol is an overestimate of the amount actually present. One of these
unknown substances was first thought to be catechol. Catechol is a well-known biodegradation
product from vanillin in many other systems, where it is first oxidized to vanillic acid and
further transformed into catechol [42] [43]. By observing Figure 5, it can be noted that catechol
is not a biodegradation product emerging within 95 h of cultivation for this yeast strain. Prior
to the present study, a working hypothesis was that strain FMYD002 did not convert vanillin
into vanillic acid. This has been more challenging to prove from the TLC results. The spots for
vanillic acid and the unknown compounds have similar Rf-values. One aspect that differs
between these is the intensity of the spots when observing the plate under UV and when stained
with MBTH. Vanillic acid is more visible in the UV light and can barely be seen with MBTH.
The unknown compounds can easily be observed with MBTH and are also seen under UV light
(but not as clearly), a fact that would suggest that vanillic acid is not one of the putative
biodegradation products. A known concentration of vanillic acid was analyzed with HPLC
where the retention time was measured 1.49 (data not shown) which does not match any peaks
obtained from the Experiments. From these preliminary data, the suggestion is still that strain
FMYD002 probably does not convert vanillin into vanillic acid under the conditions tested.
That the unknown biodegradation substances are present all the way until 95 h of cultivation
might suggest that they relate to substances released during lysis of cells. When a yeast cell

20
dies, there is a leakage of substances from the inside of the cells to the extracellular environment
[44] [45]
4.3 Applications and future prospects The yeast was isolated from old wooden houses (Rönnander, personal communication), which
suggests that it can live in lignin-rich environments. This basic research has provided insights
into how the yeast strain FMYD002 biodegrades vanillin. The result from this study can be
used by the researchers at the University of Gävle in their further studies on this yeast strain
and its vanillin biodegradation pathway. At the University of Gävle, strain FMYD002 has also
demonstrated the ability to grow on plates containing lignin. If strain FMYD002 degraded the
lignin or not is however not established (Rönnander and Wright, personal communication). The
results of the present study suggest that the yeast can biodegrade a lignin-derived component
(vanillin), suggesting a role for this yeast during lignin biodegradation in nature. This role could
be to take care some of the low-molecular-weight compounds derived from lignin. It might be
that during biodegradation of lignin in nature, the toxic compound vanillin is produced by first
biodegrades (e.g. white rot fungi), as a mechanism, thus enabling only a few microorganisms
to survive.
Lignocellulosic biomass can be used to produce biofuels. To overcome the obstacle of lignin
resistance to degradation, it can first be pre-treated leading to lignin degraded to phenolics and
other aromatic compounds. These can act as inhibitors for the growth for several
microorganisms [46]. This inhibition can lower the yield of biofuels, such as bioethanol, which
renders strategies to increase the yield desirable [47] [48]. Finding microorganisms that are
adapted to cope with these inhibitors is therefore of interest. Strain FMYD002 could thus fulfill
this purpose due to its ability to biotransform vanillin.
In conclusion, the yeast strain FMYD002 was able to metabolize the lignin-derived substance
vanillin even though vanillin is toxic for some microorganisms. The results so far support the
hypothesis that vanillyl alcohol could be the biodegradation product that the yeast produces
from vanillin, and that it does so in order to detoxify vanillin. From HPLC and TLC analyses,
it was observed that the yeast had started to form vanillyl alcohol after 10 h of cultivation, with
a maximum concentration of vanillyl alcohol after 34 h of cultivation. At that time, all the
vanillin had been transformed. The higher cell concentrations that were obtained when the yeast
was grown in the presence of vanillin, might be due to the fact that the yeast utilizes the vanillyl
alcohol formed and metabolizes it further.
It is not yet certain that the biodegradation product studied in the present work is vanillyl
alcohol. In order to confirm its identify, mass spectrometry and NMR studies are needed. There
were also some unknown compounds formed, whose nature and role require more research.
They are present all the way until 95 h of cultivation, suggesting that they may relate to some
substances released during cell lysis of the yeast during stationary phase growth.
The pathways for how lignin is degraded are not fully understood at the present time, so the
results from this preliminary and basic research study can serve as a piece of the puzzle and
provide further understanding of the pathways for lignin biodegradation and unleash the
potential of lignin in other industrial applications.

21
5 Acknowledgements First, I would like to thank my external supervisor Associate Prof. Sandra A.I Wright at the
University of Gävle for giving me this opportunity and throughout the project always
supporting me when I ran into problems. I would also like to thank my main supervisor Prof.
Gunnar Henriksson for all the support I received during the work of my thesis.
I also like to acknowledge Ph.D. student Jonas Rönnander at the University of Gävle for all aid
and support throughout this project and for always being there if a problem arose.
The HPLC analyses would not have been possible without the generosity of Ms. Bodil Jönsson
at Vasaskolan.
Lastly, I want to express my gratitude to my family and my boyfriend for providing me with
constant support and encouragement throughout my years of study and through the entire
process of this thesis. This accomplishment would not have been possible without them. Thank
you.
Caroline Nehvonen

22
6 References
[1] E. M. Rubin, "Genomics of cellulosic biofuels," Nature, vol. 454, pp. 841-845, 2008.
[2] H. Chen, "Chemical Composition and Structure of Natural Lignocellulose," in
Biotechnology of Lignocellulose, Springer Netherlands, 2014, pp. 25-71.
[3] N. Reddy and Y. Yang, "Biofibers from agricultural biproducts for industrial
applications," TRENDS in Biotechnology, vol. 23, no. 1, pp. 22-27, 2005.
[4] S. E. J. Lebo, J. D. Gargulak and T. J. McNally, "Lignin," in Kirk-Othmer Encyclopedia
of Chemical Technology, John Wiley & Sons, Inc. , 2001.
[5] M. Baucher, B. Monties, M. Van Montagu and W. Boerjan, "Biosynthesis and Genetic
Engineering of Lignin," Critical Reviews in Plant Sciences, vol. 17, no. 2, pp. 125-197,
1998.
[6] G. Chatel and R. D. Rogers, "Review: Oxidation of Lignin Using Ionic Liquids - An
Innovative Strategy To Produce Renewable Chemicals," ACS Sustainable Chemistry and
Engineering, vol. 2, no. 3, pp. 322-339, 2014.
[7] T. D. H. Bugg, M. Ahmad, E. M. Hardiman and R. Rahmanpour, "Pathways for
degradation of lignin in bacteria and fungi," Natural Product Report, vol. 28, pp. 1883-
1896, 2011.
[8] F. J. Ruiz-Duenas and A. T. Martinez, "Microbial degradation of lignin: how a bulky
recalcitrant polymer is efficiently recycled in nature and how we can take advantage of
this," Microbial Biotechnology, vol. 2, no. 2, pp. 164-177, 2009.
[9] K. E. Pye, "Industrial Lignin Production and Applications," in Biorefineries – Industrial
Processes and Products: Status Quo and Future DIrections, Weinheim, Wiley-VCH
Verlag GmbH, 2005, pp. 165-200.
[10] E. Sjöström, Wood Chemistry, San Diego: Academic Press Inc., 1993.
[11] F. S. Chakar and A. J. Ragauskas, "Review of current and future softwood kraft lignin
process chemistry," Industrial Crops and Products, vol. 20, pp. 131-141, 2004.
[12] A. Tejado, C. Peña, J. Labidi, J. M. Echeverria and I. Mondragon, "Physico-chemical
characterization of lignins from different sources for use in phenol-formaldehyde resin
synthesis," Bioresource Technology, vol. 98, pp. 1655-1663, 2007.
[13] V. Daniels, "Paper," in Conservation Science: Heritage Materials, Cambridge, RSC
Publishing, 2006, pp. 32-55.
[14] K. E. Hammel, "Fungal Degradation of Lignin," in Driven by Nature: Plant Litter Quality
and Decomposition., Michigan, CAB International, 1997, pp. 33-45.

23
[15] R. t. Have and P. J. M. Teunissen, "Oxidative Mechanisms Involved in Lignin
Degradation by White-Rot Fungi," American Chemical Society, vol. 101, pp. 3397-3413,
2001.
[16] M. Dashtban, H. Schraft, T. A. Syed and W. Qin, "Fungal biodegradation and enzymatic
modification of lignin," International Journal of Biochemistry and Molecular Biology,
vol. 1, no. 1, pp. 36-50, 2010.
[17] T. K. Kirk and R. L. Farrell, "Enzymatic "combustion": the microbial degradation of
lignin," Annual Review of Microbiology, vol. 41, pp. 465-505, 1987.
[18] S. Camarero, M. Jesus Martinez and A. T. Martinez, "Understanding lignin
biodegradation for the improved utilization of plant biomass in modern biorefineries,"
Biofuels, Bioproducts and Biorefining, vol. 8, no. 5, pp. 615-625, 2014.
[19] M. E. Brown and M. C. Chang, "Exploring bacterial lignin degradation," Current Opinion
in Chemical Biology, vol. 19, pp. 1-7, 2014.
[20] M. H. Gold and M. Alic, "Molecular biology of the lignin-degrading basidiomycete
Phanerochaete chrysosporium," Microbiological Reviews, vol. 57, no. 3, pp. 605-622,
1993.
[21] J. Trojanowski, K. Haider and V. Sundman, "Decomposition of 14C-Labelled Lignin and
Phenols by a Nocardia sp.," Archives of Microbiology, vol. 114, pp. 149-153, 1977.
[22] H. Sorensen, "Decomposition of Lignin by Soil Bacteria and Complex Formation
between Autoxidized Lignin and Organic Nitrogen Compounds," J Gen Microbiol, vol.
27, pp. 21-34, 1962.
[23] M. Ahmad, J. N. Roberts, E. M. Hardiman, R. Singh, L. D. Eltis and T. D. H. Bugg,
"Identification of DypB from Rhodococcus jostii RHA1 as a Lignin Peroxidase,"
Biochemistry, vol. 50, pp. 5096-5107, 2011.
[24] G. H. I. Tomlinsson and H. Hibbert, "Studies on Lignin and Related Compounds. XXIII.
The Preparation and Methylation of Spruce Lignin Sulfonic Acids," Journal of the
American Chemical Society, vol. 58, no. 2, pp. 340-345, 1936.
[25] C.-L. Chen, H.-M. Chang and T. K. Kirk, "Aromatic Acids Produced during Degradation
of Lignin in Spruce Wood by Phanerochaete Chrysosporium," Holzforschung -
International Journal of the Biology, Chemistry, Physics and Technology of Wood, vol.
36, no. 1, pp. 3-9, 1982.
[26] J. A. Buswell, K.-E. Eriksson, J. K. Gupta, S. G. Hamp and I. Nordh, "Vanillic Acid
Metabolism by Selected Soft-rot, Brown-rot, and White-rot Fungi," Archives of
Microbiology, vol. 131, pp. 366-374, 1982.
[27] K.-E. L. Eriksson, R. A. Blanchette and P. Ander, "Biodegradation of lignin," in
Microbial and Enzymatic Degradation of Wood and Wood Components, Berlin, Springer-
Verlag, 1990, pp. 225-333.

24
[28] S. Kim, P. A. Thiessen, E. E. Bolton, J. Chen, G. Fu, A. Gindulyte, L. Han, J. He, S. He,
B. A. Shoemaker, J. Wang, B. Yu, J. Zhang and S. H. Bryant, "PubChem Substance and
Compound databases," Nucleic Acids Research, vol. 44, no. D1, p. D1202–D1213, 2016.
[29] R. J. S. Lewis, Hawley's Codensed CHemical Dictionary, 15th ed., New York: John Wiley
& Cons, Inc., 2007, p. 1313.
[30] J. F. Stanzione III, J. M. Sadler, J. J. La Scala, K. H. Reno and R. P. Wool, "Vanillin-
based resin for use in composite applications," Green Chemistry, vol. 14, pp. 2346-2352,
2012.
[31] A. R. Brochado, C. Matos, B. L. Møller, J. Hansen, U. H. Mortensen and K. R. Patil,
"Improved vanillin production in baker's yeast through in silico design," Microbial Cell
Factories, vol. 9, no. 84, 2010.
[32] G. S. CLar, "Vanillin," Perfumes and flavorist, vol. 15, pp. 45-54, 1990.
[33] A. Vishtal and A. Kraslawski, "Challenges in Industrial Applications of Technical
Lignins," BioResources, vol. 6, no. 3, pp. 3547-3568, 2011.
[34] A. Endo, T. Nakamura and J. Shima, "Involment of ergosterol in tolerance to vanillin, a
potential inhibitor of bioethanol fermentation, in Saccharomyces cerevisiae," FEMS
Microbiology Letters, vol. 299, pp. 95-99, 2009.
[35] D. J. Fitzgerald, M. Stratford and A. Narbad, "Analysis of the inhibition of food spoilage
yeasts by vanillin," International Journal of Food Microbiology, vol. 86, pp. 113-122,
2003.
[36] M. Rahouti, F. Seigle-Murandi, R. Steinman and K.-E. Eriksson, "Metabolism of Ferulic
Acid by Paecilomyces variotii and Pestalotia palmarum," Applied and Environmental
Microbiology, vol. 55, no. 9, pp. 2391-2398, 1989.
[37] N. K. Nishikawa, R. Sutcliffe and J. N. Saddler, "The influence of lignin degradation
products on xylose fermentation by Klebsiella pneumoniae," Applied Microbiology and
Biotechnology, vol. 27, pp. 549-552, 1988.
[38] H.-P. Chen, M. Chow, C.-C. Liu, A. Lau, L. Liu and L. D. Eltis, "Vanillin Catabolism in
Rhodococcus jostii RHA1," Applied and Environmental Microbiology, pp. 586-588,
2011.
[39] D. Libkind, S. Brizzio and M. van Broock, "Rhodotorula mucilaginosa, a Carotenoid
Producing Yeast Strain from a Patagonian Hogh-Altitude Lake," Folia Microbiology, vol.
49, no. 1, pp. 19-25, 2004.
[40] D. A. Treco and V. Lundblad, "Preparation of Yeast media," Current Protocols in
Molecular Biology, pp. 13.1.1-13.1.7, 1993.
[41] H. L. Barnett and V. G. Lilly, "The Inhibitory Effects of Sorbose on Fungi," Science, vol.
114, no. 2965, pp. 439-440, 1951.

25
[42] H. Priefert, J. Rabenhorst and A. Steinbüchel, "Biotechnological production of vanillin,"
Applied Microbiology and Biotechnology, vol. 56, pp. 296-314, 2001.
[43] J. Sutherland, D. Crawford and A. 3. Pometto, "Metabolism of cinnamic, p-coumaric, and
ferulic acids by Strptomyces setonii," Canadian Journal of Microbiology, vol. 10, pp.
1253-1257, 1983.
[44] T. Hernawan and G. Fleet, "Chemical and cytological changes during the autolysis of
yeasts," Journal of Industrial Microbiology, vol. 14, pp. 440-450, 1995.
[45] J. Zhao and G. H. Fleet, "Degradation of DNA during the autolysis of Saccharomyces
cerevisiae," Journal of Industrial Microbiology and Biotechnology, vol. 30, pp. 175-182,
2003.
[46] L. J. Jönsson, B. Alriksson and N.-O. Nilvebrant, "Bioconversion of lignocellulose:
inhibitors and detoxification," Biotechnology and Biofuels, vol. 6, no. 16, 2013.
[47] E. Palmqvist and B. Hahn-Hägerdal, "Fermentation of lignocellulosic hydrolysates. I:
inhibition and detoxification," Bioresource Technology, vol. 74, pp. 17-24, 2000.
[48] E. H.-H. Palmqvist, "Fermentation of lignocellulosic hydrolysates. II: inhibitors and
mechanisms of inhibition," Bioresource Technology, vol. 74, pp. 25-33, 2000.
26
Appendix 1 – LiBa (Lilly and Barnett) medium preparation To prepare a 5x Lilly-Barnett medium [41] stock solution, three solutions (A, B, and C) were
made separately and then mixed.
Solution A was made by compose 10 g D-glucose, 1 g KH2PO4, and 0.5 g MgSO4 x 7H2O into
a flask and dissolve it with 95 mL Milli Q water. The solution was then autoclaved.
Solution B was made by dissolving 2 g asparagine in 100 mL Milli Q water and sterile filter
the solution.
Solution C was made as a 200x stock solution comprised of 0.001 g FeSO4 x 7H2O, 0.87 g
ZnSO4 x 7H2O, 0.3 g MnSO4 x H2O, 0.01 g biotin, and 0.01 g thiamine dissolved in 500 mL
Milli Q water. The solution was sterile filtered and the bottle covered with aluminum foil and
stored in the fridge (4 ˚C).
To prepare 500 mL LiBa medium; 49 mL of solution A, 50 mL of solution B, 1 mL of solution
C, and 400 mL Milli Q water was mixed in an autoclaved bottle. The medium was stored in the
fridge (4 ˚C).
Table 1: Some chemicals used in these Experiments and the company where they were purchased.
Chemical Company
Vanillin Alfa Aesar
Vanillyl alcohol Sigma-aldrich
Vanillic acid Sigma-Aldrich
Catechol Sigma-Aldrich
D(+)-Glucose BDH
Yeast extract
granulated
Merck
Peptone from
casein
Merck
Bacteriological
agar
VWR
KH2PO4 Applichem
MgSO4 x 7H2O Kebolab
L-Asparagine
anhydrous
Molekula
ZnSO4 x 7H2O Scharlau
Biotin Sigma-Aldrich
Ethyl acetate Bie&berntsen A-S
Toluene KEBOlab
Formic acid VWR chemicals
N2 AGA

27
Appendix 2 – Equation used for calculations Equation (1), was used to for example calculate the volume needed to reach a specific
concentration
𝑣1 ∗ 𝑐1 = 𝑣2 ∗ 𝑐2 (1)
Where v1 is the unknown volume, c1 represent the cell concentration before dilution, v2 is the
final volume after dilution, and c2 corresponds to the desired concentration.
28
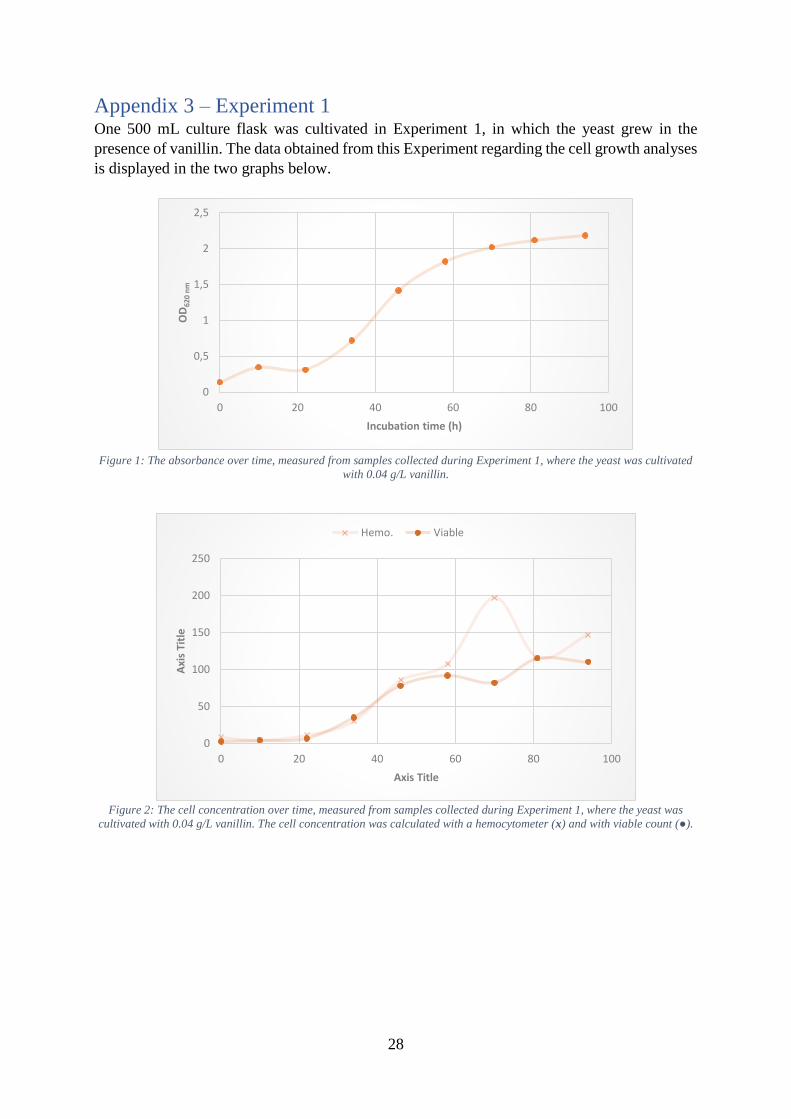
Appendix 3 – Experiment 1 One 500 mL culture flask was cultivated in Experiment 1, in which the yeast grew in the
presence of vanillin. The data obtained from this Experiment regarding the cell growth analyses
is displayed in the two graphs below.
Figure 1: The absorbance over time, measured from samples collected during Experiment 1, where the yeast was cultivated
with 0.04 g/L vanillin.
Figure 2: The cell concentration over time, measured from samples collected during Experiment 1, where the yeast was
cultivated with 0.04 g/L vanillin. The cell concentration was calculated with a hemocytometer (x) and with viable count (●).
0
0,5
1
1,5
2
2,5
0 20 40 60 80 100
OD
620
nm
Incubation time (h)
0
50
100
150
200
250
0 20 40 60 80 100
Axi
s Ti
tle
Axis Title
Hemo. Viable

29
Appendix 4 – Experiment 2 In Experiment 2, there were two types of cultivations running simultaneously. One flask
contained vanillin and the other culture flask contained only LiBa medium for the yeast to grow
in. The data obtained from this Experiment regarding the cell growth analyses is displayed in
the four graphs below.
Figure 1: The absorbance over time, measured from samples collected during Experiment 2. This is the data from the culture
where 0.04 g/L vanillin was present during cultivation.
Figure 2: The cell concentration over time, measured from samples collected during Experiment 2. This is the data from the
culture where 0.04 g/L vanillin was present during cultivation. The cell concentration was calculated with a hemocytometer
(x) and with viable count (●).
0
0,5
1
1,5
2
2,5
0 20 40 60 80 100
Ab
s
Time [h]
0
20
40
60
80
100
120
140
160
0 20 40 60 80 100
10
^6 C
FU/m
L
Time [h]
Hemo. Viable

30
Figure 3: The absorbance over time, measured from samples collected during Experiment 2 where the yeast was cultivated
only in LiBa medium.
Figure 4: The cell concentration over time, measured from samples collected during Experiment 2. This is the data from the
culture where the yeast was cultivated only in LiBa medium. The cell concentration was calculated with a hemocytometer
(x) and with viable count (●).
0
0,2
0,4
0,6
0,8
1
1,2
1,4
0 20 40 60 80 100
OD
620
nm
Incubation time (h)
0
5
10
15
20
25
30
35
0 20 40 60 80 100
Ce
ll co
nc.
(1
06
CFU
/mL)
Incubation time (h)
Hemo. Viable

31
Appendix 5 – Experiment 3 One 500 mL culture flask was cultivated in Experiment 3, in which the yeast grew in the
presence of vanillin. The data obtained from this Experiment regarding the cell growth analyses
is displayed in the two graphs below.
Figure 1: The absorbance over time, measured from samples collected during Experiment 3 where the yeast was cultivated
with 0.01 g/L vanillin (according to HPLC results).
Figure 2: The cell concentration over time, measured from samples collected during Experiment 3, where the yeast was
cultivated with 0.01 g/L vanillin (according to HPLC results). The cell concentration was calculated with a hemocytometer
(x) and with viable count (●).
0
0,2
0,4
0,6
0,8
1
1,2
1,4
1,6
1,8
0 20 40 60 80 100 120
Ce
ll co
nc
(10
6C
FU/m
L)
Incubation time (h)
-10
0
10
20
30
40
50
60
70
0 20 40 60 80 100 120
Ce
ll co
nc.
(1
06
CFU
/mL)
Incubation time (h)
Hemo. Viable
32
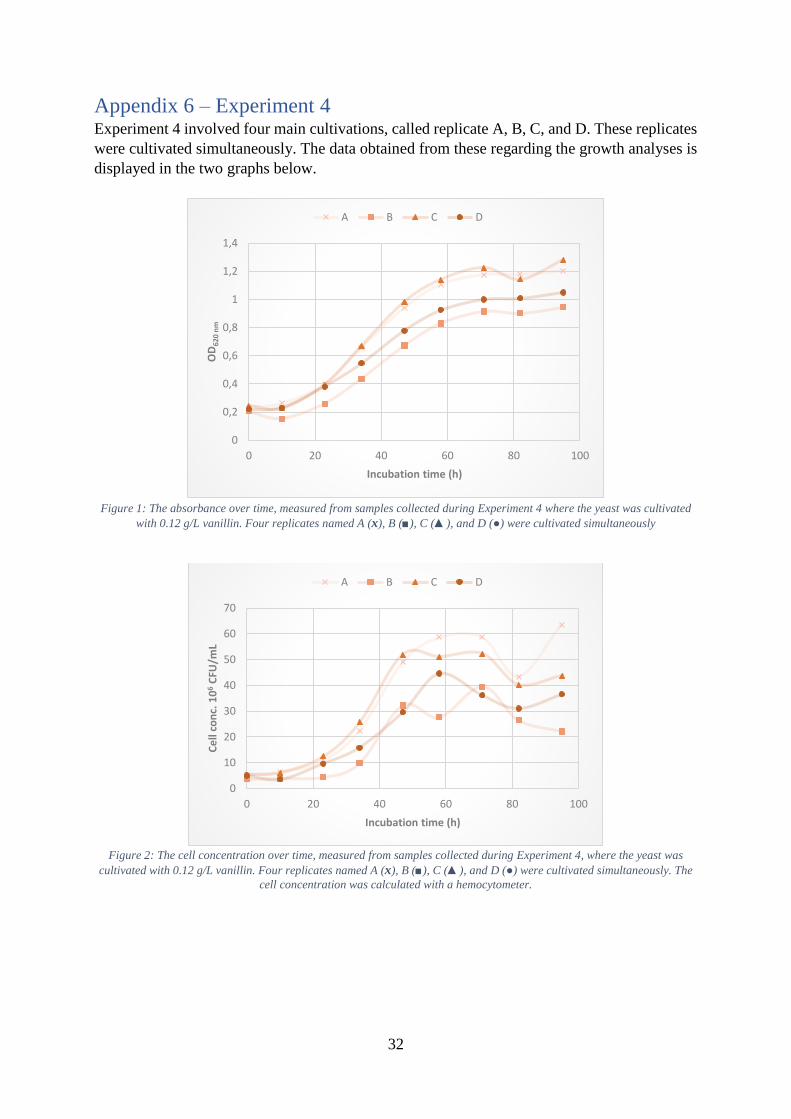
Appendix 6 – Experiment 4 Experiment 4 involved four main cultivations, called replicate A, B, C, and D. These replicates
were cultivated simultaneously. The data obtained from these regarding the growth analyses is
displayed in the two graphs below.
Figure 1: The absorbance over time, measured from samples collected during Experiment 4 where the yeast was cultivated
with 0.12 g/L vanillin. Four replicates named A (x), B (■), C (▲), and D (●) were cultivated simultaneously
Figure 2: The cell concentration over time, measured from samples collected during Experiment 4, where the yeast was
cultivated with 0.12 g/L vanillin. Four replicates named A (x), B (■), C (▲), and D (●) were cultivated simultaneously. The
cell concentration was calculated with a hemocytometer.
0
0,2
0,4
0,6
0,8
1
1,2
1,4
0 20 40 60 80 100
OD
620
nm
Incubation time (h)
A B C D
0
10
20
30
40
50
60
70
0 20 40 60 80 100
Ce
ll co
nc.
10
6C
FU/m
L
Incubation time (h)
A B C D

33
Appendix 7 – Absorbance vs. cell concentration During this project, it was investigated if the absorbance measurement could provide an
indication on the cell concentration. To explore this, the absorbance was plotted against the cell
concentration for each Experiment.
Figure 1: The absorbance (OD620 nm) plotted against the cell concentration. The cell concentration was calculated with both a
hemocytometer (●) and viable count (x). A: Results obtained from Experiment 1, where the yeast was cultivated with 0.04 g/L
vanillin. B: Results obtained from Experiment 2, where the yeast was cultivated in 0.04 g/L vanillin. C: Results from Experiment
2, where the yeast was cultivated in only LiBa medium. D: Results from Experiment 3, where the yeast was cultivated with
vanillin (the start concentration of vanillin is uncertain).
A B
C D

34
Appendix 8 – White colonies During viable count, white colonies emerged on several of the plates. The distribution of white
colonies on the plates can be seen in the tables below. No viable count was performed during
Experiment 4. However, after 47 h of cultivation a loop from each replicate was streaked on
YEPD-plates. These plates are displayed below.
Table 1: The distribution of white colonies (bald values) among the plates used in viable count for Experiment 1. The -3 to -7
corresponds to the dilution where -3 corresponds to 1:1000 dilution, -4 to a 1:10,000 dilution etc.
Table 2: The distribution of white colonies (bald values) among the plates used in viable count for Experiment 2. The -3 to -7
corresponds to the dilution where -3 corresponds to 1:1000 dilution, -4 to a 1:10,000 dilution etc.
Table 3: The distribution of white colonies (bald values) among the plates used in viable count for Experiment 3. The -3 to -7
corresponds to the dilution where -3 corresponds to 1:1000 dilution, -4 to a 1:10,000 dilution etc.
Time [h]
-7 -6 -5 -4 -3 -7 -6 -5 -4 -3
0 1 23 213 0 0 0
10 4 23 192 0 1 1
22 19 65 0 2
34 35 283 0 0
46 78 0
58 1 14 92 0 1 0
70 3 10 82 21 228 190/77
81 1 13 116 0 1 0
94 3 6 110 11 136 188/93
White coloniesPink colonies
Time [h]
-7 -6 -5 -4 -3 -7 -6 -5 -4 -3
0 1 14 130 0 78 73
11 2 26 103 1 0 3
23 2 14 91 2 8 26
35 4 47 291 2 46 16
47 13 98 600 0 1 2
59 11 93 0 0
71 4 10 105 3 3 32
95 3 11 98 3 56 116
Pink colonies White colonies
Time [h]
-7 -6 -5 -4 -3 -7 -6 -5 -4 -3
0 1 9 112 0 0 1
5 2 12 123 0 0 0
11 0 22 99 0 0 0
23 8 20 237 8 1 1
35 11 89 0 0
47 30 241 40 4
59 5 30 326 0 0 0
71 8 53 5 50
83 0 9 50 267 0 0 0 0
95 0 6 49 242 0 0 0 0
100 0 3 40 281 0 0 2 1
Pink colonies White colonies

35
Figure 112: Streaks directly from the four replicates (A, B, C, and D) in Experiment 4 onto agar plates after 47 h of
cultivation. No white colonies were observed.
A B
C D

36
Appendix 9 – Standard curves for HPLC Standard curves were made to quantify vanillin and the suggested degradation product vanillyl
alcohol. The standard curves were measured in triplicates. The default reports from these
analyses are featured below. The obtained standard curves are also displayed. These standards
for vanillin and vanillyl alcohol were prepared by dissolving the substances in LiBa medium.
Table 1: The HPLC default report for vanillin used for creation of the standard curve. Triplicates (VA 1, VA 2, VA 3) were
performed for six different concentrations.
Figure 1: Standard curve for vanillin obtained by HPLC. The mobile phase used was methanol/water with a ratio of 30/70
VA 1
Conc. [mM] Peak # Time [min] Area [µV*s] Height [µV] Area [%] Norm. Area [%] BL Area/Height [s]
0,075 249 5,918 391215,39 18768,47 30,93 30,93 VE 20,8443
0,125 224 5,858 866584,56 39037,15 69,39 69,39 VB 22,199
0,25 215 5,817 1581002,53 62986,15 84,92 84,92 VB 25,1008
0,5 185 5,771 2966240,44 111933,9 92,94 932,94 VB 26,4999
1 169 5,743 4862690,53 176718,59 95,63 95,63 VB 27,5166
2 154 5,706 6093493,51 214991,03 94,66 94,66 VB 28,343
VA 2
Conc. [mM] Peak # Time [min] Area [µV*s] Height [µV] Area [%] Norm. Area [%] BL Area/Height [s]
0,075 232 5,733 9928,49 333,86 4,83 4,83 BB 29,7387
0,125 233 5,724 796960,8 29998,51 88,93 88,93 VB 26,5667
0,25 203 5,701 1520622,74 56423,37 92,78 92,78 VB 26,9502
0,5 185 5,68 3176183,08 112512,54 94,59 94,59 VB 28,2296
1 202 5,68 1808744,67 64981,1 89,37 89,37 VE 27,8349
2 159 5,649 8070454,74 261265,45 95,84 95,84 BB 30,8899
VA 3
Conc. [mM] Peak # Time [min] Area [µV*s] Height [µV] Area [%] Norm. Area [%] BL Area/Height [s]
0,075 230 5,69 372743,78 14046,41 67,41 67,41 VB 26,5366
0,125 229 5,664 862581,53 31526,6 84,66 84,66 VB 27,3604
0,25 200 5,655 1706961,1 60714,64 90,77 90,77 VE 28,1145
0,5 168 5,643 3264935,21 111844,61 94,7 94,7 VE 29,1917
1 195 5,653 1742499,18 61539,36 89,15 89,15 VV 28,3152
2 141 5,597 9886582,55 296006,27 96,14 96,14 VB 33,3999
HPLC Default report
HPLC Default report
HPLC Default report
y = 4E+06x + 550564R² = 0,9749
0
2000000
4000000
6000000
8000000
10000000
0 0,5 1 1,5 2 2,5
Are
a [µ
V*s
]
Concentration [mM]
Standard curve
Vanillin

37
Table 2: The HPLC default report for vanillyl alcohol used for creation of the standard curve. Triplicates (VAL 1, VAL 2,
VAL 3) were performed for the six different concentrations.
Figure 2: Standard curve for vanillyl alcohol obtained by HPLC. The mobile phase used was methanol/water with a ratio of
30/70
VAL 1
Conc. [mM] Peak # Time [min] Area [µV*s] Height [µV] Area [%] Norm. Area [%] BL Area/Height [s]
0,075 78 2,545 51427,71 7935,74 15,39 15,39 VE 6,4805
0,125 81 2,548 106495,69 16249,16 28,51 28,51 VE 6,5539
0,25 79 2,546 179906,22 27316,02 41,17 41,17 BB 6,5861
0,5 80 2,541 310590,26 44464,38 53,48 53,48 VE 6,9851
1 72 2,538 649542,81 90563,54 75,41 75,41 VB 7,1722
2 78 2,54 1225983,75 169239,69 79,56 79,56 BB 7,2441
VAL 2
Conc. [mM] Peak # Time [min] Area [µV*s] Height [µV] Area [%] Norm. Area [%] BL Area/Height [s]
0,075 77 2,76 52218,13 6050,42 9,13 9,13 VB 8,6305
0,125 75 2,741 105486,94 12383,69 24,42 24,42 BB 8,5182
0,25 83 2,728 161662,73 18805,23 35,97 35,97 BB 8,5967
0,5 90 2,708 304483,27 34925,45 61,55 61,55 VB 8,7181
1 77 2,697 664568,01 75012,33 70,17 70,17 BB 8,8595
2 88 2,688 1253650,13 138030,54 80,91 80,91 BE 9,0824
VAL 3
Conc. [mM] Peak # Time [min] Area [µV*s] Height [µV] Area [%] Norm. Area [%] BL Area/Height [s]
0,075 90 2,697 51856,62 5685,01 18,65 18,65 VB 9,1216
0,125 86 2,682 99981,95 10646,22 30,76 30,76 VB 9,3913
0,25 82 2,68 171406,86 17919,21 46,52 46,52 VB 9,5655
0,5 88 2,685 306799,32 30987,02 58,21 58,21 VE 9,9009
1 81 2,685 649329,25 64683,65 72,83 72,83 VB 10,0385
2 81 2,684 1323021,94 124769,81 83,51 83,51 BB 10,6037
HPLC Default report
HPLC Default report
HPLC Default report
y = 629295x + 11737R² = 0,9993
0
200000
400000
600000
800000
1000000
1200000
1400000
0 0,5 1 1,5 2 2,5
Are
a [µ
V*s
]
Concentration [mM]
Standard curve
Vanillyl alcohol

38
Appendix 10 – HPLC default reports The areas obtained from the HPLC analyses were of importance for quantification.
Quantification were performed for vanillin and the suggested degradation product vanillyl
alcohol. Other compounds than these two appeared, called compound X and Y. Due to no
knowledge about these compounds, no quantification were performed on them. In some cases,
only one of these unknown compounds was observed. The areas obtained from all HPLC
analyses is featured in the graphs below.
Figure 1: The areas obtained from HPLC for the different samples collected during Experiment 2. No other compounds than
vanillin (VA, ■) and vanillyl alcohol (VAL, ●) were observed. No peaks after 34 h were observed during this HPLC analysis.
.
Figure 2: The areas obtained from HPLC for the different samples collected during Experiment 3. The graph displays the
change in area over time for vanillin (VA, ■), vanillyl alcohol (VAL, ●), and compound X (X, ▲).
0
200000
400000
600000
800000
1000000
1200000
1400000
1600000
1800000
0 5 10 15 20 25 30 35 40
Are
a (µ
V*s
)
Incubation time (h)
VA VAL
-100000
0
100000
200000
300000
400000
500000
600000
700000
800000
900000
0 20 40 60 80 100
Are
a (µ
V*s
)
Incubation time (h)
VA VAL X
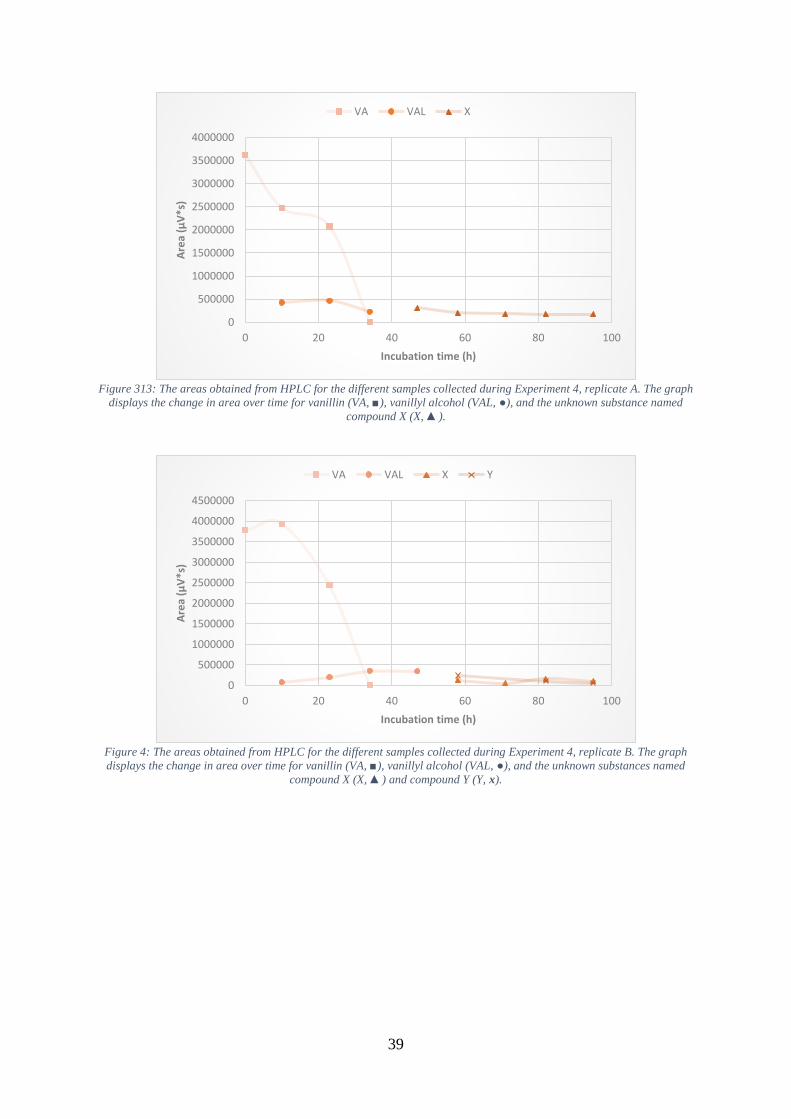
39
Figure 313: The areas obtained from HPLC for the different samples collected during Experiment 4, replicate A. The graph
displays the change in area over time for vanillin (VA, ■), vanillyl alcohol (VAL, ●), and the unknown substance named
compound X (X, ▲).
Figure 4: The areas obtained from HPLC for the different samples collected during Experiment 4, replicate B. The graph
displays the change in area over time for vanillin (VA, ■), vanillyl alcohol (VAL, ●), and the unknown substances named
compound X (X, ▲) and compound Y (Y, x).
0
500000
1000000
1500000
2000000
2500000
3000000
3500000
4000000
0 20 40 60 80 100
Are
a (µ
V*s
)
Incubation time (h)
VA VAL X
0
500000
1000000
1500000
2000000
2500000
3000000
3500000
4000000
4500000
0 20 40 60 80 100
Are
a (µ
V*s
)
Incubation time (h)
VA VAL X Y

40
Figure 5: The areas obtained from HPLC for the different samples collected during Experiment 4, replicate C. The graph
displays the change in area over time for vanillin (VA, ■), vanillyl alcohol (VAL, ●), and the unknown substances named
compound X (X, ▲) and compound Y (Y, x).
Figure 6: The areas obtained from HPLC for the different samples collected during Experiment 4, replicate D. The graph
displays the change in area over time for vanillin (VA, ■), vanillyl alcohol (VAL, ●), and the unknown substance named
compound X (X, ▲).
0
500000
1000000
1500000
2000000
2500000
3000000
3500000
0 20 40 60 80 100
Are
a (µ
V*s
)
Incubation time (h)
VA VAL X Y
-500000
0
500000
1000000
1500000
2000000
2500000
3000000
3500000
4000000
4500000
0 20 40 60 80 100
Axi
s Ti
tle
Axis Title
VA VAL X

41
Appendix 11 – HPLC chromatograms
Figure 114: Chromatogram of standards with 1 mM vanillyl alcohol and 1 mM vanillin dissolved in LiBa medium. The
retention time for vanillyl alcohol is 3.53 and for vanillin 8.65 min.
Vanillyl alcohol
Vanillin

42
Figure 2: Chromatogram from Experiment 4, replicate C after 58 h of cultivation. The unknown compounds are marked in
the picture where compound X had a retention time of 3.19 min and compound Y had the retention time of 3.41 min.
Compound X
Compound Y