Embed Size (px)
Citation preview
AN ABSTRACT OF THE THESIS OF
WILLIAM HENRY MAC FARLANE for the degree of DOCTOR OF
EDUCATION in EDUCATION presented on NOVEMBER 20, 1981
Title: A STUDY OF THE MATHEMATICAL COMPETENCE REQUIREMENTS
FOR GRADUATION AMONG OREGON'S A-AA-AAA SENIOR HIGH
SCHOOLS
Abstract approveRedacted for privacyedacted for privacyffiDr. Sylvia Tucker /r. Michael Colbert
Competency-based education was introduced to the
state of Oregon in the early 1970's, mandating that the
graduating classes of 1978 would meet these competency
requirements for graduation. The Oregon Department of
Education allowed each school district to compile its
own lists of competencies in each of the mandated areas.
There were no state recommended guidelines in these
areas; consequently, competencies were varied in require-
ments and numbers.
This research was designed to establish minimal
mathematics competencies for Oregon's four-year public
senior high schools; they would also be applicable to
all other high schools in the state.
The use of mean scores and the one-way analysis of
variance (ANOVA) at the .05 level of significance was
applied to determine if there were any significant dif-
ferences between and among responses. There were
significant differences in 15 of the 71 items. The LSD

test was then applied to determine where the differences
lay. A significant difference was revealed between AAA
and AA in 15 items. AAA and A schools differed signifi-
cantly on only 2 items.
From this study it can be concluded that schools
classified as A and AAA are more closely aligned in their
interpretation of mathematical competencies at all levels.
A and AAA accepted the competency list with fewer
exceptions as being necessary for mathematical instruc-
tion.
It was further indicated that schools classified
as AA felt a need for fewer competencies than the other
classifications of schools.
In constructing the final master list of com-
petencies using a combination of F statistic scores and
mean scores, 19 items were rejected, leaving 52 items
that compose the finished document.
The model procedure developed for this study pro-
vided useful information in compiling and evaluating
data. It could be used to study and evaluate the other
5 areas of competence designated by the state of
Oregon.

A STUDY OF THE MATHEMATICAL COMPETENCEREQUIREMENTS FOR GRADUATION AMONG
OREGON'S A-AA-AAA SENIOR HIGH SCHOOLS
by
WILLIAM HENRY MAC FARLANE
A THESIS
submitted to
Oregon State University
in partial fulfillment ofthe requirements for the
degree of
DOCTOR OF EDUCATION
Completed November 20, 1981
Commencement June 1982

APPROVED:
Redacted for privacyRedacted for privacy
Professor of Educationin charge of major
Redacted for privacy
Division COZYdinator
Redacted for privacy
G7`Dean of G74 duate SchIll
Date thesis is presented November 20, 1981
Typed by Mary Syhiman for WILLIAM HENRY MAC FARLANE
TO MY FATHER --
This book is dedicated in appreciation and
love to the one member of the family who was not
able to be here for its completion.

ACKNOWLEDGEMENTS
As William Herbert Carruth has written:
We .are all dreamers of dreams,on visions our childhood is fed;and the heart of the child is undaunted, it seems,By the ghosts of dreams that are dead.
The completion of this dissertation and degree is
the culmination of one of my dreams. To this end, I would
like to express my sincere appreciation to the members of
my committee who provided support, advice and council, and
encouragement to me during my studies and the writing of
this dissertation: Dr. Sylvia Tucker who encouraged me to
pursue this degree and who helped smooth the way for its
completion; Dr. John Oades, whose critical evaluations and
recommendations made the pursuit of this effort more mean-
ingful; Dr. Helen Hall whose constructive advice and cheer-
ful reassurance made working with her a pleasure; Dr.
Harland Padfield who, through his quiet and supportive
personality, provided encouragement; and Dr. Michael
Colbert who, through his acceptance of me as a person,
recognized some spark of talent and ability, proded,
encouraged, directed, and supported me through good times
and bad times to the completion of this dissertation.
My appreciation is also expressed to the members of
my family who encouraged me to do what I wanted to do and
supported these efforts. To my wife, whose scholastic
ability far out-weighs mine, for her aid in the mechanics

of this paper. And to my dearest friend, Margaret, who
provided care, understanding, and support for me during
both a difficult and pleasant time in my life.
Let him .show a brave face if he can,Let him woo fame or fortune instead -Yet there's not much to do but to bury a manWhen the last of his dreams is dead.
TABLE OF CONTENTS
CHAPTER
I INTRODUCTION
PAGE
1
Significance of the Study 4
Scope of the Study 7
Statement of the Problem 9
Purpose of the Study 9
Objectives of the Study 10Design of the Study 12Hypothesis 14Assumptions 14Delimitations 15Limitations 15Definition of Terms 16
II REVIEW OF LITERATURE 19
Introduction 19Development of Competency Requirements
for High School Graduation 20State of the Art 30Mathematical Competencies 33Summary 41
III RESEARCH DESIGN 42
Introduction 42Type of Study 42Population and Sample 42Instrumentation 44Data Collection and Procedures 45Treatment of the Data 46
Statistical Design 46
The Mathematical Model 46Data Analysis 47
IV ANALYSIS OF THE DATA 49
Introduction 49Findings Relative to the HypothesisUnder Investigation 51
Summary 68

V SUMMARY, FINDINGS, CONCLUSIONS ANDRECOMMENDATIONS 69
Introduction 69Summary 69Findings 70Conclusions 72Discussion 74Recommendations for Action 76
BIBLIOGRAPHY
APPENDICES
78
A Letter to Don Fineran, Oregon State Depart-ment of Education Math Specialist 84
B Response from Don Fineran, Oregon StateDepartment of Education Math Specialist 86
C Sampling Schools by Classification 89
D Delphi Committee Members 91
E Mathematical Competence Questionnaire 93
F Approved Secondary Schools in OregonFall of 1980 98
G Oregon School Activities Association(Revised) 110
H Letter to Building Administrators AskingCooperation in Study 114
I List of Mathematical Competencies asIdentified by A Schools 116
J List of Mathematical Competencies asIdentified by AA Schools 121
K List of Mathematical Competencies asIdentified by AAA Schools 125
List of Mathematical CompetenciesIdentified as Rejected by Use of FStatistic and Mean Scores by TotalGroup 130

LIST OF TABLES
TABLE
I Total Group Means by Individual ItemTo Establish Levels of Acceptability
II Total Mean Acceptance Levels andRelated Percentages
III Oregon's Four-Year Public Senior HighSchools Classification A Mean Scoresby Individual Item
IV Oregon's Four-Year Public Senior HighSchools Classification AA Mean Scoresby Individual Item
V Oregon's Four-Year Public Senior HighSchools Classification AAA Mean Scoresby Individual Item
VI Individual Mean Acceptance Levels andRelated Percentages
VII Table of Rejections Based on F Probabilityand LSD Results
PAGE
56
58
59
62
64
66
67

A STUDY OF THE MATHEMATICAL COMPETENCEREQUIREMENTS FOR GRADUATION AMONG
OREGON'S A-AA-AAA SENIOR HIGH SCHOOLS
CHAPTER I
INTRODUCTION
Prior to 1972, Oregon high school seniors received
diplomas based on secondary education philosophy and guide-
lines from the Oregon Board of Education. Diplomas
were granted based on satisfactory attendance and course
completion as well as local school options. These regula-
tions concerning the awarding of the secondary school
diploma had changed little since the 1920's. (27) Oregon
recognized a need to study its philosophy and guidelines
and applied for and was granted a study grant from the
Ford Foundation in the 1960's which was later to be known
as "The Oregon Program." (27) This grant allowed selected
districts in Oregon to investigate their system of goal
setting and competency development as a basis for their
educational programs and completion requirements.
In 1969, the Oregon State Department of Education
sponsored a state-wide needs assessment to ascertain the
views of the general public, Oregon's educators, students
and dropouts, concerning the knowledge and skills needed
and expected of completing twelfth graders. As the
results of the needs assessment were evaluated, it became
2
evident that further research was necessary because of the
overwhelming response for curricular change. In that same
year, the Oregon Association of School Administrators pro-
duced findings from their inquiries that also called for
immediate change in the Oregon school curriculum and in
the requirements for high school graduation. (27) Further,
during the 1969-1970 academic year, the Oregon State
Board of Education and the State Superintendent of Public
Instruction held Town Hall meetings in 14 Oregon cities
with over two thousand citizens who expressed their educa-
tional views and priorities for educational change in the
state. (27)
As a result of the forementioned action, the Oregon
Board of Education targeted September, 1974, as a time
of change for high school graduation requirements to
include measurable competence for each student and to
establish some general guidelines for implementation.
These guidelines were based on the following assumptions:
(1) Districts need freedom at the local level to
adapt curriculum to the changing needs of
students and sociological conditions. At
the same time, districts want some general
guidance as they progress toward implementa-
tion of the new graduation requirements.

(2) Clear goals based on student outcomes can
be developed and student attainment can
be measured.
(3) Students should have more alternatives for
meeting graduation requirements to accommo-
date individual learning styles, interests,
strengths, and weaknesses. Alternatives
might be credit by examination, off-campus
study, independent study, early and/or
delayed graduation. (27)
In 1972-1973 six Oregon school districts had tentatively
developed guidelines for the "new" graduation requirements.
Because of this early action, state-level seminars and
workshops were developed to synthesize these guidelines
and report the findings to all of Oregon's school dis-
tricts. This synthesization became know as the "Minimum
Standards for Oregon Schools", and was produced as the
guidelines by the State Board of Education in December,
1974.
To avoid violation of local control, the Oregon
Board of Education provided only guidelines of a general
nature. Individual districts were allowed to develop
their own germane minimal competencies. The minimum
standard definition was described as a "statement of
desired student performance representing demonstrated
ability to apply knowledge, understanding, and/or skills

4
assumed to contribute to success in life-role func-
tions." (27) The difference between goals and competen-
cies was acknowledged; competencies were always to
be written in terms of application of knowledge, under-
standing or skills. Because of this, all competencies
may be goals, but not all goals may be competencies.
SIGNIFICANCE OF THE STUDY
Local school district staff and citizens continued
in their efforts to develop, refine, and obtain common
agreement of required competencies for their school dis-
tricts. This resulted in wide differences insofar as
terminology, comprehensiveness, strength, number, and
measurability of defined competencies for each district.
Student movement between districts and district requirements
were not considered. Despite the emerging differences,
the 234 Oregon School Districts were obligated to con-
tinue their efforts because of the mandate of Oregon
Administrative Rules (OAR) 581-22-231. These administra-
tive rules stated that the local board shall, by September
1, 1976, adopt and make available to the community, mini-
mum competencies it is willing to accept as evidence that
students are equipped to function in the society in which
they live. (27)

5
Consequently, because of the mandate and few clear-
cut guidelines from the Oregon Board of Education, minimum
competency requirements became a state issue of con-
troversy and confusion. Within neighboring districts,
the number of competencies could differ between a hand-
ful and as many as 387. Disparity of requirements created
problems in competency evaluation, evaluation of trans-
ferring students, and the complicated record keeping and
documentation.
The present Standards For Public Schools With Com-
pliance Indicators and Commentary, by the Oregon Depart-
ment of Education, February 22, 1980, (29) along with
Unit Credit Requirements and Attendance Requirements
lists only briefly the Competence Requirements:
(a) Each student shall demonstrate competence in:
(A) Reading
(B) Writing
(C) Mathematics
(D) Speaking
(E) Listening
(F) Reasoning
(b) Student competence:
(A) Shall be verified by measurement of
student knowledge and skills or measure-
ment of student ability to apply that
knowledge and skill;

(B) May be verified through alternative means
to meet individualized needs; however, the
school district's standard of performance
must not be reduced; and
(C) When verified in courses, shall be des-
scribed in planned course statements;
challenge tests and/or other appropriate
procedures for verification of competencies
assigned to courses must also be available.
(c) In developing curriculum and criteria for
verification, school districts should be guided
by levels of performance required in life roles.
(d) Competence in reading, writing, mathematics,
speaking, listening, and reasoning shall be
recorded on student's high school transcripts.
Competence, when verified prior to grade 9,
shall be recorded on high school transcripts. (29)
Local redefinition continues throughout the State
without the strong, succinct regulations and guidelines
for state unification of minimal competencies in each of
the six listed areas. Even allowing for local control,
there is no central synthesis agent to assist districts
in their efforts to establish their requirements within
a workable framework of compliance or commonality with
adjoining or distant school districts within the State.

7
SCOPE OF THE STUDY
In order to assist the synthesis agent process, only
one of the competence areas, mathematics, was selected to
be investigated. The purpose of this investigation was
to design a model that could be used for further com
pilation of state-wide commonalities and differences in
studying all competencies. In addition, guidelines for
the establishment of requirements and record keeping of
transferring students could be facilitated.
To this end, a letter of inquiry was created and
forwarded to the Oregon Department of Education, November
20, 1980 (Appendix A) asking:
1. Has the Oregon Department of Education set
minimal math competencies as minimal guide-
lines for school districts?
2. Does the Department have math competencies
from every school district in the state?
3. Has the Department synthesized the com-
petencies and, if so, what are the
commonalities?
4. Have these competencies been broken down
and any comparison made among A-AA-AAA
high schools?
5. Has the Department taken any steps toward
developing an instrument that measures or
predicts state competencies in math or has
anyone else? If so, what is the name of the
instrument?
In response to the preceding five questions, a "no"
answer was acquired with the following respective commen-
tary:
(1) Consistent with educational philosophy in
Oregon, local districts and their community
determine the competence requirements. See
Goals 588-22-211 (OAR). The Standards require
that districts do this.
(2) Some have been collected as a result of work
shared with district people or standards
evaluation visits, but whatever samples are
on hand at any one time varies from time to
time.
(3) Competence requirements for each district
undergo frequent revision. Observation of
district competence requirements lead one
to conclude there is a great deal of com-
monality in the general sense. Paper/pencil
computations covering the four operations
with whole numbers, fractions, decimals and
percent is very common. Attempts to include
"applications" or "problems" are also fairly
common, and generally deal with:

(a) distance, time, rate;
(b) costs;
(c) measurement;
(d) perimeter, area, volume;
(4) Observations of commonalities given in the
third answer indicate no significant differ-
ence relating to school size.
(5) Since the districts each have their own set
of competencies, there can be no state-wide
measure of competence. (Appendix B)
Thus, evidence was dndicated of the lack of state-
wide firmness in any of the six competence areas for
Oregon's high school graduates.
STATEMENT OF THE PROBLEM
The central problem of this study was to determine
minimal mathematical competence requirements for gradua-
tion among Oregon's four-year public senior high schools,
and to determine if likenesses and differences exist
among those school groups designated by enrollment as A,
AA, and AAA.
PURPOSE OF THE STUDY.
The major purpose of this study was to establish,
for Oregon's school districts, a listing common to all
districts and reflecting Oregon's philosophy of minimal

10
mathematical competencies for graduation from Oregon's
four-year public senior high schools. A second purpose
was to ascertain if minimal mathematical requirements
for graduation differ among those groups of four-year
public senior high schools designated by enrollment as
A, AA, and AAA. If these facts were established, it was
then anticipated that likenesses and differences in these
competencies could be viewed and shared by the state's
four-year public senior high schools. This would per-
mit future analysis and synthesis for simplicity and
common base lines, and aid in record keeping and trans-
cript simplification of the mobile student between and
among districts. A third purpose of the study was to
establish a model procedure for future study of the
remaining five areas of competence as designated by the
State of Oregon. (29)
OBJECTIVES OF THE STUDY
The objectives of this study were:
1. To ascertain if a need existed for defining
minimal math competencies as a guide for
Oregon's four-year public senior high schools.
2. To ascertain if there was an agent or agency
acting as a state-wide clearing house for
each district's mathematical competencies.

11
3. To attempt a state-wide synthesis of mathe-
matical competencies so that commonalities
and differences could be viewed and dealt
with.
4. To create an instrument that would be an
effective tool and germane to each four-year
public senior high school that would,
when applied and completed, give the
necessary data applicable to the central
problem of the study.
5. To determine if minimal mathematical com-
petencies differed among groups of four-
year public senior high schools recognized
by the Oregon Department of Education as
A, AA, and AAA.
6. To assist present and future competency and
curricula coordinators in their efforts to
coordinate their particular tasks with
their professional peers in similar and
dissimilar school districts.
7. To add to the growing body of research and
literature a model procedure for identifying
competencies applicable to the State of
Oreaon and other states in like endeavors.

12
DESIGN OF THE STUDY
To fulfill the intended purposes of this study, the
following steps were undertaken:
1. An affirmative answer was obtained from
the Oregon State Department of Education
that a need existed for the nature of the
study and its results. (Appendix B)
2. A review of research studies concerned
with senior high school competencies for
graduation in Oregon and other states was
conducted.
3. A collection of all A, AA, and AAA four-
year public senior high school listings
in Oregon for sampling procedures both
for instrumentation creation and instru-
mentation application for data and data
analysis was compiled. (Appendix F & G)
4. A sampling of three was obtained in each of
the designated school groups for necessary
data for instrumentation creation. (Appendix
C)
5. A compilation of the returned data from
the initial sampling for a Delphi procedure
was used by a panel of experts (Appendix D)
comprising a classroom mathematics teacher,

13
a secondary mathematics department supervisor,
a secondary school principal with a science-
math instructional background, a school dis-
trict coordinator of mathematical curricula
and instruction, and a math specialist of
mathematics education from the Oregon State
Department of Education for final instrument
creation.
6. The final instrumentation was completed.
(Appendix E)
7. Retrieval of 51 instruments from randomly
selected schools of "A" size, "AA" size,
and "AAA" size with appropriate additional
items for opinion itemization such as (a)
do you include? (b) if so, importance on
Likert Scale 1 to 5. (c) If not, opinion
concerning inclusion on scale of 1 to 5,
etc., was completed.
8. An analysis of returned data was completed.
9. The use of the findings in conjunction with
purpose of the study was coordinated.
10. Recommendations for action and recommendations
for further study were noted.
14
HYPOTHESIS
HO1 There are no significant differences in the
minimal mathematical competencies for gradua-
tion requirements among Oregon's A, AA, and
AAA four-year public senior high schools.
ASSUMPTIONS
In conducting the investigation, certain basic assump-
tions were made:
1. Sample schools were stratified into large
schools or "AAA" schools with Average Daily
Membership (ADM) grades 10, 11, and 12, with
populations of 2,281 to 600; medium schools
or "AA" schools with ADM grades 10, 11, and
12, with populations of 599 to 200; and small
schools or "A" schools with ADM grades 10,
11, and 12 with populations of 199 to 1.
(Appendix F and G)
2. The panel of experts selected for the Delphi
treatment were representative of their pro-
fessional peers in the State of Oregon and
were acceptable in peer representation.
(Appendix D)
3. The nine schools selected for instrumentation
creation assistance representing A, AA, and
AAA responses preceding the Delphi

15
application were representative of their respec-
tive like-sized institutions. (Appendix C)
4. A valid instrument for data collection was
created by the process outlined in the study.
(Appendix E)
5. A sample size of 17 in each of the three
school categories would accurately reflect
the minimal competencies common to those
categorized institutions. (3)
DELIMITATIONS
1. Both the Delphi process and the adminis-
tration of the finalized instrument
were conducted by mail with letters of
explanation attached. (Appendix H.)
2. Interpretation of responses was determined
by the researcher without bias to the best
of his ability in cases of unclear or garbled
response.
3. Only teachers or math department heads or
principals were requested to respond to the
research instrument.
LIMITATIONS
1. The length of the finalized instrument and
its items were the result of the original

16
sampling and Delphi treatment.
2. The responses of the randomly selected
respondents may have varied somewhat
from their peer representatives, but in
the spirit of research, were accepted as
representative.
3. The respondents may have been influenced
by their personal rather than professional
bias toward competencies for high school
graduation as well as the instrument it-
self.
DEFINITION OF TERMS
1. Class A School: ADM June 1980 Grades 10-12
Student Population ,1-199. (Appendix F and G)
2. Class AA School: ADM June 1980 Grades 10-12
Student Population 200-599. (Appendix F and G)
3. Class AAA School: ADM June 1980 Grades 10-12
Student Population 600-2,281. (Appendix F and G)
4. Common School District: A school district other
than a union high school district formed pri-
marily to provide education in all or part of
grades K/1 through 12 to pupils residing within
the district. (29)

17
5. Competency: Those skills, concepts, and
attitudes needed by all workers regardless
of their occupations or specific jobs. (.29)
6. Course Goal: Statements describing what
students are expected to know or be able to
do as a result of having completed a course,
elementary unit, or grade level. (29)
7. District: A common or union high school dis-
trict. (29)
8. Diploma: The document issued by school dis-
tricts attesting to the holder's having:
(a) Demonstrated competencies the district
school board has adopted for graduation,
(b) Completed the state required 21 units
of credit and any additional units of
credit the district school board
specifies, and
(c) Completed 12 years of educational experi-
ence, or the equivalent as authorized by
district school board policies adopted
in conformance with these rules. (29)
9. High School: Any combination of grades 10
through 12 in districts providing a junior high
school containing grade 9; any combination of
grades 9 through 12 organized as a separate
unit; grades 9 through 12 housed with grades

18
K/1 through 12; grades 7 or 8 through 12, if
approved by the Oregon Department of Educa-
tion. (29)
10. Knowledge: The accumulated facts, truths,
principles and information to which the human
mind has access. (15)
11. Program Goal: Statements describing what
students are expected to learn in each dis-
trict instructional program in any combination
of grades K/1 through 12. (29)
12. Skill: Anything that the individual has learned
to do with ease and precision: may be either
a physical or a mental performance. (11)
13. Unit of Credit: Certification of a student's
successful completion of classroom or equivalent
work (i.e., independent study, work experience,
research) in a course of at least 130 clock
hours. (29)

CHAPTER II
REVIEW OF LITERATURE
INTRODUCTION
19
A review of existing literature concerned with
senior high school competencies, particularly mathe-
matical competencies, for graduation in Oregon and other
states was conducted. Of the many articles and reports
reviewed, only the most relevant were described below.
These studies were organized into the following cate-
gories:
1. The development of competency require-
ments for high school graduation.
2. A description of the current state of
the art in establishing minimal competency
requirements in Oregon high schools.
3. A discussion of mathematical competencies
as one distinct area of knowledge and
skill included in minimal competency
requirements for high school graduation.

20
DEVELOPMENT OF COMPETENCY REQUIREMENTS FOR HIGH SCHOOLGRADUATION
Oregon is one of the front runners of the com-
petency movement in the United States. The move toward
competency-based education in Oregon, beginning in the
1960's, was traced in Graduation Requirement Guidelines
(Revised), published in 1977, by the Oregon Department
of Education and reviewed in the introduction to this
dissertation. The investigations and public meetings of
the 1960's culminated in the adoption of new minimum
state requirements for graduation in 1972, and the
adoption of competency-based minimum standards for
Oregon public schools in 1974.
In "Competency-eased Education in Oregon: An
Overview" Mary Hall described the transition, during
1972-74, of Oregon's public elementary and secondary
schools, and the educational institutions which train
teachers and administrators for these schools, to a
"competency-based orientation." This was accomplished
through the enactment of "three separate but inter-
related state-wide policies" dealing with:
1. Changes in the minimum requirementsfor graduation from high school;
2. Changes in the standards upon whichpersonnel preparation institutions areaccredited and educational personnelare certified;
21
3. Changes in the minimum school standardsused by the state to accredit elementaryand secondary schools. (13)
In developing a program for instituting these
policy changes, Oregon followed the "Oregon Way"
established during pioneer times: local control. Mary
Hall described the "Oregon personality" in three phases,
using it to explain why she believed competency-based
education could be successful in Oregon. First, the
Oregonians tend to judge an individual by what he or she
can do, rather than by who they are or what they did in
the past. Secondly, Hall continued, Oregonians generally
disregard events occurring outside of the state and are
certainly not attentive to "imported" ideas. Thirdly,
the "True Oregonian" is impressed by "experts" who
"suggest how to do something, not what to do." (13)
In "The Oregon Walkabout, "Dale Parnell, former
Superintendent of Public Instruction in Oregon, described
the motivation behind the competency-based education
movement in Oregon. He compared Oregon students receiv-
ing "survival skills" through competency-based education
to young Australian aborigines on a "walkabout," a
survival test through which the youth made the transi-
tion from childhood to adulthood. "While the young
Australian aborgine learns to survive by stalking
kangaroos in a deadly ballet, an Oregon youth will

22
have acquired survival skills to function as a wage
earner or producer in an increasingly urbanized nation."(30)
Parnell further related the Oregon system of educa-
tion to Abraham Maslow's hierarchy of human needs:
survival, security, love and belonging, self-esteem,
and self-actualization. Parnell concluded, "Too often
American schools and colleges aim for the self-actualiz-
ing and higher-level needs while ignoring survival and
security needs." Oregon's competency requirements, he
explained, are intended to produce more equitable
priority ranking among college transfer and career com-
petency requirements in a thrust to free career and
vocational education/technical education of the 'second-
rate' stigma." (30)
Thomas Olson, in "Coping with the Instructional
Dimensions of Competency-Based Graduation Requirements"
(25), stresses "the desire to bring about a greater
range of alternative learning settings and experiences"
as the primary motivation in Oregon. For example, some
seniors may be enrolled in a nearby community college,
some may be employed in community service full or part-
time, and some seniors may be regularly enrolled in
school-based programs. Similarly, some students may
graduate after 11 years, others after the traditional
12 years, and still others may require 13 years of total
schooling.

23
Another important aspect of competency-based
requirements, Olson noted, is the expectation that they
will "help insure a student the ability to function with-
in today's complicated society." (25)
Olson described the way in which these changes
will be affected in "Graduation Requirements as a Vehicle
for Change." (26) He cited a 100 -year old newspaper
article which called for reform by "restricting the
studies in all public schools to the English branches
excluding all the singular flub dubs and frabbles." He
then continued to describe Oregon's unique approach taken
in the Revised Oregon High School Graduation Requirements
adopted in 1972:
The focus of the revised graduationrequirements is on identificationand student achievement of minimumsurvival competencies in three broadareas: personal development, socialresponsibility, and career develop-ment. (26)
The new requirements caused "a massive critical
reassessment of all aspects of the educational program
in Oregon" for the first time in 40 years, according
to Earl N. Anderson (1), who describes himself as "a
practitioner."
For the past ten years, citizens haveexpressed dissatisfaction with theeducational system in practice. Theyare concerned with present curricularofferings and graduation requirements

24
versus real-life requirements thatgraduates must deal with and meet." (1)
Anderson welcomed the new curriculum and compe-
tencies through which "current graduates will not only
meet the old requirements of credit and attendance, but
will meet the new requirements of demonstrating the com-
petencies considered necessary, as defined by the school
district, for survival in today's world." (1)
Oregon's school districts accepted the concept of
competency-based education, Anderson asserted,but they
were overwhelmed by the magnitude of the change once
they began to implement it. Individual districts formed
consortiums to conduct research and produce model
materials. Staff at individual school district offices
actually drafted the guidelines and procedures. These
research and development efforts addressed the follow-
ing topics:
1. What are the goals of the school
district?
2. What is the curriculum content of
specified required areas of study?
3. What are the competencies that
students need to function in a
modern society? (1)

25
Due to the emphasis on local control, each dis-
trict was charged with developing its own competencies.
Egge described the tension between the local and state
roles and the emergence of the state support system.
"This system, headed by the Oregon Department of Educa-
tion, includes policy-making, provision of information
resources and communications links, and personnel
development." (6)
Olson summarized what was needed: "Specification
of competencies, the design and implementation of con-
tinuous feedback evaluation systems as students move
through the learning experiences, and the summative
certification of achievement of the competencies." (26)
Subsequently, a number of guides were issued by the
Oregon Department of Education and by other agencies,
to assist districts, such as:
1. "The Elementary-Secondary Guide for
Oregon Schools" (1975) which provided:
(a) the revised minimum standard for public
schools adopted by the Board of Educa-
tion in December, 1974,
(b) specific criteria to determine com-
pliance with the standards, and
(c) a brief description of the character-
istics of quality instructional programs.
26
2. U.S. Bureau of Elementary and Secondary
Education, Oregon Graduation Require-
ments: Guidelines for Record Keeping
Procedures and Sample Forms (1974).
This booklet outlined various record-
keeping procedures and provided sample
forms, of several options for flexibility.
This encouraged districts to adapt the
forms to meet their needs, preferences,
and resources.
3. U.S. Bureau of Elementary and Secondary
Education, Oregon Graduation Requirements:
Guidelines for Planned Course Statements
(1974). Guidelines and sample materials
were provided in reponse to requests from
teachers, curriculum planners, and adminis-
trators, for clarification and modifica-
tion of Oregon Graduation Requirements,
Administrative Guidelines (Section 1, 1973).
4. "Measuring Performance: Verifying Com-
petencies Through Observation and Judg-
ment" (1977). A guide developed to
assist Oregon school districts in meeting
revised minimum state standards for
planning and assessment. (19)

27
5. Miller, Lorin. "The New State Graduation
Requirements: An Overview and Discussion,"
OSSC Bulletin 20:7 (1977). Miller examined
the new Oregon competency-based high school
graduation requirements which became effective
in the fall of 1976. Included was a model
plan to aid school districts in complying
with the new requirements.
These, and other guides assisted districts in
establishing competencies, but did not prevent the
inconsistency and duplication of effort. Anderson
points out, "...among districts there are not standard
competencies for any of the six areas for which com-
petencies are to be established. This gives rise to a
remarkable complexity of record-keeping and trans-
cribing with no standardization patterns to follow for
students who transfer to school8 outside a given
system." (1)
Herron noted "The concept of local control in
choosing minimum competencies is very strong."
described problems created because teachers were more
oriented toward specifying school skills, rather than
life skills as suggested by the standards. Neverthe-
less, both school personnel and the general public
viewed the standards positively. (14)

28
At least 36 other states have legislation or actual
programs incompetency -based education. "Minimal Com-
petency Measurement Conference: Summary Report" sum-
marized the national movement:
While terminology and emphasis differamong the states, there seems to be aneffort to define minimum and basicskills, and that some form of test bedevised to measure these skills, inmany instances, on a state-widebasis, to see how well these skillsare mastered by all students. Thiswould also be a prerequisite to gradua-tion. (22)
George Elford reviewed the policy issues relating
to competency-based education: "test score decline, the
widespread offering of electives in high school, the
complaints of employers about the skill level of high
school graduates, and the public mood." (8) A National
Association of Secondary School Principals task force
reported in 1975 "that the criteria for a high school
diploma should be distinctive representing an accomplish-
ment independent of other factors...the diploma should
certify that the graduate possesses the baseline skills
and knowledge essential to an effective adult citizen-
ship." (23)
There were several varieties of minimum competency
programs, as described in "Basic Skills Assessment
Around the Nation:"
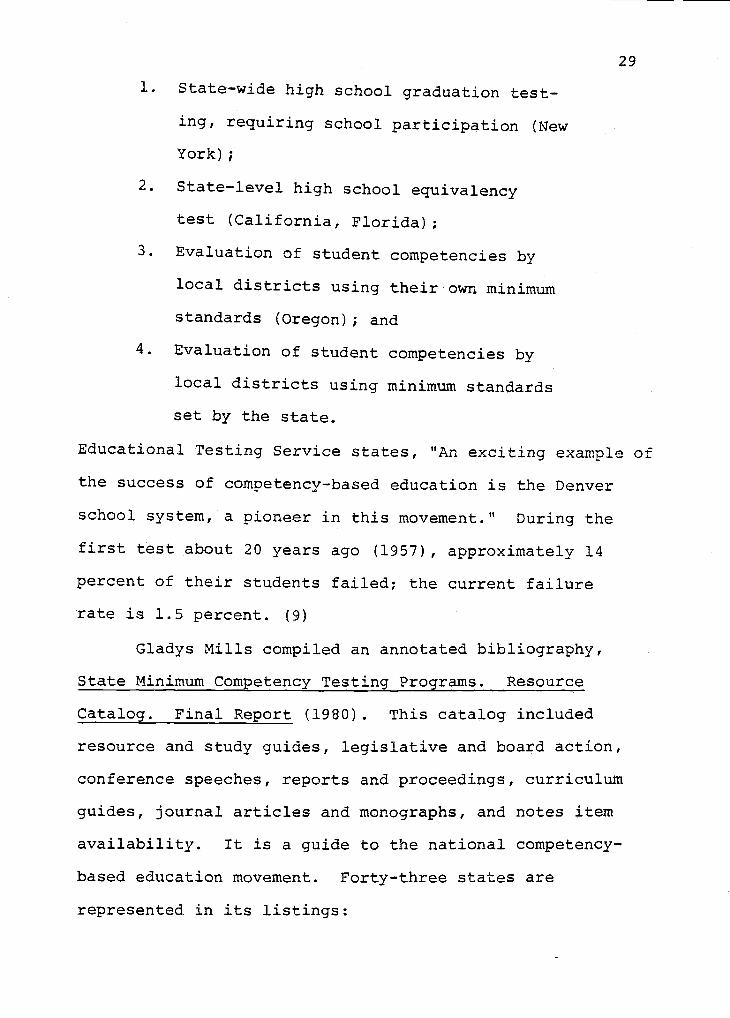
29
1. State-wide high school graduation test-
ing, requiring school participation (New
York);
2. State - level high school equivalency
test (California, Florida);
3. Evaluation of student competencies by
local districts using their own minimum
standards (Oregon); and
4. Evaluation of student competencies by
local districts using minimum standards
set by the state.
Educational Testing Service states, "An exciting example of
the success of competency-based education is the Denver
school system, a pioneer in this movement." During the
first test about 20 years ago (1957), approximately 14
percent of their students failed; the current failure
rate is 1.5 percent. (9)
Gladys Mills compiled an annotated bibliography,
State Minimum Competency Testing Programs. Resource
Catalog. Final Report (1980). This catalog included
resource and study guides, legislative and board action,
conference speeches, reports and proceedings, curriculum
guides, journal articles and monographs, and notes item
availability. It is a guide to the national competency-
based education movement. Forty-three states are
represented. in its listings:

30
Alabama, Alaska, Arizona, Arkansas,California, Colorado, Connecticut,Delaware, Florida, Georgia, Hawaii,Idaho, Illinois, Indiana, Iowa, Kansas,Kentucky, Louisiana, Maine, Maryland,Massachusetts, Michigan, Missouri,Montana, Nebraska, Nevada, New Hampshire,New Jersey, New Mexico, New York, NorthCarolina, Oklahoma, Oregon, Pennsylvania,Rhode Island, South Carolina, Tennessee,Texas, Utah, Vermont, Virginia, Washington,and Wyoming. (21)
In developing competency requirements much concern
has been expressed about legal ramifications. According
to J. Patrick Mahon (18) there were three kinds of legal
issues associated with competency-based education pro-
grams: claims under the due process clause, claims of
discrimination under the equal protection clause, and
claims of negligence.
Trachtenburg discussed the legal implications
of state-wide pupil performance standards, concluding:
The tendency of the courts to defer tothe expertise of professional educators,as well as more general judicial develop-ments limiting law reform litigation,will provide a first line of defenseagainst all legal challenges. (33)
STATE OF THE ART
"Oregon Minimum Standards" set forth the follow-
ing competency requirements for the graduating classes
of Oregon's public high schools. For 1978:
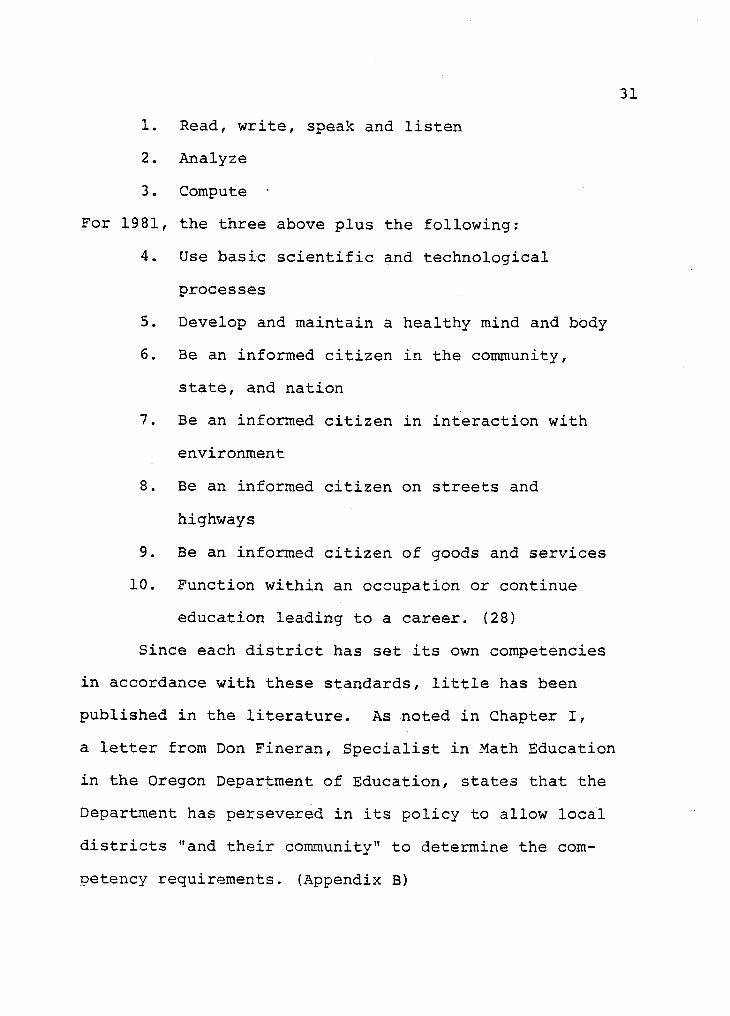
31
1. Read, write, speak and listen
2. Analyze
3. Compute
For 1981, the three above plus the following:
4. Use basic scientific and technological
processes
5. Develop and maintain a healthy mind and body
6. Be an informed citizen in the community,
state, and nation
7. Be an informed citizen in interaction with
environment
8. Be an informed citizen on streets and
highways
9. Be an informed citizen of goods and services
10. Function within an occupation or continue
education leading to a career. (28)
Since each district has set its own competencies
in accordance with these standards, little has been
published in the literature. As noted in Chapter I,
a letter from Don Fineran, Specialist in Math Education
in the Oregon Department of Education, states that the
Department has persevered in its policy to allow local
districts "and their community" to determine the com-
petency requirements. (Appendix B)
32
Although Verne Duncan, present Oregon Superintend-
ent of Public Instruction, wrote in 1978, "I have told
the State Board of Education it would be helpful to have
a state recommended list of competencies school districts
may use in their graduation requirements," no such list
has come forth. (4)
In 1978, school administrators were asked through
the Edugram to comment on competency-based education gradua-
tion requirements. The following were among the replies:
The new graduation requirements havehelped our teachers place prioritieson what is to be emphasized, and notleft everyone to teach what they wantto. It has been one of the best thingsfor kids in the 29 years I have beenteaching.
For too many years, students enteringmy journalism classes have been taughtbasic sentence structure and otherfundamentals. This year's class, thefirst crop with three years of com-petency testing, were able to produceacceptable news stories on their firstassignment.
Why have the competency designers beenallowed to wander all over the map andstill have no finite directions?Minimum competencies should be stand-ardized for graduation from an Oregonhigh school. If we need 1000 or 5,they should be the same for everydistrict. (5)
In 1979, Frahm and Covington, discussing "What's
Happening in Minimum Competency Testing?" concluded:

33
1. The major strength of minimum competency
testing programs is the identification of
specific learning objectives, especially
in the elementary grades;
2. The effect of high school graduation tests
is unclear;
3. The full impact of the programs is un-
certain; and
4. The effect of emphasizing basic skills
upon below-average students and high-
achieving students is as yet unanswered. (10)
MATHEMATICAL COMPETENCIES
Mathematical competencies form one distinct area
of knowledge and skill included in minimal competency
programs. Documents describing mathematical competen-
cies currently being used in various schools in the
United States are described in this section.
"Complete General Mathematics Program for Use in
Bilingual Math Classes, Grades 9-12," by Roger Williams
provided one of the first sources. This work included
worksheets and assessment instruments on various mathe-
matical skills, progress charts, pre- and post-tests,
answer keys, and other resource information. The
topics included place value, addition, subtraction,

34
multiplication, division, fractions, decimals, and
percent. (36)
Griffin, in "Minimal Competency Exam Program,"
described the Minimal Competency Exam Program of Peoria
Public Schools scheduled for full implementation with
the graduating class of 1980. General areas of mathe-
matical skills to meet competency requirements were
given as follows:
1. Add, subtract, multiply, and divide
whole numbers.
2. Compute percentages of whole numbers.
3. Balance a checkbook given deposits and
dollar amounts of checks written.
4. Compute change for the purchase of
retail items.
5. Prepare a household budget given major
expense items.
6. Add, subtract, multiply, divide decimals.
7. Accurately read and use units of measures,
e.g., miles, feet, hours, pounds, etc.
8. Add a column of numbers such as a grocery
list of fifteen items.
9. Determine simple interest cost on a loan,
given the interest rate.

35
10. Correctly complete the short form Federal
and State Income Tax form, given the
necessary tax data.
11. Compare the cost of grocery items and
compute the cost per ounce for each item.
12. Interpret and utilize units of the metric
system.
13. Add, subtract, multiply, and divide fractions.
14. Compute net pay, given gross pay and deduc-
tions. (12)
"STAMM," the "Systematic Teaching and Measuring
Mathematics" program was developed by Jefferson County
Public Schools in Lakewood, Colorado. The performance
objectives for the STAMM program covered numbers and
numeration, properties and operations on numbers, com-
putation, sets and logic, equations and inequalities,
relations and functions, probability and statistics,
graphing, geometry, measurement, mathematical system,
and consumer mathematics. These objectives were for
students in K-8 grades. A list of 39 math competencies
was tested at the end of Grade 8 and students who
showed a deficiency took work to remedy the deficiencies.
Examples of K-8 mathematical competencies were:
1. Apply non-standard measures
2. Number value and place value
36
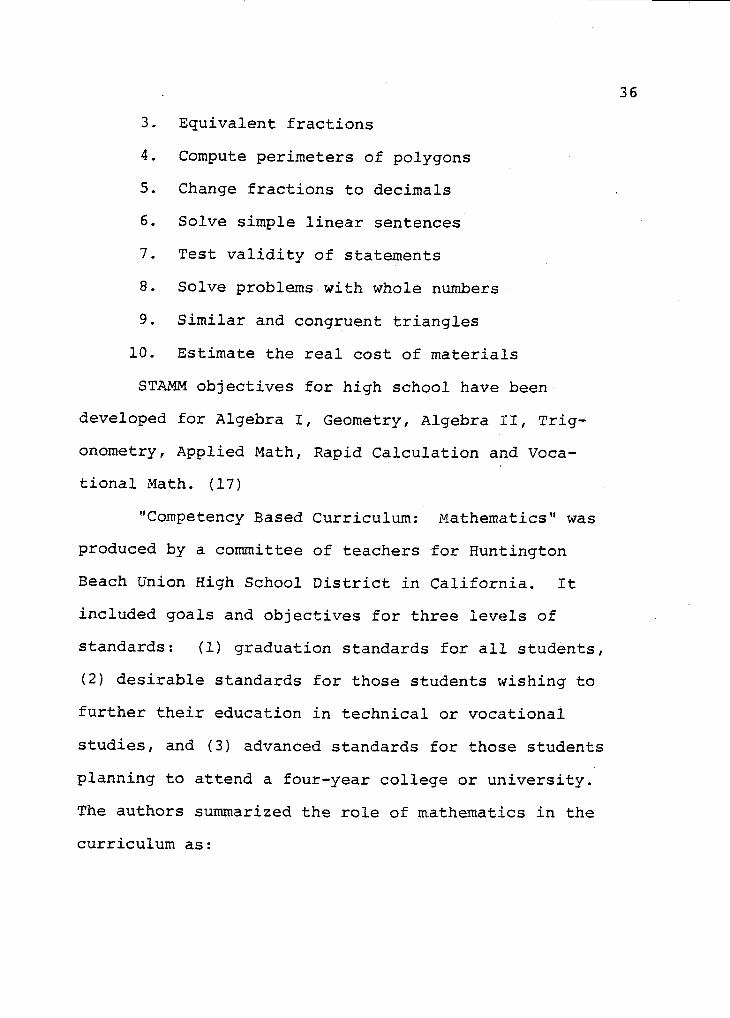
3. Equivalent fractions
4. Compute perimeters of polygons
5. Change fractions to decimals
6. Solve simple linear sentences
7. Test validity of statements
8. Solve problems with whole numbers
9. Similar and congruent triangles
10. Estimate the real cost of materials
STAMM objectives for high school have been
developed for Algebra I, Geometry, Algebra II, Trig-
onometry, Applied Math, Rapid Calculation and Voca-
tional Math. (17)
"Competency Based Curriculum: Mathematics" was
produced by a committee of teachers for Huntington
Beach Union High School District in California. It
included goals and objectives for three levels of
standards: (1) graduation standards for all students,
(2) desirable standards for those students wishing to
further their education in technical or vocational
studies, and (3) advanced standards for those students
planning to attend a four-year college or university.
The authors summarized the role of mathematics in the
curriculum as:

37
We believe that the educational programshould promote excellence based upon theoptimum fulfillment of each individual'scapabilities as determined by his experi-ences, needs, and incentives. We commitmathematics instruction to a partnershipwith Reading and Language Arts to providebasic skills competencies to the graduatesof the Huntington Beach Union High School'District.
We believe that mathematics contributesto the intellectual growth of the individualby a course of study which emphasizeslogical reasoning and sound decision-making.The purpose of these studies is to stressthe structural nature of reality and thenecessity for basic computational skillsto enable the student to describe, under-stand, interpret, and appreciate hisenvironment. Mathematical education andtraining seek to provide the student withthe means to become a functional member ofa rapidly changing society. (16)
The major goals of the discipline were outlined
as follows:
1. Each student, in accordance with his innatepotential, will acquire and develop thoseskills and understandings necessary for thenext step in the hierarchy of mathematicaleducation.
2. Students will have the opportunity to under-stand consumer mathematics principles usedto develop an understanding of the effectiveuse of these in living.
3. Each student will learn to use mathematicsin problem solving.
4. Students will experience an awareness ofthe mathematical structure of the environ-ment. (16)
The objectives were divided into categories of
standards:

38
1. Graduation Standards...objectives for allstudents who will be recommended for adiploma. Students must demonstrate pro-ficiency in accomplishing each of thoseobjectives as measured by a uniform testin the district, for example:
a. Percent
b. Reading of Graphs
c. Wages
d. Measurements
e. Checking accounts
f. Budgeting
g. Comparative pricing on a unit basis
h. Approximations of the correct answers
to mathematical problems.
2. Desirable Standards...objectives...gearedtoward those students who not only willcomplete high school graduation, but planto continue further formal education,either in technical school or at a com-munity college. Completion of these objec-tives requires greater achievement thanthose objectives in the GRADUATION STANDARDS.However, students functioning in this cate-gory must also complete, satisfactorily,the GRADUATION STANDARDS objectives, forexample:
a. Use addition and multiplication pro-perties of rational and irrationalnumbers.
b. Solve linear equations in one variable.
c. Solve systems of equations in twovariables.
d. Solve equations containing functionalexpressions.
39
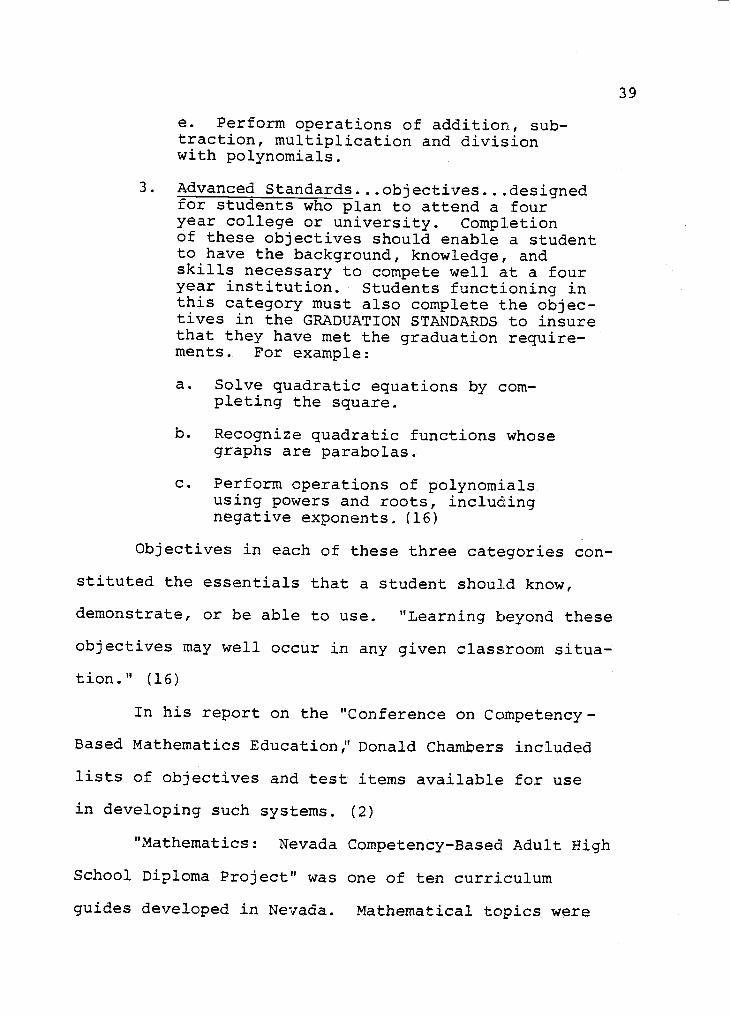
e. Perform operations of addition, sub-traction, multiplication and divisionwith polynomials.
3. Advanced Standards...objectives...designedfor students who plan to attend a fouryear college or university. Completionof these objectives should enable a studentto have the background, knowledge, andskills necessary to compete well at a fouryear institution. Students functioning inthis category must also complete the objec-tives in the GRADUATION STANDARDS to insurethat they have met the graduation require-ments. For example:
a. Solve quadratic equations by com-pleting the square.
b. Recognize quadratic functions whosegraphs are parabolas.
c. Perform operations of polynomialsusing powers and roots, includingnegative exponents. (16)
Objectives in each of these three categories con-
stituted the essentials that a student should know,
demonstrate, or be able to use. "Learning beyond these
objectives may well occur in any given classroom situa-
tion." (16)
In his report on the "Conference on Competency-
Based Mathematics Education;' Donald Chambers included
lists of objectives and test items available for use
in developing such systems. (2)
"Mathematics: Nevada Competency-Based Adult High
School Diploma Project" was one of ten curriculum
guides developed in Nevada. Mathematical topics were

40
divided into (1) problem solving, (2) computation, and
(3) geometry and measurement. Competency statements
and performance indicators were provided for each
topic area. (24)
Mathematical competencies included in the "Com-
petencies Catalog" developed by the Illinois State
Office of Education listed below were similar in many
ways to those reviewed from other states and were com-
patible with the kinds of competencies used in Oregon.
As an example:
1. Perform the basic operations ofsubtraction, multiplication andwith whole numbers.
2. Perform the basic operations ofsubtraction, multiplication andwith common fractions.
addition,division
addition,division
3. Add and subtract measures of such thingsas time, distance, and coinage.
4. Translate mathematical symbols for opera-tions and numbers into words.
5. Convert units within and between the metricand English measurement systems.
6. Compute percents.
7. Recall and use sample formula to solvegeometric problems.
8. Read and use graphs, tables and charts.
9. Recognize real life situations in whichcalculators and computers may be used.
10. Use basic computational skills to solveconsumer problems dealing with interest,commission, down payments, and percentages. (31)

41
SUMMARY
Although Oregon has been one of the front runners
in the competency-based educational movement in the
United States, the unique emphasis Oregonians have put
on "local control" has created problems for Oregon
educators who establish and teach competencies, and
for students who may transfer from one school dis-
trict to another. Guides or resource catalogs to aid
districts in establishing competencies, and perhaps
even state standards, are needed by educators.
The Oregon "state of the art" has been difficult
to assess because so little has been published about
competencies currently being used in Oregon school dis-
tricts. Although the mathematical competencies developed
for use in other states were not used in developing
competency items for this study, the literature has
provided background for the research.

42
CHAPTER III
RESEARCH DESIGN
INTRODUCTION
The Research Design chapter contains the follow-
ing sections: type of study, population and sample,
instrumentation, data collection and procedures, and
treatment of the data.
TYPE OF STUDY
This is a descriptive study to determine minimal
mathematical competence requirements for graduation
among Oregon's four-year public senior high schools,
and to determine if likenesses and differences exist
among those school groups designated by enrollment as
A, AA, and AAA. Only statements of association will
be made on the findings because the variates cannot
be manipulated. (3)
POPULATION AND SAMPLE
For the purposes of this study, the sample popula-
tion for the creation of the instrument and eventual
Delphi treatment and instrument administration, was
selected from within the four-year public senior
high schools in Oregon. This selection was based on

43
assured response by personal contact with the respective
building administrator. A listing of the administrator,
school and telephone number may be found as Appendix C.
Those schools were deleted when the Table of Random Num-
bers indicated their selection.
The Delphi panel of experts was personally selected
by the investigator and was representative of a person
from each professional station of mathematics curricula
and instruction in Oregon. Their assistance was recruited
to insure the relevancy of the finalized instrumentation.
Their names, addresses and positions are found in
Appendix D.
The respondents using the finalized instrument
were selected by using the list of 257 senior high
schools in the state of Oregon as a total population
group. (Appendix F and G) The sample of 51 schools was
selected from members of this total population group
through the use of the Table of Random Numbers. (32)
Letters soliciting cooperation in this research
were addressed to the appropriate building administra-
tor requesting his/her aid in the completion of the
instrument. (Appendix E) The administrator was asked
to share this instrument with the appropriate math
person in his/her building. In the larger districts
it was anticipated that the math department head would
44
be the appropriate person to review and evaluate. In
the smaller schools without departmental structure,
the leading math teacher and/or the principal may well
have been the person completing the review and evaluation.
For research purposes, individual cell size for each
school classification (A-AA-AAA) was designated at 17
with a power level of .70 in accordance with Cohen's
text. (3)
INSTRUMENTATION
In developing the 5 point Likert-type response
scale, the use of a Delphi committee was employed. Upon
receipt of suggested math competencies from the selected
sample schools a document was compiled and submitted to
the Delphi committee. The committee was then asked to
accept, reject, modify and/or add to each of these
competencies. After receiving the first round of
evaluations from the committee, the responses were again
reviewed by the investigator and a second document was
compiled for an additional evaluation and adjudication,
and final consensus.
After final Delphi input, the demographic and
5 point Likert-type scale was compiled, printed,
and sent to the randomly selected schools in
each classification. These participants were asked

45
if they had the competencies in their school, and if so,
the importance of each. From this data, results, con-
clusions and recommendations were drawn. (Appendix E)
DATA COLLECTION AND PROCEDURES
Each of the randomly selected schools was asked
to cooperate in the study. Initial contact was made
to the building administrator by letter. (Appendix H)
In the mail out of the letter and instrument, a
self-addressed return envelope was enclosed for a cost-
free return by the participating schools. A period of
two weeks was allowed for the response. If instru-
mentation was not returned by that time, a follow-
up letter would be sent to help speed the returns. It
was planned to select alternate schools if the original
schools did not cooperate. Sufficient returns were
received from the original randomly selected popula-
tion to void the anticipated alternate plan. Seventy-
five instruments were distributed with a return of at
least 17 in each of the three cell categories for a 68%
return.

46
TREATMENT OF THE DATA
Statistical Design
The statistical design was planned to give support
for the study's independent variable which was reflected
in the problem statement. The intent of the research
was to identify the importance levels of the given math
competencies for A-AA-AAA programs, and the statistical
analysis was planned to determine any significant differ-
ences among A-AA-AAA schools.
The Mathematical Model
The mathematical model for the research analysis
was a one factor fixed arrangement. The mathematical
structure of the model was as follows:
Y. = M a. +E.13 13
where M is the overall mean
a.1 is the differential (fixed) effect
associated with school classifications
Eij is the residual (error) effect with
NID (012)

Data Analysis
The study's focus was to test the following
hypothesis:
MAAA = MAA
= MA
The one-way analysis of variance procedure was
used in testing the hypothesis.
The decision layout, including sources of varia-
tion, is shown below:
ANOVA DECISION LAYOUT
47
Source of Computed Tabular FVariation df ss ms F a=.05 df=2,48
Between ClassWithin Error 2 A A/2 MS / S
Total 48 B B/48
50 C C/50
It was planned, if computed F equaled or exceeded the
tabular F, the null hypothesis would be rejected at the
.05 level of significance. If HO was rejected, a
multiple comparison test would be conducted in order
to identify the source of rejection. A PRIORI (in
advance) hypotheses are shown below:
M > MAAA AA
MAAA > MA

48
The Least Significant Difference (LSD) would then
utilized in testing these hypotheses.

CHAPTER IV
ANALYSIS OF THE DATA
INTRODUCTION
49
The major purpose of this study was to establish,
for Oregon's school districts, a listing common to all
districts and reflecting Oregon's philosophy of minimal
mathematical competencies for graduation from Oregon's
four-year public senior high schools for completing
seniors. A second purpose was to ascertain if minimal
mathematical requirements for graduation differ among
those groups of four-year public senior high schools
designated by enrollment as A, AA, and AAA. If these
facts were established, it was then anticipated that
likenesses and differences in these competencies could
be viewed and shared by the state's four-year public
senior high schools for future analysis and synthesis
for simplicity and common base lines, as well as an aid
in record keeping and transcript simplification of the
mobile student between and among districts. A third
purpose of the study was to establish a model procedure
for future study of the remaining five areas of competence
as designated by the state of Oregon.

50
The sample selected for the research was drawn from
the list of four-year public senior high schools in the
state of Oregon as a total population group. The sample
was selected from members of this total population group
through the use of a Table of Random Numbers. (32)
A total of 51 respondents, 17 from A high schools,
17 from AA high schools, and 17 from AAA high schools
responded to the study. For research purposes, indivi-
dual cell size for each school classification (A, AA,
and AAA) was designated at 17 with a power level of .70
in accordance with Cohen's Statistical Power Analysis
for the Behavioral Sciences. (3)
The data in this research, collected through mail
instrumentation, was analyzed by the use of statistical
procedures. A one-way analysis of variance (ANOVA) was
used in testing the hypothesis to determine if signifi-
cant differences existed as postulated.
In this study, the .05 level of confidence was used
as a criterion for accepting or rejecting the null hypo-
thesis. If the computed values were greater than the
tabular values at the .05 level of significance, the
null hypothesis was retained. Conversely, when the
computed value was less than the tabular value, the
null hypothesis was rejected as not being a tenable
statement.
51
In the event the hypothesis was rejected, the Least
Significant Difference (LSD) statistical tool was applied
to determine where differences existed.
Findings Relative to the Hypothesis UnderInvestigation
HO MAl
: MACAAA
It was planned, if computed F equaled or exceeded the
tabular F, the null hypothesis would be rejected at the
.05 level of significance. If H01 was rejected, a
multiple comparison test would be conducted in order to
identify the source of rejection. A PRIORI (in advance)
hypotheses are shown below:
AAA> m
AA
MAAA>
The LSD test was utilized in testing these hypotheses.
The following master list is a compilation of
competencies that was selected through statistical
methods. This list represents the considered
evaluation of the participants in the study as being
those competencies worthy of inclusion by at least
66 2/3% of the respondents.
52
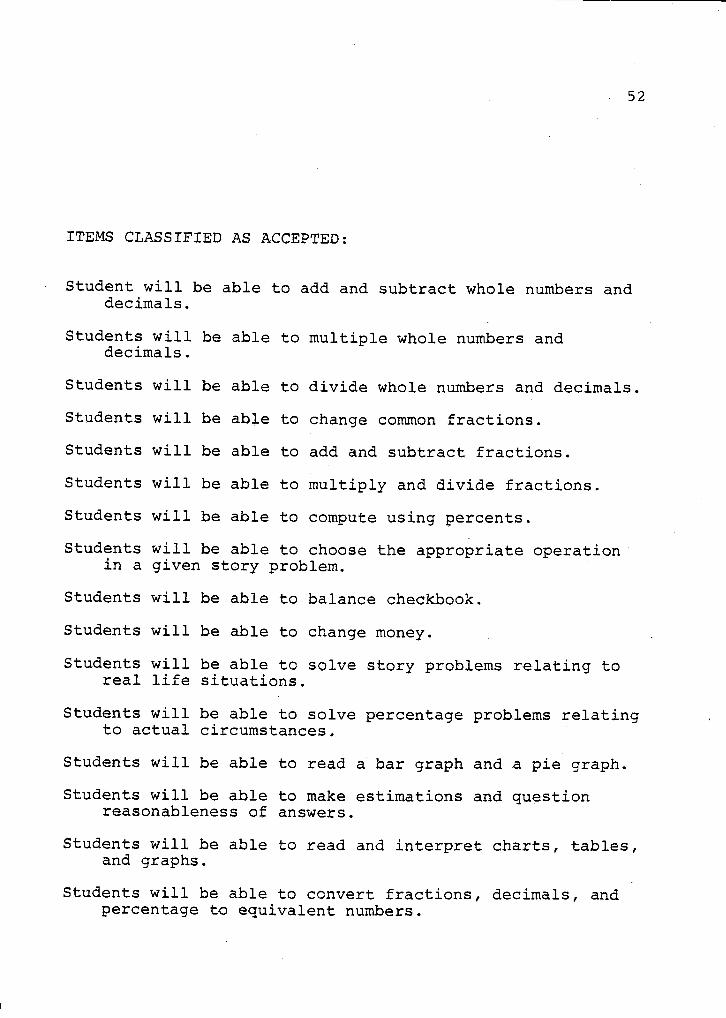
ITEMS CLASSIFIED AS ACCEPTED:
Student will be able to add and subtract whole numbers anddecimals.
Students will be able to multiple whole numbers anddecimals.
Students will be able to divide whole numbers and decimals.
Students will be able to change common fractions.
Students will be able to add and subtract fractions.
Students will be able to multiply and divide fractions.
Students will be able to compute using percents.
Students will be able to choose the appropriate operationin a given story problem.
Students will be able to balance checkbook.
Students will be able to change money.
Students will be able to solve story problems relating toreal life situations.
Students will be able to solve percentage problems relatingto actual circumstances.
Students will be able to read a bar graph and a pie graph.
Students will be able to make estimations and questionreasonableness of answers.
Students will be able to read and interpret charts, tables,and graphs.
Students will be able to convert fractions, decimals, andpercentage to equivalent numbers.

53
Students will be able to measure lengths, weights, volumes,with metric measurements.
Students will be able to identify simple polygons.
Students will be able to use ruler and protractor.
Students will be able to compute area, perimeter, andvolume.
Students will be able to use the calculator to assist inproblem solving.
Students will be able to solve equations with one variable,write algebraic expressions for everyday situations,and to use equations to solve word problems.
Students will be able to use addition, subtraction,multiplication, and division of real numbers insolving equations.
ITEMS CLASSIFIED AS RECOMMENDED:
Students will be able to compute mean of a set of data.
Students will be able to evaluate simple expressions bysubstituting for the given.
Students will be able to work with variables and solvesimple equations.
Students will be able to recognize the meaning of variablesand their use in algebraic expressions.
Students will be able to read and draw bar graphs andbroken line graphs, and be able to graph linear equa-tions.
Students will be able to graph linear equations and solvesystems of equations.
Students will know factoring techniques and be able toapply them in solving sentences and practical problems.
Students will be able to compute area and perimeter ofpolygons and circles.
54
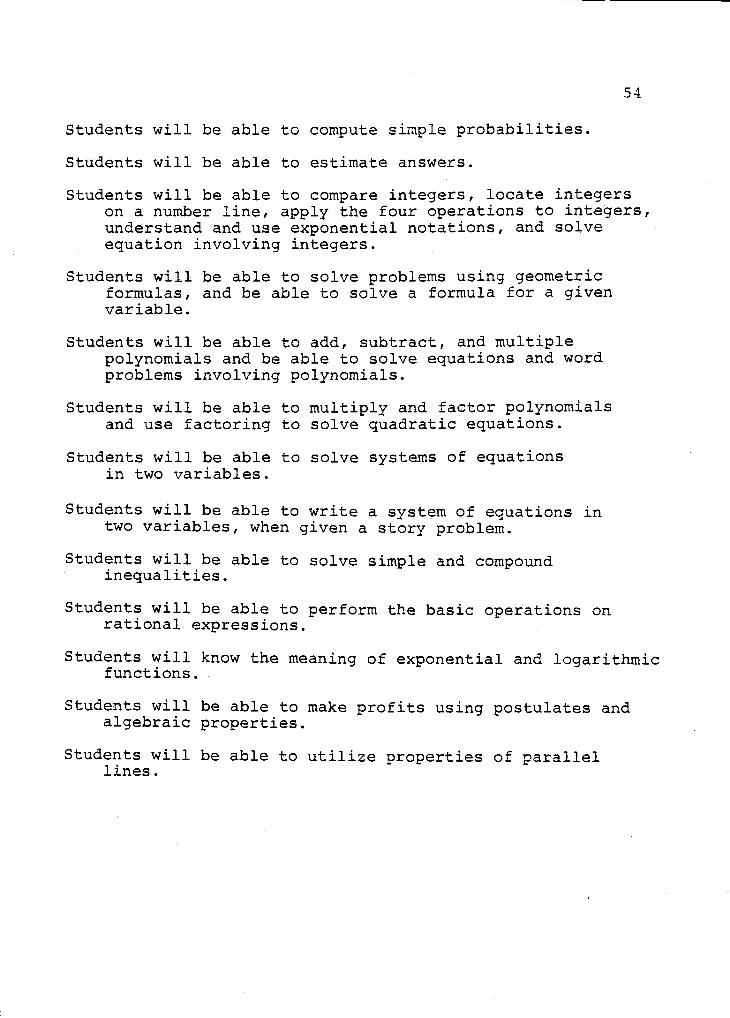
Students will be able to compute simple probabilities.
Students will be able to estimate answers.
Students will be able to compare integers, locate integerson a number line, apply the four operations to integers,understand and use exponential notations, and solveequation involving integers.
Students will be able to solve problems using geometricformulas, and be able to solve a formula for a givenvariable.
Students will be able to add, subtract, and multiplepolynomials and be able to solve equations and wordproblems involving polynomials.
Students will be able to multiply and factor polynomialsand use factoring to solve quadratic equations.
Students will be able to solve systems of equationsin two variables.
Students will be able to write a system of equations intwo variables, when given a story problem.
Students will be able to solve simple and compoundinequalities.
Students will be able to perform the basic operations onrational expressions.
Students will know the meaning of exponential and logarithmicfunctions.
Students will be able to make profits using postulates andalgebraic properties.
Students will be able to utilize properties of parallellines.

55
Students will be able to prove triangles congruent.
Students will be able to make profits using postulates andalgebraic properties.
Students will be able to relate trigonometric functionsand circular functions.
Students will be able to perform the basic straight edgeand compass constructions.
Students will be able to develop the cartesian coordinatesystem.
Students will be able to operate with relations andfunctions.
Students will be able to graph relations.
Students will be able to evaluate polynomials.
To compile the master list of competencies indigenous
to the total group (A, AA, and AAA) mean scores were used
to establish competencies at three levels classified as
accepted, recommended, and optional. Mean scores for the
accepted level were set by the researcher at 3.000 or
greater, 2.000 to 2.999 for the recommended level, and
1.999 or less as optional. (Table I)
56
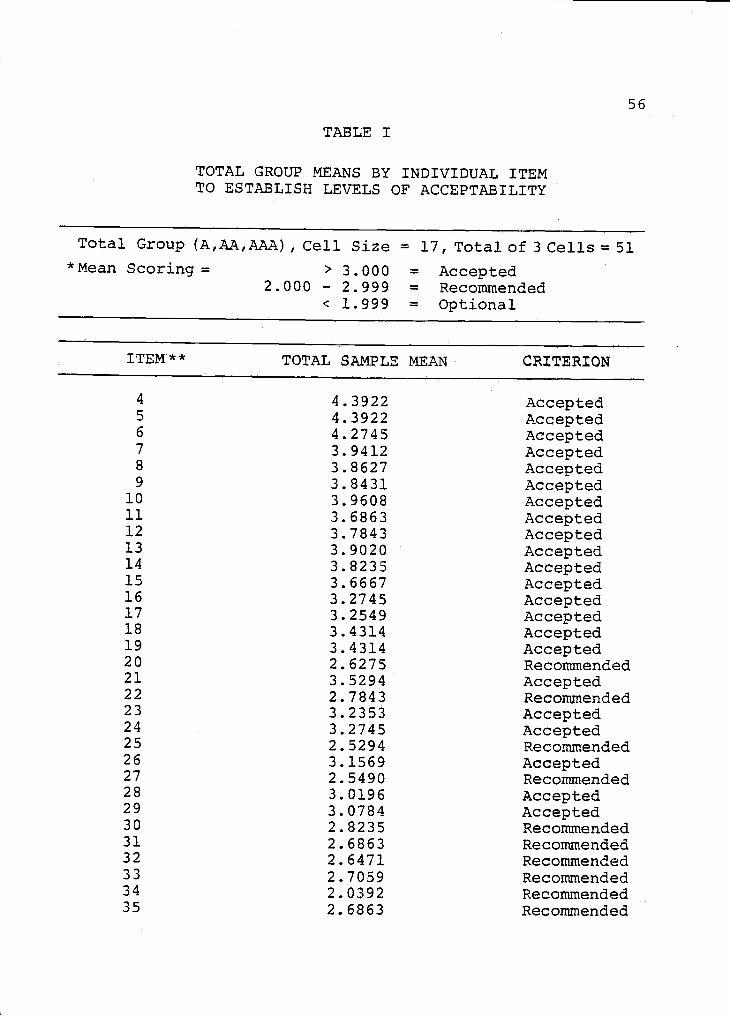
TABLE I
TOTAL GROUP MEANS BY INDIVIDUAL ITEMTO ESTABLISH LEVELS OF ACCEPTABILITY
Total Group (A,AA,AAA),Cell Size = 17, Total of 3 Cells = 51
*Mean Scoring= > 3.000 = Accepted2.000 - 2.999 = Recommended
< 1.999 = Optional
ITEM* * TOTAL SAMPLE MEAN CRITERION
4 4.3922 Accepted5 4.3922 Accepted6 4.2745 Accepted7 3.9412 Accepted8 3.8627 Accepted9 3.8431 Accepted
10 3.9608 Accepted11 3.6863 Accepted12 3.7843 Accepted13 3.9020 Accepted14 3.8235 Accepted15 3.6667 Accepted16 3.2745 Accepted17 3.2549 Accepted18 3.4314 Accepted19 3.4314 Accepted20 2.6275 Recommended21 3.5294 Accepted22 2.7843 Recommended23 3.2353 Accepted24 3.2745 Accepted25 2.5294 Recommended26 3.1569 Accepted27 2.5490 Recommended28 3.0196 Accepted29 3.0784 Accepted30 2.8235 Recommended31 2.6863 Recommended32 2.6471 Recommended33 2.7059 Recommended34 2.0392 Recommended35 2.6863 Recommended

TABLE I - COntinued 57
ITEM TOTAL SAMPLE MEAN CRITERION
36 2.7647 Recommended37 2.5098 Recommended38 2.9608 Recommended39 2.4706 Recommended40 2.5294 Recommended41 2.4118 Recommended42 2.2941 Recommended43 2.1176 Recommended44 2.2157 Recommended45 2.0196 Recommended46 2.5294 Recommended47 2.2549 Recommended48 1.9412 Optional49 2.0000 Recommended50 1.9020 Optional51 2.3725 Recommended52 2.4314 Recommended53 2.4902 Recommended54 2.4314 Recommended55 2.9216 Recommended56 2.7255 Recommended57 2.5636 Recommended58 1.8627 Optional59 2.2745 Recommended60 2.2941 Recommended61 2.3333 Recommended62 2.5098 Recommended63 2.5882 Recommended64 2.1961 Recommended65 2.2549 Recommended66 2.4706 Recommended67 1.6667 Optional68 1.9804 Optional69 2.3922 Recommended70 1.8235 Optional71 2.5294 Recommended72 2.6471 Recommended73 2.2353 Recommended74 1.8235 Optional
* *
Terms and level were arbitrarily established by theresearcher; the terms have no intrinic value; thehigher the mean the more indication there is ofgreater acceptance by those answering the question-naire.
See Math Competency Questionnaire, Appendix E, p. 93.

58
Table I represents the total competency list that
respondents were asked to evaluate. At this point,
there were no cuts reducing this list to correspond
with the finalized master list.
For the total group, 22 competency items were
identified as being acceptable. At the recommended
level, 42 competencies were identified. The optional
level competencies were shown to be 7. (Table II)
TABLE II
TOTAL MEAN ACCEPTABLE LEVELSAND RELATED PERCENTAGES
ACCEPTED RECOMMENDED OPTIONAL TOTAL ITEMS
22 42
30.986% 59.155%
7
9.859%
71
100.000%
The mean scores and criterion selection for
classification A are illustrated in Table III. This
table shows that 35 competency items were selected at
the accepted level, 31 at the recommended level, and 5
at the optional level.

59
TABLE III
OREGON'S FOUR-YEAR PUBLIC SENIOR HIGH SCHOOLSCLASSIFICATION A
MEAN SCORES BY INDIVIDUAL ITEM
Cell Size = 17
Mean Scoring = > 3.000 = Accepted
2.000 - 2.999 = Recommended
< 1.999 = Optional
ITEM SAMPLE MEAN CRITERION
4 4.3529 Accepted5 4.3529 Accepted6 4.3529 Accepted7 4.0000 Accepted8 3.8824 Accepted9 3.8824 Accepted
10 4.0588 Accepted11 3.5882 Accepted12 4.0000 Accepted13 4.1765 Accepted14 3.7059 Accepted15 3.8824 Accepted16 3.4118 Accepted17 3.1176 Accepted18 3.4118 Accepted19 3.4118 Accepted20 2.5882 Recommended21 3.5882 Accepted22 2.2353 Recommended23 3.0588 Accepted24 2.8235 Recommended25 2.3529 Recommended26 3.0588 Accepted27 2.4118 Recommended28 3.2941 Accepted29 3.1765 Accepted30 3.0588 Accepted31 3.0000 Accepted32 3.0000 Accepted33 3.0000 Accepted

60
TABLE III - Continued
ITEM SAMPLE MEAN CRITERION
34 2.1765 Recommended35 2.9412 Recommended36 3.1765 Accepted37 2.8235 Recommended38 3.5294 Accepted39 2.9412 Recommended40 2.8235 Recommended41 2.6471 Recommended42 2.4118 Recommended43 2.3529 Recommended44 2.4118 Recommended45 2.1765 Recommended46 2.8235 Recommended47 2.4118 Recommended48 1.8235 Optional49 1.9412 Optional50 2.0000 Recommended51 2.7647 Recommended52 3.0000 Accepted53 3.0000 Accepted54 2.8824 Recommended55 3.4118 Accepted56 3.0588 Accepted57 3.0000 Accepted58 2.0000 Recommended59 2.4118 Recommended60 2.5882 Recommended61 2.5294 Recommended62 2.8824 Recommended63 3.0588 Accepted64 2.5294 Recommended65 2.4118 Recommended66 2.7647 Recommended67 1.4118 Optional68 1.5294 Optional69 2.5882 Recommended70 1.7647 Optional71 3.1765 Accepted72 3.1176 Accepted73 2.6471 Recommended74 2.2941 Recommended

61
The mean scores and criterion selection for
classification AA are illustrated in Table IV which
shows that 20 competency items were selected at the
accepted level, 15 at the recommended level, and 36
at the optional level.
The mean scores and criterion selection for
classification AAA are illustrated in Table V which
shows that 28 competency items were selected at the
accepted level, 42 at the recommended level, and 1 at
the optional level.
Table VI is a composite of the responses of all
three classifications by level of acceptability.
For purposes of this study, possible scores on
the instrumentation results depicting F scores ranged
from .0062 to .0388, showing significant differences
in items 44, 45, 52, 53, 55, 56, 57, 59, 60, 63, 67,
68, 71, 72, and 73. Because HO1 was rejected, the
multiple comparison test (LSD) was applied resulting
in the significant differences depicted in Table VII.

62
TABLE IV
OREGON'S FOUR-YEAR PUBLIC SENIOR HIGH SCHOOLSCLASSIFICATION AA
MEAN SCORES BY INDIVIDUAL ITEM
Cell Size = 17
Mean Scoring = > 3.000 =
2.000 - 2.999 =
< 1.999 =
Accepted
Recommended
Optional
ITEM SAMPLE MEAN CRITERION
4 4.0000 Accepted5 4.0000 Accepted6 3.9412 Accepted7 3.5882 Accepted8 3.5882 Accepted9 3.7059 Accepted
10 3.7059 Accepted11 3.2941 Accepted12 3.6471 Accepted13 3.3529 Accepted14 3.7059 Accepted15 3.2353 Accepted16 3.1176 Accepted17 3.1176 Accepted18 3.4118 Accepted19 3.1765 Accepted20 2.4118 Recommended21 3.4706 Accepted22 3.0588 Accepted23 3.2353 Accepted24 3.5294 Accepted25 2.5294 Recommended26 2.941 2 Recommended27 2.5294 Recommended28 2.5882 Recommended29 2.8824 Recommended30 2.5882 Recommended31 2.1176 Recommended32 2.0000 Recommended33 2.2353 Recommended

63
TABLE IV - Continued
ITEM SAMPLE. MEAN CRITERION
34 1.7059 Optional35 2.2941 Recommended36 2.2353 Recommended37 1.8824 Optional38 2.2353 Recommended39 1.7647 Optional40 1.8235 Optional41 1.7059 Optional42 1.7059 Optional43 1.5882 Optional44 1.5294 Optional45 1.4118 Optional46 2.0000 Recommended47 1.8235 Optional48 1.6471 Optional49 1.6471 Optional50 1.4118 Optional51 1.7647 Optional52 1.7059 Optional53 1.6471 Optional54 1.7647 Optional55 1.8824 Optional56 1.8824 Optional57 1.8235 Optional58 1.4118 Optional59 1.6471 Optional60 1.5882 Optional61 1.7059 Optional62 2.0000 Recommended63 1.6471 Optional64 1.6471 Optional65 1.6471 Optional66 1.8235 Optional67 1.3529 Optional68 1.7647 Optional69 1.8235 Optional70 1.4118 Optional71 1.8235 Optional72 1.7647 Optional73 1.4706 Optional74 1.2941 Optional

64
TABLE V
OREGON'S FOUR-YEAR PUBLIC SENIOR HIGH SCHOOLSCLASSIFICATION AAA
MEAN SCORES BY INDIVIDUAL ITEM
Cell Size = 17
Mean Scoring = > 3.000 = Accepted
2.000 - 2.999 = Recommended
< 1.999 = Optional
ITEM SAMPLE MEAN CRITERION
4 4.8235 Accepted5 4.8235 Accepted6 4.5294 Accepted7 4.2353 Accepted8 4.1176 Accepted9 3.9412 Accepted
10 4.1176 Accepted11 4.1765 Accepted12 3.7059 Accepted13 4.1765 Accepted14 4.0588 Accepted15 3.8824 Accepted16 3.2941 Accepted17 3.5294 Accepted18 3.4706 Accepted19 3.7059 Accepted20 2.8824 Recommended21 3.5294 Accepted22 3.0588 Accepted23 3.4118 Accepted24 3.4706 Accepted25 2.7059 Recommended26 3.4706 Accepted27 2.7059 Recommended28 3.1765 Accepted29 3.1765 Accepted30 2.8235 Recommended31 2.9412 Recommended32 2.9412 Recommended33 2.8824 Recommended

65
TABLE V - Continued
ITEM SAMPLE MEAN CRITERION
34 2.2353 Recommended35 2.8235 Recommended36 2.8824 Recommended37 2.8235 Recommended38 3.1176 Accepted39 2.7059 Recommended40 2.9412 Recommended41 2,8824 Recommended42 2.7647 Recommended43 2.4118 Recommended44 2.7059 Recommended45 2.4706 Recommended46 2.7647 Recommended47 2.5294 Recommended48 2.3529 Recommended49 2.4118 Recommended50 2.2941 Recommended51 2.5882 Recommended52 2.5882 Recommended53 2.8235 Recommended54 2.6471 Recommended55 3.4706 Accepted56 3.2353 Accepted57 2.8824 Recommended58 2.1765 Recommended59 2.7647 Recommended60 2.7059 Recommended61 2.7647 Recommended62 2.6471 Recommended63 3.0588 Accepted64 2.4118 Recommended65 2.7059 Recommended66 2.8235 Recommended67 2.2353 Recommended68 2.6471 Recommended69 2.7647 Recommended70 2.2941 Recommended71 2.5882 Recommended72 3.0588 Accepted73 2.5882 Recommended74 1.8824 Optional

TABLE VI
INDIVIDUAL MEAN ACCEPTANCE LEVELSAND RELATED PERCENTAGES
CLASSIFICATION ACCEPTED RECOMMENDED OPTIONAL TOTAL ITEMS
35 31 5 71
49.296% 43.662% 7.042% 100.000%
AA 20 15 36 71
28.169% 21.127% 50.704% 100.000%
AAA 28 42 1 71
39.437% 59.155% 1.408% 100.000%

TABLE VII7
TABLE OF REJECTIONS BASED ON F PROBABILITYAND LSD RESULTS
ITEM AMEAN SCORE
AA AAACOMPUTED
FPROBABILITY
FHO DECISIONX = .05
L.S.D. RESULTSAAA>AA AAA>A
44 2.4118 1.5294 2.7059 3.481 .0388 Rejected Yes. No
45 2.1765 1.4118 2.4706 3.760 .0304 Rejected Yes No
52 3.0000 1.7059 2.5882 3.809 .0291 Rejected Yes No
53 3.0000 1.6471 2.8235 4.399 .0176 Rejected Yes No
55 3.4118 1.8824 3.4706 5.331 .0081 Rejected Yes No
56 3.0588 1.8824 3.2353 3.748 .0307 Rejected Yes No
57 3.0000 1.8235 2.8824 3.797 .0295 Rejected Yes No
59 2.4118 1.6471 2.7647 3.857 .0280 Rejected Yes No
60 2.5882 1.5882 2.7059 3.858 .0279 Rejected Yes No
63 3.0588 1.6471 3.0588 5.126 .0096 Rejected Yes No
67 1.4118 1.3529 2.2353 5.664 .0062 Rejected Yes Yes
68 1.5294 1.7647 2.6471 3.671 .0329 Rejected Yes Yes
71 3.1765 1.8235 2.5882 3.644 .0336 Rejected Yes No
72 3.1176 1.7647 3.0588 4.689 .0138 Rejected Yes No
73 2.6471 1.4706 2.5882 4.158 .0216 Rejected Yes No

68
SUMMARY
Based on the data using mean scores, with ranges of
3.000 or greater equaling a classification designation of
accepted, there were 22 items selected. In the mean range
of 2.000 to 2.999 designated as recommended, 42 items were
selected. Using a mean range of 1.999 or less, designated
as optional, 7 items were selected.
Individual school classification A accepted 35 items,
recommended 31 items, and listed as optional 5 items.
Classification AA accepted 20 items, recommended 15 items,
and listed as optional 36. Classification AAA accepted
28 items, recommended 42, and listed as optional 1 item.
The data further indicates that in the use of F
scores 15 of the 71 items were rejected at the .05 level
of confidence. Of these 15 items the significant dif-
ferences lay between AAA and AA with the exception of
items 67 and 68 where the significant differences lay
between AAA and AA as well as AAA and A.
69
CHAPTER V
SUMMARY, FINDINGS, CONCLUSIONS, AND RECOMMENDATIONS
INTRODUCTION
The final chapter in this study is designed to
present in sequence:
1. a summary of the research,
2. the conclusions of the study and a discussion
of the findings,
3. the recommendations for further action and,
4. the recommendations for further study.
SUMMARY
The major purpose of this study was to establish,
for Oregon's school districts, a listing common to all
districts which reflected Oregon's philosophy of minimal
mathematical competencies for graduation from Oregon's
four-year public senior high schools for completing
seniors. The inception of competency - based education
in the United States, and more specifically in the state
of Oregon, led to the conduction of this research.
Confusion on the part of individual school dis-
tricts coupled with broad general guidelines from the
Oregon Department of Education has placed competency-
based education in a position of uncertainty and

70
non-uniformity. The study was undertaken in an effort to
establish guidelines and parameters common to the general
populace of Oregon's four-year public senior high schools
as well as to establish similar guidelines as they relate
to schools classified as A, AA, and AAA in relationship
to enrollment size.
The instrument was sent to randomly selected schools
with a cover letter addressed to the building principal
with an explanation of the research and procedures.
Upon receipt of 51 responses (17 in each of three cells),
statistical procedures were applied to the data. In
analyzing the data, the one-way analysis of variance
procedure was employed in testing the hypothesis. The
hypothesis was to be accepted or rejected based on the
.05 level of significance.
FINDINGS
The following findings drawn from the study were
founded on the results of mean score applications and
the one-way analysis of variance (ANOVA) tabulations
calculated at the .05 confidence level.
1. The master list of competencies was constructed
from those competencies designated by mean
scores as accepted, recommended, and
optional. The mean scores were designated
as accepted, 3.000, recommended, 2.000 to

71
2.999, and optional, 1.999 or less. For the
master competency list there were 22 items
in the accepted category, 42 items in the
recommended category, and 7 items in the
optional category.
2. Listing of those items at the accepted
level by mean scores of 3.000, showed that
there were 35 items accepted by schools
classified as A.
3. Items designated as recommended at a mean
score level of 2.000 to 2.999, were found
to be 31 by those schools classified as A.
4. At the optional level of 1.999 or less,
schools classified as A noted 5 in this
category.
5. Listings of those items at the accepted
level by mean scores of 3.000, showed
that there were 20 items accepted by
schools classified as AA.
6. Items designated as recommended at a
mean score level of 2.000 to 2.999,
were found to be 15 by those schools
classified as AA.
7. At the optional level of 1.999 or less,
schools classified as AA noted 36 in
this category.

72
8. Listings of those items at the accepted level
by mean scores of 3.000, showed that there
were 28 items accepted by schools classified
as AAA.
9. Items designated as recommended at a mean
score level of 2.000 to 2.999, were found
to be 42 by those schools classified as AAA.
10. At the optional level of 1.999 or less,
schools classified as AAA noted 1 in this
category.
CONCLUSIONS
From the above findings it can be concluded that:
1. Schools classified as A and AAA are more closely
aligned in their interpretation of mathematical
competencies at all levels, accepted, recom-
mended, and optional, than schools classified
as AA.
2. Schools classified as A and AAA accepted the
competency list with fewer exceptions as being
necessary for mathematics instruction as com-
pared with schools classified as AA.
3. Schools classified as AA indicated a need
for fewer competencies than schools classified
as A and AAA.
73
4. There is a significant difference between AAA
and AA in 15 items. (Table VII)
5. There is a significant difference between AAA
and A in only 2 items. (Table VII)
In respect to these conclusions, it is conceivable
that AAA schools which characteristically have many and
varied programs view themselves in part as college and
university preparatory institutions. With this emphasis,
the respondents may have answered the questionnaire in
light of requriements for post-secondary success and
their own interests and values.
AA schools may have more than one mathematics track
but perhaps do not emphasize the college preparatory
aspect of the curriculum. Therefore, as a group, the
AA schools might, in light of the broad general guide-
lines listed by the state, decide to keep their number of
competencies at a minimum.
At the A level, schools may have fewer programs
because of staff and enrollment limitations and might
have only one mathematics program which may be geared
to the post-secondary preparatory need. It may also
be possible that in A schools they do not want
scholastic inadequacy to be equated with their size.

74
DISCUSSION
The data indicated that in practically every item,
A and AAA schools expected higher levels of competence
and a greater number of competencies than did AA schools.
The higher the level of sophistication of the competency
the less important it was to AA school personnel to the
point that they ranked over half of the competencies as
being optional. The data also indicated that as the
competency requirement became more difficult A and AAA
schools ranked them lower, that is, at the recommended
level.
On the basis of F statistic scores, 15 items were
rejected, leaving 56 intact. Using a combination of F
statistic scores and mean scores, 19 items were rejected,
leaving 52 intact.
Due to the fact that the ranking levels, accepted,
recommended, and optional, were selected on mean scores
of the total group, there is variation among the indivi-
dual classifications with respect to compiling a total
in each category. Because of this variation in making
final master list decisions, items listed as optional in
these categories are not reflected in the master list.
The reason for this was that a 66 2/3% "accepted level"
was set by the researcher as defining the category. For
example, if by individual classification, A schools
scored "recommended," AAA schools scored "recommended,"

75
and AA schools scored "optional," the item would be con-
sidered to be "recommended."
The questionnaire was divided into three levels of
competencies - A, B, and C; A being basic math skills
(Title I Math, Arithmetic, Applied Math), B being mid-
range math skills (Algebra I, Algebra II, Trigonometry),
and C being high level math skills (Geometry, Analysis,
Computer Programming I).
It was found that all competencies were retained at
the A level. At level B, four items were rejected, and
at level C, 15 were rejected. This further supports the
earlier statement that the greater the competency sophis-
tication the less important it was felt to be.
Results of this study will be shared with schools
which were selected to participate in this work. Com-
petencies listed by school size will be shared with
those schools, i.e., competencies selected by A schools
will be shared with A schools. (Appendix I, J, and K)
The Oregon Department of Education will receive a
copy of the master list to aid them in competency selec-
tion and recommendations.
The model procedure developed for this study has
provided useful information in compiling and evaluating
data. It would be applicable to use this procedure to
study and evaluate the other 5 areas of competence
designated by the state of Oregon.

RECOMMENDATIONS FOR ACTION
Recommendations are provided for those involved in
competency building and curriculum construction. The
recommendations listed herein are designed to aid in
solving the problems of mathematics competency design
for Oregon's four-year public senior high schools.
On the basis of this study, it is recommended
that:
1. The school districts of the state of Oregon
consider adopting the 23 competencies listed
as accepted by mathematics personnel.
2. The school districts of the state of Oregon
review the 29 competencies identified as
recommended by mathematics personnel and make
revisions and selection in light of their
educational philosophies and needs.
3. The school districts of the state of Oregon
discard those competencies that were rejected
in this study. (Appendix L)
4. The Oregon Department of Education provide
leadership for standardization of mathe-
matics competencies at the state level.
5. The Oregon Department of Education consider
the 23 mathematics competencies rated as
accepted as a foundation for state-wide
76

77
standardization of minimal mathematical
requirements for high school graduation.
6. Follow-up on each school's response after
these schools have re-eived the results
of the questionnaire to see if. there has
been any change in their mathematics com-
petency requirements in light of data
received through this research.
7. Indlude parent groups in the sample popula
tion for further research efforts.
8. Encourage the Oregon Department of Education
to survey the four-year public senior
high schools to reinforce this study
and help establish competency guidelines
for mathematics as well as the other
curricular areas.

78
BIBLIOGRAPHY
1. Anderson, Earl N. 1975. "Coping With Oregon's New
Competency-Based Graduation Requirements--View
From a Practitioner," presented at Annual Meeting
of the American Educational Research Association.
ERIC Document ED105594.
2. Chambers, Donald L. 1978. Report on the Conference
on Competency-Based Mathematics Education (Madison,
Wisconsin, January 13, 1978). Washington, D.C.:
Bureau of Elementary and Secondary Education
(DHEW/OE).
3. Cohen, Jacob. 1969. Statistical Power Analysis for
the Behavioral Sciences. Academic Press.
4. Duncan, Verne. 1978. "Standards," The Pipeline
(August).
5. Edu-gram. 1978 (June). Salem: Oregon Department
of Education.
6. Egge, Donald E. 1979. "State-Wide Learning
Requirements: The Oregon Story." ERIC ED180055.
7. "Elementary-Secondary Guide for Oregon Schools."
1975. Pre-Publication Draft. ERIC ED109753.

79
8. Elford, George. 1977. "A Review of Policy Issues
Related to Competency Testing for High School
Graduation," paper presented at the Annual Meet-
ing of the New England Education Research Organiza-
tion (9th, Manchester, New Hampshire, May 4-7,
1977) .
9. Educational Testing Service. 1977. "Basic Skills
Assessment Around the Nation." An ETS Informa-
tion Report.
10. Frahm, Robert, and Covington, Jimmie. 1979. "What's
Happening in Minimum Competency Testing?" ERIC
Document ED175908.
11. Good, Carter V. 1973. Dictionary of Education.
Third edition. McGraw-Hill Book Co.
12. Griffin, E. H. 1977. "Minimum Competency Exam
Program," paper presented at the Annual Meeting
of the Northern Illinois Association for Educa-
tional Research Evaluation and Development (1st,
Bloomingdale, Illinois, May 1977). ERIC
ED158256.
13. Hall, Mary. 1975. "Competency-Based Education in
Oregon: An Overview," paper presented at the
Annual Meeting of the American Educational
Research Association. ERIC Document ED104026.

80
14. Herron, Marshall D. 1978. "Establishing Proficiency
Standards for High School Graduation." ERIC
Document ED167615.
15. Hopke, William E. 1968. Dictionary of Personnel
and Guidance Terms. J. G. Ferguson Publishing
Co.
16. Huntington Beach Union High School District,
California. 1978. "Competency Based Curriculum:
Mathematics." ERIC Document ED157506.
17. Jefferson County Public Schools, Lakewood, Colorado.
"Systematic Teaching and Measuring mathematics,
'STAMM,' mini-sampler," ERIC Document ED144843.
18. Mahon, J. Patrick. 1980. "Competency-Based Educa-
tion--What Are the Legal Issues?" NASSP
Bulletin, February.
19. "Measuring Performance: Verifying Competencies
Through Observation and Judgment." 1977. ERIC
Document ED144990.
20. Miller, Lorin L. 1977. "The New State Graduation
Requirements: An overview and Discussion,"
OSSC Bulletin 20 (7).
21. Mills, Gladys H. 1980. State Minimum Competency
Testing Programs. Resource Catalog. Final
Report. Washington, D.C.: National Institute
of Education (DHEW).
81
22. "Minimal Competency Measurement Conference: Summary
Report." 1976. Sponsored by National Assessment
of Educational Progress and Clearinghouse for
Applied Performance Testing. ERIC Document
ED127376.
23. National Association of Secondary School Principals.
1975. Graduation Requirements. (Special Task
Force Report) Reston, VA: NASSP.
24. Nevada, Department of Education. 1979. Nevada Com-
petency-Based Adult High School Diploma Project:
Student Handbook. Carson City: Division of
Adult, Continuing and Community Education.
25. Olson, Thomas A. 1975a. "Coping With the Instruc-
tional Dimensions of competency-Based Graduation
Requirements," paper presented at the Annual
Meeting of the American Educational Research
Association.
26. . 1975b. "Graduation Requirements
as a Vehicle for Change," paper presented at the
Annual Meeting of the American Educational
Research Association. ERIC Document ED108394.
27. Oregon. Department of Education. 1977. Graduation
Requirement Guidelines, Revised. Salem.
28. . 1978. "Oregon Minimum Standards."
Salem.

82
29. . 1980. "Standards for Public
Schools with Compliance Indicators and Com-
mentary. Salem.
30. Parnell, Dale. 1974. "The Oregon Walkabout,"
Phi Beta Kappan 56(3):205-206.
31. "Performance Indicators for Competency Assessment.
Competencies Catalogue and Users Guide - A
Resource for School Districts Interested in
Defining and Testing for Minimal Competencies,"
Illinois State Office of Education, Springfield,
15 Dec. 1978, 381 p.
32. Snedecor and Cochran. Copyright 1967. The Iowa
State University Press. Ames, Iowa, 6th
Edition.
33. Tractenberg, Paul L. 1977. The Legal Implications
of Statewide pupil Performance Standards. Denver,
Colorado: Education Commission of the States,
Handicapped Children's Education Project;
Washington, D.C.: National Institute of Education
(DHEW).
34. U.S. Bureau of Elementary and Secondary Education
(DHEW/OE). 1974a. Oregon Graduation Requirements:
Guidelines for Record Keeping Procedures and
Sample Forms. Washington, D.C.

83
35. . 1974b. Oregon Graduation
Requirements: Guidelines for Planned Course
Statements. Washington D.C.
36. Williams, Roger. 1976. "Complete General Mathe-
matics Program for Use in Bilingual Math Classes,
Grades 9-12." ERIC Document ED153837.

APPENDICES

84
APPENDIX A
LETTER TO DON FINERAN
OREGON STATE DEPARTMENT OF EDUCATIONMATH SPECIALIST

85
November 20, 1980
Mr. Don Fineran, SpecialistMath EducationOregon Department of Education700 Pringle Parkway S.E.Salem, Oregon 97310
Dear Mr. Fineran:
As we discussed on the phone, I am listing thequestions pertinent to my study. Thank you in advancefor your replies and help.
mis
1) Has the Oregon Department of Education setminimal math competencies as minimal guide-lines for school districts?
2) Does the Department have math competenciesfrom every school district in the state?
3) Has the Department synthesized the com-petencies and, if so, what are the com-monalities?
4) Have these competencies been broken downand any comparison made among A-AA-AAAhigh schools?
5) Has the Department taken any steps towarddeveloping an instrument that measures orpredicts state competencies in math or hasanyone else? If so, what is the name ofthe instrument?
Sincerely,
W. H. MacFarlane423 Education HallOregon State UniversityCorvallis, Oregon
97331754-3648

86
APPENDIX B
RESPONSE FROM DON FINERAN
OREGON STATE DEPARTMENT OF EDUCATION
MATH SPECIALIST

87
November 25, 1980
W. H. MacFarlaneOregon State UniversitySchool of EducationCorvallis, OR 97331
Dear Bill:
Thank you for your November 20 letter and questions regarding math competencies.Your questions and my answers follow.
1. Has the Oregon Department of Education set minimal math competencies asminimal guidelines for school districts?
No. Consistent with educational philosophy in Oregon, local districtsand their community, determine the competence requirements. See Goals
581-22-211. The Standards require that districts do this.
2. Does the Department have math competencies from every school districtin the state?
No. Some have been collected as a result of work shared with districtpeople or standards evaluation districts, but whatever samples on handat any one time varies from time to time.
3. Has the Department synthesized the competencies and, if so, what are thecommonalities?
No. Competence requirements for each district undergo frequent revision.My observations of district competence requirements lead me to concludethere is a great deal of commonality in the general sense. Paper/pencil
computations covering the four operations with whole number, fractions,decimals and percent is very common. Attempts to include "applications"or "problems" are also fairly common, and generally deal with:
(a) distance, time, rate;(b) costs;
(c) measurement;(d) perimeter, area, volume;

W. H. MacFarlanePage 2November 26, 1980
4. Have these competencies been broken down and any.comparison made amongA-AA-AAA high schools?
No. My observations of commonalities given the third answer indicateno significant difference relating to school size.
5. Has the Department taken any steps toward developing an instrument thatmeasures or predicts state competencies in math or has anyone else? If
so, what is the name of the instrument?
No. Since the districts each have their own set of competencies, therecan be no statewide measure of competence.
Sincerely,
Don Fineran, SpecialistMath Education378-3778
DF/rsEnclosure
88

89
APPENDIX C
SAMPLING SCHOOLS BY CLASSIFICATION

90
SAMPLING SCHOOLS BY CLASSIFICATION
AAA
School Contact Person Phone
1. Sandy Union High Dennis Crow 668-8011
2. North. Salem High Tom Pickens 672-7781x230
3. Centennial Minnie Richards 665-1147
AA
1. Yamhill-Carlton Gene Carlson 662-3229
2. Rogue, River Chuck Moore 582-3297
3. St. Helens Zan Freeburn 397-1900
A
1. Scio High School Margaret Trachsel 394-3275
2. Colton Secondary W. Fred Proett 824-2311
3. Santiam High School Bid Sanders 897-2311
91
APPENDIX D
DELPHI COMMITTEE MEMBERS
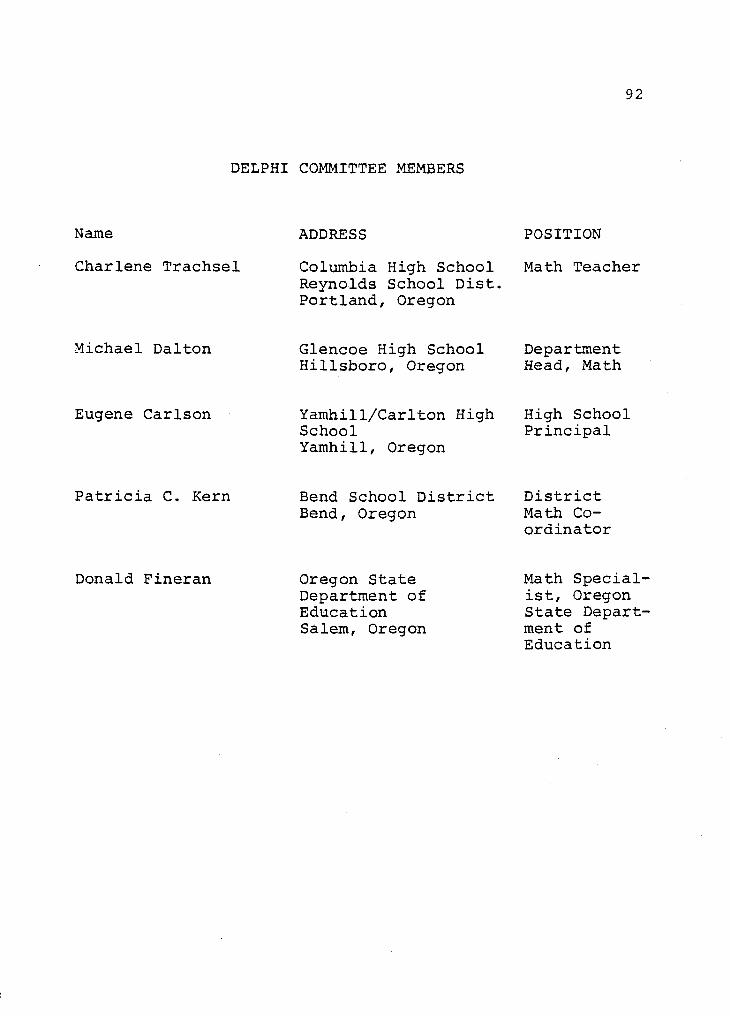
DELPHI COMMITTEE MEMBERS
Name
Charlene Trachsel
Michael Dalton
Eugene Carlson
Patricia C. Kern
Donald Fineran
ADDRESS
Columbia High SchoolReynolds School Dist.Portland, Oregon
Glencoe High SchoolHillsboro, Oregon
Yamhill/Carlton HighSchoolYamhill, Oregon
Bend School DistrictBend, Oregon
Oregon StateDepartment ofEducationSalem, Oregon
92
POSITION
Math Teacher
DepartmentHead, Math
High SchoolPrincipal
DistrictMath Co-ordinator
Math Special-ist, OregonState Depart-ment ofEducation
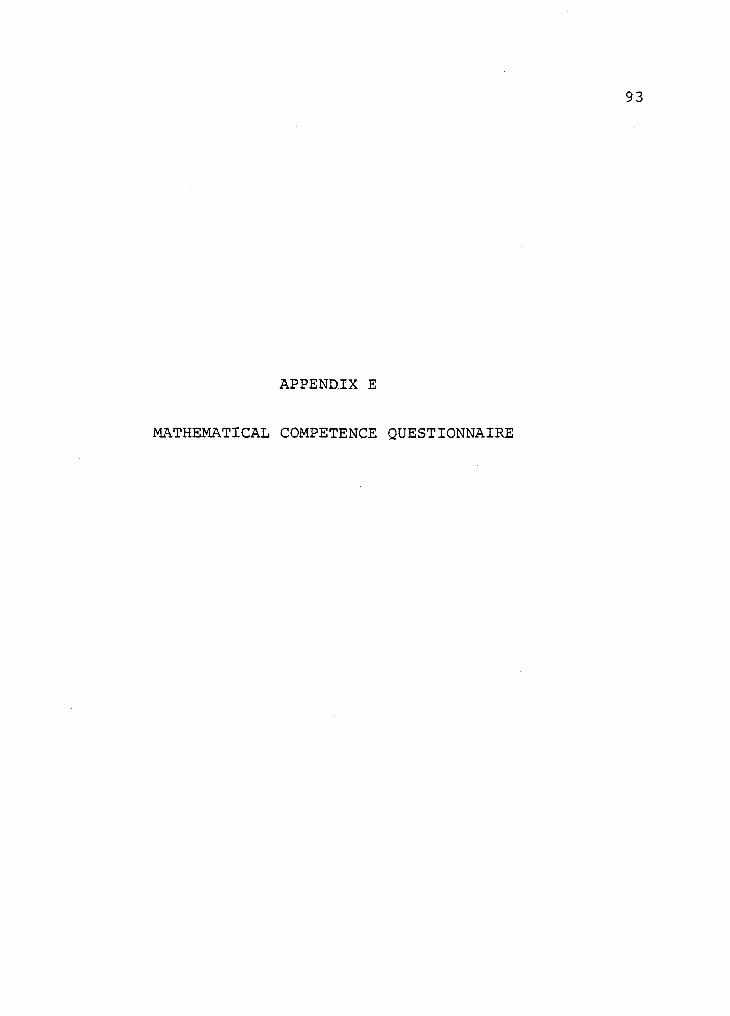
93
APPENDIX E
MATHEMATICAL COMPETENCE QUESTIONNAIRE

MATHEM AT ICAL COMPETENCE QUEST ION N I ARE
EMANATION OF PROJECT
The central problem of this study is to determine minimal mathematical competence requirements forgraduation among Oregon four-year publicsenior high schools, and to determine if likenesses anddifferences exist among those school groups designated by enrollment as A, AA, AAA.
The major purpose Of this study is to establish, for Oregon's school districts, a listing commonto all districts and reflecting Oregon's philosophy of minimal mathematical competence for gradua-tion from Oregon's high schools.
DEMOGRAPHIC INFORMATION
Instructions: Please respond by a check or answer to the following:
1. Size of School: A AA AAA
2. Your faculty title in your school: Teacher Department Head Principal
3. How many teachers in your school teach at least one mathematics class?
GENERAL INSTRUCTIONS
Do you have the following competencies in your school? If yes, mark yes, if no, mark no. In all
cases, please mark on the scale of one (1) to five (5) your best judgment of acceptability of each
item as a competency for graduation.
Levels of Acceptance:
1. Very low2. Low3. Medium4. High5. Very high
A. Competencies included in such courses as:TITLE I MATH, ARITHMETIC, APPLIED MATH, ETC.
ITEM YES NO LEVEL OF ACCEPTANCE
4. Student will be able to add and subtract wholenumbers and decimals.
1 2 3 4 5
5. Students will be able to multiple whole numbersand decimals. 1 2 3 4 5
6. Students will be able to divide whole numbersand decimals. 1 2 3 4 5
7. Students will be able to change common fractions. 1 2 3 4 5
8. Students will be able to add and subtractfractions. 1 2 3 4 5
9. Students will be able to multiply and dividefractions. 1 2 3 4
10. Students will be able to compute using percents. 1 2 3 4 5
11. Students will be able to choose the appropriateoperation in a given story problem. 1 2 3 4 5
12. Students will be able to balance checkbook. 1 2 3 4 5
13. Students will be able to change money. 1 2 3 4 5
14. Students will be able to solve story problemsrelating to real life situations. 1 2 3 4 5
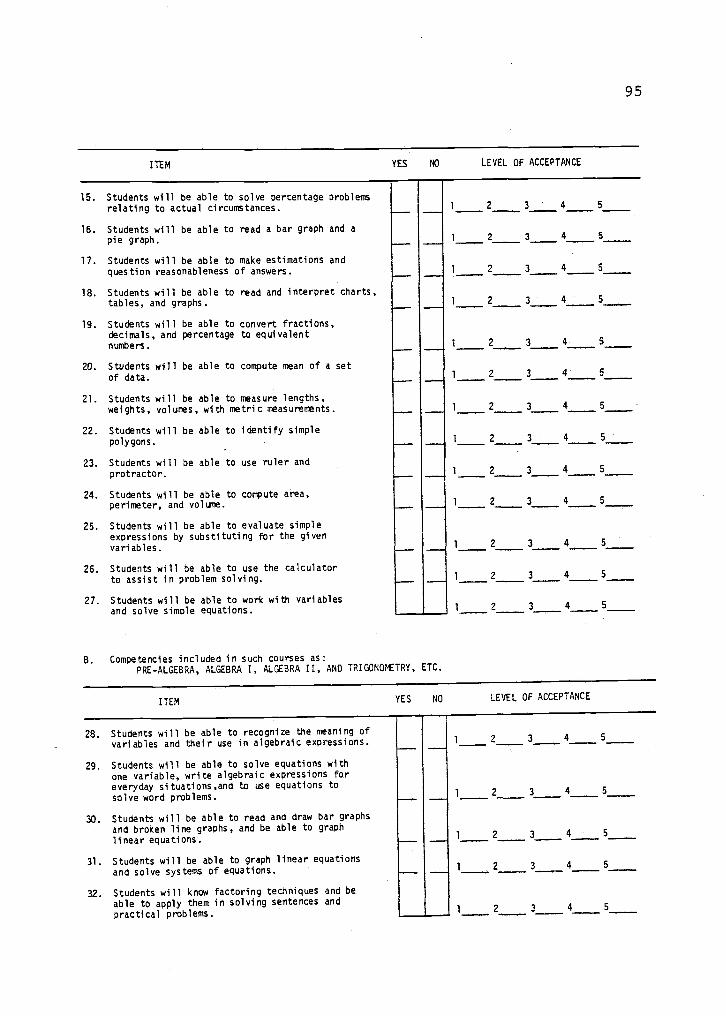
95
ITEM YES NO LEVEL OF ACCEPTANCE
15. Students will be able to solve percentage problemsrelating to actual circumstances.
16. Students will be able to read a bar graph and apie graph.
17. Students will be able to make estimations andquestion reasonableness of answers.
18. Students will be able to read and interpret charts,tables, and graphs.
19. Students will be able to convert fractions,decimals, and percentage to equivalentnumbers.
20. Students will be able to compute mean of a setof data.
21. Students will be able to measure lengths,weights, volumes, with metric measurements.
22. Students will be able to identify simplepolygons.
23. Students will be able to use ruler andprotractor.
24. Students will be able to compute area,perimeter, and volume.
25. Students will be able to evaluate simpleexpressions by substituting for the givenvariables.
26. Students will be able to use the calculatorto assist in problem solving.
27. Students will be able to work with variablesand solve simple equations.
8. Competencies included in such courses as:PRE-ALGEBRA, ALGEBRA I, ALGEBRA II, AND TRIGONOMETRY, ETC.
1 2 3 4 5
1 2 3 4 5
1 2 3 4 5
1 2 3 4 5
1 4 5
1 2 3 4
1 2 3 4 5
1 2 3 4 5
3 4
1 2 3 4
1 2 3 4 s
1 2 3 4 5
1 2 3 4 5
ITEM
28. Students will be able to recognize the meaning ofvariables and their use in algebraic expressions.
29. Students will be able to solve equations withone variable, write algebraic expressions foreveryday situations,and to use equations to
solve word problems.
30. Students will be able to read and draw bar graphsand broken line graphs, and be able to graph
linear equations.
31. Students will be able to graph linear equationsand solve systems of equations.
32. Students will know factoring techniques and beable to apply them in solving sentences andpractical problems.
YES NO LEVEL OF ACCEPTANCE
2 4 5
2 5
2 3 5
5
1 2 3 4
9fi
ITEM
33. Students will be able to compute area and perimeterof polygons and circles.
34. Students will be able to compute simple pro-babilities.
35. Students will be able to estimate answers.
36. Students will be able to compare integers, locateintegers on a number line, apply the four opera-tions to integers, understand and use exponentialnotations, and solve equation involving integers .
37. Students will be able to solve problems usinggeometric formulas, and be able to solve aformula for a given variable.
38. Students will be able to use addition, sub-traction, multiplication, and division ofreal numbers in solving equations.
39. Students will be able to add, subtract, andmultiple polynomials and be able to solveequations and word problems involving poly-nomials.
40. Students will be able to multiply and factorpolynomials and use factoring to solve
41. Students will be able to solve systems of equationsin two variables.
42. Students will be able to write a system of equat-ions in two variables, when given a story problem.
43. Students will be able to solve simple and compoundinequalities.
4 Students will be able to subtract, multiply,4. add,
divide and simplify radical expressions.
45. Students will know the order properties for thereal numbers and the axioms of the real numbersystem.
46. Students will be able to perform the basicoperations on rational expressions.
47. Students will know the meaning of exponential
and logarithniic functions.
48. Students will be able to apply summation nota-tion to arithmetic and geometric series.
49. Students will be able to find sums ofarithmetic and geometric series.
YES NO LEVEL OF ACCEPTANCE
1 2 3 4
1 2 3 4 5
1 2 2 4
1 2 3 4
1 2 3
3 4 5
1 2 3 4 5
quadratic equations. 1 2 3 4 5
2 3 4 5
1 2 3 4 5
2 3 4 5
1 2 3
3 4 5
2 3 4 5
2 3 4 5
1 2 3 4
1 2 3 4 5

C. Competencies included in such courses as:GEOMETRY, ANALYSIS, COMPUTER PROGRAMMING I, ETC.
97
ITEM
50. Students will be able to make profitslater and algebraic properties.
51. Students will beparallel lines.
52.
53.
54.
55.
Studentspoints.
will
Students willtriangles.
Students will
gruent.
be
be
be
using postu-
able to utilize properties of
able to identify basic sets of
able to utilize congruent
able to prove triangles con-
to know and applyStudents will be ablepythogorian theorem.
56. Students will be able to know relationshipsin a 45-45-90 and 30-60-90 triangle.
57. Students will be able to identify propertiesof similar triangles.
58. Students will be able to make profits using.postulates and algebraic properties.
59. Students will be able to relate propertiesof quadrilaterials.
60. Students will be able to investigate pro-perties of a circle.
61. Students will be able to relate trigonometricfunctions and circular functions.
Students will be able to perform the basic straightedge and compass constructions.
62.
63.
64.
65. Students will be ableand functions.
Students will be ableright triangle.
Students will be ablecoordinate system.
66. Students will be able
to apply properties of
to develop the cartesian
to operate with relations
to graph relations.
67. Students will be able to relate ordered triplesor real numbers and points in space.
68. Students will be able to identify conics anddetermine their characteristics from theirequations.
69. Students will be able to eealuate polynomials.
70. Students will be able to represent points andcurves using polar coordinates.
71. Students will be able to explore the careeropportunities open to a person with a com-puter programming background.
72. Students will be able to understand impactof computers on society.
73. Students will be able to investigate thecriteria and characteristics of "looping".
74. Students will be able to understanddocument programs.
YES NO LEVEL OF ACCEPTANCE
1 2
1 2 3 4 5
1 2 3 4
1 2 3 4
1 2 3 4
1 2 3 4 5
1 2 3 4 5
1 2 3 4 5
1 2 3 4 s
1 2 3 4 5
1 2 3 4 5
1 2 3 4
1 2 3 4 5
1 2 3 4 5
1 2 3 4 5
1 2 3 4 5
1 2 3 4 5
1 2 3 4 5
1 2 3 4 5
1 2 3 4 5
1 2
1 2 3 4 5
4 5
1 2 3 4
1 2 3 4 5
98
APPENDIX F
APPROVED SECONDARY SCHOOLS IN OREGON
FALL OF 1980
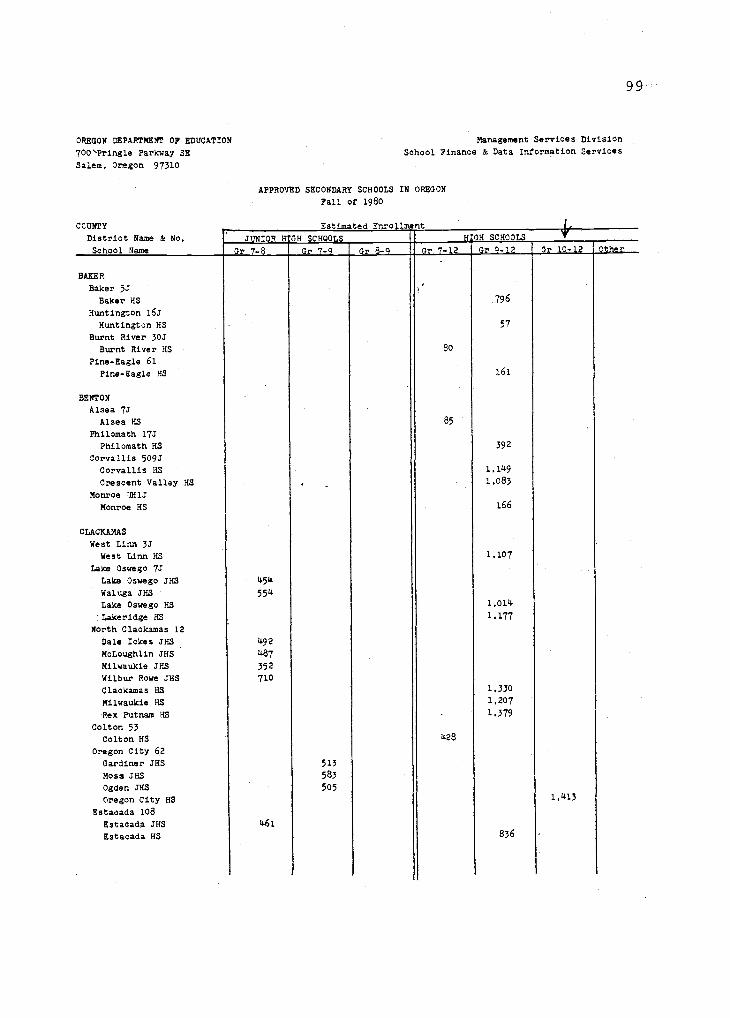
OREGON DEPARTMENT OP EDUCATION
700'Pringle Parkway SE
Salem, Oregon 97310
Management Services Division
School Finance & Data Information Services
APPROVED SECONDARY SCHOOLS IN OREGON
Pall of 1980
9 9
District Name & No. JUNIOR HIGH SCHOOLS H:GH SCHOOLS 1r
School Name Gr 7-8 Gr 7-9 Gr R -9 Or 7-12 Gr 9-12 Gr 10-12 Other
BAKER
Baker 5J
Baker HS ,796
Huntington 163
Huntington HS 57
Burnt River 30J
Burnt River HS 80
Pine-Eagle 61
Pine-Eagle HS 161
BENTON
Alsea 7J
Alsea HS 85
Philomath 17J
Philomath HS 392
Corvallis 509J
Corvallis HS 1.149
Crescent Valley HS . 1.083
Monroe UH1J
Monroe HS 166
CLACKAMAS
West Linn 3J
West Linn HS 1.107
Lake Oswego 7J
Lake Oswego JHS 454
Waluga JIM 554
Lake Oswego HS 1,014
Lakeridge HS 1,177
North Clackamas 12
Dale Ickes JHS 492
McLoughlin JHS 487
Milwaukie JHS 352
Wilbur Rowe JHS 710
Clackamas HS 1,330
Milwaukie HS 1,207
Rex Putnam HS 1.379
Colton 53
Colton HS 428
Oregon City 62
Gardiner JHS 513
Moss JHS 583
Ogden JHS 505
Oregon City HS 1,413
Estacada 108
Estacada .1118 461
Estacada HS 836

COUNTY
District Name & No.
School Name
Gladstone 115
Gladstone HS
Canby UH1
Canby HS
Sandy UH2
Sandy HS
Molalla mi4
Molalla Mid-HS
Molalla HS
CLATSOP
Astoria 1
Astoria HS
Jewell 8
Jewell HS
Seaside 10
Seaside HS
Warrenton 30
Warrenton HS
COLUMBIA
Scappoose 1J
Scappoose HS
Clatskanie 5J
Clatskanie HS
Knappa HS
Rainier 13
Rainier HS
Veronia 47J
Vernonia HS
St. Helens 502
St. Helens JHS
St. Helens HS
COOS
Coquille 8
Coquille HS
Coos Bay 9
Millicoma JHS
Sunset JHS
Marshfield HS
North Bend 13
North Bend JHS
North Bend HS
Powers 31
Powers HS
Myrtle Point 41
Myrtle Point HS
Bandon 54
Bandon HS
CROOK
Crook County Unit
.rook ES
100
Estimated Enrollment
Junior High Schools High Schools
Or. 7-8 Gr. 7-9 Or. 8-9 Gr. 7-12 Gr. 9-12 Gr. 10-12 Other
327
409
531
614
2
55
91
629
1,291
1,275
693
504
258
538
389
199
520
238
499
1,477
1,066
387
304
751
532
545 (9-1484 (11--

101
Estimated Enrollment
COUNTY Junior High Schools High Schools
District Name & No. . 7-8 Gr. Gr. 8-9 Gr. 7-12 Or. 9-12 Gr 10-12 other
School Name
643
_.7.7
834849
130
113
272
296
177
513
331
1,071
232
1,040
1,389
203
361
690
243
170
79
458
603
423
54
8o
1,575
CURRY
Port Orford-Langlois 2J
Pacific HS
Brookings-Harbor 17
Brookings-Harbor HS
Gold Beach UH1
Gold Beach HS
DESCHUTES
Bend 1
Bend HS
LaPine HS
Mountain View HS
Redmond 2J
Obsidian JHS
Redmond HS
DOUGLAS
Oakland 1
Oakland HS
Roseburg 4
John C. Fremont JHS
Joseph Lane JHS
Roseburg HS
Glide 12
Glide HS
Days Creek 15
Days Creek HS
South Umpqua 19
South Umpqua HS
Camas Valley 21J
Camas ValleY HS
North Douglas 22
North Douglas HS
Yoncalla 32
Yoncalla HS
Elkton 34
Elkton HS
Riddle 70
Riddle HS
Glendale 77
Glendale HS
Reedsport 105
Reedsport HS
Winston-Dillard 116
Douglas HS
Sutherlir. 130
Sutherlin HS
GILL/A14
Arlington 3
Arlington HS
Condon 25J
Condon HS
3

102
Estimated CnrollmentCOUNTY Junior High Schools High SchoolsDistrict Name & No. .Gr. 7-8 Gr. 7-,2 . 8-9 Gr. 7-12 Gr. 4-12 Gr. 10-12 OtherSchool Name
293339
127
83
41
301
23
39
93
445
GRANT
John Day 3
Grant HS
Prairie City 4
Prairie City HS
Mt. Vernon 6
Mt. Vernon HS
Monument 8
Monument HS
Dayville 16J
Dayville HS
Long Creek 17
Long Creek HS
HARNEY
Crane UH1J
Crane HS
Burns UH2
Burns HS
HOOD RIVER
Hood River 1
Hood River JHS
Ity'East JHS
Cascade Locks HS
Hood River Valley HS 614
JACKSON
Phoenix 4
Talent JHS 299Phoenix HS 692
Ashland 5
Ashland JHS 667Ashland HS
715Central Point 6
Hanby JHS 205Scenic JHS 825Crater HS 1,045
Eagle Point 9
Eagle Point JHS 428Eagle Point HS
957Rogue River 35
Rogue River HS 444Prospect 59
Prospect HE 76Butte Palls 91
Butte Palls HS 86Medford 544
Hedrick JHS 783McLoughlin JO 698Medford Mid-HS 1,524 (9-1Medford HS
1,544 (11-

COUNTY
" District Name & No,
School Name
Estimated Enrollment
103
Junior High Schools High SchoolsZr. 7-8 Gr. 7-9 Cr. 8-9 Gr. 7-12 Gr. 9-12 Gr. 10-12 .- Uther
JEFFERSON
Culver 4
Culver HS
Madras 509J
Madras JHS
Madras HS
JOSEPHINE
Grants Pass 7
Grants Pass HS
Josephine County Unit
Hidden Valley HS
Illinois Valley HS
North Valley HS
KLAMATH
Klamath County Unit
Brixner JHS
Henley MIS
Bonanza HS
Chiloquin HS
Gilchrist HS
Henley RS
Lost River HS
Klamath UH2
Klamath HS
Mazama HS
LAKE
Lakeview 7
Lakeview JRS
Lakeview HS
Paisley 11
Paisley HS
LANE
Pleasant Hill 1
Pleasant Hill JHS
Pleasant Hill HS
Eugene 4J
Cal Young JIM
Colin Kelly JHS
James Madison JHS
James Monroe JHS
John F. Kennedy ZITS
Roosevelt JHS
Spencer Butte JHS
Thomas Jefferson JHS
Churchill HS
North Eugene HS
Opportunity Center
Sheldon HS
South Eugene HS
391
517
389
149
256
428
452
653
427
628
693
425
555
5
169
328
124
634
1,310
950
459832
195
143
717
167
1,081
1,077
384
458
1,146
1,041
826
1,176
38 (7-10

104
Estimated Enrollment
COUNTY Junior High Schools High Schools
District Name & No. Zr. 7-8 Gr. 7-9 ,Gr. 8 -9 Gr. 7-12 Gr. 9-12 Gr. 10-12 'other
School Name
Springfield 19
Springfield HS 1,564Thurston HS 1,405
Fern Ridge 28J
Fern Ridge JHS 473Elmira HS 420
Mapleton 32
Mapleton HS 190
Creswell 40
Creswell HS 330
South Lane 45J
Lincoln JHS 814
Cottage Grove HS 740
Bethel 52
'Willamette HS 1,041
Crow-Applegate-Lorane 66
Crow HS 147
McKenzie 68
McKenzie River HS 217
Junction City 69
Junction City HS 621
Lowell 71
Lowell HS 137
Oakridge 76
Oakridge HS 357 (8-12Marcola 79
Mohawk HS 123
Blachly 90
Triangle Lake HS 92
Siuslaw 97J
Siuslaw HS 456
LINCOLN
Lincoln County Unit
Lincoln JIM 356
Eddyville HS 108
Newport HS 348
Siletz HS 197
Taft HS 436
Toledo HS 305
Waldport HS 272
LINN
Greater Albany 8J
Caiapooya JHS 714
Memorial JHS 654
North Albany JHS 512
South Albany HS 886
West Albany HS 913
Sweet Home 55
Sweet Home JHS 410
Sweet Home HS 817
Scio 95
Selo HS 244
6

COMM., District Name & No.
School Name
Estimated Enrollment
105
Junior High Schools High Schools
4r. 7-8 Gr. 7-9 Cr. 8-9 Gr. 7-12 Gr. 9-12 Gr. 10 -12 Other
Mill City-Gates 129J
Santiam HS
Central Linn 552
Central Linn HS
Lebanon UH1
Lebanon HS
Harrisburg UH5J
Harrisburg HS
MALHEUR
Ontario 8
Ontario JHS
Ontario HS
Nyssa 26
Nyssa JHS
Nyssa HS
Adrian 61
Adrian HIS
Harper 66
Harper HS
Jordan Valley UH1
Jordan Valley HS
Vale UH3
Vale HS
MARION
Jefferson 14J
Jefferson HS
North Marion 15
North Marion HS
Salem 24J
McKay HS
MeNary HS
North Salem HS
South Salem HS
Sprague HS
St Paul 45
St. Paul HS
Mt. Angel 91
John F. Kennedy HS
Woodburn 103
Woodburn JHS
Woodburn HS
Detroit 123J
Detroit HS
Gervais UH1
Gervais HS
Stayton UH4J
Stayton HS
Cascade UH5
Cascade JHS
Cascade HS
Silverton UH73
Silverton HS
186
336
602
558
7
613
188
277
1,525
204
392
116
35
61
350
334
1,418
1,445
1,158
1,760
1,595
91
222
632
305
559
873
653
520

COUNTY
District Name & No.
School Name
106
Estimated Enrollment
Junior High Schools
4r. 7-8 Gr. 7-9 Or. 8-9 Gr. 7-12
High Schools
Gr. 9-12 1 Gr. 10-12 'Other
MORROW
Morrow 1
Ihritedrieigift
Heppner HS
Ione HS
Riverside HS
MULTNOMAH
Portland 1
Adams HS
Benson Polytechnic HS
Cleveland HS
Franklin HS
Grant HS
Jackson HS
Jefferson HS
Lincoln HS
Madison HS
Marshall HS
Metro Learning Ctr. (Couch
Roosevelt HS
Vocational Village HS
Washington - Monroe HS
Wilson HS
Parkrose 3
Fremont JHS
Parkrose Heights JHS
Parkrose HS
Reynolds 7
Hauton B. Lee Middle
Rockwood Middle
Columbia HS
Reynolds HS
Centennial 28J
Centennial HS
Corbett 39
Corbett HS
David Douglas 40
Aim HS
David Douglas HS
Gresham UH2J
Gresham HS
Sam Barlow HS
POLK
Dallas 2
Academy JHS
LeCreole JHS
Dallas HS
Central 13J
Talmadge JHS
Central HS
*Secondary enrollment only**7th Grade only
599
389
211"
482
418
544
8
439
84
201
263
665
1,560
1,250
1,497
1,647
805
981
1,098
1,469
1,163
1,198
883
1,444
881
986
1,556
233
56
2,006
1,462
1,554
1,046
576
504
*109 (K-
184 (Un

CDUNTY
District Name & No.
School Name
POLK (coat)
Perrydale 21
Perrydale HS
Falls City 57
Falls City HS
Valsetz 62
Valsetz HS
SHERMAN
Sherman UH1
Sherman HS
TILLAMOOK
Tillamook 9
Tillamook JHS
Tillamook HS
Neah-Kah-Nie 56
Neah-Kah-Nie HS
Nestucca UH3
Nestucca HS
UMATILLA
Helix 1
Griswold HS
Pilot Rock 2
Pilot Rock HS
Echo 5
Echo HS
Umatilla 6
Umatilla HS
Hermiston 8
Armand Larive JHSHermiston HS
Umapine 13
Umapine HS
Pendleton 16
Helen McCune JHS
John Murray JHS
Pendleton HS
Athena 29
Athena-Weston JHS
Weston,..MbEwen RS
Stanfield 61
Stanfield HS
Ukiah 80Ukiah HS
McLoughlin UH3
McLoughlin HS
107
Estimated Enrollment
Junior High Schools High Schools
Cr.7-8
315
545
402
Gr. _7:9
152
Gr. 8-9 Gr. 7-12 Gr. 9-12 Or: 10-12 'Other
9
385
3.9
426
251
34.
35
60
137
684
206
39
61
207
895
143
30
459
791
141

108
Estimated Enrollment
COUNTY Junior High Schools HiEh Schools
District Name & No. Zr. 7-8 Gr. 7-9 Gr. 8-9 Gr. 7-12 Gr. 9 -12 Gr. 10-12 Other
School Name
UNION
LaGrande 1
LaGrande HS 862
Union 5
Union HS 264
North Powder 8J
Powder Valley HS 74
Imbler 11
Imbler HS 168
Cove 15
Cove HS 146
Elgin 23
Elgin HS 208
WALLOWA
Joseph 6
Joseph HS 126
Wallowa 12
Wallowa HS 203
Enterprise 21
Enterprise HS 217
WASCO
Chenowith 9
Wahtonka HS 278
The Dalles 12
The Dalles JHS 592The Dalles HS 626
Dufur 29
Dufur HS 75Wasco County UH1
Wasco-County HS 142
WASHINGTON
Banks 13
Banks JHS 183
Banks HS 413
Forest Grove 15
Neil Armstrong JHS 871Forest Grove HS 837
Tigard 23
Fowler JHS 63oTwality JHS 811Tigard HS 1,289
Beaverton 48J
Cedar Park Intern. 912
Five Oaks Intern. 763
Highland Park Intern. 897
Meadow Park Intern. 791
Mountain View Intern. 916
Whitford Intern. 904
Aloha HS 1,587
Beaverton HS 1,816
Sunset HS 1,720
10
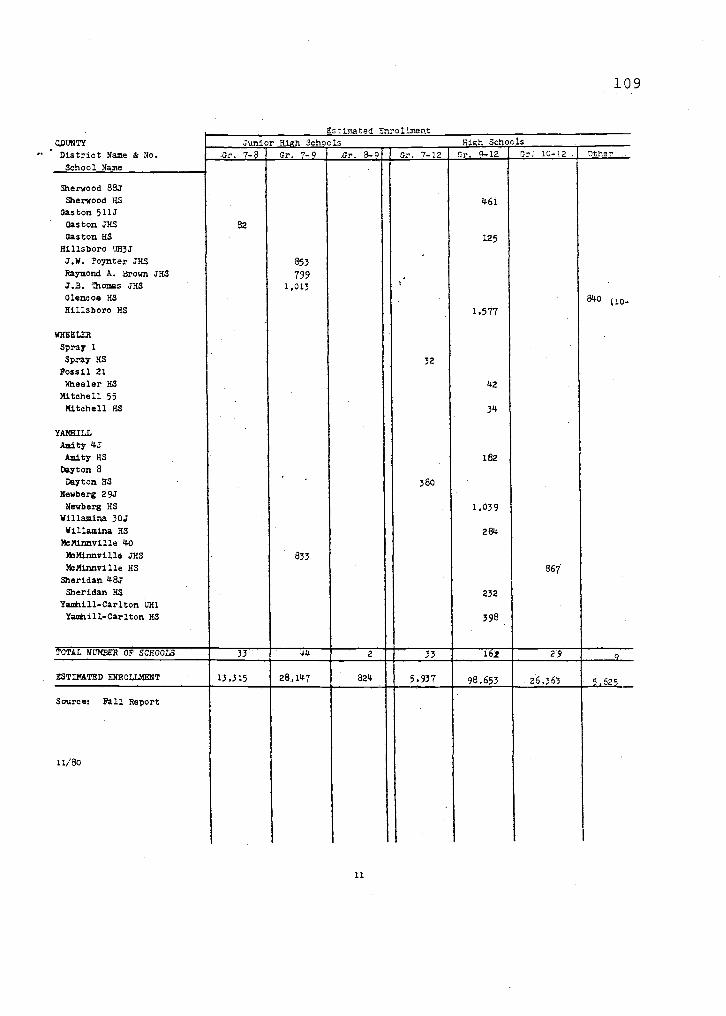
=UMWDistrict Name & No.
School Name
109
Estimated Enrollment
Junior High Schools High Schools
Zr. 7-8
Sherwood 88J
Sherwood HS
Gaston 511J
Gaston JHS
Gaston HS
Hillsboro UH3J
J.W. Poynter JHS
Raymond A. Brown JHS
J.B. Thomas JHS
Glencoe HS
Hillsboro HS
WHEELER
Spray 1
Spray HS
Fossil 21
Wheeler HS
Mitchell 55
Mitchell HS
YAMMILL
Amity 4.1
Amity HS
Dayton 8
Dayton HS
Newberg 29J
Newberg HS
Willamina 30J
Willamina HS
McMinnville 40
McMinnville JHS
McMinnville HS
Sheridan 48J
Sheridan HS
Yamhill-Carlton UH1
Yamhill-Carlton HS
82
Gr. 7-9
853
7991,013
833
Gr. 8- 9 Gr. 7-12 Gr. 9-12 Cr. 10-12 Other
32
380
461
125
1.577
42
34
182
1,039
284
232
398
867
840 (10,
OTAL NUMBER OF SCHOOLS 33 44 33 162 9
ESTIMATED ENROLLMENT 13,315 28,147 824 5,937 98,653 26,363 5,625
Source: Fall Report
11/80
11

110
APPENDIX G
OREGON SCHOOL ACTIVITIES ASSOCIATION
(Revised)

OREGON SCHOOL ACTIVITIES ASSOCIATION(Revised)
CLASS AAA SCHOOLS -- 86
1980-81 Numerical Listing of SchoolsADM (Grades 10-12)
according to June 30, 1980
1. Medford 2,281 44. Marshall 8452. Beaverton 1,775 45. Lakeridge 8383. Aloha 1,576 46. Glencoe (Hillsboro)** 8374. Hillsboro ** 1,570 47. Crescent Valley 8365. Sunset 1,641 48. Forest Grove 8346. David Douglas 1,448 49. South Albany 8267. Roseburg 1,448 50. Lake Oswego 8178. Oregon City 1,311 51. Klamath Union 8119. South Salem 1,290 52. Roosevelt 79910. Tigard 1,243 53. McMinnville,z 79011. South Eugene 1,200 54. North Bend 78712. Grant 1,171 55. North Salem 77913. Madison 1,168 56. Pendleton 77714. Benson 1,142 57. Jesuit* 77415. Wilson 1,137 58. Bend 77016. Churchill 1,124 59. Mazama 75617. Centennial 1,123 60. Reynolds 75118. Barlow 1,098 61. Cottage Grove 74919. Marshfield 1,094 62. Willamette 74520. Lebanon 1,092 63. Lincoln 74121. Sprague 1,086 64. Mountain View 74022. Crater 1,059 65. Molalia 72023. Franklin 1,049 66. Newberg 71724. Putnam 1,036 67. Ashland 70725. Springfield 1,033 68. Washington/Monroe 69126. North Eugene- 1,027 69. Hood River Valley 67727. Parkrose 1,021 70. Hermiston 67028. Thurston 1,005 71. Silverton 66429. Gresham 1,000 72. Eagle Point 66330. McNary 991 73. Jefferson 65931. Clackamas 991 74. Hidden Valley -- 62132. West Albany__ 987 75. La Grande 61133. Redmond 956 76. Jackson 60434. Grants Pass 955 77. The Dallas 59635. Sandy 953 78. Ontario 59136. St. Mary's Academy * 920 79. Dallas 58937. McKay 896 80. Crook County 57338. Milwaukie 890 81. Estacada 56739. Cleveland 884 82. Baker 56440. Sheldon 883 83. Sweet Home 55441. Corvallis 881 84. Columbia 54742. Canby 880 85. Adams 488,43. West Linn 855 86. Central Catholic 333
* All boy or all girl school -- enrollment doubled.** Actual enrollment first week of school.
TOTAL NUMBER OF MEMBER SCHOOLS: STUDENT POPULATION:
Public Private = Total
Class AAA 83 '3 36 Class AAA 79,934Class AA 54 5 59 Class AA 20,622Class A 93 19 112 Class A 10,278
230 27 257 110,834

112
CLASS AA SCHOOLS -- 59
1980-81 Numerical Listing of Schools according to June 30, 1980ADM (Grades 10-12).
1. St. Mary of Valley* (Beaverton) 560 31. Illinois Valley 3312. North Valley 537 32. Siuslaw 3303. St. Helens 531 33. Reedsport 3224. Cascade 528 34. Sutherlin 3195. Astoria 525 35. Nyssa 3046. Central 521 36. Glide 3027. Henley 518 37. Myrtle Point 3008. Phoenix 505 38. Lakeview 2999. Tillamook 501 39. Taft 296
10. South Umpqua 495 40. Salem Academy 28211. Madras 485 41. Yamhill-Carlton 28112. LaSalle 485 42. Vale 27713. Gladstone 432 43. Banks 27214. Scappoose 432 44. Clatskanie 26915. Stayton 428 45. Philomath 26816. Woodburn 421 46. North Marion 26617. Marist 416 47. Gold Beach 24718. Junction City 413 48. Creswell 24219. Elmira 409 49. Bandon 23820. Douglas 383 50. Jefferson 23521. Brookings-Harbor 380 51. Gervais 23422. Coquille 360 52. Neah-Kah-Nie 22823. Rainier 360 53. Central Linn 22624. Sherwood 359 54. Grant Union 21825. Newport 357 55. Oakridge 21726. McLoughlin 354 56. Toledo 19927. Seaside 351 57. Dayton 19828. Burns 346 58. Willamina 19329. Pleasant Hill 338 59. Nestucca 16730. Rogue River 332
* All boy or all girl school enrollment doubled.

CLASS A SCHOOLS -- 112
1980-81 Numerical Listing of SchoolsADM (Grades 10-12)
1, Wahtonka 199
2. Riverside 195
3, Walport 192
4, Scio 189
5, Colton 186
6. Warrenton 181
7, Sheridan 173
8, Vernonia 171
9, Corbett 170
10. Kennedy 168
11. Enterprise 166
12. Knappa 166
13, Chemawa 165
14. Chiloquin. 162
15. Heppner 159
16. Harrisburg 156
17. Regis 156
18, North Douglas 155
19. Oakland 153
20. Portland Christian 152
21, Sacred Heart Academy (Salem) 149
22. Weston-McEwen 149
23. Elgin 149
24. Pine Eagle 145
25, Catlin Gabel 144
26. Glendale 138
27. Lost River 136
28. Bonanza 133
29, Pacific 132
30. St. Mary's (Medford) 132
31, Lutheran 130
32. Riddle 130
33. Santiam 128
34. Amity 127
35. Umatilla 127
35, Union 126
37. LaPine 120
38, Crow 118
39. Monroe 118
40. Pilot Rock 116
41. Yoncalla 116
42. Wasco 111
43. Gilchrist 111
44. Sherman 105
45. Stanfield 100
46. Joseph 99
47. Siletz 99
48. McKenzie 97
49. MacLaren 97
50. Lowell 95
51. Wallowa 93
52. Gaston 91
53. Oregon Episcopal 89
54. Canyonville Bible Academy 89
55. Imbler 88
56. Culver 87
113
according to June 30, 1980
57. Mohawk 87
58. Santiam Christian (Corvallis) 8559. Adrian 82
60. St. Paul 79
61. Western Mennoite 76
62. Mapleton 74
63. Columbia Christian 69
64. Condon 69
65. Powder Valley 69
66. North Clackamas Christian 68
67. Elkton 68
68. Sacred Heart Acad. (K. Falls) 6669. Crane 64
70. Prairie City 61
71. Cove 61
72. Paisley 61
73. Dufur 59
74. Butte Falls 57
75. Camas Valley 55
76. Ione 55
77. Grace Christian (Medford) 55
78. Days Creek 54
79. Alsea 53
80. Oregon State Deaf School 52
81. Jordan Valley 49
82. Eddyville 49
83. Prospect 48
84. Echo 47
85. Arlington 46
86. Huntington 46
87. Powers 46
88. The Delphian (Sheridan) 46
89. Cascade Locks 45
90. Burnt River 40
91. Wheeler 39
92. Triangle Lake 39
93. Santa Clara Christian (Eugene)373736363529282727272625242321202019
94. Mt. Vernon95. Falls City96. Detroit97. Nazarene (Roseburg)98. Mitchell99. Long Creek100. Harper101. Dayville102. Perrydale103. Jewell104. Griswold105. Faith Bible (Aloha)106. Monument107. Ukiah108. Spray109. Umapine110. Yaauina Christian111. Valsetz 18
112. Christ's Center (Junctiy City)16

114
APPENDIX H
LETTER TO BUILDING ADMINISTRATORSASKING COOPERATION IN STUDY
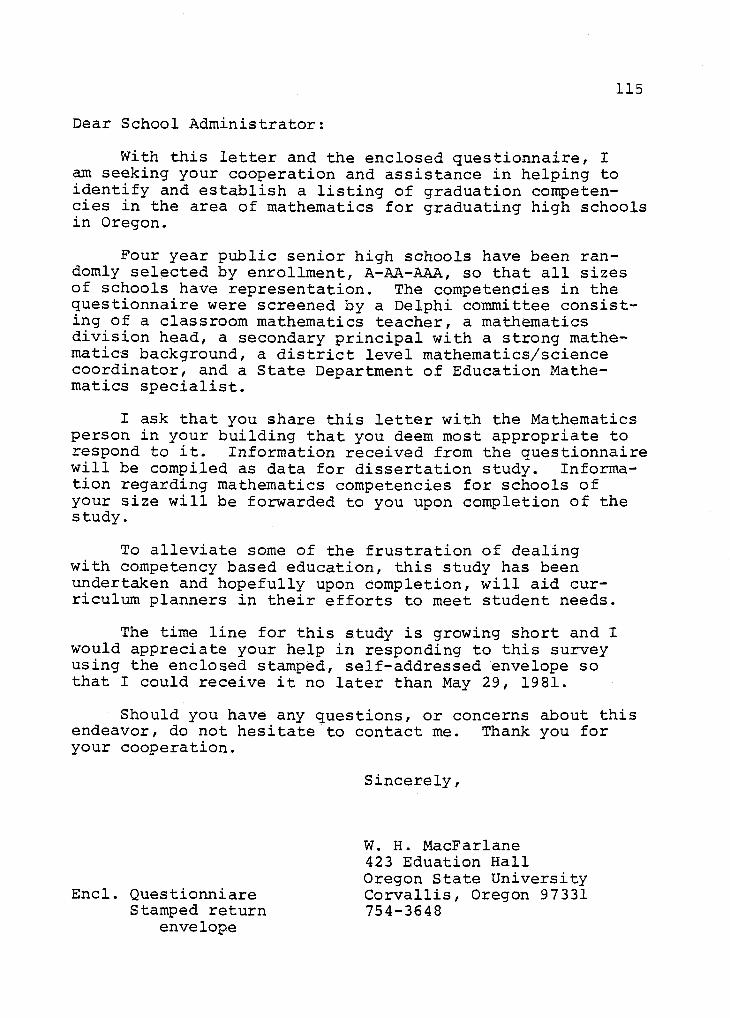
115
Dear School Administrator:
With this letter and the enclosed questionnaire, Iam seeking your cooperation and assistance in helping toidentify and establish a listing of graduation competen-cies in the area of mathematics for graduating high schoolsin Oregon.
Four year public senior high schools have been ran-domly selected by enrollment, A-AA-AAA, so that all sizesof schools have representation. The competencies in thequestionnaire were screened by a Delphi committee consist-ing of a classroom mathematics teacher, a mathematicsdivision head, a secondary principal with a strong mathe-matics background, a district level mathematics/sciencecoordinator, and a State Department of Education Mathe-matics specialist.
I ask that you share this letter with the Mathematicsperson in your building that you deem most appropriate torespond to it. Information received from the questionnairewill be compiled as data for dissertation study. Informa-tion regarding mathematics competencies for schools ofyour size will be forwarded to you upon completion of thestudy.
To alleviate some of the frustration of dealingwith competency based education, this study has beenundertaken and hopefully upon completion, will aid cur-riculum planners in their efforts to meet student needs.
The time line for this study is growing short and Iwould appreciate your help in responding to this surveyusing the enclosed stamped, self-addressed envelope sothat I could receive it no later than May 29, 1981.
Should you have any questions, or concerns about thisendeavor, do not hesitate to contact me. Thank you foryour cooperation.
Encl. QuestionniareStamped return
envelope
Sincerely,
W. H. MacFarlane423 Eduation HallOregon State UniversityCorvallis, Oregon 97331754-3648
116
APPENDIX .1
LIST OF MATHEMATICAL COMPETENCIESAS IDENTIFIED BY A SCHOOLS

117
LIST OF MATHEMATICAL COMPETENCIESAS IDENTIFIED BY A SCHOOLS
ITEMS CLASSIFIED AS ACCEPTED:
Student will be able to add and subtract whole numbers anddecimals.
Students will be able to multiple whole numbers anddecimals.
Students will be able to divide whole numbers and decimals.
Students will be able to change common fractions.
Students will be able to add and subtract fractions.
Students will be able to multiply and divide fractions.
Students will be able to compute using percents.
Students will be able to choose the appropriate operationin a given story problem.
Students will be able to balance checkbook.
Students will be able to change money.
Students will be able to solve story problems relating toreal life situations.
Students will be able to solve percentage problems relatingto actual circumstances.
Students will be able to read a bar graph and a pie graph.
Students will be able to make estimations and questionreasonableness of answers.
Students will be able to read and interpret charts, tables,and graphs.
Students will be able to convert fractions, decimals, andpercentage to equivalent numbers.
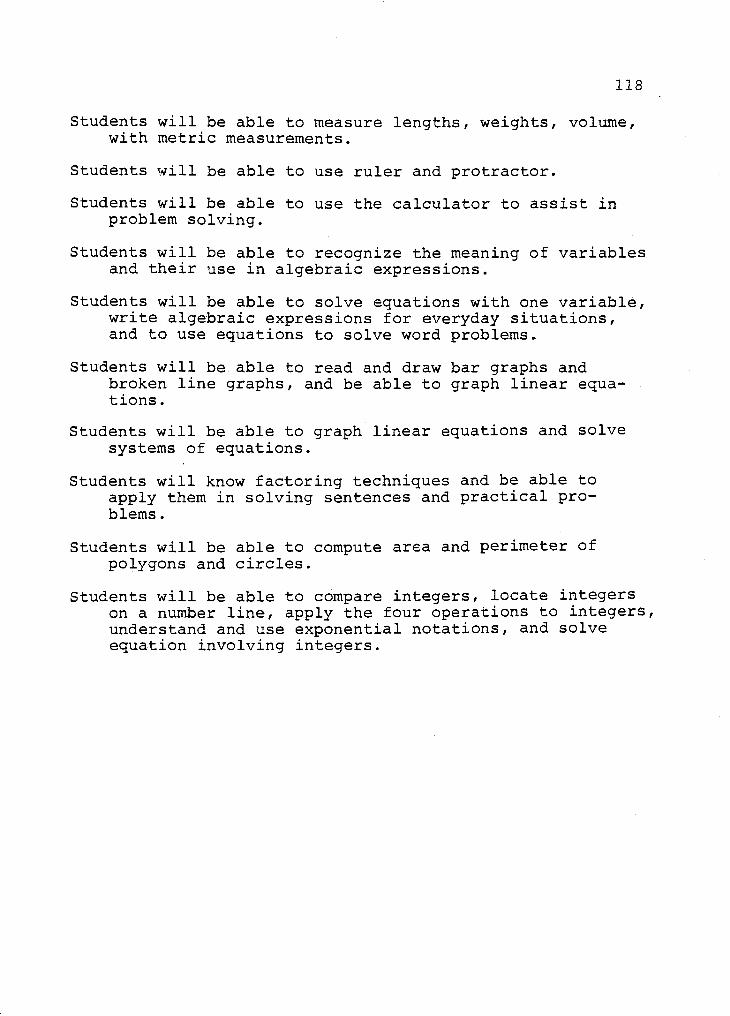
118
Students will be able to measure lengths, weights, volume,with metric measurements.
Students will be able to use ruler and protractor.
Students will be able to use the calculator to assist inproblem solving.
Students will be able to recognize the meaning of variablesand their use in algebraic expressions.
Students will be able to solve equations with one variable,write algebraic expressions for everyday situations,and to use equations to solve word problems.
Students will be able to read and draw bar graphs andbroken line graphs, and be able to graph linear equa-tions.
Students will be able to graph linear equations and solvesystems of equations.
Students will know factoring techniques and be able toapply them in solving sentences and practical pro-blems.
Students will be able to compute area and perimeter ofpolygons and circles.
Students will be able to compare integers, locate integerson a number line, apply the four operations to integers,understand and use exponential notations, and solveequation involving integers.

119
ITEMS CLASSIFIED AS RECOMMENDED:
Students will be able to compute mean of a set of data.
Students will be able to identify simple polygons.
Students will be able to compute area, perimeter andvolume.
Students will be able to evaluate simple expressions bysubstituting for the given variables.
Students will be able to work with variables and solvesimple equations.
Students will be able to compute simple probabilities.
Students will be able to estimate answers.
Students will be able to solve problems using geometricformulas, and be able to solve a formula for a givenvariable.
Students will be able to add, subtract, and multiplypolynomials and be able to solve equations and wordproblems involving polynomials.
Students will be able to multiply and factor polynomialsand use factoring to solve quadratic equations.
Students will be able to solve systems of equations intwo variables.
Students will be able to write a system of equations intwo variables, when given a story problem.
Students will be able to solve simple and compound in-equalities.
Students will be able to perform the basic operationson rational expressions.
Students will know the meaning of exponential and logarithmicfunctions.
Students will be able to make profits using postulatesand algebraic properties.

120
Students will be able to utilize properties of parallellines.
Students will be able to prove triangle congruent.
Students will be able to make profits using postulatesand algebraic properties.
Students will be able to relate trigonometric functionsand circular functions.
Students will be able to perform the basic straightedge and compass constructions.
Students will be able to develop the cartesian coordinatesystem.
Students will be able to operate with relations and func-tions.
Students will be able to graph relations.
Students will be able to evaluate polynomials.
121
APPENDIX J
LIST OF MATHEMATICAL COMPETENCIESAS IDENTIFIED BY AA SCHOOLS

122
LIST OF MATHEMATICAL COMPETENCIESAS IDENTIFIED BY AA SCHOOLS
ITEMS CLASSIFIED AS ACCEPTED:
Student will be able to add and subtract whole numbers anddecimals.
Students will be able to multiple whole numbers anddecimals.
Students will be able to divide whole numbers and decimals.
Students will be able to change common fractions.
Students will be able to add and subtract fractions.
Students will be able to multiply and divide fractions.
Students will be able to compute using percents.
Students will be able to choose the appropriate operationin a given story problem.
Students will be able to balance checkbook.
Students will be able to change money.
Students will be able to solve story problems relating toreal life situations.
Students will be able to solve percentage problems relatingto actual circumstances.
Students will be able to read a bar graph and a pie graph.
Students will be able to make estimations and questionreasonableness of answers.
Students will be able to read and interpret charts,tables, and graphs.
Students will be able to convert fractions, decimals, andpercentage to equivalent numbers.

123
Students will be able to measure lengths, weights, volumes,with metric measurements.
Students will be able to identify simple polygons.
Students will be able to use ruler and protractor.
Students will be able to compute area, perimeter, andvolume.
ITEMS CLASSIFIED AS RECOMMENDED:
Students will be able to compute mean of a set of data.
Students will be able to evaluate simple expressions bysubstituting for the given variables.
Students will be able to use the calculator to assist inproblem solving.
Students will be able to work with variables and solvesimple equations.
Students will be able to recognize the meaning of variablesand their use in algebraic expressions.
Students will be able to solve equations with one variable,write algebraic expressions for everyday situations,and to use equations to solve word problems.
Students will be able to read and draw bar graphs andbroken line graphs, and be able to graph linearequations.
Students will be able to graph linear equations and solvesystems of equations.
Students will know factoring techniques and be able toapply them in solving sentences and practical pro-blems.
Students will be able to compute area and perimeter ofpolygons and circles.
Students will be able to estimate answers.
Students will be able to compare integers, locate integerson a number line, apply the four operations tointegers, understand and use exponential notations,and solve equation involving integers.

124
Students will be able to use addition, subtraction, multi-plication, and division of real numbers in solvingequations.
Students will be able to perform the basic operations onrational expressions.
Students will be able to perform the basic straight edgeand compass constructions.

125
APPENDIX K
LIST OF MATHEMATICAL COMPETENCIESAS IDENTIFIED BY AAA SCHOOLS

126
LIST OF MATHEMATICAL COMPETENCIESAS IDENTIFIED BY AAA SCHOOLS
ITEMS CLASSIFIED AS ACCEPTED:
Student will be able to add and subtract whole numbers anddecimals.
Students will be able to multiple whole numbers anddecimals.
Students will be able to divide whole numbers and decimals.
Students will be able to change common fractions.
Students will be able to add and subtract fractions.
Students will be able to multiply and divide fractions.
Students will be able to compute using percents.
Students will be able to choose the appropriate operationin a given story problem.
Students will be able to balance checkbook.
Students will be able to change money.
Students will be able to solve story problems relating toreal life situations.
Students will be able to solve percentage problems relatingto actual circumstances.
Students will be able to-read a bar graph and a pie graph.
Students will be able to make estimations and questionreasonableness of answers.
Students will be able to read and interpret charts, tables,and graphs.
Students will be able to convert fractions, decimals, andpercentage to equivalent numbers.

127
Students will be able to measure lengths, weights, volumes,with metric measurements.
Students will be able to identify simple polygons.
Students will be able to use ruler and protractor.
Students will be able to compute area, perimeter, andvolume.
Students will be able to use the calculator to assist inproblem solving.
Students will be able to recognize the meaning of variablesand their use in algebraic expressions.
Students will be able to solve equations with one variable,write algebraic expressions for everyday situations,and to use equations to solve word problems.
Students will be able to use addition, subtraction, multi-plication, and division of real numbers in solvingequations.
ITEMS CLASSIFIED AS RECOMMENDED:
Students will be able to compute mean of a set of data.
Students will be able to evaluate simple expressions bysubstituting for the given variables.
Students will be able to work with variables and solvesimple equations.
Students will be able to read and draw bar graphs andbroken line graphs, and be able to graph linearequations.
Students will be able to graph linear equations and solvesystems of equations.
Students will know factoring techniques and be able toapply them in solving sentences and practical pro-blems.
Students will be able to compute area and perimeter ofpolygons and circles.
Students will be able to compute simple probabilities.
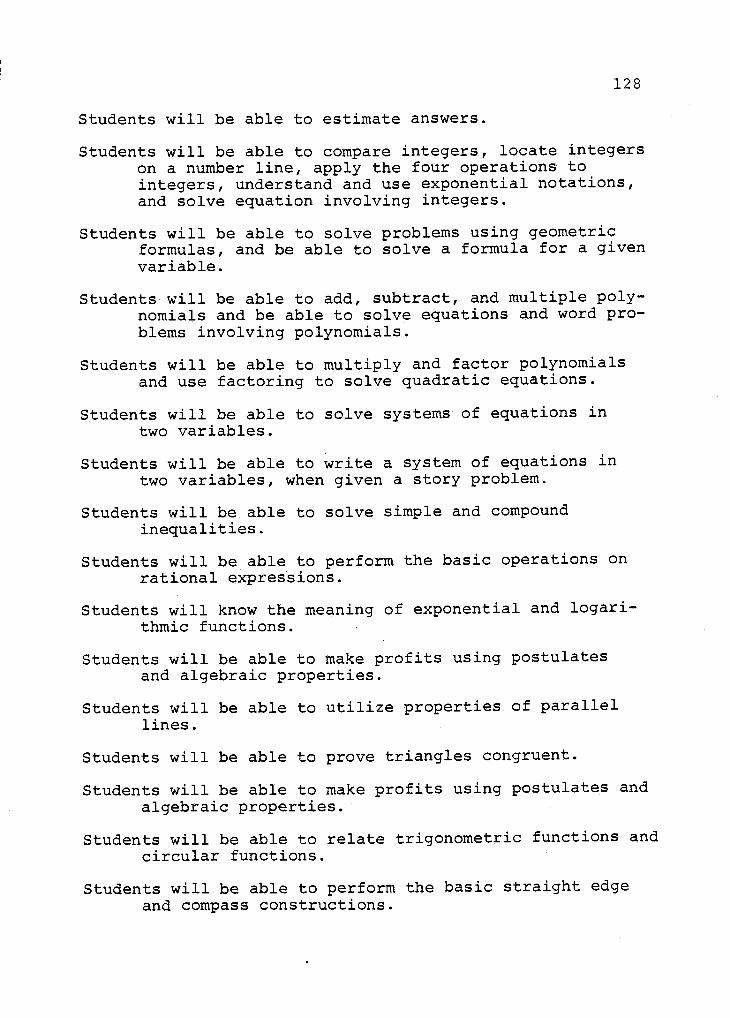
128
Students will be able to estimate answers.
Students will be able to compare integers, locate integerson a number line, apply the four operations tointegers, understand and use exponential notations,and solve equation involving integers.
Students will be able to solve problems using geometricformulas, and be able to solve a formula for a givenvariable.
Students will be able to add, subtract, and multiple poly-nomials and be able to solve equations and word pro-blems involving polynomials.
Students will be able to multiply and factor polynomialsand use factoring to solve quadratic equations.
Students will be able to solve systems of equations intwo variables.
Students will be able to write a system of equations intwo variables, when given a story problem.
Students will be able to solve simple and compoundinequalities.
Students will be able to perform the basic operations onrational expressions.
Students will know the meaning of exponential and logari-thmic functions.
Students will be able to make profits using postulatesand algebraic properties.
Students will be able to utilize properties of parallellines.
Students will be able to prove triangles congruent.
Students will be able to make profits using postulates andalgebraic properties.
Students will be able to relate trigonometric functions andcircular functions.
Students will be able to perform the basic straight edgeand compass constructions.

129
Students will be able to develop the cartesian coordinatesystem.
Students will be able to operate with relations and func-tions.
Students will be able to graph relations.
Students will be able to evaluate polynomials.

130
APPENDIX L
LIST OF MATHEMATICAL COMPETENCIESIDENTIFIED AS REJECTED BY USE OF F STATISTIC
AND MEAN SCORES BY TOTAL GROUP
Students will be able to relate ordered triples or realnumbers and points in space.
Students will be able to identify conics and determinetheir characteristics from their equations.
Students will be able to represent points and curves usingpolar coordinates.

131
LIST OF MATHEMATICAL COMPETENCIESIDENTIFIED AS REJECTED BY USE OF F SCORES
AND MEAN SCORES
Students will be able to add, subtract, multiply, divideand simplify radical expressions.
Students will know the order properties for the realnumbers and the axioms of the real number system.
Students will be able to apply summation notation toarithmetic and geometric series.
Students will be able to find sums of arithmetic andgeometric series.
Students will be able to identify basic sets of points.
Students will be able to utilize congruent triangles.
Students will be able to know and apply pythogoriantheorem.
Students will be able to know relationships in a 45-45-90and 30-60-90 triangle.
Students will be able to identify properties of similartriangles.
Students will be able to relate properties of quadri-laterials.
Students will be able to investigate properties of acircle.
Students will be able to apply properties of right tri-angle.
Students will be able to relate ordered triples or realnumbers and points in space.
Students will be able to identify conics and determinetheir characteristics from their equations.
Students will be able to represent points and curves usingpolar coordinates.

132
Students will be able to explore the career opportunitiesopen to a person with a computer programming back-ground.
Students will be able to understand impact of computerson society.
Students will be able to investigate the criteria andcharacteristics of "looping".
Students will be able to understand document programs.