Embed Size (px)
Citation preview
Journal of Subsea and Offshore -Science and Engineering-, Vol.1
March 20 , 2015
1 Published by International Society of Ocean, Mechanical and Aerospace Scientists and Engineers
A Study of The Dynamic Longitudinal Hull Structural Responses and Ultimate Strength of Drillship
I Dewa G.A.S. Yuda,a,* Eko B. Djatmiko,b and Daniel M. Rosyid,b
a)Master Degree Student,Marine Technology Post-Graduate Program, Institut Teknologi Sepuluh Nopember(ITS), Surabaya, Indonesia. b)Dept. Of Ocean Engineering, Institut Teknologi Sepuluh Nopember (ITS), Surabaya, Indonesia. *Corresponding author: [email protected] Paper History Received: 29-January-2015 Received in revised form: 4-March-2015 Accepted: 19-March-2015 ABSTRACT Sustainability studies will support the development of drillship design. One primary aspect to be explored during the design stageis the global structural responses due to the excitation of head sea waves. This paper presents the global structural response analysis by implementing the so called quasi-static approach and the effect for ultimate strength. In this respect, a motion analysis should be first carried out to obtain the coupled heave and pitch motion data for a range of regular wave frequency.The next step is performing the quasi-static computation for a number of wave frequencies, where the magnitudes of heave and pitch motions are considered important. After accomplishing RAO of shear force and bending moment calculation, further analysis is obtained the extreme global structural responses by implementing the spectral approach. It will be inputed to Global Finite Element Model (FEM) to get the ultimate condition of drillship material. Final results of the global analysis indicates the ultimate condition is exceeded on 12 meter wave height by the Structural Stress output of 585 Mpa. KEY WORDS: Drillship; Dynamic Wave Load; Structural Spectral Response; Finite Element Analysis; Ultimate strength. NOMENCLATURE
EPI Eastern Part of Indonesia
MBPOD Million Barrels of Oil Per Day ITS Institut Teknologi Sepuluh Nopember RAO Response Amplitude Operator Lpp Length between Perpendicular B Breadth H Height T Draught LCB Longitudinal Center of Bouyancy LCF Longitudinal Center of Floatation KMT Transversal Keel to Metacenter KML Longitudinal Keel to Metacenter BMT Transversal Bouyancy to Metacenter BML Longitudinal Bouyancy to Metacenter Hs Significant Wave Height FEM Finite Element Method SF Shear Force BM Bending Moment LWT Lightweight DWT Deadweight Mjk Matrixof ship mass and mass moment of inertia Ajk Matrix of hydrodynamic added mass coefficient Bjk Matrix of hydrodynamic damping coefficient Kjk Matrix of hydrostatic stiffness, Fj Matrix of excitation Forces (F1, F2, F3) and Moments (F4, F5, F6) w(x) Weight distribution along the ship hull Δ(x) Buoyancy distribution along the ship hull ITTC International Towing Tank Conference ISSC International Ship Structure Congress m0 The area under the structural response spectra m2 The second moment of the area under structural
response spetra Ts Storm duration (3.0 hours)
Journal of Subsea and Offshore -Science and Engineering-, Vol.1
March 20 , 2015
2 Published by International Society of Ocean, Mechanical and Aerospace Scientists and Engineers
α The probability of exceedance The level of confidence that the extreme response
σ Stress matrix σ σ σ σ σ σ Stiffness matrix of model Deformation matrix
fL Longitudinal stress of component fT Vertical stress of component fLT Vertical plane stress fUL Ultimate strength of material Sm Strength reduction factor (1 for ordinary steel) 1.0 INTRODUCTION Indonesia requires an oil supply of approximately 1,450 MBPOD, while the national production could only reach the range of 860 MBPOD. In future the shortage is planned to be tackled by exploiting the resources from the EPI, where a reserve in the quantity of 3.5 billion barrels is predicted to be available, with a further potential up to 50 billion barrels. However it should be realized that oil reserves in EPI mostly located in the deepsea and harsher environment. Deepsea oil and gas exploration and exploitation such as in EPI necessitate the utilization of floating structures to support the operation. Therefore national capacity building in the design and engineering of floating offshore structures should be greatly encouraged. One type of the floating offshore structures of interest is the drillship.
An intensive study on drillship has been commenced at ITS since 2013, covering the basic design, motion analysis and followed by the operability analysis [1]. The preliminary evaluation of the global structural responses of the drillship induced by wave excitations has been concluded that moonpool is a critical area of structure [2]. Results of evaluation will be in the form SF andBM to be further implemented in the structural design of the drillship. In the current study, Dynamic hull structural response analysis is conducted by implementing the designated quasi-static approach, which is basically the enhancement to the classical static wave approach long practiced in the monohull ship design [3]. While in the classical approach the wave considered in the analysis is characterized with length equal to ship length and height equal to 1/20 of the wave length, the quasi-static will consider the effect of waves in a number of frequencies. Realizing that one of the most critical design condition is the longitudinal strength, then the current study is chiefly concentrated to observe the effect of head waves, with dominant motion modes to be tackled are heave and pitch.
In general the quasi-static analysis will be conducted in a number of regular wave frequencies where the heave and pitch motions are regarded to have important effect on the global structure responses. The heave and pitch motion
data is taken from executing a hydrodynamic mathematical model based on the 3-dimensional diffraction theory. The regular wave height accounted for has a small amplitude and hence the heave and pitch motions are also relatively small so that assumption of straight down weight vector of every hull section applies. For each wave frequency selected the computation of global structural responses is conducted for one wave cycle, divided in 11 time steps. Therefore information on the changing of SF and BM distribution along the hull in each time step could be recorded. This could be further evaluated to see any of those that may instigate sizable stress or deflection on the hull structure.
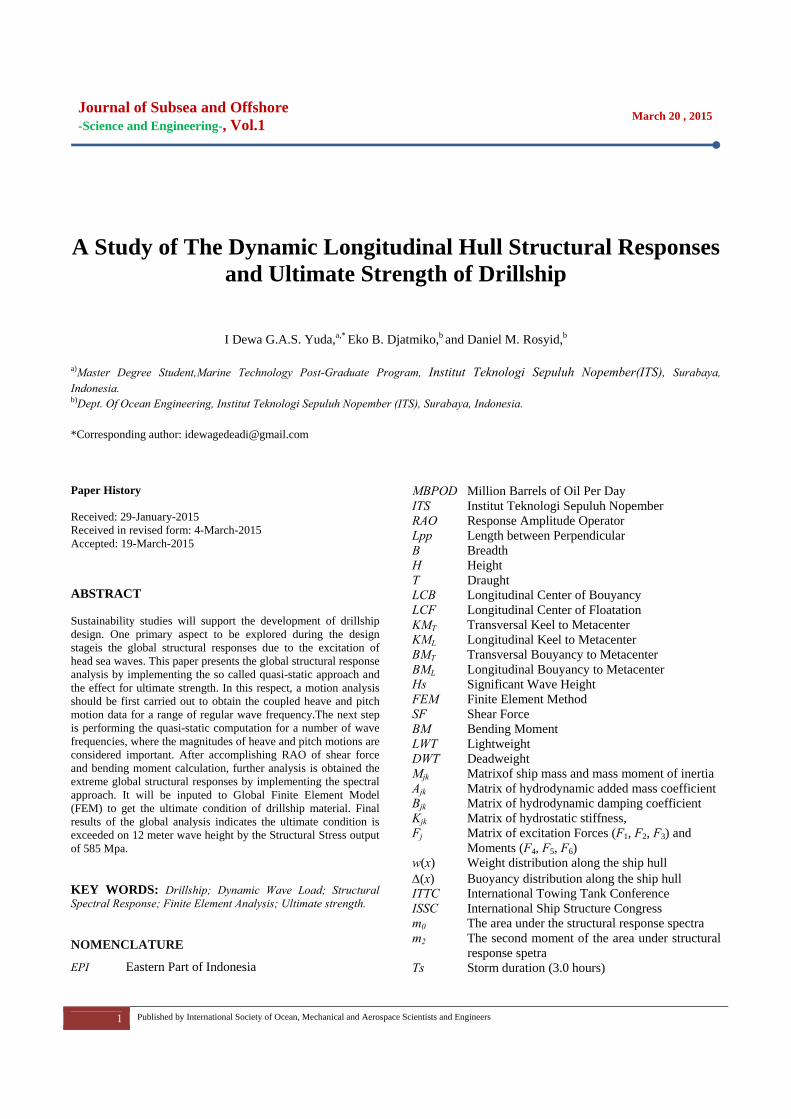
After accomplishing computation on all of the wave frequencies observation is then made to pick up the maximum SF and BM in each frequency, at any position of interest on the drillship hull. For the global structural analysis input, all maximum SF and BM in each drillship position (section 1-40) should be computed. By the variation of frequency, it will be arranged as SF and BM RAO for each station. Such RAO will be incorporated in the spectral analysis to derive the extreme values of SF and BM. It will necessary for evaluation of global ultimate strength of the structure. 2.0 METHODOLOGY 2.1 Data Accumulation The first primary data for this study is the reference ship, namely the drillship Oribis One.as made avaliable by Fossli and Hendriks [4]. Based on this data, New drillship was designed as reported in ref [1]. The general arrangement is exhibited in Figure 1 with principal particulars as presented in Table 1.
Figure 1: General Arrangement of Drillship [1].
The peculiar feature of a drillship is the arrangement of
moonpool to accommodate the extension of drill pipe and riser from the drilling rig down to the seabed. As a moonpool basically is a large opening, then hull structural strength in this location is
Journal of Subsea and Offshore -Science and Engineering-, Vol.1
March 20 , 2015
3 Published by International Society of Ocean, Mechanical and Aerospace Scientists and Engineers
reduced substantially. Therefore certain strengthening should be established in this respect.
Table 1: Principal parameter of drillship [2].
Parameter Design Hydro Check
Difference (%)
Displacement (ton) 35,193.0 35,421.7 0.65 Lpp (m) 156.0 156.0 0.00 B (m) 29.9 29.9 0.00 H (m) 15.6 15.6 0.00T (m) 9.0 9.0 0.00 LCB to Midship (m) 3.265 3.270 0.15 LCF to Midship (m) -7.203 -7.164 0.54 KMT (m) 13.29 13.33 0.30 KML (m) 222.82 223.21 0.17 BMT (m) 8.64 8.68 0.41 BML (m) 218.17 218.55 0.18
The next data needed in the study is related to the environment
regarded as the primary source of excitation. For this the wave distribution data has been obtained from ABS in 2010 [5], related to the world wave scatter diagram, as contained in table 2. Based on this data, wave spectral analysis is calculated as the increasing of Hs. In this study,depend on the summary over all periods of the worldwide wave data, Distribution of Hs is arranged from 1 up to 14m. In this range, The Significant wave height will occured as the probability value in the table 2. All probability will cause the structural effect for the drillship. So, this range will be very important to be analyzed.
Table 2: Unrestricted worldwide wave data [5].
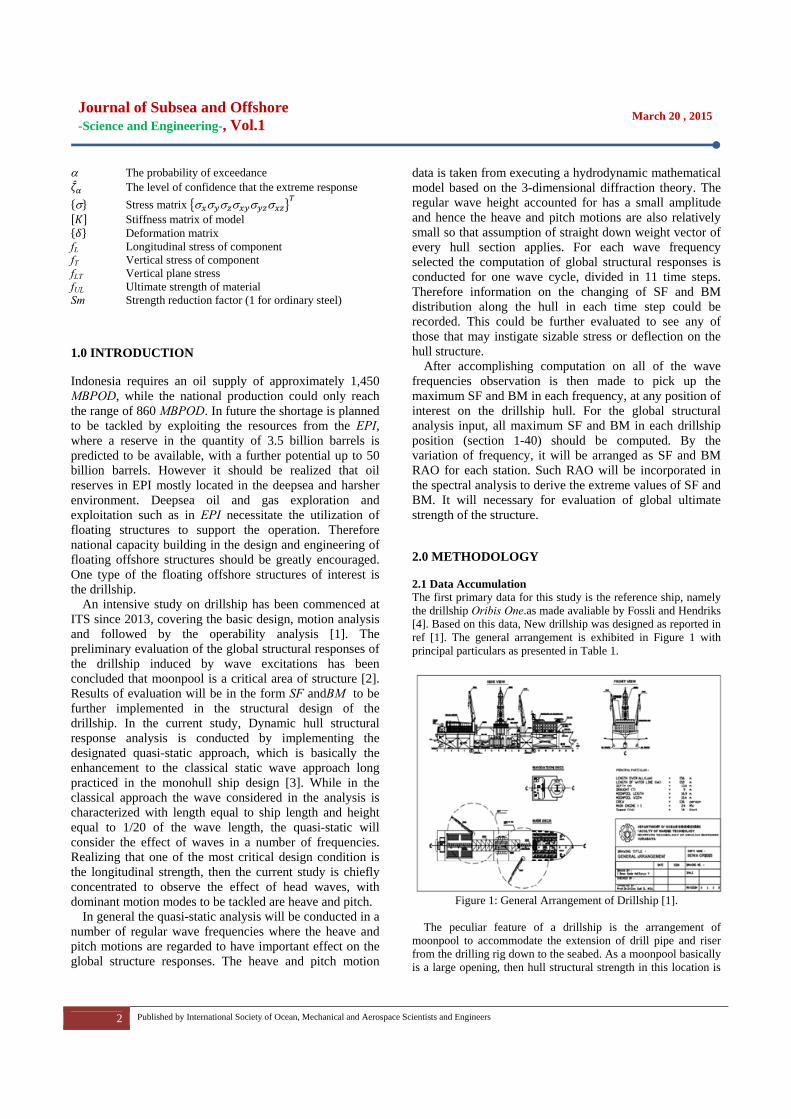
2.2 Modeling the Drillship Hull. Following the design and development of the general arrangement, further step is aimed at the establishment of hull model. There are 2 model that will be established for this analysis. The first one is related to general design, hydrostatic and hydrodynamic analysis as depicted in figure 2, and the second is required for Finite Element analysis as shown in figure 3. Model of FEM is the result of mesh sensitivity stage. For global structural analysis, The number of meshes are 2,114,808 units.
The hull model for general design is related to the lines plan and Bonjean curve of drillship as shown in figure 4 and 5. This model design and computation is helped by Hidrostar Software. Finite element model of drillship is made by using the construction design of drillship as shown in figure 6 up to 10. By the rule of drillship construction[6], It will arranged in the 3 dimensional desain that contained with thousand of elements. Number of element is dependent on the mesh size definition in
FEM All The design is combined with the vessel weight distribution to obtain SF and BM distribution, then the stress of structure.
Figure 2: Hull model for general design with Hidrostar Software.
Figure 3: Hull structure for Finite Element Model.
Figure 4: Lines plan of drillship [1].
Figure 5: Bonjean curve of drillship [2].
Figure 6: Center frame design of drillship.
Figure 7: Longitudinal Stiffener design of drillship
Journal of Subsea and Offshore -Science and Engineering-, Vol.1
March 20 , 2015
4 Published by International Society of Ocean, Mechanical and Aerospace Scientists and Engineers
Figure 8: Typical frame design of drillship.
Figure 9: Bulkhead design of drillship.
Figure 10: Moonpool frame design of drillship.
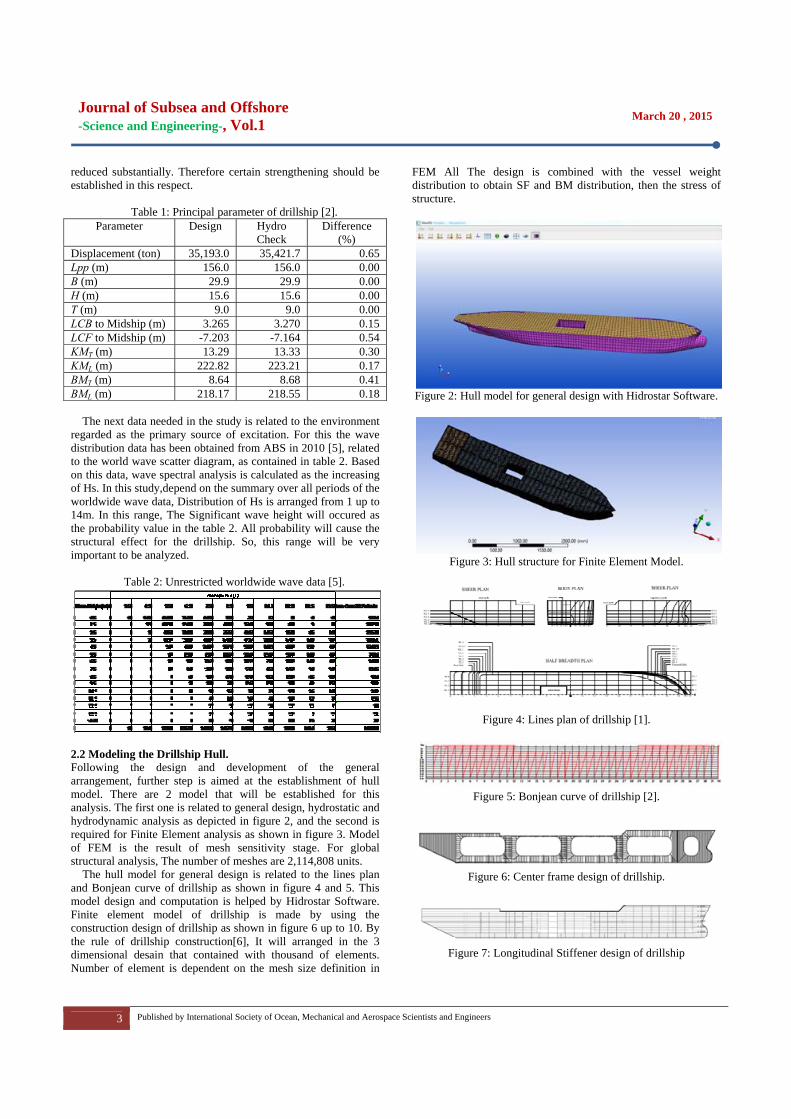
2.3 Weight Distribution Ship weight comprises of LWT and DWT. In addition to common ship components, the LWT of a drillship also covers the drilling equipments, drilling rigs, and specific topside facilities. In the case of DWT, specific components for a drillship include drill water, liquid mud, brine, base oil, barite and/or bentonite, cement, and bulks. For the current study the weight distribution of the drillship is shown in Figure 11. By the 40 It is noticeable from the graph that for station 16 – 19 the weight distribution is low, as
this is the position of moonpool. By this Dristribution in each frequency, RAO of each potition (station) in drillship as a load in regular wave will be obtained by quasi static approach.
Figure 11: Total weight distribution of drillship
2.4 Procedure of Computations The first stage of computation is directed towards the generation of drillship motion RAO. The numerical model is developed on the basis of the 3-dimensional diffraction theory. Computation is executed for the drillship in free floating stationary condition induced by the regular head waves in the frequency range from 0.25 up to 2.0 rad/s. The general motion equation is expressed as follows [7,8]: ∑ ζ ζ ζ ; , 1 … 6 (1)
The second stage of the computation is aimed at generating the shear force and bending moment. The shear force is basically obtained by integration of the difference between the ship weight and buoyancy distribution. Whereas the bending moment is obtained from integrating the shear force distribution, as described by the equation 2 and 3 [3].
∆ (2)
(3)
After completing the SF and BM computation in regular waves
up to the composition of their RAOs, the next stage of analysis is dedicated to attain the characteristics of global responses in random waves. For this case the spectral form to be applied is the ITTC/ISSC spectrum [7] which is suitable in common world waters.
Following the global responses in random waves, the most probable extreme value of the structural response brought about a random wave may be found by applying the equation 4 [7].
2 2 ln (4)
To be more conservative in the design so that a certain level of
structural response would not be exceeded, or in other words the
Journal of Subsea and Offshore -Science and Engineering-, Vol.1
March 20 , 2015
5 Published by International Society of Ocean, Mechanical and Aerospace Scientists and Engineers
level of confidence is to be enhanced, then equation 4 should be modified into equation 5. Usually � is taken as a small value, for instance 1% or 0.01. Reversely the level of confidence that the extreme response would not be exceeded is calculated as 1-0.01, that is 0.99 or 99%.
2 2ln (5)
By increasing Hs, structural response of SF and BM on each component (station) will be obtained in computation. This will be inputed to FEM of drillship. Stress on elements (component) will be computed by Finite Element method as results. The results depend on the number of mesh of the model. Therefore, mesh sensitivity step should be done before computation. Equation 6 shows the method to obtain result stress in FEM [9].
σ (6)
Ultimate strength analysis will be obtained by applying the
ultimate limit strength of the component material. Structure of drillship will be failure when the limit of material ultimate strength is exceeded, as shown in equation 7 and 8 [9].
(7)
(8)
3.0 RESULT AND DISCUSSIONS 3.1 Drillship Motions The hydrodynamic computation for the stationary and free floating drillship in the propagation of regular head waves yields the heave and pitch RAOs as depicted in figure 12. RAO’s computation of this study is used hidrostar software. The heave motion characteristic of the drillship is amenable, with largest RAO value approaching 1.0 m/m at very low frequency. The pitch motion has pronounced resonance with the peak RAO of some 1.36 deg/m at the wave frequency of about 0.45 rad/s. The heave and pitch data contained in figure 7 will then be used in the quasi-static analysis as explained in the sub-section.
Figure 12: Heave and pitch RAOs of the drillship
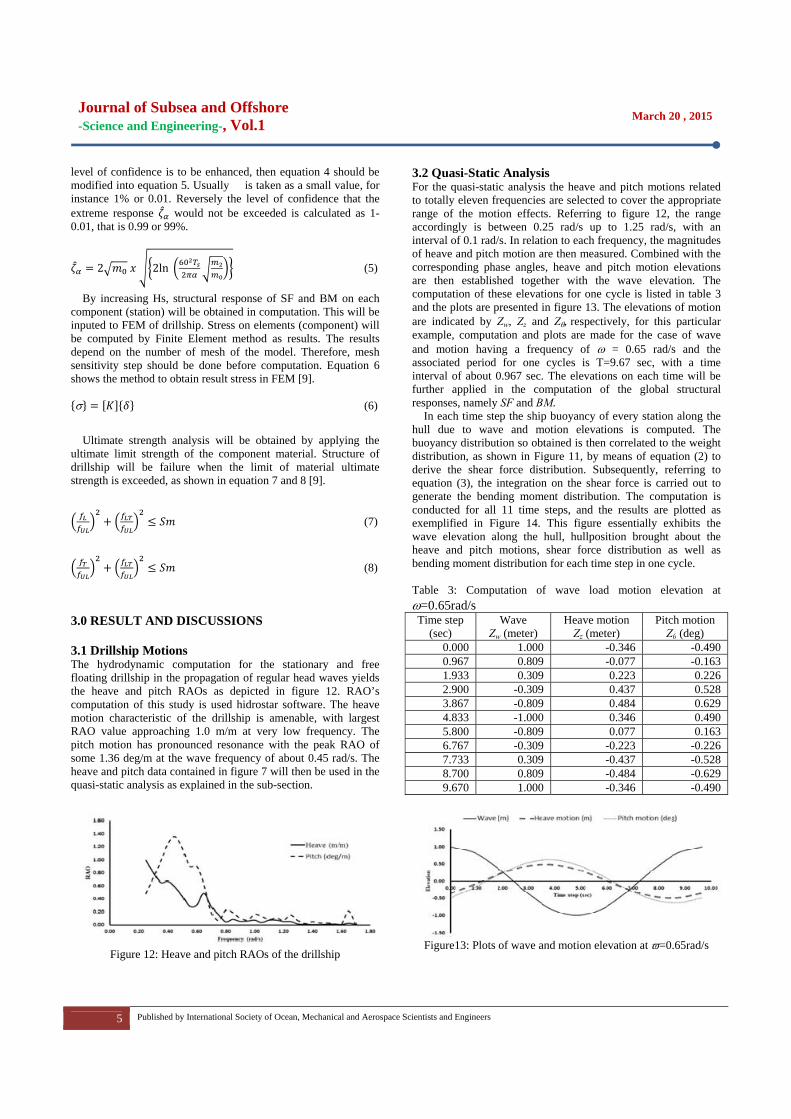
3.2 Quasi-Static Analysis For the quasi-static analysis the heave and pitch motions related to totally eleven frequencies are selected to cover the appropriate range of the motion effects. Referring to figure 12, the range accordingly is between 0.25 rad/s up to 1.25 rad/s, with an interval of 0.1 rad/s. In relation to each frequency, the magnitudes of heave and pitch motion are then measured. Combined with the corresponding phase angles, heave and pitch motion elevations are then established together with the wave elevation. The computation of these elevations for one cycle is listed in table 3 and the plots are presented in figure 13. The elevations of motion are indicated by Zw, Zz and Zθ, respectively, for this particular example, computation and plots are made for the case of wave and motion having a frequency of ω = 0.65 rad/s and the associated period for one cycles is T=9.67 sec, with a time interval of about 0.967 sec. The elevations on each time will be further applied in the computation of the global structural responses, namely SF and BM.
In each time step the ship buoyancy of every station along the hull due to wave and motion elevations is computed. The buoyancy distribution so obtained is then correlated to the weight distribution, as shown in Figure 11, by means of equation (2) to derive the shear force distribution. Subsequently, referring to equation (3), the integration on the shear force is carried out to generate the bending moment distribution. The computation is conducted for all 11 time steps, and the results are plotted as exemplified in Figure 14. This figure essentially exhibits the wave elevation along the hull, hullposition brought about the heave and pitch motions, shear force distribution as well as bending moment distribution for each time step in one cycle.
Table 3: Computation of wave load motion elevation at ω=0.65rad/s Time step Wave Heave motion Pitch motion
(sec) Zw (meter) Zz (meter) Zθ (deg) 0.000 1.000 -0.346 -0.490 0.967 0.809 -0.077 -0.163 1.933 0.309 0.223 0.226 2.900 -0.309 0.437 0.528 3.867 -0.809 0.484 0.629 4.833 -1.000 0.346 0.490 5.800 -0.809 0.077 0.163 6.767 -0.309 -0.223 -0.226 7.733 0.309 -0.437 -0.528 8.700 0.809 -0.484 -0.629 9.670 1.000 -0.346 -0.490
Figure13: Plots of wave and motion elevation at ϖ=0.65rad/s

Journal o-Science an
6 P
The shear fsummarized infrequencies areevery frequencgrouped accordgrouped accordas function of tas shown in Fig
Figure14: Sheadrillship in eaω=0.65 rad/s
Figure15: Sheaω = 0.65 rad/s
of Subsea and Engineerin
Published by Interna
force and bendn Figures 15 e finalized, thecy at the 40 pdingly. Those mding to the posthe frequency tgure 17 and 18
ar force and beach time step d
ar force distribu
nd Offshorng-, Vol.1
ational Society of O
ding moment dand 16. After maximum val
positions along maximum valu
sition along theto establish the .
ending momendue to wave a
.
ution for each t
re
Ocean, Mechanical a
distributions arr computation ues of SF and the hull is re
ues which are ae hull are then pRAO for SF an
nt distributions and motion eff
time step at freq
and Aerospace Scie
re then on all BM in corded already plotted nd BM,
on the
fects at
quency
Ffr
Fd
Fd
a0a7invInstimmsawainthpd
3WNminrec
entists and Engineer
Figure16: Bendrequency ω = 0
Figure17: Sheardrillship hull
Figure18: Bendidrillship hull
As can be seeare similar, with0.55 up to 0.60at the section of76.6 MN. As forn each positio
values within tntriguingly thetation 28, in thmperative at th
maximum frequay 0.55 up to 0
wave data thoseand 5.0 m. Thern this study carhose characteri
prossibility of rdevelop.
3.3 Extreme GWaves Numerous studimarine operationtenstive studiecommend acconducted durin
rs
ding moment d0.65 rad/s
r force RAO
ing moment RA
en in Figure 17 h maximum varad/s. The largef the moonpoolr the case of SFn are relativelthe frequency e largest maximhe order of ap
his point to be huency range of 0.65 rad/s. Refee periods are rerefore, in the ore should be takistic heights, aresonance on t
Global Struct
ies has documons. The manyies that have urate prediction
ng the design st
distribution for
at station 1 u
AO at station 1
and 18, the patlues within theest maximum Sl (st.16), with aF, the tendencyly consistent, range of 0.55
mum BM of alpproximately 1highlighted conthe SF and BM
erring to the unrelated to wave operation of theken when experas there woulthe global stru
tural Respons
ented various y casualties w
been conductn on the dynamtage. Therefore
March 20 , 20
r each time st
up to 40 along
1 up to 40 alon
ttern of RAO foe frequency ranSF eventually oan intensity of
y of BM RAO cwith the maxi
5 up to 0.65 l takes place a096.49 MNm.
ncerns related tM, which is betrestricted worldheights betwee
e drillship forwriencing wavesd be a fairly
uctural respons
ses in Random
severe casualtiwas mentioneted [10-12]. Tmic loads shoue, this study pre
015
ep at
g the
ng the
for SF nge of occurs
some urves imum rad/s. at the
It is to the tween dwide en 3.0 arded
s with high
ses to
m
ies in ed by These uld be edicts

Journal o-Science an
7 P
extreme globalof Hs in randconducted by equations 4 anthis case, by coand the ITTC/that the regionextreme valueincreasing Hs.
Figure19: Ex
Figure 20: Exwave as increa
3.4 Finite EleFirst stage of drillship modesensitivity is s88302 elementnumber of elem
0
200
400
600
800
1000
1200
1400
1600
1800
0
Shear F
orce (M
N)
0
5000
10000
15000
20000
25000
0
bend
ing m
omen
(MNm
)
of Subsea and Engineerin
Published by Interna
l structural respdom wave as adopting the e
nd 5. A proceduorelating the RA/ISSC spectral
n of drillship me on the long
xtreme responseincr
xtreme responsasing Hs
ement Analysthe FEM com
l should be donshown in figurts until higher
ment, it made co
2 4 6
2 4 6
nd Offshorng-, Vol.1
ational Society of O
ponses (SF andshown in figu
extreme formulure of spectral aAOs as exhibite
form. The spemoonpool (statio
itudinal dimen
es of shear forcereasing Hs
ses of bending
sis
mputation, mesne.By trial forcre 21. The con
number of it.onvergen result
8 10 12
Hs (m)
8 10 12
Hs (m)
Hs vs Bending Momen
re
Ocean, Mechanical a
d BM) with incrure 19 and 20lae as put forwanalysis is adoped in figure 17 ectral analysis on 16) has the bnsion of drills
e in random wa
g moment in r
sh sensitivity se, The graph onvergence star With increasit trendline.
14 16
station 2
station 3
station 4
Station 5
Station 6
Station 7
Station 8
Station 9
Station 10
Station 11
Station 12
Station 13
Station 14
Station 15
Station 16
Station 17
Station 18
Station 19
Station 20
Station 21
Station 22
Station 23
Station 24
Station 25
Station 26
Station 27
Station 28
Station 29
Station 30
Station 31
Station 32
Station 33
Station 34
Station 35
Station 36
Station 37
Station 38
Station 39
Station 40
14 16
Station 2
station 3
station 4
station 5
Station 6
Station 7
Station 8
Station 9
Station 10
Station 11
Station 12
Station 13
Station 14
Station 15
Station 16
Station 17
Station 18
Station 19
Station 20
Station 21
Station 22
Station 23
Station 24
Station 25
Station 26
Station 27
Station 28
Station 29
Station 30
Station 31
Station 32
Station 33
Station 34
Station 35
Station 36
Station 37
Station 38
Station 39
Station 40
and Aerospace Scie
reasing 0. It is ward in pted in and 18 shows
biggest hip as
ave as
random
step of f mesh
rted by ing the
wcuthdewMd
entists and Engineer
F
Responses of will be inputed ondition of dril
ultimate strengthhat drillship w
dynamic load aach Hs is exhi
will mostly hapMPa. Simply supdrillship FEM (a
Table M
PrimaSeconda
Figure 22:
rs
Figure 21: Mesh
f SF and BM in to FEM. It aim
llship. Correlateh as shown in ill get ultimate
as shown in figibited in figureppened on the pport(pinned-roaft-fore edge).
4: Criteria of dMaterial type ary (ASTM 897ary (ASTM A8
Ultimate streng
h sensitivity of
each Hs condimed to obtain ted by the critertable 4, The c
e failure in abogure 22. Condie 23 (a up to f)
moonpool regiolled) is assum
drillship ultimatValu
7) 75852) 483
gth of global an
(a)
(b)
March 20 , 20
FEM
tion (fig. 19 anthe ultimate stria of global dril
computation preout 12 meter Hition of structu). The critical ion, it is about
med as a constra
te strength ue Unit 8 MPa 3 MPa
nalysis by FEM
015
nd 20) ength llship edicts Hs by ure in stress t 585 ain of
M
Journal of Subsea and Offshore -Science and Engineering-, Vol.1
March 20 , 2015
8 Published by International Society of Ocean, Mechanical and Aerospace Scientists and Engineers
(c)
(d)
(e)
(f)
Figure 23: FEM Results of drillship (a)Hs=4m (b)Hs=6m (c)Hs=8m (d)Hs=10m (e)Hs=12m (f)Hs=14m
4.0 CONCLUSION A study has been carried out to investigate the global structural responses of a 35,000 ton class drillship due to the head waves excitations by applying the quasi-static approach of dynamic loads. Based on the results of computation and analyses, a number of conclusions may be put forward, as follows: • The regular wave excitation instigate a moderate motion
characteristic in the heave mode, with maximum RAO value approaching unity or 1.0 m/m at very low frequency. For the pitch mode, the RAO curve show a pronounced hump at the frequency of 0.60 rad/s, having a magnitude of some 1.36 deg/m. The pitch motion is considered to have a significant effect on the shear force and bending moment which also have the magnified curves at frequency of about 0.60 rad/s.
• Making use of the quasi static approach it is possible to generate the global response distributions which explicitely indicate the effect of vessel motions in elapsed times. This represent an enhancement to the classical static wave approach analysis.
• Computation by adopting the quasi-static approach yields the maximum shear force on the drillship in the extent of 76.6 MN to occur at section of moonpool (station 16) when induced by a regular head wave with frequency of 0.65 rad/s. Further, the computation gives a maximum bending moment of 1096.49 MNm with peak frequency of 0.65 rad/s.
• The spectral analysis shows that the region of drillship moonpool (station 16) has the biggest extreme value on the longitudinal dimension of drillship as increasing Hs (from 1 up to 14 m).
• The FEM computation and analysis predict that drillship will get ultimate failure in about 12 meter Hs with 585 Mpa stressby inputing spectral responses of SF and BM. The critical stress will mostly happened on the moonpool region.
ACKNOWLEDGEMENTS The authors would like to convey a great appreciation to : • Fresh Graduate Scholarship Program of DIKTI & ITS that
supported this study. • Bureau Veritas as ITS’s partner that provides hidrostar
licensed Software to assist this research. REFERENCE 1. Yuda, I.D.G.A.S., Djatmiko, E.B. and Wardhana, W. (2013).
Evaluation on the Motion and Operability Aspects in the Design of a 35,000 ton Displacement Drillship. Proc. of Seminar on the Theory and Application in Marine Technology, SENTA 2013, Surabaya, Indonesia.
2. Ariyanto, S., Djatmiko, E.B., Murtedjo, M., and Yuda, I.D.G.A.S. (2014). A Study of The Longitudinal Hull Structural Responses on a 35,000 Ton Class Drillship due to Wave Load by the Quasi-Static Approach. Proc. The 9th International Conference on Marine Technology, MARTEC 2014, Surabaya, Indonesia.
3. Rawson, K.J. dan Tupper, E.C.(2001), Basic Ship Theoryvol. 1, Butterworth-Heinemann, Oxford, UK
4. Fossli, B. And Hendriks, S.,PRD12,000 Drill Ship; increasing Efficiency in Deep Water Operations,Proc. of IADC/SPE Drilling Conference, Orlando, Florida, USA.
5. ABS (2010), Guide for Spectral-Based Fatigue Analysis for Floating Production, Storage and Offloading (FPSO) Installation, American Bureau of Shipping, USA, May
6. ABS (2011), Drillship : Hull Structural Design and Analysis, American Bureau of Shipping, USA.
7. Djatmiko, E.B. (2012), Behavior and Operability of Ocean Structure on Random Waves, ITS Press, Surabaya, Indonesia
8. Chakrabarti, S.K. (1987), Hydrodynamics of Offshore Structures, Computational Mechanics Publications Southampton Boston, Springer-Verlag, Berlin
9. Paik JK, Thayaballi AK. 2003. Ultimate Limit State Design Of Steel Plated Structures, John Wiley & Sons.
10. Burke, R.J. (1982), The Consequences of Extreme Loadings on Ships Structures, Proc. of Extreme Loads Response Symposium, SSC/SNAME, Arlington, VA, USA, Oct.
11. Djatmiko, E.B. (1995), Identification of SWATH Ship Global Structural Responses Utilizing a Physical Model, Research Project Report, LPPM-ITS, Surabaya
12. DNV (2011),Modelling and Analysis of Marine Operations, DNV-RP-H103, Norway


![J org Pretz arXiv:2005.12203v1 [physics.class-ph] 25 May 2020 › pdf › 2005.12203.pdf · (t)/ m mass 1 mass 2 mass 3 mass 4 mass 5 mass 6 mass 7 mass 8 mass 9 mass 10 Figure 2](https://img.dokumen.tips/doc/110x75/5f1ec529f26656179f60ee75/j-org-pretz-arxiv200512203v1-25-may-2020-a-pdf-a-200512203pdf-t.jpg)