Embed Size (px)
Citation preview

A Study of the Dust Mineralogy of Low and High MassPost-Main Sequence Stars
A THESIS
SUBMITTED TO THE FACULTY OF THE GRADUATE SCHOOL
OF THE UNIVERSITY OF MINNESOTA
BY
Ryan Alan Arneson
IN PARTIAL FULFILLMENT OF THE REQUIREMENTS
FOR THE DEGREE OF
Doctor of Philosophy
Advisor:
Robert D. Gehrz
December, 2017
© Ryan Alan Arneson 2017
ALL RIGHTS RESERVED

Acknowledgements
I would like to thank my advisor, Bob Gehrz, who provided me with well-defined research
projects to study and for allowing me to take his place as a guest observer onboard
SOFIA. Flying on SOFIA to observe TX Per was a once-in-a-lifetime opportunity. I am
appreciative of his guidance and support.
I would like to thank Adam Bolton, for introducing me to the field of astrophysics
and for giving me my first research experience. Adam’s influence has had a lasting
effect.
I cannot thank my So-Arneson family enough for all of their support throughout the
years. To my Mom and Dad, thank you for allowing me to pursue my dreams and for
being my role models. To Grandma, thank you for giving me my first telescope and for
always inspiring me.
Most of all I would like to thank my wife, Jacky So, for her constant support and
encouragement. This thesis would not have been possible without her.
i

Dedication
To Little Bunny, my other whole
ii

Abstract
Luminous blue variables (LBVs) represent a post-main sequence phase in which
massive stars (Mi ≥ 20 M� , Langer et al., 1994) lose a considerable amount of mass
via giant eruptions and minor outbursts creating circumstellar nebula. RV Tauri and
yellow semi-regular (SRd) variables are two classes of post-main sequence stars with a
typical mass of ∼ 0.7 M� (Tuchman et al., 1993) that are thought to be the immediate
precursors of planetary nebulae (PNe) and have been termed “proto-planetary nebu-
lae” (PPNe). These classes of stars are responsible for creating unique circumstellar
environments where various dust species grow, undergo processing and dissipate into
the interstellar medium (ISM). This thesis studies the dust mineralogy and mass-loss
history of both high mass (LBVs) and low mass (RV Tauri and SRd variables) post-
main sequence stars using SOFIA/FORCAST 5 – 40 µm mid-infrared imaging and
spectroscopy.
In particular, I present SOFIA/FORCAST 5-40 µm mid-infrared imaging of the
dust surrounding the LBV candidates MN 90 and HD 168625 to quantify the mineral
abundances of the circumstellar dust and constrain the evolutionary state of these ob-
jects. The images between 7.7 – 37.1 µm of HD 168625 compliment previously obtained
mid-IR imaging. The dust color temperature and optical depth maps of HD 168625
show evidence for the limb-brightened peaks of an equatorial torus. Our image at 37.1
µm of MN 90 shows a limb-brightened, spherical dust shell. A least-squares fit to the
spectral energy distribution of MN 90 yields a dust temperature of 69± 3 K, with the
peak of the emission at 42 µm. Similarly for HD 168625, I estimate a dust temperature
of 160 ± 7 K, with the peak of the emission at 18 µm. Radiative transfer calculations
of HD 168625 using 2-Dust estimate that mass-loss occurred 2.6 × 10³ years ago at a
rate of 1.3× 10⁻⁷ M� yr−1 to create a dust torus/shell with a dust mass of 2.4× 10⁻³
M�. Similarly, I estimate for MN 90 that mass-loss occurred 6×10³ years ago at a rate
of 8.3× 10⁻⁶ M� yr−1 to create a dust shell with a dust mass of 2.5× 10⁻² M� . The
2-Dust calculations suggest the presence of oxygen rich silicates around both stars.
I further present a SOFIA/FORCAST 5 – 40 µm mid-infrared grism spectroscopic
survey that examines the mineralogy of the circumstellar dust in a sample of RV Tauri
iii

and SRd variable stars. A mineralogical model for each star indicates the presence of
both carbon rich and oxygen rich dust species–contrary to simple dredge-up models–
with a majority of the dust in the form of amorphous carbon and graphite. The oxygen
rich dust is primarily in the form of amorphous silicates. For most of the systems,
the analysis suggests that the grains are relatively large and have undergone significant
processing, supporting the hypothesis that the dust is confined to a Keplerian disk and
that the heavily processed, central regions of the disk are viewed from a nearly face-
on orientation. These results help to determine the physical properties of post-main
sequence circumstellar environments and to constrain models of post-main sequence
mass loss and planetary nebula formation.
iv

Contents
Acknowledgements i
Dedication ii
Abstract iii
List of Tables vii
List of Figures viii
1 Introduction 1
2 SOFIA/FORCAST Observations of the Luminous Blue Variable Can-
didates MN 90 and HD 168625 4
2.1 Introduction . . . . . . . . . . . . . . . . . . . . . . . . . . . . . . . . . . 5
2.2 Observations & Data Reduction . . . . . . . . . . . . . . . . . . . . . . . 8
2.2.1 Spectral Energy Distributions . . . . . . . . . . . . . . . . . . . . 9
2.2.2 MN 90 . . . . . . . . . . . . . . . . . . . . . . . . . . . . . . . . . 10
2.2.3 HD 168625 . . . . . . . . . . . . . . . . . . . . . . . . . . . . . . 10
2.2.4 IR Reddening . . . . . . . . . . . . . . . . . . . . . . . . . . . . . 13
2.3 Radiative Transfer Modeling . . . . . . . . . . . . . . . . . . . . . . . . . 14
2.3.1 2-Dust Introduction . . . . . . . . . . . . . . . . . . . . . . . . . 14
2.3.2 Input Parameters . . . . . . . . . . . . . . . . . . . . . . . . . . . 15
2.3.3 Model Results . . . . . . . . . . . . . . . . . . . . . . . . . . . . 16
2.4 Discussion . . . . . . . . . . . . . . . . . . . . . . . . . . . . . . . . . . . 24
v

2.4.1 HD 168625 . . . . . . . . . . . . . . . . . . . . . . . . . . . . . . 26
2.4.2 MN 90 . . . . . . . . . . . . . . . . . . . . . . . . . . . . . . . . . 26
2.5 Conclusion . . . . . . . . . . . . . . . . . . . . . . . . . . . . . . . . . . 27
3 A SOFIA/FORCAST Grism Study of the Mineralogy of Dust in the
Winds of Proto-planetary Nebulae: RV Tauri Stars and SRd Variables 29
3.1 Introduction . . . . . . . . . . . . . . . . . . . . . . . . . . . . . . . . . . 30
3.2 Program Stars . . . . . . . . . . . . . . . . . . . . . . . . . . . . . . . . 34
3.3 Observations and Data Reduction . . . . . . . . . . . . . . . . . . . . . 34
3.4 Spectral Energy Distributions of the Survey Objects . . . . . . . . . . . 36
3.4.1 Dust Species . . . . . . . . . . . . . . . . . . . . . . . . . . . . . 37
3.4.2 Spectral Decomposition Model . . . . . . . . . . . . . . . . . . . 39
3.4.3 Grain Size Distribution . . . . . . . . . . . . . . . . . . . . . . . 41
3.5 Results . . . . . . . . . . . . . . . . . . . . . . . . . . . . . . . . . . . . . 41
3.6 Discussion . . . . . . . . . . . . . . . . . . . . . . . . . . . . . . . . . . . 62
3.6.1 Crystallinity . . . . . . . . . . . . . . . . . . . . . . . . . . . . . 69
3.6.2 Dual Chemistry . . . . . . . . . . . . . . . . . . . . . . . . . . . . 70
3.6.3 Viewing Effects . . . . . . . . . . . . . . . . . . . . . . . . . . . . 70
3.6.4 Limitations of the Fit . . . . . . . . . . . . . . . . . . . . . . . . 71
3.6.5 Crystallinity of the ISM . . . . . . . . . . . . . . . . . . . . . . . 73
3.7 Conclusion . . . . . . . . . . . . . . . . . . . . . . . . . . . . . . . . . . 78
4 Summary 80
vi

List of Tables
2.1 Summary of SOFIA/FORCAST Observations of HD 168625 . . . . . . 9
2.2 2-Dust Density Function Parameters for the Best-Fit Models . . . . . . 17
2.3 MN 90 2-Dust Input and Derived Parameters . . . . . . . . . . . . . . . 23
2.4 HD 168625 2-Dust Input and Derived Parameters . . . . . . . . . . . . 25
3.1 Properties of the RV Tauri and SRd Variables in this Survey . . . . . . 35
3.2 Dust Species and Properties Used in this Work . . . . . . . . . . . . . . 39
3.3 RV Tauri and SRd Star Mineralogy . . . . . . . . . . . . . . . . . . . . . 43
vii

List of Figures
2.1 Observed and model SEDs of MN 90 . . . . . . . . . . . . . . . . . . . . 11
2.2 Observed and model SEDs of HD 168625 . . . . . . . . . . . . . . . . . 12
2.3 Observed SOFIA/FORCAST and 2-Dust model image of MN 90 . . . . 17
2.4 Observed SOFIA/FORCAST and 2-Dust model image of HD 168625 . 21
2.5 Temperature and optical depth map of HD 168625 at 37.1 µm . . . . . 22
3.1 SOFIA/FORCAST spectra and archival photometry . . . . . . . . . . . 51
3.2 Normalized SOFIA/FORCAST spectra . . . . . . . . . . . . . . . . . . 56
3.3 Best-fit models for our sample of stars . . . . . . . . . . . . . . . . . . . 61
3.4 Normalized probability distribution functions and covariance of the best
fit coefficients . . . . . . . . . . . . . . . . . . . . . . . . . . . . . . . . . 67
3.5 Continuum subtracted 10 to 20 µm flux ratios versus the 10 µm to con-
tinuum flux ratios . . . . . . . . . . . . . . . . . . . . . . . . . . . . . . 68
3.6 AC Her: The effect on the fit when removing dust species from the best
model . . . . . . . . . . . . . . . . . . . . . . . . . . . . . . . . . . . . . 73
3.7 UY CMa: The effect on the fit when removing dust species from the best
model . . . . . . . . . . . . . . . . . . . . . . . . . . . . . . . . . . . . . 75
3.8 AC Her: The effect on the fit when adding dust species to the best model 76
3.9 UY CMa: The effect on the fit when adding dust species to the best model 77
viii

Chapter 1
Introduction
Post-main sequence stars are important producers of dust in the universe. As the
stars evolve off the main sequence, they shed mass in outflows that produce a variety
of dust species that enrich the interstellar medium (ISM). In our own Galaxy, dust
enrichment of the ISM is dominated by the dusty winds from low to intermediate mass
stars (1 – 8 M�) during the asymptotic giant branch (AGB) phase (Gehrz, 1989). The
relative contribution from high mass stars (M > 8 M� ) is also important and is often
used to explain the substantial dust abundances observed in high-redshift galaxies and
quasars (Micha lowski et al., 2010; Dwek et al., 2007; Beelen et al., 2006; Bertoldi &
Cox, 2002). If the dust-forming stars show the standard cosmic element mixture in
their photospheres, they mainly form silicate dust in their stellar outflows (see Molster
et al. 2010 for a review of observations). With progressive changes in the surface element
mixture they start to form completely different dust species. The best known example
is the change of spectral type from M over S to C for stars of low and intermediate mass
(initial mass Mi < 8 M� ) during their evolution on the thermally pulsing AGB. This
results from the dredging up of freshly produced carbon from He burning in the core
region to the surface after each pulse. The change in chemistry and spectral type from
being oxygen-rich for M stars to carbon-rich for C stars is accompanied by a drastic
change in the dust production from silicate to carbon production. Studying the mass-
loss history and mineral species of post-main sequence stars provides insight into the
physical parameters of the star and their role in the enrichment of the ISM.
Luminous blue variables (LBVs) represent a post-main sequence phase in which
1

2
massive stars (Mi ≥ 20 M� , Langer et al., 1994) lose a considerable amount of mass
via giant eruptions and minor outbursts. These giant eruptions are responsible for
producing circumstellar nebulae with sizes of about 1 – 2 pc and expansion velocities
anywhere from ∼ 10 km s−1 to ∼ 1000 km s−1 (as in the case of η Car, Weis, 2012) that
are then shaped by wind-wind interactions (van Marle et al., 2007). The morphology
of the nebula discloses the mass-loss history and evolutionary stage of the central star
and the circumstellar environment. Shenoy et al. (2016) and Gordon et al. (2017) are
paradigms on mass-loss histories for which the analysis presented in this thesis is based.
By imaging these nebulae at a range of wavelengths, we can study their structure,
estimate the dust composition, and quantify the dust temperature and total mass.
These parameters will help to determine the physical properties of the circumstellar
environments and to constrain the importance of eruptive mass-loss in high-mass, post-
main sequence stellar evolution.
RV Tauri and yellow semi-regular (SRd) variables are two classes of post-asymptotic
giant branch (post-AGB) stars that lie along the horizontal track on the Hertzsprung-
Russell (H-R) diagram linking AGB stars to planetary nebulae (PNe). They are thought
to be the immediate precursors of PNe and have been termed “proto-planetary nebulae”
(PPNe). RV Tauri stars are characterized by semi-regular, bimodal variability (possibly
resulting from interaction with a binary companion; Waelkens & Waters, 1993; Percy,
1993; Fokin, 1994), a high mass-loss rate, and often a prominent infrared (IR) excess
(Gehrz & Woolf, 1970; Gehrz, 1972; Gehrz & Ney, 1972). SRd variables are similar
to RV Tauri stars in many respects but are probably single star systems, as indicated
by the absence of regular pulsations (Percy & Ursprung, 2006). RV Tauri stars are a
loosely defined subclass of Population II Cepheid variables named after the prototype
RV Tau. They are defined as luminous (I-II) mid-F to K supergiants with a typical
mass of ∼ 0.7 M� (Tuchman et al., 1993; Fokin, 1994). It has been suggested that RV
Tauri stars are binary systems with circumstellar dust confined to a disk (Van Winckel
et al., 1999) which emit in the thermal IR. By modeling the thermal IR spectrum
emission we can determine the source of the IR-excess, identify the dust species present
and quantify fundamental dust properties, such as the grain size distribution and dust
temperature. These parameters help to determine the physical properties of the post-
AGB circumstellar environment and to constrain models of post-AGB mass loss and

3
planetary nebula formation.
In this thesis I present a study of the mineralogy and mass-loss of 2 candidate LBV
stars, 15 RV Tauri and 3 SRd variable stars. All of the stars presented in this thesis
have been observed using the Faint Object infraRed CAmera for the SOFIA Telescope
(FORCAST) onboard NASA’s airborne Stratospheric Observatory for Infrared Astron-
omy (SOFIA). In Chapter 2, I present our work using imaging and radiative transfer
modeling to probe the mass-loss of the luminous blue variable candidates MN 90 and
HD 168625 in the 5 – 40 µm range (Arneson et al., 2017, in preparation). In Chapter
3, I utilize near infrared grism spectroscopy between 5 – 40 µm to study the mineralogy
of both RV Tauri stars and SRd variable stars (Arneson et al., 2017). A summary is
provided in Chapter 4.

Chapter 2
SOFIA/FORCAST Observations
of the Luminous Blue Variable
Candidates MN 90 and HD
168625
This chapter has been submitted for publication in the Astronomical Journal
with the following author list: Arneson, R. A., Shenoy, D. P., Smith, N.,
and Gehrz, R. D.
Abstract
We present SOFIA/FORCAST imaging of the dust surrounding the lumi-
nous blue variable (LBV) candidates MN 90 and HD 168625 to quantify
the mineral abundances of the circumstellar dust and constrain the evolu-
tionary state of these objects. Our image at 37.1 µm of MN 90 shows a
limb-brightened, spherical dust shell. Our images between 7.7 – 37.1 µm
of HD 168625 compliment previously obtained mid-IR imaging. The dust
color temperature and optical depth maps of HD 168625 show evidence for
the limb-brightened peaks of an equatorial torus. A least-squares fit to the
spectral energy distribution of MN 90 yields a dust temperature of 69 ± 3
K, with the peak of the emission at 42 µm. Similarly for HD 168625, we
4

5
estimate a dust temperature of 160± 7 K, with the peak of the emission at
18 µm. These results help to constrain models of LBV nebulae and their
circumstellar environments.
2.1 Introduction
It is widely recognized that luminous blue variables (LBVs) represent a post-main se-
quence phase in which massive stars (Mi ≥ 20 M� , Langer et al., 1994) lose a consid-
erable amount of mass via giant eruptions and minor outbursts. From the expansion
velocities of known LBV nebulae, a dynamical age of a few 104 years is usually in-
ferred, which points to a very short-lived evolutionary phase – only about 40 are known
(Clark et al., 2005; Weis, 2011; Naze et al., 2012). Although the category is still not
clearly defined, these objects exhibit a high luminosity (≥ 105.5 L�), low amplitude
photometric variability (∼ 0.1 mag) on timescales ranging from weeks to months, and a
larger, irregular photometric variability, called S Dor variability, with amplitudes of 1 –
2 mag occuring on timescales of years to decades with mass-loss rates of ∼ 10−5− 10−4
M� yr−1. In addition, some LBVs exhibit giant eruptions, η Car being the most famous
example (Humphreys et al., 1999). These giant eruptions are responsible for producing
circumstellar nebulae with sizes of about 1 – 2 pc and expansion velocities anywhere
from ∼ 10 km s−1 to ∼ 1000 km s−1 (as in the case of η Car, Weis, 2012) that are
then shaped by wind-wind interactions (van Marle et al., 2007). These nebulae can
have various morphologies; Weis (2011) estimates 50% are bipolar, 40% spherical, and
10% are irregular. The bipolar nebulae may be formed from density gradients in the
wind (Frank et al., 1995), different mass-loss episodes in which the wind changes from
equatorial to polar during the bistability jump (Smith et al., 2004), or the rotation of
the star (Dwarkadas & Owocki, 2002; Smith & Townsend, 2007). Thus, the morphology
of the nebula discloses the mass-loss history and evolutionary stage of the central star
and the circumstellar environment.
In this work we present 5 – 40 µm mid-IR observations with the Faint Object
infraRed CAmera for the SOFIA Telescope (FORCAST; Herter et al., 2012) instrument
on board the NASA Stratospheric Observatory for Infrared Astronomy (SOFIA; Becklin

6
et al., 2007; Gehrz et al., 2009; Young et al., 2012) of the two compact nebulae, MN
90 and HD 168625. By imaging these nebulae at a range of wavelengths, we can study
their structure, estimate the dust composition, and quantify the dust temperature and
total mass. These parameters will help to determine the physical properties of the
circumstellar environments and to constrain the importance of eruptive mass-loss in
post-main sequence stellar evolution. In Section 3.3 we summarize the observations and
data reduction strategies of the stars observed. Section 3.4.2 describes the axisymmetric
radiative transfer code 2-Dust and the derived dust geometry parameters and inferred
mass-loss histories. We discuss the results of our analysis of MN 90 and HD 168625 in
Section 3.6 and finally we provide the conclusions in Section 3.7.
MN 90 (central star 2MASS J18455593-0308297) was discovered and catalogued by
Gvaramadze et al. (2010) using the Multiband Imaging Photometer (MIPS; Rieke et al.,
2004) aboard the Spitzer Space Telescope (Werner et al., 2004; Gehrz et al., 2007) in
the MIPS Galactic Plane Survey (MIPSGAL; Carey et al., 2009), which mapped 278
deg2 of the inner Galactic plane: −65◦ < l < −10◦ and 10◦ < l < 65◦ for |b| < 1◦. It
is one of a large number of similar shells found in MIPSGAL images that resemble the
circumstellar nebulae of LBVs and late WN-type Wolf Rayet stars (WNL). The lack
of optical counterparts for most of them indicates they are highly obscured (Wachter
et al., 2010). Follow-up spectroscopy of some of the other MIPS Nebulae have revealed
them to be LBVs, candidate LBVs or early-type supergiants (see the summary list in
Kniazev et al., 2015). MN 90 is nearly circular and appears to be a limb-brightened
shell with a star at the center. The star is undetected in Swift UV images, Palomar
Observatory Sky Survey (POSS) visual images, and the ground-based visual images used
to make the HST Guide Star Catalog. The distance to MN 90 is unknown and there
is little information about its physical parameters. Wachter et al. (2010) included MN
90 along with a large sample of numerous similar shells for follow-up spectroscopy but
ultimately did not report any spectra for this particular star. Based on the analysis of
other stars in their sample, they grouped MN 90 along with other shells for which they
predict the stars are early-type. Naze et al. (2012) did not dectect any X-ray emission
from MN 90 in their XMM-Newton survey of a sample of known and candidate LBVs.
There is one other reference to MN 90 as a nebula; Mizuno et al. (2010) lists MN 90 as
MGE029.5086-00.2090, but other than reporting a MIPSGAL flux at 24 µm, there is

7
nothing more specific about the central star. We are unaware of any other imaging or
spectroscopy of MN 90 that may have been obtained. Hereafter we will use “MN 90”
to refer to both the nebula and the central star.
HD 168625 (IRAS 18184–1623) was first identified as a candidate LBV by Chentsov
& Luud (1989), who classified it as spectral type B5.6 ± 0.3 with T∗ ' 13000 K. Its
spectral type seems to vary from B2 (Popper & Seyfert, 1940) to B8 (Morgan et al.,
1955), although no dramatic light-variations have been been reported in the last 40
years (van Genderen et al., 1992; Sterken et al., 1999). The lack of evidence for large
variations kept HD 168625 from being classified as an LBV. However, it was found to
be LBV-like by Hutsemekers et al. (1994) who, using near-infrared (near-IR) and visible
imaging and spectroscopy, found a high mass-loss rate and a shell with two regions: an
inner 10′′×13′′ elliptical ring and a perpendicular outer horn-shaped region suggesting a
bipolar outflow. Nota et al. (1996) used deeper Hα imaging of the nebula to identify faint
filaments in the bipolar structure that extended to 16′′×21′′, indicating that a LBV-like
major outburst occurred ∼ 103 years ago. Given its curious characteristics, HD 168625
has been the focus of several additional studies. Meixner et al. (1999) included it in their
large, mid-infrared (mid-IR) proto-planetary nebula candidates survey and imaged it at
8.8, 12.5, and 20.6 µm, which revealed a toroidal dust shell. From mid-IR images at 4.7,
10.1, 11.6, and 19.9 µm, Robberto & Herbst (1998) used an analytical spherical model to
derive a dust temperature of 135 K and a dust mass of 2.8×10⁻³ M�. Similarly, Pasquali
et al. (2002) used mid-IR imaging at 4 and 11 µm to derive a dust temperature of 113
K, and a nebular expansion velocity of 19 km s−1 using ground-based echelle spectra.
O’Hara et al. (2003) modeled the morphology of the toroidal dust region using 2-Dust
and found a dust mass of 2.5±0.1×10⁻³ M�. Mahy et al. (2016) used far-infrared (far-
IR) imaging and spectroscopy with optical spectra to constrain the CNO abundances
of HD 168625 and the surrounding nebula to determine that the central star had an
initial mass between 28 – 33 M� and lost its material after the blue supergiant phase.
Smith (2007) was the first to question the origins of the filamentary bipolar structure
of the nebula around HD 168625 and argued against the interaction between a faster
wind of the star and slower ejections as a possible explanation, while other scenarios
involving either the evolution of a single star or interactions between two massive stars
were advanced. Namely, a single rotating star could eject an equatorial torus even if

8
it is not rotating at the critical speed. Presumably this can occur because the stars
approach or violate the classical Eddington limit during their giant eruptions when the
mass is ejected, allowing the star’s rotation to be more influential at the resulting lower
effective gravity. Taylor et al. (2014) found no evidence for a binary companion to HD
168625 from radial velocity monitoring and a modest rotation speed of 53 km s−1 . The
presence of a possible companion star was detected by Aldoretta et al. (2015) using
interferometric observations. A wide-orbit companion with a projected separation of
1.15′′ was later confirmed by Martayan et al. (2016) using adaptive optics images, but
there is no evidence that it is gravitationally bound to HD 168625 and is too distant
to have any impact on the shaping of the nebula. The role companions play in the
formation and evolution of LBV and LBV-like objects is still not well understood.
2.2 Observations & Data Reduction
The targets were observed with SOFIA/FORCAST during Guest Investigator (GI) Cy-
cles 2 and 3. Descriptions of the SOFIA Observatory and its science instrument (SI)
suite have been given by Becklin et al. (2007), Gehrz et al. (2009), and Young et al.
(2012).
FORCAST is a dual-channel mid-IR imager covering the 5 – 40 µm range. Each
channel uses a 256 × 256 pixel array and provides a distortion-corrected 3.2′ × 3.2′
field of view with a scale of 0.768′′ pix−1. The Short Wave Camera (SWC) uses a Si:As
blocked-impurity band (BIB) array optimized for λ < 25 µm, while the Long Wave
Camera’s (LWC) Si:Sb BIB array is optmized for λ > 25 µm. Observations were taken
in standard two-position chop-and-nod mode with the direction of the nod matching
the direction of the chop (NMC). The data were reduced by the SOFIA Science Center
using the FORCAST Redux v1.0.1β and v1.0.6 pipelines (Clarke et al., 2015) for HD
168625 and MN 90, respectively. After correction for bad pixels and droop effects, the
pipeline removed sky and telescope background emission by first subtracting chopped
image pairs and then subtracting nodded image pairs. The resulting positive images
were aligned and merged. The merged images were then coadded using a robust mean.
We observed MN 90 on UT 2015 July 3 during Guest Investigator (GI) Cycle 3 using
the F371 filter (λ0 = 37.1 µm ∆λ = 3.3 µm). The total coadded exposure time for

9
Table 2.1. Summary of SOFIA/FORCAST Observations of HD 168625
Filter λ0 ∆λ Exp. Time PSF FWHM(µm) (µm) (s) (arcsec)
F077 7.7 0.47 30 2.5′′
F111 11.1 0.95 30 2.5′′
F197 19.7 5.5 16 2.7′′
F253 25.3 1.86 25 3.0′′
F315 31.5 5.7 25 3.1′′
F336 33.6 1.9 31 3.1′′
F348 34.8 3.8 30 3.4′′
F371 37.1 3.3 26 3.5′′
the observation of MN 90 was 1553 sec (25.9 min). Observations of the asteroid Vesta
provided the PSF, with a near-diffraction-limited FWHM at 37.1 µm of 3.6′′.
We observed HD 168625 on UT 2014 June 13 during Guest Investigator (GI) Cycle
2 using eight different filters which are summarized in Table 2.1. Observations of Beta
Andromedae provided the PSF.
2.2.1 Spectral Energy Distributions
We present the IR spectral energy distributions (SEDs) of MN 90 and HD 168625 in Fig-
ure 2.1 and Figure 2.2, respectively. To supplement our newly acquired SOFIA/FORCAST
photometry, we also gathered archival data from the NASA/IPAC Infrared Science
Archive (IRSA; Berriman, 2008) database. These include photometry from the Two
Micron All-Sky Survey (2MASS; Skrutskie et al., 2006) at 1.25, 1.65, and 2.17 µm, the
AKARI satellite (Murakami et al., 2007) at 9 and 18 µm, the Wide-field Infrared Survey
Explorer (WISE ; Wright et al., 2010) at 3.4, 4.6, 12 and 22 µm, the Midcourse Space
Experiment (MSX ; Egan et al., 2003) at 8.3, 12.1, 14.7, and 21.3 µm the Spitzer MIPS
at 24 µm, and the Spitzer Infrared Array Camera (IRAC) Galactic Legacy Infrared Mid-
plane Survey Extraordinaire I (GLIMPSE I; Benjamin et al., 2003; Churchwell et al.,
2009) program at 3.6, 4.5, 5.8, and 8 µm. Photometry from our SOFIA/FORCAST
images and the Herschel (Pilbratt, 2003) Photoconductor Array Camera and Spec-
trometer (PACS; Poglitsch et al., 2010) at 70, 100, and 160 µm were obtained by using

10
aperture photometry after sky background subtraction. Note that in the longer wave-
length Herschel PACS/SPIRE images of MN 90 from 160 − 500 µm the dust shell is
no longer distinguishable above bright diffuse background emission. For HD 168625 we
further include the Infrared Astronomical Satellite (IRAS ; Neugebauer et al., 1984) Low
Resolution Spectrometer (LRS) spectra from Volk & Cohen (1989).
We model the dust shell flux as equilibrium thermal emission from dust grains all at
a single radius rd from the star. We assume the grains’ emissivity behaves as a power
law with Qabs ∝ λ−β. We adopt a power-law index of β = 1.0, which is a typical value
for the circumstellar dust of evolved stars (e.g., Knapp et al. (1993)). For MN 90, a
least-squares fit of a λBλ(T ) curve modified with this emissivity yields Td = 69± 3 K,
with the peak of the emission at λ = 42 µm. For HD 168625, a least-squares fit of a
λBλ(T ) curve modified with this emissivity Qabs ∝ λ−1 yields Td = 160± 7 K, with the
peak of the emission at λ = 18 µm.
2.2.2 MN 90
Our FORCAST 37.1 µm image of MN 90 is shown in Figure 2.3. The nebula is clearly
resolved, with a radius of ∼ 30′′. It is nearly circular, with brightened limbs slightly
enhanced towards the southeast. The appearance is consistent with previously obtained
images at 24, 37.1 and 70 µm. Based on its appearance we will analyze the nebula as
a thin, hollow shell whose far-IR spectrum is due to equilibrium thermal emission from
dust grains all at the same distance from the star. This type of shell can result, for
example, when a post-red supergiant (post-RSG) star has developed a fast wind during
an LBV phase which sweeps up gas and dust lost during the previous RSG phase (Smith,
2014).
2.2.3 HD 168625
The FORCAST images of HD 168625 are shown in Figure 2.4. The nebula is clearly
resolved, with a partially complete ring structure that has two peaks almost symmetric
around the star. We concur with Meixner et al. (1999); O’Hara et al. (2003) in their
interpretation of these two peaks as limb-brightened peaks of a torus of dust with a
radius of ∼ 15′′. The appearance is consistent with previously obtained images at 8.8,

11
100 101 102
λ (µm)
10−15
10−14
10−13
10−12
10−11
λFλ
(W m
2)
MN 90
Bλ(69 K)
2Dust Model
2MASS
MSX
IRAC
AKARI
WISE
Herschel
SOFIA
MIPS
Figure 2.1 – Observed and model SEDs of MN 90. The reddened model SED is shownas a solid blue line. The dashed lines are the best fitting Qabs(λ) · λBλ(Td) functionswith an assumed power law emissivity Qabs(λ) ∝ λ−1, which yields Td = 69± 3 K withthe peak of the emission at λ = 42 µm. Photometry data points are from this work(SOFIA) and archival databases.

12
100 101 102
λ (µm)
10−13
10−12
10−11
10−10
10−9
λFλ
(W m
2)
HD 168625
Bλ(160 K)
IRAS LRS
2Dust Model
2MASS
IRAC
MSX
AKARI
Herschel
IRAS
SOFIA
Figure 2.2 – Observed and model SEDs of HD 168625. The reddened model SED isshown as a solid blue line. The solid black line is the IRAS LRS (Volk & Cohen, 1989).The dashed line is the best fitting Qabs(λ)·λBλ(Td) function with an assumed power lawemissivity Qabs(λ) ∝ λ−1, which yields Td = 160 ± 7 K with the peak of the emissionat λ = 18 µm. Photometry data points are from this work (SOFIA), and archivaldatabases.

13
12.5, and 20.6 µm from Meixner et al. (1999) and PACS 70 µm images (Groenewegen
et al., 2011). It is important to mention, that our SOFIA/FORCAST images do not
detect the outer polar rings seen in Spitzer IRAC images (Smith, 2007), suggesting the
rings must be cold. Figure 2.5 shows the temperature and optical depth maps that are
derived from the SOFIA/FORCAST 11.1 and 34.8 µm images by following the method
described by Dayal et al. (1998). Our temperature map estimates torus temperatures
of ∼ 165, which is in agreement with the estimate of 160 K obtained from our least-
squares fit to the IR excess but is slightly higher than the equilibrium temperature
estimates made by Pasquali et al. (2002, 113 K), Robberto & Herbst (1998, 135 K)
and O’Hara et al. (2003, 130 K). The map predicts optical depths between 8 × 10⁻⁵
and 3× 10⁻⁴, about a factor of ten lower than our model predicts, but in line with the
results of O’Hara et al. (2003). This indicates that the nebula is optically thin and the
east and west emission peaks coincide with the regions in which the optical depth is
high, confirming the interpretation that we are observing the limb-brightened edges of
an optically thin edge-on dust torus surrounding the central star.
2.2.4 IR Reddening
The mid-IR photometry (5 – 40 µm) must be de-reddened for comparison with the
2-Dust model SED outputs, or conversely, the 2-Dust SEDs must be reddened, as we
have done. We used the Fritz et al. (2011) extinction law as it utilizes the most recent
near-IR (1 – 2.4 µm) observations of the galactic center. We extend the law longward
of 24 µm by adopting the Draine (2003) interstellar extinction curve defined in Figure
10 of that paper, as was done by Lau et al. (2013). We scaled the AKsof the Fritz et al.
(2011) extinction law based on the distance to the objects. We accomplished this by
utilizing the 3-D Milky Way dust map of Green et al. (2015) to estimate the extinction.
We then converted from extinction to reddening by assuming AKs= 0.320× E(B−V),
as calculated by Yuan et al. (2013) for a 7000 K source spectrum at E(B−V) = 0.4
mag, using the Cardelli et al. (1989) reddening law and assuming RV = 3.1.
As previously mention in Section 2.1, the distance to MN 90 is unknown. In the
absence of further information about the star beyond the catalogued 1.2 − 8 µm pho-
tometry, we consider the implications of assuming that MN 90 is an LBV. We assume a

14
luminosity of L? = 3× 10⁵ L�, at the lower end of luminosities for LBVs in their quies-
cent state between outbursts (see e.g. Figure 1 of Smith et al., 2004). This luminosity
corresponds to T? ≈ 14000 K. For dust grains with emissivity Qabs(λ) ∝ λ−β, the radius
rd of the shell may be computed with:
r2d =
L?16πσT 4
d
(T?Td
)β(2.1)
where Td is the grains’ equilibrium temperature. Substituting the assumed values for
the star and the fitted Td = 69 K obtained using β = 1.0 yields rd = 0.6 pc. For the
shell’s observed angular radius of 30′′ this places MN 90 at a distance of 4.2 kpc. At
this distance we estimate a reddening of AKs= 0.52 for MN 90.
The distance to HD 168625 is also not well known. Hutsemekers et al. (1994) and
Nota et al. (1996) assumed HD 168625 had a distance of 2.2 kpc, the same distance
as the neighboring Omega Nebula (M17). Robberto & Herbst (1998) used infrared
(IR) observations and estimates of stellar parameters to obtain a distance of 1.2 kpc.
Whereas, a kinematic distance of 2.8 kpc was derived by Pasquali et al. (2002). HD
168625 is only 1′ away from the LBV HD 168607. Both are found in the outskirts of the
star-forming region M17, and are thought to be part of the larger Ser OB1 association
at ∼ 2.2 kpc (Chentsov & Gorda, 2004). The Gaia DR1 distance to HD 168607 is
0.98 ± 0.27 kpc or 1.16 ± 0.35 kpc using the ABJ parallaxes (Smith & Stassun, 2017).
Given its association with HD 168607, we adopt a distance of 1.2 kpc for HD 168625.
We estimate a reddening of AKs= 0.27 for HD 168625. Note that any visual wavelength
values are subject to considerable uncertainty, as Fritz et al. (2011) points out that there
are several possible extrapolations from their anchor region around Brackett-γ (2.166
µm) into the visual.
2.3 Radiative Transfer Modeling
2.3.1 2-Dust Introduction
We utilize the the axisymmetric radiative transfer code 2-Dust (Ueta & Meixner, 2003)
to estimate the stellar parameters and dust shell morphology of MN 90 and HD 168625.
The code solves the equation of radiative transfer following the principle of long char-
acteristic (i.e. traces the radiation hitting the dust grain from anywhere in the shell
15
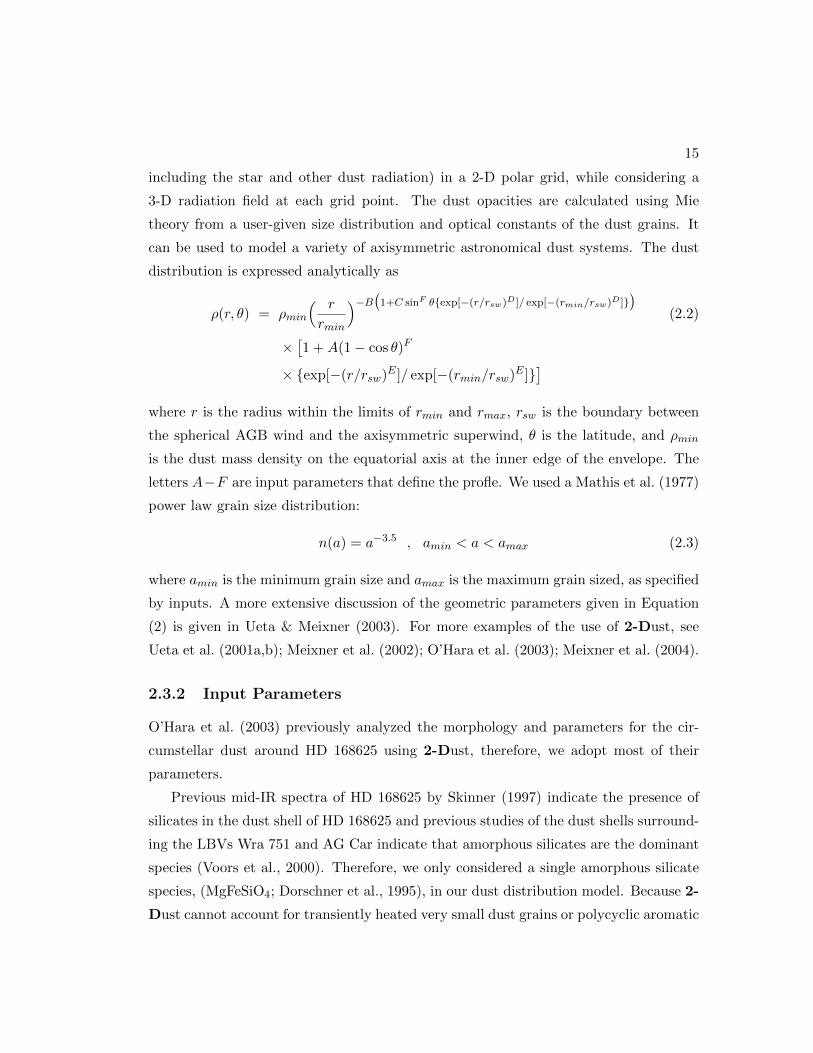
including the star and other dust radiation) in a 2-D polar grid, while considering a
3-D radiation field at each grid point. The dust opacities are calculated using Mie
theory from a user-given size distribution and optical constants of the dust grains. It
can be used to model a variety of axisymmetric astronomical dust systems. The dust
distribution is expressed analytically as
ρ(r, θ) = ρmin
( r
rmin
)−B(1+C sinF θ{exp[−(r/rsw)D]/ exp[−(rmin/rsw)D]})
(2.2)
×[1 +A(1− cos θ)F
× {exp[−(r/rsw)E ]/ exp[−(rmin/rsw)E ]}]
where r is the radius within the limits of rmin and rmax, rsw is the boundary between
the spherical AGB wind and the axisymmetric superwind, θ is the latitude, and ρmin
is the dust mass density on the equatorial axis at the inner edge of the envelope. The
letters A−F are input parameters that define the profle. We used a Mathis et al. (1977)
power law grain size distribution:
n(a) = a−3.5 , amin < a < amax (2.3)
where amin is the minimum grain size and amax is the maximum grain sized, as specified
by inputs. A more extensive discussion of the geometric parameters given in Equation
(2) is given in Ueta & Meixner (2003). For more examples of the use of 2-Dust, see
Ueta et al. (2001a,b); Meixner et al. (2002); O’Hara et al. (2003); Meixner et al. (2004).
2.3.2 Input Parameters
O’Hara et al. (2003) previously analyzed the morphology and parameters for the cir-
cumstellar dust around HD 168625 using 2-Dust, therefore, we adopt most of their
parameters.
Previous mid-IR spectra of HD 168625 by Skinner (1997) indicate the presence of
silicates in the dust shell of HD 168625 and previous studies of the dust shells surround-
ing the LBVs Wra 751 and AG Car indicate that amorphous silicates are the dominant
species (Voors et al., 2000). Therefore, we only considered a single amorphous silicate
species, (MgFeSiO4; Dorschner et al., 1995), in our dust distribution model. Because 2-
Dust cannot account for transiently heated very small dust grains or polycyclic aromatic

16
hydrocarbon (PAH) emission, which has been observed in previous observations(Volk
& Cohen, 1989; Skinner, 1997; Umana et al., 2010), we ignore fitting the 2-Dust model
to the 8 – 15 µm region. There is also evidence of crystalline forsterite grains being
present (Blommaert et al., 2014), which may contribute to the emission at ∼ 11 and 19
µm seen in the IRAS LRS.
Most estimates of the effective temperature of the central star of HD 168625 are
between 12000 – 15000 K (Nota et al., 1996; O’Hara et al., 2003; Mahy et al., 2016),
and may vary by a few thousand degrees. The temperature and radius of the star have
been adjusted to roughly match the observed SED. However, since the data points are
taken by many observers over several decades, we cannot model HD 168625 at any single
epoch. The inner radius of the dust shell is well constrained by these mid-IR images to
be 8.5′′ or 0.05 pc at a distance of 1.2 kpc.
As previously mentioned, little is know about MN90 and the central star. We use
the SOFIA/FORCAST 37.1 µm image to constrain the angular size of rmin to a value
of 20′′ or 0.41 pc at a distance of 4.2 kpc. We started with a stellar temperature of
14000 K and radius 100 R�. Like HD 168625, the temperature and radius of the star
have been adjusted to roughly match the observed SED and we used a single species
dust distribution of amorphous silicates.
2.3.3 Model Results
We ran 150 models to obtain the best fit to the SED and SOFIA/FORCAST images of
both stars. The best fit SEDs of MN 90 and HD 168625 are shown in Figures 2.1 and
2.2. Input dust distribution parameters for both stars are given in Table 2.2. Derived
stellar and dust parameters for the best fit models of MN 90 and HD 168625 are given
in Tables 2.3 and 2.4.
The model SED for MN 90 fits the data well in the wavelength region λ ≥ 8 µm. The
discrepancy at shorter wavelengths may be due to the choice of the anchor region for the
reddening as discussed in Section 2.2.4, an underestimate in the distance, or incorrect
stellar parameters. Our model image of MN 90 compares well with the FORCAST
37.1 µm image except for the northwest edge of the shell which appears brighter in
the FORCAST image suggesting that the shell is slightly asymmetric. However, the
morphology of the dust shell is well modeled as a symmetric sphere. We found the best

17
-30” -20” -10” 0 10” 20” 30”
∆ RA (arcsec)
-30”
-20”
-10”
0
10”
20”
30”∆
DE
C(a
rcse
c)
37.1 (µm)
-30” -20” -10” 0 10” 20” 30”
∆ RA (arcsec)
-30”
-20”
-10”
0
10”
20”
30”37.1 (µm)
0.005 0.010 0.015 0.020
(Jy arcsec−2)
-30”
-20”
-10”
0
10”
20”
30”
Figure 2.3 – Observed SOFIA/FORCAST image (left) and 2-Dust model image (right)of MN 90 at 37.1 µm with north up and east to the left. The models have been scaled tothe same total flux as the observed image and convolved with a Gaussian with FWHMequal to the matching PSF of the SOFIA/FORCAST image (inset white circle). Inthe observed SOFIA/FORCAST image, the contours are spaced at 1σ, 2σ, and 3σintervals above the background noise. In the 2-Dust model, the contours are space at20% intervals of the peak intensity. The central star is not included in the model.
Table 2.2. 2-Dust Density Function Parameters for the Best-Fit Models
Parameter MN 90 HD 168625
A 1 31B 2 2C 2.5 4D 0 6E 0 3F 0 4θinc 0◦ 55◦
τ37.1µm at eq. 6× 10⁻⁴ 5× 10⁻³

18
-30” -20” -10” 0 10” 20” 30”
∆ RA (arcsec)
-30”
-20”
-10”
0
10”
20”
30”
∆D
EC
(arc
sec)
7.70 (µm)
-30” -20” -10” 0 10” 20” 30”
∆ RA (arcsec)
-30”
-20”
-10”
0
10”
20”
30”7.70 (µm)
0.000 0.025 0.050 0.075 0.100
(Jy arcsec−2)
-30”
-20”
-10”
0
10”
20”
30”
(a) FORCAST F077
-30” -20” -10” 0 10” 20” 30”
∆ RA (arcsec)
-30”
-20”
-10”
0
10”
20”
30”
∆D
EC
(arc
sec)
11.1 (µm)
-30” -20” -10” 0 10” 20” 30”
∆ RA (arcsec)
-30”
-20”
-10”
0
10”
20”
30”11.1 (µm)
0.00 0.08 0.16 0.24
(Jy arcsec−2)
-30”
-20”
-10”
0
10”
20”
30”
(b) FORCAST F111

19
-30” -20” -10” 0 10” 20” 30”
∆ RA (arcsec)
-30”
-20”
-10”
0
10”
20”
30”
∆D
EC
(arc
sec)
19.7 (µm)
-30” -20” -10” 0 10” 20” 30”
∆ RA (arcsec)
-30”
-20”
-10”
0
10”
20”
30”19.7 (µm)
0.00 0.25 0.50 0.75 1.00
(Jy arcsec−2)
-30”
-20”
-10”
0
10”
20”
30”
(c) FORCAST F197
-30” -20” -10” 0 10” 20” 30”
∆ RA (arcsec)
-30”
-20”
-10”
0
10”
20”
30”
∆D
EC
(arc
sec)
25.3 (µm)
-30” -20” -10” 0 10” 20” 30”
∆ RA (arcsec)
-30”
-20”
-10”
0
10”
20”
30”25.3 (µm)
0.0 0.2 0.4 0.6 0.8
(Jy arcsec−2)
-30”
-20”
-10”
0
10”
20”
30”
(d) FORCAST F253

20
-30” -20” -10” 0 10” 20” 30”
∆ RA (arcsec)
-30”
-20”
-10”
0
10”
20”
30”
∆D
EC
(arc
sec)
31.5 (µm)
-30” -20” -10” 0 10” 20” 30”
∆ RA (arcsec)
-30”
-20”
-10”
0
10”
20”
30”31.5 (µm)
0.0 0.2 0.4 0.6
(Jy arcsec−2)
-30”
-20”
-10”
0
10”
20”
30”
(e) FORCAST F315
-30” -20” -10” 0 10” 20” 30”
∆ RA (arcsec)
-30”
-20”
-10”
0
10”
20”
30”
∆D
EC
(arc
sec)
33.6 (µm)
-30” -20” -10” 0 10” 20” 30”
∆ RA (arcsec)
-30”
-20”
-10”
0
10”
20”
30”33.6 (µm)
0.00 0.25 0.50 0.75 1.00
(Jy arcsec−2)
-30”
-20”
-10”
0
10”
20”
30”
(f) FORCAST F336

21
-30” -20” -10” 0 10” 20” 30”
∆ RA (arcsec)
-30”
-20”
-10”
0
10”
20”
30”∆
DE
C(a
rcse
c)
34.8 (µm)
-30” -20” -10” 0 10” 20” 30”
∆ RA (arcsec)
-30”
-20”
-10”
0
10”
20”
30”34.8 (µm)
0.0 0.2 0.4 0.6 0.8
(Jy arcsec−2)
-30”
-20”
-10”
0
10”
20”
30”
(g) FORCAST F348
-30” -20” -10” 0 10” 20” 30”
∆ RA (arcsec)
-30”
-20”
-10”
0
10”
20”
30”
∆D
EC
(arc
sec)
37.1 (µm)
-30” -20” -10” 0 10” 20” 30”
∆ RA (arcsec)
-30”
-20”
-10”
0
10”
20”
30”37.1 (µm)
0.0 0.2 0.4 0.6 0.8
(Jy arcsec−2)
-30”
-20”
-10”
0
10”
20”
30”
(h) FORCAST F371
Figure 2.4 – Observed SOFIA/FORCAST image (left) and 2-Dust model image (right)of HD 168625 at (a) 7.7 µm, (b) 11.1 µm, (c) 19.7 µm, (d) 25.3 µm, (e) 31.5 µm, (f)33.6 µm, (g) 34.8 µm, and (h) 37.1 µm with north up and east is to the left. Themodels have been scaled to the same total flux as the observed image and convolvedwith a Gaussian with FWHM equal to the matching PSF of the SOFIA/FORCASTimage (inset white circle). In the observed SOFIA/FORCAST images, the contours arespaced at 1σ, 2σ, and 3σ intervals above the background noise. In the 2-Dust model,the contours are space at 20% intervals of the peak intensity. The central star is notincluded in the model.

22
-30" -20" -10" 0 10" 20" 30" RA (arcsec)
-30"
-20"
-10"
0
10"
20"
30" D
EC (a
rcse
c)Temperature
-30" -20" -10" 0 10" 20" 30" RA (arcsec)
-30"
-20"
-10"
0
10"
20"
30"37.1
130 140 150 160 170Temperature (K)
8e-05 2e-04 2e-04 3e-04 4e-0437.1
-30"
-20"
-10"
0
10"
20"
30"
Figure 2.5 – Temperature map (left) and optical depth map at 37.1 µm (right) of HD168625. Temperature contours go from 125 to 175 K with an interval of 5 K. The opticaldepth map has contours from 2 × 10⁻⁵ to 4 × 10⁻⁴ at intervals of 4 × 10⁻⁵. In bothimages, spurious data around the edges have been removed.
fit density distribution had an amorphous silicate shell extending from rmin = 0.31 pc
to 3rmin = 0.92 pc. The grain size distribution suggests that the silicates had grain
sizes between 0.1 – 0.5 µm. Our model gives a dust mass of 2.5× 10⁻² M� and a dust
mass-loss rate of 8.3× 10⁻⁶ M� yr−1 .
The model SED for HD 168625 fits the data well in most of the wavelength range
except for 8 – 15 µm for the reasons mentioned in Section 2.3.2. We confirm the dust
distribution model of O’Hara et al. (2003) with only minor differences in the stellar
temperature, radius and grain size distribution. The morphology of the dust is found to
be a disk-like shell with an equator-to-pole density ratio of 31, an elliptical midshell, and
an inclination angle of 55◦ with the plane of the sky. Our model images compare well
with the FORCAST observations except for the gap in the northern rim of the 7.7 µm
emission and the gap in the southern rim of the 19.7, 25.3, 31.5, and 33.6 µm, emission
which may indicate the lack of large dust grains in this region or a different composition.
This supports the suggestion that the dust shell may include small, transiently heated
dust grains that are not at thermal equilibrium and are not accounted for in these

23
Table 2.3. MN 90 2-Dust Input and Derived Parameters
Input
L∗ ∝ d 7.1× 10⁴ L�T∗ 14000 K
R∗ ∝ d 85 R�d 4.2 kpc
ISM AKs 0.52rmin ∝ d 0.31 pcrmax ∝ d 0.92 pcrsw ∝ d 0.46 pcamin 0.1 µmamax 0.5 µmvexp
a 50 km s−1
Composition Amorphous Silicatesb
Derived
Mdust ∝ d2 2.5× 10⁻² M�Mdust ∝ d2 8.3× 10⁻⁶ M� yr
−1
τAGBc ∝ d 3.4× 10³ yr
aTypical for LBVs (Nota et al., 1995)
bMgFeSiO4 (Dorschner et al., 1995)
cTimescale for mass-loss on the AGB

24
models. The grain size distribution suggests that grain sizes between 0.001 – 0.5 µm
exist in the circumstellar environment. Our model gives a dust mass of 2.4×10⁻³ M�and
a dust mass-loss rate of 1.3× 10⁻⁷ M� yr−1 . This is likely an underestimate the mass
because we are only looking at material in the equator, ∼ 10 – 20% of the solid angle
of the entire nebula. The bipolar nebula seen in Spitzer images suggests that the
circumstellar material at higher latitudes was ejected with higher speed, and therefore
it is farther from the star and cooler, which went undetected in the SOFIA imaging
that only detects the inner torus. The model suggests that HD 168625 lost mass in a
torus-shaped outburst, which has been suggested for all LBVs by Hutsemekers et al.
(1994). The current fast wind of the LBV has probably interacted with this torus,
creating an elliptical bubble perpendicular to the plane of the torus, which is consistent
with a unified model of LBV nebulae proposed by Nota et al. (1995).
2.4 Discussion
As previously mentioned in Section 2.3.2, crystalline forsterite has been detected around
HD 168625. This indicates that at least some of the circumstellar material, probably
that confined to the torus, has undergone annealing and suggests that the circumstellar
environment is similar to that of lower mass progenitors i.e. proto-planetary nebulae
(PPNe). We should point out that our model for HD 168625 included moderately
sized grains (0.1 – 0.5 µm) as did the model found by O’Hara et al. (2003, 0.001 – 1.0
µm) which points to the nebula being relatively young and unprocessed. Aside from
the similarities in morphology between PPN and LBVs, a key difference may be the
duration of mass-loss. Far-IR images at 55 µm of HD 168625 by O’Hara et al. (2003)
suggests that the outer dust shell is no more than 5 times the inner radius. Whereas,
for the Egg Nebula, a well-studied PPN, 180 µm images suggest that the outer shell is a
few hundred times larger than the inner radius (Speck et al., 2000). The mass-loss shells
of LBVs appear to be more compressed than for PPNs, suggesting that the mass-loss
occurred in a more short-lived (< 104 yr) phase compared with PPNs (∼ 105 yr).

25
Table 2.4. HD 168625 2-Dust Input and Derived Parameters
Input
L∗ ∝ d 2.5× 10⁴ L�T∗ 12000 K
R∗ ∝ d 60 R�d 1.2 kpc
ISM AKs 0.27rmin ∝ d 0.05 pcrmax ∝ d 0.26 pcrsw ∝ d 0.15 pcamin 0.001 µmamax 0.5 µmvexp
a 19 km s−1
Composition Amorphous Silicatesb
Derived
Mdust ∝ d2 2.4× 10⁻³ M�Mdust ∝ d2 1.3× 10⁻⁷ M� yr
−1
τAGBc ∝ d 7.6× 10³ yr
aPasquali et al. (2002)
bMgFeSiO4 (Dorschner et al., 1995)
cTimescale for mass-loss on the AGB

26
2.4.1 HD 168625
Mahy et al. (2016) used Herschel/PACS spectroscopy and CNO abundances to estimate
an initial mass of 28 – 33 M� for HD 168625 and propose that the star lost its mass
during or just after the blue supergiant (BSG) phase and has not yet reached the red
supergiant (RSG) phase. Furthermore, they found that single star evolutionary tracks
were able to explain the N content between the nebula and the central star. This depends
on the assumption that the star is a single star, whereas Smith & Tombleson (2015)
argue that LBVs may be the product of binary evolution. As mentioned in Section 2.1,
a wide-orbit binary companion to HD 168625 has been observed, but the influence this
companion has on the evolution and morphology of HD 168625 is negligible. Given that
no X-ray emission has been observed (Naze et al., 2012) rules out mass transfer via Roche
lobe overflow. The rotation rate of HD 168625 is estimated to be 53 km s−1 (Taylor
et al., 2014) which is not high enough to explain the bipolar structure based on rotation
or binary merger. Furthermore, no companion has been detected in radial velocity
monitoring.
If we use the canonical gas-to-dust ratio of 100 we estimate a total (gas plus dust)
shell mass-loss rate of 1.4 × 10⁻⁵ M� yr−1 and a total mass of 0.24 M� . This is likely
an underestimate of the mass because we are only looking at material in the equatorial
torus. Dividing our value for rmin = 0.05 pc by the nebular expansion velocity measured
by Pasquali et al. (2002) gives an expansion time of ' 2600 yr, and using our value of
rmax = 0.26 pc, the mass-loss lasted for ' 1×10⁴ yr. As noted in Table 2.4, the 2-Dust
estimates for the dust mass and mass-loss rate are proportional to the distance squared
and given the uncertainty in the distance to HD 168625 the values we have estimated
in this work should be interpreted with appropriate caution.
2.4.2 MN 90
The morphology of MN 90 lacks a large equator-to-pole mass distribution like most
LBVs and is nearly spherical, similar to V4998 Sgr (Lau et al., 2014). The total mass
(gas plus dust) lost by the star and the rate of mass-loss are estimated to be about
2.5 M� and 8.4× 10⁻⁴ M� yr−1 using the canonical gas-to-dust ratio of 100. Dividing
our value for rmin = 0.31 pc by an assumed expansion velocity of 50 km s−1 gives an

27
estimated expansion time of ' 6000 yr and using our value of rmax = 0.92 pc, we
estimate the mass-loss lasted for ' 1.2 × 10⁴ yr. As noted in Table 2.3, the 2-Dust
estimates for the dust mass and mass-loss rate are proportional to the distance squared
and given the distance to MN 90 is unknown the values we have estimated in this work
should be interpreted as hypothetical.
Based on the mid-IR morphology and results from radiative transfer calculations,
MN 90 is a very luminous star surrounded by an optically thin possibly oxygen rich
dust shell located at about 4.2 kpc. However, given the uncertainties in the distance
and stellar parameters, no strong conclusions about the nature of MN 90 can be made.
It is necessary to observationally uncover the physical characteristics of the central star
to determine the exact evolutionary status of MN 90. Because MN 90 is not visible
in the optical due to heavy extinction, near-IR spectroscopic information is needed
to constrain the physical parameters for the central star. Furthermore, continuous
near-IR photometry to better characterize the variability of the source would be useful.
Regardless of the exact evolutionary status, MN 90 seems highly likely to be an evolved,
massive post-main sequence star.
2.5 Conclusion
Our SOFIA/FORCAST images between 7.7 – 37.1 µm of HD 168625 compliment pre-
viously obtained mid-IR imaging. The dust color temperature and optical depth maps
that we derive from our observations show evidence for the limb-brightened peaks of an
equatorial torus and for very small, transiently heated dust grains. A least-squares fit
of a λBλ(Td) curve with emissivity Qabs(λ) ∝ λ−1 to the SED of HD 168625 yields an
estimated dust temperature of 160± 7 K, with the peak of the emission at 18 µm. Our
detailed radiative transfer model using 2-Dust supports the claim that the dust resides
in a thin, axisymmetric dust shell and estimates that HD 168625 lost 2.4× 10⁻³ M� of
dust in a massive stellar wind with a mass-loss rate of 1.3 × 10⁻⁷ M� yr−1 that ended
approximately 2600 years ago. Using a canonical gas-to-dust ratio of 100 we estimate
a total mass-loss of 0.24 M� for HD 168625 which is a lower limit given we are only
observing the inner equatorial torus, ∼ 10 – 20% of the solid angle of the entire nebula.
These 2-Dust estimates assume that HD 168625 has a luminosity of 2.5 × 10⁴ L�, at

28
the lower end of luminosities of LBVs in their quiescent state, and a distance of 1.2 kpc.
Our SOFIA/FORCAST image at 37.1 µm of MN 90 shows a limb-brightened, spher-
ical dust shell surrounding the central star. A least-squares fit of a λBλ(Td) curve with
emissivity Qabs(λ) ∝ λ−1 to the SED of MN 90 yields a dust temperature of 69± 3 K,
with the peak of the emission at 42 µm. Our 2-Dust model supports the idea that the
dust resides in a thin, spherical dust shell and estimates that MN 90 lost 2.5 × 10⁻²
M� of dust in a massive stellar wind with a mass-loss rate of 8.3× 10⁻⁶ M� yr−1 that
ended approximately 6000 years ago. These 2-Dust estimates assume that MN 90 has
a luminosity of 7.1×10⁴ L�, at the lower end of luminosities of LBVs in their quiescent
state, and a distance of 4.2 kpc. Using the canonical gas-to-dust mass ratio of 100, we
estimate a total mass-loss of 2.5 M� for MN 90. Our 2-Dust model of MN 90 has good
agreement with observations if we assume very small, transiently heated silicate grains.
With a more direct and reliable measurement of the distances to MN 90 and HD
168625, more accurate dust mass and mass-loss rates could be estimated. The un-
certainty in the distance to MN 90 and the limited information regarding its physical
parameters make it a prime candidate for follow-up observations and photometric mon-
itoring.

Chapter 3
A SOFIA/FORCAST Grism
Study of the Mineralogy of Dust
in the Winds of Proto-planetary
Nebulae: RV Tauri Stars and
SRd Variables
This chapter has been published in the Astrophysical Journal with the fol-
lowing bibiliographic reference: Arneson, R. A., Gehrz, R. D., Woodward,
C. E., et al. 2017, ApJ, 843, 51
Abstract
We present a SOFIA/FORCAST grism spectroscopic survey to examine the
mineralogy of the circumstellar dust in a sample of post-asymptotic giant
branch yellow supergiants that are believed to be the precursors of plane-
tary nebulae. Our mineralogical model of each star indicates the presence of
both carbon rich and oxygen rich dust species–contrary to simple dredge-up
models–with a majority of the dust in the form of amorphous carbon and
29

30
graphite. The oxygen rich dust is primarily in the form of amorphous sili-
cates. The spectra do not exhibit any prominent crystalline silicate emission
features. For most of the systems, our analysis suggests that the grains are
relatively large and have undergone significant processing, supporting the
hypothesis that the dust is confined to a Keplerian disk and that we are
viewing the heavily processed, central regions of the disk from a nearly face-
on orientation. These results help to determine the physical properties of the
post-AGB circumstellar environment and to constrain models of post-AGB
mass loss and planetary nebula formation.
3.1 Introduction
RV Tauri and yellow semi-regular (SRd) variables are two classes of post-asymptotic
giant branch (post-AGB) stars that lie along the horizontal track on the Hertzsprung-
Russell (H-R) diagram linking AGB stars to planetary nebulae (PNe). They are thought
to be the immediate precursors of PNe and have been termed “proto-planetary nebulae”
(PPNe)1 . RV Tauri stars are characterized by semi-regular, bimodal variability (pos-
sibly resulting from interaction with a binary companion; Waelkens & Waters, 1993;
Percy, 1993; Fokin, 1994), a high mass-loss rate, and often a prominent infrared (IR)
excess. SRd variables are similar to RV Tauri stars in many respects but are probably
single star systems, as indicated by the absence of regular pulsations (Percy & Ursprung,
2006).
RV Tauri stars are a loosely defined subclass of Population II Cepheid variables
named after the prototype RV Tau. They are defined as luminous (I-II) mid-F to
K supergiants with a typical mass of ∼ 0.7 M� (Tuchman et al., 1993; Fokin, 1994)
that show alternating deep and shallow minima in their light curves (Preston et al.,
1963). They have formal periods (defined as the time between successive deep minimia)
between 30 and 150 days, but cycle-to-cycle variability is common, and the amplitudes
may reach up to 4 magnitudes in V (Percy, 1993). RV Tauri stars are divided into two
1 The phrase “proto-planetary” is also widely used by the exoplanetary and planet formation commu-nities to refer to dusty disks around young stars. Also note that in the literature the terms preplanetaryor proto-planetary nebulae have been used interchangeably with the term post-AGB objects.

31
photometric classes (‘a’ and ‘b’) based on their light curves (Kukarkin, 1958). The RVa
class contains constant mean magnitude stars, and the RVb class contains stars that have
a varying mean magnitude with a period of 600 to 1500 days. There are several possible
explanations for these light variations. One explanation for the alternating minima is
that there is a resonance between the fundamental period and the first overtone (Takeuti
& Petersen, 1983; Shenton et al., 1992; Tuchman et al., 1993; Fokin, 1994). Another
possibility is that the light variations are due to a geometrical projection effect where
the pulsating star is periodically obscured by a circumbinary disk (Van Winckel et al.,
1999; Maas et al., 2002).
Preston et al. (1963) classified the RV Tauri stars into three spectroscopic classes
(‘A’, ‘B’, ‘C’). RVA stars are spectral type G – K, and show strong absorption lines and
normal CN or CH bands while TiO bands sometimes appear at photometric minima.
RVB stars are generally hotter spectral types, weaker lined, and show enhanced CN
and CH bands. RVC stars are also weak lined but show normal CN and CH molecular
bands. There is no correlation between the photometric and spectroscopic classes.
It has long been known (Gehrz & Woolf, 1970; Gehrz, 1972; Gehrz & Ney, 1972)
that some RV Tauri stars (e.g. AC Her, U Mon, R Sct, R Sge) show very strong
thermal IR emission from circumstellar dust. Observations by the Infrared Astronomical
Satellite (IRAS ) confirmed these previous detections and increased the sample size.
IRAS detected considerable cool, circumstellar dust around many of the RV Tauri
stars, which has been interpreted as being due to strong, dusty mass-loss during AGB
evolution (Jura, 1986). From CO observations, Alcolea & Bujarrabal (1991) suggest
a mass loss rate of 4 × 10⁻⁷ to 7 × 10⁻⁶ M�yr−1 within the last 102 to 103 years for
most of the RV Tauri stars. Because of their position on the H-R diagram, variability,
high mass-loss rate and rarity (about 110 are known), it is generally believed that RV
Tauri stars represent a relatively short-term, unstable transitional phase between the
AGB and PNe phases of solar-mass stars. If RV Tauri stars are assumed to be evolving
on the post-AGB track, models predict that they spend about 200 years as variables
and take about 1000 years to go from AGB to PNe (Schoenberner, 1983; Percy et al.,
1991; Fokin, 1994), however some (e.g. R Sct) are “lazy”, spend more time in the RV
Tauri stage as evidenced by their mass loss history, have higher CO emission, and show
a relatively low IR excess in the 5 – 20 µm range but a larger IR excess for λ & 50

32
µm (Bujarrabal et al., 1988; Alcolea & Bujarrabal, 1991). The lack of a near-IR excess
and the presence of a large mid- and far-IR excess is evidence for a thick and extended
dust envelope that is relatively cool. The detection of SiO around R Sct could be an
indication of on-going, weak mass loss (Bujarrabal et al., 1989). Alcolea & Bujarrabal
(1991) estimate that ∼ 1/5 RV Tauri stars exhibit this “lazy” evolutionary behavior.
Interestingly, RV Tauri stars do not have the same high C and s-process overabun-
dances that are characteristic of other post-AGB stars. Instead, their photospheres are
“depleted” of refractory elements (Gonzalez et al., 1997b,a; Giridhar et al., 1998, 2000,
2005; Van Winckel et al., 1998; Molster et al., 2002a,b,c; Maas et al., 2002, 2005; Deroo
et al., 2005; Gielen et al., 2007, 2009; Rao & Giridhar, 2014). This phenomenon is not
fully understood, but is apparently due to a chemical rather than a nucleosynthetic
process (van Winckel, 2003). The refractory elements, which have a high dust conden-
sation temperature, are separated from the volatiles as the condensed grains are driven
away by radiation pressure in the circumstellar environment. The depleted gas is then
re-accreted onto the stellar photosphere leaving it with a peculiar composition similar to
that of the depleted gas in the interstellar medium (ISM) (Hinkle et al., 2007). Waters
et al. (1992) suggested that these abundance anomalies are more likely to occur when
the dust is trapped in a circumstellar disk. These same depletion patterns are also
observed in binary post-AGB stars with circumbinary disks (Van Winckel et al., 1995).
This has led to the suggestion that the depleted RV Tauri stars are also binaries with
a circumstellar disk (Van Winckel et al., 1999). In their study, de Ruyter et al. (2006)
included many RV Tauri stars in the class of post-AGB binaries with disks and sug-
gested that the thermal IR spectrum originates in the Keplerian circumstellar disk. The
narrow velocity width lines of the 12CO and 13CO J = 2→ 1 and J = 1→ 0 transitions
of AC Her, V441 Her, and R Sct and the 12CO J = 3→ 2 and J = 2→ 1 transitions of
AR Pup are indicative of a Keplerian disk (Bujarrabal et al., 2013, 2015). The trapping
of grains in a disk could provide the environment needed to enable grains to grow to
sizes significantly larger than those in the ISM or in the stellar outflows of single stars
(Shenton et al., 1995; de Ruyter et al., 2005). The similar class of SRd stars, however,
does not show evidence of disks and may evolve from single stars.
Depending on the oxygen and carbon abundances in the circumstellar gas, either
oxygen- or carbon-rich dust is formed. It has been found that many of the RV Tauri

33
stars have very weak CO J = 2→ 1 lines, unlike the stronger CO J = 2→ 1 lines char-
acteristic of other, more massive, post-AGB stars (Alcolea & Bujarrabal, 1991; He et al.,
2014; Bujarrabal et al., 2015). It is possible that the unique circumstellar environment
of RV Tauri stars either surpresses the formation of CO molecules (possibly through UV
photodissociation) or underexcites them (Alcolea & Bujarrabal, 1991; McDonald et al.,
2015). However, the weakness may be due to the compactness of the disk, as has been
suggested for the case of AC Her (Bujarrabal et al., 2015). In oxygen-rich gas, dust such
as olivine (Mg2(1−x)Fe2xSiO4) and pyroxene (Mg1−xFexSiO3) is formed. In carbon-rich
gas, carbon rich dust particles such as SiC, amorphous carbon, and possible polycyclic
aromatic hydrocarbons (PAHs) are formed.
The amount of crystalline grain material compared to amorphous grain material is
generally low, ∼ 10 – 15%, and is dominant only in rare cases. Crystalline material is
also generally only detected in stars that have experienced high mass loss rates (above
10−5M�yr−1) (Cami et al., 1998; Sylvester et al., 1999; Sogawa & Kozasa, 1999; Suh,
2002). However, both crystalline and amorphous grains have been detected simultane-
ously in stellar outflows, both in the present study as well as in others. Gielen et al.
(2008, 2009) showed that dust processing in circumstellar disk environments is conducive
to creating large, crystalline grains. As the disk is subjected to the hard radiation and
stellar wind from the central source, the dust crystallization fraction increases (Gielen
et al., 2011) and the disk dissipates (Kastner et al., 2004; Gezer et al., 2015; Kastner
et al., 2016; Lisse et al., 2017). Thus, the IR excess associated with the dusty disk
diminishes as the system ages and transitions to a PN.
In this work we present 5 – 40 µm IR spectra on a diverse sample of RV Tauri and
SRd variables from a grism spectroscopic study of suspected proto-planetary nebula
precursors with the Faint Object infraRed CAmera for the SOFIA Telescope (FOR-
CAST; Herter et al., 2012) instrument on board the NASA Stratospheric Observatory
for Infrared Astronomy (SOFIA; Becklin et al., 2007; Gehrz et al., 2009; Young et al.,
2012). With this rich data set, we produce spectroscopic sampling of these objects in
the mid-IR. By modeling the emission we can determine the source of the IR-excess,
identify the dust species present and quantify fundamental dust properties, such as the
grain size distribution and dust temperature. These parameters help to determine the
physical properties of the post-AGB circumstellar environment and to constrain models

34
of post-AGB mass loss and planetary nebula formation.
In Section 3.2 we summarize the stars observed by our program. An overview of the
observations and data reduction strategies is given in Section 3.3. Section 3.4 contains
the construction of the spectral energy distributions and the spectral decomposition
model we used to measure the mineralogy of the program stars. The results of our
model, a discussion of our results and our conclusions are presented in Sections 3.5 –
3.7.
3.2 Program Stars
We have selected a sample of RV Tauri and related SRd stars based upon: 1) their
availability for SOFIA flights from Palmdale, CA and Christchurch, NZ, 2) diversity of
their IR spectral energy distributions (SEDs), 3) our ability to obtain a signal-to-noise
ratio compatible with our science objectives in a reasonable integration time.
The properties of the 18 RV Tauri and SRd variables presented in this work are
summarized in Table 3.2. TX Per is sometimes categorized as an RV Tauri star and
sometimes as an SRd variable. We concur with Percy & Coffey (2005), which refers
to TX Per as being a “mild” RV Tauri as the consecutive minima are very similar in
depth, and categorize TX Per as an RV Tauri variable.
The mineralogy of many of these systems has been studied previously (Molster et al.,
2002c; Deroo et al., 2006; Gielen et al., 2007, 2011; Blommaert et al., 2014; Hillen et al.,
2015). These studies have mostly focused on crystalline silicates. Most of the studies
found evidence for large, crystalline dust grains indicative of highly processed material.
Some of the studies suggest that the crystalline and amorphous silicates are at different
temperatures suggesting that the two species are spatially separated and have different
formation histories.
3.3 Observations and Data Reduction
The targets were observed with SOFIA during Guest Investigator (GI) Cycles 2, 3, and
4. Descriptions of the SOFIA Observatory and its science instrument (SI) suite have
been given by Becklin et al. (2007), Gehrz et al. (2009), and Young et al. (2012). All of

35
Tab
le3.
1.P
rop
erti
esof
the
RV
Tau
rian
dS
Rd
Var
iab
les
inth
isS
urv
ey
Nam
eT
yp
eS
pec
tral
Typ
eP
erio
d(d
)a[F
e/H
] 0b
PC
cS
Cc
SE
Dd
Teff
(K)
Bin
ari
tye
Ch
emic
al
Typ
efR
ef.
TW
Cam
RV
F8Ib
G8Ib
87
-0.4
0a
AD
isk
4800
1U
YC
Ma
RV
G0
114
-0.5
0a
B5500
2o
1C
enS
Rd
G3Ia
0200
3R
UC
enR
VA
7Ib
G2p
e65
-1.1
0a
BD
isk
6000
Y4,
5S
XC
enR
VF
5G
3/5V
p33
-0.3
0b
BD
isk
6250
Y4,
5S
UG
emR
VF
5M
350
0.0
0b
AD
isk
5250
6A
CH
erR
VF
2p
IbK
4e
75
-0.9
0a
BD
isk
5900
YO
7V
441
Her
SR
dF
2Ib
e70
Dis
kY
O8,
9U
Mon
RV
F8Ib
eK0p
Ib91
-0.5
0b
AD
isk
5000
YO
1,
10
CT
Ori
RV
F9
136
-0.6
0a
BD
isk
5500
10,
11
TV
Per
SR
dK
0358
12
TX
Per
RV
Gp
(M2)K
0e(
M2)
78
-0.6
0a
A4250
6A
RP
up
RV
F0IF
8I
76
0.4
0b
BD
isk
6000
O10,
13
RS
ge
RV
G0Ib
G8Ib
71
0.1
0b
AD
isk
5100
13
AI
Sco
RV
G0K
271
-0.3
0b
AD
isk
5300
C?
2,
10
RS
ctR
VG
0Ia
eK2p
(M3)I
be
147
-0.2
0a
AU
nce
rtain
4500
1R
VT
au
RV
G2Ia
eM2Ia
79
-0.4
0b
AD
isk
4500
C1
VV
ul
RV
G4eK
3(M
2)
76
0.1
0a
AD
isk
4500
2,
6
aP
uls
ati
on
per
iod
indays
bT
he
esti
mate
din
itia
lm
etallic
ity
ob
tain
edvia
the
Zn
or
Sab
un
dan
ce(G
ezer
etal.,
2015)
cP
hoto
met
ric
class
(PC
)an
dsp
ectr
osc
op
iccl
ass
(SC
)
dS
pec
tral
ener
gy
dis
trib
uti
on
class
ifica
tion
from
Gez
eret
al.
(2015)
eY
ind
icate
sco
nfi
rmed
bin
ari
tyb
ase
don
rad
ial
vel
oci
tym
easu
rem
ents
.C
on
firm
ing
bin
ari
tyu
sin
gth
ism
eth
od
isd
ifficu
ltb
ecau
seth
ep
hoto
sph
eres
of
thes
evari
ab
les
have
larg
eam
plitu
de
rad
ial
pu
lsati
on
s.
fS
tellar
chem
ical
typ
efr
om
He
etal.
(2014)
an
dre
fere
nce
sth
erei
n
Ref
eren
ces.
—(1
)G
irid
har
etal.
(2000);
(2)
Gir
idh
ar
etal.
(2005);
(3)
O’C
on
nel
l(1
961);
(4)
Maas
etal.
(2002);
(5)
Maas
etal.
(2005);
(6)
Rao
&G
irid
har
(2014):
(7)
Gir
idh
ar
etal.
(1998);
(8)
Wate
rset
al.
(1993);
(9)
de
Ru
yte
ret
al.
(2006);
(10)
Kis
set
al.
(2007);
(11)
Gon
zale
zet
al.
(1997a);
(12)
Payn
e-G
ap
osc
hkin
(1952);
(13)
Gon
zale
zet
al.
(1997b
)

36
the targets in our survey were observed using FORCAST.
FORCAST is a dual-channel mid-IR camera and spectrograph operating between 5
– 40 µm. Each channel consists of a 256 × 256 pixel array that yields a 3.4′ × 3.2′ field-
of-view with a square plate scale of 0.768′′, after distortion correction. The Short Wave
Camera (SWC) uses a Si:As blocked-impurity band (BIB) array optimized for λ < 25
µm, while the Long Wave Camera’s (LWC) Si:Sb BIB array is optmized for λ > 25 µm.
Observations can be made through either of the two channels individually or, by use
of a dichroic mirror, with both channels simultaneously across the entire range. All of
the observations presented in this work were taken in the single channel, long-slit mode.
We utilized FORCAST’s suite of grisms, which provided low spectral resolution (R ≈200) over the 5 – 40 µm range. The following grisms were used for our observations: G1
covering 4.9 – 8.0 µm, G3 covering 8.4 – 13.7 µm, G5 covering 17.6 – 27.7 µm, and G6
covering 28.7 – 37.1 µm. All of the observations were taken in the “nod match chop”
mode (C2N) which used a chop throw of 30′′, a chop angle of either 0◦ or 30◦, and no
dithering.
The data were reduced by the SOFIA Science Center using FORCAST Redux v1.5.0
and v1.2.0 pipeline versions (Clarke et al., 2015) and released to the authors as level
3 results. We stacked the spectra when there were multiple observations of a given
target. We did not use any of the data points between 9.19 – 10.0 µm as these are
strongly affected by telluric ozone absorption. The spectra were smoothed with a 3
point un-weighted boxcar to emphasize spectral features.
3.4 Spectral Energy Distributions of the Survey Objects
We present the IR SEDs of the survey objects in Figure 3.1. As can be seen in Figure
3.2, all of the program stars except for TX Per were observed with the G1, G3, and G5
grisms, and only 7 of the 18 stars were also observed with the G6 grism. TX Per was
fainter than expected and we were only able to obtain the G1 grism spectrum (4.9 – 8.0
µm). We were unable to model the spectral energy distribution of TX Per with such a
limited wavelength range. The continuum normalized SOFIA grism spectra are shown
in Figure 3.2. We have also gathered archival broadband IR photometry for comparison
with the SOFIA spectra. Photometry from the Two Micron All-Sky Survey (2MASS;

37
Skrutskie et al., 2006) at 1.25, 1.65, and 2.17 µm, the AKARI satellite (Murakami
et al., 2007) at 9 and 18 µm, the Wide-field Infrared Survey Explorer (WISE ; Wright
et al., 2010) at 3.4, 4.6, 12 and 22 µm, the Midcourse Space Experiment (MSX ; Egan
et al., 2003) at 8.28, 12.13, 14.65, 21.34 µm, and the Infrared Astronomical Satellite
(IRAS ; Neugebauer et al., 1984) at 12, 25, 60, and 100 µm were all taken from the
NASA/IPAC Infrared Science Archive (IRSA; Berriman, 2008) database. Photometry
from the Herschel (Pilbratt, 2003) Photoconductor Array Camera and Spectrometer
(PACS; Poglitsch et al., 2010) at 70, 100, and 160 µm and Spectral and Photometric
Imaging Receiver (SPIRE; Griffin et al., 2010) at 250, 350, and 500 µm were obtained by
using aperture photometry after sky background subtraction. The archival photometry
data points were not used in any of the least squares fitting routines and are only plotted
to visualize the SED of each star.
3.4.1 Dust Species
Previous studies have shown that the most common dust species present in circum-
stellar environments are amorphous and crystalline silicates with olivine and pyroxene
stoichiometries (Molster et al., 2002a,b,c; Gielen et al., 2011). Amorphous olivine has
very prominent broad features around 9.8 and 18 µm. These features arise from the Si-
O stretching and O-Si-O bending modes. Amorphous pyroxene shows a 10 µm feature
similar to that of amorphous olivine, but shifted towards shorter wavelengths. Crys-
talline forsterite has prominent emission features at 11.2, 23.7, and 33.7 µm. Many of
the stars in our sample are known to be oxygen rich (see Table 3.2) however an increased
abundance of carbon dredged up as the star evolves is possible (Iben, 1981; Chan &
Kwok, 1990). Models suggest that stars with main sequence masses less than 1.5 M�
do not experience third dredge-up. Therefore, the surface composition of these stars is
fixed by the first dredge-up and red giant branch extra-mixing, and they are oxygen rich
AGB stars. For main sequence stars with masses over 6 M� the stars undergo shallow
third dredge-up episodes. Stars in the intermediate main sequence mass range undergo
repeated third dredge-up episodes that bring carbon to the surface to become carbon
stars (for a review see Straniero et al. 2006; Karakas & Lattanzio 2014). The interpulse
time for the third dredge-up is a few times 104 years with carbon stars undergoing sev-
eral pulses after the carbon abundance first exceeds the oxygen abundance (Straniero

38
et al., 1997). The interpulse time exceeds the expansion time for circumstellar shells
and as expected nearly all normal AGB stars have shells of the same composition as the
star. Carbon rich AGB stars are expected to have circumstellar shells dominated by
amorphous carbon or graphite grains with some silicon carbide (SiC) possibly present
(Suh, 2000; Speck et al., 2005, 2009). Amorphous carbon does not have prominent IR
features but contributes to the dust continuum emission, however, graphitic carbon and
silicon carbide have emission features at 11.53 µm and in the 10 – 13 µm region, respec-
tively. The strong depletion of iron in the photospheres of RV Tauri stars suggests that
metallic iron may be present in the circumstellar environment. Iron grains can form at
temperatures 50 – 100 K lower than silicates and are stable in O-rich environments above
700 K (Kemper et al., 2002). Like amorphous carbon, metallic iron lacks prominent IR
features and contributes to the overall dust continuum. Therefore, the dust species we
included in our model are crystalline forsterite, amorphous olivine, amorphous pyroxene,
amorphous carbon, silicon carbide, graphite, and metallic iron. We only considered the
magnesium-rich crystalline species of olivine (forsterite) as it has been found that the
iron content of circumstellar crystalline olivine around evolved stars is lower than 10%
(Tielens et al., 1998; Molster et al., 2002c). In addition, we only included amorphous
enstatite and pyroxene with an iron content of 0% as these species were found to be
better fits to the spectra than the same species with an iron content of 50%. We tried
including Mg-righ crystalline olivine, Mg-rich crystalline enstatite, crystalline bronzite,
crystalline fayalite, iron oxide, amorphous alumina, and amorphous silica in our model,
however none of these dust species were significantly present. We discuss the addition
of some of these species more in Section 3.6.4.
Mass absorption coefficients for the different dust species are calculated from optical
constants using a homogeneous sphere approximation (Min et al., 2005). Although the
continuous distribution of ellipsoids approximation (CDE; Bohren & Huffman, 1983)
is widely used, it is only valid in the Rayleigh limit for small grain sizes. Because we
are interested in the grain size distribution we did not use the CDE approximation.
The details of the different optical constants that we used can be found in Table 3.2.
In cases where the refractive index was reported for the three crystallographic direc-
tions, we assumed even distributions of each orientation. There are many laboratory

39
Table 3.2 Dust Species and Properties Used in this Work
Dust Species Composition Structure Density (g/cm3) Grain Size (µm) Reference
Forsterite Mg2SiO4 C 3.27 0.1 Koike et al. (2003)Olivine Mg2SiO4 A 3.71 0.1, 2.0 Dorschner et al. (1995)
Pyroxene MgSiO3 A 3.20 0.1, 2.0 Dorschner et al. (1995)Carbon Pyrolized at 400◦ C A 1.435 0.1, 2.0 Jaeger et al. (1998b)
Silicon Carbide α-SiC C 3.26 0.1, 2.0 Pegourie (1988)Graphite C 2.24 0.1, 2.0 Draine & Lee (1984)
Metallic Iron Fe C 7.87 0.1, 2.0 Pollack et al. (1994)
Note. – The mineral structure is denoted as either amorphous (A) or crystalline (C).
measurements of IR optical constants available, corresponding to different material com-
positions, crystal structures, annealing temperatures, measurement environments, grain
sizes, and grain orientations. These different measurements produce spectra with similar
global features but with unique differences. While the minerals we have chosen to use
in our model may result in different relative abundances compared to those derived in
previous studies, we are less concerned with making comparisons with those works and
more concerned with drawing comparisons between the program stars in the present
study.
3.4.2 Spectral Decomposition Model
To identify the minerals present and to quantify the grain size distributions, we fit the
observed SOFIA spectra with synthetic spectra of various mineral species. The synthetic
spectra were calculated from the optical constants of each mineral. The conversion
from laboratory measured optical constants of dust to mass absorption coefficients is
not straightforward. Several factors affect the observed emission features, including the
chemical composition of the dust, the grain size, and the grain shape (Min et al., 2003,
2005). We constructed a basic model to fit the full FORCAST wavelength range. Given
that we see the silicate features in emission, we assume that the dust features are in an
optically thin part of the disk and, therefore, we approximate the spectrum as a linear
combination of dust absorption profiles. The emission model is given by
λFλ ∝∑i
ciµi(λ)×∑j
ajλBλ(Tj), (3.1)

40
where µi(λ)(cm−1) is the absorption coefficient of dust component i and ci gives the
volume fraction of that dust component, Bλ(Tj) (W sr−1 m−3) denotes the Planck func-
tion at temperature Tj and aj is the scaling factor for the jth Planck function. The
absorption coefficient is related to the mass absorption coefficient (opacity) by µ = κρ
where κ (cm2 g−1) is the mass absorption coefficient (opacity) and ρ (g cm−3) is the den-
sity of the dust component. The formulation of our model assumes that the stellar
contribution to the SED in this range is negligible. We further assume that all of the
dust in a population is in thermal equilibrium with all of the other dust species, regard-
less of particle sizes or the ability to absorb and re-emit starlight. We first used a least
squares minimization to fit the Planck functions to the FORCAST continuum. We fit
the functions to the entire FORCAST wavelength range available except for the 8−12.5
µm range, which is dominated by silicate emission. Two Planck functions were used
for all of the spectral models except for o1 Cen and V Vul where only a single Planck
function was needed to fit the underlying continuum. The best fitting Planck function
parameters are shown in Figure 3.1 and summarized in Table 3.3, however, the sum of
the Planck scaling factors, aj , have been normalized to unity in order to represent the
fraction of dust at each temperature Tj . The best fitting Planck functions are plotted
with the FORCAST spectra in Figure 3.1. It is probably not realistic to model the dust
as a single temperature component or even as a two-temperature component–a temper-
ature gradient is probably more realistic–but in order to keep the number of parameters
at a minimum we only use a maximum of two Planck functions in our model.
After finding the best fitting Planck functions, the best fitting dust fraction coeffi-
cients, ci, were found by a non-negative least squares minimization of the model to the
entire observed FORCAST wavelength range. The reduced χ2 of the spectrum is given
by
χ2red = 1
N−M
N∑i=1
∣∣∣Fmodel(λi)−Fobs(λi)σi
∣∣∣2 , (3.2)
where N is the number of wavelength points, M the number of fit parameters, Fmodel(λi)
is the model flux at a given wavelength, Fobs(λi) is the observed flux at a given wave-
length, and σi the absolute error of the observed flux at each wavelength λi. The reduced
χ2 values are summarized in Table 3.3.
Errors on the dust fraction coefficients were calculated from 5000 realizations of
a Monte Carlo simulation with Gaussian noise distributions. We omitted a mineral

41
species from the fit if the error, σci , on ci is greater than the value of ci itself. Figure
3.4 illustrates the distributions of the best fitting dust fraction coefficients, ci, and the
covariance between the coefficients (Foreman-Mackey, 2016). Most of the coefficients
show little to no correlation with the exception of the carbon, graphite, and metallic
iron species which are strongly anti-correlated in most cases. Even though this model
is only an approximation, it gives a good fit overall to the observed spectra (see Figure
3.3). A full radiative transfer model that could account for a temperature gradient in
the disk that may produce a better fitting result is beyond the scope of this work.
3.4.3 Grain Size Distribution
To study the grain size distribution, we used two dust grain sizes in our model with radii
of 0.1 and 2.0 µm. These sizes were chosen based on the work of Bouwman et al. (2001)
and Honda et al. (2004) which found that, in the 10 µm spectral region, 0.1 µm grains
sufficiently describe grains with a < 1.0 µm while 1.5 – 2.0 µm grains sufficiently describe
grains with a > 1.5 µm. Larger sized grains were not considered as the emission features
from larger grains become too weak to distinguish from the continuum emission. Because
the grains with radii of 2.0 µm are in the Mie scattering regime, we used the python
module pymiecoated (Leinonen, 2012) to calculate the mass absorption coefficients for
the 2.0 µm grains. pymiecoated computes the scattering properties of single- and dual-
layered spheres in the Mie regime using the results of Bohren & Huffman (1983) and
the optical constants of bulk materials. The mass absorption coefficient for crystalline
forsterite was taken directly from Koike et al. (2003). Because we did not have the
optical constants for this mineral we were unable to calculate the mass absorption
coefficient for larger sized grains in the Mie scattering regime.
3.5 Results
The results of the spectral decomposition modeling are shown in Figure 3.3. Details of
individual sources are provided in Table 3.3. The spectroscopic features present in these
sources span a broad range of dust properties and characteristics. All of the RV Tauri
stars in our sample, with the exceptions of UY CMa, TX Per, and R Sct have been

42
reported as disk sources (Gezer et al., 2015). Two sources, o1 Cen and V Vul display
a simple blackbody continuum. However, model fits demonstrate that they both also
exhibit a weak IR excess (see Figure 3.1 (c) and (r)), suggesting that these systems may
be in the final stages of dissipation. The remaining RV Tauri stars all exhibit emission
from carbon-rich minerals with varying degrees of amorphous and crystalline silicates.
Two of our SRd sources, V441 Her and TV Per, show prominent silicate features.
The presence of these features suggests that these sources, too, may have dusty disks
akin to the disks of the RV Tauri stars. Alternatively, these features might also arise
from normal dusty outflows. In the case of V441 Her, the 10 µm feature is strong
while the 20 µm feature is weak, as is expected for relatively fresh and unprocessed
amorphous silicates (Nuth & Hecht, 1990). In contrast, TV Per exhibits strong 10 and
20 µm silicate emission, suggestive of prolonged exposure to hard radiation. We discuss
this more fully in Section 3.6.

43T
able
3.3:
RV
Tau
rian
dS
Rd
Sta
rM
iner
alog
y
Sta
rχ
2 red
Min
eral
c iσci
Vf
σV
fT
1(K
)F
T1
T2(K
)F
T2
TW
Cam
0.2
6G
raphit
e-sm
all
3.7
50.1
50.5
82.6
E-2
1365±
105
0.0
19±
3.6
E-3
332±
80.9
81±
3.6
E-3
Gra
phit
e-la
rge
1.1
40.0
60.1
81.1
E-2
Carb
on-l
arg
e1.0
80.1
00.1
71.7
E-2
Pyro
xen
e-sm
all
0.2
60.0
30.0
44.1
E-3
SiC
-sm
all
0.2
00.0
40.0
35.7
E-3
UY
CM
a0.0
8G
raphit
e-sm
all
1.7
60.4
90.3
61.0
E-1
1251±
201
0.0
10±
4.1
E-3
337±
70.9
90±
4.1
E-3
Gra
phit
e-la
rge
1.2
90.1
10.2
63.6
E-2
Carb
on-l
arg
e1.2
00.2
10.2
44.9
E-2
Pyro
xen
e-sm
all
0.4
70.0
60.1
01.7
E-2
Fors
teri
te-s
mall
0.2
10.0
40.0
48.6
E-3
o1
Cen
0.3
2Ir
on-s
mall
7.0
10.4
80.4
93.8
E-2
3780±
193
1.0
--
Gra
phit
e-sm
all
5.9
60.4
90.4
23.7
E-2
Gra
phit
e-la
rge
1.1
70.0
60.0
85.5
E-3
Pyro
xen
e-sm
all
0.1
70.0
30.0
12.1
E-3
RU
Cen
0.2
3G
raphit
e-sm
all
3.5
30.2
00.4
52.8
E-2
535±
16
0.0
10±
1.4
E-3
203±
20.9
90±
1.4
E-3
Carb
on-l
arg
e2.0
10.1
80.2
52.4
E-2
Pyro
xen
e-sm
all
0.8
90.0
50.1
18.0
E-3
Gra
phit
e-la
rge
0.8
60.0
80.1
11.1
E-2
SiC
-sm
all
0.5
00.0
60.0
68.3
E-3
Fors
teri
te-s
mall
0.1
10.0
20.0
13.0
E-3
SX
Cen
0.2
4G
raphit
e-sm
all
2.6
50.2
60.4
14.5
E-2
715±
14
0.0
42±
4.8
E-3
244±
70.9
58±
4.8
E-3
Carb
on-l
arg
e1.7
70.1
40.2
72.7
E-2
Gra
phit
e-la
rge
0.9
50.0
80.1
51.5
E-2
Pyro
xen
e-la
rge
0.7
20.1
90.1
13.0
E-2
Olivin
e-la
rge
0.3
20.1
80.0
52.8
E-2
Continued
onnextpage

44T
able
3.3
–Continued
from
previouspage
Sta
rχ
2 red
Min
eral
c iσci
Vf
σV
fT
1(K
)F
T1
T2(K
)F
T2
Pyro
xen
e-sm
all
0.0
80.0
60.0
19.8
E-3
SU
Gem
0.4
0G
raphit
e-sm
all
4.0
60.1
20.5
91.9
E-2
1444±
83
0.0
23±
3.1
E-3
349±
50.9
77±
3.1
E-3
Carb
on-l
arg
e1.1
60.0
70.1
71.1
E-2
Gra
phit
e-la
rge
1.0
70.0
50.1
57.5
E-3
Pyro
xen
e-sm
all
0.3
80.0
20.0
62.9
E-3
SiC
-sm
all
0.2
70.0
30.0
43.9
E-3
AC
Her
1.4
3G
raphit
e-sm
all
3.4
30.0
60.4
89.4
E-3
489±
40.0
22±
9.4
E-4
207±
10.9
78±
9.4
E-4
Carb
on-l
arg
e1.5
10.0
50.2
16.6
E-3
Gra
phit
e-la
rge
0.9
20.0
20.1
33.6
E-3
Pyro
xen
e-sm
all
0.7
60.0
10.1
12.3
E-3
SiC
-sm
all
0.5
00.0
20.0
72.6
E-3
Fors
teri
te-s
mall
0.0
90.0
10.0
19.8
E-4
V441
Her
0.1
5G
raphit
e-sm
all
3.1
40.1
40.4
02.2
E-2
1607±
68
0.0
19±
1.8
E-3
363±
30.9
81±
1.8
E-3
Carb
on-s
mall
2.7
60.2
00.3
52.6
E-2
Gra
phit
e-la
rge
1.0
70.0
50.1
48.3
E-3
Olivin
e-sm
all
0.4
40.0
80.0
61.0
E-2
Pyro
xen
e-sm
all
0.2
30.0
40.0
35.2
E-3
SiC
-sm
all
0.2
10.0
40.0
35.3
E-3
UM
on
0.5
0C
arb
on-s
mall
3.5
50.5
00.3
06.3
E-2
772±
10
0.0
20±
1.0
E-3
254±
10.9
80±
1.0
E-3
Gra
phit
e-sm
all
3.1
70.1
30.2
74.5
E-2
Iron-l
arg
e2.9
41.8
80.2
51.6
E-1
Pyro
xen
e-sm
all
0.8
70.0
60.0
71.3
E-2
SiC
-sm
all
0.5
60.0
50.0
59.0
E-3
Gra
phit
e-la
rge
0.4
20.1
50.0
41.4
E-2
Olivin
e-sm
all
0.3
80.1
00.0
39.8
E-3
CT
Ori
0.2
5G
raphit
e-sm
all
3.9
10.1
70.5
32.5
E-2
684±
13
0.0
41±
4.0
E-3
258±
50.9
59±
4.0
E-3
Continued
onnextpage

45T
able
3.3
–Continued
from
previouspage
Sta
rχ
2 red
Min
eral
c iσci
Vf
σV
fT
1(K
)F
T1
T2(K
)F
T2
Carb
on-l
arg
e1.5
80.1
20.2
11.7
E-2
Gra
phit
e-la
rge
0.9
70.0
70.1
31.1
E-2
Pyro
xen
e-sm
all
0.5
70.0
30.0
85.0
E-3
SiC
-sm
all
0.3
80.0
40.0
55.7
E-3
TV
Per
0.5
8C
arb
on-s
mall
3.7
50.5
80.2
96.5
E-2
2340±
12
0.0
02±
4.0
E-5
297±
10.9
98±
4.0
E-5
Iron-l
arg
e3.2
42.2
00.2
51.7
E-1
Gra
phit
e-sm
all
2.4
70.1
60.1
93.5
E-2
Pyro
xen
e-sm
all
1.4
70.0
70.1
12.0
E-2
Olivin
e-sm
all
1.0
40.1
40.0
81.7
E-2
SiC
-sm
all
0.8
70.0
70.0
71.3
E-2
Gra
phit
e-la
rge
0.3
00.1
70.0
21.4
E-2
AR
Pup
1.9
3G
raphit
e-sm
all
4.0
70.1
10.4
81.4
E-2
734±
70.0
62±
3.0
E-3
280±
30.9
38±
3.0
E-3
Carb
on-s
mall
2.8
80.0
60.3
48.3
E-3
Gra
phit
e-la
rge
1.0
20.0
20.1
22.8
E-3
Olivin
e-la
rge
0.2
30.0
10.0
31.5
E-3
Pyro
xen
e-sm
all
0.1
90.0
10.0
26.9
E-4
RSge
0.1
7G
raphit
e-sm
all
3.6
60.5
40.4
36.8
E-2
862±
29
0.0
26±
3.6
E-3
270±
70.9
74±
3.6
E-3
Carb
on-s
mall
3.0
20.4
20.3
65.5
E-2
Gra
phit
e-la
rge
0.9
70.1
30.1
11.8
E-2
Pyro
xen
e-sm
all
0.5
10.0
30.0
66.2
E-3
SiC
-sm
all
0.3
40.0
50.0
46.8
E-3
AI
Sco
0.3
2G
raphit
e-sm
all
3.9
40.1
70.5
93.0
E-2
1049±
74
0.0
30±
6.1
E-3
322±
70.9
70±
6.1
E-3
Carb
on-l
arg
e1.1
50.1
40.1
72.1
E-2
Gra
phit
e-la
rge
1.1
00.0
80.1
61.3
E-2
Pyro
xen
e-sm
all
0.3
00.0
30.0
44.2
E-3
SiC
-sm
all
0.1
90.0
40.0
36.3
E-3
Continued
onnextpage

46T
able
3.3
–Continued
from
previouspage
Sta
rχ
2 red
Min
eral
c iσci
Vf
σV
fT
1(K
)F
T1
T2(K
)F
T2
RSct
1.1
8G
raphit
e-sm
all
5.4
20.2
30.7
03.1
E-2
1857±
44
0.0
17±
7.0
E-3
158±
18
0.9
83±
7.0
E-3
Gra
phit
e-la
rge
1.1
00.0
50.1
48.0
E-3
Carb
on-l
arg
e1.0
40.0
70.1
31.0
E-2
Pyro
xen
e-sm
all
0.2
30.0
20.0
32.2
E-3
RV
Tau
0.2
6G
raphit
e-sm
all
3.7
00.1
30.4
31.9
E-2
760±
10
0.0
52±
2.9
E-3
256±
30.9
48±
2.9
E-3
Carb
on-s
mall
3.2
10.2
10.3
72.5
E-2
Gra
phit
e-la
rge
0.9
20.0
60.1
17.1
E-3
Pyro
xen
e-sm
all
0.4
70.0
30.0
53.3
E-3
SiC
-sm
all
0.3
80.0
30.0
43.9
E-3
VV
ul
0.3
6Ir
on-s
mall
8.0
60.5
50.5
54.1
E-2
678±
41.0
--
Gra
phit
e-sm
all
4.9
20.4
10.3
43.1
E-2
Gra
phit
e-la
rge
1.0
50.0
50.0
75.0
E-3
Pyro
xen
e-la
rge
0.3
10.0
70.0
24.9
E-3
SiC
-larg
e0.1
60.0
60.0
14.4
E-3
Pyro
xen
e-sm
all
0.1
00.0
50.0
13.3
E-3
Note
.–c i
isth
eav
erage
bes
tfit
coeffi
cien
tof
agiv
enm
iner
al
spec
ies.σci
isth
est
andard
dev
iati
on
of
the
aver
age
bes
tfit
coeffi
cien
t,
Vf
isth
evolu
me
fract
ion,σ
(Vf)
isth
eer
ror
inth
evolu
me
fract
ion,
T1,2
are
the
bla
ckb
ody
dust
tem
per
atu
res,
and
FT
1,2
isth
efr
act
ion
of
dust
at
those
tem
per
atu
res,
resp
ecti
vel
y.‘s
mall’
refe
rsto
0.1µ
msp
her
ical
gra
ins,
‘larg
e’des
ignate
s2.0µ
msp
her
ical
gra
ins.

47
100 101 102
λ (µm)
10-14
10-13
10-12
10-11
10-10
λFλ(
W m2)
TW CamBλ(1365 K)
Bλ(332 K)
Total Continuum
(a) TW Cam
100 101 102
λ (µm)
10-14
10-13
10-12
10-11
10-10
λFλ(
W m2)
UY CMaBλ(1251 K)
Bλ(337 K)
Total Continuum
(b) UY CMa
100 101 102
λ (µm)
10-14
10-13
10-12
10-11
10-10
λFλ(
W m2)
o1 Cen
Bλ(3780 K)
(c) o1 Cen
100 101 102
λ (µm)
10-14
10-13
10-12
10-11
10-10
λFλ(
W m2)
RU CenBλ(535 K)
Bλ(203 K)
Total Continuum
(d) RU Cen

48
100 101 102
λ (µm)
10-14
10-13
10-12
10-11
10-10
λFλ(
W m2)
SX CenBλ(715 K)
Bλ(244 K)
Total Continuum
(e) SX Cen
100 101 102
λ (µm)
10-14
10-13
10-12
10-11
10-10
λFλ(
W m2)
SU GemBλ(1444 K)
Bλ(349 K)
Total Continuum
(f) SU Gem
100 101 102
λ (µm)
10-14
10-13
10-12
10-11
10-10
λFλ(
W m2)
AC Her
Bλ(489 K)
Bλ(207 K)
Total Continuum
(g) AC Her
100 101 102
λ (µm)
10-14
10-13
10-12
10-11
10-10
λFλ(
W m2)
V441 Her
Bλ(1607 K)
Bλ(363 K)
Total Continuum
(h) V441 Her

49
100 101 102
λ (µm)
10-14
10-13
10-12
10-11
10-10
λFλ(
W m2)
U Mon
Bλ(772 K)
Bλ(254 K)
Total Continuum
(i) U Mon
100 101 102
λ (µm)
10-14
10-13
10-12
10-11
10-10
λFλ(
W m2)
CT OriBλ(684 K)
Bλ(258 K)
Total Continuum
(j) CT Ori
100 101 102
λ (µm)
10-14
10-13
10-12
10-11
10-10
λFλ(
W m2)
TV Per
Bλ(2340 K)
Bλ(297 K)
Total Continuum
(k) TV Per
100 101 102
λ (µm)
10-14
10-13
10-12
10-11
10-10
λFλ(
W m2)
TX Per
Bλ(1534 K)
(l) TX Per

50
100 101 102
λ (µm)
10-14
10-13
10-12
10-11
10-10
λFλ(
W m2)
AR Pup
Bλ(734 K)
Bλ(280 K)
Total Continuum
(m) AR Pup
100 101 102
λ (µm)
10-14
10-13
10-12
10-11
10-10
λFλ(
W m2)
R SgeBλ(862 K)
Bλ(270 K)
Total Continuum
(n) R Sge
100 101 102
λ (µm)
10-14
10-13
10-12
10-11
10-10
λFλ(
W m2)
AI Sco
Bλ(1049 K)
Bλ(322 K)
Total Continuum
(o) AI Sco
100 101 102
λ (µm)
10-14
10-13
10-12
10-11
10-10
λFλ(
W m2)
R SctBλ(1857 K)
Bλ(158 K)
Total Continuum
(p) R Sct

51
100 101 102
λ (µm)
10-14
10-13
10-12
10-11
10-10
λFλ(
W m2)
RV Tau
Bλ(760 K)
Bλ(256 K)
Total Continuum
(q) RV Tau
100 101 102
λ (µm)
10-14
10-13
10-12
10-11
10-10
λFλ(
W m2)
V Vul
Bλ(678 K)
(r) V Vul
Figure 3.1 – The observed SOFIA/FORCAST spectrum (green curve) of our sample ofstars is plotted together with the archival photometry from 2MASS (blue pentagons),MSX (blue triangles), AKARI (light blue squares), WISE (yellow circles), IRAS (or-ange crosses), Herschel (red diamonds), and the best fitting Planck functions (blackdotted and dashed curves). WISE photometry upper limits are depicted as orangedownward arrows.

52
0 5 10 15 20 25 30 35 40
λ (µm)
0.5
1.0
1.5
2.0
2.5
Con
tinuum
Nor
mal
izedλFλ(
W m2)
TW Cam
(a) TW Cam
0 5 10 15 20 25 30 35 40
λ (µm)
0.5
1.0
1.5
2.0
2.5
Con
tinuum
Nor
mal
izedλFλ(
W m2)
UY CMa
(b) UY CMa
0 5 10 15 20 25 30 35 40
λ (µm)
0.5
1.0
1.5
2.0
2.5
Con
tinuum
Nor
mal
izedλFλ(
W m2)
o1 Cen
(c) o1 Cen
0 5 10 15 20 25 30 35 40
λ (µm)
0.5
1.0
1.5
2.0
2.5
Con
tinuum
Nor
mal
izedλFλ(
W m2)
RU Cen
(d) RU Cen

53
0 5 10 15 20 25 30 35 40
λ (µm)
0.5
1.0
1.5
2.0
2.5
Con
tinuum
Nor
mal
izedλFλ(
W m2)
SX Cen
(e) SX Cen
0 5 10 15 20 25 30 35 40
λ (µm)
0.5
1.0
1.5
2.0
2.5
Con
tinuum
Nor
mal
izedλFλ(
W m2)
SU Gem
(f) SU Gem
0 5 10 15 20 25 30 35 40
λ (µm)
0.5
1.0
1.5
2.0
2.5
Con
tinuum
Nor
mal
izedλFλ(
W m2)
AC Her
(g) AC Her
0 5 10 15 20 25 30 35 40
λ (µm)
0.5
1.0
1.5
2.0
2.5
Con
tinuum
Nor
mal
izedλFλ(
W m2)
V441 Her
(h) V441 Her

54
0 5 10 15 20 25 30 35 40
λ (µm)
0.5
1.0
1.5
2.0
2.5
Con
tinuum
Nor
mal
izedλFλ(
W m2)
U Mon
(i) U Mon
0 5 10 15 20 25 30 35 40
λ (µm)
0.5
1.0
1.5
2.0
2.5
Con
tinuum
Nor
mal
izedλFλ(
W m2)
CT Ori
(j) CT Ori
0 5 10 15 20 25 30 35 40
λ (µm)
0.5
1.0
1.5
2.0
2.5
Con
tinuum
Nor
mal
izedλFλ(
W m2)
TV Per
(k) TV Per
0 5 10 15 20 25 30 35 40
λ (µm)
0.5
1.0
1.5
2.0
2.5
Con
tinuum
Nor
mal
izedλFλ(
W m2)
TX Per
(l) TX Per

55
0 5 10 15 20 25 30 35 40
λ (µm)
0.5
1.0
1.5
2.0
2.5
Con
tinuum
Nor
mal
izedλFλ(
W m2)
AR Pup
(m) AR Pup
0 5 10 15 20 25 30 35 40
λ (µm)
0.5
1.0
1.5
2.0
2.5
Con
tinuum
Nor
mal
izedλFλ(
W m2)
R Sge
(n) R Sge
0 5 10 15 20 25 30 35 40
λ (µm)
0.5
1.0
1.5
2.0
2.5
Con
tinuum
Nor
mal
izedλFλ(
W m2)
AI Sco
(o) AI Sco
0 5 10 15 20 25 30 35 40
λ (µm)
0.5
1.0
1.5
2.0
2.5
Con
tinuum
Nor
mal
izedλFλ(
W m2)
R Sct
(p) R Sct

56
0 5 10 15 20 25 30 35 40
λ (µm)
0.5
1.0
1.5
2.0
2.5
Con
tinuum
Nor
mal
izedλFλ(
W m2)
RV Tau
(q) RV Tau
0 5 10 15 20 25 30 35 40
λ (µm)
0.5
1.0
1.5
2.0
2.5
Con
tinuum
Nor
mal
izedλFλ(
W m2)
V Vul
(r) V Vul
Figure 3.2 – Continuum normalized SOFIA/FORCAST spectrum (green curve) afterdividing by the best fitting continuum of our sample of stars showing the WISE archivalphotometry (yellow points) and telluric ozone region (gray band).

57
0.0
0.5
1.0
1.5
2.0
2.5
3.0
3.5
4.0
4.5
λFλ
(W m
2)
1e 12 TW Cam
Pyroxene−small
Carbon−large
SiC−small
Graphite−small
Graphite−large
Total
FORCAST
5 10 15 20 25 30 35
λ (µm)
0.200.150.100.050.000.050.100.15
Res
idual
(a) TW Cam
0.2
0.0
0.2
0.4
0.6
0.8
1.0
1.2
1.4
λFλ
(W m
2)
1e 12 UY CMa
Pyroxene−small
Carbon−large
Graphite−small
Graphite−large
Forsterite−small
Total
FORCAST
5 10 15 20 25 30 35
λ (µm)
0.2
0.0
0.2
0.4
0.6
0.8
Res
idual
(b) UY CMa
0.0
0.2
0.4
0.6
0.8
1.0
1.2
1.4
λFλ
(W m
2)
1e 11 o1 Cen
Pyroxene−small
Graphite−small
Graphite−large
Iron−small
Total
FORCAST
5 10 15 20 25 30 35
λ (µm)
0.40.30.20.10.00.10.20.3
Res
idual
(c) o1 Cen
0.0
0.5
1.0
1.5
2.0
2.5
3.0
3.5
λFλ
(W m
2)
1e 12 RU Cen
Pyroxene−small
Carbon−large
SiC−small
Graphite−small
Graphite−large
Forsterite−small
Total
FORCAST
5 10 15 20 25 30 35
λ (µm)
0.2
0.1
0.0
0.1
0.2
Res
idual
(d) RU Cen

58
0.0
0.2
0.4
0.6
0.8
1.0
1.2
1.4
1.6
λFλ
(W m
2)
1e 12 SX Cen
Olivine−large
Pyroxene−small
Pyroxene−large
Carbon−large
Graphite−small
Graphite−large
Total
FORCAST
5 10 15 20 25 30 35
λ (µm)
0.30.20.10.00.10.20.30.40.5
Res
idual
(e) SX Cen
1
0
1
2
3
4
5
6
7
λFλ
(W m
2)
1e 12 SU Gem
Pyroxene−small
Carbon−large
SiC−small
Graphite−small
Graphite−large
Total
FORCAST
5 10 15 20 25 30 35
λ (µm)
0.40.20.00.20.40.60.8
Res
idual
(f) SU Gem
0.0
0.2
0.4
0.6
0.8
1.0
1.2
1.4
λFλ
(W m
2)
1e 11 AC Her
Pyroxene−small
Carbon−large
SiC−small
Graphite−small
Graphite−large
Forsterite−small
Total
FORCAST
5 10 15 20 25 30 35
λ (µm)
0.100.050.000.050.100.150.200.25
Res
idual
(g) AC Her
0
1
2
3
4
5
6
λFλ
(W m
2)
1e 11 V441 Her
Olivine−small
Pyroxene−small
Carbon−small
SiC−small
Graphite−small
Graphite−large
Total
FORCAST
5 10 15 20 25 30 35
λ (µm)
0.05
0.00
0.05
0.10
0.15
Res
idual
(h) V441 Her

59
0.0
0.5
1.0
1.5
2.0
2.5
3.0
3.5
λFλ
(W m
2)
1e 11 U Mon
Olivine−small
Pyroxene−small
Carbon−small
SiC−small
Graphite−small
Graphite−large
Iron−large
Total
FORCAST
5 10 15 20 25 30 35
λ (µm)
0.20.00.20.40.60.81.01.2
Res
idual
(i) U Mon
0.0
0.5
1.0
1.5
2.0
2.5
λFλ
(W m
2)
1e 12 CT Ori
Pyroxene−small
Carbon−large
SiC−small
Graphite−small
Graphite−large
Total
FORCAST
5 10 15 20 25 30 35
λ (µm)
0.2
0.1
0.0
0.1R
esid
ual
(j) CT Ori
0.5
0.0
0.5
1.0
1.5
2.0
2.5
3.0
3.5
4.0
λFλ
(W m
2)
1e 11 TV Per
Olivine−small
Pyroxene−small
Carbon−small
SiC−small
Graphite−small
Graphite−large
Iron−large
Total
FORCAST
5 10 15 20 25 30 35
λ (µm)
0.0
0.5
1.0
Res
idual
(k) TV Per
0.5
0.0
0.5
1.0
1.5
2.0
2.5
3.0
3.5
λFλ
(W m
2)
1e 11 AR Pup
Olivine−large
Pyroxene−small
Carbon−small
Graphite−small
Graphite−large
Total
FORCAST
5 10 15 20 25 30 35
λ (µm)
0.20.00.20.40.60.81.01.2
Res
idual
(l) AR Pup

60
2
0
2
4
6
λFλ
(W m
2)
1e 12 R Sge
Pyroxene−small
Carbon−small
SiC−small
Graphite−small
Graphite−large
Total
FORCAST
5 10 15 20 25 30 35
λ (µm)
2101234
Res
idual
(m) R Sge
2
1
0
1
2
3
4
5
6
7
λFλ
(W m
2)
1e 12 AI Sco
Pyroxene−small
Carbon−large
SiC−small
Graphite−small
Graphite−large
Total
FORCAST
5 10 15 20 25 30 35
λ (µm)
1.0
0.5
0.0
0.5
1.0R
esid
ual
(n) AI Sco
0.0
0.5
1.0
1.5
2.0
2.5
3.0
λFλ
(W m
2)
1e 11 R Sct
Pyroxene−small
Carbon−large
Graphite−small
Graphite−large
Total
FORCAST
5 10 15 20 25 30 35
λ (µm)
0.40.30.20.10.00.10.20.3
Res
idual
(o) R Sct
0.2
0.0
0.2
0.4
0.6
0.8
1.0
1.2
1.4
λFλ
(W m
2)
1e 11 RV Tau
Pyroxene−small
Carbon−small
SiC−small
Graphite−small
Graphite−large
Total
FORCAST
5 10 15 20 25 30 35
λ (µm)
0.40.20.00.20.40.60.81.0
Res
idual
(p) RV Tau

61
2
0
2
4
6
8
λFλ
(W m
2)
1e 12 V Vul
Pyroxene−small
Pyroxene−large
SiC−large
Graphite−small
Graphite−large
Iron−small
Total
FORCAST
5 10 15 20 25 30 35
λ (µm)
3210123
Res
idual
(q) V Vul
Figure 3.3 – Best model fits for our sample of stars, showing the contribution of thedifferent mineral species. Top: the observed SOFIA/FORCAST spectra and 1σ errors(black points) are plotted together with the best model fit (red curve) and the mineralspecies (colored curves). The data points between 9.19 – 10.0 µm have been removedas these are strongly affected by telluric ozone absorption. Bottom: the normalizedresidual spectra after dividing by the best model of the observed spectra.

62
3.6 Discussion
The 10 and 20 µm emission features can be used to quantify the grain size and age of
the circumstellar dust (van Boekel et al., 2003, 2005; Juhasz et al., 2010). The peak-to-
continuum ratio of the 10 µm feature can be used as a measure of the amount of grain
growth because larger grains will produce a less prominent feature. In addition, the
continuum subtracted 10/20 µm flux ratio has been shown to decrease monotonically
with increased processing and therefore can be used to indicate the age of the circum-
stellar silicates (Nuth & Hecht, 1990). Older, more processed grains will have a lower
10/20 µm ratio. A plot of these two ratios for all our program stars can be seen in
Figure 3.5. Most of the sources show a low peak to continuum value (i.e. < 2.0) and a
low 10/20 µm ratio (i.e. < 50) indicating that the grains are relatively large and have
undergone significant processing. This supports the idea that the dust is constrained
to a Keplerian disk. There are two outliers in Figure 3.5, TV Per and UY CMa. TV
Per has a high peak to continuum value and a small 10/20 µm ratio indicating that the
dust grains are small and old. The small grain size is consistent with our model, which
predicts a small spherical grain volume fraction of ∼ 74% for TV Per. This suggests
that the circumstellar environment around TV Per is such that the grains are unable
to grow to large sizes. UY CMa has a low peak to continuum value and a large 10/20
µm ratio indicating that the dust grains are both large and young. This is also consis-
tent with our model which predicts a small grain volume fraction of ∼ 50% around UY
CMa. Robinson & Hyland (1977) and Mitchell & Robinson (1981) found that for low
optical depths, some of the circumstellar silicate dust may be in absorption rather than
emission if it is at a low temperature. The viewing angle of the disks will also affect
the peak-to-continuum ratio of the 10 µm feature (Crapsi et al., 2008) As mentioned
in Section 3.4.2, factors like the grain size and shape will affect the observed emission
features. The optical depth, viewing angle, temperature, and particle size of the grains
may mask the 10/20 µm ratio and could contribute to the high volume fraction of small
grains found by our model.

63
(a) TW Cam (b) UY CMa
(c) o1 Cen (d) RU Cen

64
(e) SX Cen (f) SU Gem
(g) AC Her (h) V441 Her

65
(i) U Mon (j) CT Ori
(k) TV Per (l) AR Pup

66
(m) R Sge (n) AI Sco
(o) R Sct (p) RV Tau

67
(q) V Vul
Figure 3.4 – Normalized probability distribution functions, ci, of each mineral speciesafter 5000 realizations of a Monte Carlo simulation with Gaussian noise distributionsand the covariance between the coefficients. The dashed lines show the mean (ci) andthe 1σ (σci) confidence levels. The contours show the 1σ confidence levels.

68
1.0 1.5 2.0 2.5 3.0Peak to Continuum
0
50
100
150
200
250
300
350
Con
tinuum
Subtr
acte
d10.
0/20.0
UY CMa
TV Per
TW Cam
o1 Cen RU Cen
SX Cen
SU GemAC Her
V441 Her
U Mon
CT OriAR Pup
R SgeAI Sco
R Sct
RV Tau
V Vul
Figure 3.5 – Ratio of the continuum subtracted flux at 10 and 20 µm versus the peakto continuum ratio of the 10 µm silicate feature.

69
3.6.1 Crystallinity
Although Molster et al. (2002a,b) showed that the silicate crystallinity fraction in disk
sources was much higher than that observed in outflow sources, we do not see a high
silicate crystallinity fraction in any of the objects in our sample listed as “disk” SEDs in
Table 3.2 and for all of the FORCAST spectra there are no obvious crystalline emission
features present. One explanation is that crystalline silicate material is not abundant in
any of the stars observed. However, crystalline olivines have been detected around AC
Her and are thought to be present at the ∼ 10− 50% level around AR Pup and U Mon
(Blommaert et al., 2014; de Ruyter et al., 2005). The lack of strong crystalline silicate
emission features does not necessarily indicate a lack of presence. If a temperature
difference exists between the amorphous and crystalline silicates, it is possible to include
up to 40% of crystalline silicates in the circumstellar dust without seeing crystalline
features in the spectra (Kemper et al., 2001). Another possible explanation for this
observation is that crystalline silicates are generally colder than amorphous silicates,
which could mean that the grains are not co-spatial or that they have different optical
properties. In fact, when modeling the circumstellar material around AC Her, Hillen
et al. (2015) found the spatial distribution of the forsterite to be different from the
amorphous dust. The difference in optical properties could be due in part to the different
iron content of each material, which increases the opacity in the near-IR significantly
(Molster et al., 2002c; Dorschner et al., 1995). Additionally, the spectral features will be
less prominent if the crystalline grains are larger than the amorphous grains. Therefore,
if the crystalline silicates are only moderately abundant (i.e. . 40%), cooler, and larger
than the amorphous silicates, the spectral features of the crystalline silicates could easily
be masked by the amorphous silicates. Interestingly, Blommaert et al. (2014) did not
detect crystalline olivines around AR Pup and U Mon in the mid-IR and interpreted
this as an indication that the crystalline olivines are hot (∼ 600 K) around these two
stars. If they are indeed hot, than the crystalline olivine abundances must be relatively
low or the grains must be large around these two stars for them to go undetected by
FORCAST.

70
3.6.2 Dual Chemistry
Our model predicts that most of the dust is carbon rich with some oxygen rich silicates.
This dual formation of carbon and oxygen rich minerals has been observed in several
classical novae, namely V1280 Sco (Sakon et al., 2016), V705 Cas (Evans et al., 2005),
V842 Cen (Smith et al., 1994), and QV Vul (Gehrz et al., 1992) as well as IRAS 09425-
6040, a carbon AGB star which shows circumstellar silicate dust features (Suh, 2016).
The formation of both carbon rich and oxygen rich dust could be due to a chemical
gradient in the wind as the stars evolve from oxygen rich to carbon rich after undergo-
ing C dredge-up processes due to a recent AGB thermal pulse. Suh (2016) successfully
modeled the dust envelope around IRAS 09425-6040 with an outer oxygen rich shell
and an inner carbon rich shell, validating this hypothesis. Similarly, the carbon-rich
planetary nebula BD +30◦ 3639 exhibits spatially separated carbon-rich polycyclic aro-
matic hydrocarbons and oxygen-rich silicate dust (Guzman-Ramirez et al., 2015). The
post-AGB binary HR 4049 is a peculiar example of a depleted oxygen rich star with
a featureless mid-IR spectrum possibly resulting from amorphous carbon masking the
spectral features from silicates (Acke et al., 2013). While it is possible we may be ob-
serving the stars in transition from oxygen rich to carbon rich, it would require that
all of these stars result from a narrow range of masses that terminate AGB evolution
just as the carbon exceeds the oxygen abundance. A more plausible explanation for the
dual chemistry mineralogy is that the dust formed in a common envelope environment
of a binary system where the carbon and oxygen abundances can rapidly change. This
mechanism has been invoked as the possible origin of post-AGB disks (Kashi & Soker,
2011; Lu et al., 2013; Hardy et al., 2016).
3.6.3 Viewing Effects
Most of the FORCAST continua are well described by two Planck functions, suggesting
that we are viewing the systems from a nearly face-on orientation and see both the inner
(∼ 1000 K) and outer (∼ 250 K) regions of the disks. Our results are corroborated by
Hillen et al. (2015) who used a radiative transfer code to model the dust around AC
Her as a highly evolved (i.e. mm sized grains), circumstellar disk with an inclination of
50± 8◦ and found good agreement with observations. Bujarrabal et al. (2007) detected

71
an extended bipolar outflow and an unresolved, compact (presumably disk) component
around V441 Her with an inclination of ∼ 75◦. The typical uniform disk diameter of
the N band emission region of the RV Tauri stars interferometrically observed by Hillen
et al. (2017) is ∼ 40 mas. making it difficult to verify the inclination angle of other
systems.
3.6.4 Limitations of the Fit
It is worth mentioning the various difficulties encountered in the modeling of the dust
species present around our program stars and the limitations of our simplified model.
As mentioned in Section 3.3, less than half of the program stars were observed with the
G6 grism (28.7 – 37.1 µm). The addition of this data would have aided the modeling and
identification of the minerals as crystalline silicates have prominent emission features
in this region. Similarly, the lack of coverage from 14 – 17 µm between grisms G3
and G5 made it more difficult to constrain the abundance of amorphous silicates which
have emission features around 17 µm. Amorphous carbon and metallic iron, on the
other hand, lack prominent IR features and our model could be fitting these species
to the overall dust continuum or temperature gradient thereby increasing the relative
abundances.
Because our model included 13 dust species and some of the program stars had
relatively low signal-to-noise FORCAST spectra, it was difficult to confirm the unique-
ness of our models. For spectra with high signal-to-noise ratios, excluding dust species
from the model had a noticeably negative impact on the goodness of fit (see Figure
3.6). Whereas, for low signal-to-noise spectra the exclusion of dust species changed the
overall shape of the fit but the χ2red values changed very little (see Figure 3.7). For
both high and low signal-to-noise spectra, adding additional dust species improves the
goodness of fit very little, if at all. We checked this by including Mg-rich crystalline en-
statite (Jaeger et al., 1998a), iron oxide (FeO; Henning et al., 1995), amorphous alumina
(porous; Begemann et al., 1997), and amorphous silica (Henning & Mutschke, 1997) to
our model one at a time. The χ2red values either remained the same or marginally im-
proved for all of the program stars. The volume fraction of the added dust species
depended on the signal-to-noise ratio of the spectra, with lower signal-to-noise spectra
generally including 1 – 4% by volume and high signal-to-noise spectra including ≤ 1%

72
0.0
0.2
0.4
0.6
0.8
1.0
1.2
1.4
λFλ
(W m
2)
1e 11 AC Her
Carbon−large
SiC−small
Graphite−small
Graphite−large
Forsterite−small
Total
FORCAST
5 10 15 20 25 30 35
λ (µm)
0.20.10.00.10.20.30.40.50.6
Res
idual
(a) Pyroxene-small removed; χ2red = 9.13
0.0
0.2
0.4
0.6
0.8
1.0
1.2
1.4
λFλ
(W m
2)
1e 11 AC Her
Pyroxene−small
SiC−small
Graphite−small
Graphite−large
Forsterite−small
Total
FORCAST
5 10 15 20 25 30 35
λ (µm)
0.10.00.10.20.30.4
Res
idual
(b) Carbon-large removed; χ2red = 5.45
0.0
0.2
0.4
0.6
0.8
1.0
1.2
1.4
λFλ
(W m
2)
1e 11 AC Her
Pyroxene−small
Carbon−large
Graphite−small
Graphite−large
Forsterite−small
Total
FORCAST
5 10 15 20 25 30 35
λ (µm)
0.100.050.000.050.100.150.20
Res
idual
(c) SiC-small removed; χ2red = 2.37
0.0
0.2
0.4
0.6
0.8
1.0
1.2
1.4
1.6
λFλ
(W m
2)
1e 11 AC Her
Pyroxene−small
Carbon−large
SiC−small
Graphite−large
Forsterite−small
Total
FORCAST
5 10 15 20 25 30 35
λ (µm)
0.20.00.20.40.60.81.0
Res
idual
(d) Graphite-small removed; χ2red = 10.2
by volume. Figure 3.8 illustrates the effect of adding additional dust species to AC Her
(high signal-to-noise spectra) and Figure 3.9 illustrates the effect of adding additional
dust species to UY CMa (low signal-to-noise spectra).

73
0.0
0.2
0.4
0.6
0.8
1.0
1.2
1.4
λFλ
(W m
2)
1e 11 AC Her
Pyroxene−small
Carbon−large
SiC−small
Graphite−small
Forsterite−small
Total
FORCAST
5 10 15 20 25 30 35
λ (µm)
0.20.10.00.10.20.30.4
Res
idual
(e) Graphite-large removed; χ2red = 5.46
0.0
0.2
0.4
0.6
0.8
1.0
1.2
1.4
λFλ
(W m
2)
1e 11 AC Her
Pyroxene−small
Carbon−large
SiC−small
Graphite−small
Graphite−large
Total
FORCAST
5 10 15 20 25 30 35
λ (µm)
0.1
0.0
0.1
0.2
Res
idual
(f) Forsterite removed; χ2red = 1.01
Figure 3.6 – The effect on the fit when removing dust species from the best model ofAC Her.
3.6.5 Crystallinity of the ISM
An upper limit on the degree of crystallinity of silicates in the diffuse ISM has been
estimated by Kemper et al. (2004) to be 0.2%± 0.2% by mass. This estimate is similar
to the average crystalline silicate fraction we find for our program stars of 0.4% ±0.05% by volume. We concur with Kemper et al. (2004) that this suggests crystalline
material is either diluted in the ISM by other amorphous grain producing processes
such as supernovae, or there is an amorphization process that occurs in the ISM on
a shorter timescale than the destruction timescale, possibly heavy ion bombardment.
Our mineralogy model of each star predicts that the majority of the dust is in the form
of graphite and amorphous carbon. On average our model predicts 80%± 1% graphite
and amorphous carbon, and 57%±1% graphite around each star by volume. This large
volume fraction of graphite and carbon around post-AGB stars may help explain the
2175 A bump observed in the interstellar extinction curve which is possibly due to these
two species (Rouleau et al., 1997; Duley & Seahra, 1998; Bradley et al., 2005).

74
0.2
0.0
0.2
0.4
0.6
0.8
1.0
1.2
1.4
λFλ
(W m
2)
1e 12 UY CMa
Carbon−large
Graphite−small
Graphite−large
Forsterite−small
Total
FORCAST
5 10 15 20 25 30 35
λ (µm)
0.2
0.0
0.2
0.4
0.6
0.8
Res
idual
(a) Pyroxene-small removed; χ2red = 0.34
0.2
0.0
0.2
0.4
0.6
0.8
1.0
1.2
1.4
λFλ
(W m
2)
1e 12 UY CMa
Pyroxene−small
Graphite−small
Graphite−large
Forsterite−small
Total
FORCAST
5 10 15 20 25 30 35
λ (µm)
0.0
0.5
1.0R
esid
ual
(b) Carbon-large removed; χ2red = 0.25
0.2
0.0
0.2
0.4
0.6
0.8
1.0
1.2
1.4
λFλ
(W m
2)
1e 12 UY CMa
Pyroxene−small
Carbon−large
Graphite−large
Forsterite−small
Total
FORCAST
5 10 15 20 25 30 35
λ (µm)
0.0
0.5
1.0
1.5
2.0
Res
idual
(c) Graphite-small removed; χ2red = 0.14
0.2
0.0
0.2
0.4
0.6
0.8
1.0
1.2
1.4
λFλ
(W m
2)
1e 12 UY CMa
Pyroxene−small
Carbon−large
Graphite−small
Forsterite−small
Total
FORCAST
5 10 15 20 25 30 35
λ (µm)
0.40.20.00.20.40.60.8
Res
idual
(d) Graphite-large removed; χ2red = 0.90

75
0.2
0.0
0.2
0.4
0.6
0.8
1.0
1.2
1.4
λFλ
(W m
2)
1e 12 UY CMa
Pyroxene−small
Carbon−large
Graphite−small
Graphite−large
Total
FORCAST
5 10 15 20 25 30 35
λ (µm)
0.2
0.0
0.2
0.4
0.6
Res
idual
(e) Forsterite removed; χ2red = 0.26
Figure 3.7 – The effect on the fit when removing dust species from the best model ofUY CMa.

76
0.0
0.2
0.4
0.6
0.8
1.0
1.2
1.4
λFλ
(W m
2)
1e 11 AC Her
Pyroxene−small
Carbon−large
SiC−small
Graphite−small
Graphite−large
Forsterite−small
Enstatite−small
Total
FORCAST
5 10 15 20 25 30 35
λ (µm)
0.100.050.000.050.100.150.200.25
Res
idual
(a) Enstatite-small added; χ2red = 0.61
0.0
0.2
0.4
0.6
0.8
1.0
1.2
1.4
λFλ
(W m
2)
1e 11 AC Her
Pyroxene−small
Carbon−large
SiC−small
Graphite−small
Graphite−large
Forsterite−small
FeO−small
Total
FORCAST
5 10 15 20 25 30 35
λ (µm)
0.100.050.000.050.100.150.200.25
Res
idual
(b) FeO-small added; χ2red = 0.56
0.0
0.2
0.4
0.6
0.8
1.0
1.2
1.4
λFλ
(W m
2)
1e 11 AC Her
Pyroxene−small
Carbon−large
SiC−small
Graphite−small
Graphite−large
Forsterite−small
Alumina−small
Total
FORCAST
5 10 15 20 25 30 35
λ (µm)
0.100.050.000.050.100.150.200.25
Res
idual
(c) Alumina-small added; χ2red = 0.61
0.0
0.2
0.4
0.6
0.8
1.0
1.2
1.4
λFλ
(W m
2)
1e 11 AC Her
Pyroxene−small
Carbon−large
SiC−small
Graphite−small
Graphite−large
Forsterite−small
Silica−small
Total
FORCAST
5 10 15 20 25 30 35
λ (µm)
0.100.050.000.050.100.150.200.25
Res
idual
(d) Silica-small added; χ2red = 0.59
Figure 3.8 – The effect on the fit when adding dust species to the best model of ACHer. The best fitting coefficient, ci, for Alumina-small in panel (c) was 0.00.

77
0.2
0.0
0.2
0.4
0.6
0.8
1.0
1.2
1.4
λFλ
(W m
2)
1e 12 UY CMa
Pyroxene−small
Carbon−large
Graphite−small
Graphite−large
Forsterite−small
Enstatite−small
Total
FORCAST
5 10 15 20 25 30 35
λ (µm)
0.2
0.0
0.2
0.4
0.6
0.8
Res
idual
(a) Enstatite-small added; χ2red = 0.085
0.2
0.0
0.2
0.4
0.6
0.8
1.0
1.2
1.4
λFλ
(W m
2)
1e 12 UY CMa
Pyroxene−small
Carbon−large
Graphite−small
Graphite−large
Forsterite−small
FeO−small
Total
FORCAST
5 10 15 20 25 30 35
λ (µm)
0.2
0.0
0.2
0.4
0.6
0.8
Res
idual
(b) FeO-small added; χ2red = 0.085
0.2
0.0
0.2
0.4
0.6
0.8
1.0
1.2
1.4
λFλ
(W m
2)
1e 12 UY CMa
Pyroxene−small
Carbon−large
Graphite−small
Graphite−large
Forsterite−small
Alumina−small
Total
FORCAST
5 10 15 20 25 30 35
λ (µm)
0.2
0.0
0.2
0.4
0.6
Res
idual
(c) Alumina-small added; χ2red = 0.080
0.2
0.0
0.2
0.4
0.6
0.8
1.0
1.2
1.4
λFλ
(W m
2)
1e 12 UY CMa
Pyroxene−small
Carbon−large
Graphite−small
Graphite−large
Forsterite−small
Silica−small
Total
FORCAST
5 10 15 20 25 30 35
λ (µm)
0.2
0.0
0.2
0.4
0.6
0.8
Res
idual
(d) Silica-small added; χ2red = 0.085
Figure 3.9 – The effect on the fit when adding dust species to the best model of UYCMa.

78
3.7 Conclusion
We have presented a first look at data obtained with SOFIA/FORCAST of 15 RV Tauri
and 3 SRd variable stars. These data have demonstrated the diversity of dust features
present in these systems, possibly tracing the evolutionary track from post-AGB star
to PN. These observations of IR excess support the hypothesis that the systems in
question are at an advanced stage in their transition to PNe. Our main conclusions can
be summarized as follows:
– Almost all of the stars observed display a 10 µm and/or 20 µm emission feature.
For most of the stars observed, the FORCAST continua are well described by two
Planck functions one at ∼ 1000 K and one at ∼ 250 K with a majority of the dust
(∼ 97%) in the cooler form. A single Planck function fit the underlying contiuum
of o1 Cen and V Vul, indicating that these systems may be in the final stages of
disk dissipation.
– Our mineralogy model indicates the presence of both carbon rich and oxygen rich
dust species with a majority of the dust, 80% ± 1% by volume on average, in
the form of amorphous carbon and graphite. All of the stars display this dual
chemistry circumstellar dust. This requires that either these stars result from a
narrow range of masses that terminate AGB evolution just as the carbon exceeds
the oxygen abundance or that the formation process is not single star evolution.
We speculate the formation process is common envelope evolution.
– The spectra do not exhibit any obvious crystalline emission features and our model
only predicts UY CMa, RU Cen, and AC Her to have crystalline forsterite at
volume fractions of 4%± 0.9%, 1%± 0.3%, and 1%± 0.1%, respectively.
– Most of the spectra show a low peak to continuum value (i.e. < 2.0) and a low
10/20 µm ratio (i.e. < 50) indicating that the grains are relatively large and
have undergone significant processing, supporting the hypothesis that the dust is
constrained to a Keplerian disk and that we are viewing the heavily processed,
central regions of the disk from a nearly face-on orientation.
– The average composition of the SRd variables contains 8% more small carbon

79
dust and less graphite (14% less of the small species and 5% less of the large)
than the average composition of the RV Tauri stars. Of the three SRd variables
modeled in this work, none of them contained the large carbon species–on average
the RV Tauri stars contained 13% by volume. Overall the average volume fraction
of large grains for the SRd variables was 16% compared to 30% for the RV Tauri
stars. The paucity of large grains around any of the SRd variables supports the
hypothesis that these stars are single star systems.
– Between the featureless IR dust species, amorphous carbon is included in more of
our models (16 out of 17) than metallic iron (4 out of 17).

Chapter 4
Summary
The goal of this thesis was to study the mineralogy and mass-loss histories of post-
main sequence stars using airborne mid-IR imaging and spectroscopy. With the Faint
Object infraRed CAmera for the SOFIA Telescope (FORCAST) on board the NASA
Stratospheric Observatory for Infrared Astronomy (SOFIA) the candidate luminous
blue variables MN 90 and HD 168625 have been imaged with near diffraction limited
resolution. Two-dimensional radiative transfer modeling of MN 90 and HD 168625
reveals recent mass-loss in the circumstellar environment. The SOFIA/FORCAST grism
spectroscopic study of 15 RV Tauri stars and 3 SRd variable stars, a sample of proto-
planetary nebulae, demonstrated the diversity of dust features present in these systems.
The SOFIA/FORCAST images between 7.7 – 37.1 µm of HD 168625 compliment
previously obtained mid-IR imaging. The dust color temperature and optical depth
maps that we derive from our observations show evidence for the limb-brightened peaks
of an equatorial torus and for very small, transiently heated dust grains. A least-squares
fit of a λBλ(Td) curve with emissivity Qabs(λ) ∝ λ−1 to the SED of HD 168625 yields
an estimated dust temperature of 160 K, with the peak of the emission at 18 µm. Our
detailed radiative transfer model using 2-Dust supports the claim that the dust resides
in a thin, axisymmetric dust shell and estimates that HD 168625 lost 2.4× 10⁻³ M� of
dust in a massive stellar wind with a mass-loss rate of 1.3 × 10⁻⁷ M� yr−1 that ended
approximately 2600 years ago. Using a canonical gas-to-dust ratio of 100 we estimate
a total mass-loss of 0.24 M� for HD 168625 which is a lower limit given we are only
observing the inner equatorial torus, ∼ 10 – 20% of the solid angle of the entire nebula.
80

81
These 2-Dust estimates assume that HD 168625 has a luminosity of 2.5 × 10⁴ L�, at
the lower end of luminosities of LBVs in their quiescent state, and a distance of 1.2 kpc.
Our SOFIA/FORCAST image at 37.1 µm of MN 90 shows a limb-brightened, spherical
dust shell surrounding the central star. A least-squares fit of a λBλ(Td) curve with
emissivity Qabs(λ) ∝ λ−1 to the SED of MN 90 yields a dust temperature of 69 K, with
the peak of the emission at 42 µm. Our 2-Dust model supports the idea that the dust
resides in a thin, spherical dust shell and estimates that MN 90 lost 2.5 × 10⁻² M� of
dust in a massive stellar wind with a mass-loss rate of 8.3 × 10⁻⁶ M� yr−1 that ended
approximately 6000 years ago. Using the canonical gas-to-dust mass ratio of 100, we
estimate a total mass-loss of 2.5 M� for MN 90. These 2-Dust estimates assume that
MN 90 has a luminosity of 7.1 × 10⁴ L�, at the lower end of luminosities of LBVs in
their quiescent state, and a distance of 4.2 kpc. Our 2-Dust model of MN 90 has good
agreement with observations if we assume very small, transiently heated silicate grains.
With a more direct and reliable measurement of the distances to MN 90 and HD 168625,
more accurate dust mass and mass-loss rates could be estimated. The uncertainty in
the distance to MN 90 and the limited information regarding its physical parameters
make it a prime candidate for follow-up observations and photometric monitoring.
The SOFIA/FORCAST 5 – 40 µm mid-infrared grism spectroscopic survey of RV
Tauri and SRd variable stars suggests the presence of both carbon rich and oxygen rich
dust species, with a majority of the dust being in the form of amorphous carbon and
graphite, for all of the stars observed. This requires that either these stars result from
a narrow range of masses that terminate AGB evolution just as the carbon exceeds
the oxygen abundance or that the formation process is not single star evolution. We
speculate the formation process is common envelope evolution of a binary system where
the carbon and oxygen abundances can rapidly change. The spectra do not exhibit any
obvious crystalline emission features and our model only predicts UY CMa, RU Cen,
and AC Her to have crystalline forsterite at volume fractions less than 4%. Most of
the spectra show a low peak to continuum value (i.e. < 2.0) and a low 10/20 µm ratio
(i.e. < 50) indicating that the grains are relatively large and have undergone significant
processing, supporting the hypothesis that the dust is constrained to a Keplerian disk
and that we are viewing the heavily processed, central regions of the disk from a nearly
face-on orientation. These observations support the hypothesis that the systems in

82
question are at an advanced stage in their transition to PNe.

References
Acke, B., Degroote, P., Lombaert, R., et al. 2013, A&A, 551, A76
Alcolea, J., & Bujarrabal, V. 1991, A&A, 245, 499
Aldoretta, E. J., Caballero-Nieves, S. M., Gies, D. R., et al. 2015, AJ, 149, 26
Arneson, R. A., Gehrz, R. D., Woodward, C. E., et al. 2017, ApJ, 843, 51
Becklin, E. E., Tielens, A. G. G. M., Gehrz, R. D., & Callis, H. H. S. 2007, in Proc. SPIE,
Vol. 6678, Infrared Spaceborne Remote Sensing and Instrumentation XV, 66780A
Beelen, A., Cox, P., Benford, D. J., et al. 2006, ApJ, 642, 694
Begemann, B., Dorschner, J., Henning, T., et al. 1997, ApJ, 476, 199
Benjamin, R. A., Churchwell, E., Babler, B. L., et al. 2003, PASP, 115, 953
Berriman, G. B. 2008, in Proc. SPIE, Vol. 7016, Observatory Operations: Strategies,
Processes, and Systems II, 701618
Bertoldi, F., & Cox, P. 2002, A&A, 384, L11
Blommaert, J. A. D. L., de Vries, B. L., Waters, L. B. F. M., et al. 2014, A&A, 565,
A109
Bohren, C. F., & Huffman, D. R. 1983, Absorption and Scattering of Light by Small
Particles (New York: Wiley)
Bouwman, J., Meeus, G., de Koter, A., et al. 2001, A&A, 375, 950
Bradley, J., Dai, Z. R., Erni, R., et al. 2005, Science, 307, 244
83
84
Bujarrabal, V., Alcolea, J., Van Winckel, H., Santander-Garcıa, M., & Castro-Carrizo,
A. 2013, A&A, 557, A104
Bujarrabal, V., Bachiller, R., Alcolea, J., & Martin-Pintado, J. 1988, A&A, 206, L17
Bujarrabal, V., Castro-Carrizo, A., Alcolea, J., & Van Winckel, H. 2015, A&A, 575, L7
Bujarrabal, V., Gomez-Gonzalez, J., & Planesas, P. 1989, A&A, 219, 256
Bujarrabal, V., van Winckel, H., Neri, R., et al. 2007, A&A, 468, L45
Cami, J., de Jong, T., Justtannont, K., Yamamura, I., & Waters, L. B. F. M. 1998,
Ap&SS, 255, 339
Cardelli, J. A., Clayton, G. C., & Mathis, J. S. 1989, ApJ, 345, 245
Carey, S. J., Noriega-Crespo, A., Mizuno, D. R., et al. 2009, PASP, 121, 76
Chan, S. J., & Kwok, S. 1990, A&A, 237, 354
Chentsov, E. L., & Gorda, E. S. 2004, Astronomy Letters, 30, 461
Chentsov, E. L., & Luud, L. 1989, Astrophysics, 31, 415
Churchwell, E., Babler, B. L., Meade, M. R., et al. 2009, PASP, 121, 213
Clark, J. S., Larionov, V. M., & Arkharov, A. 2005, A&A, 435, 239
Clarke, M., Vacca, W. D., & Shuping, R. Y. 2015, in Astronomical Society of the Pacific
Conference Series, Vol. 495, Astronomical Data Analysis Software an Systems XXIV
(ADASS XXIV), ed. A. R. Taylor & E. Rosolowsky, 355
Crapsi, A., van Dishoeck, E. F., Hogerheijde, M. R., Pontoppidan, K. M., & Dullemond,
C. P. 2008, A&A, 486, 245
Dayal, A., Hoffmann, W. F., Bieging, J. H., et al. 1998, ApJ, 492, 603
de Ruyter, S., van Winckel, H., Dominik, C., Waters, L. B. F. M., & Dejonghe, H. 2005,
A&A, 435, 161
de Ruyter, S., van Winckel, H., Maas, T., et al. 2006, A&A, 448, 641

85
Deroo, P., Reyniers, M., van Winckel, H., Goriely, S., & Siess, L. 2005, A&A, 438, 987
Deroo, P., van Winckel, H., Min, M., et al. 2006, A&A, 450, 181
Dorschner, J., Begemann, B., Henning, T., Jaeger, C., & Mutschke, H. 1995, A&A, 300,
503
Draine, B. T. 2003, ARA&A, 41, 241
Draine, B. T., & Lee, H. M. 1984, ApJ, 285, 89
Duley, W. W., & Seahra, S. 1998, ApJ, 507, 874
Dwarkadas, V. V., & Owocki, S. P. 2002, ApJ, 581, 1337
Dwek, E., Galliano, F., & Jones, A. P. 2007, ApJ, 662, 927
Egan, M. P., Price, S. D., & Kraemer, K. E. 2003, in Bulletin of the American Astro-
nomical Society, Vol. 35, American Astronomical Society Meeting Abstracts, 1301
Evans, A., Tyne, V. H., Smith, O., et al. 2005, MNRAS, 360, 1483
Fokin, A. B. 1994, A&A, 292, 133
Foreman-Mackey, D. 2016, The Journal of Open Source Software, 24,
doi:10.21105/joss.00024
Frank, A., Balick, B., & Davidson, K. 1995, ApJ, 441, L77
Fritz, T. K., Gillessen, S., Dodds-Eden, K., et al. 2011, ApJ, 737, 73
Gehrz, R. 1989, in IAU Symposium, Vol. 135, Interstellar Dust, ed. L. J. Allamandola
& A. G. G. M. Tielens, 445
Gehrz, R. D. 1972, ApJ, 178, 715
Gehrz, R. D., Becklin, E. E., de Pater, I., et al. 2009, Advances in Space Research, 44,
413
Gehrz, R. D., Jones, T. J., Woodward, C. E., et al. 1992, ApJ, 400, 671

86
Gehrz, R. D., & Ney, E. P. 1972, PASP, 84, 768
Gehrz, R. D., & Woolf, N. J. 1970, ApJ, 161, L213
Gehrz, R. D., Roellig, T. L., Werner, M. W., et al. 2007, Review of Scientific Instru-
ments, 78, 011302
Gezer, I., Van Winckel, H., Bozkurt, Z., et al. 2015, MNRAS, 453, 133
Gielen, C., van Winckel, H., Min, M., Waters, L. B. F. M., & Lloyd Evans, T. 2008,
A&A, 490, 725
Gielen, C., van Winckel, H., Waters, L. B. F. M., Min, M., & Dominik, C. 2007, A&A,
475, 629
Gielen, C., van Winckel, H., Reyniers, M., et al. 2009, A&A, 508, 1391
Gielen, C., Bouwman, J., van Winckel, H., et al. 2011, A&A, 533, A99
Giridhar, S., Lambert, D. L., & Gonzalez, G. 1998, ApJ, 509, 366
—. 2000, ApJ, 531, 521
Giridhar, S., Lambert, D. L., Reddy, B. E., Gonzalez, G., & Yong, D. 2005, ApJ, 627,
432
Gonzalez, G., Lambert, D. L., & Giridhar, S. 1997a, ApJ, 481, 452
—. 1997b, ApJ, 479, 427
Gordon, M. S., Shenoy, D., Humphreys, R. M., et al. 2017, ArXiv e-prints,
arXiv:1708.00018
Green, G. M., Schlafly, E. F., Finkbeiner, D. P., et al. 2015, ApJ, 810, 25
Griffin, M. J., Abergel, A., Abreu, A., et al. 2010, A&A, 518, L3
Groenewegen, M. A. T., Waelkens, C., Barlow, M. J., et al. 2011, A&A, 526, A162
Guzman-Ramirez, L., Lagadec, E., Wesson, R., et al. 2015, MNRAS, 451, L1

87
Gvaramadze, V. V., Kniazev, A. Y., & Fabrika, S. 2010, MNRAS, 405, 1047
Hardy, A., Schreiber, M. R., Parsons, S. G., et al. 2016, MNRAS, 459, 4518
He, J. H., Szczerba, R., Hasegawa, T. I., & Schmidt, M. R. 2014, ApJS, 210, 26
Henning, T., Begemann, B., Mutschke, H., & Dorschner, J. 1995, A&AS, 112, 143
Henning, T., & Mutschke, H. 1997, A&A, 327, 743
Herter, T. L., Adams, J. D., De Buizer, J. M., et al. 2012, ApJ, 749, L18
Hillen, M., de Vries, B. L., Menu, J., et al. 2015, A&A, 578, A40
Hillen, M., Van Winckel, H., Menu, J., et al. 2017, A&A, 599, A41
Hinkle, K. H., Brittain, S. D., & Lambert, D. L. 2007, ApJ, 664, 501
Honda, M., Kataza, H., Okamoto, Y. K., et al. 2004, ApJ, 610, L49
Humphreys, R. M., Davidson, K., & Smith, N. 1999, PASP, 111, 1124
Hutsemekers, D., van Drom, E., Gosset, E., & Melnick, J. 1994, A&A, 290, 906
Iben, Jr., I. 1981, ApJ, 246, 278
Jaeger, C., Molster, F. J., Dorschner, J., et al. 1998a, A&A, 339, 904
Jaeger, C., Mutschke, H., & Henning, T. 1998b, A&A, 332, 291
Juhasz, A., Bouwman, J., Henning, T., et al. 2010, ApJ, 721, 431
Jura, M. 1986, ApJ, 309, 732
Karakas, A. I., & Lattanzio, J. C. 2014, PASA, 31, e030
Kashi, A., & Soker, N. 2011, MNRAS, 417, 1466
Kastner, J. H., Huenemoerder, D. P., Schulz, N. S., et al. 2004, ApJ, 605, L49
Kastner, J. H., Principe, D. A., Punzi, K., et al. 2016, AJ, 152, 3

88
Kemper, F., de Koter, A., Waters, L. B. F. M., Bouwman, J., & Tielens, A. G. G. M.
2002, A&A, 384, 585
Kemper, F., Vriend, W. J., & Tielens, A. G. G. M. 2004, ApJ, 609, 826
Kemper, F., Waters, L. B. F. M., de Koter, A., & Tielens, A. G. G. M. 2001, A&A,
369, 132
Kiss, L. L., Derekas, A., Szabo, G. M., Bedding, T. R., & Szabados, L. 2007, MNRAS,
375, 1338
Knapp, G. R., Sandell, G., & Robson, E. I. 1993, ApJS, 88, 173
Kniazev, A. Y., Gvaramadze, V. V., & Berdnikov, L. N. 2015, MNRAS, 449, L60
Koike, C., Chihara, H., Tsuchiyama, A., et al. 2003, A&A, 399, 1101
Kukarkin, B. V. 1958, in IAU Symposium, Vol. 5, Comparison of the Large-Scale Struc-
ture of the Galactic System with that of Other Stellar Systems, ed. N. G. Roman,
49
Langer, N., Hamann, W.-R., Lennon, M., et al. 1994, A&A, 290, 819
Lau, R. M., Herter, T. L., Morris, M. R., & Adams, J. D. 2014, ApJ, 785, 120
Lau, R. M., Herter, T. L., Morris, M. R., Becklin, E. E., & Adams, J. D. 2013, ApJ,
775, 37
Leinonen, J. 2012, Python code for calculating Mie scattering from single and dual-
layered spheres
Lisse, C. M., Christian, D. J., Wolk, S. J., et al. 2017, AJ, 153, 62
Lu, G., Zhu, C., & Podsiadlowski, P. 2013, ApJ, 768, 193
Maas, T., Van Winckel, H., & Lloyd Evans, T. 2005, A&A, 429, 297
Maas, T., Van Winckel, H., & Waelkens, C. 2002, A&A, 386, 504
Mahy, L., Hutsemekers, D., Royer, P., & Waelkens, C. 2016, A&A, 594, A94

89
Martayan, C., Lobel, A., Baade, D., et al. 2016, A&A, 587, A115
Mathis, J. S., Rumpl, W., & Nordsieck, K. H. 1977, ApJ, 217, 425
McDonald, I., Zijlstra, A. A., Lagadec, E., et al. 2015, MNRAS, 453, 4324
Meixner, M., Ueta, T., Bobrowsky, M., & Speck, A. 2002, ApJ, 571, 936
Meixner, M., Zalucha, A., Ueta, T., Fong, D., & Justtanont, K. 2004, ApJ, 614, 371
Meixner, M., Ueta, T., Dayal, A., et al. 1999, ApJS, 122, 221
Micha lowski, M. J., Murphy, E. J., Hjorth, J., et al. 2010, A&A, 522, A15
Min, M., Hovenier, J. W., & de Koter, A. 2003, A&A, 404, 35
—. 2005, A&A, 432, 909
Mitchell, R. M., & Robinson, G. 1981, MNRAS, 196, 801
Mizuno, D. R., Kraemer, K. E., Flagey, N., et al. 2010, AJ, 139, 1542
Molster, F. J., Waters, L. B. F. M., & Kemper, F. 2010, in Lecture Notes in Physics,
Berlin Springer Verlag, Vol. 815, Lecture Notes in Physics, Berlin Springer Verlag,
ed. T. Henning, 143–201
Molster, F. J., Waters, L. B. F. M., & Tielens, A. G. G. M. 2002a, A&A, 382, 222
Molster, F. J., Waters, L. B. F. M., Tielens, A. G. G. M., & Barlow, M. J. 2002b, A&A,
382, 184
Molster, F. J., Waters, L. B. F. M., Tielens, A. G. G. M., Koike, C., & Chihara, H.
2002c, A&A, 382, 241
Morgan, W. W., Code, A. D., & Whitford, A. E. 1955, ApJS, 2, 41
Murakami, H., Baba, H., Barthel, P., et al. 2007, PASJ, 59, S369
Naze, Y., Rauw, G., & Hutsemekers, D. 2012, A&A, 538, A47
Neugebauer, G., Habing, H. J., van Duinen, R., et al. 1984, ApJ, 278, L1

90
Nota, A., Livio, M., Clampin, M., & Schulte-Ladbeck, R. 1995, ApJ, 448, 788
Nota, A., Pasquali, A., Clampin, M., et al. 1996, ApJ, 473, 946
Nuth, III, J. A., & Hecht, J. H. 1990, Ap&SS, 163, 79
O’Connell, D. J. K. 1961, Ricerche Astronomiche, 6
O’Hara, T. B., Meixner, M., Speck, A. K., Ueta, T., & Bobrowsky, M. 2003, ApJ, 598,
1255
Pasquali, A., Nota, A., Smith, L. J., et al. 2002, AJ, 124, 1625
Payne-Gaposchkin, C. 1952, Nature, 170, 223
Pegourie, B. 1988, A&A, 194, 335
Percy, J. R. 1993, in Astronomical Society of the Pacific Conference Series, Vol. 45,
Luminous High-Latitude Stars, ed. D. D. Sasselov, 295
Percy, J. R., & Coffey, J. 2005, Journal of the American Association of Variable Star
Observers (JAAVSO), 33, 193
Percy, J. R., Sasselov, D. D., Alfred, A., & Scott, G. 1991, ApJ, 375, 691
Percy, J. R., & Ursprung, C. 2006, Journal of the American Association of Variable
Star Observers (JAAVSO), 34, 125
Pilbratt, G. L. 2003, in Proc. SPIE, Vol. 4850, IR Space Telescopes and Instruments,
ed. J. C. Mather, 586–597
Poglitsch, A., Waelkens, C., Geis, N., et al. 2010, A&A, 518, L2
Pollack, J. B., Hollenbach, D., Beckwith, S., et al. 1994, ApJ, 421, 615
Popper, D. M., & Seyfert, C. K. 1940, PASP, 52, 401
Preston, G. W., Krzeminski, W., Smak, J., & Williams, J. A. 1963, ApJ, 137, 401
Rao, S. S., & Giridhar, S. 2014, RMxAA, 50, 49

91
Rieke, G. H., Young, E. T., Engelbracht, C. W., et al. 2004, ApJS, 154, 25
Robberto, M., & Herbst, T. M. 1998, ApJ, 498, 400
Robinson, G., & Hyland, A. R. 1977, MNRAS, 180, 495
Rouleau, F., Henning, T., & Stognienko, R. 1997, A&A, 322, 633
Sakon, I., Sako, S., Onaka, T., et al. 2016, ApJ, 817, 145
Schoenberner, D. 1983, ApJ, 272, 708
Shenoy, D., Humphreys, R. M., Jones, T. J., et al. 2016, AJ, 151, 51
Shenton, M., Evans, A., & Williams, P. M. 1995, MNRAS, 273, 906
Shenton, M., Albinson, J. S., Barrett, P., et al. 1992, A&A, 262, 138
Skinner, C. J. 1997, in Astronomical Society of the Pacific Conference Series, Vol. 120,
Luminous Blue Variables: Massive Stars in Transition, ed. A. Nota & H. Lamers, 322
Skrutskie, M. F., Cutri, R. M., Stiening, R., et al. 2006, AJ, 131, 1163
Smith, C. H., Aitken, D. K., & Roche, P. F. 1994, MNRAS, 267, 225
Smith, N. 2007, AJ, 133, 1034
—. 2014, ARA&A, 52, 487
Smith, N., & Stassun, K. G. 2017, AJ, 153, 125
Smith, N., & Tombleson, R. 2015, MNRAS, 447, 598
Smith, N., & Townsend, R. H. D. 2007, ApJ, 666, 967
Smith, N., Vink, J. S., & de Koter, A. 2004, ApJ, 615, 475
Sogawa, H., & Kozasa, T. 1999, ApJ, 516, L33
Speck, A. K., Corman, A. B., Wakeman, K., Wheeler, C. H., & Thompson, G. 2009,
ApJ, 691, 1202

92
Speck, A. K., Meixner, M., & Knapp, G. R. 2000, ApJ, 545, L145
Speck, A. K., Thompson, G. D., & Hofmeister, A. M. 2005, ApJ, 634, 426
Sterken, C., Arentoft, T., Duerbeck, H. W., & Brogt, E. 1999, A&A, 349, 532
Straniero, O., Chieffi, A., Limongi, M., et al. 1997, ApJ, 478, 332
Straniero, O., Gallino, R., & Cristallo, S. 2006, Nuclear Physics A, 777, 311
Suh, K.-W. 2000, MNRAS, 315, 740
—. 2002, MNRAS, 332, 513
—. 2016, ApJ, 819, 61
Sylvester, R. J., Kemper, F., Barlow, M. J., et al. 1999, A&A, 352, 587
Takeuti, M., & Petersen, J. O. 1983, A&A, 117, 352
Taylor, W. D., Evans, C. J., Simon-Dıaz, S., et al. 2014, MNRAS, 442, 1483
Tielens, A. G. G. M., Waters, L. B. F. M., Molster, F. J., & Justtanont, K. 1998,
Ap&SS, 255, 415
Tuchman, Y., Lebre, A., Mennessier, M. O., & Yarri, A. 1993, A&A, 271, 501
Ueta, T., & Meixner, M. 2003, ApJ, 586, 1338
Ueta, T., Meixner, M., Dayal, A., et al. 2001a, ApJ, 548, 1020
Ueta, T., Meixner, M., Hinz, P. M., et al. 2001b, ApJ, 557, 831
Umana, G., Buemi, C. S., Trigilio, C., Leto, P., & Hora, J. L. 2010, ApJ, 718, 1036
van Boekel, R., Min, M., Waters, L. B. F. M., et al. 2005, A&A, 437, 189
van Boekel, R., Waters, L. B. F. M., Dominik, C., et al. 2003, A&A, 400, L21
van Genderen, A. M., van den Bosch, F. C., Dessing, F., et al. 1992, A&A, 264, 88
van Marle, A. J., Langer, N., & Garcıa-Segura, G. 2007, A&A, 469, 941

93
van Winckel, H. 2003, ARA&A, 41, 391
Van Winckel, H., Waelkens, C., Fernie, J. D., & Waters, L. B. F. M. 1999, A&A, 343,
202
Van Winckel, H., Waelkens, C., & Waters, L. B. F. M. 1995, A&A, 293
Van Winckel, H., Waelkens, C., Waters, L. B. F. M., et al. 1998, A&A, 336, L17
Volk, K., & Cohen, M. 1989, AJ, 98, 931
Voors, R. H. M., Waters, L. B. F. M., de Koter, A., et al. 2000, A&A, 356, 501
Wachter, S., Mauerhan, J. C., Van Dyk, S. D., et al. 2010, AJ, 139, 2330
Waelkens, C., & Waters, L. B. F. M. 1993, in Astronomical Society of the Pacific
Conference Series, Vol. 45, Luminous High-Latitude Stars, ed. D. D. Sasselov, 219
Waters, L. B. F. M., Trams, N. R., & Waelkens, C. 1992, A&A, 262, L37
Waters, L. B. F. M., Waelkens, C., Mayor, M., & Trams, N. R. 1993, A&A, 269, 242
Weis, K. 2011, in IAU Symposium, Vol. 272, Active OB Stars: Structure, Evolution,
Mass Loss, and Critical Limits, ed. C. Neiner, G. Wade, G. Meynet, & G. Peters,
372–377
Weis, K. 2012, in Astrophysics and Space Science Library, Vol. 384, Eta Carinae and
the Supernova Impostors, ed. K. Davidson & R. M. Humphreys, 171
Werner, M. W., Roellig, T. L., Low, F. J., et al. 2004, ApJS, 154, 1
Wright, E. L., Eisenhardt, P. R. M., Mainzer, A. K., et al. 2010, AJ, 140, 1868
Young, E. T., Becklin, E. E., Marcum, P. M., et al. 2012, ApJ, 749, L17
Yuan, H. B., Liu, X. W., & Xiang, M. S. 2013, MNRAS, 430, 2188