Embed Size (px)
Citation preview

Health and Safety Executive
A study of the characteristics of cementitious surface toppings and applied concrete
Prepared by the Health and Safety Laboratory for the Health and Safety Executive 2007
RR547 Research Report
Health and Safety Executive
A study of the characteristics of cementitious surface toppings and applied concrete
Mr Rob Shaw Health and Safety Laboratory Harpur Hill Industrial Estate Harpur Hill Buxton SK17 9JN
Slips & trips are the most common cause of major injuries at work and they occur in almost all workplaces; 95% of major slips result in broken bones. In a typical year, slips and trips account for 33% of all reported major injuries and 20% of over-3-day injuries to employees. The construction sector has a higher rate of slips and trips than any other sector. Rarely is there a single cause of a slipping accident, and so a holistic approach to reducing the number of slip accidents is required. The major contributing factor in a slip accident is the interaction of the pedestrians heel and the floor surface. The potential for slip will depend on the footwear worn, the nature of the floor surface and the presence of any contamination.
Cementitious floors are present in many work places, particularly in the construction sector and in warehouses. The slip resistance of these surfaces will depend on the application technique used, and therefore the surface finish obtained. The aim of this study was to assess the slip resistance of cement floors applied using a variety of techniques and to determine whether the application of dry shake techniques such as surface hardeners and dust inhibitors effects the slip properties of the surface.
This report and the work it describes were funded by the Health and Safety Executive (HSE). Its contents, including any opinions and/or conclusions expressed, are those of the author alone and do not necessarily reflect HSE policy.
HSE Books
© Crown copyright 2007
First published 2007
All rights reserved. No part of this publication may bereproduced, stored in a retrieval system, or transmitted inany form or by any means (electronic, mechanical,photocopying, recording or otherwise) without the priorwritten permission of the copyright owner.
Applications for reproduction should be made in writing to:Licensing Division, Her Majesty’s Stationery Office,St Clements House, 2-16 Colegate, Norwich NR3 1BQor by e-mail to [email protected]
2
CONTENTS
1. Introduction ............................................................................................................................... 5
2. Experimental Procedures........................................................................................................... 6
3. Results ....................................................................................................................................... 7
4. Discussion ............................................................................................................................... 10
5. Conclusions and Recommendations........................................................................................ 11
Appendix A: Slip Resistance Data .............................................................................................. 12
Appendix B: UKSRG Guidelines ............................................................................................... 31
Appendix C: HSE Information Sheet Slips & Trips 1 ................................................................ 32
3
EXECUTIVE SUMMARY
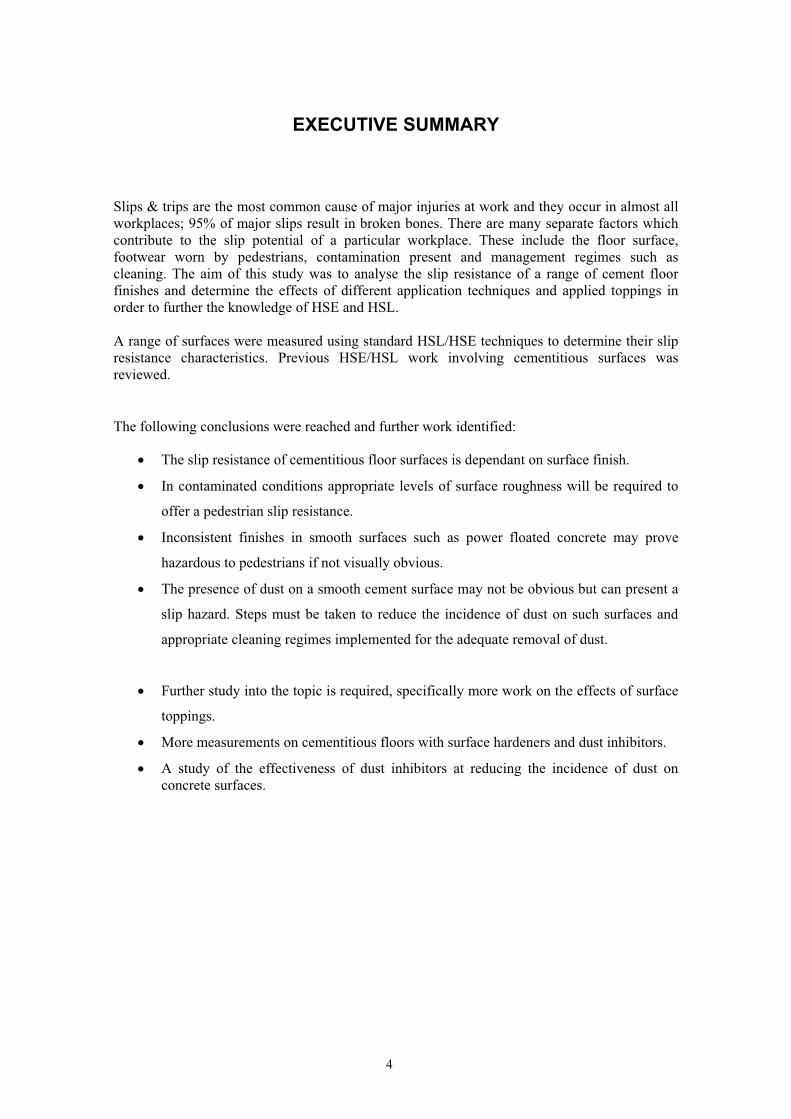
Slips & trips are the most common cause of major injuries at work and they occur in almost all
workplaces; 95% of major slips result in broken bones. There are many separate factors which
contribute to the slip potential of a particular workplace. These include the floor surface,
footwear worn by pedestrians, contamination present and management regimes such as
cleaning. The aim of this study was to analyse the slip resistance of a range of cement floor
finishes and determine the effects of different application techniques and applied toppings in
order to further the knowledge of HSE and HSL.
A range of surfaces were measured using standard HSL/HSE techniques to determine their slip
resistance characteristics. Previous HSE/HSL work involving cementitious surfaces was
reviewed.
The following conclusions were reached and further work identified:
x� The slip resistance of cementitious floor surfaces is dependant on surface finish.
x� In contaminated conditions appropriate levels of surface roughness will be required to
offer a pedestrian slip resistance.
x� Inconsistent finishes in smooth surfaces such as power floated concrete may prove
hazardous to pedestrians if not visually obvious.
x� The presence of dust on a smooth cement surface may not be obvious but can present a
slip hazard. Steps must be taken to reduce the incidence of dust on such surfaces and
appropriate cleaning regimes implemented for the adequate removal of dust.
x� Further study into the topic is required, specifically more work on the effects of surface
toppings.
x� More measurements on cementitious floors with surface hardeners and dust inhibitors.
x� A study of the effectiveness of dust inhibitors at reducing the incidence of dust on
concrete surfaces.
4

1. INTRODUCTION
Slips & trips are the most common cause of major injuries at work and they occur in almost all
workplaces; 95% of major slips result in broken bones. In a typical year, slips and trips account
for 33% of all reported major injuries and 20% of over-3-day injuries to employees. The
construction sector has a higher rate of slips and trips than any other sector. Rarely is there a
single cause of a slipping accident, and so a holistic approach to reducing the number of slip
accidents is required. The major contributing factor in a slip accident is the interaction of the
pedestrians heel and the floor surface. The potential for slip will depend on the footwear worn,
the nature of the floor surface and the presence of any contamination.
Cementitious floors are present in many work places, particularly in the construction sector and
in warehouses. The slip resistance of these surfaces will depend on the application technique
used, and therefore the surface finish obtained. The aim of this study was to assess the slip
resistance of cement floors applied using a variety of techniques and to determine whether the
application of dry shake techniques such as surface hardeners and dust inhibitors effects the slip
properties of the surface.
5
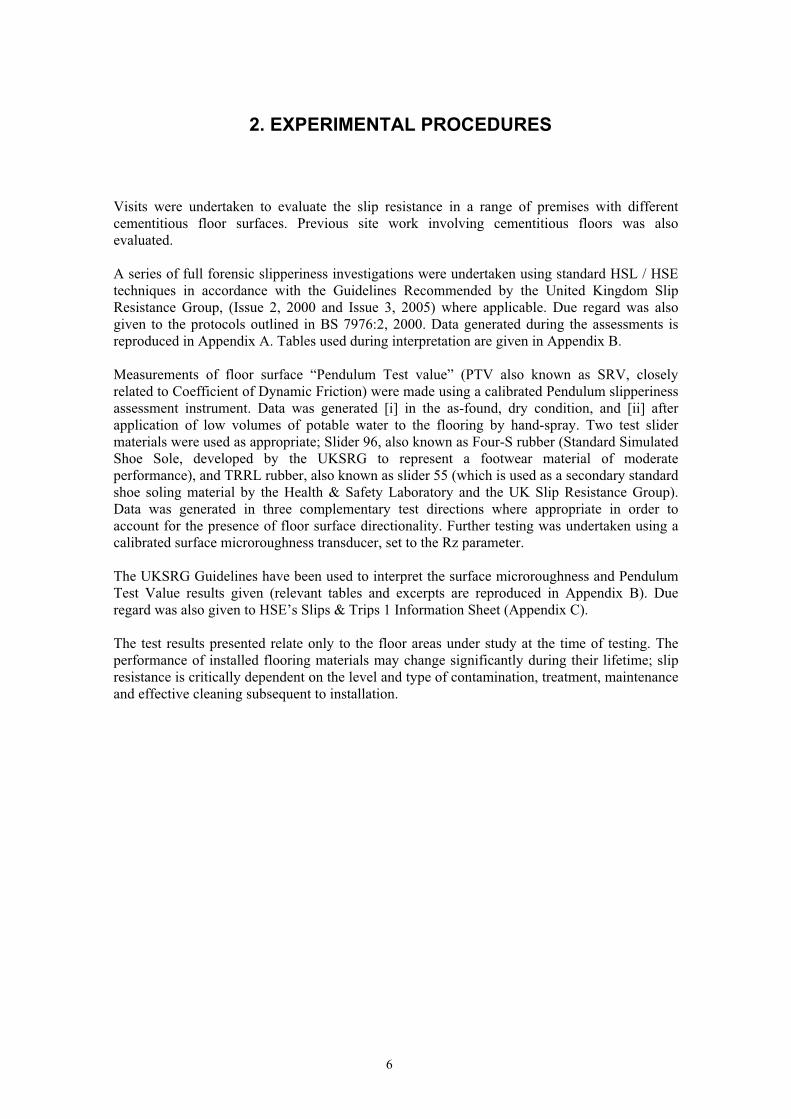
2. EXPERIMENTAL PROCEDURES
Visits were undertaken to evaluate the slip resistance in a range of premises with different
cementitious floor surfaces. Previous site work involving cementitious floors was also
evaluated.
A series of full forensic slipperiness investigations were undertaken using standard HSL / HSE
techniques in accordance with the Guidelines Recommended by the United Kingdom Slip
Resistance Group, (Issue 2, 2000 and Issue 3, 2005) where applicable. Due regard was also
given to the protocols outlined in BS 7976:2, 2000. Data generated during the assessments is
reproduced in Appendix A. Tables used during interpretation are given in Appendix B.
Measurements of floor surface “Pendulum Test value” (PTV also known as SRV, closely
related to Coefficient of Dynamic Friction) were made using a calibrated Pendulum slipperiness
assessment instrument. Data was generated [i] in the as-found, dry condition, and [ii] after
application of low volumes of potable water to the flooring by hand-spray. Two test slider
materials were used as appropriate; Slider 96, also known as Four-S rubber (Standard Simulated
Shoe Sole, developed by the UKSRG to represent a footwear material of moderate
performance), and TRRL rubber, also known as slider 55 (which is used as a secondary standard
shoe soling material by the Health & Safety Laboratory and the UK Slip Resistance Group).
Data was generated in three complementary test directions where appropriate in order to
account for the presence of floor surface directionality. Further testing was undertaken using a
calibrated surface microroughness transducer, set to the Rz parameter.
The UKSRG Guidelines have been used to interpret the surface microroughness and Pendulum
Test Value results given (relevant tables and excerpts are reproduced in Appendix B). Due
regard was also given to HSE’s Slips & Trips 1 Information Sheet (Appendix C).
The test results presented relate only to the floor areas under study at the time of testing. The
performance of installed flooring materials may change significantly during their lifetime; slip
resistance is critically dependent on the level and type of contamination, treatment, maintenance
and effective cleaning subsequent to installation.
6

3. RESULTS
The following table summarises surface roughness and Pendulum Test Values for the range of
surfaces tested. All PTV results are generated with slider 96 rubber, which represents a shod
pedestrian (the most frequent user in all of the areas studied). Full results for each area studied
can be found in Appendix A.
Floor Type Rz Surface
Roughness(µm)
Condition Direction PTV
(slider 96)
Notes
Power floated
concrete
6.0 Dry
Dry
Dry
I
II
III
70
73
73
Wet I 9
Wet II 11
Wet III 11
Power floated
concrete
6.3 Dry I 61
Dusty
Dusty
Dusty
I
II
III
47
41
46
Wet I 21
Wet II 29
Wet III 24
Installed cement 13.7 Damp I 40
paver
Wet I 26
Power floated
concrete, with
hardener
16.8 Dry
Dry
Dry
I
II
III
50
49
45
Greasy,
difficult to
get totally
clean
Wet I 19
Wet II 25
Wet III 21
Power floated
concrete, worn
17.8 Dry
Dry
Dry
I
II
III
65
64
63
Porous
Dusty I 60
Wet
Wet
Wet
I
II
III
39
47
41
Power floated 19.9 Dry I 62
concrete
Dusty I 45
Wet I 30
7

Rough concrete 23.5 Dusty
Dusty
Dusty
I
II
III
56
54
54
Wet I 45
Dusty and
wet
I 40
Rough concrete 38.0 Dusty
Dusty
Dusty
I
II
III
56
58
58
Wet I 54
Dusty and
wet
I 50
Power floated
concrete, worn
39.8 Dry
Dry
Dry
I
II
III
52
47
51
Wet I 38
Wet II 48
Wet III 36
Rough concrete, 49.4 Dry I 69
with
epoxy/aggregate Wet I 69
coating
Rough concrete, 55.5 Dry I 57
etched
Water/chrome I 56
tan
Rough concrete, 58.3 Wet I 40
with aggregate Wet II 41
Wet III 40
Uninstalled 68.2 Dry I 66
cement paver
Wet I 57
Patterned N/A Wet I 40
concrete paver Wet II 45
Wet III 44
Profiled N/A Wet I 67
concrete paver Wet III 54
Wet IV 49
Power floated N/A Wet, paste, I 43
concrete, with paper pulp
epoxy/aggregate
coating
Figure 3.1 Table of surface roughness and PTV data for the range of surfaces studied.
8
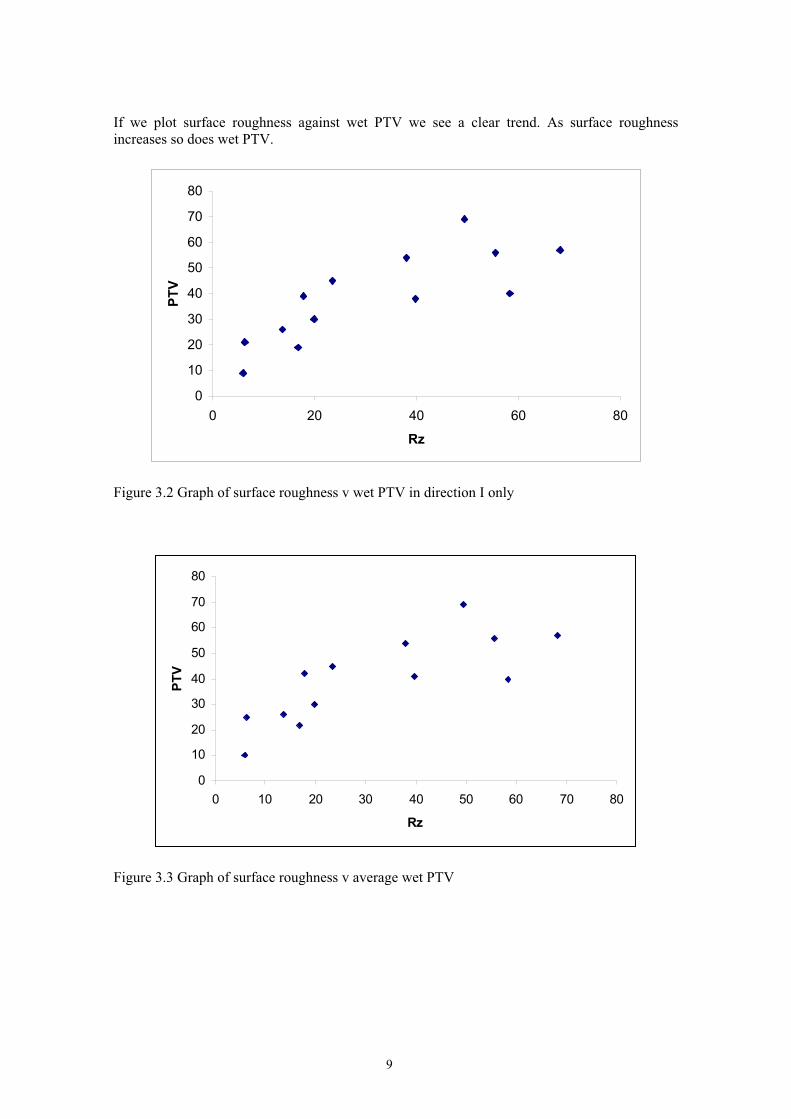
If we plot surface roughness against wet PTV we see a clear trend. As surface roughness
increases so does wet PTV.
80
70
60
50
PT
V
40
30
20
10
0
0 20 40 60 80
Rz
Figure 3.2 Graph of surface roughness v wet PTV in direction I only
PT
V
80
70
60
50
40
30
20
10
0
0 10 20 30 40 50 60 70 80
Rz
Figure 3.3 Graph of surface roughness v average wet PTV
9

4. DISCUSSION
The correlation between Rz and wet PTV was plotted for all surfaces on which both values
could be obtained. Two graphs were produced of Rz against wet PTV in direction I only (Figure
3.2) and Rz against wet PTV where the average of the three directions was taken (Figure 3.3).
Where possible on site, direction I is the main direction of pedestrian travel. If the floor surface
is clean and dry it can be reasonably expected that the floor will present a low slip potential. The
slip potential in contaminated conditions is therefore more important when considering the slip
resistance of a surface.
A rougher surface has a better chance of breaking through a squeeze film of contaminant and
making contact with a pedestrians heel. The more viscous the contaminant the greater the level
of roughness required to offer a high level of slip resistance. Cementitious floor surfaces appear
to behave in a similar manner to other hard surfaces observed in previous HSL/HSE lab work
and site visits. As Rz surface roughness increases so does PTV in contaminated conditions.
The main limitation of this study is the relatively small number of floors measured. Although
the trend shown in Figures 3.2 and 3.3 is quite clear we still know very little about the effects of
various surface toppings. Only one dutyholder in the premises visited knew the exact
specification of the floor. From this work it would appear that surface hardeners do not alter the
slip resistance of a surface, which is still dependant on the level of surface microroughness,
however as only one floor was known for sure to have been treated with a surface hardener this
is far from conclusive evidence.
One of the main problems seen with power floated concrete floors was the inconsistent nature of
the application. Almost all floors studied had rougher and smoother patches within the overall
finish. One of the biggest contributing factors in a slipping accident is a change in the level of
slip resistance underfoot without an accompanying visual difference to warn the pedestrian to
change their gait. This may mean that power floated concrete floors are more dangerous than
consistent surfaces with similar levels of slip resistance.
Another problem with concrete floors, especially newer surfaces, is the generation of dust. Most
of the power floated surfaces studied had significant level of dust present on the surface. This
reduced the dry Pendulum Test Values obtained and quickly built up on the soles of workers
shoes. Often cleaning regimes were not effective enough to remove dust from the surface.
10

5. CONCLUSIONS AND RECOMMENDATIONS
Conclusions
x� The slip resistance of cementitious floor surfaces is dependant on surface finish.
x� In contaminated conditions appropriate levels of surface roughness will be required to
offer a pedestrian slip resistance.
x� Inconsistent finishes in smooth surfaces such as power floated concrete may prove
hazardous to pedestrians if not visually obvious.
x� The presence of dust on a smooth cement surface may not be obvious but can present a
slip hazard. Steps must be taken to reduce the incidence of dust on such surfaces and
appropriate cleaning regimes implemented for the adequate removal of dust.
Recommendations
x� Further study into the topic is required, specifically more work on the effects of surface
toppings.
x� More measurements on cementitious floors with surface hardeners and dust inhibitors.
x� A study of the effectiveness of dust inhibitors at reducing the incidence of dust on
concrete surfaces.
11

APPENDIX A: SLIP RESISTANCE DATA
Area 1: Power floated concrete, warehouse
Smooth Patch
Rz Surface Roughness: 6.3 µm
Pendulum SRV (Four-S Rubber Slider)
Condition Contamination Test Direction SRV As-found Dusty Direction I 47 As-found Dusty Direction II 41 As-found Dusty Direction III 46
As-found Wet Direction I 21 As-found Wet Direction II 29 As-found Wet Direction III 24
As-found Dusty Direction I 45 Cleaned Dry Direction I 61 Cleaned Wet Direction I 24
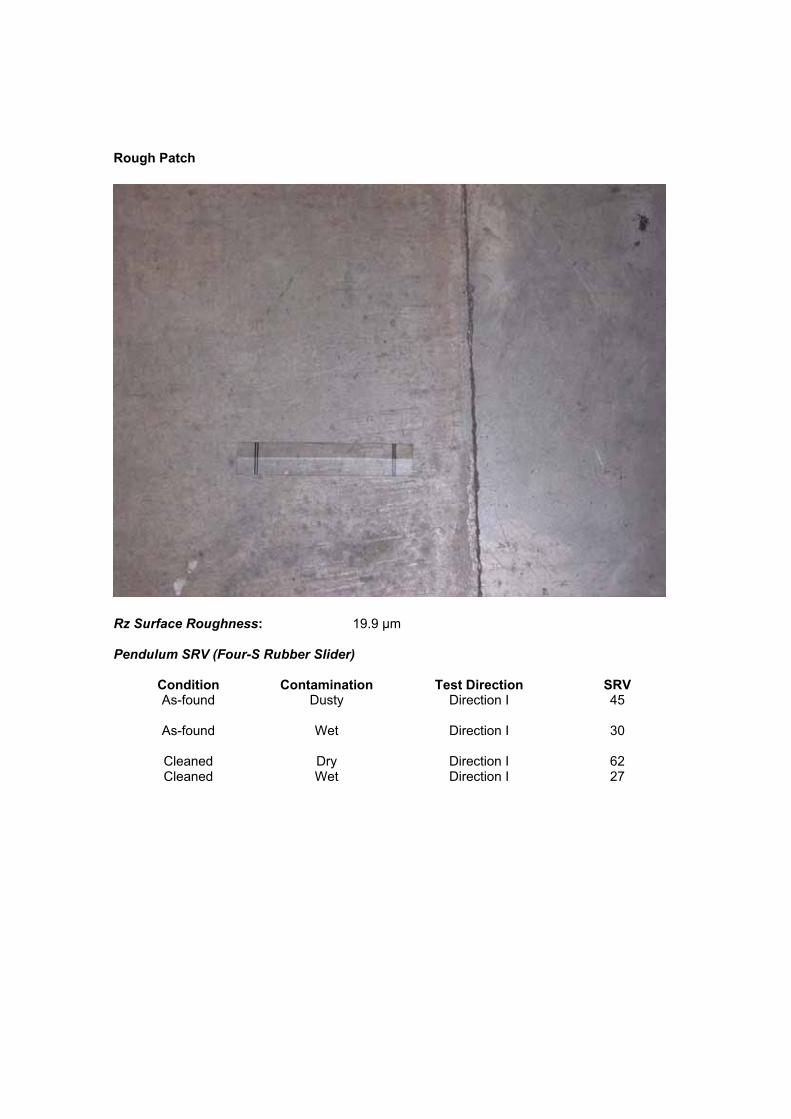
Rough Patch
Rz Surface Roughness: 19.9 µm
Pendulum SRV (Four-S Rubber Slider)
Condition Contamination Test Direction SRV As-found Dusty Direction I 45
As-found Wet Direction I 30
Cleaned Dry Direction I 62 Cleaned Wet Direction I 27
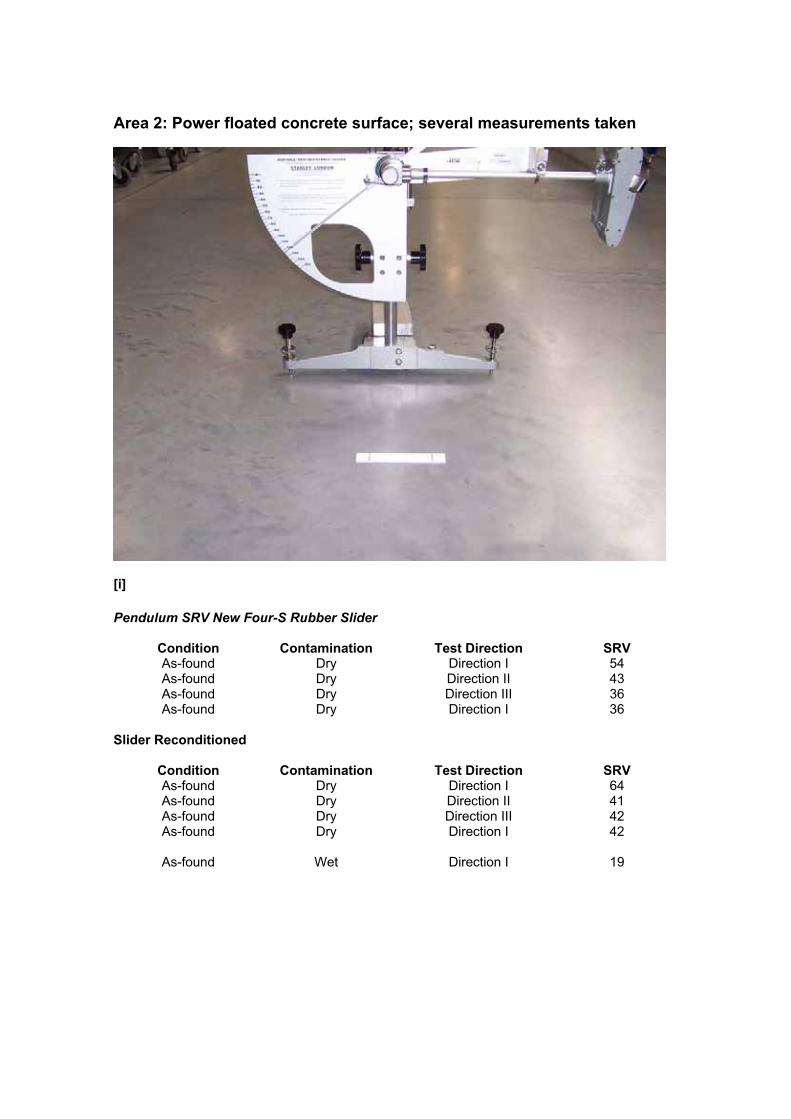
Area 2: Power floated concrete surface; several measurements taken
[i]
Pendulum SRV New Four-S Rubber Slider
Condition Contamination Test Direction SRV As-found Dry Direction I 54 As-found Dry Direction II 43 As-found Dry Direction III 36 As-found Dry Direction I 36
Slider Reconditioned
Condition Contamination Test Direction SRV As-found Dry Direction I 64 As-found Dry Direction II 41 As-found Dry Direction III 42 As-found Dry Direction I 42
As-found Wet Direction I 19
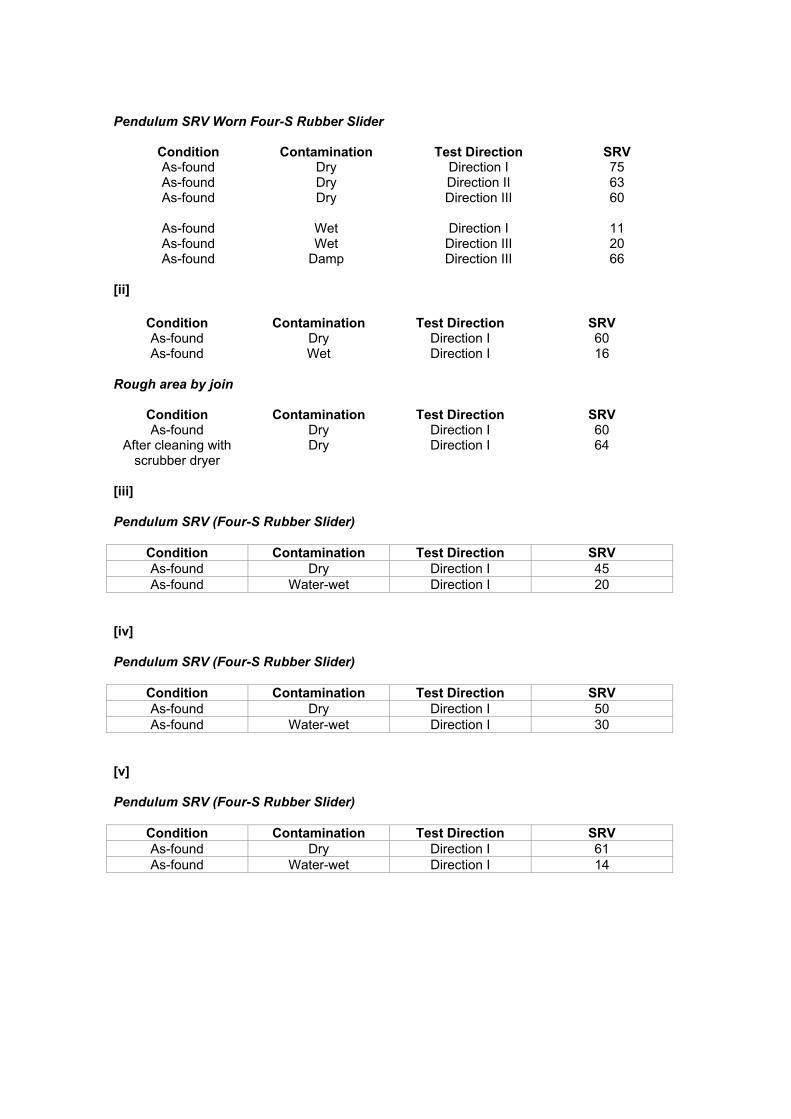
Pendulum SRV Worn Four-S Rubber Slider
[ii]
Condition As-found As-found As-found
As-found As-found As-found
Condition As-found As-found
Rough area by join
Condition As-found
After cleaning with scrubber dryer
[iii]
Contamination Test Direction SRV Dry Direction I 75 Dry Direction II 63 Dry Direction III 60
Wet Direction I 11 Wet Direction III 20
Damp Direction III 66
Contamination Test Direction SRV Dry Direction I 60 Wet Direction I 16
Contamination Test Direction SRV Dry Direction I 60 Dry Direction I 64
Condition Contamination Test Direction SRV
As-found Dry Direction I 45
As-found Water-wet Direction I 20
Condition Contamination Test Direction SRV
As-found Dry Direction I 50
As-found Water-wet Direction I 30
Pendulum SRV (Four-S Rubber Slider)
[iv]
Pendulum SRV (Four-S Rubber Slider)
[v]
Pendulum SRV (Four-S Rubber Slider)
Condition Contamination Test Direction SRV
As-found Dry Direction I 61
As-found Water-wet Direction I 14
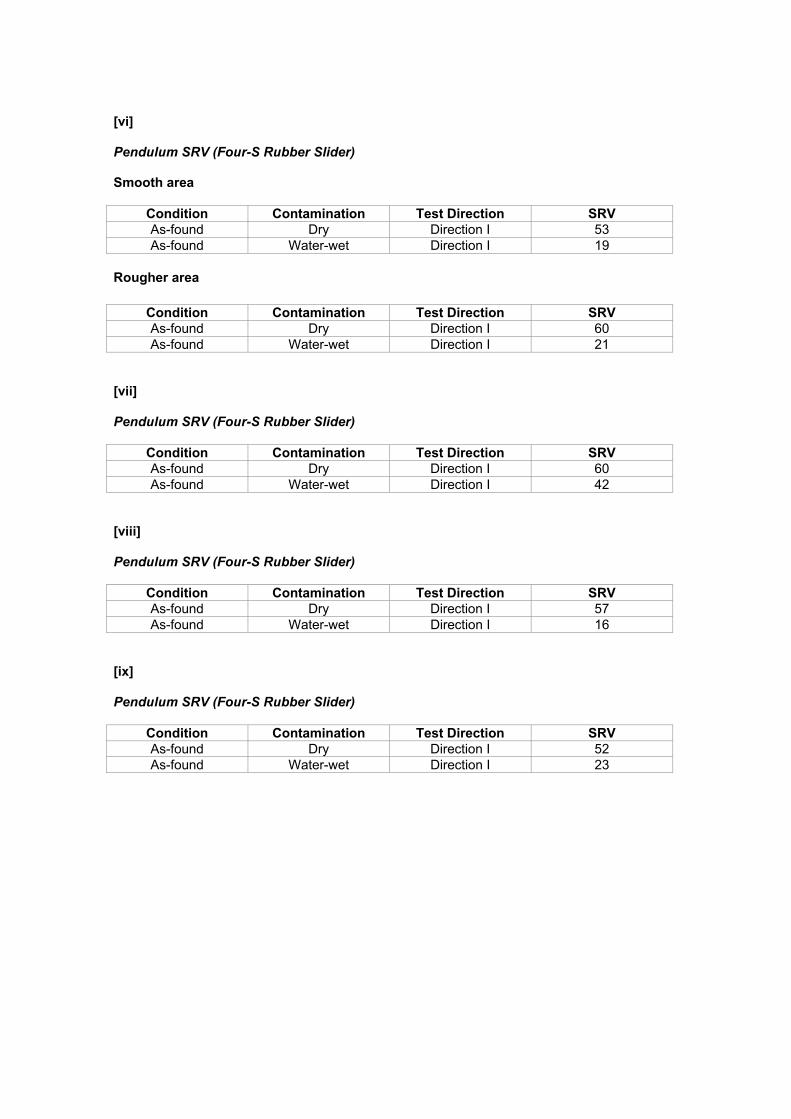
[vi]
Pendulum SRV (Four-S Rubber Slider)
Smooth area
Condition Contamination Test Direction SRV
As-found Dry Direction I 53
As-found Water-wet Direction I 19
Rougher area
Condition Contamination Test Direction SRV
As-found Dry Direction I 60
As-found Water-wet Direction I 21
[vii]
Pendulum SRV (Four-S Rubber Slider)
Condition Contamination Test Direction SRV
As-found Dry Direction I 60
As-found Water-wet Direction I 42
[viii]
Pendulum SRV (Four-S Rubber Slider)
Condition Contamination Test Direction SRV
As-found Dry Direction I 57
As-found Water-wet Direction I 16
[ix]
Pendulum SRV (Four-S Rubber Slider)
Condition Contamination Test Direction SRV
As-found Dry Direction I 52
As-found Water-wet Direction I 23

Area 3: Old power floated concrete floor, worn
Rz Surface Roughness: 17.8 µm
Pendulum SRV (Four-S Rubber Slider)
Condition Contamination Test Direction SRV As-found Dusty Direction I 60 As-found Wet Direction I 39 As-found Dry Direction I 65
As-found Dusty and wet Direction I 45
Swept Dry Direction I 65 Swept Dry Direction II 64 Swept Dry Direction III 63
Swept Wet Direction I 39 Swept Wet Direction II 47 Swept Wet Direction III 41
Swept Damp Direction I 70
Cleaned Dry Direction I 64 Cleaned Wet Direction I 37

Area 4: Treated cement floors
Floor Type: Powerfloated concrete with dry shake hardner
Rz Surface Roughness: 16.8 µm (mean)
PTV (Four-S Rubber Slider)
Condition Contamination Test Direction PTV As-found Dust/grease Direction I 35
Cleaned Dry Direction I 50 Cleaned Dry Direction II 49 Cleaned Dry Direction III 45
Cleaned Wet Direction I 19 Cleaned Wet Direction II 25 Cleaned Wet Direction III 21

Floor Type: Concrete With Epoxy / Aggregate Coating
Rz Surface Roughness: 49.4 µm (mean)
PTV (Four-S Rubber Slider)
Condition Contamination Test Direction PTV As-found Dry Direction I 69
Cleaned Wet Direction I 69
Contaminated Edge
PTV (Four-S Rubber Slider)
Condition Contamination Test Direction PTV As-found Wet Direction I 71
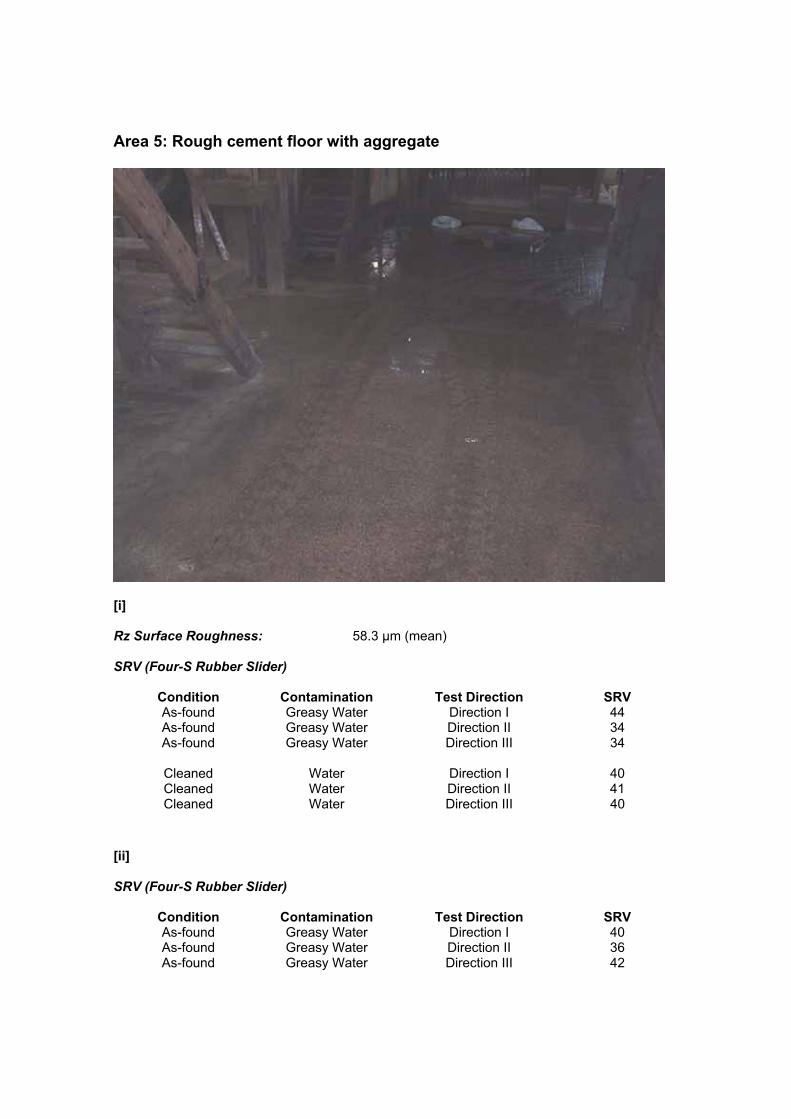
Area 5: Rough cement floor with aggregate
[i]
Rz Surface Roughness: 58.3 µm (mean)
SRV (Four-S Rubber Slider)
Condition As-found As-found As-found
Contamination Greasy Water Greasy Water Greasy Water
Cleaned Cleaned Cleaned
Water Water Water
[ii]
SRV (Four-S Rubber Slider)
Condition As-found As-found As-found
Contamination Greasy Water Greasy Water Greasy Water
Test Direction SRV Direction I 44 Direction II 34 Direction III 34
Direction I 40 Direction II 41 Direction III 40
Test Direction SRV Direction I 40 Direction II 36 Direction III 42

[iii]
Rz Surface Roughness: 55.5 µm (mean)
SRV (Four-S Rubber Slider)
Condition Contamination Test Direction SRV As-found Dry Direction I 57
As-found Chrome tan/water Direction I 56

Area 6: Concrete paving slabs
[i]
Surface type: Patterned concrete paver
Pendulum Tests (Rubber Slider 96)
Condition Contamination Test Direction PTV As-found Wet Direction I 40
As-found Wet Direction II 45 As-found Wet Direction III 44
Pendulum Tests (TRRL Rubber Slider)
Condition Contamination Test Direction PTV As-found Wet Direction I 32
As-found Wet Direction II 31 As-found Wet Direction III 32
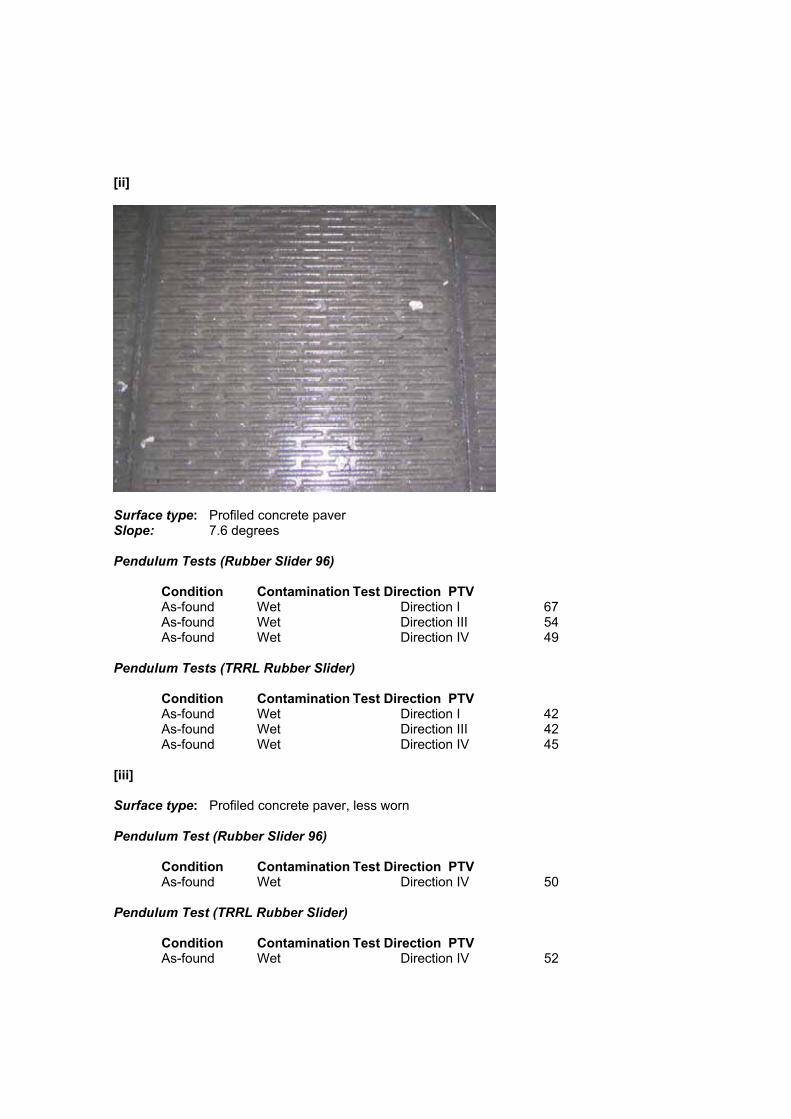
[ii]
Surface type: Profiled concrete paver Slope: 7.6 degrees
Pendulum Tests (Rubber Slider 96)
Condition Contamination Test Direction PTV As-found Wet Direction I 67
As-found Wet Direction III 54 As-found Wet Direction IV 49
Pendulum Tests (TRRL Rubber Slider)
Condition Contamination Test Direction PTV As-found Wet Direction I 42
As-found Wet Direction III 42 As-found Wet Direction IV 45
[iii]
Surface type: Profiled concrete paver, less worn
Pendulum Test (Rubber Slider 96)
Condition Contamination Test Direction PTV As-found Wet Direction IV 50
Pendulum Test (TRRL Rubber Slider)
Condition Contamination Test Direction PTV As-found Wet Direction IV 52

Area 7: Power floated concrete, worn
Temperature: Approx. 5°C
Rz Surface Roughness: 39.8 µm (mean)
Pendulum SRV (Four-S Rubber Slider)
Condition Contamination Test Direction SRV As-found Dry Direction I 52 As-found Dry Direction II 47 As-found Dry Direction III 51
As-found Water-wet Direction I 38 As-found Water-wet Direction II 48 As-found Water-wet Direction III 36 Cleaned Water-wet Direction I 52 As-found Hydraulic Oil Direction I 20
Pendulum SRV (TRRL Rubber Slider)
Condition Contamination Test Direction SRV As-found Dry Direction I 78 As-found Dry Direction II 82 As-found Dry Direction III 86
As-found Water-wet Direction I 39 As-found Water-wet Direction II 34 As-found Water-wet Direction III 41 Cleaned Water-wet Direction I 49 As-found Hydraulic Oil Direction I 15
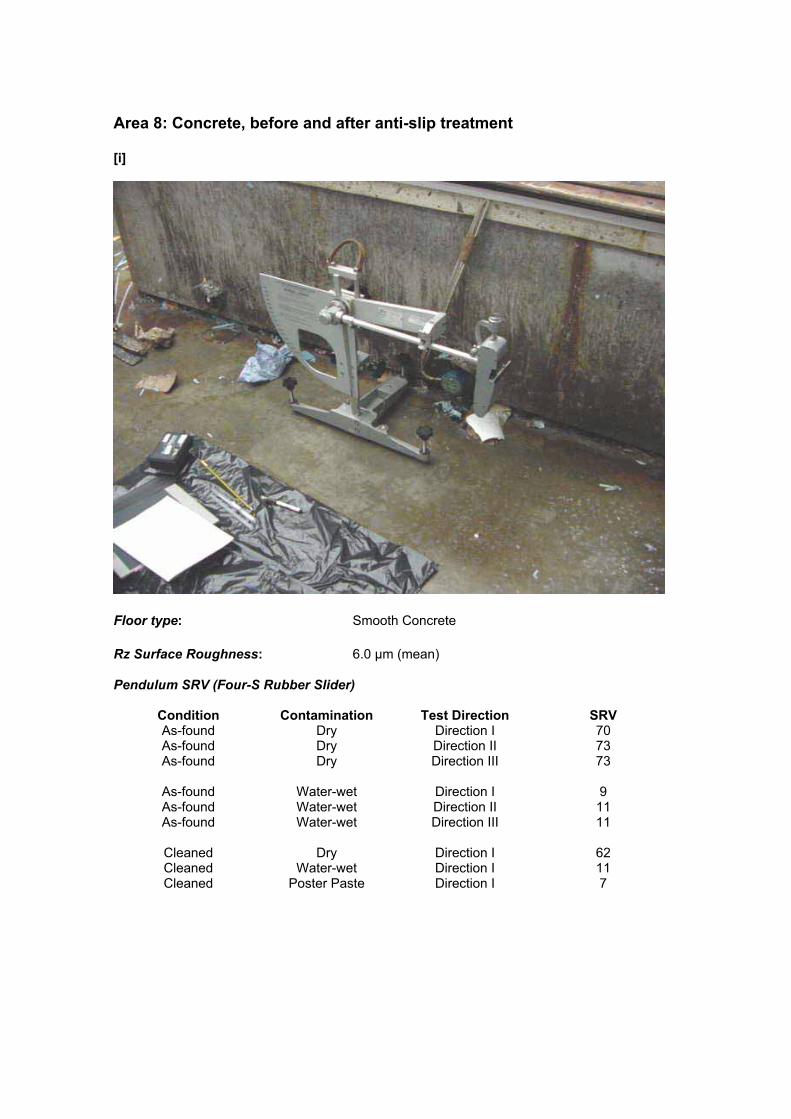
Area 8: Concrete, before and after anti-slip treatment
[i]
Floor type: Smooth Concrete
Rz Surface Roughness: 6.0 µm (mean)
Pendulum SRV (Four-S Rubber Slider)
Condition Contamination Test Direction SRV As-found Dry Direction I 70 As-found Dry Direction II 73 As-found Dry Direction III 73
As-found Water-wet Direction I 9 As-found Water-wet Direction II 11 As-found Water-wet Direction III 11
Cleaned Dry Direction I 62 Cleaned Water-wet Direction I 11 Cleaned Poster Paste Direction I 7
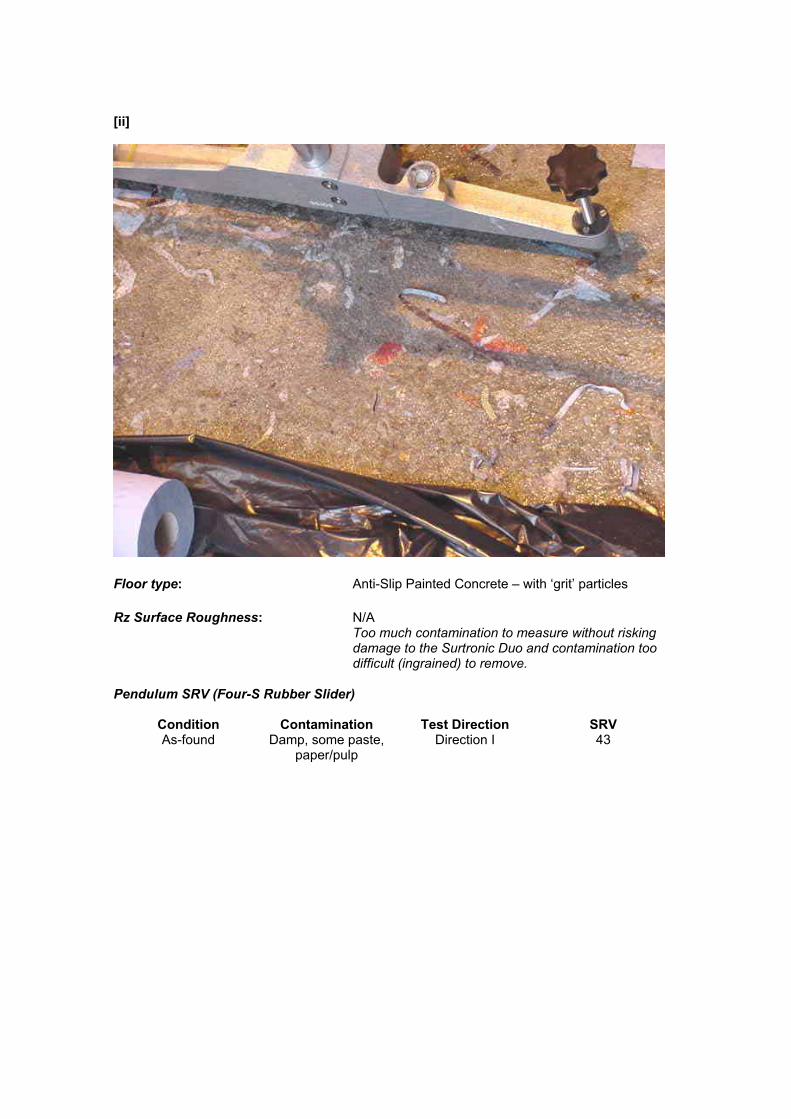
[ii]
Floor type: Anti-Slip Painted Concrete – with ‘grit’ particles
Rz Surface Roughness: N/A Too much contamination to measure without risking damage to the Surtronic Duo and contamination too difficult (ingrained) to remove.
Pendulum SRV (Four-S Rubber Slider)
Condition Contamination Test Direction SRV As-found Damp, some paste, Direction I 43
paper/pulp

Area 9: Cement paving, installed and uninstalled
[i]
Rz Surface Roughness: 13.7 µm (mean)
Pendulum SRV (Four-S Rubber Slider)
Condition Contamination Test Direction SRV As-found Damp / Drying Direction I 40
As-found Water-wet Direction I 26

[ii]
Rz Surface Roughness: 68.2 µm (mean)
Pendulum SRV (Four-S Rubber Slider)
Condition Contamination Test Direction SRV As-found Dry Direction I 66 As-found Water-wet Direction I 57
Pendulum SRV (TRRL Rubber Slider)
Condition Contamination Test Direction SRV As-found Dry Direction I 91 As-found Water-wet Direction I 65

Area 10: Rough concrete, warehouse
[i]
Rz Surface Roughness:
PTV (Slider 96 rubber)
Condition As-found As-found As-found
As-found
Cleaned Cleaned
As-found
38.0 µm (mean)
Contamination Test Direction PTV Dusty Direction I 56 Dusty Direction II 58 Dusty Direction III 58
Dusty and wet Direction I 50
Dry Direction I 52 Wet Direction I 54
Deep compacted Direction I 54 dust
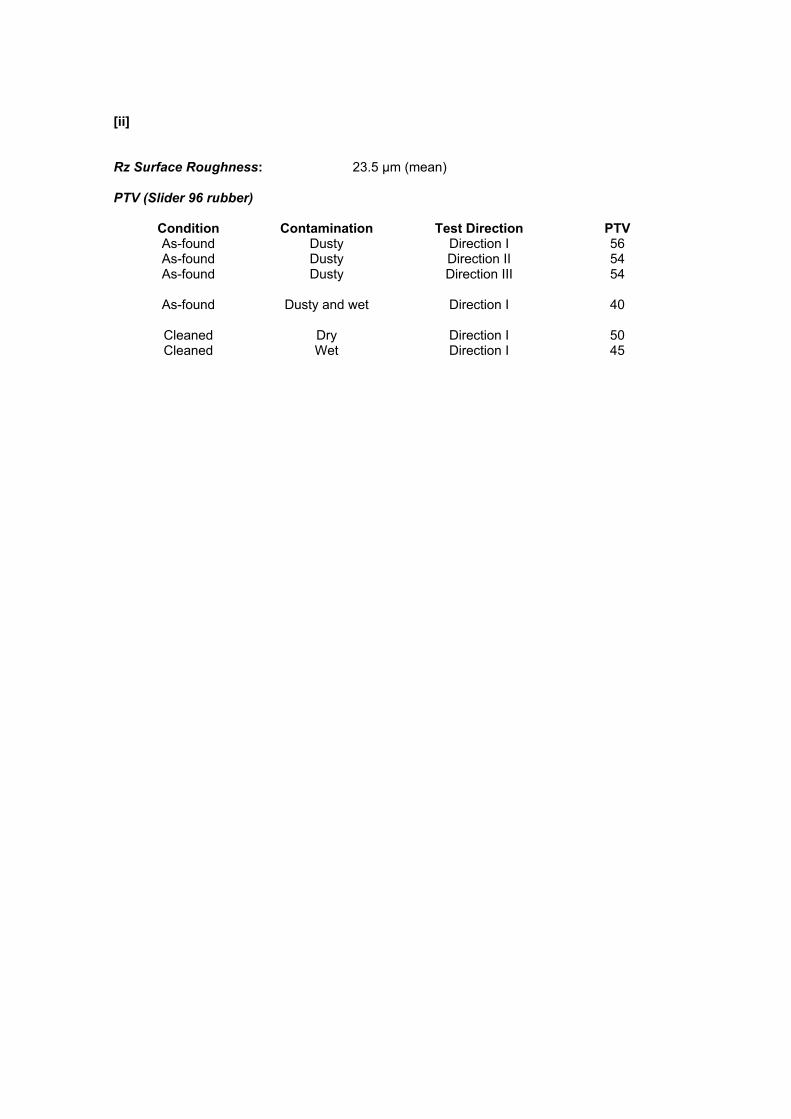
[ii]
Rz Surface Roughness:
PTV (Slider 96 rubber)
Condition As-found As-found As-found
As-found
Cleaned Cleaned
23.5 µm (mean)
Contamination Test Direction PTV Dusty Direction I 56 Dusty Direction II 54 Dusty Direction III 54
Dusty and wet Direction I 40
Dry Direction I 50 Wet Direction I 45

APPENDIX B: UKSRG GUIDELINES
EXCERPTS FROM “THE MEASUREMENT OF FLOOR SLIP RESISTANCE - GUIDELINES RECOMMENDED BY THE UK SLIP RESISTANCE GROUP”, ISSUE 2, JUNE 2000.
IMPORTANT NOTE: Research in the UK by the Health and Safety Executive (HSE) has identified that more than 90% of slipping accidents occur on wet floors, most usually on relatively smooth surfaces. Evaluation of the slip resistance of floors is not an exact science. In addition to selected measuring instruments, it demands the relevant expertise and methodical procedures. In this context these guidelines offer advisory information in respect of measuring the slip resistance of flooring materials under water-wet conditions.
The information within this document, which may be revised as knowledge and understanding of pedestrian slipping increase, does not define the ‘safety status’ of any floor or flooring material at any stage of its service life.
Four-S Pendulum Value Potential for Slip
25 and below High
25 to 35 Moderate
35 to 65 Low
Above 65 Extremely Low
TRRL Pendulum Value Potential for Slip
19 and below High
20 to 39 Moderate
40 to 74 Low
Above 75 Extremely Low
Rz (Rtm) Surface Roughness* Potential for Slip
Below 10 High
Between 10 and 20 Moderate
Above 20 and up to 30 Low
Above 30 Extremely Low
*Roughness values applicable for water-wet, low activity pedestrian areas.
EXCERPTS FROM “THE MEASUREMENT OF FLOOR SLIP RESISTANCE - GUIDELINES RECOMMENDED BY THE UK SLIP RESISTANCE GROUP”, ISSUE 3, 2005.
Pendulum Test Value Potential for Slip
24 and below High
25 to 35 Moderate
36 and above Low
Rz (Rtm) Surface Roughness* Potential for Slip
Below 10 High
Between 10 and 20 Moderate
Above 20 Low

APPENDIX C: HSE INFORMATION SHEET SLIPS & TRIPS 1
Health and Safety ExecutiveHealth and Safety Executive
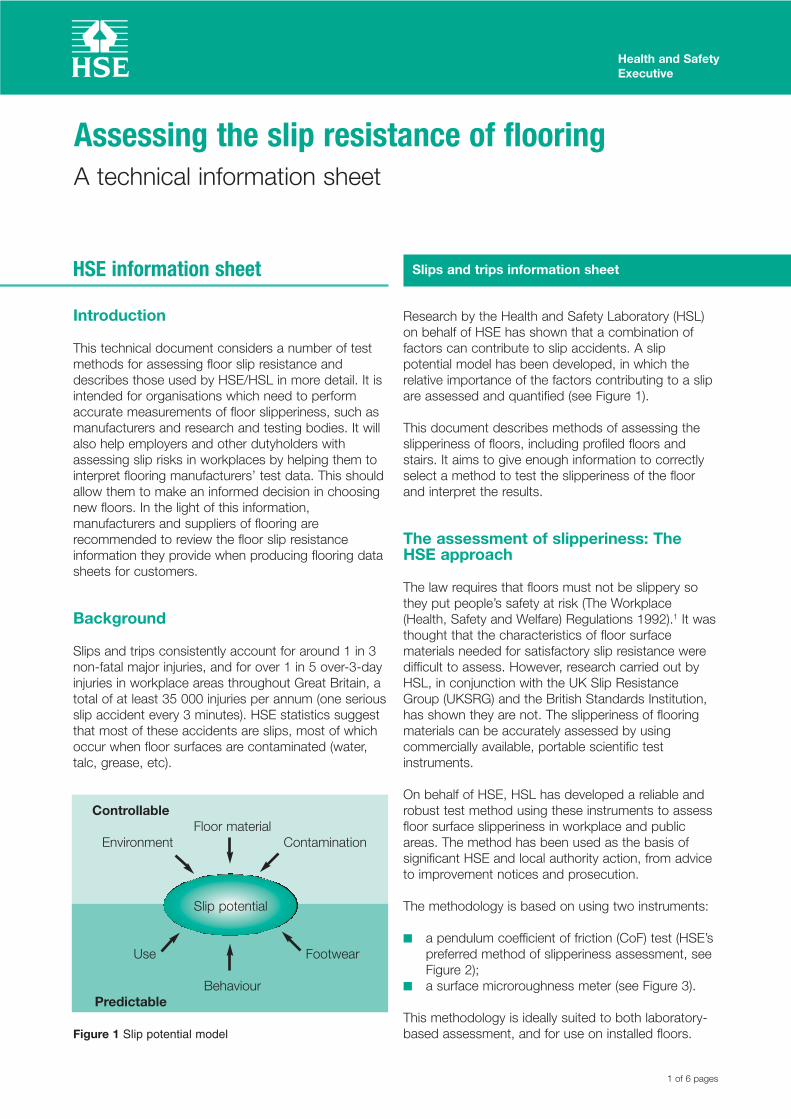
Assessing the slip resistance of flooringA technical information sheet
HSE information sheet
Introduction
This technical document considers a number of test methods for assessing floor slip resistance and describes those used by HSE/HSL in more detail. It is intended for organisations which need to perform accurate measurements of floor slipperiness, such as manufacturers and research and testing bodies. It will also help employers and other dutyholders with assessing slip risks in workplaces by helping them to interpret flooring manufacturers’ test data. This should allow them to make an informed decision in choosing new floors. In the light of this information, manufacturers and suppliers of flooring are recommended to review the floor slip resistance information they provide when producing flooring data sheets for customers.
Background
Slips and trips consistently account for around 1 in 3 non-fatal major injuries, and for over 1 in 5 over-3-day injuries in workplace areas throughout Great Britain, a total of at least 35 000 injuries per annum (one serious slip accident every 3 minutes). HSE statistics suggest that most of these accidents are slips, most of which occur when floor surfaces are contaminated (water, talc, grease, etc).
Slip potential
Floor material Contamination
Use
Behaviour
Footwear
Environment
Predictable
Controllable
Figure 1 Slip potential model
Slips and trips information sheet
Research by the Health and Safety Laboratory (HSL) on behalf of HSE has shown that a combination of factors can contribute to slip accidents. A slip potential model has been developed, in which the relative importance of the factors contributing to a slip are assessed and quantified (see Figure 1).
This document describes methods of assessing the slipperiness of floors, including profiled floors and stairs. It aims to give enough information to correctly select a method to test the slipperiness of the floor and interpret the results.
The assessment of slipperiness: The HSE approach
The law requires that floors must not be slippery so they put people’s safety at risk (The Workplace (Health, Safety and Welfare) Regulations 1992).1 It was thought that the characteristics of floor surface materials needed for satisfactory slip resistance were difficult to assess. However, research carried out by HSL, in conjunction with the UK Slip Resistance Group (UKSRG) and the British Standards Institution, has shown they are not. The slipperiness of flooring materials can be accurately assessed by using commercially available, portable scientific test instruments.
On behalf of HSE, HSL has developed a reliable and robust test method using these instruments to assess floor surface slipperiness in workplace and public areas. The method has been used as the basis of significant HSE and local authority action, from advice to improvement notices and prosecution.
The methodology is based on using two instruments:
■ a pendulum coefficient of friction (CoF) test (HSE’s preferred method of slipperiness assessment, see Figure 2);
■ a surface microroughness meter (see Figure 3).
This methodology is ideally suited to both laboratory-based assessment, and for use on installed floors.
1 of 6 pages
Health and Safety Executive
The data generated may be strengthened by considering additional test data where appropriate.
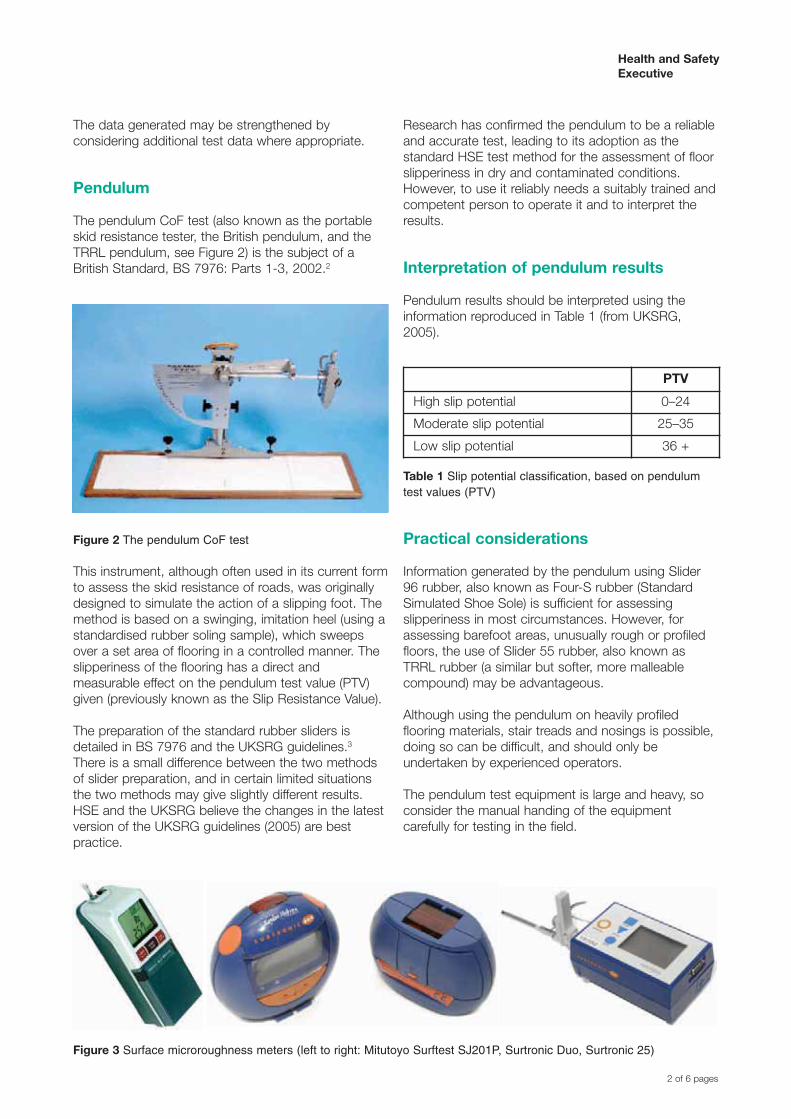
Pendulum
The pendulum CoF test (also known as the portable skid resistance tester, the British pendulum, and the TRRL pendulum, see Figure 2) is the subject of a British Standard, BS 7976: Parts 1-3, 2002.2
Research has confirmed the pendulum to be a reliable and accurate test, leading to its adoption as the standard HSE test method for the assessment of floor slipperiness in dry and contaminated conditions. However, to use it reliably needs a suitably trained and competent person to operate it and to interpret the results.
Interpretation of pendulum results
Pendulum results should be interpreted using the information reproduced in Table 1 (from UKSRG, 2005).
PTV
High slip potential 0–24
Moderate slip potential 25–35
Low slip potential 36 +
Figure 2 The pendulum CoF test
This instrument, although often used in its current form to assess the skid resistance of roads, was originally designed to simulate the action of a slipping foot. The method is based on a swinging, imitation heel (using a standardised rubber soling sample), which sweeps over a set area of flooring in a controlled manner. The slipperiness of the flooring has a direct and measurable effect on the pendulum test value (PTV) given (previously known as the Slip Resistance Value).
The preparation of the standard rubber sliders is detailed in BS 7976 and the UKSRG guidelines.3
There is a small difference between the two methods of slider preparation, and in certain limited situations the two methods may give slightly different results. HSE and the UKSRG believe the changes in the latest version of the UKSRG guidelines (2005) are best practice.
Table 1 Slip potential classification, based on pendulum test values (PTV)
Practical considerations
Information generated by the pendulum using Slider 96 rubber, also known as Four-S rubber (Standard Simulated Shoe Sole) is sufficient for assessing slipperiness in most circumstances. However, for assessing barefoot areas, unusually rough or profiled floors, the use of Slider 55 rubber, also known as TRRL rubber (a similar but softer, more malleable compound) may be advantageous.
Although using the pendulum on heavily profiled flooring materials, stair treads and nosings is possible, doing so can be difficult, and should only be undertaken by experienced operators.
The pendulum test equipment is large and heavy, so consider the manual handing of the equipment carefully for testing in the field.
Figure 3 Surface microroughness meters (left to right: Mitutoyo Surftest SJ201P, Surtronic Duo, Surtronic 25)
2 of 6 pages

Health and Safety Executive
Surface microroughness
An indication of slipperiness in water-contaminated conditions may be simply obtained by measuring the surface roughness of flooring materials. Roughness measurements may also be used to monitor changes in floor surface characteristics, such as wear. Research has shown that measurement of the Rz parameter allows slipperiness to be predicted for a range of common materials. Rz is a measure of total surface roughness, calculated as the mean of several peak-to-valley measurements.
Interpretation of surface roughness
When surface microroughness data is used to supplement pendulum test data, the roughness results should be interpreted using the information reproduced in Table 2 (from UKSRG, 2005). Where only roughness data is available, use it in conjunction with the Slips Assessment Tool (SAT) detailed below.
Rz surface roughness
Below 10 µm High slip potential
10–20 µm Moderate slip potential
20 + µm Low slip potential
Table 2 Slip potential classification, based on Rz microroughness values (applicable for water-wet pedestrian areas)
Practical considerations: Roughness meters
Research has shown that the Rz roughness parameter gives a good indication of floor slipperiness in water-contaminated conditions. The measurement of Rz using a hand-held meter is simple and quick. It is possible to measure other roughness parameters that give a more complete picture of floor surface slipperiness (this is the subject of ongoing research). Although the use of portable, commercially available roughness meters (see Figure 3) for assessing floor surface slipperiness is increasing, they are unsuitable for use on carpet, undulating or very rough floors.
The figures quoted in Table 2 relate to floor surface slipperiness in water-contaminated conditions. If there are other contaminants, differing levels of roughness will be needed to lower slip potential. As a general rule, a higher level of surface roughness is needed to maintain slip resistance with a more viscous (thicker) contaminant. Note that the figures in Table 3 are typical Rz surface microroughness levels at which floors are likely to result in a low slip potential, as a
function of contaminant type and should not be used on their own for specifying floors.
Minimum roughness (Rz)
Contaminant
20 µm Clean water, coffee, soft drinks
45 µm Soap solution, milk
60 µm Cooking stock
70 µm Motor oil, olive oil
above 70 µm Gear oil, margarine
Table 3 Typical Rz surface microroughness levels for a low slip potential, as a function of contaminant type
Where the size of the pendulum tester limits its use, such as on stairs, surface microroughness can be used to compare the surface with an area of the same surface that can be tested using the pendulum.
Slips assessment tool (SAT)
HSE and HSL have produced a PC-based software package to assess the slip potential presented by level pedestrian walkway surfaces. The SAT prompts the user to collect surface microroughness data from the test area, using a hand-held meter. The SAT supplements the surface microroughness data (Rz) with other relevant information from the pedestrian slip potential model. This includes the causes of floor surface contamination, the regimes used to clean the floor surface (both in terms of their effectiveness and frequency), the footwear types worn in the area, along with associated human factors and environmental factors. On completion, a slip risk classification is supplied to the user; this gives an indication of the potential for a slip. SAT is designed to assist in the decision-making process when considering the risk of slipping in a defined area, and can be used iteratively to show the influence of different control measures. However, it should not be relied upon when considering the performance of just the flooring; in this instance a suitable CoF test should be used. The SAT software can be downloaded free from www.hsesat.info.
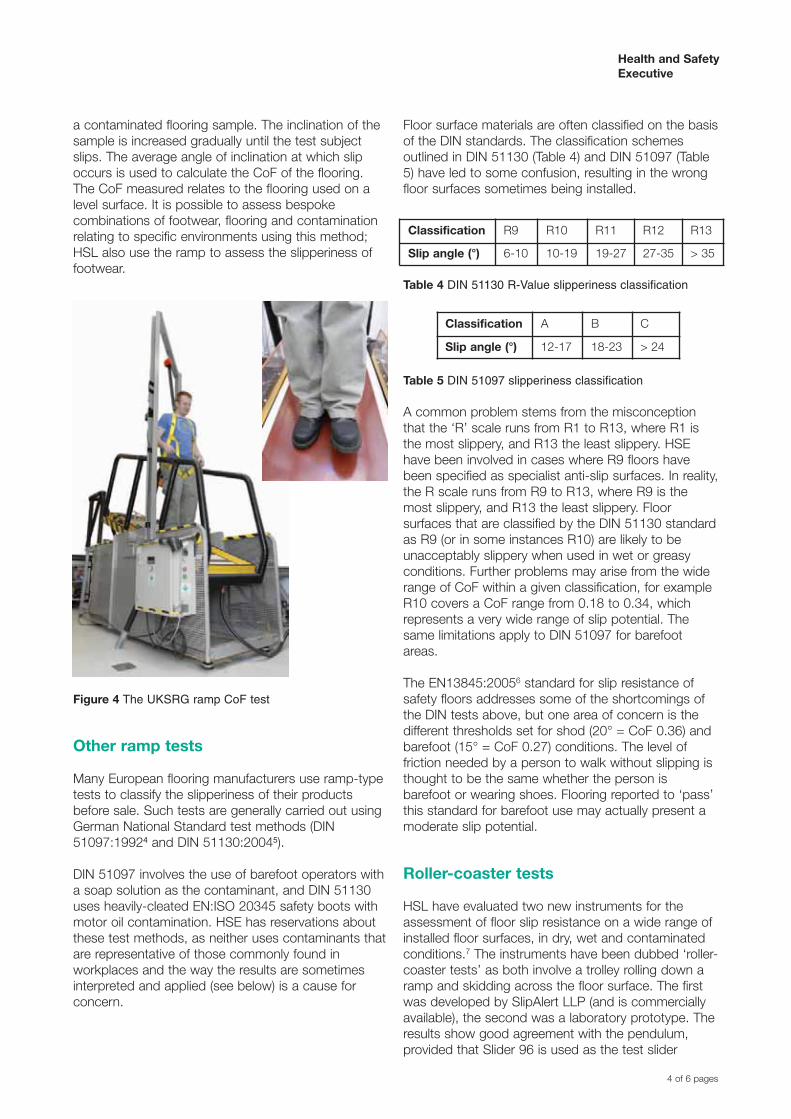
The UKSRG ramp test
The UKSRG ramp test (Figure 4) is designed to simulate the conditions commonly encountered in typical workplace slip accidents. Clean water is used as the contaminant and footwear with a standardised soling material is used, although barefoot testing may also be undertaken. The test method involves using test subjects who walk forwards and backwards over
3 of 6 pages
Health and Safety Executive
a contaminated flooring sample. The inclination of the sample is increased gradually until the test subject slips. The average angle of inclination at which slip occurs is used to calculate the CoF of the flooring. The CoF measured relates to the flooring used on a level surface. It is possible to assess bespoke combinations of footwear, flooring and contamination relating to specific environments using this method; HSL also use the ramp to assess the slipperiness of footwear.
Figure 4 The UKSRG ramp CoF test
Other ramp tests
Many European flooring manufacturers use ramp-type tests to classify the slipperiness of their products before sale. Such tests are generally carried out using German National Standard test methods (DIN 51097:19924 and DIN 51130:20045).
DIN 51097 involves the use of barefoot operators with a soap solution as the contaminant, and DIN 51130 uses heavily-cleated EN:ISO 20345 safety boots with motor oil contamination. HSE has reservations about these test methods, as neither uses contaminants that are representative of those commonly found in workplaces and the way the results are sometimes interpreted and applied (see below) is a cause for concern.
Floor surface materials are often classified on the basis of the DIN standards. The classification schemes outlined in DIN 51130 (Table 4) and DIN 51097 (Table 5) have led to some confusion, resulting in the wrong floor surfaces sometimes being installed.
Table 4 DIN 51130 R-Value slipperiness classification
Classification R9 R10 R11 R12 R13
Slip angle (°) 6-10 10-19 19-27 27-35 > 35
Classification A B C
Slip angle (°) 12-17 18-23 > 24
Table 5 DIN 51097 slipperiness classification
A common problem stems from the misconception that the ‘R’ scale runs from R1 to R13, where R1 is the most slippery, and R13 the least slippery. HSE have been involved in cases where R9 floors have been specified as specialist anti-slip surfaces. In reality, the R scale runs from R9 to R13, where R9 is the most slippery, and R13 the least slippery. Floor surfaces that are classified by the DIN 51130 standard as R9 (or in some instances R10) are likely to be unacceptably slippery when used in wet or greasy conditions. Further problems may arise from the wide range of CoF within a given classification, for example R10 covers a CoF range from 0.18 to 0.34, which represents a very wide range of slip potential. The same limitations apply to DIN 51097 for barefoot areas.
The EN13845:20056 standard for slip resistance of safety floors addresses some of the shortcomings of the DIN tests above, but one area of concern is the different thresholds set for shod (20° = CoF 0.36) and barefoot (15° = CoF 0.27) conditions. The level of friction needed by a person to walk without slipping is thought to be the same whether the person is barefoot or wearing shoes. Flooring reported to ‘pass’ this standard for barefoot use may actually present a moderate slip potential.
Roller-coaster tests
HSL have evaluated two new instruments for the assessment of floor slip resistance on a wide range of installed floor surfaces, in dry, wet and contaminated conditions.7 The instruments have been dubbed ‘roller-coaster tests’ as both involve a trolley rolling down a ramp and skidding across the floor surface. The first was developed by SlipAlert LLP (and is commercially available), the second was a laboratory prototype. The results show good agreement with the pendulum, provided that Slider 96 is used as the test slider
4 of 6 pages

Health and Safety Executive
material. Roller-coaster tests are more portable than the pendulum and may be used by people with little or no experience of floor surface assessment. A large test area is required, however, which can limit their applicability in some situations. As the test slider can travel a significant distance over the floor surface, it measures the average slip resistance of the area tested. This may limit the ability of these tests to identify small areas of slippery flooring surrounded by more slip-resistant flooring; it may be important to identify such small areas during an investigation. However, if visual inspection reveals areas with differing visual appearance (due to wear or inconsistency), microroughness measurements may be taken to highlight these differences. Furthermore, although it may be difficult to demonstrate the effect of a liquid spill on the slip resistance of the floor using these test methods, the effects of such spills can be accurately measured.
(a)
(b)
Figure 5 Roller-coaster slip tests (a) SlipAlert CoF test (b) The laboratory prototype
CoF test
Sled-type tests
The instruments that have been dubbed ‘sled tests’ involve a self-powered trolley that drags itself across the floor surface, measuring the CoF as it moves. Laboratory-based assessments have strongly suggested that several tests currently available (particularly those based on ‘sled-type’ principles) can produce misleading data in wet conditions. Information from such tests shows that some smooth flooring appears to be less slippery in wet conditions than when dry; this is clearly at odds with everyday experience. Such tests may give credible results in dry conditions, though it should be stressed that the vast majority of slipping accidents occur in wet, contaminated conditions.
(b)
(a)
Figure 6 Sled-type tests (a) The FSC2000 (b) the Tortus test
Interpretation of manufacturers’ data
Most slip resistance information provided by flooring manufacturers is produced from as-supplied products (ie ex-factory). The slipperiness of flooring materials can change significantly due to the installation process (due to grouting, burnishing, polishing), after short periods of use, due to inappropriate maintenance or longer-term wear. Furthermore, data quoted simply as CoF should be viewed with uncertainty, as the type of CoF test used can have a critical affect on the validity of the data.
The test data needed to characterise a floor should relate to the floor as finished for the intended use and with any contamination present in normal use.
References and further reading
References
1 Workplace health, safety and welfare. Workplace (Health, Safety and Welfare) Regulations 1992. Approved Code of Practice L24 HSE Books 1992 ISBN 0 7176 0413 6
2 BS 7976-1:2002 Pendulum testers. Specification British Standards Institution 2002 ISBN 0 580 40144 8
BS 7976-2:2002 Pendulum testers. Method of operation British Standards Institution 2002 ISBN 0 580 40145 6
BS 7976-3:2002 Pendulum testers. Method of calibration British Standards Institution 2002 ISBN 0 580 40146 4
5 of 6 pages

3 The assessment of floor slip resistance Issue 3 United Kingdom Slip Resistance Group, 2005
4 DIN 51097: 1992 Testing of floor coverings; determination of the anti-slip properties; wet-loaded barefoot areas; walking method; ramp test German National Standard 1992
5 DIN 51130: 2004 Testing of floor coverings; determination of the anti-slip properties; workrooms and fields of activities with slip danger; walking method; ramp test German National Standard 2004
6 EN13845:2005 Resilient floor coverings: Polyvinyl chloride floor coverings with particle based enhanced slip resistance. Specification British Standards Institution 2005 ISBN 0 580 46677 9
7 Evaluation of the Kirchberg Rolling Slider and SlipAlert Slip Resistance Meters Available at www.hse.gov.uk/research/hsl_pdf/2006/hsl0665.pdf
Further reading
Safer surfaces to walk on, reducing the risk of slipping CIRIA C652 2006
Slips and trips: Guidance for employers on identifying hazards and controlling risks HSG155 HSE Books 1996 ISBN 0 7176 1145 0
Slips and trips: Guidance for the food processing industry HSG156 HSE Books 1996 ISBN 0 7176 0832 8
More information about slips and trips can be found at www.hse.gov.uk/slips and at www.hsl.gov.uk/capabilities/pedestrian.htm.
Health and Safety Executive
Further information
HSE priced and free publications are available by mail order from HSE Books, PO Box 1999, Sudbury, Suffolk CO10 2WA Tel: 01787 881165 Fax: 01787 313995 Website: www.hsebooks.co.uk (HSE priced publications are also available from bookshops and free leaflets can be downloaded from HSE’s website: www.hse.gov.uk.)
For information about health and safety ring HSE’s Infoline Tel: 0845 345 0055 Fax: 0845 408 9566 Textphone: 0845 408 9577 e-mail: [email protected] or write to HSE Information Services, Caerphilly Business Park, Caerphilly CF83 3GG.
British Standards are available from BSI Customer Services, 389 Chiswick High Road, London W4 4AL Tel: 020 8996 9001 Fax: 020 8996 7001 e-mail: [email protected] Website: www.bsi-global.com
This document contains notes on good practice which are not compulsory but which you may find helpful in considering what you need to do.
This document is available web only at: www.hse.gov.uk/pubns/web/slips01.pdf.
© Crown copyright This publication may be freely reproduced, except for advertising, endorsement or commercial purposes. First published 03/07. Please acknowledge the source as HSE.
Published by the Health and Safety Executive 03/07 Slips and trips 1(rev1) 6 of 6 pages


Published by the Health and Safety Executive 04/07

Health and Safety Executive
A study of the characteristics of cementitious surface toppings and applied concrete Slips & trips are the most common cause of major injuries at work and they occur in almost all workplaces; 95% of major slips result in broken bones. In a typical year, slips and trips account for 33% of all reported major injuries and 20% of over-3-day injuries to employees. The construction sector has a higher rate of slips and trips than any other sector. Rarely is there a single cause of a slipping accident, and so a holistic approach to reducing the number of slip accidents is required. The major contributing factor in a slip accident is the interaction of the pedestrians heel and the floor surface. The potential for slip will depend on the footwear worn, the nature of the floor surface and the presence of any contamination.
Cementitious floors are present in many work places, particularly in the construction sector and in warehouses. The slip resistance of these surfaces will depend on the application technique used, and therefore the surface finish obtained. The aim of this study was to assess the slip resistance of cement floors applied using a variety of techniques and to determine whether the application of dry shake techniques such as surface hardeners and dust inhibitors effects the slip properties of the surface.
This report and the work it describes were funded by the Health and Safety Executive (HSE). Its contents, including any opinions and/or conclusions expressed, are those of the author alone and do not necessarily reflect HSE policy.
RR547
www.hse.gov.uk