Embed Size (px)
Citation preview
The Mathematics Educator
2015, Vol. 16, No.1, 19-44
A Study of Mathematics Written Assessment in Singapore Secondary Schools
WONG Lai Fong
Anderson Secondary School
Singapore
Berinderjeet KAUR
National Institute of Education
Nanyang Technological University
Singapore
Abstract: In Singapore schools, teachers rely heavily on written assessments they
construct themselves assessing students’ learning in mathematics. However, there
are no assessment standards available for them to scrutinize their written
assessments for quality and rigor. Therefore the purpose of this study is to derive
a set of assessment standards to examine the quality of mathematics written
assessment from three secondary schools in Singapore, in particular, the alignment
to relevant dimensions of understanding and cognitive demands. Findings of this
study show that while all the categories of cognitive demands and dimensions of
understanding are represented in the mathematics written assessments, the items
are heavily biased towards assessing knowledge and skills in particular categories
or dimensions. These findings have implications as assessment drives what
students learn. Research has shown that the quality and characteristics of our
mathematics written assessment send a signal to our students whether to take
either a surface approach or a deep approach to learning.
Keywords: written assessment, assessment standards, dimensions of
understanding, cognitive demands
Introduction
Assessment is an integral part of the teaching and learning process. It is
employed for a wide range of purposes – from providing information to help
a teacher improve on the teaching pedagogies so that students will better
learn the subject knowledge, to informing administrators to make or
improve on education policies for the nation, besides merely providing
feedback to students themselves and their parents. In Singapore where a

20 A Study of Mathematics Written Assessment
strong examination-oriented educational culture pervades, there is also a
great pressure for teachers and students to excel at all assessments,
especially the national examinations.
In recent years, there have been attempts by the Ministry of Education
(MOE) to deemphasize this strong examination culture by introduction of
several initiatives, such as Thinking Schools, Learning Nation (TSLN)
(Goh, 1997) and Teach Less, Learn More (TLLM) (Lee, 2004) to reform the
nation’s education system, advocating teaching for higher-order thinking
skills rather than rote memorization of factual and procedural knowledge.
These changes in pedagogical approaches are reflected in our assessment
methods where traditional paper-and-pencil assessment is now
complemented by alternative and authentic assessments such as project
work, performance-based assessment, and student self-assessment (Koh,
2011). However, even though there is a growing number of research studies
on the nature, mode, quality, and impact of assessments, traditional teacher-
developed written assessments continue to command most of the emphasis
and time spent testing in schools (Yeo, 2006). Yet, there is a dearth of study
on the quality of the mathematics written assessments in Singapore
secondary schools and there is a danger that as more resources and effort are
put in the development of alternative assessments, as a result, insufficient
attention is given to maintaining and improving the quality of written
assessments.
Therefore, this study attempts to study a collection of past years’ school
preliminary examination papers and aims to examine the cognitive and
content demands the written assessments made on students. In Singapore
secondary schools, the written assessment at the end of the four/five years,
known as the preliminary examination, assesses the entire syllabus and is
modelled after the MOE-UCLES examination, as the purpose of this
examination is to prepare the students for the national examination. The
specific objectives of the study are: (a) to derive a set of assessment
standards based on existing taxonomies, approaches documenting cognitive
demands of students’ knowledge in the literature of assessment; (b) to use
the set of assessment standards to study patterns of the schools’ written
assessments; and (c) to draw implications for teachers specific to assessment
items that are valid, that is, aligned to relevant dimensions of understanding
and cognitive demands.

Wong Lai Fong and Berinderjeet Kaur 21
The intent of mathematics instruction should be to promote the acquisition
of knowledge in a broad range of mathematical topics and to promote the
acquisition of mathematical thinking and reasoning skills (MOE, 2012).
Thus, it is important to ensure that assessments in mathematics reflect the
goals of instruction espoused by curriculum, and to measure students’
proficiency in solving mathematics problems, reasoning mathematically,
and communicating mathematically.
Literature Review
As learning mathematics is often viewed as mastering a set of skills,
procedures, and formulae, traditional mathematics written assessment
commonly focuses on whether these have been mastered, by testing
students’ computational skills or their ability to retrieve information on the
procedures and formulae from memory (Bergsten, 2002; Brown, 2010; Tan,
2011). Items that appear on written assessments typically test skills in
isolation of a problem context and do not test whether or not students
understand the mathematical concepts, are able to integrate mathematical
knowledge to solve a problem, or are able to communicate effectively using
the language of mathematics. Research has shown that some students who
produce a correct “solution” on a test item may not even understand this
solution or the underlying question behind it (Schoenfeld, 1988). As goals
of the mathematics education move to broader objectives, such as
developing mathematical thinkers who can apply their knowledge to solving
real problems, it is no longer appropriate to simply assess student
knowledge by having students compute answers and apply formulas, but
also to solve real problems and use mathematical reasoning. Because
assessment is often viewed as driving the curriculum and students learn to
value what they know they will be tested on, we should assess what we
value (Wiliam, 2001). We need to determine what students should know
and be able to do at the end of the mathematics course, and these should be
then translated into clearly articulated goals and objectives of our
assessments.
The assessment philosophy of Singapore education is that (1) assessment is
integral to the learning process; (2) assessment begins with clarity of
purpose; and (3) assessment should gather information to inform practice

22 A Study of Mathematics Written Assessment
(Tan, 2013). The main principle of assessment is that it should support and
enhance the learning of mathematics by furnishing useful information to
teachers on how well students have learnt a particular topic, where they are
having difficulty, and what additional pedagogical strategies might need to
be introduced; and to students on their progress toward the achievement of
learning goals. The Primary Education Review and Implementation (PERI)
Committee recommended that “assessment should be fit for purpose”, and
that “the school-based assessment system should be balanced to place
greater emphasis on skills development and to provide constructive
feedback which enables more meaningful learning” (MOE, 2009, p. 35).
The Singapore Secondary Mathematics Syllabuses document lists the aims
of our mathematics curriculum that are to enable students to:
1. acquire the necessary mathematical concepts and skills for everyday
life, and for continuous learning in mathematics and related
disciplines;
2. develop the necessary process skills for the acquisition and
application of mathematical concepts and skills;
3. develop the mathematical thinking and problem solving skills and
apply these skills to formulate and solve problems;
4. recognise and use connections among mathematical ideas, and
between mathematics and other disciplines;
5. develop positive attitudes towards mathematics;
6. make effective use of a variety of mathematical tools (including
information and communication technology tools) in the learning
and application of mathematics;
7. produce imaginative and creative work arising from mathematical
ideas;
8. develop the abilities to reason logically, to communicate
mathematically, and to learn cooperatively and independently.
(MOE, 2006, p. 1)
With the learning goals for students in our mathematics curriculum clearly
articulated, the syllabus document delineates the assessment objectives for
GCE O-level mathematics as testing students’ abilities to:
1. understand and use mathematical concepts and skills in a variety of
contexts;

Wong Lai Fong and Berinderjeet Kaur 23
2. organise and analyse data and information; formulate problems into
mathematical terms and select and apply appropriate techniques of
solution, including manipulation of algebraic expressions;
3. solve higher order thinking problems; interpret mathematical results
and make inferences; write mathematical explanation and
arguments. (Singapore Examinations and Assessment Board, 2014,
p. 1)
In 1956, Bloom and a team of examiners provided guidelines for an
assessment framework in his now-classic work Taxonomy of Educational
Objectives: Cognitive Domain (Bloom et al., 1956). Bloom’s classification
system, commonly known as Bloom’s taxonomy, defines and categorizes
processes that students might use to demonstrate their content knowledge
into a hierarchical system: knowledge, comprehension, application, analysis,
synthesis and evaluation. However, results of some studies carried out to
explore the use of the Bloom’s taxonomy as a framework to assess
mathematics knowledge show that “Bloom’s taxonomy does not provide an
accurate model to guide item writers for anticipating the cognitive processes
used by students to solve items on an achievement test in mathematics”
(Gierl, 1997, p. 26), and that “mathematics teachers have difficulty
interpreting the thinking skills in Bloom’s taxonomy and creating test items
for higher-order thinking” (Thompson, 2008, p. 96).
Smith et al. (1996) suggested that “Bloom’s taxonomy is quite good for
structuring assessment tasks, but does have some limitations in the
mathematical context”, and proposed a modification of Bloom’s taxonomy,
the MATH taxonomy (Mathematical Assessment Task Hierarchy) for the
structuring of assessment tasks. They identified eight categories of
mathematical knowledge and skills and arranged them into three groups A,
B and C. These eight categories are ordered by the nature, not the difficulty
level, of the activity required to complete task successfully (Figure 1).
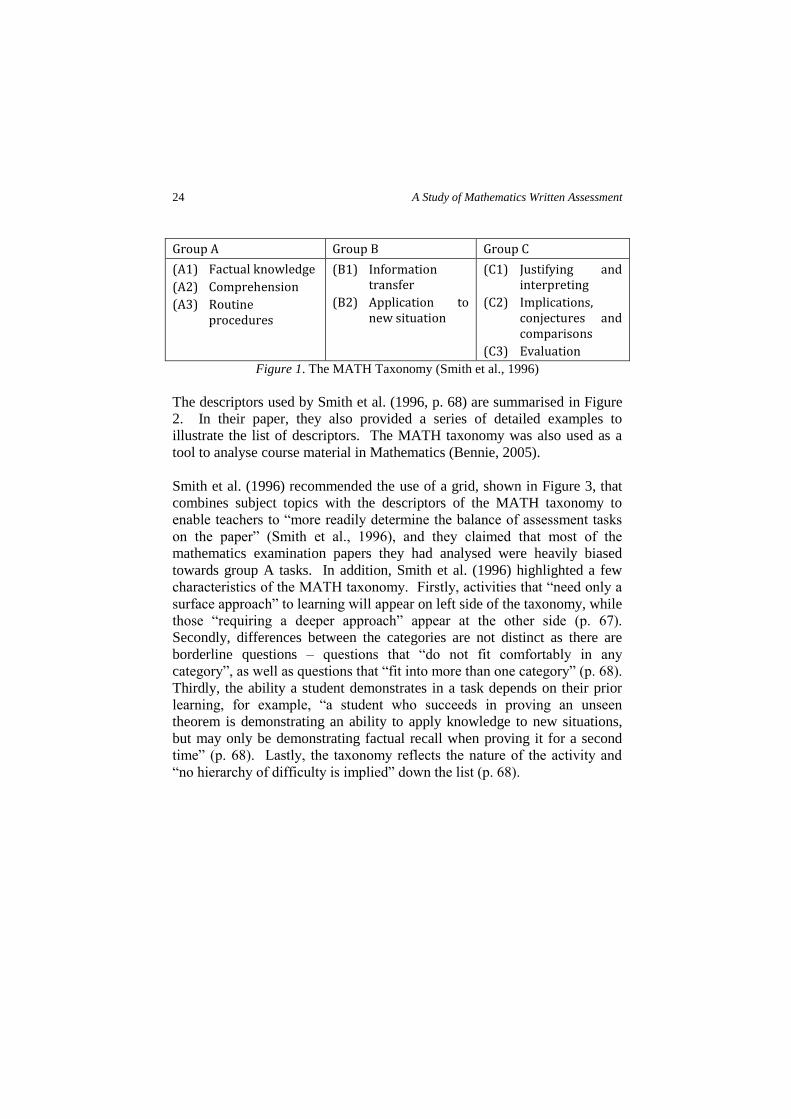
24 A Study of Mathematics Written Assessment
Group A Group B Group C
(A1) Factual knowledge
(A2) Comprehension
(A3) Routine procedures
(B1) Information transfer
(B2) Application to new situation
(C1) Justifying and interpreting
(C2) Implications, conjectures and comparisons
(C3) Evaluation
Figure 1. The MATH Taxonomy (Smith et al., 1996)
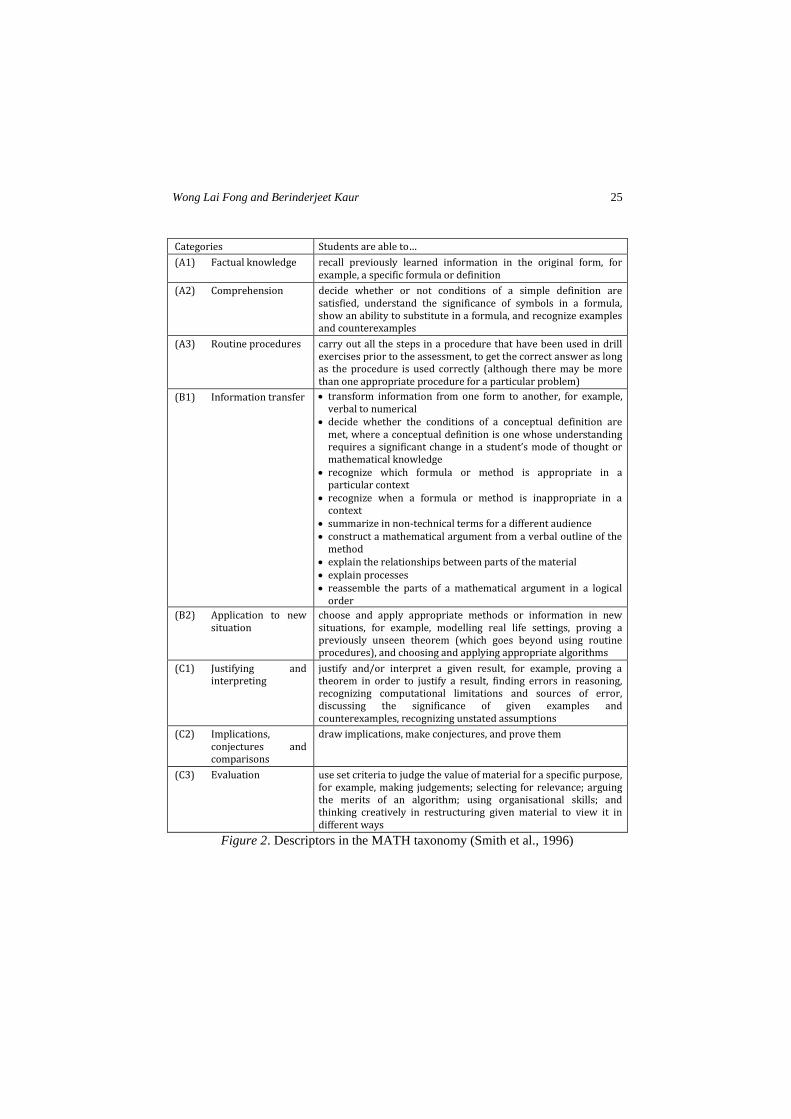
The descriptors used by Smith et al. (1996, p. 68) are summarised in Figure
2. In their paper, they also provided a series of detailed examples to
illustrate the list of descriptors. The MATH taxonomy was also used as a
tool to analyse course material in Mathematics (Bennie, 2005).
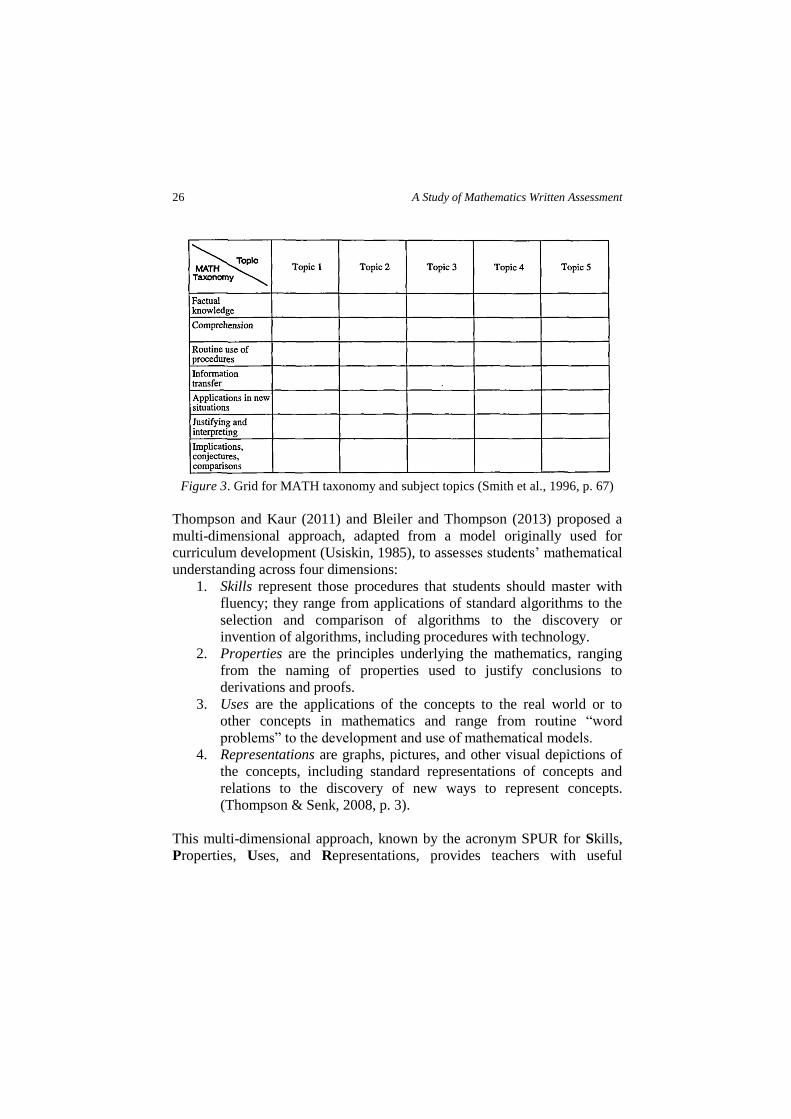
Smith et al. (1996) recommended the use of a grid, shown in Figure 3, that
combines subject topics with the descriptors of the MATH taxonomy to
enable teachers to “more readily determine the balance of assessment tasks
on the paper” (Smith et al., 1996), and they claimed that most of the
mathematics examination papers they had analysed were heavily biased
towards group A tasks. In addition, Smith et al. (1996) highlighted a few
characteristics of the MATH taxonomy. Firstly, activities that “need only a
surface approach” to learning will appear on left side of the taxonomy, while
those “requiring a deeper approach” appear at the other side (p. 67).
Secondly, differences between the categories are not distinct as there are
borderline questions – questions that “do not fit comfortably in any
category”, as well as questions that “fit into more than one category” (p. 68).
Thirdly, the ability a student demonstrates in a task depends on their prior
learning, for example, “a student who succeeds in proving an unseen
theorem is demonstrating an ability to apply knowledge to new situations,
but may only be demonstrating factual recall when proving it for a second
time” (p. 68). Lastly, the taxonomy reflects the nature of the activity and
“no hierarchy of difficulty is implied” down the list (p. 68).
Wong Lai Fong and Berinderjeet Kaur 25
Categories Students are able to…
(A1) Factual knowledge recall previously learned information in the original form, for example, a specific formula or definition
(A2) Comprehension decide whether or not conditions of a simple definition are satisfied, understand the significance of symbols in a formula, show an ability to substitute in a formula, and recognize examples and counterexamples
(A3) Routine procedures carry out all the steps in a procedure that have been used in drill exercises prior to the assessment, to get the correct answer as long as the procedure is used correctly (although there may be more than one appropriate procedure for a particular problem)
(B1) Information transfer transform information from one form to another, for example, verbal to numerical
decide whether the conditions of a conceptual definition are met, where a conceptual definition is one whose understanding requires a significant change in a student’s mode of thought or mathematical knowledge
recognize which formula or method is appropriate in a particular context
recognize when a formula or method is inappropriate in a context
summarize in non-technical terms for a different audience construct a mathematical argument from a verbal outline of the
method explain the relationships between parts of the material explain processes reassemble the parts of a mathematical argument in a logical
order
(B2) Application to new situation
choose and apply appropriate methods or information in new situations, for example, modelling real life settings, proving a previously unseen theorem (which goes beyond using routine procedures), and choosing and applying appropriate algorithms
(C1) Justifying and interpreting
justify and/or interpret a given result, for example, proving a theorem in order to justify a result, finding errors in reasoning, recognizing computational limitations and sources of error, discussing the significance of given examples and counterexamples, recognizing unstated assumptions
(C2) Implications, conjectures and comparisons
draw implications, make conjectures, and prove them
(C3) Evaluation use set criteria to judge the value of material for a specific purpose, for example, making judgements; selecting for relevance; arguing the merits of an algorithm; using organisational skills; and thinking creatively in restructuring given material to view it in different ways
Figure 2. Descriptors in the MATH taxonomy (Smith et al., 1996)
26 A Study of Mathematics Written Assessment
Figure 3. Grid for MATH taxonomy and subject topics (Smith et al., 1996, p. 67)
Thompson and Kaur (2011) and Bleiler and Thompson (2013) proposed a
multi-dimensional approach, adapted from a model originally used for
curriculum development (Usiskin, 1985), to assesses students’ mathematical
understanding across four dimensions:
1. Skills represent those procedures that students should master with
fluency; they range from applications of standard algorithms to the
selection and comparison of algorithms to the discovery or
invention of algorithms, including procedures with technology.
2. Properties are the principles underlying the mathematics, ranging
from the naming of properties used to justify conclusions to
derivations and proofs.
3. Uses are the applications of the concepts to the real world or to
other concepts in mathematics and range from routine “word
problems” to the development and use of mathematical models.
4. Representations are graphs, pictures, and other visual depictions of
the concepts, including standard representations of concepts and
relations to the discovery of new ways to represent concepts.
(Thompson & Senk, 2008, p. 3).
This multi-dimensional approach, known by the acronym SPUR for Skills,
Properties, Uses, and Representations, provides teachers with useful
Wong Lai Fong and Berinderjeet Kaur 27
information about the depth of their students’ mathematical understanding,
and assessments encompassing all four dimensions will give teachers
insights into strengths and weaknesses in their students’ knowledge of the
mathematical concepts. In their papers (Thompson & Kaur, 2011; Bleiler &
Thompson, 2013), examples were given to illustrate how to use SPUR to
create a balanced assessment of students’ mathematical understanding.
Mathematics teachers attempt to influence students’ learning by changing
their teaching approaches and designing alternative assessments, but studies
have shown that students are often more inclined to learn the skills that are
of direct relevance to passing examinations than to adopt a deep approach to
learning, and therefore are more willing to adapt their learning styles and to
do what they perceive is necessary to pass assessment tasks (Ramsden,
1992; Tan, 2007). This implies that changing teaching methods without due
attention to assessment methods is not sufficient, and hence there is a need
to scrutinize our assessment tools and analyse our assessment information to
make changes and improve our instructions. Our assessment items must
reflect the type of mathematical knowledge and skills we value.
The frameworks discussed in the literature provide an overview on how
different types and levels of knowledge could be assessed, and a basis for
examining items in a written assessment. In particular, the MATH
taxonomy presents specifically both the mathematical knowledge and skills
to be learnt, and the cognitive process along which the knowledge and skills
can differ, while the SPUR approach categorises students’ mathematical
understanding across four dimensions. Furthermore, the descriptors of these
taxonomy and frameworks are also aligned to the learning goals and
assessment objectives for students stipulated in our mathematics curriculum.
Drawing upon the frameworks described above, a set of assessment
standards is derived to study patterns of the written assessment items in
secondary schools’ preliminary examinations, so that it can guide teachers in
the design of a good written assessment that not only check on the content
balance of items, and also test the range of cognitive demands across the
various dimensions.
28 A Study of Mathematics Written Assessment
The Study
This study adopts an exploratory design conducted on a research problem
that has few or no earlier studies focusing on gaining insights and familiarity
for later investigation. It examines a collection of the mathematics written
assessments in three schools’ preliminary examinations and the GCE O-
level national examination, in particular, the cognitive demands the written
assessments made on students. A set of assessment standards, derived from
the review of literature, particularly the MATH taxonomy and the SPUR
approach, is used to study the patterns of the items in these written
assessments and document the cognitive demands made on students.
This study seeks to answer the following two research questions:
a) What are the types of cognitive demands represented in the
mathematics written assessments of the three schools’ preliminary
examination?
b) What are the dimensions of understanding represented in the
mathematics written assessments of the three schools’ preliminary
examination?
The sample
Two types of papers are used in this study: (a) the General Certificate of
Education (GCE) O-level mathematics (syllabus 4016) paper, set
collaboratively by the Ministry of Education (MOE) and the University of
Cambridge Local Examinations Syndicate (UCLES), that serves as the
benchmark paper, and (b) mathematics papers in three secondary schools’
preliminary examination that form the materials to be investigated. In this
study, the papers examined from the respective sources will be referred to as
the four assessments, and they are from the examinations in the year 2013.
The mathematics syllabus 4016 consists of three content strands, namely,
Numbers and Algebra (N&A), Geometry and Measurement (G&M), and
Statistics and Probability (S&P) (SEAB, 2014). There are two papers in the
written assessment – Paper 1 that consists of about 25 short answer
questions testing more on the fundamental skills and concepts, and Paper 2
that consists of 10 to 11 questions of varying marks and lengths testing more
on higher order thinking skills. Candidates are required to answer all
questions in each paper.
Wong Lai Fong and Berinderjeet Kaur 29
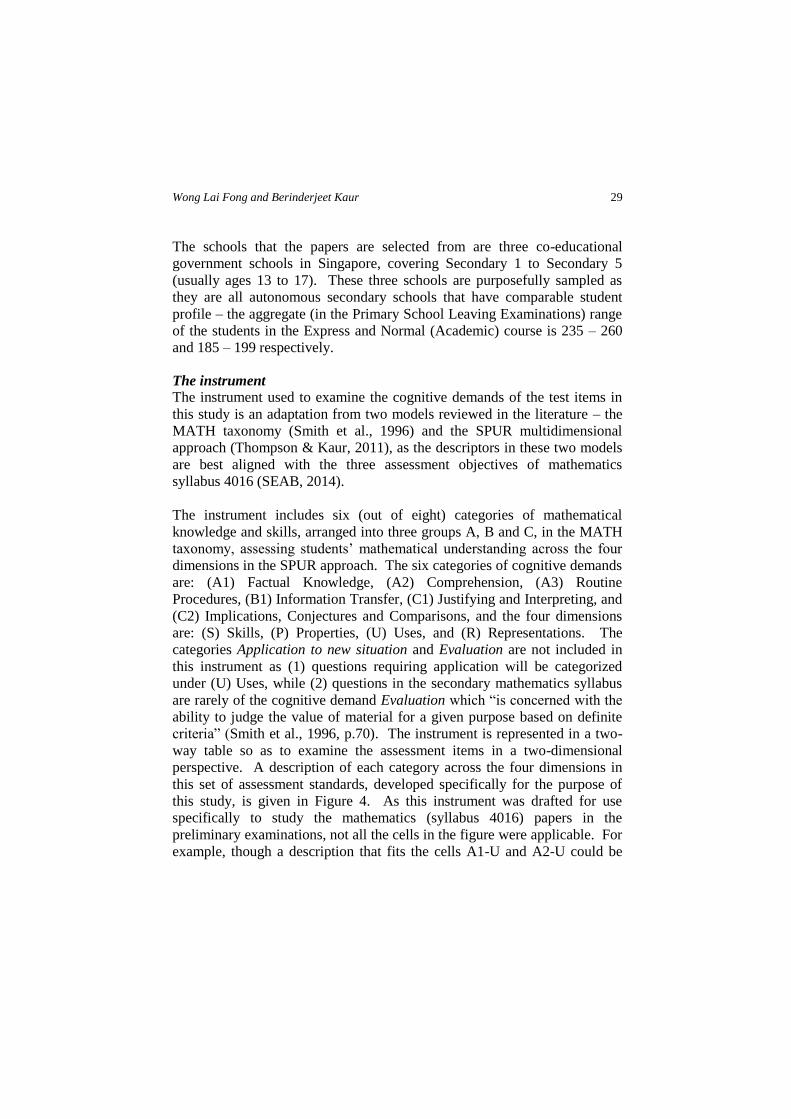
The schools that the papers are selected from are three co-educational
government schools in Singapore, covering Secondary 1 to Secondary 5
(usually ages 13 to 17). These three schools are purposefully sampled as
they are all autonomous secondary schools that have comparable student
profile – the aggregate (in the Primary School Leaving Examinations) range
of the students in the Express and Normal (Academic) course is 235 – 260
and 185 – 199 respectively.
The instrument The instrument used to examine the cognitive demands of the test items in
this study is an adaptation from two models reviewed in the literature – the
MATH taxonomy (Smith et al., 1996) and the SPUR multidimensional
approach (Thompson & Kaur, 2011), as the descriptors in these two models
are best aligned with the three assessment objectives of mathematics
syllabus 4016 (SEAB, 2014).
The instrument includes six (out of eight) categories of mathematical
knowledge and skills, arranged into three groups A, B and C, in the MATH
taxonomy, assessing students’ mathematical understanding across the four
dimensions in the SPUR approach. The six categories of cognitive demands
are: (A1) Factual Knowledge, (A2) Comprehension, (A3) Routine
Procedures, (B1) Information Transfer, (C1) Justifying and Interpreting, and
(C2) Implications, Conjectures and Comparisons, and the four dimensions
are: (S) Skills, (P) Properties, (U) Uses, and (R) Representations. The
categories Application to new situation and Evaluation are not included in
this instrument as (1) questions requiring application will be categorized
under (U) Uses, while (2) questions in the secondary mathematics syllabus
are rarely of the cognitive demand Evaluation which “is concerned with the
ability to judge the value of material for a given purpose based on definite
criteria” (Smith et al., 1996, p.70). The instrument is represented in a two-
way table so as to examine the assessment items in a two-dimensional
perspective. A description of each category across the four dimensions in
this set of assessment standards, developed specifically for the purpose of
this study, is given in Figure 4. As this instrument was drafted for use
specifically to study the mathematics (syllabus 4016) papers in the
preliminary examinations, not all the cells in the figure were applicable. For
example, though a description that fits the cells A1-U and A2-U could be

30 A Study of Mathematics Written Assessment
“Identify a concept in a real world setting” and “Interpret a word problem in
a real world context” respectively, such items are not tested in the syllabus.
Categories Skills (S) Properties (P)
A1 Write out the formula Name the properties
A2
Use an appropriate formula
Write an appropriate
expression
Recognize examples and
counter examples
Form statement using properties
A3 Carry out all the steps in a/an
procedure/algorithm
Carry out a/an
procedure/algorithm based the
properties
B1 Recognize which formula or
method is appropriate or
inappropriate in a particular
context
Interpret information from a
concept to another
C1 Prove a theorem/formula or an
algebraic expression/ equation
Justify and/or interpret a given
result based on properties
C2 Draw implications, make
conjectures or derive proofs
Categories Uses (U) Representations (R)
A1 Name the form of representation
A2 Extract information from
representation
A3 Carry out a/an
procedure/algorithm in a real life
context
Carry out calculations based on
information from representation
Represent information in a
required form
B1 Apply a concept to a real life
situation or other concepts Transform information from
one form to another
Interpret information from
representation
C1 Justify and/or interpret a given
results in a real life context
Justify the use of a form of
representation
C2 Draw implications or make
conjectures for a real life
situation
Draw implications from
representations
Legend: A1-Factual Knowledge; A2-Comprehension; A3-Routine Procedures; B1-Information Transfer; C1-Justifying and Interpreting; C2-Implications, Conjectures and Comparisons
Figure 4. The instrument to examine cognitive demands
Wong Lai Fong and Berinderjeet Kaur 31
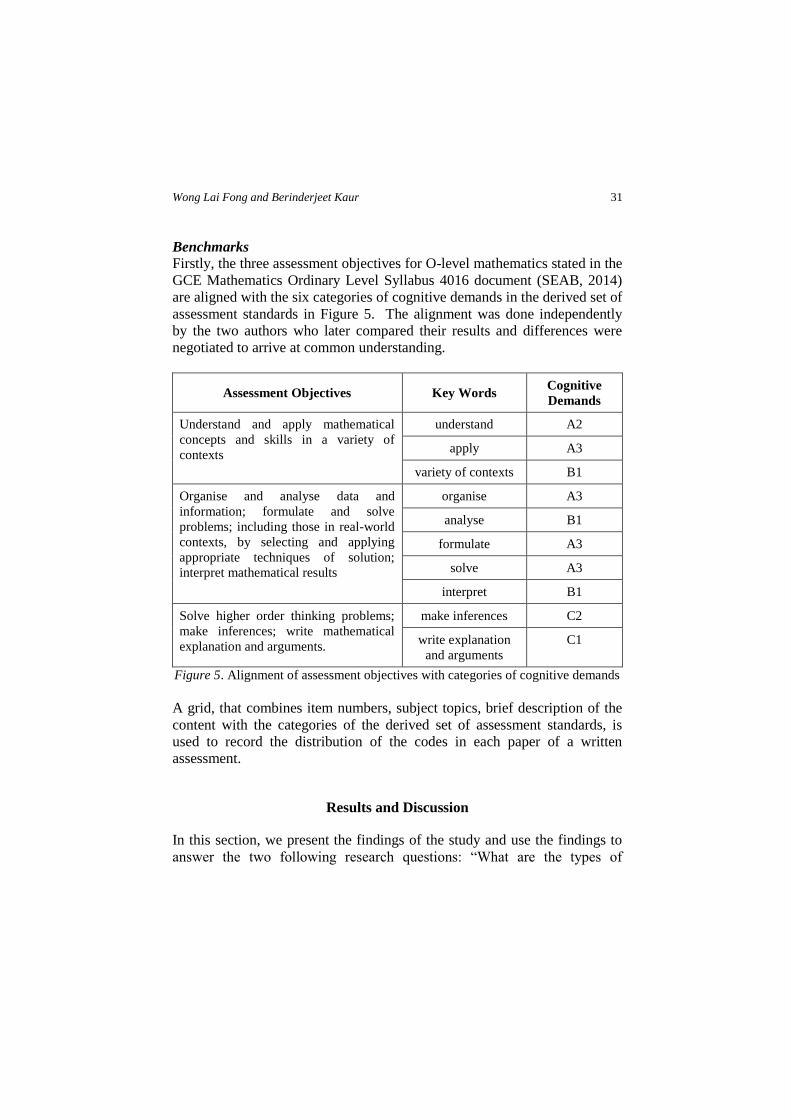
Benchmarks Firstly, the three assessment objectives for O-level mathematics stated in the
GCE Mathematics Ordinary Level Syllabus 4016 document (SEAB, 2014)
are aligned with the six categories of cognitive demands in the derived set of
assessment standards in Figure 5. The alignment was done independently
by the two authors who later compared their results and differences were
negotiated to arrive at common understanding.
Assessment Objectives Key Words Cognitive
Demands
Understand and apply mathematical
concepts and skills in a variety of
contexts
understand A2
apply A3
variety of contexts B1
Organise and analyse data and
information; formulate and solve
problems; including those in real-world
contexts, by selecting and applying
appropriate techniques of solution;
interpret mathematical results
organise A3
analyse B1
formulate A3
solve A3
interpret B1
Solve higher order thinking problems;
make inferences; write mathematical
explanation and arguments.
make inferences C2
write explanation
and arguments
C1
Figure 5. Alignment of assessment objectives with categories of cognitive demands
A grid, that combines item numbers, subject topics, brief description of the
content with the categories of the derived set of assessment standards, is
used to record the distribution of the codes in each paper of a written
assessment.
Results and Discussion
In this section, we present the findings of the study and use the findings to
answer the two following research questions: “What are the types of
32 A Study of Mathematics Written Assessment
cognitive demands represented in the mathematics written assessments of
the three schools’ preliminary examination?” and “What are the dimensions
of understanding represented in the mathematics written assessments of the
three schools’ preliminary examination?”
Though there are only about 25 questions in paper 1 and 10 to 11 questions
in paper in each written assessment, there are several part questions that
allow the testing of a range of cognitive demands in the different
dimensions. In this study, the two authors independently identified and
rated the cognitive demands of the items in the GCE O-level assessment
using the derived set of assessment standards before coming together to
check for reliability of coding. Out of 107 questions or part questions, the
codes for 99 were concurred. The 8 items that had different coding were
discussed and arrived at consensus. Hence it may be said that the inter-
coder reliability was (99÷107)×100%=92.5%.
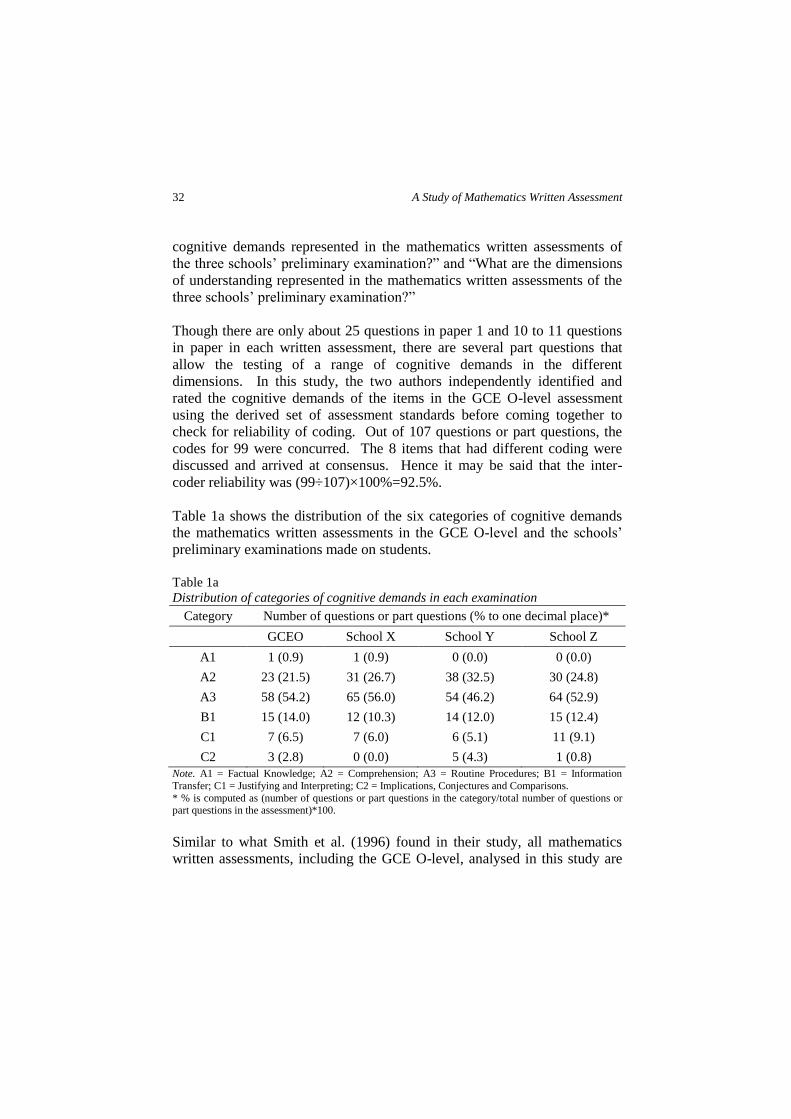
Table 1a shows the distribution of the six categories of cognitive demands
the mathematics written assessments in the GCE O-level and the schools’
preliminary examinations made on students.
Table 1a
Distribution of categories of cognitive demands in each examination
Category Number of questions or part questions (% to one decimal place)*
GCEO School X School Y School Z
A1 1 (0.9) 1 (0.9) 0 (0.0) 0 (0.0)
A2 23 (21.5) 31 (26.7) 38 (32.5) 30 (24.8)
A3 58 (54.2) 65 (56.0) 54 (46.2) 64 (52.9)
B1 15 (14.0) 12 (10.3) 14 (12.0) 15 (12.4)
C1 7 (6.5) 7 (6.0) 6 (5.1) 11 (9.1)
C2 3 (2.8) 0 (0.0) 5 (4.3) 1 (0.8)
Note. A1 = Factual Knowledge; A2 = Comprehension; A3 = Routine Procedures; B1 = Information
Transfer; C1 = Justifying and Interpreting; C2 = Implications, Conjectures and Comparisons.
* % is computed as (number of questions or part questions in the category/total number of questions or part questions in the assessment)*100.
Similar to what Smith et al. (1996) found in their study, all mathematics
written assessments, including the GCE O-level, analysed in this study are
Wong Lai Fong and Berinderjeet Kaur 33
heavily biased towards assessing knowledge and skills in Group A category,
with almost 50% or more of the items focusing on (A3) Routine Procedures
and 20-30% on (A2) Comprehension, though only 0.9% on (A1) Factual
Knowledge in the GCE O-level and School X assessments while none in the
other two schools. In fact, only around 10-15% of the items focus on Group
B and less than 10% on Group C.
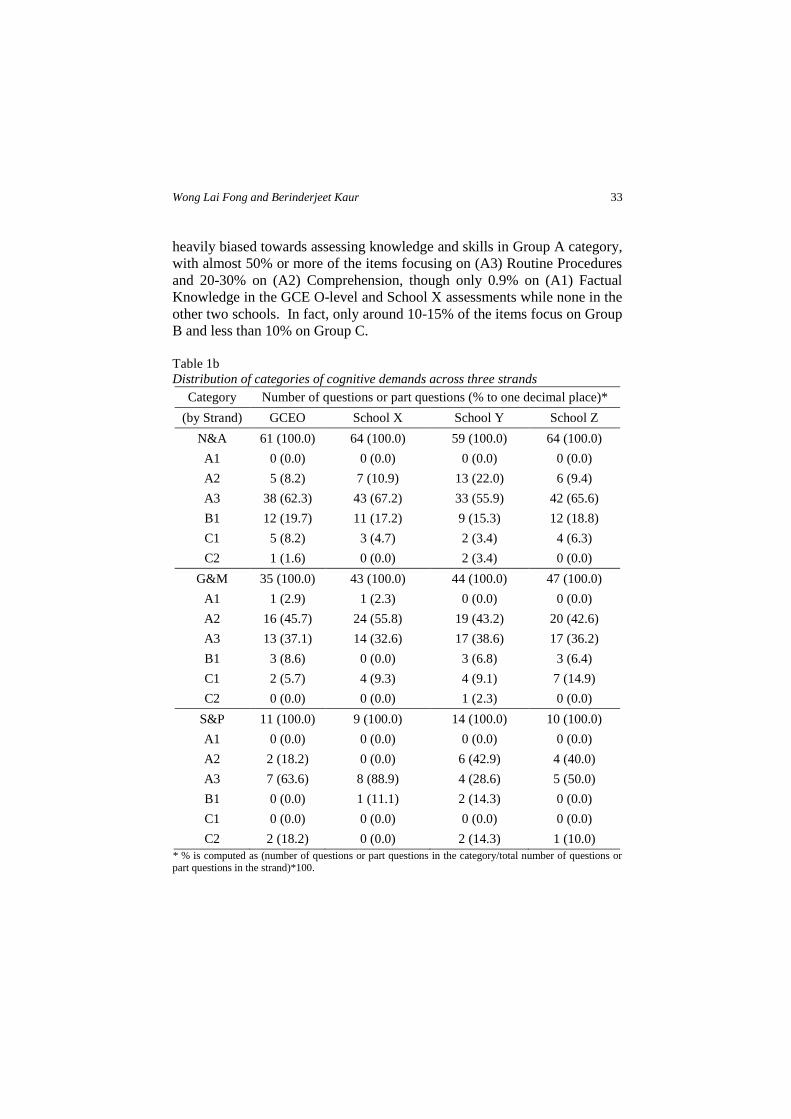
Table 1b
Distribution of categories of cognitive demands across three strands
Category Number of questions or part questions (% to one decimal place)*
(by Strand) GCEO School X School Y School Z
N&A 61 (100.0) 64 (100.0) 59 (100.0) 64 (100.0)
A1 0 (0.0) 0 (0.0) 0 (0.0) 0 (0.0)
A2 5 (8.2) 7 (10.9) 13 (22.0) 6 (9.4)
A3 38 (62.3) 43 (67.2) 33 (55.9) 42 (65.6)
B1 12 (19.7) 11 (17.2) 9 (15.3) 12 (18.8)
C1 5 (8.2) 3 (4.7) 2 (3.4) 4 (6.3)
C2 1 (1.6) 0 (0.0) 2 (3.4) 0 (0.0)
G&M 35 (100.0) 43 (100.0) 44 (100.0) 47 (100.0)
A1 1 (2.9) 1 (2.3) 0 (0.0) 0 (0.0)
A2 16 (45.7) 24 (55.8) 19 (43.2) 20 (42.6)
A3 13 (37.1) 14 (32.6) 17 (38.6) 17 (36.2)
B1 3 (8.6) 0 (0.0) 3 (6.8) 3 (6.4)
C1 2 (5.7) 4 (9.3) 4 (9.1) 7 (14.9)
C2 0 (0.0) 0 (0.0) 1 (2.3) 0 (0.0)
S&P 11 (100.0) 9 (100.0) 14 (100.0) 10 (100.0)
A1 0 (0.0) 0 (0.0) 0 (0.0) 0 (0.0)
A2 2 (18.2) 0 (0.0) 6 (42.9) 4 (40.0)
A3 7 (63.6) 8 (88.9) 4 (28.6) 5 (50.0)
B1 0 (0.0) 1 (11.1) 2 (14.3) 0 (0.0)
C1 0 (0.0) 0 (0.0) 0 (0.0) 0 (0.0)
C2 2 (18.2) 0 (0.0) 2 (14.3) 1 (10.0)
* % is computed as (number of questions or part questions in the category/total number of questions or part questions in the strand)*100.
34 A Study of Mathematics Written Assessment
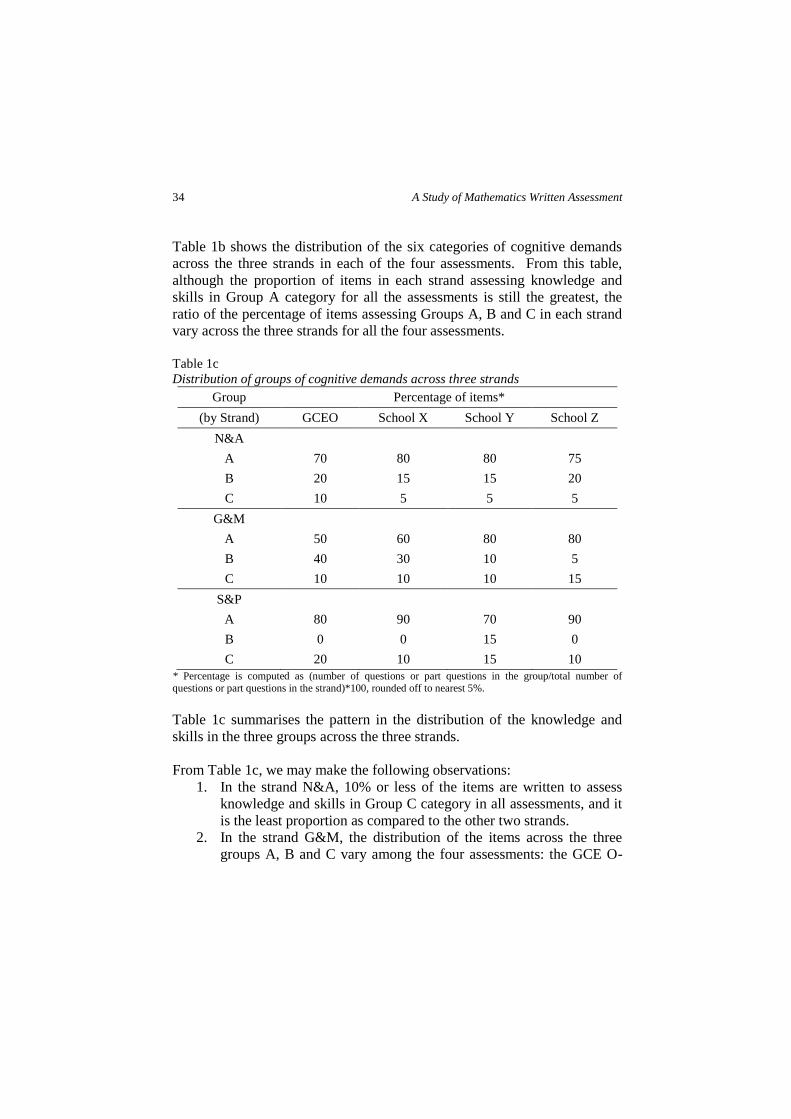
Table 1b shows the distribution of the six categories of cognitive demands
across the three strands in each of the four assessments. From this table,
although the proportion of items in each strand assessing knowledge and
skills in Group A category for all the assessments is still the greatest, the
ratio of the percentage of items assessing Groups A, B and C in each strand
vary across the three strands for all the four assessments.
Table 1c
Distribution of groups of cognitive demands across three strands
Group Percentage of items*
(by Strand) GCEO School X School Y School Z
N&A
A 70 80 80 75
B 20 15 15 20
C 10 5 5 5
G&M
A 50 60 80 80
B 40 30 10 5
C 10 10 10 15
S&P
A 80 90 70 90
B 0 0 15 0
C 20 10 15 10
* Percentage is computed as (number of questions or part questions in the group/total number of questions or part questions in the strand)*100, rounded off to nearest 5%.
Table 1c summarises the pattern in the distribution of the knowledge and
skills in the three groups across the three strands.
From Table 1c, we may make the following observations:
1. In the strand N&A, 10% or less of the items are written to assess
knowledge and skills in Group C category in all assessments, and it
is the least proportion as compared to the other two strands.
2. In the strand G&M, the distribution of the items across the three
groups A, B and C vary among the four assessments: the GCE O-
Wong Lai Fong and Berinderjeet Kaur 35
level and School X have the lowest proportion of items, as
compared to the other two strands, assessing knowledge and skills
in Group A while it is comparable in the other two schools’
assessments; the GCE O-level and School X have the highest
proportion of items, as compared to the other two strands, assessing
knowledge and skills in Group B while it is only 10% or less in the
other two schools’ assessments.
3. In the strand S&P, 10% or more of the items are written to assess
knowledge and skills in Group C category in all assessments, and it
is the highest proportion as compared to the other two strands; no
items are written to assess Group B in three out of the four
assessments; the proportion of items assessing Group A is the
highest, as compared to the other two strands, in three out of the
four assessments.
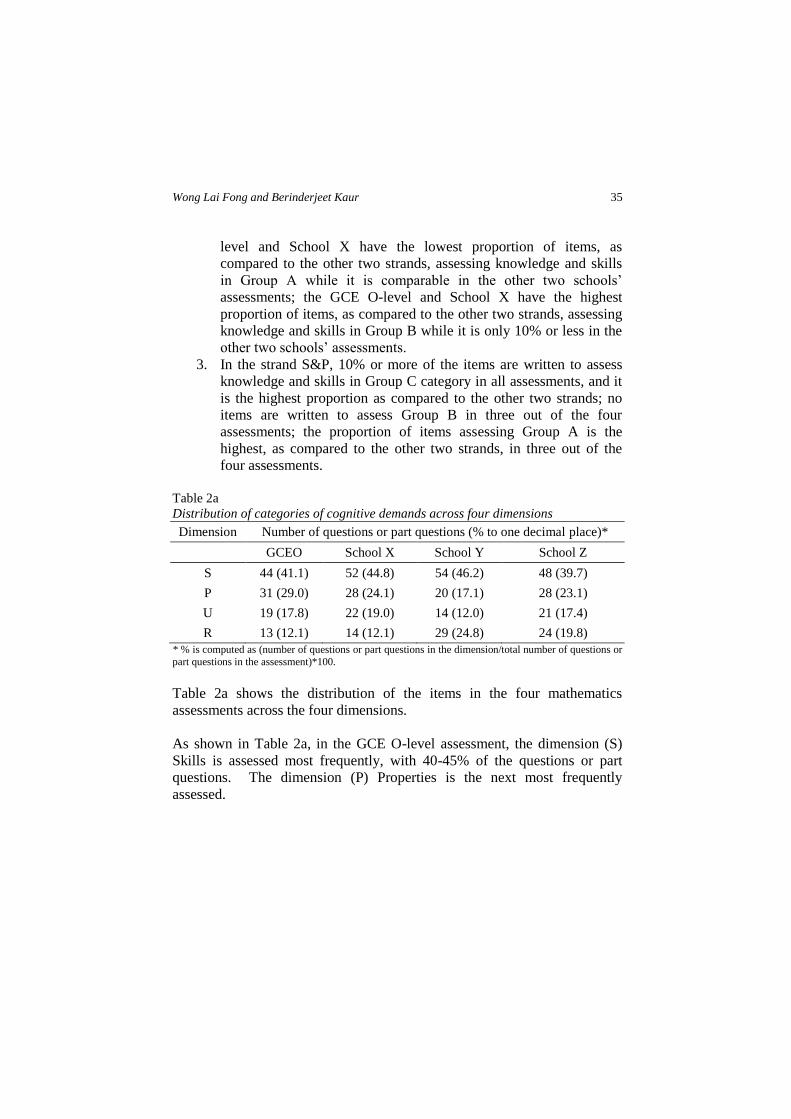
Table 2a
Distribution of categories of cognitive demands across four dimensions
Dimension Number of questions or part questions (% to one decimal place)*
GCEO School X School Y School Z
S 44 (41.1) 52 (44.8) 54 (46.2) 48 (39.7)
P 31 (29.0) 28 (24.1) 20 (17.1) 28 (23.1)
U 19 (17.8) 22 (19.0) 14 (12.0) 21 (17.4)
R 13 (12.1) 14 (12.1) 29 (24.8) 24 (19.8)
* % is computed as (number of questions or part questions in the dimension/total number of questions or
part questions in the assessment)*100.
Table 2a shows the distribution of the items in the four mathematics
assessments across the four dimensions.
As shown in Table 2a, in the GCE O-level assessment, the dimension (S)
Skills is assessed most frequently, with 40-45% of the questions or part
questions. The dimension (P) Properties is the next most frequently
assessed.

36 A Study of Mathematics Written Assessment
Table 2b
Distribution of dimensions of understanding across three strands
Dimension Number of questions or part questions (% to one decimal place)*
(by Strand) GCEO School X School Y School Z
N&A 61 (100.0) 64 (100.0) 59 (100.0) 64 (100.0)
S 26 (42.6) 28 (43.8) 27 (45.8) 23 (35.9)
P 12 (19.7) 5 (7.8) 7 (11.9) 8 (12.5)
U 16 (26.2) 22 (34.4) 11 (18.6) 19 (29.7)
R 7 (11.5) 9 (14.1) 14 (23.7) 14 (21.9)
G&M 35 (100.0) 43 (100.0) 44 (100.0) 47 (100.0)
S 18 (51.4) 24 (55.8) 25 (56.8) 25 (53.2)
P 15 (42.9) 18 (41.9) 11 (25.0) 18 (38.3)
U 2 (5.7) 0 (0.0) 3 (6.8) 1 (2.1)
R 0 (0.0) 1 (2.3) 5 (11.4) 3 (6.4)
S&P 11 (100.0) 9 (100.0) 14 (100.0) 10 (100.0)
S 0 (0.0) 0 (0.0) 2 (14.3) 0 (0.0)
P 4 (36.4) 5 (55.6) 2 (14.3) 2 (20.0)
U 1 (9.1) 0 (0.0) 0 (0.0) 1 (10.0)
R 6 (54.5) 4 (44.4) 10 (71.4) 7 (70.0)
* % is computed as (number of questions or part questions in the dimension/total number of questions or part questions in the strand)*100.
Table 2b further shows the distribution of the items assessing the four
dimensions of understanding across the three strands.
From Table 2b, we may make the following observations:
1. In the strand N&A, all four dimensions of understanding are
assessed in all four assessments. The greatest emphasis is placed on
(S) Skills, and three out of four schools are considerably balanced in
assessing the remaining three dimensions.
2. In the strand G&M, all four assessments are not balanced across
these four dimensions – the greatest emphasis is placed on (S)
Skills, followed by (P) Properties, and (U) Uses and (R)
Representations are in fact not assessed in two out of four
assessments.

Wong Lai Fong and Berinderjeet Kaur 37
3. In the strand S&P, again, all four assessments are not balanced
across these four dimensions – the greatest emphasis in this case is
(R) Representations, followed by (P) Properties, and (S) Skills is not
assessed in three out of four assessments while (U) Uses is not
assessed in two out of four.
Table 3
Distribution of categories of cognitive demands across four dimensions
Category Number of questions or part questions (% to one decimal place)*
(by Dimension) GCEO School X School Y School Z
A1-S 0 (0.0) 0 (0.0) 0 (0.0) 0 (0.0)
A2-S 15 (14.0) 26 (22.4) 25 (21.4) 22 (18.2)
A3-S 24 (22.4) 23 (19.8) 27 (23.1) 20 (16.5)
B1-S 3 (2.8) 1 (0.9) 0 (0.0) 2 (1.7)
C1-S 2 (1.9) 2 (1.7) 2 (1.7) 4 (3.3)
A1-P 1 (0.9) 0 (0.0) 0 (0.0) 0 (0.0)
A2-P 6 (5.6) 5 (4.3) 5 (4.3) 4 (3.3)
A3-P 16 (15.0) 17 (14.7) 9 (7.7) 16 (13.2)
B1-P 3 (2.8) 1 (0.9) 3 (2.6) 2 (1.7)
C1-P 4 (3.7) 5 (4.3) 3 (2.6) 6 (5.0)
C2-P 1 (0.9) 0 (0.0) 0 (0.0) 0 (0.0)
A3-U 11 (10.3) 14 (12.1) 8 (6.8) 13 (10.7)
B1-U 6 (5.6) 8 (6.9) 6 (5.1) 7 (5.8)
C1-U 1 (0.9) 0 (0.0) 0 (0.0) 0 (0.0)
C2-U 1 (0.9) 0 (0.0) 0 (0.0) 1 (0.8)
A1-R 0 (0.0) 1 (0.9) 0 (0.0) 0 (0.0)
A2-R 2 (1.9) 0 (0.0) 8 (6.8) 4 (3.3)
A3-R 7 (6.5) 11 (9.5) 10 (8.5) 15 (12.4)
B1-R 3 (2.8) 2 (1.7) 5 (4.3) 4 (3.3)
C1-R 0 (0.0) 0 (0.0) 1 (0.9) 1 (0.8)
C2-R 1 (0.9) 0 (0.0) 5 (4.3) 0 (0.0)
* % is computed as (number of questions or part questions in the category and dimension/total number of
questions or part questions in the assessment)*100.

38 A Study of Mathematics Written Assessment
Table 3 shows a more detailed distribution of the six categories of cognitive
demands the mathematics written assessments made on students across the
four dimensions.
From Table 3, it is evident that the most frequent cognitive demands the
written assessments made on students are both (A3) Routine Procedures and
(A2) Comprehension in the (S) Skills dimension, followed by (A3) Routine
Procedures in both (P) Properties and (U) Uses dimensions. Though (A1)
Factual Knowledge in (S) Skills dimension is not assessed at all, it is
reasonable, as A1-S may be considered too low on the hierarchy of
cognitive demands to be assessed at the secondary level. Cognitive
demands that only one or two out of the four assessments made on students
are: (A1) Factual Knowledge in (P) Properties; (C1) Justifying and
Interpreting in (U) Uses and (R) Representations; and (C2) Implications,
Conjectures and Comparisons in all three (P) Properties, (U) Uses, and (R)
Representations.
Drawing on the above data, we now present the implications of the findings.
Cognitive demands of written assessment The quality and characteristics of our mathematics written assessment send
a signal to our students whether to take either a surface approach or a deep
approach to learning (Ramsden, 1992). Written assessment that tests a
narrow range of skills will only encourage students to take a surface
approach to learning. Based on the findings of their study, D’Souza and
Wood (2003) concluded that “it is possible to improve students’ learning by
paying more attention to assessment methods that test a broader range of
skills”. It is thus imperative that we critically examine the types and extent
of cognitive demands our written assessment made on students.
Schools should aim to assess the knowledge and skills of all six categories
in their written assessments, and if possible, in all the three strands of the
syllabus. Findings (see Table 1c) suggest that it is easier (or harder), or
more (or less) suitable, to write items in a particular strand to assess the
knowledge and skills of a particular category or group. The schools could
have also modelled their written assessments after the GCE O-level as the
distributions of the six categories across the three strands in the schools’
assessments are somewhat similar to that in the GCE O-level. However, the
Wong Lai Fong and Berinderjeet Kaur 39
primary objectives of the national examination are to evaluate individual
student progress and to place students in educational streams according to
their performance in the examination. Thus, teachers must be mindful of the
types of cognitive demands made on students as they write the assessment
items in the different strands, so as to create a balanced assessment that
informs on the actual learning that takes place rather than purely measures
the outcomes of that learning.
With the introduction of the strand Mathematical processes in the revised
mathematics syllabus implemented from 2013, there is a need for teachers to
review the composition of the various categories of cognitive demands
represented in the written assessment, and not be heavily biased towards
assessing knowledge and skills in Group A category. It is stated in the
syllabus document (MOE, 2012):
Mathematical processes refer to the process skills involved in the process
of acquiring and applying mathematical knowledge. This includes
reasoning, communication and connections, applications and modelling,
and thinking skills and heuristics that are important in mathematical
problem solving and beyond. (MOE, 2012, p. 41)
From the indicators of the process of Reasoning, communication and
connections, it is apparent that the descriptors are similar to those of Group
C, that is, (C1) Justifying and Interpreting, and (C2) Implications,
Conjectures and Comparisons, in the derived set of assessment standards
used in this study. There is a need to consider an increase in the percentage
of the assessment items on Group C in the mathematics written assessment
in future.
Finally, it is important to note that there is no hierarchy of difficulty implied
as we move down the categories of cognitive demands in the derived set of
assessment standards. It is the type of the cognitive demands we are
interested in, and not the degree of difficulty. Therefore, not only must the
teacher appropriately select or write assessment items, the teacher must also
accurately assess students’ higher order knowledge and skills without
increasing unnecessary complexity of the question.

40 A Study of Mathematics Written Assessment
Dimensions of understanding in written assessment
Though the findings of this study revealed that all four dimensions of
understanding are represented in the mathematics written assessments of the
three schools, these assessments are biased towards assessing the (S) Skills
dimension. Furthermore, from the distribution of items assessing the
different dimensions of understanding across three strands (see Table 2b),
other than the content area of the strand Numbers and Algebra that was
assessed from all four dimensions, it was not the case for the other two
strands. This implies that the written assessment did not provide teachers
with the opportunity to determine how their students might address some
aspects of the other content areas.
This suggests that much can be done to create a more balanced assessment
that not only include items that assess the various categories of cognitive
demands, but also assess all four dimensions of understanding in the three
strands. As Thompson and Kaur (2011) mentioned in their work, “Overall
test results provide only a quick view of student understanding, and a view
that can be misleading.” If the aims of our mathematics curriculum are to
develop students with a robust and flexible understanding of mathematics,
and knowledge of effective use of a variety of mathematical tools in the
learning and application of mathematics, then it is essential that we assess
more than just their knowledge of skills. Although it is relatively easy to
write items on assessing the (S) Skills dimension, teachers should
consciously write items or modify existing items on (S) Skills, to assess the
other three dimensions of understanding, so as to gain additional
perspectives on their students’ understanding of the mathematical concepts
(Thompson & Kaur, 2011). It is apparent that Number and Algebra in the
curriculum lands itself to more focus on (S) Skills while Geometry and
Measurement to (P) Properties, Statistics and Probability to (R)
Representations. Nevertheless, a conscious attempt should be made by
teachers when designing test items in each strand to assess as many
dimensions of understanding as possible.
Furthermore, under the strand Mathematical processes in the revised
mathematics syllabus, it is stated (MOE, 2012):
Besides learning standard mathematical models, students should, under
teacher guidance, develop an awareness and understanding of the
mathematical modelling process. They work on real-world problems
Wong Lai Fong and Berinderjeet Kaur 41
either individually or in groups. They would need to understand the real-
world situation, make assumptions about the situation, devise a
mathematical model to solve the problem, and interpret the solution in
the context of the situation. (MOE, 2012, p. 41)
This implies the need for teachers to assess the other three dimensions of
understanding besides (S) Skills. From the indicators of the process of
Applications and modelling stated in the revised syllabus, it is apparent that
the assessment of the dimensions of (U) Uses and (R) Representations is
inevitable. In fact, according to Usiskin (2012):
A person has full understanding of a mathematical concept if he or she
can deal effectively with the skills and algorithms associated with the
concept, with properties and mathematical justifications (proofs)
involving the concept, with uses and applications of the concept, with
representations and metaphors for the concept. (Usiskin, 2012, p. 14)
Conclusion
Assessment is an important component of any instructional programme as it
serves to ascertain learners’ attainment of learning objectives, and to
compare learners by their performance for placement purposes. Every care
must therefore be taken to ensure that the instruments used in assessing
learners, especially the written assessment that constitutes a large part of the
overall assessment, as in Singapore, are developed based on acceptable
principles and standards.
While there are limitations in this study, such as the raters’ subjectivity and
their interpretations of the cognitive demands, and the collection of written
assessments used in the study, it offers some insights into how the range of
cognitive demands are reflected in schools’ assessment. The authors are in
no position to stipulate the distribution of items of a balanced assessment as
it is best left to the prerogative of the classroom teachers. For education
excellence, it is imperative for teachers to review and reflect on the
assessment development procedures in schools to ensure that the gaps
revealed by this study are addressed. The need to review and reflect is even
more critical considering that preliminary examination papers are exchanged
among schools, and more students than those within a school are using and
42 A Study of Mathematics Written Assessment
learning from these test items. The instrument developed in this study can
be useful to teachers as a set of assessment standards to guide them in their
construction of written assessment, as there is a discernable need for our
written assessment to be of the highest standards and robust enough to stand
up to public scrutiny, and be worthy of the international recognition that
Singapore’s Mathematics Education gained with successive excellent results
in the Trends in International Mathematics and Science Study (TIMSS) and
Programme for International Student Assessment (PISA) tests.
References
Bennie, K. (2005). The MATH taxonomy as a tool for analysing course material in
Mathematics: A study of its usefulness and its potential as a tool for curriculum
development. African Journal of Research in Mathematics, Science and
Technology Education, 9(2), 81-95.
Bergsten, C. (2002). Critical factors and prognostic validity in mathematics
assessment. ICTM2, at Crete.
Bleiler, S. K., & Thompson, D. R. (2013). Multidimensional assessment of CCSSM.
Teaching Children Mathematics, 19(5), 292-300.
Bloom, B. S., Engelhart, M. D., Furst, E. J., Hill, W. H., & Krathwohl, D. R. (1956).
Taxonomy of educational objectives: Handbook I: Cognitive domain. New
York: David McKay.
Brown, R. G. (2010). Does the introduction of the graphics calculator into system-
wide examinations lead to change in the types of mathematical skills tested?
Educational Studies in Mathematics, 73(2), 181-203.
D’Souza, S. M., & Wood, L. N. (2003). Designing assessment using the MATH
taxonomy. In Mathematics Education Research: Innovation, Networking,
Opportunity. Proceedings of the 26th Annual Conference of MERGA Inc.,
Deakin University, Geelong, Australia (pp. 294-301).
Gierl, M. J. (1997). Comparing cognitive representations of test developers and
students on a mathematics test with Bloom's Taxonomy. The Journal of
Educational Research, 91(1), 26-32.
Goh, C. T. (1997, June 2). Shaping our future: Thinking Schools, Learning Nation.
Speech presented at the International Conference on Thinking, Singapore.
Retrieved from http://www.moe.gov.sg/media/speeches/1997/020697.htm
Koh, K. H. (2011). Improving teachers' assessment literacy. Pearson.
Lee, H. L. (2004, August 22). Our future of opportunity and promise. Speech
presented at National Day Rally, Singapore. Retrieved from
Wong Lai Fong and Berinderjeet Kaur 43
http://www.nas.gov.sg/archivesonline/speeches/view-
html?filename=2004083101.htm
Ministry of Education (MOE). (2006). Secondary mathematics syllabuses.
Singapore: Author.
Ministry of Education (MOE). (2009). Report of the Primary Education Review and
Implementation (PERI) committee. Singapore: Author.
Ministry of Education (MOE). (2012). O-level mathematics teaching and learning
syllabus. Singapore: Author.
Ramsden, P. (1992). Learning to teach in higher education. London: Routledge.
Schoenfeld, A. H. (1988). When good teaching leads to bad results: The disasters of
‘well-taught’ mathematics courses. Educational Psychologist, 23(2), 145-166.
Singapore Examinations and Assessment Board (SEAB). (2014). GCE
MATHEMATICS Ordinary Level (Syllabus 4016). Singapore: Author. Retrieved
from http://www.seab.gov.sg/oLevel/2014Syllabus/4016_2014.pdf
Smith, G., Wood, L., Coupland, M., Stephenson, B., Crawford, K., & Ball, G.
(1996). Constructing mathematical examinations to assess a range of knowledge
and skills. International Journal of Mathematical Education in Science and
Technology, 27(1), 65-77.
Tan, E. (2013, January). Assessment in Singapore: Assessing creativity, critical
thinking and other skills for innovation. Presentation at OECD-CCE-MOE
Educating for Innovation Workshop [PowerPoint slides], Singapore. Retrieved
from http://www.oecd.org/edu/ceri/07%20Eugenia%20Tan_Singapore.pdf
Tan, K. (2011). Assessment for learning in Singapore: unpacking its meanings and
identifying some areas for improvement. Educational Research for Policy and
Practice, 10(2), 91-103.
Tan, K. H. K. (2007). Is teach less, learn more a quantitative or qualitative idea? In
Proceedings of the Redesigning Pedagogy: Culture, Knowledge and
Understanding Conference. Singapore.
Thompson, D. R., & Kaur, B. (2011). Using a multi-dimensional approach to
understanding to assess students’ mathematical knowledge. In B. Kaur & K. Y.
Wong (Eds.), Assessment in the mathematics classroom, (pp. 17-32). Singapore:
World Scientific Publishing.
Thompson, D. R., & Senk, S. L. (2008, July). A multi-dimensional approach to
understanding in mathematics textbooks developed by UCSMP. Paper presented
in Discussion Group 17 of the International Congress on Mathematics
Education. Monterrey, Mexico.
Thompson, T. (2008). Mathematics teachers’ interpretation of higher-order thinking
in Bloom’s Taxonomy. International Electronic Journal of Mathematics
Education, 3(2), 96-109.
Usiskin, Z. (1985). We need another revolution in secondary school mathematics. In
C. R. Hirsch (Ed.), The Secondary School Mathematics Curriculum, 1985

44 A Study of Mathematics Written Assessment
Yearbook of the National Council of Teachers of Mathematics, (pp. 1-21).
Reston, VA: National Council of Teachers of Mathematics.
Usiskin, Z. (2012). What does it mean to understand some mathematics. In 12th
International Congress on Mathematics Education (ICME-12) (pp. 8-15).
Wiliam, D. (2001). An overview of the relationship between assessment and the
curriculum. In D. Scott (Ed.), Curriculum and assessment, (pp. 165-181).
Greenwich, CT: JAI Press.
Yeo, K. K. J. (2006, May). A critique of paper-and-pencil secondary one
mathematics semestral assessment papers. Paper presented at the 32nd Annual
Conference of the International Association for Educational Assessment,
Singapore.
Authors:
Wong Lai Fong (corresponding author), Anderson Secondary School, Singapore;
[email protected]; Berinderjeet Kaur, National Institute of Education,
Nanyang Technological University, Singapore; [email protected].