Embed Size (px)
Citation preview
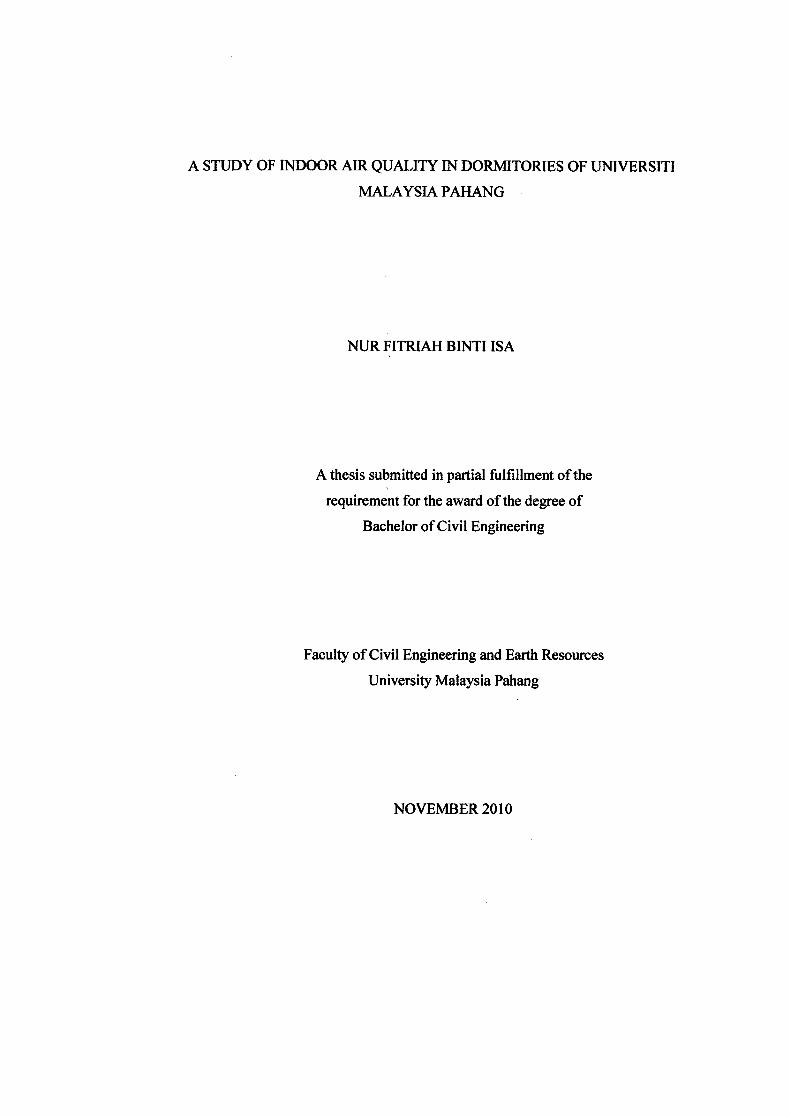
A STUDY OF INDOOR AIR QUALITY IN DORMITORIES OF UNWERSITI
MALAYSIA PAHANG
NUR FITRIAH Bll'4T1 ISA
A thesis submitted in partial fulfillment of the
requirement for the award of the degree of
Bachelor of Civil Engineering
Faculty of Civil Engineering and Earth Resources
University Malaysia Pahang
NOVEMBER 2010
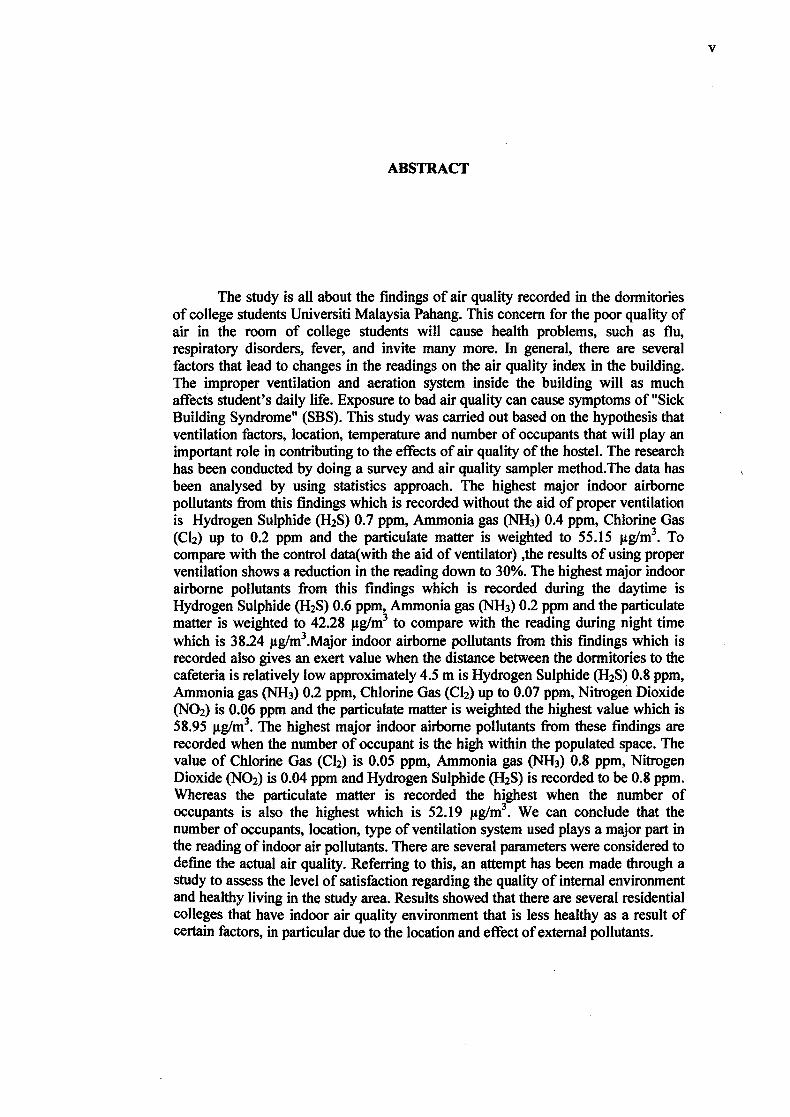
ABSTRACT
The study is all about the findings of air quality recorded in the dormitories of college students Universiti Malaysia Pahang. This concern for the poor quality of air in the room of college students will cause health problems, such as flu, respiratory disorders, fever, and invite many more. In general, there are several factors that lead to changes in the readings on the air quality index in the building. The improper ventilation and aeration system inside the building will as much affects student's daily life. Exposure to bad air quality can cause symptoms of "Sick Building Syndrome" (SBS). This study was carried out based on the hypothesis that ventilation factors, location, temperature and number of occupants that will play an important role in contributing to the effects of air quality of the hostel. The research has been conducted by doing a survey and air quality sampler method.The data has been analysed by using statistics approach. The highest major indoor airborne pollutants from this findings which is recorded without the aid of proper ventilation is Hydrogen Sulphide (H2S) 0.7 ppm, Ammonia gas (NH3) 0.4 ppm, Chlorine Gas (C12) up to 0.2 ppm and the particulate matter is weighted to 55.15 Lg/M3. To compare with the control data(with the aid of ventilator) the results of using proper ventilation shows a reduction in the reading down to 30%. The highest major indoor airborne pollutants from this findings which is recorded during the daytime is Hydrogen Sulphide (H2S) 0.6 ppm, Ammonia gas (NH3) 0.2 ppm and the particulate matter is weighted to 42.28 JLg/m3 to compare with the reading during night time which is 38.24 tg/m3.Major indoor airborne pollutants from this findings which is recorded also gives an exert value when the distance between the dormitories to the cafeteria is relatively low approximately 4.5 in is Hydrogen Sulphide (H2S) 0.8 ppm, Ammonia gas (NH3) 0.2 ppm, Chlorine Gas (C12) up to 0.07 ppm, Nitrogen Dioxide (NO2) is 0.06 ppm and the particulate matter is weighted the highest value which is 58.95 jig/rn3. The highest major indoor airborne pollutants from these findings are recorded when the number of occupant is the high within the populated space. The value of Chlorine Gas (C12) is 0.05 ppm, Ammonia gas (NH3) 0.8 ppm, Nitrogen Dioxide (NO2) is 0.04 ppm and Hydrogen Sulphide (142S) is recorded to be 0.8 ppm. Whereas the particulate matter is recorded the highest when the number of occupants is also the highest which is 52.19 jig/M3. We can conclude that the number of occupants, location, type of ventilation system used plays a major part in the reading of indoor air pollutants. There are several parameters were considered to define the actual air quality. Referring to this, an attempt has been made through a study to assess the level of satisfaction regarding the quality of internal environment and healthy living in the study area. Results showed that there are several residential colleges that have indoor air quality environment that is less healthy as a result of certain factors, in particular due to the location and effect of external pollutants.
V
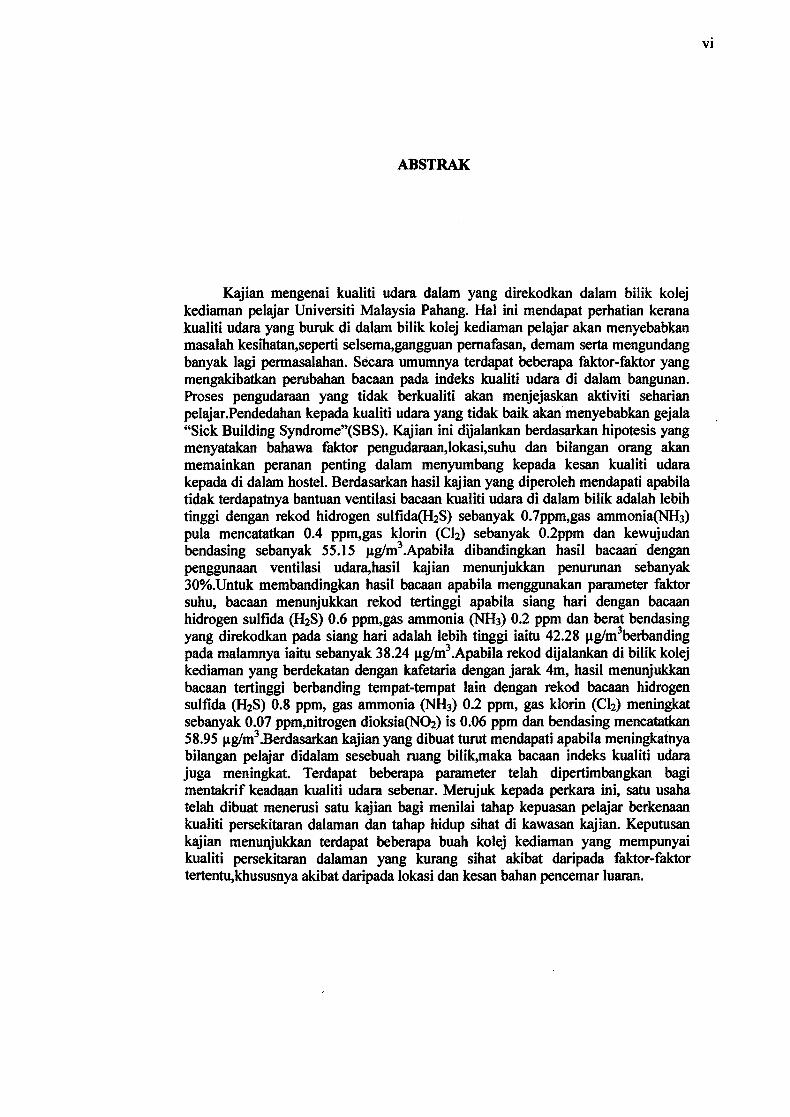
ABSTRAK
Kajian mengenai kualiti udara dalam yang direkodkan dalam bilik kolej kediaman pelajar Universiti Malaysia Pahang. Hal mi mendapat perhatian kerana kualiti udara yang buruk di dalam bilik kolej kediaman pelajar akan menyebabkan masalah kesihatan,seperti selsema,gangguan pernafasan, demam serta mengundang banyak lagi permasalahan. Secara umumnya terdapat beberapa faktor-faktor yang mengakibatkan perubahan bacaan path indeks kualiti udara di dalam bangunan. Proses pengudaraan yang tidak berkualiti akan menjejaskan aktiviti seharian pelajar.Pendedahan kepada kualiti udara yang tidak baik akan menyebabkan gejala "Sick Building Syndrome"(SBS). Kajian mi dijalankan berdasarkan hipotesis yang menyatakan bahawa faktor pengudaraan,lokasi,suhu dan bilangan orang akan memainkan peranan penting dalam menyumbang kepada kesan kualiti udara kepada di dalam hostel. Berdasarkan hasil kajian yang diperoleh mendapati apabila tidak terdapatnya bantuan ventilasi bacaan kualiti udara di dalam bilik adalah lebih tinggi dengan rekod hidrogen sulfida(H2S) sebanyak 0.7ppm,gas ammonia(NH3) pula mencatatkan 0.4 ppm,gas kiorin (02) sebanyak 0.2ppm dan kewujudan bendasing sebanyak 55.15 ig/m3.Apabila dibandingkan hasil bacaan dengan penggunaan ventilasi udara,hasil kajian menunjukkan penurunan sebanyak 30%.Untuk membandingkan hasil bacaan apabila menggunakan parameter faktor suhu, bacaan menunjukkan rekod tertinggi apabila slang hari dengan bacaan hidrogen sulfida (H2S) 0.6 ppm,gas ammonia (NH3) 0.2 ppm dan berat bendasing yang direkodkan path siang hari adalah lebih tinggi iaitu 42.28 tg/m3berbanding pada malamnya iaitu sebanyak 38.24 tg/m3.Apabila rekod dijalankan di bulk kolej kediaman yang berdekatan dengan kafetaria dengan jarak 4m, hasil menunjukkan bacaan tertinggi berbanding tempat-tempat lain dengan rekod bacaan hidrogen sulfida (H2S) 0.8 ppm, gas ammonia (NH3) 0.2 ppm, gas kiorin (C12) meningkat sebanyak 0.07 ppm,nitrogen dioksia(NO2) is 0.06 ppm dan bendasing mencatatkan 58.95 ig/m3 .Berdasarkan kajian yang dibuat turut mendapati apabila meningkatnya bilangan pelajar didalam sesebuah ruang bilik,maka bacaan indeks kualiti udara juga meningkat. Terdapat beberapa parameter telah dipertimbangkan bagi mentakrif keadaan kualiti udara sebenar. Merujuk kepada perkara ini, satu usaha telah dibuat menerusi satu kajian bagi menilai tahap kepuasan pelajar berkenaan kualiti persekitaran dalaman dan tahap hidup sihat di kawasan kajian. Keputusan kajian menunjukkan terdapat beberapa buah kolej kediaman yang mempunyai kualiti persekitaran dalaman yang kurang sihat akibat daripada faktor-faktor tertentu,khususnya akibat daripada lokasi dan kesan bahan pencemar luaran.
A

TABLE OF CONTENTS
vi'
CHAPTER
TITLE
PAGE
TITLE 1
DECLARATION H
DEDICATION HI
ACKNOWLEDGEMENT
iv
ABSTRACT V
ABSTRAK
A
TABLE OF CONTENTS VI'
LIST OF TABLES XII
LIST OF FIGURES xvi
LIST OF ABBREVIATIONS
Ax
LIST OF APPENDICES
1
INTRODUCTION
1
1.1 Background Study 1
1.2 Particulate Matter versus Health
2
1.3 Problem Statement
4
1.4 Objectives of The Study 5
1.5 Scope of Study 6
1.6 Significance of Study 7
1.7 Limitations of Study 8
2 LITERATURE REVIEW 9
2.1 General
9
2. 1.1 Sustainable Development
9
2.1.2 Healthy Environmental Building
10

viii
2.1.3 Comfort Condition 10
2.2 Environmental Health 11
2.3 Definition of Air Pollution 12
2.3.1 Indoor Air Pollution 13
2.4 Indoor Environmental Quality (IEQ) 15
2.4.1 Indoor Air Quality 16
2.4.2 Ventilation 17
2.4.3 Thermal comfort 17
2.5 The Health Factor 18
2.6 Indoor Air Quality Pollution Effect 19
2.6.1 Carbon Monoxide (CO) 19
2.6.2 Carbon Dioxide (CO2) 20
2.6.3 Nitrogen Dioxide (NO2) 22
2.6.4 Sulfur Dioxide (SO2) 22
2.6.5 Radon 23
2.6.6 Particulate Matter (PM 10) 24
2.7 Indoor Environmental Quality Guidelines 25
2.8 Summary of Indoor Air Quality 29
3 METHODOLOGY 30
3.1 Introduction 30
3.2 Planning 32
3.3 Sampling 34
3.4 Instrumentation 35
3.4.1 Gray Wolf Direct Sense 35
3.4.2 Total Suspended Particulate Equipment 36
3.5 Data Analysis 37
3.5.1 The Questionnaire Survey 38
3.5.2 Statistical Analysis 38
3.5.3 Average Index Analysis 39
3.6 Primary and Secondary Sources 40
3.7 Flow Chart of Research Design 41
3.8 Standard Guidelines for Indoor Air Quality 42

lx
4 RESULTS AND ANALYSIS 43
4.0 Introduction 43
4.1 Data Analysis (Questionnaires) 43
4.1.1 Section A: Demographic Information 44
4.1.1.1 Distribution by Gender 44
4.1.1.2 Distribution by Residential College 46
4.1.1.3 Distribution by Smoking Habits 48
4.1.1.4 Distribution by Duration 49
4.1.2 Section B: The Satisfaction of IEQ 51
4.1.2.1 Degree of Satisfaction of IEQ 51
4.1.2.2 Satisfaction Upon Odour Problem 53
4.1.2.3 Satisfaction Upon Thermal Quality 54
4.1.2.4 Satisfaction Upon Soot and Dust 55
4.1.3 Section C: The Satisfaction of Health Quality 56
4.1.3.1 View of Healthy Indoor Quality 56
4.1.3.2 View of Health Problems 58
4.1.3.3 View of Health Relief 59
4.1.3.4 View of Sustainable Development 60
4.2 Data Analysis (Instrumentation) 62
4.2.1 Data Analysis (Particulate Matter PM 10) 62
4.2.1.1 PM10 by Temperature 62
4.2.1.2 PM10 by Day and Night 62
4.2.1.3 PM10 by Mechanical Ventilation 66
4.2.1.4 PM10 by Natural Ventilation 68
4.2.1.5 PM10 by Number Of Occupants 70
4.2.1.6 PM10 by Presence Of Occupants 72
4.2.2 Data Analysis (Other Air Pollutant) 74
4.2.2.1 Location 74
4.2.2.1.1 Ammonia (NH3) 75
4.2.2.1.2 Carbon Monoxide (CO) 76
4.2.2.1.3 Chlorine (C12) 77
4.2.2.1.4 Hydrogen Sulphide 78

x
4.2:2.1.5 Nitrogen Dioxide (NO2) 79
4.2.2.2 Temperature 80
4.2.2.2.1 Ammonia (NH3) 80
4.2.2.2.2 Hydrogen Sulphide 81
4.2.2.3 Presence of Mechanical Ventilator 82
4.2.2.3.1 Ammonia (NH3) 83
4.2.2.3.2 Chlorine (C12) 84
4.2.2.3.3 Hydrogen Sulphide 85
4.2.2.4 Presence of Natural Ventilator 86
4.2.2.4.1 Ammonia (NH3) 87
4.2.2.4.2 Chlorine (C12) 88
4.2.2.4.3 Hydrogen Sulphide 89
4.2.2.4.4 Ammonia (NH3) 90
4.2.2.5 Presence of Occupants 91
4.2.2.5.1 Chlorine (C12) 92
4.2.2.5.2 Ammonia (NH3) 93
4.2.2.5.3 Nitrogen Dioxide (NO 2) 94
4.2.2.5.4 Hydrogen Sulphide 95
4.2.2.6 Number of Occupants 96
4.2.2.6.1 Ammonia (NH3) 97
4.2.2.6.2 Chlorine (C12) 98
4.2.2.6.3 Hydrogen Sulphide 99
4.2.2.6.4 Nitrogen Dioxide (NO2) 100
5 CONCLUSION AND RECOMMENDATIONS 101
5.1 Introduction 101
5.2 Key Findings of Study 101
5.3 Recommendations 104
5.3.1 Improving Indoor Quality Living 104
5.3.2 Recommendation for Future Study 105
REFERENCES 107
APPENDIX A 109
xl
APPENDIX B
113
APPENDIX C
116
APPENDIX I)
123

LIST OF TABLES
TABLE NO TITLE
PAGE
1.1 Lists of Parameters 7
2.1 Indoor Air Pollutant, Sources and Effects 8
2.2 Long Term Goal for Indoor Environmental Quality 25
2.3 List of Contaminant and Maximum Allowable Limits
26
2.4 Guidelines for maximum concentration of specific
27
indoor air contaminants
2.5
Guidelines for Maximum Concentration of Specific
27
Indoor Air Contaminants
2.6
Recommended Maximum Concentration for Specific
28
Classes of Contaminants
2.7
Guidelines Values for Specific Physical Parameters
28
3.1
Rating Scale of Average Index Score 40
3.2
List of Parameters and Standard Guidelines for Indoor Air 42
Quality

4.1 Frequency Distribution by Gender 44
4.2 Descriptive Statistics by Gender 44
4.3 Frequency Distribution by Residential College Allocated 46
4.4 Descriptive Statistics by Residential College 47
4.5 Frequency Distribution of Active Smokers Among Male 48
Respondents
4.6 Descriptive Statistics by Smokers Frequency 49
4.7 Duration of Respondents Inside Dormitories 49
4.8 Descriptive Statistics by Duration 50
4.9 Degree of Satisfaction of Respondents Inside Dormitories 51
4.10 Descriptive Statistics For the Respondents Satisfaction 51
upon Their Dormitories Indoor Air Quality
4.11 Degree of Satisfaction of Respondents Due to Odour 53
Problem Inside Dormitories
4.12 Descriptive Statistics For Inadequate Ventilation 53
Contribution to Bad Odour
4.13 Frequency of Respondents View Due to Thermal Quality 54
Inside Dormitories
4.14 Frequency of Respondents View Due to Thermal Quality 55
Inside Dormitories

4.15 Descriptive Statistics For the Respondents Upon Soot and 55
Dust that Affect the View Area
4.16 Descriptive Statistics For the Respondents Upon Soot and 55
Dust
4.17 Frequency Distribution for Level of Agreement for Health 56
Complaint
4.18 Descriptive Statistics for the Respondents of their View 57
on Living in a Healthy Indoor Environment Condition
4.19 Frequency distribution for level of agreement for 58
experience of frequent health symptoms
4.20 Descriptive statistics for level of agreement for experience 58
of frequent health symptoms
4.21 Frequency distribution for level of agreement that 59
leaving the house gives relief from health complaint
4.22 Descriptive statistics for the respondents for having a feel 59
of relief after leaving the dormitories for long periods
4.23 Frequency distribution for level of agreement for 60
respondent's awareness of sustainable development
4.24 Descriptive statistics for the respondents for their view of 61
the importance of sustainable development
4.25 Particulate Matter (PM 10) in dormitory between day and 62
night

4.26 Descriptive Statistics of Particulate Matter (PM 10) in 63
dormitory between day and night
4.27 Particulate Matter (PM 10) in different dormitories 64
location
4.28 Descriptive Statistics of Particulate Matter (PM 10) in 65
Dormitory between day and night
4.29 Particulate Matter (PM 10) concentration and the 66
mechanical ventilation
4.30 Descriptive Statistics of Particulate Matter (PM 10) 67
concentration and the mechanical ventilation
4.31 Particulate Matter (PM 10) concentration and the natural 68
ventilation
4.32 Descriptive Statistics of Particulate Matter (PM 10) 69
concentration and the natural ventilation
4.33 Particulate Matter (PM 10) concentration and the number 70
of occupants
4.34 Descriptive Statistics of Particulate Matter (PM10) 71
concentration and the number of occupants
4.35 Particulate Matter (PM 10) concentration and the presence 72
of occupants
4.36 Descriptive Statistics of Particulate Matter (PM10) 73
concentration and the number of occupants

LIST OF FIGURES
FIGURE NO TITLE PAGE
2.1 Reasons for Indoor Air Quality Problem 12
3.1 Project Flow of Research Methodology 31
3.2 Outline Research Methodology 32
3.3 Gray Wolf Sense PCCIO IQ-410 (including Probe) 36
3.4 Detail Flow Chart 41
4.1 Frequency Distribution by Gender 45
4.2 Frequency Distribution by Location of Residential 46 College
4.3 Frequency Distribution of Active Smokers Among Male 48 Respondents
4.4 Duration of Respondents Inside Dormitories 50
4.5 Particulate Matter (PM 10) in Dormitory Between Day 63 and Night
4.6 Particulate Matter (PM 10) in Dormitory in Different 65 Dormitories Location
4.7 Particulate Matter (PM 10) Concentration and the 67 Mechanical Ventilation
4.8 Particulate Matter (PM 10) Concentration and the Natural 69 Ventilation
4.9 Particulate Matter (PM 10) Concentration and the Number 71 of Occupants
4.10 Particulate Matter (PM 10) Concentration and the Presence 73

of Occupants
4.11 Ammonia Concentration (ppm) and the Location 75
4.12 Carbon Monoxide Concentration (ppm) and the Location 76
4.13 Chlorine Concentration (ppm) and the Location 77
4.14 Hydrogen Sulphide Concentration (ppm) and the 78 Location
4.15 Nitrogen Dioxide Concentration (ppm) and the Location 79
4.16 Ammonia Concentration (ppm) and the Temperature 80
4.17 Hydrogen Sulphide Concentration (ppm) and the 81 Temperature
4.18 The Presence of Fan Help to Improve Indoor Ventilation 82 System
4.19 Ammonia Concentration (ppm) and Mechanical 83 Ventilation
4.20 Chlorine Concentration (ppm) and Mechanical 84 Ventilation
4.21 Hydrogen Sulphide Concentration (ppm) and Mechanical 85 Ventilation
4.22 Nitrogen Dioxide Concentration (ppm) and Mechanical 86 Ventilation
4.23 The Air Movement Occur Through Natural Ventilation 86
4.24 Chlorine Concentration (ppm) and Natural Ventilation 87
4.25 Ammonia Concentration (ppm) and Natural Ventilation 88
4.26 Nitrogen Dioxide Concentration (ppm) and Natural 89 Ventilation
4.27 Hydrogen Sulphide concentration (ppm) and Natural 90 Ventilation
4.28 Number of Occupants Plays Important Role In Thermal 91 Effects
4.29 Chlorine Concentration (ppm) and Presence Of 92 Occupants

4.30 Ammonia concentration (ppm) and Presence Of 93 Occupants
4.31 Nitrogen Dioxide Concentration (ppm) and Presence Of 94 Occupants
4.32 Hydrogen Sulphide Concentration (ppm) and Presence Of 95 Occupants
4.33 Overall view of Residential College 3 96
4.34 Ammonia Concentration (ppm) and No. Of Occupants 97
4.35 Chlorine Concentration (ppm) and No. Of Occupants 98
4.36 Hydrogen Sulphide Concentration (ppm) and No. Of 99 Occupants
4.37 Nitrogen Dioxide concentration (ppm) and No. Of 100 Occupants

LIST OF ABBREVIATIONS
NHRMC - The National Health and Medical Research Council
SBS - Sick Building Syndrome
US - United States
EPA - Environmental Policy Agent
PM - Particulate Matter
WHO - World Health Organisation
CO - Carbon Monoxide
NO2 - Nitrogen Dioxide
SO2 - Sulfur Dioxide
COHb - Carboxyhemoglobin
liMP - Universiti Malaysia Pahang
SBS - Sick Building Syndrome
IEQ - Indoor Environmental Quality
NIOSH - The National Institute for Occupational Safety and
Health
ASHRAE - American Society of Heating Refrigerating and Air-
Conditioning Engineers
WHO - World Health Organisation
ISO - International Standards Organisation
ET - Effective Temperature
NAAQS - National Ambient Air Quality Standards
OSHA - Occupational Safety and Health
CDPL - Carbon Dioxide ppm Levels
DOSH - Department of Safety and Health
NH3 - Ammonia
C12 - Chlorine
ACCA - Air Conditioning Contractors Association
TLV - Threshold Limit Value
xix

LIST OF APPENDICES
APPENDIX TITLE PAGE
A Figure of The Case Study 109
B Questionnaires for Dormitories Occupants 113
C Data Obtained From Instrument 116
D One-Way ANOVA Analysis 123

CHAPTER 1
INTRODUCTION
1.1 Background Study
The National Health and Medical Research Council (NHMIRC) defines indoor air
as air within a building occupied for at least one hour by people of varying states of health.
This can include the office, classroom, dormitories, shopping centre, hospital and home.
Indoor air quality can be defined as the totality of attributes of indoor air that affect a
person's health and well being.
Increasingly, as dwellings have become better sealed from the external
environment, pollutants being released from indoor sources are being found at higher
concentrations.
Sick building syndrome (sometimes referred to as SBS) becomes evident when
occupants of a home or building experience health problems which have an unknown cause. SBS usually occurs when much time is spent in a home or building. In many cases
the actual cause of the problem cannot be identified. The health problems may be evident
with occupants who spend much time in a certain room or area of the structure, or may be
a problem throughout the entire structure.
In most cases problems become known when a building is operated or
maintained in a manner that is inconsistent with its design. Indoor air problems can begin
because of poor building design or poor maintenance of the building. In other cases found
problems can result because of activities happening within the structure that can have an
environmental effect and make matters worse. It is generally recognized that Malaysians
spend 90% or more of their time indoors.
Despite this, relatively little research has been done on the quality of air in our
homes, universities, recreational buildings, restaurants, public buildings, offices, or inside
cars
Poor indoor air quality can result in significant adverse impacts on our health and
environment. Moreover, these impacts carry a significant cost burden to the economy. In
recent years, comparative risk studies performed by the US EPA and its Science Advisory
Board have consistently ranked indoor air pollution among the top five environmental
risks to public health (US EPA, 1993).
1.2 Particulate Matter versus Health
Particulate matter (PM) is an air pollutant consisting of a mixture of particles that
can be solid, liquid or both, are suspended in the air and represent a complex mixture of
organic and inorganic substances. These particles vary in size, composition and origin.
Their properties are summarized according to their particle size.
2

3
L The coarse fraction is called PM 10 (particles with an aerodynamic diameter
smaller than 10pm), which may reach the upper part of the airways and
lung.
ii. Smaller or fine particles are called PM 2.5 (with an aerodynamic diameter
smaller than 2.5 pin); these are more dangerous because they penetrate
more deeply into the lung and may reach the alveolar region.
The size of the particles also determines the time they spend in the atmosphere.
While sedimentation and precipitation removes PM1O from the atmosphere within few
hours of emission, PM2.5 may remain there for days or even a few weeks. Consequently,
these particles can be transported over long distances. The systematic data assessment
completed in 2004 by the WHO European Centre for Environment and Health, Bonn,
indicates that:
1. PM increases the risk of respiratory death in infants under 1 year, affects
the rate of lung function development, aggravates asthma and causes other
respiratory symptoms such as cough and bronchitis in children
ii. PM2.5 seriously affects health, increasing deaths from cardiovascular and
respiratory diseases and lung cancer. Increased PM2.5 concentrations
increase the risk of emergency hospital admissions for cardiovascular and
respiratory causes.
iii. PM10 affects respiratory morbidity, as indicated by hospital admissions for
respiratory illness.
The gaseous pollutants from combustion sources include some identified as
Prominent atmospheric pollutants - carbon monoxide (CO), nitrogen dioxide (NO2), and
sulfur dioxide (SO2).
Carbon monoxide is an asphyxiant. An accumulation of this odorless, colorless gag
may result in a varied constellation of symptoms deriving from the compound's affinity for and combination with hemoglobin, forming carboxyhemoglobin (COHb) and disrupting

oxygen transport. The elderly, the fetus, and persons with cardiovascular and pulmonary
diseases are particularly sensitive to elevated CO levels.
Nitrogen dioxide (NO) and sulfur dioxide (SO 2) act mainly as irritants, affecting
the mucosa of the eyes, nose, throat, and respiratory tract. Acute S0 2-related bronchial
constriction may also occur in people with asthma or as a hypersensitivity reaction.
Extremely high-dose exposure (as in a building fire) to NO2 may result in pulmonary
edema and diffuse lung injury. Continued exposure to high NO 2 levels can contribute to
the development of acute or chronic bronchitis.
The relatively low water solubility of NO2 results in minimal mucous membrane
irritation of the upper airway. The principal site of toxicity is the lower respiratory tract.
Recent studies indicate that low-level NO 2 exposure may cause increased bronchial
reactivity in some asthmatics, decreased lung function in patients with chronic obstructive
pulmonary disease, and an increased risk of respiratory infections, especially in young
children.
The high water solubility of SO2 causes it to be extremely irritating to the eyes and
upper respiratory tract. Concentrations above six parts per million produce mucous
membrane irritation. Epidemiologic studies indicate that chronic exposure to SO2 is
associated with increased respiratory symptoms and decrements in pulmonary function.
Clinical studies have found that some asthmatics respond with bronchoconstriction to even
brief exposure to SO2 levels as low as 0.4 parts per million.
13 Problem Statement
The quality of indoor air is concerned more and more by the government and the
Public in Malaysia nowadays and the indoor air regarding the health effects are becoming
a serious challenge in both urban and rural areas of Malaysia. In order to further study the
factors which affects of the indoor air quality and population exposure to dormitories of
Universiti Malaysia Pahang, it is very important for us to know clearly what the major
indoor airborne particulate pollutants is in dormitories to get the information that can lead 10 analysis of sick building syndrome.
4

Adherence to the increasing awareness towards protecting the environment in
development, this study emerges as a tool to help and enable the determination of the
factors that increase of PM (particulate matter) levels within the house. We need to
contribute to the environment that receives or possibly receives the impact from the test
conducts, through self-commitment and provision of resources to make an environmental
management system successful (Siah, 2005).
Various studies have shown that presence of occupants, outdoor air speed, location
characteristics and quality of ventilation system are large contributor to the generation of
particulate matters concentration. In order to improve the quality of indoor air pollution,
existing research works will be developed on the methods which will be discussed in the
following chapter.
1.4 Objectives of The Study
The pace of changes and development of the Malaysian economy have been rapid
and have inevitably boosted the lifestyle of its citizens. Without jeopardizing the ability of
future generation to meet their own needs, effective indoor air quality strategies within
each dormitories should be developed and implemented. One of the ways to achieve it is
to identify the sources that could assist in the reducing of the air pollutant particulate
matters. Hence, the objectives of the study are twofold:
To investigate and record the major airborne particulate matters within
student dormitories in Universiti Malaysia Pahang
ii. To compare and analyse the data results which shows the concentration
levels of particulate matter major airborne particles.
5

1.5 Scope of Study
The study focuses on the dormitories in Universiti Malaysia
Pahang(UMP),ReasOns mainly due to location accessibility and availability. In this case,
several dormitories will be chosen based on certain characteristic. They were made up of
mainly dormitories with variety of characteristics such as number of occupants, location
either located nearby cafeteria or waste disposal center, with or without natural or
mechanical ventilation, and temperature. As this case study will involve exposure
monitoring which takes at least 8 hours in order to make this case study a success.
Dormitories will be chosen depending on room configurations and structural
characteristics that affect ventilation. In choosing the dormitories, a survey will be
conducted to understand the lifestyle of the student, and whether the dorm is good enough
for the health of the occupants. The upcoming information will be taken from the student
health's information by doing short survey to strengthening the data collected to consider
whether the dormitories in UMP are safe to health.General question about the importance
of sustainable development also been asked to require the information on how the
knowledge of sustainability of development of the environment being perceived by the
randomized student of UMP.
The phase of designing the ventilation system to improvised the system will not be
taken into consideration since the designing part is way too far from the scope of the study
to be completed within the estimated time. Furthermore, a more careful research need to
be conducted to implement it and need to be conducted as a group by group.
6

Table 1.1: Lists of parameters that will plays a vital role to the change of reading
Parameter Details
Temperature • Day
• Night
Number of Occupants/Students in one • 5 students
dorm • 6 students
• 7 students
• 8 students
Ventilation (mechanical/natural) • Windows (open/close)
• Fan (on/off)
Location of the dormitories • Near cafeteria
• In between two buildings
• Facing open space
Presence of occupants • With occupant
• Without occupant
1.6 Significance of Study
The study was conducted in order to represent local satisfaction of the students
regarding the quality of indoor air inside the dormitories due to impact of surroundings.
On the other hand, this study also might also help in improving the air quality and
measuring and enhancing pollutants levels by applying strategies of controlling the source,
improving the current ventilation systems and providing air cleaners in future
development. Apart from that, this study also investigated the degree of understanding for
local inhabitant corresponds to development planning. To sum it all up, the finding of the
7


![Indoor Air Pollution - WordPress.com · Chapter 1 Indoor Air Pollution “Indoor air pollutant levels are 25-62% greater [in our homes] ... poor indoor air quality is to install a](https://img.dokumen.tips/doc/110x75/5b511fb87f8b9a7b648b9e83/indoor-air-pollution-chapter-1-indoor-air-pollution-indoor-air-pollutant.jpg)