Embed Size (px)
Citation preview
Journal of Statistics Education, Volume 21, Number 1 (2013)
1
A Study of Faculty Views of Statistics and Student Preparation Beyond an Introductory Class Kirsten Doehler Laura Taylor Elon University Jessalyn Smith CTB/McGraw Hill Journal of Statistics Education Volume 21, Number 1 (2013), www.amstat.org/publications/jse/v21n1/doehler.pdf Copyright © 2013 by Kirsten Doehler, Laura Taylor and Jessalyn Smith all rights reserved. This text may be freely shared among individuals, but it may not be republished in any medium without express written consent from the authors and advance notification of the editor. Key Words: Introductory Statistics; Statistics Education; Teaching; Undergraduate Research. Abstract The purpose of this research is to better understand the role of statistics in teaching and research by faculty from all disciplines and their perceptions of the statistical preparation of their students. This study reports the findings of a survey administered to faculty from seven colleges and universities regarding the use of statistics in teaching and research with undergraduate students. The introductory statistics course serves as a foundation for statistical methods that students learn and use in classes within numerous other disciplines. Information was collected from faculty on how students can be better prepared in the introductory statistics class to use statistics in other disciplines. Findings from this paper imply that statistics is being widely used in a variety of disciplines but also suggest that cooperative communication and transitional second courses in statistics be implemented. This paper also highlights the varied statistical techniques that faculty members teach in their courses and mentor in student research projects and statistical experiences. 1. Introduction It is becoming more widespread for college students to take an introductory statistics course, whether it is within mathematics/statistics departments or in an allied field. Between 1995 and 2010, enrollment in elementary statistics courses at four-year colleges in mathematics and

Journal of Statistics Education, Volume 21, Number 1 (2013)
2
statistics departments in the United States increased from 164,000 to 312,000 students according to the 2005 and 2010 reports by the Conference Board of Mathematical Sciences (CBMS) (Lutzer, Rodi, Kirkman, and Maxwell 2007, CBMS 2010 draft results). This represents a 90% increase. Comparatively, there was a 33% increase in non-advanced mathematics course (precollege, introductory, and calculus) enrollments (Lutzer et al. 2007, CBMS 2010 draft results). Introductory statistics courses are usually offered within a mathematics and/or statistics department and are often the first of several statistics courses or experiences, such as undergraduate research, involving student use of statistics. In many cases, additional statistics courses or experiences with statistics are taught or facilitated by faculty in client disciplines such as the student’s major or an area of academic interest. The widespread use of statistics in client disciplines has been established in many studies (Carlson 2002; Switzer and Horton 2007; Sterling, Rosenbaum, and Weinkam 1995). With faculty from various backgrounds teaching statistics in their courses and using statistics while engaging students in research, college students are being exposed to statistics in a wide variety of contexts. In the past decade the American Statistical Association has endorsed the Guidelines for Assessment and Instruction in Statistics Education (GAISE) report (Aliaga, Cobb, Cuff, Garfield, Gould, Lock, Moore, Rossman, Stephenson, Utts, Velleman, and Witmer 2005). Other recommendations have been proposed in the statistics education community and several studies have collected data from faculty teaching statistics. Data were gathered from interviews with a sample of statistics instructors teaching a non-traditional (reformed) statistics class as part of research into reform endeavors within statistical education (Garfield 2000; Garfield, Hogg, Schau, and Whittinghill 2002). This study resulted in recommendations that included developing support for statistics instructors in client disciplines and the creation of a second course. Hassad (2007) also investigated reform-oriented pedagogies through the development of the Faculty Attitude Toward Statistics (FATS) scale, the first instrument for measuring attitudes toward teaching statistics. In addition, Hassad (2011) developed the Teaching of Introductory Statistics Scale (TISS) that considers instructional customs and tools used in introductory statistics. The quality of statistics education received by students is of particular interest since Cobb (1993, paragraph 3) reminds us that “Of all subjects taught as often as statistics, surely no other subject is so often taught by faculty with so little formal training in the subject.” Given that statistics is taught by faculty from a wide range of disciplines with varied levels of knowledge in the subject, it makes sense that Shaughnessy (2007) supports increasing research efforts related to the conceptions that instructors have towards statistics. We are helping to investigate this issue by considering several questions, one of which is related to faculty notions of the statistical preparation of students upon entering their courses. We are not aware of research that has focused on understanding the statistical interactions (teaching and mentoring) of faculty from many disciplines with students. We have surveyed faculty across all disciplines from seven different universities. This paper reports the findings from this survey regarding the teaching of statistics and the use of statistics in undergraduate research across disciplines. Statisticians are well aware that other fields utilize statistics, and our survey provides an opportunity to better understand the audience of our client disciplines and the precise statistical methods and procedures they use most frequently. Several questions of interest in our study are given in the following list:

Journal of Statistics Education, Volume 21, Number 1 (2013)
3
• In which disciplines are faculty teaching statistical methods and using statistical methods
in undergraduate research projects? • How do faculty perceive the statistical preparation of students entering their classes? • What suggestions do faculty from client disciplines provide for improving introductory
statistics courses? 2. Methods An inventory available in the Appendix was developed and used in this study to address the use of statistics in teaching and undergraduate research. The items in this inventory were part of a larger survey that was conducted to gather data on attitudes and perceptions of faculty toward statistics. Participants were asked whether or not they teach statistical methods in their courses (see Question 7 in the Appendix). For the participants who indicated that they used statistical methods in their teaching, a list of 15 statistical topics was provided and respondents were prompted to select all of the methods that they use in their teaching (see Question 8 in the Appendix). Respondents were also provided with an option to list additional topics. Individuals responding that they teach statistics were asked to report their level of agreement on a five-point Likert-scaled item (strongly disagree to strongly agree) related to a statement about their satisfaction with the statistical knowledge and preparation of students entering their courses (see Question 11 in the Appendix). Additionally, all survey respondents were asked to complete a sentence related to the statistical preparation needed to be successful in their classes (see Question 12 in the Appendix). For all but one of the schools where the survey was administered, individuals could complete the sentence with one of five options, where the last option was “Question does not apply.” At one school this fifth option was not available. Similarly, participants were asked whether or not they use statistical methods in their students’ undergraduate research projects (see Question 9 in the Appendix). For individuals who indicated that they used statistical methods in undergraduate research, the same list of 15 topics was provided and respondents were asked to indicate which analysis methods they had utilized in research projects with undergraduates (see Question 10 in the Appendix). Again an option to list other statistical methods was available. The list of statistical methods provided to respondents for both the teaching and undergraduate research project questions was considered to be representative of methods commonly covered in undergraduate statistics courses and utilized in undergraduate research projects. Statistical tools utilized in previous teaching and consulting experiences were also considered by the authors while developing the list of topics. There were 22 individuals who wrote in an additional statistical topic that they utilized in their teaching and 20 individuals who wrote in an additional topic that they had used in undergraduate research projects. When these two lists of additional topics are combined, there was no single topic mentioned more than four times. Also, since two of the methods in our list of 15 were used so infrequently, we grouped them into the “Other” category in the tables of results.

Journal of Statistics Education, Volume 21, Number 1 (2013)
4
At two universities, respondents were given an opportunity to offer suggestions related to how statistical preparation can be improved for students in their discipline (see Question 13 in the Appendix). This open-ended item allowed faculty from a wide variety of disciplines to provide feedback on their perceptions of potential improvements to statistics education. Several items related to demographic information were also included. The questionnaire was administered through the Survey Methods online software by sending a link to all faculty via email. The inventory was administered to faculty at seven institutions, ranging from liberal arts colleges to research universities. Participants at six of these schools had the option of having their name entered into a random drawing for one of five $20 Target gift cards.
The following results are based on data found in the statuse.csv file. The file StatUse.txt includes more information about the variables in the statuse.csv file. 3. Results 3.1 Sample Characteristics The inventory was administered to all faculty at seven different institutions, ranging from liberal arts colleges to research universities. The institutions from which data was gathered are East Carolina University, Elon University, Lenoir-Rhyne University, Northern Kentucky University, Western Kentucky University, Westminster College, and Wilkes University. These institutions were chosen based on convenience. Participation in the study was optional. There were a total of 747 teaching faculty and staff respondents who answered at least one of the two main inventory items. Of the teaching faculty and staff who responded, 72.4% were on the professorial track (assistant, associate, or full professor), 21.4% were on other teaching tracks, and 6.2% answered other or administrator. Additionally, this study had responses from a wide range of academic disciplines, including some fields that are not commonly thought of as being consumers of statistics within the arts and humanities. Table 1 provides a distribution of respondents based on self-identified area of affiliation. Surprisingly, about 60% of responses were from faculty who did not identify themselves with either Social/Behavioral Sciences or STEMS disciplines (Science/Technology/Engineering/Mathematics/Statistics). The mean and median number of years taught by respondents was 13.4 and 10.4 years, respectively.

Journal of Statistics Education, Volume 21, Number 1 (2013)
5
Table 1: Counts and percentages of respondents describing their use of statistics in undergraduate classes they teach based on area of primary affiliation (n=747).
Uses Statistics in Classes Teaches Statistics in Classes
Total By
Affiliation
Almost all of the time
Frequently Occasionally Rarely Never Yes No
Arts
31 4.1%
0 0.0%
1 3.2%
2 6.5%
13 41.9%
15 48.4%
1
30
Business/Management
67 9.0%
8 11.9%
17 25.4%
19 28.4%
18 26.9%
5 7.5%
37
29
Communications
31 4.1%
0 0.0%
2 6.5%
13 41.9%
13 41.9%
3 9.7%
8
23
Education
76 10.2%
3 3.9%
9 11.8%
32 42.1%
23 30.3%
9 11.8%
14
62
Health/Medicine
119 15.9%
4 3.4%
34 28.6%
44 37.0%
31 26.1%
6 5.0%
27
92
Humanities
84 11.2%
0 0.0%
4 4.8%
21 25.0%
28 33.3%
31 36.9%
7
77
Professional Fields
28 3.7%
0 0.0%
7 25.0%
10 35.7%
9 32.1%
2 7.1%
5
23
STEMS (Science/Technology/ Engineering/ Mathematics/Statistics)
153 20.5%
19 12.4%
47 30.7%
55 35.9%
23 15.0%
9 5.9%
97
54
Social/Behavioral Sciences
154 20.6%
26 16.9%
47 30.5%
52 33.8%
23 14.9%
6 3.9%
80
73
Vocational/Technical Fields
4 0.5%
0 0.0%
0 0.0%
4 100.0%
0 0.0%
0 0.0%
3
1
Total by statistics use in undergraduate classes
747 100.0%
60 8.0%
168 22.5%
252 33.7%
181 24.2%
86 11.5%
279
464
Percentages within each affiliation aggregate to 100% across the “Uses Statistics in Classes” columns. Total counts in the “Teaches Statistics in Classes” columns do not add to total by affiliation for three disciplines due to missing values. 3.2 Teaching Many disciplines teach statistics, which is not surprising, but the extent, frequency, and preparation of faculty who teach and use statistics is often unclear. In particular, we found that 85% of respondents have taken a statistics class on some level (high school, undergraduate, or graduate school). Of those who teach statistics in their classes, about 6% reported that they had not had a statistics class themselves. In addition to sample characteristics, Table 1 shows the number of faculty in each discipline area that teach statistics in their classes. Approximately 38% of respondents teach statistical methods in their courses. In four of the 10 affiliation categories (Business/Management, STEMS, Social/Behavioral Sciences, and Vocational/Technical Fields) more than 50% of respondents indicated that they teach statistics in their classes. Table 1 also gives information on how often faculty use statistics in their classes. In all affiliations except for Arts and Humanities, more than 48% of individuals responded that they use statistics occasionally, frequently, or almost all of the time in their classes. As expected, in Business/Management, the STEMS disciplines, and Social/Behavioral Sciences, a majority of

Journal of Statistics Education, Volume 21, Number 1 (2013)
6
respondents reported teaching or using statistics. Surprisingly, 25% of individuals in the Humanities use statistics occasionally. Overall, all areas represented use statistics to some extent. It is interesting to note that in some disciplines there are major discrepancies between the percentage of faculty who teach statistics in their classes and the percentage of faculty who use statistics occasionally, frequently, or almost all of the time in their classes. For example, in Education, Health/Medicine, and the Professional Fields the percentage of individuals responding that they use statistics occasionally, frequently, or almost all of the time is at least three times greater than the percentage of individuals teaching statistics in their classes. Also, in the Communications discipline nearly twice as many individuals stated that they used statistics occasionally, frequently, or almost all of the time in their classes compared to the percentage that teach statistics. A summary of the topics covered by the 279 respondents who teach statistical analysis methods in their classes is provided in Table 2. Statistical topics are listed in order of frequency of overall occurrence. Only affiliations with 14 or more individuals responding that they taught statistics were included in Table 2. All other affiliations were grouped together and listed as “Other.”

Journal of Statistics Education, Volume 21, Number 1 (2013)
7
Tab
le 2
: Pe
rcen
tage
s of r
espo
nden
ts te
achi
ng th
e fo
llow
ing
stat
istic
al m
etho
ds in
thei
r cou
rses
by
area
of
affil
iatio
n.
Ove
rall
n=27
9
95.7
%
90.0
%
78.9
%
73.8
%
63.8
%
56.3
%
55.2
%
53.0
%
46.2
%
40.1
%
28.0
%
20.4
%
20.1
%
16.5
%
Not
e: 2
79 o
f the
747
resp
onde
nts i
ndic
ated
that
they
teac
h st
atis
tical
ana
lysi
s met
hods
in th
eir c
lass
es.
Are
as
of a
ffilia
tion
with
less
than
14
resp
onde
nts w
ere
incl
uded
in th
e “O
ther
” ca
tego
ry.
Oth
er
n=24
95.8
%
91.7
%
70.8
%
75.0
%
50.0
%
50.0
%
25.0
%
54.2
%
33.3
%
33.3
%
16.7
%
29.2
%
8.3%
8.3%
S/B
n=80
100%
87.5
%
92.5
%
78.8
%
66.3
%
62.5
%
58.8
%
58.8
%
46.3
%
43.8
%
35.0
%
38.8
%
31.3
%
25.0
%
STEM
S n=
97
92.8
%
92.8
%
72.2
%
73.2
%
67.0
%
57.7
%
70
.1%
42.3
%
51.5
%
42.3
%
26.8
%
2.1%
11.3
%
15.5
%
H/M
n=
27
88.9
%
77.8
%
59.3
%
63,0
%
44.4
%
51.9
%
14.8
%
63.0
%
22.2
%
44.4
%
33.3
%
25.9
%
18.5
%
7.4%
E n=
14
100%
100%
78.6
%
85.7
%
64.3
%
64.3
%
21.4
%
57.1
%
50.0
%
35.7
%
21.4
%
28.6
%
7.1%
0%
B/M
n=
37
97.3
%
91.9
%
86.5
%
67.6
%
73.0
%
43.2
%
70.3
%
59.5
%
56.8
%
29.7
%
21.6
%
16.2
%
32.4
%
18.9
%
Com
putin
g D
escr
iptiv
e St
atist
ics (
mea
n, m
edia
n, st
d. d
ev.)
Cre
atin
g H
istog
ram
s, B
ar C
harts
, Sca
tterp
lots
& o
ther
Gra
phs
Cor
rela
tion
T-te
sts
Con
fiden
ce In
terv
als
Chi
-Squ
are
Tests
Leas
t Squ
ares
Reg
ress
ion
Ana
lysis
of V
aria
nce
(AN
OV
A)
Hyp
othe
sis T
ests
for P
ropo
rtion
s
Test
s of N
orm
ality
Non
para
met
ric M
etho
ds
Cro
nbac
h’s A
lpha
Oth
er T
opic
s
Logi
stic
Regr
essio
n
Table 2 shows that Least Squares Regression has a much higher occurrence rate in STEMS disciplines and Business/Management compared to the overall occurrence of 55.2%. Less than 22% of the respondents in Education and Health/Medicine affiliations reported teaching Least Squares Regression. Of those teaching statistics in their classes, T-tests are taught by 10% more respondents than confidence intervals and in all affiliations except Business/Management, T-tests are taught more frequently than confidence intervals. It is also interesting to note that overall hypothesis tests for proportions are of less interest than various other topics including chi-square tests and ANOVA. However, this is in large part because respondents in the

Journal of Statistics Education, Volume 21, Number 1 (2013)
8
Health/Medicine affiliation reported teaching hypothesis tests for proportions only 22.2% of the time. In the other four affiliations specified in Table 2 at least 46.3% of respondents reported teaching this topic. There are also contrasting percentages for the use of Cronbach’s alpha between STEMS (which would include all statistics classes offered by mathematics and/or statistics departments) and all other affiliations. In particular, Cronbach’s alpha is taught by only 2.1% of respondents in STEMS disciplines compared to being taught by between 16.2% and 38.8% of respondents teaching statistics in other affiliations. A similar disparity is noticed in the Other Topics category. For example, more than 31% of respondents in both Business/Management and Social/Behavioral Sciences taught other statistical topics not specifically mentioned in Table 2 as opposed to only 11.3% of STEMS respondents teaching other topics. The only topics listed multiple times in the Other Topics category were Bayesian statistics, probability, sampling, and time series, each of which was mentioned twice. Some of the topics listed once in this category include information criteria for regression models, factor analysis, hierarchical linear models, MANOVA, power analysis, spatial statistics, statistical process control, and survival analysis. Respondents who reported teaching statistical methods were asked to rate their level of agreement on a five-point Likert scale from strongly agree to strongly disagree with the following statement: I am satisfied with the statistical knowledge and preparation of students entering my courses. Of the 277 individuals answering this question, 9.4% strongly agreed, 17.0% moderately agreed, 30.7% were neutral, 30.3% moderately disagreed, and 12.6% strongly disagreed. Note that these results include some faculty members who teach introductory statistics classes, and therefore may be teaching students who have limited or no exposure to statistics. Results for this item were also examined based on affiliation. In each of the five affiliations shown in Table 2, at least 37% of respondents reported that they either moderately or strongly disagreed with the statement. Among the five affiliations in Table 2, the Social/Behavioral Sciences had the largest percentage of agreement with the statement (33.8%), the largest percentage of disagreement with the statement (48.8%), and the smallest percentage of neutral responses (17.5%). 3.3 Undergraduate Research Participants were asked whether or not they have their students use statistics in undergraduate research projects. A summary of the responses to this question can be found in Table 3. Approximately 48% of all respondents reported using statistics in undergraduate research projects. About twice as many respondents in Communications, Health/Medicine, Humanities, and the Professional Fields reported using statistics in undergraduate research projects compared to the number of individuals who reported teaching statistics in Table 1.

Journal of Statistics Education, Volume 21, Number 1 (2013)
9
Table 3: Counts and percentages of respondents within each area of primary affiliation that use statistics when advising undergraduate research projects (n=746 because of one missing response).
Area of Primary Affiliation
Have used statistical methods when advising research projects
Have not used statistical methods when advising research projects
Arts
0 0.0%
31 100.0%
Business/Management
32 47.8%
35 52.2%
Communications
14 45.2%
17 54.8%
Education
24 31.6%
52 68.4%
Health/Medicine
56 47.1%
63 52.9%
Humanities
14 16.9%
69 82.1%
Professional Fields
11 39.3%
17 60.7%
STEMS (Science/Technology/Engineering/ Mathematics/Statistics)
102 66.7%
51 33.3%
Social/Behavioral Sciences 104 67.5%
50 32.5%
Vocational/Technical Fields 2 50.0%
2 50.0%
Overall
359 48.1%
387 51.9%
In Business/Management, Communications, and Health/Medicine responses are split fairly evenly between respondents that do and do not use statistical methods when advising research projects. As expected, in Arts, Education, and Humanities significantly more respondents do not use statistical methods when advising research projects whereas the opposite is true for STEMS and Social/Behavioral Sciences. Participants reporting that they mentored undergraduate research projects involving statistics were asked to select the topics they have utilized from the same list presented to those who reported teaching statistics. The topics being used in undergraduate research projects for the 359 faculty who reported using statistical methods are summarized in Table 4. Again the topics are reported with the most frequently used topic listed first and the least frequently used topic occurring last. The order of topics is relatively similar to the list of topics in Table 2 with no topic moving more than two spots up or down.

Journal of Statistics Education, Volume 21, Number 1 (2013)
10
T
able
4: P
erce
ntag
es o
f res
pond
ents
usi
ng th
e fo
llow
ing
stat
istic
al m
etho
ds in
und
ergr
adua
te re
sear
ch
proj
ects
by
area
of a
ffili
atio
n.
O
vera
ll n=
359
94.7
%
82.7
%
74.1
%
73.3
%
56.5
%
56.0
%
54.6
%
42.6
%
34.8
%
34.8
%
25.9
%
25.9
%
18.7
%
16.7
%
Not
e: 3
59 o
f the
747
resp
onde
nts i
ndic
ated
that
they
use
d st
atis
tical
ana
lysi
s met
hods
in u
nder
grad
uate
re
sear
ch p
roje
cts.
Are
as o
f aff
iliat
ion
with
less
than
24
resp
onde
nts w
ere
incl
uded
in th
e “O
ther
” ca
tego
ry.
Oth
er
n=41
95.1
%
70.7
%
51.2
%
48.8
%
41.5
%
34.1
%
31.7
%
14.6
%
19.5
%
26.8
%
19.5
%
19.5
%
7.3%
7.3%
S/B
n=10
4
98.1
%
82.7
%
82.7
%
82.7
%
67.3
%
65.4
%
56.7
%
47.1
%
43.3
%
43.3
%
27.9
%
49.0
%
29.8
%
21.2
%
STEM
S n=
102
96.1
%
89.2
%
72.5
%
72.5
%
55.9
%
50.0
%
61.8
%
65.7
%
32.4
%
24.5
%
29.4
%
3.9%
16.7
%
17.6
%
H/M
n=
56
85.7
%
75.0
%
80.4
%
64.3
%
66.1
%
66.1
%
53.6
%
12.5
%
35.7
%
42.9
%
30.4
%
28.6
%
12.5
%
17.9
%
E n=
24
100%
87.5
%
66.7
%
87.5
%
41.7
%
58.3
%
50.0
%
25.0
%
45.8
%
29.2
%
12.5
%
25.0
%
20.8
%
4.2%
B/M
n=
32
90.6
%
87.5
%
75.0
%
81.3
%
37.5
%
53.1
%
59.4
%
56.3
%
25.0
%
40.6
%
18.8
%
25.0
%
12.5
%
18.8
%
Com
putin
g D
escr
iptiv
e St
atist
ics (
mea
n, m
edia
n, st
d. d
ev.)
Cre
atin
g H
istog
ram
s, B
ar C
harts
, Sca
tterp
lots
& o
ther
Gra
phs
T-te
sts
Cor
rela
tion
Chi
-Squ
are
Tests
Ana
lysis
of V
aria
nce
(AN
OV
A)
Con
fiden
ce In
terv
als
Leas
t Squ
ares
Reg
ress
ion
Test
s of N
orm
ality
Hyp
othe
sis T
ests
for P
ropo
rtion
s
Non
para
met
ric M
etho
ds
Cro
nbac
h’s A
lpha
Oth
er T
opic
s
Logi
stic
Regr
essi
on
Similar to the result from Table 2, Least Squares Regression has a much higher occurrence rate in STEMS disciplines and Business/Management compared to the overall occurrence of 42.6%. We also note that Cronbach’s alpha is still underrepresented in STEMS compared to all other disciplines. There were four topics mentioned multiple times in the Other Topics category. Specifically, principal component analysis was mentioned four times, MANOVA was mentioned three times, and both factor analysis and multivariate statistics were mentioned twice. Other topics that were listed only once in this category include Bayesian statistics, hierarchical linear

Journal of Statistics Education, Volume 21, Number 1 (2013)
11
models, power analysis, spatial statistics, survival analysis, and time series. In all topics shown in Table 4 except for Computing Descriptive Statistics, the “Other” affiliation has a lower percentage than the overall occurrence rate. 3.4 Views on Statistical Preparation of Students This survey was also aimed at better understanding how faculty perceive the statistical preparation of students entering their courses. All participants were asked to rate the overall statistical needs or expectations of students taking their classes by selecting which statement they supported the most. This question is shown in item 12 in the Appendix. The school that piloted this survey did not have the last option of “Question does not apply,” so the last two options were combined in Table 5.
Table 5: Counts and percentages of respondents giving their opinions on statistical preparation of students.
Statistical Preparation Total By
Affiliation Overly
Prepared Adequately
Prepared Additional
Classes Useful No need for
Statistics/Does Not Apply Arts
31 4.2%
0 0.0%
7 22.6%
4 12.9%
20 64.5%
Business/Management
66 8.9%
0 0.0%
25 37.9%
33 50.0%
8 12.1%
Communications
31 4.2%
0 0.0%
14 45.2%
11 35.5%
6 19.4%
Education
76 10.2%
0 0.0%
22 28.9%
40 52.6%
14 18.4%
Health/Medicine
119 16.0%
1 0.8%
33 27.7%
57 47.9%
28 23.5%
Humanities
84 11.3%
0 0.0%
19 22.6%
16 19.0%
49 58.3%
Professional Fields
28 3.8%
0 0.0%
4 14.3%
11 39.3%
13 46.4%
STEMS (Science/Technology/ Engineering/ Mathematics/Statistics)
152 20.4%
0 0.0%
49 32.2%
78 51.3%
25 16.4%
Social/Behavioral Sciences
153 20.6%
1 0.7%
45 29.4%
84 54.9%
23 15.0%
Vocational/Technical Fields
4 0.5%
0 0.0%
1 25.0%
3 75.0%
0 0.0%
Total by statistics use in undergraduate classes
744 100.0%
2 0.3%
219 29.4%
337 45.3%
186 25.0%
In six of the 10 areas represented in the table the most common response was that students would be more prepared if additional statistics classes were taken. Communications is the only discipline where the most popular response was that students are adequately prepared and do not need additional statistics classes. Excluding those individuals who responded “No need for statistics” or “Does Not Apply,” approximately 60% of the respondents felt that additional classes would be useful.

Journal of Statistics Education, Volume 21, Number 1 (2013)
12
3.5 Suggestions for the Introductory Statistics Course In order to obtain information on thoughts of faculty about how students can be better prepared to use statistics in other courses, we asked an open-ended question at two universities in the study. This question prompted respondents to provide feedback on how the department that houses statistics on campus could better prepare students to use statistics in their discipline.
There were 141 individuals who responded with at least one suggestion. We have highlighted some specific responses by common theme in Table 6. The most popular responses were related to increasing statistical literacy, concepts, and interpretations. There were many responses that dealt with making statistics relevant and connecting statistics to a specific discipline in the form of examples, special classes, etc. Table 6: A summary of the responses to the question “How can the Department of ___(department name inserted here)____ better prepare students for using statistics in your discipline?
Category of Response
Total Number of Responses
Increase statistical literacy, concepts, and interpretations.
35
Be relevant.
23
Cover specific content.
22
Create a discipline-specific statistics course. 20
Miscellaneous. 17
Connect introductory statistics to a specific discipline.
14
University specific comment. 14
Use specific technologies or software. 11
Increase rigor. 10
Integrate statistics into upper-level courses within other disciplines.
10
Overall
176
Throughout this section of the paper we have highlighted various interesting facets of the data, and we invite readers to explore the provided data set more fully. 4. Study Limitations A pilot study was conducted at one university, which led to minor changes in the survey to make it clearer. For example, in item seven the word “undergraduate” was inserted since not all schools surveyed after the pilot study were primarily focused on undergraduate education.

Journal of Statistics Education, Volume 21, Number 1 (2013)
13
Responses to items 8 and 10 were limited because the topics provided were not an exhaustive list. The list provided focused more on topics that were related to analyzing data after it had been gathered. The open-ended item related to suggestions for the introductory statistics course was part of the survey at only two of the seven schools. These two schools were chosen for the extra item based on the input of a statistician at the school and because we wanted to limit the number of responses needing to be categorized. Lastly, some schools are more heavily represented because of low response rates from universities where invitations to take the survey could not be sent from a university associated email address. Generalizing this research is limited since the data were gathered through a combination of convenience and voluntary response sampling. In particular, individuals with a greater interest in statistics may have been more likely to respond to the survey. 5. Discussion Our study provided an opportunity for faculty from numerous areas including the client disciplines to share their opinions on how introductory statistics could be improved. There appears to be a disconnection between what often occurs in an introductory statistics course and how faculty from client disciplines view what is taking place. For example, it is common practice to use real data, but it does not appear to be perceived by faculty that we do this (Table 6). One possible explanation for this disconnection comes from Macnaughton (1998), who highlights that using real data is not enough and instead realistic data that will be viewed as important by students is necessary. He further warns against using “frivolous” data that leads students to view statistics as “frivolous.” Introductory statistics often provides a first impression of statistics to students that can lead to further propagation of this mindset in future classes where other faculty use statistics and interact with these students. Participants expressed a desire to create connections between statistics and other disciplines, such as economics and biology. Arguably, using real data and making connections are goals of introductory statistics teachers. On a positive note, these comments demonstrate that statistics is being widely utilized by faculty in numerous areas so that students have a potentially high exposure to statistics in the client disciplines. That is, students are seeing that statistics is a discipline that rarely stands alone; it has more value when connections are made to other disciplines. Based on our study, we see that faculty from a wide variety of academic areas are modeling the use of statistics in their classes and mentoring undergraduate research projects that utilize statistical tools (Table 1, Table 2, Table 3, and Table 4). Many statistics faculty would agree that it is not necessary for students to learn a vast number of statistical techniques in introductory statistics, but rather to have a sufficient grasp of statistical thinking and reasoning so that they can easily adapt and apply other statistical methods, even those that are more complex. This idea is directly in line with the first recommendation from the GAISE report, which is “Emphasize statistical literacy and develop statistical thinking” (Aliaga et al. 2005). However, from our study, it is evident that our client disciplines are not completely being served by introductory classes as currently offered and express a desire for students to have more statistical preparation

Journal of Statistics Education, Volume 21, Number 1 (2013)
14
(Table 5). There is also clearly a desire from other disciplines to provide discipline-specific statistical education and connections (Table 6). This study demonstrates the reach of statistics into many client disciplines both in coursework and undergraduate research projects. Although some results may not be overly surprising or new, this study highlights that introductory statistics courses are not terminal statistical experiences for many students as demonstrated by the high use of statistics in coursework and student research within numerous disciplines. Therefore, introductory statistics courses serve the purpose of preparing students for future statistical experiences beyond the introductory statistics classroom. 6. Recommendations From the results of this study, suggestions can be made for departments and faculty developing and expanding statistics education at their institutions. It is recommended that lines of open communication be developed and that transitional second courses be created. Besides helping to meet the needs of client disciplines that have been highlighted, these recommendations also promote the GAISE report (Aliaga et al. 2005) and other notable findings (e.g. Garfield 2000; Garfield et al. 2002; Moore 1997). The results of open communication are two-fold. Introductory statistics faculty will understand the statistical toolkits that students will need to be familiar with in other disciplines and obtain real data from these disciplines (i.e., faculty will be better able to see the trajectory that students are on). Also, faculty in client disciplines will be provided with better prepared students and an understanding of the current best practices for teaching statistics (Garfield et al., 2002; Jordan and Haines, 2006; Zieffler, Park, Garfield, delMas, and Bjornsdottir 2008). Additionally, it is recommended that a second course is created (Garfield et al. 2002). It is our recommendation that these second courses should serve the purpose of transitioning students from the statistical thinking and logic of an introductory statistics course to the mindset of using statistics within other disciplines by building connections. As Zieffler et al. (2008) suggest, “It is recommended that statistics teachers help students experience the practice of statistics, which in turn helps them to understand its power and utility.” These second courses will also provide appropriate exposure early in students’ academic careers to make the connection between statistical thinking and the application of statistics in their own areas of study. This proposed type of transitional second course is supported by the vast number of comments in Table 6 regarding discipline-specific content, courses, and data. A second course also provides the opportunity to break away from calculator-based instruction and to introduce software to students that prepares students to be users of statistics. These courses would most properly be taught in computer labs. Moreover, a second course allows for additional semester hours studying statistics in which special topics that could not fit into a single semester of introductory statistics can be introduced. These special topics can fit the needs of the students and their affiliated client disciplines as an introduction or overview to the methods that they will most commonly encounter in discipline-specific courses or research projects. Lastly, it could be very beneficial to offer this second statistics course as a class that is team-taught by a statistician and a

Journal of Statistics Education, Volume 21, Number 1 (2013)
15
faculty member within a client discipline. 7. Future Work As discussed earlier, creating a second course in statistics addresses the feedback from client disciplines that students need more statistical preparation. However, adding a second statistics course to the requirements for a discipline-specific major will increase credit hour requirements. Are faculty willing to increase the number of required courses or drop some other required course from the curriculum to make room for this second statistics course? Additionally, if students are unable to take a second course, it would be extremely difficult for the introductory course to meet the needs of all disciplines. Since the GAISE guidelines (Aliaga et al. 2005) support a strong conceptual understanding of statistics, covering additional statistical procedures in an introductory course is not practical. Note though, that it is unknown whether faculty in client disciplines are aware of these guidelines. Therefore, for future administrations of this survey, it is recommended that additional questions be added to the survey to address these issues. One question should ask faculty responders whether they are willing to require additional credit hours within a discipline-specific major to accommodate this second statistics course. If not, then a question needs to ask whether responders are willing to replace a required course from their curriculum with a second statistics course. If responders are unwilling to add a second course, a follow-up question should seek out information on what course content they would be willing to have omitted in order to incorporate discipline-specific material in an introductory course. At least one question should also focus on whether respondents, especially those within client disciplines, are aware of best practices and recommendations from statistics education research, such as the GAISE report. In addition, it would be interesting to include a question asking respondents whether they would be willing to team-teach a second statistics course. Forthcoming administrations of our survey would benefit from additional topics in the list of statistical methods utilized in undergraduate research and teaching, such as those that have already been mentioned under Other Topics in this administration of the survey. Other suggested options include Z-Tests for proportions and/or population means, experimental design, and sampling methods. Also, the confidence interval option can be clarified by including confidence intervals for proportions and confidence intervals for means as two separate topics. We believe the study presented in this article is a launching point for meaningful research related to faculty needs and perceptions of statistics. Future studies at other institutions would further enhance the understanding of how faculty view statistics and its usefulness. Lastly, the current data could be enhanced by using random sampling techniques and gathering results from larger research universities.

Journal of Statistics Education, Volume 21, Number 1 (2013)
16
Appendix: Survey
1. Do you wish to participate in this study? a) Yes b) No
2. Which area is your primary affiliation? a) Arts b) Business/Management c) Communications d) Education e) Health/Medicine f) Humanities g) Mathematics/Statistics h) Professional Fields i) Science/Technology/Engineering (excluding Math/Statistics) j) Social/Behavioral Sciences
3. Which of the following best describes you?
a) Adjunct b) Administrator c) Assistant Professor d) Associate Professor e) Professor f) Instructor (Full-time) g) Instructor (Part-time) h) Staff (Nonteaching) i) Staff (Teaching) j) Other (please specify)
4. How many years have you been teaching at the collegiate level? (Not including years as
a teaching assistant. Please include the current year.)
5. Have you ever taken a statistics class? a) Yes b) No
Journal of Statistics Education, Volume 21, Number 1 (2013)
17
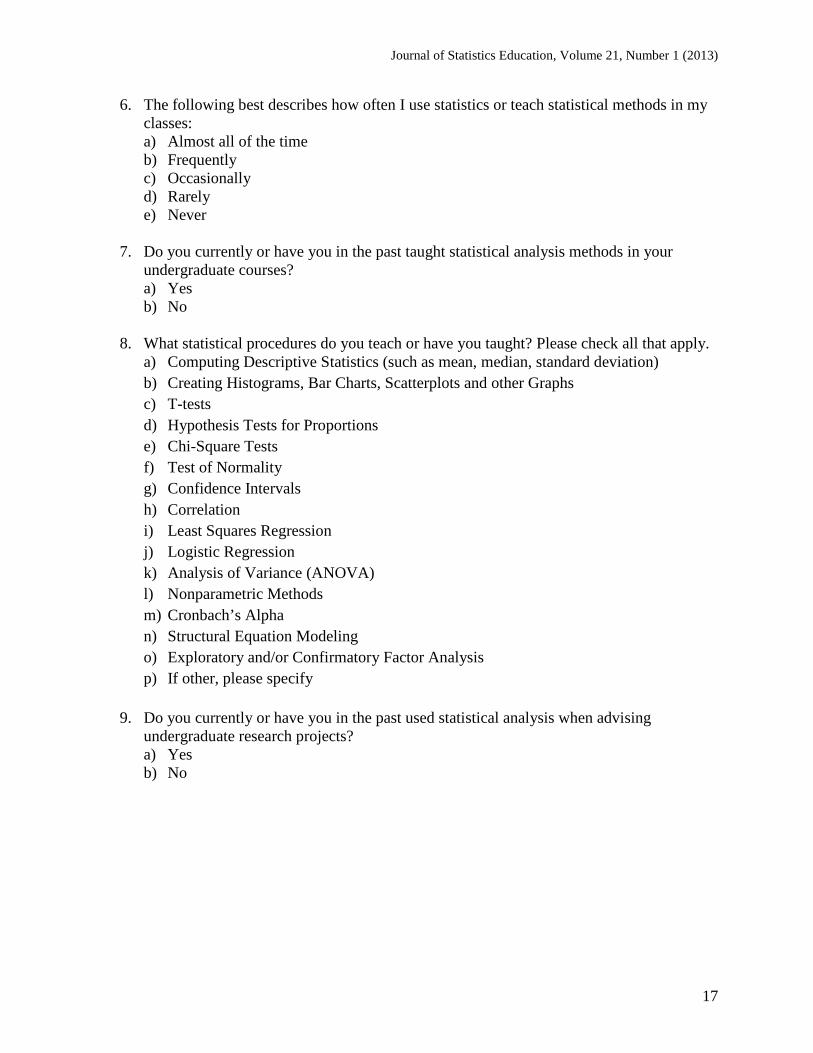
6. The following best describes how often I use statistics or teach statistical methods in my classes: a) Almost all of the time b) Frequently c) Occasionally d) Rarely e) Never
7. Do you currently or have you in the past taught statistical analysis methods in your
undergraduate courses? a) Yes b) No
8. What statistical procedures do you teach or have you taught? Please check all that apply.
a) Computing Descriptive Statistics (such as mean, median, standard deviation) b) Creating Histograms, Bar Charts, Scatterplots and other Graphs c) T-tests d) Hypothesis Tests for Proportions e) Chi-Square Tests f) Test of Normality g) Confidence Intervals h) Correlation i) Least Squares Regression j) Logistic Regression k) Analysis of Variance (ANOVA) l) Nonparametric Methods m) Cronbach’s Alpha n) Structural Equation Modeling o) Exploratory and/or Confirmatory Factor Analysis p) If other, please specify
9. Do you currently or have you in the past used statistical analysis when advising
undergraduate research projects? a) Yes b) No

Journal of Statistics Education, Volume 21, Number 1 (2013)
18
10. What statistical procedures do you use in undergraduate research projects? Please check all that apply. a) Computing Descriptive Statistics (such as mean, median, standard deviation) b) Creating Histograms, Bar Charts, Scatterplots and other Graphs c) T-tests d) Hypothesis Tests for Proportions e) Chi-Square Tests f) Test of Normality g) Confidence Intervals h) Correlation i) Least Squares Regression j) Logistic Regression k) Analysis of Variance (ANOVA) l) Nonparametric Methods m) Cronbach’s Alpha n) Structural Equation Modeling o) Exploratory and/or Confirmatory Factor Analysis p) If other, please specify
11. For the following statement, please indicate your level of agreement or disagreement: I am satisfied with the statistical knowledge and preparation of students entering my courses. a) strongly agree b) moderately agree c) neutral d) moderately disagree e) strongly disagree
12. For students taking my classes, I believe that they a) would be more prepared if they took additional statistics classes. b) are adequately prepared and do not need additional statistics classes. c) are overly prepared and have taken more statistics classes than they need. d) do not need to take any statistics classes to be successful. e) Question does not apply.
13. How can the Department of __________________ better prepare students for using statistics in your discipline?

Journal of Statistics Education, Volume 21, Number 1 (2013)
19
Acknowledgements This project began as a course release given by Elon University to two of the authors. Also, an Associate Provost Special Grant through Elon University supplied funding for incentives at five of the schools that participated in the study. The authors would also like to thank reviewers of several versions of this manuscript for their thoughtful comments and helpful suggestions. References Aliaga, M., Cobb, G., Cuff, C., Garfield, J., Gould, R., Lock, R., Moore, T., Rossman, A., Stephenson, B., Utts, J., Velleman, P., and Witmer, J., (2005), “Guidelines for Assessment and Instruction in Statistics Education (GAISE): College Report,” USA: American Statistical Association. Carlson, B. (2002), “Preparing Workers for the 21st Century: The Importance of Statistical Competencies,” in the Proceedings of the International Conference on Teaching Statistics (ICOTS-6). Cobb, G.W. (1993), “Reconsidering Statistics Education: A National Science Foundation Conference,” Journal of Statistics Education [Online], 1(1). Available at http://www.amstat.org/publications/jse/v1n1/cobb.html
“Conference Board of the Mathematical Sciences 2010 Survey of Undergraduate Program in the Mathematical Sciences,” accessed November 14, 2012. Available at http://www.ams.org/profession/data/cbms-survey/cbms2010-work Garfield, J. (2000), “An Evaluation of the Impact of Statistics Reform,” Final Report for NSF project REC-9732404. Garfield, J., Hogg, B., Schau, C., and Whittinghill, D. (2002), “First Courses in Statistical Science: The Status of Educational Reform Efforts,” Journal of Statistics Education [Online], 10(2). Available at http://www.amstat.org/publications/jse/v10n2/garfield.html Hassad, R. A. (2007), “Development and Validation of a Scale for Measuring Instructors’ Attitudes toward Concept-Based or Reform-Oriented Teaching of Introductory Statistics in the Health and Behavioral Sciences,” Dissertation, Touro University International. Hassad, R. A. (2011), “Constructivist and Behaviorist Approaches: Development and Initial Evaluation of a Teaching Practice Scale for Introductory Statistics at the College Level,” Numeracy [online], 4(2), DOI: 10.5038/1936-4660.4.2.7. Available at http://scholarcommons.usf.edu/numeracy/vol4/iss2/art7 Jordan, J. and Haines, B. (2006), “The Role of Statistics Educators in the Quantitative Literacy Movement,” Journal of Statistics Education, 14(2). Available at http://www.amstat.org/publications/jse/v14n2/jordan.html

Journal of Statistics Education, Volume 21, Number 1 (2013)
20
Lutzer, D. J., Rodi, S. B., Kirkman, E. E., and Maxwell, J. W. (2007), Statistical Abstract of Undergraduate Programs in Mathematical Sciences in the United States, USA: American Mathematical Society. Macnaughton, D., (1998), “Eight Features of an Ideal Introductory Statistics Course.” Available at http://www.matstat.com/teach/b0067.pdf Moore, D. S. (1997), Response. International Statistical Review, 65(2), 162-165. Shaughnessy, M. (2007), “Research on statistics learning and reasoning,” in Second Handbook of Research on Mathematics Teaching and Learning, Charlotte, NC: Information Age Publishing, 957-1010.
Sterling, T. D., Rosenbaum, W. L., and Weinkam, J. J. (1995), “Publication Decisions Revisited: The Effect of the Outcome of Statistical Tests on the Decision to Publish and Vice Versa.” The American Statistician, 49(1), 108-112.
Switzer, S. S. and Horton, N. J. (2007), “What Your Doctor Should Know about Statistics (but Perhaps Doesn’t…),” CHANCE, 20(1), 17-21. Zieffler, A., Park, J., Garfield, J., delMas, R., Bjornsdottir, A., (2008), “The Statistics Teaching Inventory: A Survey on Statistics Teachers’ Classroom Practices and Beliefs,” Journal of Statistics Education, 20(1). Available at http://www.amstat.org/publications/jse/v20n1/zieffler.html Kirsten Doehler Department of Mathematics and Statistics Elon University Campus Box 2320 Elon, NC 27244 Phone: 336-278-6473 [email protected] Laura Taylor Department of Mathematics and Statistics Elon University Campus Box 2320 Elon, NC 27244 Phone: 336-278-6493 [email protected] Jessalyn Smith CTB/McGraw Hill 131 Traylor's Gate Circle Irmo, SC 29063

Journal of Statistics Education, Volume 21, Number 1 (2013)
21
Phone: 803-834-4863 [email protected]
Volume 21 (2013) | Archive | Index | Data Archive | Resources | Editorial Board | Guidelines for Authors | Guidelines for Data Contributors | Guidelines for Readers/Data Users | Home Page |
Contact JSE | ASA Publications