Embed Size (px)
Citation preview

A Study of Enrollment Projections for D.C.’s Public Schools: Assuring Accuracy and Transparency Conducted by Cooperative Strategies, 21st Century School Fund, and Urban Institute for the Office of the District of Columbia Auditor
September 28, 2018
Kathleen Patterson, District of Columbia Auditorwww.dcauditor.org
D.C.’s Public Schools Enrollment Report Dashboard

September 28, 2018
The Hon. Phil Mendelson, Chairman The Hon. Mary Cheh, D.C. Councilmember The Hon. David Grosso, D.C. Councilmember Council of the District of Columbia 1350 Pennsylvania Avenue, N.W. Washington, D.C. 20004
Dear Chairman Mendelson and Councilmembers Cheh and Grosso:
I am pleased to share A Study of Enrollment Projections for D.C.’s Public Schools: Assuring Accuracy and Transparency. The study was requested and funded by the Council of the District of Columbia, at the initiation of D.C. Councilmember Mary Cheh. She asked ODCA to conduct “a study on student enrollment that assesses the District’s current methodology against best practices for student enrollment projections and estimates current and projected enrollment numbers for the District’s public schools based on the District’s demographic trends.”
To conduct the study requested by the Council the D.C. Auditor contracted in December 2017 with a trio of consultants led by Cooperative Strategies (CS), a national firm based in Ohio and California with extensive national experience projecting public school enrollment. CS was supported by the Urban Institute and the 21st Century School Fund, local firms with both local and national research and policy experience. The comprehensive report was released at a briefing for members of the D.C. Council followed by a Wilson Building press conference.
Projecting future enrollment is an essential responsibility of school districts that municipalities and districts rely on for planning, budgeting, and evaluation. The District uses next year projections for annual education appropriations for DCPS and charter schools, and long-term enrollment projections by city and for individual schools for educational facility capital planning. The Public Charter School Board references future enrollments when making authorizing decisions for enrollment ceilings and awarding new charters.
The study team focused its work on developing a process to assure accuracy, transparency, and efficiency in the regular development and use of next year and multi-year enrollment projections. The team did a comprehensive review of public school enrollment in the District of Columbia, including enrollment projections over the last several years, both 5- and 10-year projections, a methodology for use by policymakers, and recommendations on a process for completing projections to assure accuracy, transparency and efficiency in their development.
Key findings are:
• D.C. public school enrollment is projected to grow between 12,000 and 17,000 students in the next 10 years.
• Projection methods are least accurate for schools with high mobility rates.
• Projection process can be made more accurate, transparent and efficient.

wide, sector, school, and school by grade—the study team worked to understand the current levels of accuracy of projections and propose the optimal method for accurate, transparent, and efficient development of projections.
The report is presented as a 95-page text, plus several appendices. In addition, information used in the report has been uploaded to an interactive online dashboard, available at www.dcauditor.org. The dashboard includes school-level, baseline projections, and residence projection data, including at-risk percentage, historical enrollment, and mobility status. It is our hope that this wealth of information is of value to the public and other researchers going forward.
The report’s recommendations are built into an Enrollment Projections Development Process, a 15-step outline for the Office of the Deputy Mayor for Education, the Office of the State Superintendent of Education and Local Education Authorities, including opportunities for information exchange among local school stakeholders. The research team recommended that the District government—the Mayor and D.C. Council—adopt the projection methodology and 15-step process to assure accuracy and transparency going forward.
As is usual with the reports that ODCA produces in-house, we have included in the final report comments from the Bowser Administration. We were pleased that the Deputy Mayor for Education found the majority of our report to be informative. On those issues that were deemed to need more clarification or revision, we have made adjustments to the report in response. ODCA greatly appreciates the ongoing collaboration with our colleagues at the office of the Deputy Mayor for Education, OSSE, and DCPS on this complex and important topic.
It is our hope that the recommendations presented in this report, many of which are in practice to some extent, are intended to make the overall process more accurate, timely, efficient, and transparent.
Sincerely yours,
Kathleen PattersonDistrict of Columbia Auditor

Contents:
Introduction & Purpose ………………………………………………………………………………… 1
Acronyms …………………………………………………………………………………………………… 2
Definitions …………………………………………………………………………………………………… 3
Overview of Process, Findings & Recommendations …………………………………………… 4
Process / Background ………………………………………………………………………………… 5
Overview of Findings …………………………………………………………………………………… 6
Overview of Recommendations …………………………………………………………………… 7
Historical Enrollment …………………………………………………………………………………… 10
Summary of Enrollment Projections ……………………………………………………………… 11
Interactive Dashboard ………………………………………………………………………………… 12
Section 1: Dynamic City and Schools ………………………………………………………………… 14
Washington D.C. - Demographic Overview …………………………………………………… 14
Demand and Supply Factors Affecting Enrollment Projections ……………………… 17
Neighborhood Factors ………………………………………………………………………………… 20
School Supply Side Factors ………………………………………………………………………… 23
Section 2: Best Practices for Enrollment Projections ………………………………………… 27
Best Practices for Enrollment Projections ……………………………………………………… 27
Section 3: Processes & Methods in Comparable Cities ………………………………………… 30
Inputs and methods …………………………………………………………………………………… 32
Process and Adjustments …………………………………………………………………………… 32
Uses of Enrollment Projections …………………………………………………………………… 32
School District Interview Summary ……………………………………………………………… 32
State Interview Summary …………………………………………………………………………… 35
Section 4: Projection Processes & Methods in D.C. …………………………………………… 37
Enrollment Projection Methodology ……………………………………………………………… 37
Next-year Projections ……………………………………………………………………… 37
Multi-year Projections ……………………………………………………………………… 37
Overall Population Forecasts …………………………………………………………… 37
Uses of Enrollment Projections …………………………………………………………………… 37
Setting the District’s Operating Budget for Public Education ……………… 38
Budgeting for weighted subgroups …………………………………………………… 39
Charter Facility Allowances ……………………………………………………………… 39
Educational Facility Master and Capital Planning ……………………………… 39
Estimating the Number of Lottery Seats …………………………………………… 40
DCPS Enrollment Projection Methodology …………………………………………………… 41

Data used in DCPS Preliminary Baseline Projections ………………………… 41
Cohort Method ………………………………………………………………………………… 41
Entry Grades Enrollment Projections ………………………………………………… 41
Early Childhood Enrollment Projections …………………………………………… 41
Subgroup Projections ……………………………………………………………………… 42
Adjustments to Cohort Estimates ………………………………………………………………… 43
DCPS Central Office Review ……………………………………………………………… 43
DCPS Principal Petitions ………………………………………………………………… 43
Mid-Year Enrollment Adjustment ……………………………………………………… 43
DCPS DME Review …………………………………………………………………………… 44
Projecting Public Charter School Enrollment ………………………………………………… 44
Data used in PCS Projections …………………………………………………………… 44
LEA Process …………………………………………………………………………………… 44
PCSB Collection via the HUB …………………………………………………………… 44
PCS DME Review …………………………………………………………………………… 45
Certification of Enrollment Projections ………………………………………………………… 45
Council Review …………………………………………………………………………………………… 45
Key Findings ……………………………………………………………………………………………… 46
Section 5: Testing and Developing Methods for D.C. …………………………………………… 48
Accuracy of Current Projections …………………………………………………………………… 48
One-Year Comparison of Audited to Projected Enrollment …………………… 48
MAPE Results Overview …………………………………………………………………… 49
Findings for Charter Schools …………………………………………………………… 55
Blind Study of Enrollment Projections …………………………………………………………… 57
Student Mobility in D.C. Public and Public Charter Schools …………………………… 60
Mobility Index for Individual Schools ………………………………………………… 61
What Matters Most: Factors Affecting Projection Accuracy …………………………… 63
Methods of this Analysis …………………………………………………………………… 64
Findings ………………………………………………………………………………………… 65
How these findings might be used …………………………………………………… 69
Section 6: Proposed Process and Methodology for Developing Enrollment Projections by School: …………………………………………………………………………………… 70
Recommended adjustment #1 ………………………………………………………… 73
Recommended adjustment #2 ………………………………………………………… 74
Use of Enrollment Projections: ……………………………………………………………………… 77

Section 7: Historical / Projected Enrollment ……………………………………………………… 78
Historical Enrollment …………………………………………………………………………………… 78
Summary of Enrollment Projections ……………………………………………………………… 81
Baseline Enrollment Projections by School …………………………………………………… 81
Feeder Patterns ……………………………………………………………………………… 81
Birth Data ……………………………………………………………………………………… 81
Enrollment Projection Methodology ………………………………………………… 81
Survival Ratios ………………………………………………………………………………… 82
Enrollment Projections …………………………………………………………………… 84
System-wide Enrollment Projections …………………………………………………………… 87
Enrollment Projections Based on Residence ………………………………………………… 88
Historical Enrollment ……………………………………………………………………… 88
Birth Data ……………………………………………………………………………………… 89
Survival Ratios ………………………………………………………………………………… 89
Enrollment Projections …………………………………………………………………… 89
Interactive Dashboard ……………………………………………………………………… 90
Conclusion …………………………………………………………………………………………………… 93
Acknowledgements ……………………………………………………………………………………… 94
Agency Comments ………………………………………………………………………………………… 97
Appendices ………………………………………………………………………………………………… 101
Appendix A ………………………………………………………………………………………………… 102
Appendix B ………………………………………………………………………………………………… 110
Appendix C ………………………………………………………………………………………………… 120

StudyofEnrollmentinD.C.PublicSchools
IncludingCurrentMethodologyandFutureProjections
ConductedbyCooperativeStrategies,21stCenturySchoolFund,andUrbanInstitutefortheOfficeoftheDistrictofColumbiaAuditor
KathleenPatterson,DistrictofColumbiaAuditorwww.dcauditor.org

1
Introduction&PurposeInJanuary2018,CooperativeStrategies,inpartnershipwiththe21stCenturySchoolFundandtheUrbanInstitute,wascontractedbytheOfficeoftheD.C.Auditor(ODCA)toprovideaStudyofEnrollmentinD.C.PublicSchoolsIncludingCurrentMethodologyandFutureProjections,asrequestedbyD.C.CouncilmemberMaryCheh(Ward3).Thefollowingtaskswereincludedinthisstudy:
• Reviewandassess theprocessesbywhichDCPS, theOfficeof theState Superintendentof Education(OSSE),andtheDeputyMayorforEducation(DME)havepredictedtheenrollmentinD.C.PublicSchoolswithafocusonschoolyears2015-16,2016-17,and2017-18.
• Research and determine best practices in enrollment projections and assess the extent towhich theDistricthasutilizedbestpracticesinthelastthreeschoolyears,includinghowtheDistrictofColumbiaenrollmentprojectionshavebeenutilizedinmakingbudgetandfacilitiesdecisions.
• ConductademographicanalysisoftheDistrict’spopulationincludingreasonsforandareasofgrowthandchange inrecentyears,witha focusonschool-agepopulations, includingthehistoric trends inpublic,publiccharter,andprivateschoolenrollmentintheDistrict.
• Providea5-yearanda10-yearenrollmentprojectionbygradelevel,pre-schoolthrough12thgradeandincludeaprojectedbreakdownbasedonbest-availabledataforDCPS,D.C.PublicCharterSchools,andD.C.independentschools.
• ProposeareplicablemethodologyfortheDistrictgovernmenttousegoingforwardtoprojectenrollmentwiththeassumptionthatsuchprojectionswillcontinuetobeutilizedinbudgetingandfacilitiesplanning.
• ProduceadraftandfinalwrittenreporttobereleasedpubliclybyODCA.
OnJanuary24,2018theODCAheldameetingtokickoffthestudyandintroducetheCooperativeStrategiesTeamtokeymembersofvariousDistrictofColumbiaagenciesthatwouldbeinstrumentalinprovidingdataandinputneededforthestudy.

2
AcronymsBelowisalistofacronymsusedthroughoutthisreport.
ADA:AverageDailyAttendanceCIP:CapitalImprovementsPlanCPS:ColumbusPublicSchools(Ohio)D.C.:DistrictofColumbiaDCMR:DistrictofColumbiaMunicipalRegulationsDCPS:DistrictofColumbiaPublicSchoolsDGS:DepartmentofGeneralServicesDME:DeputyMayorforEducationDOF:CaliforniaDepartmentofFinanceDPS:DenverPublicSchoolsELL:EnglishLanguageLearnerES:ElementarySchoolEsri:EnvironmentalSystemsResearchInstituteGIS:GeographicInformationSystemsHS:HighSchoolK-5:Gradeskindergarten,first,second,third,fourth,andfifthLEA:LocalEducationAuthorityLSAT:LocalSchoolAdvisoryTeamMAPE:MeanAbsolutePercentErrorMFP:MasterFacilitiesPlanMS:MiddleSchoolNCES:NationalCenterforEducationStatistics
OCFO:OfficeoftheChiefFinancialOfficerOCTO:OfficeoftheChiefTechnologyOfficerODCA:OfficeoftheD.C.AuditorODME:OfficeoftheDeputyMayorforEducationOFCC:OhioFacilitiesConstructionCommissionOP:DistrictofColumbiaOfficeofPlanningOSSE:OfficeoftheStateSuperintendentofEducationOUSD:OaklandUnifiedSchoolDistrictPCSB:PublicCharterSchoolBoardPCS:PublicCharterSchoolsPDE:PennsylvaniaDepartmentofEducationP/E:ProjectiontoenrollmentratioPK:Pre-KindergartenPK3:3-year-oldpre-kindergartenstudentsPK4:4-year-oldpre-kindergartenstudentsSEA:StateEducationAgencySEO:StateEducationOfficeSDP:SchoolDistrictofPhiladelphiaSPED:SpecialEducationSRA:SchoolReformActSY:SchoolYearUG:UngradedUPSFF:UniformPerStudentFundingFormula
3
Definitions
Belowisaglossaryoftermsfrequentlyusedthroughoutthisreport:
Capacity–Thetotalnumberofstudentsaschoolcanserve
EnrollmentRoll-up(“Roll-up”)–thesumofenrollmentbyschoolbygradeuptoLEAorsystem-widelevel
FeederPatterns–theprogressionofschoolassignmentforstudentsbasedongeography(studentresidence)orprogramenrollment
Mobility-howmanystudentsenteredandlefttheschoolfromyeartoyear
Projection Ratios – the ratios determined based on survival ratios that are applied to current enrollment todevelopenrollmentprojections
StudentMobility-afunctionofgrossmobility,whichcanbethoughtofastheextenttowhichtheindividualswithinstudentpopulationchangefromyeartoyear,evenifoverallenrollmentremainssteady.Itisalsodefinedasapropertyofaschoolinthetransitionbetweenadjacentgrades,notofthegradesthemselves.
SurvivalRatios–thepercentageofstudentsthatmovefromgradetograde,yeartoyear;birthtokindergarten5yearslater;birthtoPK33yearslater;birthtoPK44yearslater
4
OverviewofProcess,Findings&RecommendationsThechangingpopulationanddemographicsintheDistrictofColumbiacombinedwithcomplexpubliceducationstudent assignment and choice policies create an environment in which it is difficult to predict the futureenrollment of children, youth and adults in the District of Columbia. At the same time, projecting futureenrollmentisanessentialresponsibilityofschooldistrictsandmunicipalities.Atthemunicipallevel,publicschoolenrollment affects land use, community use of school buildings and grounds, housing and neighborhooddevelopment, and transportation and municipal budgets. At the school level, it affects staffing, programopportunities,andthequalityofneighborhoodschoolsandthetypeandqualityoftheDistrictofColumbiaPublicSchools(DCPS)andcharterschoolchoicesforfamilies.
Projectingfutureenrollmentisanecessaryandessentialprocessthatschooldistrictsrelyonformanydifferentreasons. Projectionsaremostoftenusedforplanning,particularlyformasterfacilitiesplanning,buildingnewschools or consolidating schools, and for boundary adjustments as populations shift over time. However,enrollmentprojectionsintheDistrictofColumbiaarealsousedforannualbudgeting,andsohaveasector,localeducationagency(LEA)andschool leveleffectoncity,LEAandschoolbudgets. Thechanges intheDistrictofColumbiaandinthepubliceducationsectorcreateanenvironmentinwhichpredictingthefutureenrollmentofchildren,youthandadultsiscomplex.
ThisstudyexploredthecomplexitiesofprojectingenrollmentfortheDistrictofColumbiaandproposesprocessesand methods for next year and five and ten-year projections. To build a recommendation for enrollmentprojectionprocessesandmethodologythatarepracticalandofgoodvaluefortheuniquecharacteroftheDistrictof Columbia public education system, itwas necessary to navigate the data and history ofDCPS and charterschools and try to understand how DCPS and charter school supply and parental demand affect studentmovement.
WeexaminedcurrentenrollmentprojectionprocessesandmethodologiesusedintheDistrictofColumbia.WeexploredotherschooldistrictandstatelevelpracticesacrossthecountryandanalyzedwhathasworkedandwhathasnotworkedfortheDistrictofColumbiawhenprojectingenrollmentinthepast.Finally,weproposeretainingmanyaspectsofcurrentprocessesandmethods,butalsomodifyingthemtobetteralignwithlocalusesandwithnationalbestpracticestandards.
NavigatinghistoricalenrollmentdataprovesdifficultintheDistrictofColumbia.TherearemanyofficeswithintheDistrictofColumbiathatmaintainandtrackenrollmentandthegovernanceofthecity-wideagencieswiththese responsibilities has changed over time. For most of the history of public education in the District ofColumbia,thestateandlocalfunctionswereoneinthesame(astheyare inHawaii),andtheStateEducationAgency (SEA)wasunder theDCPSschoolsuperintendentandschoolboard. Theseentitiescollected, tracked,reportedandprojectedenrollment.Forashortperiod,thestateresponsibilitiesmovedintoa“StateEducationOffice” SEO, under theMayor. However, withMayoral control enacted in 2007, the state public educationfunctionswereassignedtotheOfficeoftheStateSuperintendentofEducation(OSSE),undertheMayor.
WhileDistrictofficialswereunfailinglycooperativeinsharingdatathroughoutthisproject,thedataoftenlackedconsistency inschoolnamesandschool identificationnumbers,and inwhatdata is rolledupandprovided inreporting.Thiscanbearesultofconstantchangeandmovementinasystemthatdoesnotcurrentlyhaveacentralrepositorytotrackallthehistorical influencesonstudentpopulationsmaintainedandusedbyvariousgroups.Thatis,schoolnamesineachauditedenrollmentfilearenotconsistentandsignificanttimewasspentidentifying

5
standardizedschoolnamestoanalyzehistoricalschoolenrollmentdata;studentdatawithaddressesattimeofenrollmentwasnotavailablefor10years(only5yearsofdatawasavailableinaconsistentmanner);2008-09and2009-10auditedenrollmentneededtobeaggregatedfromthestudentdataprovided.
EnrollmentprojectionsdevelopedforMasterFacilitiesPlansweredevelopedbyavarietyofconsultantsoverthepast20years.Aconsistentmodelwasnotestablished,anditwasdifficulttodeterminewasdatawasusedtodeveloptheenrollmentprojections.
Thisstudyexaminesseveralfactorsthathaveinfluencedenrollmentandpublic-schoolparticipationratesovertheyears.Theseinclude:
• Changinghousingandpopulationtrends,particularlyinattractingyoungadultsofchild-bearingages• Newconstructionandconsolidationofschools,includingboundarychanges• Program/Curriculumchanges• Increasesincharterschoolenrollmentandfacilities• Citypolicies,forchoice,studentassignment,governance,andfunding
Process/BackgroundThere aremany different approaches to conducting enrollment projections, but almost all best practices arefoundedinthecohortsurvivalmethod,whichanalyzeshistoricalenrollmentandthepercentageofstudentswhomovefromgradetograde,yeartoyear,historically.ProcessesusedintheDistrictofColumbiahavealsobeenbasedinthismethodwhichhasproducedtwo[2]maintypesofprojections.First,byschoolbygrade(summedintosectorandDistrictprojections,andsecond,bygradeonly(usuallyrolledupbysectorandthenbyDistrict).TheOfficeofPlanningalsoproducesagelevelprojectionsthatassistintheprojectionsprocess.
Projectionsareconductedforthenextyearandusedaspartofthecity’sannualbudgetcycle.Inconversationswith comparable districts that share characteristics similar to those in the District of Columbia such asdemographiccomposition;existenceofpublic,charter,andindependentschools;andschoolchoiceoptions,wehavefoundthistobeacommonpracticeforsettingdistrictbudgetsandpreparingforresourceallocationoneyear inthefuture. Multi-yearprojectionsareconductedtypicallyaspartofmaster facilitiesplanningstudies,againacommonpracticeamongothercomparabledistricts.One-yearprojectionsthatareusedforbudgetingassistindeterminingDCPSandpubliccharteroperatingbudgetsandthecharterschoolfacilitiesallowance,whilemulti-yearprojectionshelpdeterminecapitalimprovementbudgetsandPublicCharterSchoolBoarddecisionsonschoolopenings.Datasets,projectionsub-setsandreviewmethodologyaredetailedintheEnrollmentProjectionMethodologysectionofthereport.
Areviewofcomparabledistrictsacrossthecountrywasconductedtoseekoutcommonmethodologies,usesforprojections,orresultsofprojections.StatelevelofficialswerealsointerviewedtodeterminehowtheirprocessesforprojectingenrollmentweresimilartoordifferentfromtheDistrictofColumbia.Overall,wedeterminedthatthecomplexitiesofdataandtheinfluencesonenrollmentarecommonindistrictsofthissize,thoughthelevelofinfluenceofeachfactorvaries.Mostofthedistricts’primarypurposesforconductingenrollmentprojectionsareforbudgetingpurposes;thisholdstrueforstate-levelprojections.Somedistrictsconductareviewprocesswithprincipalsandother localschooladministrators,butsuchreviewsaredeterminedbythefundingformulathateach district useswhen setting budgets for each school orwhether the district has a school-level budgetingprocess.

6
Thisstudyalsoconductedacomparisonofenrollmentprojectionstoactualauditedenrollmentsfortheone-yearprojections.ComparisonsforDCPSwerecompletedforschoolyears2014-15through2017-18andforPCSschools2016-17through2017-18(duetolimiteddataavailability).Wecomparedprojectionsversusauditedenrollmentsin the aggregate, thenbyWard, by year, by grade level, andby individual school. The comparisondoes notattempt todeterminespecificallywhyerrorsoccur. Detailed results canbe found in theAccuracyofCurrentProjectionssectionofthisreport,butkeyfindingsinclude:
ForDCPSSchools:
• Themagnitudeofprojectionerrorsvariesbyward,byyear,andbygrade• Thedirectionoftheprojectionerrors(toohighortoolow)alsovariesbyward,byyear,andbygradein
waysthatoftendonotcorrespondtothemagnitudeoftheerrors
ForPCSSchools:
• PCS schools had about the same absolute projection errors across wards and showed reductions inprojectionerrorfromthe2016-17tothe2017-18schoolyears
• PCSschoolsproducedprojectionsthatskewedhighinthe2017-18schoolyear
Fiveandten-yearprojectionswereanalyzedandorcomparedsimplybyreviewingtheprocessandmethodologyconductedinpriormasterfacilitiesplansandactual(audited)enrollmentwasmeasuredagainsteachprojection.Key findings at the district level are thatmost projectionswere fairly accurate one-year out, but error ratesincreasedsignificantlyforfutureyears.
Supply and demand factors influence student movement and therefore impact enrollment projections,particularlyattheschoollevel.Governmentpoliciesinfluencedemandbyregulatinglocation,condition,capacityandaccesstopubliclyfundedschools.Indistrictswithlimitedschoolchoice,enrollmentprojectionsaresimplifiedbecausethedistrictcancontrolwherestudentsattend.Matchingsupplytoenrollmentdemandsattheschoollevelindistrictsthathaveahistoryofopeningandclosingschoolsandwherestudentsareattractedtoschools,notnecessarilylocatedwheretheylive,makesitchallengingtoaccuratelyprojectenrollmentattheschoollevel.
Demand-sidefactors,specificallyinthisstudy,areneighborhoodcharacteristicsthatinfluenceenrollmenttrendsacrosstheDistrict.Characteristicsincludedemographics,economicindicators,housing(andchangesinhousing),culturalchangesovertime,andcollegeattainment.Thesearecertainlynotallthefactorsthataffectdemandbutrepresentsomethatcanbemeasuredandcancontributetotheenrollmentprojectionprocess.
OverviewofFindingsAnenrollmentprojectionblindstudywasconductedusinghistoricalenrollmentdatafromtwotimeperiods:2008-09through2015-16,and2008-09through2016-17. The intentof thestudywastoapplydifferentprojectionratios,utilizingonlythemathematicalapproachofprojecting(commonlyreferredtoasthe“science”),tocomparetheoutputfromeachsetofenrollmentprojectionstotheactualauditedenrollmentbyschoolforbothDCPSandPCS.Whenapplyingnoexpertanalysisintoadjustingprojectionratios(ratiosdeterminedbasedonsurvivalratiosthatareappliedtocurrentenrollmenttodevelopenrollmentprojections,commonlyreferredtoasthe“art”),theresultsdeterminedthatforDCPS,accuracyforthelargestnumberofschoolswasattainedbyusinga3-yearsimpleaverageofsurvivalratios. ForPCS,utilizingtheweightedaverageofthe2mostrecentyearsofsurvivalratiosyieldedthehighestnumberofaccuraciesbyschool,butonlyslightlyhigherthanusinga3-yearsimpleaverageofsurvivalratios.

7
The “art”ofenrollmentprojections is theability toapplyexpertanalysis toadjustprojection ratiosbasedonoutsidefactorsthatarenoteasilymeasured.Thisstudydetailsthecomplexsetofdatathatcaninfluenceschoolattendance,andthatcanbeaccountedforinmostcohortsurvivalmethods.Becauseofthesefactors,accuracyinprojectingenrollmentisdifficulttoachieveasthesamplesizeofprojectionsbecomessmaller,i.e.system-wideversusschoollevel.Therefore,itbecomesessentialtodeterminewhenthe“art”ofprojectionsisbestapplied.Thisisbestcapturedinstudyingandstatisticallyanalyzingwhatmattersmostinpredictingfactorsthatintroducethemosterrorinenrollmentprojectionsusingthecohortsurvivalmethod.
The objective when identifying the most influential factors of student enrollment, is to determine how thisinformationcanbeusedtomodifyenrollmentprojectionstowardgreateraccuracy.Keyfindingsofwhatmattersmostinclude:
• ForDCPSschools,thesinglemostimportantcharacteristicthatpredictedprojectionerrorwastheschool’sstudentmobility,orhowmanystudentsenteredandlefttheschoolfromyeartoyear
• ForPCSschools,arecentsuddenshiftinstatedschoolcapacitywasassociatedwithprojectionerror–inotherwords,acohortmodelcannotanticipatefutureeffectsofrecentchangesinschoolcapacity
Studentmobilityisdefinedasafunctionofgrossmobility,whichcanbethoughtofastheextenttowhichtheindividualswithinstudentpopulationchangefromyeartoyear,evenifoverallenrollmentremainssteady.Itisalsodefinedasapropertyofaschoolinthetransitionbetweenadjacentgrades,notofthegradesthemselves.This formof studentmobilitywould be expected to have some relationship to the amount of uncertainty inprojections.Ifaschoolhasbeenexperiencing“churn”inthepast,thenfutureenrollmentscouldbelikelytodepartfromthetrajectoryofpastenrollments,subjecttochangesintheratethatstudentsaremovingin,theratethattheyaremovingout,orboth.Incontrast,aschoolwithsmallerlevelsofstudentmobilitycanbeexpectedtohavefutureenrollmentsthataremorestableandeasilypredictedbycohortsurvivalmodels,eveniftheschoolshavehadsimilarprogressionratiosinthepast.
Sudden shifts in stated school capacity could include changes in facility capacity due to renovations, newconstruction,orlocationchanges;andinthecaseofPCSschools,achangeintheenrollmentceiling.
OverviewofRecommendationsTodaytheOfficeoftheDeputyMayorforEducationhassufficientauthoritytooverseetheschedule,policies,andprocedurestobefollowedbyOSSEandLEAsinthisprocess.Whilesomeelementsoftheprocessarecentralized,there areother elements that are appropriate for a specific agencyor agenciesbasedon their expertise andauthority.Therecommendationspresentedhere—someofwhichareinplaceor inplacetosomeextent—areintended to make the overall process more timely, efficient, transparent, and accurate. The graphic on thefollowingpagesoutlinestherecommendedenrollmentprojectionsprocess.

8

9

10
HistoricalEnrollmentHistoricaldistrict-wideenrollmenthasincreasedbynearly21,000studentsoverthepastten[10]years. Mostnotableistheelementary(K-5)enrollmentwithanincreaseof11,000studentsinthatsametimeperiod.MostofthisgrowthhasbeeninPCSschools.
HistoricalEnrollment-District-wideGrade 2008-09 2009-10 2010-11 2011-12 2012-13 2013-14 2014-15 2015-16 2016-17 2017-18PK 7,067 8,211 9,581 10,778 11,428 11,855 12,040 12,309 12,529 12,718K-5 29,329 29,513 30,669 31,277 32,969 34,812 36,785 38,397 39,825 40,4256-8 13,456 13,361 13,137 13,096 13,388 13,426 13,512 13,516 14,024 14,5959-12 17,584 17,591 17,589 16,683 17,517 16,187 16,590 16,716 17,113 18,274Other 3,212 3,516 3,958 4,859 4,880 6,652 6,448 6,372 6,462 5,476K-12 60,369 60,465 61,395 61,056 63,874 64,425 66,887 68,629 70,962 73,294
GrandTotal 70,648 72,192 74,934 76,693 80,182 82,932 85,375 87,310 89,953 91,488Source:OSSEAuditedEnrollmentHistoricalEnrollment-PCS
Grade 2008-09 2009-10 2010-11 2011-12 2012-13 2013-14 2014-15 2015-16 2016-17 2017-18PK 2,820 3,604 4,346 5,382 5,858 6,290 6,425 6,477 6,700 6,921K-5 8,865 9,677 10,638 11,184 12,496 13,499 14,698 15,154 16,175 16,8736-8 6,248 6,179 6,087 6,188 6,577 6,438 6,466 6,861 7,246 7,7589-12 5,249 5,860 6,013 5,757 6,604 5,985 6,002 5,945 6,602 7,051Other 2,069 2,313 2,282 3,051 3,139 4,353 4,264 4,468 4,768 4,790K-12 20,362 21,716 22,738 23,129 25,677 25,922 27,166 27,960 30,023 31,682
GrandTotal 25,251 27,633 29,366 31,562 34,674 36,565 37,855 38,905 41,491 43,393Source:OSSEAuditedEnrollmentHistoricalEnrollment-DCPS
Grade 2008-09 2009-10 2010-11 2011-12 2012-13 2013-14 2014-15 2015-16 2016-17 2017-18PK 4,247 4,607 5,235 5,396 5,570 5,565 5,615 5,832 5,829 5,797K-5 20,464 19,836 20,031 20,093 20,473 21,313 22,087 23,243 23,650 23,5526-8 7,208 7,182 7,050 6,908 6,811 6,988 7,046 6,655 6,778 6,8379-12 12,335 11,731 11,576 10,926 10,913 10,202 10,588 10,771 10,511 11,223Other 1,143 1,203 1,676 1,808 1,741 2,299 2,184 1,904 1,694 686K-12 40,007 38,749 38,657 37,927 38,197 38,503 39,721 40,669 40,939 41,612
GrandTotal 45,397 44,559 45,568 45,131 45,508 46,367 47,520 48,405 48,462 48,095Source:OSSEAuditedEnrollment

11
SummaryofEnrollmentProjectionsThefollowingenrollmentprojectionsweredevelopedaspartofthisstudyfortheDistrictofColumbia:
• Baselineenrollmentprojectionsbyschool• System-wideenrollmentprojections• Enrollmentprojectionsbasedonresidence
Itshouldbenotedthattheoverallhistoricalenrollmentbetweenthebaselinebyschoolandelementaryboundary(residence) projections differ (due to being different data sets) and therefore the enrollment projectionspresentedalsodiffer. Inaddition,aggregating thedatadifferentlywill yielddifferent results.Detailsof theseprocessescanbefoundinSection7:Historical/ProjectedEnrollment.
BaselineEnrollmentProjectionsbySchoolBaselineenrollmentprojectionsbyschoolweredevelopedfortheDCPSandPCSschoolsintheDistrictofColumbiausingtheofficialauditedenrollmentbyschool,andbygradefrom2008-09through2017-18providedbyOSSE(https://osse.dc.gov/enrollment). The enrollment projections were developed using the cohort survivalmethodology.A3-yearsimpleaverageofsurvivalratioswasusedtoprojectDCPSschoolenrollmentanda2-yearweightedaverageofsurvivalratioswasusedtoprojectPCSschoolenrollment.Livebirthcountswereusedtoprojectkindergartenenrollment;PK,Adult,UG,andSPEDUGwerekeptflatatthecurrent2017-18enrollment.
System-wideEnrollmentProjectionsBased on the system-wide enrollment projections, using the total student population, it is anticipated thatenrollmentwillcontinuetoincreaseoverthenexttenyearsbyapproximately12,099students,amajorityofthatgrowthanticipatedinthefirstfive[5]years.Thesystem-wideenrollmentprojectionsweredevelopedusingthecohortsurvivalmethodology.A3-yearsimpleaverageofsurvivalratioswasused.LivebirthcountswereusedtoprojectPKandkindergartenenrollment;Adult,UG,andSPEDUGwerekeptflatatthecurrent2017-18enrollment.Thesearetheprojectionsthatthepost-baselineenrollmentprojectionbyschoolroll-upshouldbereconciledto.
ProjectedEnrollment-System-wide(Baseline)Grade 2018-19 2019-20 2020-21 2021-22 2022-23 2023-24 2024-25 2025-26 2026-27 2027-28PK 12,718 12,718 12,718 12,718 12,718 12,718 12,718 12,718 12,718 12,718K-5 40,361 40,493 40,775 41,159 41,304 41,530 41,743 41,811 41,881 41,7356-8 15,448 15,885 16,067 15,934 15,978 16,007 16,037 16,129 16,251 16,5859-12 17,935 18,147 18,456 19,288 19,765 19,869 19,886 19,902 20,017 20,128Other 5,698 5,698 5,698 5,698 5,698 5,698 5,698 5,698 5,698 5,698K-12 73,744 74,525 75,298 76,381 77,047 77,406 77,666 77,842 78,149 78,448
GrandTotal 92,160 92,941 93,714 94,797 95,463 95,822 96,082 96,258 96,565 96,864Source:CooperativeStrategies
ProjectedEnrollment-3YearSimpleAverage-System-wideGrade 2018-19 2019-20 2020-21 2021-22 2022-23 2023-24 2024-25 2025-26 2026-27 2027-28PK 12,942 13,154 13,245 13,087 13,087 13,087 13,087 13,087 13,087 13,087K-5 40,671 41,039 41,386 41,938 42,193 42,437 42,696 42,784 42,833 42,6916-8 15,794 16,713 17,449 17,584 17,758 17,880 17,967 18,112 18,289 18,6719-12 18,333 18,714 19,120 20,458 21,633 22,513 23,163 23,422 23,580 23,662Other 5,476 5,476 5,476 5,476 5,476 5,476 5,476 5,476 5,476 5,476K-12 74,798 76,466 77,955 79,980 81,584 82,830 83,826 84,318 84,702 85,024
GrandTotal 93,216 95,096 96,676 98,543 100,147 101,393 102,389 102,881 103,265 103,587Source:CooperativeStrategies

12
EnrollmentProjectionsBasedonResidenceEnrollmentprojectionsweredevelopedbasedontheresidenceofwherestudents(DCPSandPCS)livewithinDCPSelementaryboundaries.Enrollmentprojectionsbasedonboundaryofresidenceareusefulforplanningschoolfacilities(masterfacilityplanning)and/orattendanceboundaries.Studentdatabyaddresspointsforschoolyears2013-14through2017-18,providedbyOSSE,weregeocodedandaggregatedtotheDCPSelementaryboundaries.Theenrollmentprojectionsweredevelopedusingthecohortsurvivalmethodology.A3-yearsimpleaverageofsurvivalratioswasused.Livebirthcountswereusedtoprojectkindergartenenrollment;PKandAdultwerekeptflatatthecurrent2017-18enrollment.
InteractiveDashboardAll information used in this process has been placed in an interactive dashboard, which is available atdcauditor.org.DuetoFERPAprivacyrequirements,anysubgroupinformationthatisrepresentativeoflessthan10studentsorencompassesallstudentsmayhavebeensuppressed.
ProjectedEnrollment-System-wide(basedonResidence)Grade 2018-19 2019-20 2020-21 2021-22 2022-23 2023-24 2024-25 2025-26 2026-27 2027-28PK 12,727 12,727 12,727 12,727 12,727 12,727 12,727 12,727 12,727 12,727K-5 41,179 41,809 42,440 43,287 43,720 44,133 44,447 44,594 44,664 44,4576-8 16,117 17,165 18,001 18,264 18,600 18,898 19,213 19,494 19,860 20,3789-12 19,119 19,699 20,342 22,139 23,534 24,612 25,439 25,979 26,333 26,766Other 4,951 4,951 4,951 4,951 4,951 4,951 4,951 4,951 4,951 4,951K-12 76,415 78,673 80,783 83,690 85,854 87,643 89,099 90,067 90,857 91,601
GrandTotal 94,093 96,351 98,461 101,368 103,532 105,321 106,777 107,745 108,535 109,279Source:CooperativeStrategies

13
Schoolleveldataavailableonthedashboardincludes:
BackgroundDataSheet
• LEA• Address• Schoollocationmap(includesprogramlocationsoverthepast10years)• Cluster• Ward• Yearsopen• Totalenrollment(2017-18)• Historicalenrollment(2008-2017)• Capacity(permanentandtemporary)• Buildingsquarefootage• Racialmakeup• Specialeducationpercentage*
o Levels1-4*• Freeorreducedlunchpercentage*• LimitedEnglishproficiency(LEP)percentage*• Atriskpercentage*• Mobilitystatus
o 2015-2017• Highschoolboundary
o Buildingpermitcountsbyyearo Totalpopulation(2017)o Medianhomevalue(2017)
BaselineProjectionSheet
• Feederpatterninformation• Birthdata(2009-2017)• Historicalenrollment(2008-2017)• Survivalratios• Baselineprojectedenrollment(2018-19–2027-28)
ResidenceProjectionSheet
• Historicalandprojectedenrollment(2013-14–2027-28)• Birthsbyboundary(2003-2016)• Survivalratios
*DenotesdatathatissubjecttosuppressionduetoFERPArequirements.

14
Section1:DynamicCityandSchoolsItisimportanttounderstandtheextentofdemographicandpolicychangethathasshapedthelandscapeofthecityandpubliceducationover the last twodecades in theDistrictofColumbia.The interplayof thepersonalprioritiesandpreferencesofparentsandguardiansand thepubliceducationpolicyenvironmentcreatedandsustainedby theDistrictGovernmentoccur in thecontextofachangingcity.Private interestsofparentsandpublicconcernsoffamiliesandgovernmentcausebroaderdemographicshiftsandareaffectedbythem.
WashingtonD.C.-DemographicOverview
From its founding in 1790, theDistrict of Columbia’s population grew–often rapidly – to its historic highof802,000inthe1950Census(FigureX).Thisgrowthwasfollowedbyahalfcenturyofpopulationdeclinefrom1950to2000,andthenaresumptionofpopulationgrowthafter2000.
Theperiodofpopulationdeclinebeganwiththemovement ofmanywhite residents tothe suburbs in the 1950s and 1960s, apattern that occurred in numerous older,eastern US cities. By 1970, D.C.’s blackresidents started to leave as well. Whilesome blacks may have been following themiddle-class suburbanization trend, thecontinuing decline in living conditionscreated by public and privateunderinvestment in D.C.’s blackcommunities forced many to seekopportunities outside the city. This trendcontinuedthroughthenextseveraldecades,with predominantly black neighborhoodseastoftheAnacostiariverlosingover66,000residents between 1980 and 2000. By the2000 census, D.C.’s population reached amodernlowof572,000persons.
TheDistrict’spopulationdeclineendedaround2000andthecityenteredanewperiodofgrowthdriven,toalargeextent,bythearrivalofpersonsinthemillennialgenerationinincreasingnumbers(TatianandLei2013),partofanationaltrendofyoungeradultsbeingdrawntocities.TheGreatRecessionof2007–2009,whichhitmany other parts of the country harder than theWashington area, ledmany young people to seek out jobopportunities inD.C. Inaddition, immigrants fromCentralandSouthAmerica,Asia,Africa,and theCaribbeancontributedtothecity’spopulationgrowth.WhileD.C.hasnothistoricallybeenacenterforimmigrationtotheU.S.,sincethe1980stheWashingtonregionhasemergedasoneofthecountry’slargestnewgatewaydestinationsforimmigrantcommunities(Singer2004).Whilemostoftheincreaseinforeign-bornpersonsintheregionhasbeeninthesuburbs,D.C.’simmigrantpopulationhasgrownsteadilyaswell.Whileimmigrantsrepresentedonly4percentofthecityin1970,todaytheymakeup14percentofD.C.’spopulation.Manyimmigrantsarrivedduringthe1990s,aperiodofincreasingmigrationtotheU.S.thatwasenabledbyraisedimmigrationcaps1butalsoa
Figure1DistrictofColumbiaPopulationbyRace

15
result of other factors, such as unrest and civil wars in Central America and economicmalaise and politicalinstabilityaffectingsomeAfricancountries(Macharia2011).
DuringtheinitialtenyearsofD.C.’snewgrowth,however,thecity’sblackpopulationcontinuedtofall.Whilethesteep population losses of the 1970s, 1980s, and 1990s stopped or even reversed in many majority blackneighborhoodsinnortheastandsoutheast, increasingdemandforhousingbynewresidentsledtorisingrentsandhomepricesinnorthwestcityneighborhoods,suchasColumbaHeights,Shaw,andUStreet,thathadbeencentersoftheblackcommunity(TatianandLei2013,TatianandLei2014).Risingcostsforcedmanylong-timeresidentstosearchforlowercosthousinginotherpartsofthecity,elsewhereintheWashingtonarea,orevenoutsidetheregionentirely(Tatian,Hendey,andBogle2017).Andalthough,accordingtothelatestU.S.Censusestimates,thecity’sblackpopulationisstartingtoriseagain,thegrowthisattributabletoanincreaseinforeign-bornblacks.Immigrantsfromsub-SaharanAfricahavebeenagrowingshareofmigrantstotheU.S.since2010andtheWashingtonregionhasemergedasoneofthetopdestinationsforAfricanimmigrants,particularlythosefromEthiopia(Connor2018,Macharia2011).
Additionally,naturalpopulationgrowth,thatis,totalbirthstomothersintheCity,hasincreasedoverthepast14years(figure2).Between2000and2003,totalbirthsremainedsteadyatbetween7,500to7,700.Birthsincreasedto7,939 in2004and then jumped to8,524 in2006.Aconsistent increase inbirthshascontinuedsince then,reaching9,156totalbirths in2010anda recenthighof9,854 in2016,25percenthigher thanthenumberofchildrenbornin2000.Theincreaseinbirthswasnotuniformacrosstheentirecity,however.BirthsincreasedinallCitywardsexceptforWard3,wheretheyhavebeenatroughlythesamelevel(between800and900birthsperyear)since2003.Thelargestincreasesinbirthswereinwards4,5,and6.Thesethreewardsaccountedfortwo-thirdsofthetotalincreaseinbirthsinthecitysince2000.
Asa resultof these trends, theCityhas reacheda recentpeakpopulationof681,000,according to2016U.S.Censusestimates.Despitetheoverallpopulationgrowth,thechangeinschool-agechildrenhasfolloweddifferenttrajectories(figure3).Theperiodfrom2000to2010sawdeclinesinchildrenages5to9and10to14years,fallingby9,200and5,000persons,respectively,whilethenumberofchildrenunder5yearsand15to17yearsremainedrelativelyconstant.Itwasduringthisperiodofchildpopulationdecline,from2000to2010,thatDCPSwasclosing
7,616 7,939 7,9498,524 8,870 9,134 9,007 9,156 9,289 9,379 9,264 9,514 9,571 9,854
0
2,000
4,000
6,000
8,000
10,000
12,000
TotalLiveBirths,DistrictofColumbia
Figure2TotalLiveBirths,DistrictofColumbia

16
schools, due to overall child populationdecline and charter development thatwas capturing a growing share of thedecliningschool-agepopulation.
Between2010and2016,thenumbersofchildrenages0to9grewbyover19,000,with the largest increase being childrenunder 5 years,who increased by almost11,000. Nevertheless, the number ofchildren15to17yearsfellby1,400overthis same period and the population ofchildren10to14yearsincreasedbyonly1,800. Among all four groups, onlychildrenunder5yearscurrentlyhavealargerpopulationthantheydidin2000.
Although,asnotedabove,birthstoD.C.motherswerealsorisingbetween2004and2016,theincreaseinchildrenunder5ismuchtoolargetobeexplainedbythegrowthinchildrenbornintheCityalone.Only2,891morebirthsoccurredbetween2012and2016,whencomparedwith2006to2010,notenoughtoaccountforthe11,000netincreaseinunder5yearoldsbetweenthetwoperiods.ChangesinpeoplemigratinginandoutoftheCity,bothdomesticallyandinternationally,arethereforeamajorpartoftheexplanationforthegrowthinyoungerchildreninD.C.since2010.
TheCity’sdemographicchangeshavehadasignificant impact on public schoolenrollment.EnrollmentinDCPSschoolshadbeen declining steadily between 1970 and1990,fallingfromapproximately146,000to80,700students,parallelingthedrop intheDistrict’s overall population (figure 4)2.Between1990and1995,DCPSpublicschoolenrollment leveled off and then started asmall downward dip coinciding with theintroduction of the first charter schools intheDistrictinthe1996-97schoolyear.Totalpublic school enrollment in DCPS and PCSschools fluctuated over the next few yearsandthendroppedtoalowof72,192in2009-10.Sincethen,totalpublicschoolenrollmenthas grown steadily, increasing to 91,488studentsinthe2017-18schoolyear.
Mostoftherenewedpublicschoolgrowthwasinthecharterschools,whichincreasedenrollmentfrom25,251to34,674 students between 2008-09 and 2012-13. During this same period, enrollment in DCPS schools wasrelativelyflat,hoveringbetween45,397and45,508students.Startingin2013-14,however,enrollmentinDCPS
Figure3ChildrenbyAgeGroup,DistrictofColumbia
Figure4TraditionalPublicandCharterSchoolEnrollment

17
schoolsbegantoriseaswell,increasingto48,095studentsby2017-18.PCSenrollmenthasalmostreachedparitywithtraditionalpublicschools,with43,393studentsenrolledinchartersin2017-18.
Thedatapresentedinthissectionillustratesthecomplexrelationshipbetweendemographicchangesandschoolenrollment.Althoughpublicschoolenrollmenttendstotrackwiththeoverallpopulation,changesinspecificagegroupsdonotcorrelatedirectlywithtrendsinaggregatepopulationorbirths.Therefore,additionaldemandandsupplyfactorsneedtobeexaminedtoimprovethereliabilityofschoolenrollmentforecasts.
DemandandSupplyFactorsAffectingEnrollmentProjections
Inthestudy,itwastheorizedthattherearefactorsofparentaldemandandschoolsupplythatcouldassisttheDistrictinprojectingenrollment.Atthesametime,someneighborhoodfactorsandgovernmentpolicydecisionswereidentifiedthatmayaffecttherelationshipofparentaldemandwithschoolsupplyandthereforemayimpacttheaccuracyofschool-levelenrollmentprojections.
Historicalstudentenrollmenttrendsareaprimaryfactorforprojectingenrollmentforthenextyear;thisnaturalprogressionisbuilt inthecohortsurvivalmodel.However, itwastheorizedthatnonlinearchangesinparentaldemand and in school supply associatedwith public sector decisionmakingmay cause school enrollment todeviatefromthepastandpredictablyresultinenrollmentprojectionerrorsattheschoollevel.
Demand-sidefactorsincludeparentalpreferencesthatarehypothesizedtoaffecttheenrollmentchoices(long-andshort-term)fortheschoolagepopulationwithineachDCPShighschoolattendancezone.Thekeyindicatorsofparentaldemandwereschoolsthatrankedasafirstchoiceinthelotteryandschoolswithutilizationover100percent. Supply factors considered include thenumber, size, and characterof schools available in theCity toDistrictofColumbiachildren,youthandadultsandthepublicinputslikelytoaffecttheactualqualityoftheschool.Theneighborhoodfactorsthoughttoberelatedtoparentaldemandandschoolsupplyweretheeducationlevelofthepopulation,medianhomesaleprices,thetotalpopulationwithinaDCPShighschoolcatchmentareaandthenumberofnewconstructionpermits.
The relationship between supply and demand is highly influenced by government action and public policyincludingeverythingfromstudentassignmentpolicyandhowitoperatestowhereschoolsareopened,closed,andexpanded, and forwhom.The key laws controlling the relationshipofparental demand to school supplyincludetheSchoolReformAct(SRA)enactedbyCongresswhichestablishedtwoauthorizingentities--theDCPSBoardofEducationandthePublicCharterSchoolBoard(PCSB)(nowonlythePCSB).Anotherhistoricalactionaffectingpubliceducationhasbeenthecapitalinvestingofpublicschoolfacilities,andthefundingofthecharterFacilitiesAllowance,withtheSchoolModernizationFinancingActof2006andpolicyassociatedwiththepropertymanagementofcurrentandformerpublicschoolfacilities.Finally,thePublicEducationReformAmendmentAct(2007),putDCPSandthestatepubliceducationfunctionsunderthecontroloftheMayorandcreatedanOfficeoftheDeputyMayorforEducationtoadvancetheMayor’seducationplansandpriorities.

18
ParentalDemand NeighborhoodFactors SchoolSupplyDesire tocontrolyourchild’speergroups
• selectiveadmissions• selectiveparticipation• selectivelocation• studentachievement• studentdiversity
Perceptionofschoolquality• teachers/principal• educationalprograms• schoolclimate• studentsupports
Buildingcondition
EducationlevelofpopulationMedianhomesalepriceTotalpopulationincatchmentarea#Permitsfornewconstruction
• Schoolsiting• PCSBauthorizations• PCSBmanagementof
enrollmentceilings• DCPSschoolopenings,
closings,expansion• PCSschoolopenings,
closings,expansion• Privateschoolsupply
Educationalinputs• Programtypes• Staffing• Budget• Facilities
PolicyMediatorsCharterSchoolsActof1996D.C.SchoolReformAct(1996)SchoolModernizationFinancingActof2006PublicEducationReformAmendmentAct(PERAA)2007PublicSchoolDisposition(2004amendmenttoSRA)D.C.Studentassignmentpolicy
ParentalDemandFactors
TheMySchoolD.C.lotterydatacapturesapplicantpreferencesforschools.Thenumberofstudentswholistacertainschoolastheirfirstchoiceintheschoolchoiceapplicationreflectstheparentalandstudentpreferenceforselectiveschoolenvironmentsfortheirchildren.Thetotalnumberofstudentsthatlistacertainschoolastheirfirst choice isaggregated fromMySchool Lottery student-leveldataand is illustrated in the tablebelow.Thedesignationof“selectiveadmission”isbasedonwhethertheschoolhasaselectiveapplicationrequirementtoenroll in theschool—onlyDCPSschoolscanhaveselectiveadmissions. Themeasureof“selective location” isbasedonmedianhomesaleprice,fromtheD.C.OfficeofTaxandRevenue,whereschoolsarelocatedinhighschool feeder areas ofWilson, Roosevelt and Eastern, with average home sales greater than $620,000. Themeasureofachievementwhere50%ormoreofthestudentsscoredat4orhigher(proficientoradvanced)onthemathtestofthePARCCstandardizedtestin2016-17.Themeasureofdiversityiswhethertherearemorethantwo races represented in double-digit percentages. Finally, whether the school offers a “high demand”educational program is measured by whether it has a thematic program in STEM (Science, Technology,Engineering,andMath);duallanguage;academicallyadvanced,suchasInternationalBaccalaureateprograms;orhasaspecializedpedagogythatdefinesitsprogram,suchasMontessori,orexpeditionarylearning,forexamples.

19
ParentDemandFactors
Top25choiceschools2017-18Lottery
#1st
Choice
Lottery
Selective
Admiss
ions
Selective
Locatio
n
Achievem
ent>
50%+4
onPAR
CCM
Math
AtLeast
2Ra
ceGroup
s>1
0%
Special
Prog
ram
WashingtonLatinPCS–MiddleSchool 741 X X X X
SchoolWithoutWallsHighSchool 649 X X X X
MundoVerdeBilingualPCS 482 X X
CreativeMindsInternationalPCS 426 X X X
School-Within-School 423 X X X X
DukeEllingtonSchooloftheArts 421 X X X X
WashingtonYuYingPCS 415 X X X
KIPPDC–CollegePreparatoryPCS 403 X
TwoRiversPCSat4thStreet 379 X X X
DCBilingualPCS 336 X X
BrentElementarySchool 318 X X X
Oyster-AdamsBilingualSchool(Oyster) 301 X X X X
BASISDCPCS 296 X X X
BenjaminBannekerHighSchool 284 X X X X
SchoolWithoutWalls@Francis-Stevens 272 X
LafayetteElementarySchool 264 X X X Elsie Whitlow Stokes Community FreedomPCS(LanguageProgram)
249 X X
WilsonHighSchool 245 X X
DCPrepPCS–BenningElementary 244 X
KIPPDC–PromiseAcademyPCS 232 X
McKinleyTechnologyHighSchool 232 X X
CapitolHillMontessoriSchool@Logan 229 X X X X
RossElementarySchool 227 X X
KIPPDC–HeightsAcademyPCS 226 X
JanneyElementarySchool 225 X X X

20
ThenumberofstudentswhoentertheMySchoolD.C.applicationandlotteryisincreasingeachyear,andsoaretheschoolsthatwerelistedasafirstchoice,althoughthemostpopularschoolstendtobeconsistentacrossyears.Inthe2016-2017 lottery,222schoolswere listedasastudent’s firstchoiceat leastonce.Thenumberfor the2015-2016lotteryis214,for2014-2015itis200.(seeAppendixA)
Thecohortsurvivalratios,thepercentageofstudentswhomovefromgradetograde,yeartoyear,inherentlyaccountforparentaleffortstoselecttheirchildren’speers—includingparentalpreferencesforpeergroupsbasedonacademicachievement,income,orracialorethnicdiversity.Theschoolswiththeseattributesareingreaterdemandthanschoolsthatdonotexhibittheseselectivequalities.
These demand-side factors are not meant to capture all the factors that affect demand for schools but areintendedtorepresentfactorsthataremeasuredandavailabletothoseadjustingbaselineenrollmentprojections.Otherimportantfactorssuchaschangesinparentpreferences,changesinknowledgeaboutthelottery,andtheavailabilityofoptionsoutsideofDCPSandPCScouldalsoaffectdemand.
NeighborhoodFactors
Therearemanywaystodefineneighborhoodcharacteristics.This focus identified factors that weremost likely to affectparents’ decisions on housing and school and could becalculated annually. These characteristics cover topicsincluding neighborhood demographics, economic indicatorsandneighborhoodhousingchangesandcapturethedynamicpopulation,demographic,economic,andculturalchanges inD.C.neighborhoodsthatcouldinfluencedemand.Specifically,total population and college attainment rate were used asmeasures of neighborhood demographics and culturechanges.Medianhomesalepriceandbuildingpermitcountswerecalculatedtocapturetheeconomicandhousingactivitytrend.
Median home sale price and building permit, available bystreet address, were aggregated to the High SchoolAttendancezone.Thereare9highschoolattendancezonesinthe District of Columbia. Figure 5 shows the relationshipbetweenDCPShighschoolattendancezonesandtheCity’s8wards. The total population data is from the AmericanCommunitySurvey(ACS)data,availablebyCensustract,andwas weighted (where census tracts crossed high school attendance zone boundaries, weights were used toapportionthefive-yeartract-levelACSdataintoattendancezonesbasedontheshareofatract’spopulationineachzone)togettheappropriatehighschoolattendancezonecountofpopulationandcollegeattainmentrate.Thesefactorswereattachedtoeachschoolinthehighschoolattendancezone,includingPCSschools.AlthougheligibilityforenrollmentinaPCSschoolisnotdefinedbyschoolattendancezones,neighborhoodcharacteristicsarehypothesizedtostillaffectPCSstudentpopulations.
Figure5HighSchoolBoundariesandWards

21
TotalPopulationWithinHighSchoolAttendanceBoundariesThe table below illustrates the total population living within each of the defined current DCPS high schoolattendanceboundaries,withboundariesdefinedatthecensustractlevel.Pleasenote,therearesevenadditionalapplicationhighschoolsthatdonothavedefinedattendanceboundaries,includingBenjaminBanneker;ColumbiaHeights Education Campus; Duke Ellington School of the Arts; McKinley Technology; Phelps Architecture,Construction,andEngineering;RonBrownCollegePrep;andSchoolWithoutWalls.
HighSchoolBoundary2014
TotalPopulation
2015
TotalPopulation
2016
TotalPopulation
Anacostia 53,150 55,411 57,457Ballou 52,066 53,942 54,931Cardozo 113,943 116,638 116,553Coolidge 33,569 34,300 34,140Dunbar 77,165 79,598 83,077Eastern 78,071 79,448 81,735Roosevelt 57,236 56,655 57,086Wilson 129,703 131,192 132,150Woodson 38,834 40,300 41,881
CollegeAttainmentRateThetablebelowillustratesthecollegeattainmentrate(calculatedbydividingthetotalpopulationwithcollegedegreedividedbytotalpopulation)ineachhighschoolattendancezone.
HighSchoolBoundary 2014 2015 2016
Anacostia 0.10 0.10 0.11Ballou 0.08 0.08 0.08Cardozo 0.53 0.54 0.55Coolidge 0.28 0.29 0.30Dunbar 0.28 0.31 0.33Eastern 0.49 0.51 0.53Roosevelt 0.28 0.30 0.32Wilson 0.60 0.60 0.60Woodson 0.09 0.10 0.10
Figure6TotalPopulationbyHighSchoolBoundarySource:UrbanInstitutetabulationofAmericanCommunitySurvey5YearEstimates
Figure7CollegeAttainmentRatebyHighSchoolBoundarySource:UrbanInstitutetabulationofAmericanCommunitySurvey5YearEstimates

22
MedianHomeSalePrice($)Thetablebelowillustratesthemedianhomesalepriceineachhighschoolattendancezone.
BuildingPermitCounts
Thetablebelowillustratesthebuildingpermitcounts(thetotalnumberofnewconstructionpermits)issuedineachhighschoolattendancezone.Duetodatalimitations,thenewconstructionpermitsincludebothresidentialandcommercialconstruction;however,changesintotalnewconstructionpermitscanstillbeagoodproxyforneweconomicactivities.
HighSchoolBoundary 2014 2015 2016 2017
Anacostia 284,000 290,000 330,000 307,275Ballou 259,000 275,000 297,000 305,000Cardozo 505,250 506,850 530,000 549,900Coolidge 470,000 480,000 500,000 510,000Dunbar 480,000 513,555 537,500 533,500Eastern 550,000 569,900 594,750 620,000Roosevelt 575,000 610,000 620,000 629,250Wilson 840,500 857,000 900,000 905,000Woodson 252,950 275,000 301,000 289,950
HighSchoolBoundary 2014 2015 2016 2017
Anacostia 40 73 18 58Ballou 13 20 73 78Cardozo 36 38 33 45Coolidge 55 8 7 12Dunbar 159 164 92 178Eastern 32 42 73 55Roosevelt 11 10 15 28Wilson 45 53 44 47Woodson 39 82 90 33
Figure8MedianHomeSalePricebyHighSchoolBoundarySource:UrbanInstitutetabulationofhomesalespricefromD.C.OpenData
Figure9BuildingPermitCountsbyHighSchoolBoundarySource:UrbanInstitutetabulationofbuildingpermitrecordsfromD.C.OpenData

23
SchoolSupplySideFactors
Schoolsupply-sidefactorscanhaveasignificant impactonenrollment trendsandenrollmentprojections.Keyfactors thatmeasure school supply are the number of schools, capacity, condition, and perceived quality ofschools. School supply isparticularly influencedbygovernmentpolicy andpractice.Where the schooldistrictstrictlyassignsstudentstoschoolsbasedontheirhomeaddressand,whennecessary,providestransportationtogetthemtotheirassignedschools,LEAscancontroltheirenrollment.ThepredictabilityofthistypeofsystemisbestillustratedintheCitybydifferingparticipationratesacrossDCPSneighborhoodschools.IntheWilsonHighSchool feeder pattern, 79% of students attending a public elementary school attend their in-boundaryneighborhoodschool.Incontrast,elementaryschoolsintheDunbarHighSchoolfeederpatternaverageonly18%participation.
Ideally,schooldistrictsshouldcarefullymanagesupplytoensuretheirbuildingcapacityisnottoogreatortoosmalltoeducatethestudentpopulationoftheirdistricts.Schooldistrictsregularlyprojectenrollmentsbasedonbirthsandhistoricalenrollmenttrendsandaligntheirschoolsupplytothosechanges.IntheDistrictofColumbia,therehasbeenconsiderablevariability in supply.TheTablebelowshows thenumberofpublic schools in theDistrictofColumbia,bysectorfrom2008to2017.
SummaryofSchoolSupplyChange2008to2017,DCPSandCharterSchools
2008 2009 2010 2011 2012 2013 2014 2015 2016 2017 changeDCPS#schools 134 129 126 123 121 110 110 112 114 114 -20Charter#schools 93 96 91 98 104 108 112 115 118 120 27TOTALDCPSandPCSSchools 227 225 217 221 225 218 222 227 232 234 7
DCPSschoolsclosed 0 -2 -1 -1 -2 -11 -2 0 0 0 -19Charterschoolorgradesclosed -1 -4 -5 -5 -2 -5 -7 -8 -1 0 -38
DCPSschoolsopened 0 0 0 0 0 0 0 2 2 0 4Charterschoolopened 7 2 1 5 5 8 3 5 5 1 42
Figure10DataSource:MasterLongitudinalDataSet;andPCSBreportonschoolclosingshttps://www.dcpcsb.org/report/charter-school-growth-closures;“BetterSchoolsforAllStudents:DCPS’ConsolidationandReorganizationPlan”January2013
Thetotalnumberofschools,whichappearsrelativelystable,masksthelevelofvariabilityinsupply,asitrelatestowhichschoolsareopenedorclosedandwhichoftheover60localeducationagenciesisopeningorclosingschools.
Thetableabovesummarizeskeysupplychanges intheDistrictofColumbia’spublicschoolssince2008.Therehavebeen80public schools closed—42DCPS schools closedand38 charter schools closed, including charterschoolswheregradesweredropped.However,DCPSonlyopened4schoolssince2008andthecharterschoolsopened27schoolssince2008.
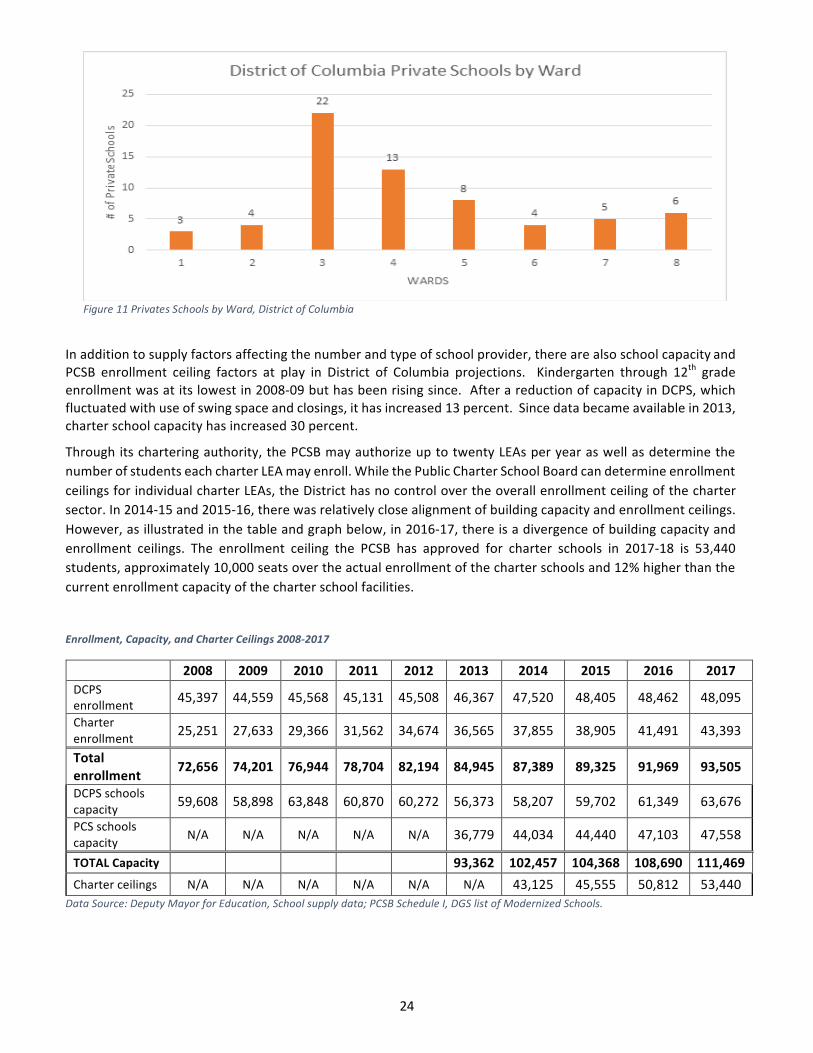
PublicschoolsarenottheonlyschoolsservingelementaryandsecondaryagechildrenandyouthintheDistrictofColumbia.D.C.hasarobustprivateschoolsector,withanestimated65independentandreligiousprivateschoolsreportedbytheAssociationofGreaterIndependentSchools,theArchdioceseofWashington,AIMS-AssociationofIndependentMarylandandDCSchools,andtheD.C.OpportunityScholarshipProgram.(AlistoftheseschoolsisincludedinAppendixA.)Theenrollmentoftheprivateschools,asprovidedbyOSSEis15,171students,includingDistrictandnon-Districtresidents3.TherewasnotadefinitivelistofD.C.locatedprivateschoolsorDistrictstudentresidentenrollmentsavailablefromOSSE.WhileWard3hasnopubliccharterschools,22oftheprivateschoolsin2017werelocatedinWard3.
24
Inadditiontosupplyfactorsaffectingthenumberandtypeofschoolprovider,therearealsoschoolcapacityandPCSB enrollment ceiling factors at play in District of Columbia projections. Kindergarten through 12th gradeenrollmentwasatitslowestin2008-09buthasbeenrisingsince.AfterareductionofcapacityinDCPS,whichfluctuatedwithuseofswingspaceandclosings,ithasincreased13percent.Sincedatabecameavailablein2013,charterschoolcapacityhasincreased30percent.
Throughitscharteringauthority,thePCSBmayauthorizeuptotwentyLEAsperyearaswellasdeterminethenumberofstudentseachcharterLEAmayenroll.WhilethePublicCharterSchoolBoardcandetermineenrollmentceilingsforindividualcharterLEAs,theDistricthasnocontrolovertheoverallenrollmentceilingofthechartersector.In2014-15and2015-16,therewasrelativelyclosealignmentofbuildingcapacityandenrollmentceilings.However,asillustratedinthetableandgraphbelow,in2016-17,thereisadivergenceofbuildingcapacityandenrollment ceilings. The enrollment ceiling the PCSB has approved for charter schools in 2017-18 is 53,440students,approximately10,000seatsovertheactualenrollmentofthecharterschoolsand12%higherthanthecurrentenrollmentcapacityofthecharterschoolfacilities.
Enrollment,Capacity,andCharterCeilings2008-2017
2008 2009 2010 2011 2012 2013 2014 2015 2016 2017DCPSenrollment 45,397 44,559 45,568 45,131 45,508 46,367 47,520 48,405 48,462 48,095
Charterenrollment 25,251 27,633 29,366 31,562 34,674 36,565 37,855 38,905 41,491 43,393
Totalenrollment 72,656 74,201 76,944 78,704 82,194 84,945 87,389 89,325 91,969 93,505
DCPSschoolscapacity 59,608 58,898 63,848 60,870 60,272 56,373 58,207 59,702 61,349 63,676
PCSschoolscapacity N/A N/A N/A N/A N/A 36,779 44,034 44,440 47,103 47,558
TOTALCapacity 93,362 102,457 104,368 108,690 111,469Charterceilings N/A N/A N/A N/A N/A N/A 43,125 45,555 50,812 53,440
DataSource:DeputyMayorforEducation,Schoolsupplydata;PCSBScheduleI,DGSlistofModernizedSchools.
Figure11PrivatesSchoolsbyWard,DistrictofColumbia

25
Figure12DataSource:DeputyMayorforEducation,Schoolsupplydata;PCSBScheduleI,DGSlistofModernizedSchools.
DCPShasfullymodernized53ofits114schools,withanother17DCPSschoolscurrentlyinplanning,designorconstruction formodernization in the current 6-year capital improvement budget. Information by school oncharterfacilitiesconditionsisnotpubliclydocumentedandreportedandthereforenotavailable.Nonetheless,sincethefirstcharterschoolopenedin1996andthroughFY19,DC’scharterschoolshaveborrowedorrefinancednearly$800millioninD.C.revenuebondsandreceivedmorethan$1billioninfacilitiesallowance.
Thehypothesisisthatchangesinthefactorsaffectingparentaldemandandschoolsupplymaycauseenrollmenttodeviatefromhistoricaltrendsandcouldimpacttheaccuracyofenrollmentprojectionsattheschoollevel.Mostofthesefactorsarewellreflectedinthecohortsurvivalmethodofprojectingenrollment.Thecohortsurvivalandcaptureratespickupparents’perceptionofqualityandanyobjectivemeasuresofqualityrelatedtotherichnessor rigor of academic programs; the professionalism and consistency of administration and teaching staff; thequalityofstudentsupportsfordiversetypesofstudents;andtheconditionandadequacyoftheschool’sfacilities.
Opening schools and closing schools is integral to the theoryof action for theeducation reformpromisedbychartersandclosingschoolshasbeenanadministrativeoperatingpriorityofDCPStotrytotargetresourcestoinstruction.
NumberofModernizedFacilities
2008 2009 2010 2011 2012 2013 2014 2015 2016 2017#ModernizedDCPSschools 16 23 25 29 32 35 35 43 48 53
Conditionofcharterschools
Noinfo Noinfo Noinfo Noinfo Noinfo Noinfo Noinfo Noinfo Noinfo Noinfo

26
1http://www.pewhispanic.org/2015/09/28/selected-u-s-immigration-legislation-and-executive-actions-1790-2014/2Enrollmentcountsdiscussedhereareauditedenrollmentnumberseachyear3OSSEFY17PerformanceOversightHearingQuestion4Response--EnrollmentinPrivateandParochialSchoolsinSY17-18todatehttps://osse.dc.gov/page/fy17-performance-oversight-questionsReferences
Connor,Philip.2018.AtLeastaMillionSub-SaharanAfricansMovedtoEuropeSince2010.Washington,DC:PewResearchCenter.March22.http://www.pewglobal.org/2018/03/22/at-least-a-million-sub-saharan-africans-moved-to-europe-since-2010.
Macharia,Kinuthia.2011.AfricanImmigrantsintheWashingtonDCMetropolitanArea:ImmigrationWavesandCommunityBuilding.Washington,DC:AmericanUniversity.http://africamigration.com/issue/jan2011/MACHARIA-AFRICAN-IMMIGRANT-COMMUNITIES.pdf.
Singer,Audrey.2004.TheRiseofNewImmigrantGateways.Washington,DC:BrookingsInstitution.February.https://www.brookings.edu/wp-content/uploads/2016/06/20040301_gateways.pdf.
Tatian,Peter,LeahHendey,andMaryBogle.2017.VoicesoftheCommunity:DC,Maryland,Virginia.Washington,DC:GreaterWashingtonCommunityFoundation.https://www.thecommunityfoundation.org/s/GWCF_VoicesDMV_Report_FINAL.pdf.
Tatian,PeterA.andSerenaLei.2013.OurChangingCity:Chapter1:Demographics.Washington,DC:UrbanInstitute.http://apps.urban.org/features/OurChangingCity/demographics/index.html.
Tatian,PeterA.andSerenaLei.2014.OurChangingCity:Chapter3:Housing.Washington,DC:UrbanInstitute.http://apps.urban.org/features/OurChangingCity/housing/index.html.

27
Section2:BestPracticesforEnrollmentProjections
BestPracticesforEnrollmentProjectionsWhenprojecting futureenrollments, it is vital to track thenumberof livebirths, theamountofnewhousingactivity, and the change in household composition. In addition, any of the following factors could cause asignificantchangeinprojectedstudentenrollment:
• Boundaryadjustments• Newschoolopenings• Changes/additionsinprogramofferings• Preschoolprograms• Changeingradeconfiguration• Interestrates/unemploymentshifts• Intra-andinter-districttransfer• Magnet/charter/privateschoolopeningorclosure• Zoningchanges• Unplannednewhousingactivity• Planned,butnotbuilt,housing• Schoolvoucherprograms• Schoolclosures
Obviously,certainfactorscanbegaugedandplannedforfarbetterthanothers.Forinstance,itmayberelativelystraightforward to gather housing data from local builders regarding the total number of lots in a plannedsubdivisionandcalculatethepotentialstudentyield.However,planningforchangesintheunemploymentrate,andhow thesemayeitherboostor reducepublic school enrollment, provesmoredifficult. In any case, it isessentialtogatherawidevarietyofinformationinpreparationforproducingenrollmentprojections.
Whenlookingaheadataschooldistrict’senrollmentoverthenexttwo,five,ortenyears,itishelpfultoapproachtheprocessfromaglobalperspective.Forexample:Howmanynewhomeshavebeenconstructedeachyear?Howmany births have occurred each year in relation to the resident population? Is housing experiencing aturnover—ifso,whatisthecompositionoffamiliesmovingin/out?Aremoreorfewerstudentsattendingprivateschoolorbeinghome-schooled?Whathastheunemploymentratetrendbeenoverthepasttenyears?Whatneweducationalpoliciesareinplacethatcouldaffectstudentenrollmentfigures?
The cohort survival methodology is often used to answer these questions and is standard throughout theeducationalplanningindustry.Thehousingmethodisalsoacommonmethodologyusedtoprojectenrollmentinareasofhighgrowthduetonewhousingdevelopment.
Traditionally,enrollmentprojectionsaredevelopedatadistrict-wideorschoollevel.Enrollmentprojectionscanalsobedevelopedbasedonwherestudentslive,ifstudentdataisavailable,includingtheiraddressatthetimeofenrollment,byschoolyear,historically. Enrollmentprojectionsbasedonwherestudentsattend,or themoretraditionalschool-levelenrollmentprojections,areusefulforbudgetingpurposesand/orteacherand/orprogramplacement.Enrollmentprojectionsbasedonwherestudentsliveisusefulforschooldistrictsthatareplanningschoolfacilitiesorattendanceboundaries.

28
CohortSurvivalMethodThecohortsurvivalmethodology(sometimesreferredtoasthegradeprogressionratiomethod)isawidelyusedenrollmentprojectionmodelthatisusedbymanyschooldistrictsandstateandfederalagenciestoprojectK-12enrollment.
Acohortisagroupofpersons[inthiscase,students].Thecohortsurvivalenrollment projection methodology uses historic live birth data andhistoric student enrollment to “age” a known population or cohortthroughout the school grades. For instance, a cohort beginswhen agroupofkindergartenersenrollsingradeKandmovestofirstgradethefollowingyear,secondgradethenextyear,andsoon.
A “survival ratio” is developed to track how this group of studentsincreased or decreased in number as theymoved through the gradelevels.Bydevelopingsurvivalratiosforeachgradetransition[i.e.2ndto3rdgrade]overaten-yearperiod,patternsemerge.Aprojectionratioforeachgradetransitionisdevelopedbasedontheanalysisofthesurvivalratios.Theprojectionsareusedasamultiplierindeterminingfutureenrollment.
Forexample, ifstudentenrollmenthasconsistently increasedfromthe8thtothe9thgradeoverthepasttenyears,thesurvivalratiowouldbegreaterthan100%andcouldbemultipliedbythecurrent8thgradetodevelopaprojectionfornextyear’s9thgrade.Thismethodologycanbecarriedthroughtodeveloptenyearsofprojectionfigures.Becausethereisnotagradecohorttofollowforstudentscomingintokindergarten,residentlivebirthcounts are used to develop a birth-to-kindergarten survival ratio. Babies born five years previous to thekindergarten class are compared in number, and a ratio can be developed to project future kindergartenenrollments.
The cohort survivalmethod is useful in areaswhere population is stable [relatively flat, growing steadily, ordeclining steadily], andwhere there have been no significant fluctuations in enrollment, births, and housingpatternsfromyeartoyear.Thecohortsurvivalmethodologyinherentlyconsiderstheneteffectsoffactorssuchasmigration,housing(newhousingandhousingturnover),dropouts,transferstoandfromcharterschools,openenrollment,anddeaths. Thismethodologydoesnotassumechanges inpolicies,programofferings,or futurechangesinhousingandmigrationpatterns.
HousingMethodEnrollmentprojectionscanbedeterminedbyanalyzing thehousingdata for theareas thatmakeupa schooldistrict.Yieldfactorscanbeestablishedbycomparingthehistoricchangeinenrollmentfromyeartoyeardividedbythetotalnumberofbuildingoroccupancypermitsissued.Forexample,ifstudentenrollmenthasincreasedbyapproximately100studentseachyearandapproximately200buildingpermitshavebeenissuedeachyearforthepasttenyearsthentheyieldfactorwouldbeapproximately0.5studentsperbuildingpermit.
Figure13CohortSurvivalMethod

29
Once yield factors are established, the number of newstudents per year canbe estimatedbymultiplying the yieldfactor by the number of projected new housing units. Thismethod iseffectivewhentherateofstudentenrollment farexceedsthelivebirthrate.
Ifhousingdemolitionsareoccurring inadistrict, thesemustalsobeconsidered.Forinstance,ifhousingdemolitionshaveincreasedrapidlyoverrecentyearswhilenewhousingstartshaveremainedrelativelyconstantovermanyyears,theconclusionmaybethatsomeofthenewhousingstartswillsimplybereplacementsforthefamiliesdisplacedbythedemolitions.Ofcourse,housingvalueandhouseholdcomposition would need to be further analyzed to confirm that this is indeed the case. It is possible thatenrollmentmayremainflatorevendeclinealthoughthereisnewhousingoccurringinthearea.
Thismethodologycanbeappliedatthelevelofgeographythatbuildingpermitandstudentdataisavailable.Forexample,ifbuildingpermitsareavailableatadistrict-widelevel,thismethodcanbeappliedtodevelopadistrict-wideprojection.Enrollmentprojectionsbyschoolorboundarycouldbedevelopedifbuildingpermitsandstudentdataareavailableatthoselevels.
The housing method is useful in areas where population is growing primarily due to new housing in areaspreviouslyundeveloped[ruralorindustrialland].Thehousingmethoddoesnotinherentlyconsidertheneteffectsoffactorssuchasmigration,housingturnover,dropouts,transferstoandfromcharterschools,openenrollment,anddeathsthatthecohortsurvivalmethoddoes.Likethecohortsurvivalmethod,thismethodologyalsodoesnotassumechangesinpolicies,programofferings,orfuturechangesinhousingandmigrationpatterns.
Figure14HousingandEnrollmentProjections

30
Section3:Processes&MethodsinComparableCitiesTheDistrictofColumbiaisnotaloneinnavigatingthechallengesofprojectingenrollment.Therearesignificantchallengesinaccurateandreliableprojectionsbecauseofdemographicandhousingchange.Butthereareneweducationpoliciesadvancedinaschoolreformmodelthatpromotesschoolopeningsandclosings,andschoolchoiceascentraltoschoolimprovementthataffectsenrollmentpatterns.Whilealldistrictsaresubjecttochangebasedonchildpopulationdemographics,manyoftheeducationpoliciesthatpromoteopenenrollmentcreateenrollmentprojectionuncertaintiesdistinctfromschooldistrictswithmoretraditionalresidence-basedstudentassignmentpolicies.
IntheStudy,wesoughttolearnhowotherdistrictswithrobustchoicepolicieswereprojectingtheirenrollmentsto learnwhether therewereanyprocessesormethods thatmightbeappropriately applied in theDistrict ofColumbia.SincetheDistrictofColumbiaisboththeStateandtheDistrict,wealsointerviewedthestateagencieswherewehadsurveyedandinterviewedschooldistrictplanners.
Fourschooldistricts listed inthetablebelow,allwithsubstantialcharterenrollmentsandstudentassignmentpolicieswhereschoolchoiceisstronglysupported,weresurveyedandinterviewed.Eachdistrictwasaskedtocompleteanonlinesurveypriortoaphoneinterviewwhereadditionalquestionsregardingenrollmentprojectionprocessandpurposewerediscussedtobetterunderstandhowtheyaredevelopedandused. ThesurveyandinterviewquestionscanbefoundinAppendixBofthisreport.
2016-2017PublicSchoolDistrictandCharterEnrollmentbySchoolDistrict
TheOfficeoftheD.C.Auditor(ODCA)sentletterstorepresentativesateachoftheseschooldistrictsrequestingtheir participation in a virtual or in-person meeting to provide insights into how enrollment projections aredeveloped in their respective districts as well as how common challenges are taken into account in thedevelopmentofenrollmentprojections.Inaddition,similarrequestsweresenttothestateagencycorrespondingtotheschooldistrictsthatagreedtoparticipate.
DistrictPublic-
SchoolEnrollmentSY16-17
CharterSchoolEnrollment
SY16-17
TotalPublic-SchoolEnrollment
SY16-17
%ofTotalEnrollmentAttendingCharter
SY16-17
DistrictofColumbia 48,510 41,491 90,001 46.1%
ColumbusCitySchools 50,405 18,080 68,485 26.4%
DenverPublicSchools* 72,700 18,463 92,331 20.0%
OaklandUnifiedSchools 36,668 12,932 49,600 26.1%
TheSchoolDistrictofPhiladelphia 134,129 64,848 198,977 32.6%
*EstimatewithinCitylimits
Source:U.S.DepartmentofEducation,NationalCenterforEducationStatistics,CommonCoreofData(CCD),PrivateSchoolUniverseSurvey(2015-16SY),UrbanInstituteDistrictProfileReport

31
Thechartbelowprovidesabriefoverviewoftheresponsetotheprimaryquestionsasked,followedbyasummaryofeachinterviewsynthesizedintofourgeneralpartsofhoweachcitycreatesitsenrollmentprojections:
• Inputsandmethods• Processandadjustments• Usesofenrollmentprojections
EducationAgencyConduct
EnrollmentProjection
PrimaryPurposeofEnrollmentProjections
In-Houseor
Consultant
YearsofEnrollmentProjected
ProjectionLevelofDetail
ConductaProjection
ReviewProcess
PublicReleaseor
internalUse
ProjectionsRegulatedbyState
Guidelines
ColumbusPublicSchools No N/A N/A N/A N/A N/A N/A N/A
DenverPublicSchools Yes Budgeting In-House 1-year
5-year
ByDistrictBySchoolBy
GradeYes Public No
OaklandUnifiedSchoolDistrict Yes Budgeting Both 1-year
ByDistrictBySchoolBy
GradeYes Internal No
TheSchoolDistrictofPhiladelphia Yes Budgeting In-House 1-year
ByDistrictBySchoolBy
GradeByGeographic
region
Yes Internal No

32
InputsandmethodsOfficialsinDenver,OaklandandPhiladelphiaalluseacohortsurvivalmethodtotrackhistoricalenrollmenttrendsforwardintothefuture.Columbuswasanoutlier,innotdoingprojections.Officialsintheotherthreecomparabledistrictsusesimilarschool-anddemographic-basedinputstoformulatetheirenrollmentprojections.DenverandPhiladelphiauseofficialOctoberenrollment counts, like theDistrictofColumbia,whileOaklanduses studentcounts from the 20th day of school. The three comparable districts also use surrounding area demographicinformationinmakingtheirenrollmentprojections,suchasbuildingpermits,andmeasuresofeconomicgrowth.Theyalsolookschoolchoicepatternstoinformpotentialdemandinagivenarea.
ProcessandAdjustmentsThe threecomparabledistricts, likeDCPS,haveaprocess for school-leveladjustmentsand feedbackon initialprojections.Denverallowsprincipalstochallengetheirinitialprojectionandaskforahighernumber,butiftheyfailtoreachtheirnewtarget,theymustpaybackthedistrictforthedifference.SchoolleadersinOaklandcanrequestchangestotheirpreliminaryprojectionswithsupportingdocumentation.PrincipalshavetheopportunitytoprovidefeedbackinPhiladelphiaaswell.
UsesofEnrollmentProjectionsMuchliketheDistrictofColumbia,thecomparablecities(exceptColumbus)usenext-yearenrollmentprojectionsforbudgetingpurposesandmulti-yearprojectionsforcapitalplanning.
SchoolDistrictInterviewSummaryColumbusPublicSchoolsColumbusPublicSchools(CPS)operatesunderapolicyofzero-basedbudgeting,andthereforedoesnotconductenrollment projections. Budget managers develop budgets for their respective areas. For example, schoolprincipals and department chiefs are budgetmanagers and therefore develop the budget for their school ordepartment. Once thebudget isdetermined, theenrollment isdictatedby thebudgetallocation. Therearemeasuresinplacetoensureschoolsarenotovercrowdedandenrollmentislimited.Budgetmanagersconsiderkeyindicatorssuchashistoricalenrollmentandbuildingcapacitywhendevelopingschoolbudgetallocations.
Although CPS does not conduct enrollment projections internally, they do receive a by District, by SchoolprojectionfromtheOhioFacilitiesConstructionCommission(OFCC).TheseprojectionsareconductedwhenCPSundergoesacapitalimprovementprogramthatisco-fundedbytheStateofOhio.Theseprojectionsareforten[10]years,andfacilityimprovements(newconstruction,modernizations,etc.)aredeterminedbythehighestyearofprojectedenrollmentifexpectedtoincreaseorthefifthyearofprojectedenrollmentifexpectedtodecrease.

33
DenverPublicSchoolsTheDenverPublicSchools (DPS)enrollmentprojectionprocessesandapproachprovideabestpracticemodelwhichtheDistrictofColumbiacanadapt. Denver’sprojectionmodel isbasedprimarilyonthecohort-survivalmethod, using the officialOctober headcounts,which are finalized inNovember. Enrollment projections areproducedbyschool,bygrade foroneyear. Theseprojectionsare thensummedtodetermineaDistrict-wideenrollmentprojection.Thisallowsforconsiderationtobegiventotrendsspecifictoindividualschoolssuchasschoolchoicetrendsandphysicalfacilitycapacities.
First,abaseenrollmentprojectionisdevelopedlookingatsurvivalratiosandlivebirthcountsbycensusblockprovidedbytheStateDepartmentofHealth.District-widekindergartenisprojectedbyanalyzingthebirthdatabyboundarylevelandtheratioofbirthstokindergarten5yearslater.Sixthgrade,andninthgradeenrollmentprojectionsarecalculatedbyanalyzingtheratiooftotalfifthandeighthgradersintheboundarythatareinsixthandninthgradethefollowingyear.Allothergrades,byschoolaredevelopedbyanalyzingthesurvivalratiosattheschoolleveltodetermineaprojectionratiothatisappliedtocurrentenrollment.
Apreliminaryenrollmentprojectionis thendeterminedbyincorporatinginputfromthechoicemanagerswhohave knowledge of school choice trends, program placements, housing development, economic growth anddecline,facilityplanningefforts,boundarychanges,policychanges,andphysicalfacilitycapacities.Thereisanabundance of data collected historically to support the adjustments made by the choice managers in thedevelopmentofthepreliminaryenrollmentprojections.Thepreliminaryenrollmentprojectionsaredistributedtoeachschoolforfeedback.Schoolschallengethepreliminaryprojectionsandafinalenrollmentprojectionisestablished. DPS implements a system of accountability where schools or administration are paid if theenrollmentprojectionsareoff.Forexample,iftheschoolchallengedthepreliminaryenrollmentprojectionforahigherprojectionandtheactualenrollment for theprojectionyearwas lower thantheprojection, theschoolowestheadministrationthedollars for thedifference instudents. Conversely, if theadministration issuesanenrollmentprojectionforaschoolthatwaslowerthantheactualenrollment,theadministrationpaystheschoolthedifference.
EnrollmentprojectionsfortheDPSaredevelopedbyinternalstaffandaremadepubliclyavailableuponrequestwhentheyarefinalizedbyDPSPlanninginlateJanuaryforthefollowingschoolyear.Theprimarypurposeoftheenrollmentprojectionsisforstudent-basedbudgetingpurposes.
Inadditiontoone-yearenrollmentprojections,DPSdevelopsafive-yearforecast.Typically,thefive-yearforecastisproducedin-housebyinternalstaff.In2017,however,theDistrictoutsourcedthisefforttolocalconsultantsfor the first time to obtain an independent perspective. The District anticipates that these forecastswill beoutsourcedeverythreeyearswithDPSstaffdevelopingtheminternallyinbetween.Thefive-yearforecastsareused to keep up with trends in growth and decline in areas of the District, determine program needs andplacement,andfacilityneeds.TheforecastsaredevelopedbyCensusblockgroup,bygradegroup(i.e.,K-5,6-8,and9-12),andthenrolledupbysub-regionandregion.District-widelong-termenrollmentforecastsaremadepubliclyavailableintheirannualStrategicRegionalAnalysis,whichispublishedinearlyDecembereachyearonwww.planning.dpsk12.org.
OaklandUnifiedSchoolDistrictTheOaklandUnifiedSchoolDistrict(OUSD)enrollmentprojectionmodelisbasedprimarilyonthecohortsurvivalmethod,usingthe20-daystudentheadcounts.Enrollmentprojectionsareproducedbyschool,bygradeforone

34
year. TheseprojectionsarethensummedtodetermineaDistrict-wideenrollmentprojection. Thisallowsforconsiderationtobegiventotrendsspecifictoindividualschoolssuchasschoolchoicetrendsandphysicalfacilitycapacities.
First, a base enrollment projection is developed looking at survival ratios and live birth counts. District-widekindergarten, sixth grade, and ninth grade enrollment projections are calculated using the cohort survivalmethodology,andthenapercentageofthetotalmarketshareforaspecificschoolisdetermined.ThepercentageofthetotalmarketshareismultipliedbytheDistrict-wideprojectedenrollmenttodevelopakindergarten,sixthgrade,orninthgradeprojectionbyschool.Forexample,ifthedistrict-widesixthgradeisprojectedtobe100,and a school historically has had 25%of the total sixth grade enrollment, the sixth-grade projection for thatparticularschoolwouldbe25.Allothergrades,byschoolaredevelopedbyanalyzingthesurvivalratiosattheschoolleveltodetermineaprojectionratiothatisappliedtocurrentenrollment.
A preliminary enrollment projection is then determined by incorporating school choice trends, programplacements,housingdevelopment,economicgrowthanddecline,andphysicalfacilitycapacities.Thepreliminaryenrollment projections are distributed to each school for feedback. Schools can request changes to thepreliminaryprojections if supportingdocumentation/data isprovided. The supportingdocumentation/data isreviewed,andafinalenrollmentprojectionisestablished.
Enrollment projections for the OUSD are developed by internal staff and are notmade public. The primarypurposeoftheenrollmentprojectionsisforbudgetingpurposes.
TheSchoolDistrictofPhiladelphiaTheSchoolDistrictofPhiladelphia(SDP)enrollmentprojectionmodel isbasedprimarilyonthecohortsurvivalmethod,completedbyDistrictstaffinFebruaryofeachschoolyearusingtheofficialOctoberenrollment.One-yearenrollmentprojectionsarecompletedprimarilyforbudgetingpurposes.TheDistrictperiodicallyconductslonger forecasted projections that are primarily used for capital planning purposes. SDP applies a weightedaveragetothecohortsurvivalduetothedynamicsofthecitypopulation,availableoptionsforschoolchoiceandthefrequentopeningandclosingofschoolsacrosstheDistrict.TheDistrictalsoimplementsmultiplestrategiestoprojectenrollmentfordifferenttypesofschools.
Neighborhood schools use live births by zip code or census tract (usually use census tract), for school year(SeptembertoAugust)asprovidedbythecity.Studentsaregeocodedusinggeographicinformationsystems(GIS)bycensusblockandgroupedtogetherintoneighborhoodgrids(i.e.planningunits)thatcanberolledupintoaDistrict-wide summary. Kindergarten is not required in the State of Pennsylvania so, birth to first grade andkindergartentofirstgradesurvivalratiosareanalyzed.
TherehasbeensignificantgrowthofcharterschoolsinPhiladelphia.Therearetwo[2]typesofcharterschoolsintheDistrict:thetraditionalcharterschoolsthatdonothavecatchmentareasandservebothneighborhoodandcity-widestudents;therenaissancecharterschoolsthathaveadefinedcatchmentandfeederpatternsidentified.Projectionsarenotcompletedfortraditionalcharterschoolsasthoseschoolsfillbasedontheircontract/charteragreements;however,modificationstopublicschoolprojectionsaremadebasedonfromwhereeachtraditionalcharterschoolmayattractstudents.Renaissanceschoolsarerequiredtotakestudentsfromtheirneighborhoodcatchmentandwillonlyfillseatsfromoutsidetheneighborhoodiftheyhavenotfulfilledtheircharterallotment.

35
ProjectionsfortheseschoolsarecompletedmuchlikethepublicschoolsandareperformedatthesametimeinFebruary.
SDPalsoofferssubstantialcity-wide(lottery)andspecial-admit(application,audition,etc.)schools.Thedatafromthestudentselectionprocessiscriticalwhenprojectingenrollmentfortheseschools.Howmanystudentsapplyandhowmanystudentsareaccepteddeterminesanattritionrate.Theaverageattritionrateisusedtoidentifyprojectionsofhowmanystudentswilltypicallyshowupforastartinggrade.Thisiscomplicatedbythefactthatstudentswill apply for thenon-starting gradeof a school. Therefore,modifications to survival ratiosmustbecalculatedbybothapplicationsandhistoricaltrendsofgrade-to-gradeenrollments.Onceagain,likecharters,itmust be determined where in the city these students are coming from to determine modifications of theneighborhoodschoolprojections.
Thereviewprocessforprojectionsismulti-layeredanddocumentedtoensurethatthosewhoparticipatedinthereviewprocesshaveknowledgeregardingtheconclusionsoftheprojections.AfterprojectionsarecompletedinFebruary, an internal review by several departments, including assistant superintendents assigned to eachnetwork,providesfeedbackbasedonknowledgeofprogrammovement,studentmovement,andpolicychangestodeterminewherestudentsshouldbeaddedtoorsubtractedfromacertainarea. Theprojectionsarethenreviewedbytheprincipalofeachschooltoapplyalocalknowledgeelementtotheprojections.Oncethesetwostepsarecompleted,alevelingprocessbyschooliscompletedtomatchadistrict-wideprojection.
EnrollmentprojectionsfortheSDParedevelopedbyinternalstaff.Thereare3individuals,includingamanager,whocollectivelydevelopenrollmentprojectionsaswellasperformGISandplanningdutiesutilizingmainlyGISanddatabaseskills.
StateInterviewSummaryAspartofthisstudy,thestateagencyinwhichthedistrictsarelocatedwereinterviewedregardingprojectionprocessesatthestatelevel.RepresentativesfromCalifornia,Colorado,OhioandPennsylvaniawereinterviewed.Thefollowingarebriefsummariesofthefindingsoftheseinterviews.
CaliforniaEnrollmentprojectionsarecompletedbytheDemographicResearchUnitoftheCaliforniaDepartmentofFinance(DOF). Student enrollment projections are completed at the county level by grade using a cohort survivalmethodology. The State projects enrollment basedonAverageDailyAttendance (ADA) utilizing historicADAenrollment by grade. ADA is ameasurement of enrollment.While it is slightly lower than the State’s actualenrollment,itprovidesthesteadiestmeasureofenrollment.Livebirthdatabycounty,asprovidedbytheStateDepartmentofHealth,isusedtoprojectkindergartenenrollment.Projectionsarecompletedfornextbudgetyear,then typically forecasted to the next 4 to 5 years; however, recently there have been legislative requests tocompleteprojectionsforupto10years.
Projectionsarecompletedusingagradeprogression(cohortsurvival)methodology,buttypicallyonlyapplythelastyear’sratiounlessatrendindicatesamodificationtothesurvivalratio.County-levelprojectionsareavailableonline for Districts to view, but there is little feedback received by the DOF for modifications. Enrollmentprojectionsareusefulforplanningbutarenotrequiredtobeusedforanyotherpurpose.

36
ColoradoEnrollmentprojections for the StateofColoradoare conductedby theColoradoGeneralAssembly legislativecounselstaff.Projectionsarecompletedatthedistrictleveltoprojectfundingforthenextschoolyearprovidingestimatesforstudentcounts,free-lunchestimates,andpropertytaxcollections.EnrollmentprojectionsusetheofficialOctoberheadcountsasthebasisofdataandapplyacohortsurvivalmethodologyforprojections.Becauseenrollmentprojectionsareusedforschooldistrictfunding,aprocessof“trueingup”isusedtodeterminefinalbudgets for State-level funding to school districts. Typically, the end of year enrollment is matched to theprojectionsandfundingisleveledforeachdistrictto“trueup”thebudgettotheenrollment.Althoughthis“true-up”occurs,thereislittlecommunicationfromthedistricttotheStatewhiledevelopingprojectionsbeforetheyare finalized. This process is currently being reviewed and modified to create a more accurate year-to-yearprojection.
CharterschoolsarealsoprojectedbytheState,typicallythreetofiveyearsouttodeterminecommunityneedsandcharter renewalapplications. Dataused todevelopenrollmentprojections includecommunityoutreach,lettersofintent,typeofschoolmodelthatisbeingprojected,historicalenrollment,andlivebirthdata.
OhioOhiodoesnotcompleteenrollmentprojectionsattheStatelevelforbudgetingpurposes.Enrollmentprojectionsaredevelopedby theOhioFacilitiesConstructionCommission (OFCC) consultants for schooldistrictsenteringfacilities projects through the State’s K-12 school renovation and building initiative. Ten-year enrollmentprojectionsareprovided todistrictsat thedistrict-wide level,bygrade,byyear. If schooldistrictswould likeenrollment projections completed by school, OFCC will conduct a by school projection for the district uponrequest.TheOFCCusesthecohortsurvivalmethodtoprojectenrollmentforallschooldistrictstowhichtheyprovideenrollmentprojections.
Datausedtoprojectenrollmentincudes:
• Livebirthcountsbyplaceofresidenceofthemother,eitherbyzipcodeormunicipality• Tenyearsofhistoricalenrollmentbygrade,byyear• Tenyearsofopenenrollmentintoandoutofthedistrictbygrade,byyear• Tenyearsofcharterenrollmentbygrade,byyear• Buildingpermits• Esri(EnvironmentalSystemsResearchInstitute)populationestimatesandprojections
PennsylvaniaTen-yearenrollmentprojectionsfortheStateofPennsylvaniaaredevelopedbythePennsylvaniaDepartmentofEducation(PDE)OfficeofDataQualityforbudgetingpurposes.PDEappliesacohortsurvivalmethodologyutilizing5yearsofhistoricalOctober1stenrollmentdata,housingdata(derivedfromtheTaxEqualizationDivision),andlivebirthdata.Modificationstosurvivalratiosaremadebasedonrecentdatatrendsoranomaliesthatwouldnottypicallyexist.Projectionsarecompletedbygrade,bydistrictandareonlyconductedattheStatelevelforchartersandcomprehensivecareerandtechnicalcenters.Thereisgenerallynoreviewfromlocaldistricts.

37
Section4:ProjectionProcesses&MethodsinD.C.EnrollmentProjectionMethodologyTheDistrictofColumbiaproducestwomaintypesofenrollmentprojections:next-yearandmulti-year.Next-yearenrollmentprojectionsarecompiledbyschool,grade,andsubgroupforDCPSandpubliccharterschools.Multi-yearprojections,whicharetypicallypartofaMasterFacilitiesPlan(MFP),areusuallybygradeandsometimesbysector, but not done at the school level. TheDistrict of ColumbiaOffice of Planning (OP) produces age levelpopulationforecasts,whichareusefulindevelopingmulti-yearenrollmentprojections.
Next-yearProjectionsAccordingtointerviewswithDistrictofficials,eachoftheDistrict’s67localeducationagencies(LEAs)projectsitsnext-yearenrollmentaspartofthecity’sannualbudgetcycle.LEAssubmittheirenrollmentprojectionstotheDME,whichcertifiestheirtotals,andsendsfinalprojectionstotheExecutiveOfficeoftheMayor(EOM),whichworkswiththeOfficeoftheChiefFinancialOfficer(OCFO),topresentaproposedbudgettotheCouncilinMarchfortheupcomingfiscalyearbeginningOctober1st.Next-yearprojectedenrollmentssubmittedtotheDMEincludeenrollmentprojectionsbyschool,gradeandsubgroupforDCPSandpubliccharterschools.
Multi-yearProjectionsLong-rangeenrollmentprojectionstypicallyhavebeenpartofaMasterFacilitiesPlan(MFP).Thesehavebeenproducedatirregularintervalssincethemid-1990’s1.Pastplanshaveusedavarietyofmethods,geographiesandperiodsofstudytoprojectfutureenrollment,makingtheirfindingsdifficulttoevaluateagainstreality.WhilepastprojectionsalsofocusedexclusivelyonprojectingDCPSenrollment,theforthcoming2018MFPwillincludecharterschoolenrollmentprojectionsaswell.
OverallPopulationForecastsThe District Office of Planning (OP) State Data Center forecasts population and, starting in 2012, estimatespopulationbyageinthecity’s46neighborhoodclusters.OPforecastsdonotlinkpopulationestimatestoschool-levelenrollment,insteadhighlightingneighborhoodsthatarelikelytoseeanincreasednumberofresidentsbyage-levelbandsinthefuture2.
UsesofEnrollmentProjectionsEnrollmentprojectionsareusedforplanningandbudgetingattheCity,LocalEducationAgency(LEA)andschool-levels.TheDistrictusesnext-yearprojectionstodetermineitsDCPSandpubliccharterschooloperatingbudgets,and the charter school facilities allowance. Multi-year projections and overall population projections haveinformedDCPSeducationalfacilitiesmasterplanningandcapitalbudgeting,andthePublicCharterSchoolBoard’splanningforschoolopenings.

38
SettingtheDistrict’sOperatingBudgetforPublicEducationTheDistrictfundsitsDCPSschoolsbasedonthenext-yearprojectedOctober5thenrollment.PubliccharterschoolsarefundedinquarterlyinstallmentsbasedontheirprojectedOctober5thenrollment(Q1),unverifiedOctober5thenrollment(Q2&Q3)andauditedOctober5thenrollment(Q4)3.TheaccuracyofDCPS’snextyearprojectionsareimportantbecausecurrentlythereisnotaprocessinplacetoadjustfundingbasedonactualenrollment.Thecaseof KellyMillerMiddle School inWard 7 illustrates how school openings and closings can impact school-levelbudgets.In2013DCPSclosedandconsolidatedRonBrownMiddleSchoolintoKellyMiller,displacingabout200students.OfficialsexpectedenrollmentinKellyMillertogrowbyabout80studentsthatfall,butenrollmentwentup by 160 students,meaning the projectionwas about 80 students too low. Conversely,when three nearbycharterschoolsexpandedtoinclude6thgradeinthefallof2015,DCPSofficialsunderestimatedhowmuchtheirexpansionwouldaffectKellyMiller’senrollment.Theschoolwasprojectedtoenroll565studentsinOctober2015,butonlyenrolled450students.Withoutaprocesstoadjustfundingbasedonactualenrollment,schoolscanbeover-orunder-fundedfortheirspecificneeds.
Figure15All6th–8thenrollmentinWoodsonFeederGeography2008-17
Evensmallerfluctuationsinenrollmentbringsignificantbudgetimplications.EachyearthenextyearenrollmentprojectionsareusedbyDCPSschoolstobudgetfortheirteachersandotherstaff,withintheparametersofDCPS’sstaffingrequirements.

39
BudgetingforweightedsubgroupsTheSchoolReformAct(SRA)requiresOSSEtoreviewtheUniformPerStudentFundingFormula(UPSFF)basicfoundationlevelofpubliceducationfundingandtheweightsthatadjustthisfoundationeverytwoyears4.Therecommendations,usuallyfromanOSSEcommitteeonUPSFF,makerecommendationstotheMayorwhichmaybeusedinsettingtheUPSFFfortheDistrict’sPublicEducationBudgetwhichisapprovedbytheCouncilaspartoftheannualbudgetprocess.Pupilweightsareaddedtothefoundationforthesecategories:pergrade-levelandsubgrouppopulations,asoutlinedinD.C.Code§38-2905,andarelistedbelow.6:
• Gradelevels• Specialpopulations
• SpecialEducationo StudentseligibleforLevel1-4specialeducationserviceso StudentscoveredunderBlackmanJonescomplianceo StudentsthatwereeligibleforAttorney’sfees
• Englishlanguagelearners• Residential• Extendedyear• At-riskstudents7
CharterFacilityAllowancesInaddition to receivingper-studentallocations,publiccharter schools receive local funding forcapital-relatedcosts for facilities, including construction,major buildings improvements, and leasing or purchasing propertythroughaFacilitiesAllowance. However,charterschoolsarenotobligatedtousetheir facilitiesallowanceoncapital-relatedfacilitiescosts.ThefacilitiesallowanceispartoftheirJuly15th(1stquarter)UPSFFpayment8.EachLEA’sfacilitiesallowanceissetasadollarfigure“multipliedbythenumberofstudentsestimatedtoattendeachPublicCharterSchool”9.IftherearediscrepanciesbetweenanLEA’sprojected,auditedOctober5thenrollments,OSSEadjuststheLEA’sApril15th(4thquarter)paymenttoreconciledifferencesinthefacilitiesallowanceaswellastheUPSFFfunding.10
EducationalFacilityMasterandCapitalPlanningMulti-yearenrollmentprojectionsshouldhelptheDistrictalign itspublic-schoolcapacitywiththeneedsof itspopulation.Five-andten-yearprojectionscompletedaspartofpastMFPsaremeanttoinformDCPS’ssix-yearcapitalimprovementsplan(CIP)processincludingestimatedpopulationgrowthorchangesinstudentdemand.Multi-year projections should also inform school boundaries for DCPS, but enrollment, capital planning, andboundarydecisionshavenotbeenconsistentlyaligned.
Intherecentpastintheabsenceofschoolboundaryleveldataprojections,decisionshavebeenmadewithoutadequate information and in silos.Another example is Barnard ES. TheWard4 school is extremely crowded,includingportableclassroomswithcapacityfor176students.TwonearbyDCPSelementaryschools,ClarkESandRudolph ES became city-wide charters in SY 2010 and 2012, respectively. Sustaining one or both as DCPSelementaryschools,basedontheneighborhoodpopulation,couldhaverelievedcrowdingatBarnard.

40
Withoutaccuratefive-yearprojections,Districtpolicymakershavesupportedacapitalbudgetthathasresultedinschoolsbeingconstructedwithinappropriatecapacities.AnotherexampleisDealMS,with2017-18enrollmentof1,475students.TheWard3schoolwasinitiallymodernizedin2009foranenrollmentof800students-toosmall a capacity to serve the population of its 6 feeder schools. It had portable classrooms soon aftermodernization.Amajoradditionin2013permittedtheschooltogrowitspermanentcapacityto1,370,stillwithportablesfor200students.MacFarlandMS,currentlyundergoingmodernizationfor590students,maysimilarlybeover-crowdedshortlyafter it reopens ifonlyhalfof the5thgradersattending its7 feederschoolschosetoattend.
EstimatingtheNumberofLotterySeatsInMarch,LEAssubmittoMySchoolD.C.thenumberofseats,byschoolandbygradethattheywillmakeavailableintheMySchoolD.C.lottery.
SeatsOfferedinSpring2017MySchoolD.C.LotterybyGradeandSectorGradelevels DCPS Charter Total
PK3 2,318 3,668 5,986PK4 1,086 1,011 2,097K 362 911 1,2731st 226 491 7172nd 218 525 7433rd 201 398 5994th 182 406 5885th 133 664 7976th 438 1,268 1,7067th 216 488 7048th 186 315 5019th 1,525 1,605 3,13010th 302 293 59511th 140 118 25812th 98 43 141
Total 7,631 12,204 19,835
TheDCPSPlanningTeamleadsthedevelopmentofthelotteryseatprojections,whicharedrivenbytheenrollmentprojections. Thisyear, lotteryseatswerefinalized inmid-March, thedeadlineforLEAstosubmitseatstoMySchool D.C. This year the following factorswere usedwhen projecting lottery seats: average class size/cap,classroom/staffallocations,buildingcapacity,andhistoricalseatallocationsandenrollment.Similartoenrollmentprojections,theDCPSPlanningOfficeproposesseatprojectionstoschoolleadersandgivesthemanopportunitytopetitionachange.
DCPSdoesnotuseestimatesofschool-levelofferacceptancerates,definedasthepercentofapplicationsthatendedupenrollingintheofferschool,outofallapplicationsthatwereoffered11,todecidehowmanyseatstomakeavailableinthelottery.Aschoolisobligatedtomakeaseatavailableifitputsitintothelottery.However,

41
becauseamatchinthelotteryresultedinenrollmentonly57%ofthetimein2017-18,itisnotuncommonforcharterstoplacemoreseatsintothelotterythantheycanmanage,knowingthattheymaybesomewhatcrowdediftheofferacceptancerateisunusuallyhigh,butcanexpectsomeattritionduringtheyear.Additionally.someschools accept large cohorts of students in their early grades, but close off admission to their upper grades,therebyreducingtheerrorintheirenrollmentprojectionsprocess.DCPSneighborhoodschools,however,mustacceptin-boundarystudentsatallgrades,makingtheirenrollmentprojectionsprocessmuchmorecomplicated.WhilelotteryseatsarenotadirectinputinthedevelopmentofDCPSenrollmentprojections;contextually,theyareusedwhenmakingprogrammaticadjustments.
DCPSEnrollmentProjectionMethodology
TheDCPSOfficeofStrategicSchoolPlanningandEnrollmentprojectsOctober5thauditedenrollment foreachDCPSschool.DCPSprojectsenrollmentusingacohort-survivalmethod12withslightlydifferentmethodsforentrygrades andearly childhood grades.Once school-level projections are ready, each school’s principal and LocalSchoolAdvisoryTeam(LSAT)canreviewandproposechanges.
DatausedinDCPSPreliminaryBaselineProjections
DCPS uses OSSE student-level data from DCPS schools to produce their school by grade cohort history andpreliminarybaselineprojections.Thedataincludestheirdemographic,age,address,school,gradelevel,atrisk,specialeducation,andEnglishlanguagelearnerstatus.WhenOPdoesagelevelprojections,theydoapresentationtoDCPStohelpthemunderstandhowtheymayimpacttheirenrollments.
CohortMethodForeachschool’snon-entrylevelgrades(1st,2nd,3rd,4th,5th,7th,8th,10th,11th,and12th)DCPSfirstaveragesthechangeofclasssizesfromonegradetothenextoverthepastfouryearsofOctober5thenrollments13.Thisfour-yearaverageiscalledthe“cohortsurvivalratio”,meaningtheaveragepercentageofaschool’sgrade-levelcohortthatstayenrolledforthenextyear’senrollmentauditinOctober.
DCPSmultipliesthenumberofstudentsinthecurrentcohortagainsttheaveragecohortsurvivalratiotoprojectnext-yearenrollment.Iftheresultingprojectioncomesoutasafraction,thedecisiontoroundupordownisbasedonwhetherthemostrecentyear’senrollmentshowsanupwardordownwardtrendincohortsurvival.
EntryGradesEnrollmentProjections
For each school’s entry level grades (Kindergarten, 6th and 9th), DCPS projects next-year enrollment using acombinationofcohortsurvivalmethodforKindergarten,averagefeederpatternretention,averagenumberofnew in-boundarystudents,andaveragenumberofout-of-boundaryenrollmentsusinga3-yearaverage.SixthgradeisnottreatedasanentrylevelgradeineducationcampusesservingPK3through8thgrade.
EarlyChildhoodEnrollmentProjectionsDCPSgenerallyprojectstofillallavailablepre-kindergartenspaces.ThenumberofPK3seatsmadeavailableisdeterminedbasedontheavailabilityofearlychildhoodclassroomsandthepercentofPK3seatsacceptedinthelottery over the past three years. Early childhood classrooms are required to be on the first floor and have

42
bathroomsadjacentorimmediatelyintheclassrooms14.AlthoughDistrictofficialsareproudofanear-universalpre-kprogram,thereisnostatutoryrequirementtoserveall3and4-year-oldsortoprovidePK3andPK4atastudent’sin-boundaryelementaryschoolandDCPSdoesnotmeetthecurrentin-boundarystudentdemandinsomeneighborhoods.AsofMarch30th,2018,therewere772PK3applicantsand1,336PK4applicantsthatdidnotreceiveamatchanywhereintheMySchoolDClotteryincluding419PK3applicantsand514PK4applicantswaitlistedattheirin-boundaryDCPSschool15.
Figure16DataSource:MySchoolDCLotteryasof3/30/18
ThroughitsEarlyActionprograminSY2017/18,however,DCPSofferedguaranteedPKaccessforfamilieslivingin-boundaryfornineteenelementaryandeducationcampusesinWards4,5,6,7and816.
DCPSestimatestheirPK4seatsbyassumingtheywillretainallPK3students(ifitwasoffered)andexpandsthePK3enrollmentbasedonthehistoriccaptureofPK4studentsandthenumberofclassroomsavailable.
Eachschool’searlychildhoodeducation(PK3andPK4)projectionsareboundbyD.C.MunicipalRegulationsforeligiblefacilityspaceandmaximumclasssizesbasedonnationalstandardsforhigh-qualitypre-kprograms17:
• PK3classesmaynotexceed16students• PK4classesmaynotexceed20students• Mixed-ageclasses(PK3andPK4)maynotexceed17students
SubgroupProjections
EnrollmentofEnglishLearnerandSpecialEducationsubgroupsareprojectedbyDCPSatthesametimeasGeneral-EducationenrollmentandsharedwithPrincipalsandthenfinalizedtogetherwiththebyschool,bygradeGeneral-Educationprojections.EnglishLearnerprojectionsarecreatedinconjunctionwith theDCPSOfficeofStrategicSchoolPlanningandtheLanguageAcquisitionDivision.SpecialEducationLevelsareprojectedbytheDivisionforSpecializedInstruction.

43
AdjustmentstoCohortEstimates
Historicalcohortmodelswillonlyaccuratelyprojectattheschoolbygradelevelwhenenrollmentisstable.Duetochangesindemandandsupply,attheschoolandgradelevels,DCPSusesasystemofcentralofficeandthenschoollevelreview,includinggradeconfigurationsubtotals,toimprovetheaccuracyofitsprojections.
DCPSCentralOfficeReview
After compiling grade-level and subgroup enrollment projections, theOffice of Strategic School Planning andEnrollmentreviewsandadjustsprojectionsbasedonseveralcriteriaoutlinedintheDCPSbudgetdevelopmentguide,including:
• Schoolspecificprogrammingchanges• Gradeconfigurationchanges• Neworexpandedprogramming• Temporaryorpermanentlocationchanges• Otherplace-basedcircumstances18
There are no written procedures for how DCPS central office staff make the adjustments to grade-level orsubgroupenrollmentprojections. However, theDCPSOfficeofStrategicSchoolPlanningandEnrollmentusesdistrict-widegradeleveltotalstohelpevaluatethebaselineprojectionsofindividualschools,whichtheyadjustpriortopostinginthewebportal.Adjustmentsdonebeforeengagingthelocalschoolsmayberelatedtofacilitycapacity,suchasaddingenrollment ifanewearlychildhoodclassroomisaddedorreducingenrollment if theschoolisbeingrelocatedintoswingspacewhichhaslowercapacity,orincreasingenrollmentfollowingaschoolmodernizationthatincreasedschoolsize.
DCPSPrincipalPetitions
Principalsreviewandproposechangestotheirschool’srevisedenrollmentprojectionsthroughanonlineportal.Inarecentimprovement,theLocalSchoolAdvisoryTeam(LSAT)chairpersons19canalsoviewtheschoolprojectedenrollments.Inthisweb-basedportal,theprincipalsseetheirprojection,aswellasthehistoricaltrends,informingeachgrade-level’sspecificcounts.Principalsmaypetitiontoadjusttheirprojectionsandmustsubmitawrittenjustificationfortheirproposedchanges.TheDCPSOfficeofStrategicSchoolPlanningandEnrollmentreviewtheprincipal petitions and justifications and provides the final school-level projection, alongwith a central officeresponsetoanyprincipalpetitions,areincludedintheonlineportal.Inconsideringtheprincipalpetitions,DCPSusestheirdistrict-widegradeleveltotalstohelpevaluatewhetherspecificpetitionsshouldbegrantedornot.
Afterthisreviewprocess,theDCPSOfficeofStrategicSchoolPlanningandEnrollmentpresentsitsfinalprojectionstotheDMEforcertification.
Mid-YearEnrollmentAdjustment
Aftertheprincipalreviewprocess,theDCPSOfficeofStrategicSchoolPlanningandEnrollmentpresentsitsschool-levelprojectionstotheDCPSOfficeoftheChiefBusinessOfficer(CBO).TheenrollmentprojectionsforDCPSaredevelopedbasedontheindividualschool,bygrade,andbysub-groups.TheDistrictofColumbia’sfinalUPSFFLEA
44
levelprojectionstypicallyincludesa2%increasebecauseDCPSisthesystemofrightintheDistrictofColumbia.and,itsenrollmenttypicallygoesupaftertheOctober5thenrollmentaudit.20
DCPSDMEReviewTheOfficeof theDeputyMayor forEducationreviewsDCPSprojectionsandhas theauthority toadjustDCPSprojections.Aftercertifyingtheprojections,theDMEsubmitstheDCPSenrollmentprojectionstotheOfficeofthe City Administrator’s Office of Budget and PerformanceManagement for use in the fiscal year educationbudget.
ProjectingPublicCharterSchoolEnrollment
D.C.CoderequiresthateachpubliccharterschoolLocalEducationAgency(LEA)submitpreliminaryprojectionsfornext-yearenrollmenttotheircharteringauthority21.EachcharterLEAdevelopsseparateprojectionsfortheirnext-yearenrollmentbyschool,bygradeandsub-groups,whichtheysubmittotheD.C.PublicCharterSchoolBoard(PCSB)byDecemberofeachyear.
DatausedinPCSProjections
ThedataprovidedbyPCSBtoPCSLEAsisOSSEauditedschoolenrollmentdataattheschoolbygradelevel,whichincludesschoolbygradespecialpopulationdata,aswell.AlthoughthePCSBdoesnotprovidethePCSLEAsanestimateoftheirprojectedenrollmentbasedonanhistoricalcohortmodel,itdoesprovidethemwith:
• currentschoolyear’sfinalenrollmentprojectionforeachschool• actualenrollmentsfromtheprevioustwoschoolyears• the“cohortattritionrate”representingthechangeinthenumberofstudentsenrolledinthegradeduring
thelastfinishedacademicyear,ascomparedtoonegradeearliertheyearbefore• the“within-yearattritionrate”meaningthechangeinenrollmentduringthelastfinishedacademicyear
forthegroupbetweentheauditandtheperiod
LEAProcess
PubliccharterLEAsuseacohort-survivalmethodtoprojecttheirnext-yearenrollment,accordingtointerviewswithmultiplecharterLEArepresentatives.Theyadjusttheirprojectionsbasedonprogramandgradechanges,enrollmentceiling(scheduleI)changes,buildingcapacity,andwait-listsize.
ThePCSBreviews,adjusts,andcompileseachcharterLEA’snext-yearprojections.CharterLEAsreceivefundingbasedontheircurrentyearenrollmentandarefundedforenrollmentandaddedweightsforsubgroups(specialeducation,atrisk,orELLstudents),iftheyhavemorethantheyprojectedfortheirOctoberofficialcountday.
PCSBCollectionviatheHUB
EachDecember, charterLEAssubmit theirnext-yearenrollmentprojections toPCSBusing theHUB,anonlineportalforLEAdatamanagers,managedbyPCSB.

45
PCSDMEReview
TheOfficeoftheDeputyMayorforEducation(DME),reviewsthepreliminaryprojectionsofthecharterLEAs.TheDMEreviewseachsubmittedprojectionandflagsanyLEAsthatsubmitaprojectedOctoberenrollmentgrowthof2%ormorecomparedtotheirpreviousauditedenrollment22.Flaggedsubmissionsreceiveadditionalscrutiny,andpotentiallyrevisedprojections,basedonthefollowingcriteria:
• Enrollmentceiling• Historyofmeetingtheirprojections• Schoolenrollmenttrendsoverthepast5years• WhetherPCSLEAsareaddingnewschools,grades,newclassrooms• Movinglocations/growingincapacity• Wait-listdata• Historicattritionforeachschool’sgrade
LEAsmaysubmit“finalfeedback”23beforeprojectionsarefinalized.Writtenproceduresforadjustingenrollmentprojectionsarevague,butboththeLEAandDME,whileseekingaccuracy,considerthecharterprojectionsalowerstakes projection than DCPS because the budgeting for the charters is adjusted based on actual Octoberenrollment.
CertificationofEnrollmentProjectionsTheDeputyMayor forEducationcertifies thenext-yearenrollmentprojectionsbefore theygo to theMayor‘sOfficeofBudgetandFinanceforuseinbuildingtheDistrict’sbudget. InarecentmemofromtheDeputyMayorfor Education, on DC PCS SY19-20 Enrollment Projections Timeline for FY20 Budget Development, the DMEinformedtheDCPSandcharterLEAsthattheenrollmentprocessistobemovedforwardbynearly6weeks.24
WhileitappearsthattheprocessesdescribedforDCPSandPCSLEAsconstituteadegreeofduediligencebyLEAs,PCSB,andDME,toensureaccurateprojections,thereisnodefined,publishedandaccessiblechecklistorcriteriathatareusedtocertifytheworkthathasbeendone.TheabsenceofwrittenpoliciesandproceduresandtheopaquenatureoftheoversightandapprovalprocessmaybeissuesthatDistrictpolicymakerswillwanttoaddress.
CouncilReview
TheCounciloftheDistrictofColumbiahasfinalauthorityovertheDistrict’sannualbudget.FollowingtheDMEcertificationprocess,theMayorsubmitsallnext-yearenrollmentprojectionsinMarchaspartoftheproposedbudget.TheCouncilCommitteeonEducationhearspublictestimonyandmayadjustnext-yearprojectionsforDCPSorthepubliccharterschoolsector.IntheFiscalYear2018budget,theCommitteeonEducationreducedtheprojectednumberofstudentswithdisabilitiesinthepublicchartersectorby110totalstudentsacrossallfourlevelsofIEP:Level1wasreducedby11students,Level2reducedby27,Level3reducedby36students,andLevel4wasreducedby36students25.OCFOdistributedtheseadjustmentstothetwolargestcharterLEAs,KIPPDCandFriendshippubliccharterschools,forthemtoabsorb.26

46
KeyFindings
CurrentlytheLEAsandtheDMElackdetaileddocumentationonformulas,adjustments,andcertificationsmadein theenrollmentprojectionsprocess. While it is not recommended that certified enrollmentprojectionsbechanged,ifD.C.Councilexercisestheauthorityofpost-certificationchanges,detaileddocumentationshouldberecorded.Thisinformationisimportantinimprovingenrollmentprojectionaccuracyandtransparencyovertime.
The use of the projection portal byDCPS and theHUB by PCSB provide helpful and efficient communicationbetweenDCPScentralofficeand local schoolsandcharterLEAs. If theportalwereexpanded to includedatainputs such as live birth data, housing data, historical and projection enrollments, and charter and DCPSenrollmentandfacilityplans,thenacataloguedlongitudinaldatasetcouldbesharedbetweeneachLEAleadingtoanimproveddatadrivenanddocumentedenrollmentprojectionsprocess.
Enrollmentprojectionsfor10yearsbyyear,bygradeprovideaconsistentplatformthatcanbereadilyusedforbudgeting(nextyearprojections)andfacilitiescapitalplanning(5-and10-yearprojections).

47
1MasterFacilityPlansweredonein1995,1997,2000,2006,2008,2010,2013,andDMEisresponsibleforproducinga2018planbyAugust2018.2D.C.Forecasts,OfficeofPlanningStateDataCenter:https://planning.dc.gov/node/12129663DMEMemotoCharterLEALeaders,June22,2017:https://dme.dc.gov/sites/default/files/dc/sites/dme/publication/attachments/2017-18%20UPSFF%20Payment%20Letter.pdf4D.C.Code§38-2911(c):https://code.dccouncil.us/dc/council/code/sections/38-2911.html5D.C.Code§38-2905:https://code.dccouncil.us/dc/council/code/sections/38-2905.html6DCPSfundedonprojection,DCpubliccharterschoolsQ1onprojected,Q2/3unverified,Q4onaudited7AtRiskDefinedinDCCode§38-2901(2A):https://code.dccouncil.us/dc/council/code/sections/38-2901.html8D.C.Code§38-2908(c):https://code.dccouncil.us/dc/council/code/sections/38-2908.html9D.C.Code§38-2908(2-3):https://code.dccouncil.us/dc/council/code/sections/38-2908.html10June22,2017MemotoCharterLEALeadersfromJennieNiles,DeputyMayorforEducation:https://osse.dc.gov/sites/default/files/dc/sites/osse/publication/attachments/2017-18%20UPSFF%20Payment%20Letter.pdf11Yang,Rui,etal.“MySchoolDCLotteryProgramEvaluationofSchoolYear2017-18”AmericanInstitutesforResearch.May2018,page16.12DCPSFY19SchoolBudgetDevelopmentGuide,pg.7:http://www.dcpsschoolbudgetguide.com/fy19_budget_guide.pdf13DCPSusesunauditedenrollmentforthecurrentschoolyearbecauseOSSEdoesnotreleaseverifiedauditedenrollmentsforthecurrentschoolyearuntilthespring.Enrollmentsforthepreviousthreeyearsareaudited.14OSSERegulationsonLicensingofChildDevelopmentFacilities:https://osse.dc.gov/sites/default/files/dc/sites/osse/publication/attachments/Final%20Rulemaking%20for%20the%20Licensing%20of%20Child%20Development%20Facilities.pdf15MySchoolDCCommonLotteryResults,March30,2018:http://enrolldcps.dc.gov/node/6116https://enrolldcps.dc.gov/sites/dcpsenrollment/files/page_content/attachments/Generic%20Early%20Action%20Flyer%202017-18.pdf17D.C.MunicipalRegulations5-A1§121:https://dcregs.dc.gov/Common/DCMR/RuleDetail.aspx?RuleId=R0020779NationalInstituteforEarlyEducationResearchwww.nieer.org18DCPSFY19SchoolBudgetDevelopmentGuide,pg.8:http://www.dcpsschoolbudgetguide.com/fy19_budget_guide.pdf19LSATchairpeoplecanseeprojectionsthroughtheonlineportalbutcannotmaketheirownadjustments.20DeputyMayorforEducation,“ResponsestoFY19BudgetOversightFollow-upQuestions”,May1,2018.21D.C.Code§38-2906(e):https://code.dccouncil.us/dc/council/code/sections/38-2906.html22DMEsubmitteddocumentationentitled“PublicCharterEnrollmentProjectionMethodology”.23Ibid.24Smith,Ahnna.“DCPCSSY19-20EnrollmentProjectionsTimelineforFY20BudgetDevelopment”.July31,2018.25DCCouncilCommitteeonEducation,“ReportandRecommendationsoftheCommitteeonEducationontheFiscalYear2018BudgetforAgenciesunderitsPurview”,May18,2017,pg.65:http://dccouncil.us/files/user_uploads/budget/Marked-up_Committee_on_Education_FY18_Budget_Report.pdf26FinalFY18PCSProjectionsbyCampusandLEA–withCounciladjustmentexplainertab.

48
Section5:TestingandDevelopingMethodsforD.C.ThefollowingstudieswereconductedtotestanddeveloprecommendationsforanenrollmentprojectionprocessandmethodologyfortheDistrictofColumbia.
• AccuracyofCurrentProjections–theaccuracyofnextyearprojectionsbyschoolandgradedevelopedusingcurrentprocessesandmethodsusedforbudgetingandstaffingwereevaluated
• Blind Study of Enrollment Projections - enrollment was projected using a traditional cohort survivalmethod,andthencomparedtheprojectionstoactualenrollmentsbydistrict,sector,grade-levels,andschool
• StudentMobilityinD.C.PublicandPublicCharterSchools-asafunctionofgrossmobilitywasanalyzed• WhatMattersMost:FactorsAffectingProjectionAccuracy-howneighborhoodandschoolcharacteristics
correlatedwiththeaccuracyof1-yearenrollmentprojectionsconductedbyastandardcohortprojectionmodel,forthecaseofDistrictofColumbiapublicandcharterschoolsforschoolyear2017-18.
AccuracyofCurrentProjectionsOne-YearComparisonofAuditedtoProjectedEnrollment
Theanalysisoftheaccuracyof1-yearenrollmentprojectionsfromDCPSutilizestwocommonstatisticalmeasuresforcomparingprojectedtoactual(audited)enrollments–theMeanAbsolutePercentageError(MAPE)andtheratioofprojectiontoenrollment (P/E). Eachcomparisonsummarizeseachmeasureforanalysesofaggregatetotals,thenbyWard,byyear,bygradelevel,andbyindividualschool.Thecomparisonwascompletedfortheschoolyears2013-2014through2017-2018;andPCSSchoolsforschoolyears2016-17and2017-18.
KeytakeawaysfromtheDCPSanalysisincludethefollowing:
Ø Themagnitudeofprojectionerrorsvariesbyward,year,andgrade.
Ø Thedirectionofprojectionerrors(toolowortoohigh)alsovariesbyward,year,andgrade,inwaysthatoftendonotcorrespondtothemagnitudeoftheerrors.
Thisresearchalsoanalyzestheaccuracyof1-yearenrollmentprojectionsfromPCSSchoolsforschoolyears2016-17and2017-18.Onlyoneyearofprojectionswerecomparedasschool-leveldatawasonlyavailableforthe2016-17schoolyear.
KeytakeawaysfromthePCSanalysisincludethefollowing:
Ø PCS schools had about the same absolute projection errors across wards and showed reductions inprojectionerrorfromthe2016-17tothe2017-18schoolyears.
Ø PCSschoolsproducedprojectionsthatskewedhighinthe2017-18schoolyear.

49
MeanAbsolutePercentError(MAPE)
BasicInformation
TheMeanAbsolutePercentError(MAPE)isastandardmeasureoftheaccuracyofprojections.UsingtermsforprojectedenrollmentEpandauditedenrollmentEa.,MAPEcanbedefinedbytheequationbelow:
𝑀𝑀𝑀𝑀𝑀𝑀𝑀𝑀 =𝑀𝑀& − 𝑀𝑀(𝑀𝑀(
− 1 ∗ 100%
MAPE has the property of treating positive errors the same as negative errors – counting both equally asdeviationsfromthedesiredoutcomeofazeropercenterror.ItisthestandardusedbytheNationalCenterforEducationStatisticstoevaluatetheaccuracyofitspastenrollmentprojections(HussarandBailey2017).
ResultsforDCPSSchools
ForthetotalsampleofallobservedDCPSschoolsforSY2013-14throughSY2017-18,theMAPEhasavalueof5.0%.Inotherwords,foragivenschoolatagivenyear,anaverageenrollmentprojectionproducedbytheDCPSmethodsandprocessmissedtheauditedprojectionbyabout5%highor5%low.Someschoolshadprojectionsclosertotheactualenrollments,andotherschoolshadprojectionsfartherfromtheactualenrollments.
*Notethatallstatisticalanalysisresultsdonot includeCHOICEAcademyatEmeryandtheIncarceratedYouthProgrambecauseoftheirsmallenrollmentsanduniquecharacteristics,thoughtheirprojectionandenrollmentcharacteristicsarelistedwithotherschoolsinAppendixC.
MAPEResultsOverviewThe top section of the following table summarizes values for the Mean Absolute Percent Error for 1-YearprojectionsbyDCPSfortheschoolyearsSY2013-14toSY2017-18.Thetablebelowprovidesinformationaboutthenumbersofobservationsinthesamples,expressedinthenumberofschoolsobservedtimesthenumberofyearseachschoolwasobserved.Fiveschoolyearswereassessed,butsomesamplesizesarenotmultiplesof5becausesomeschoolsdidnothaveprojectiondataand/ordidnotexistforall5years.MAPEvalueswereweightedbytheauditedenrollments.
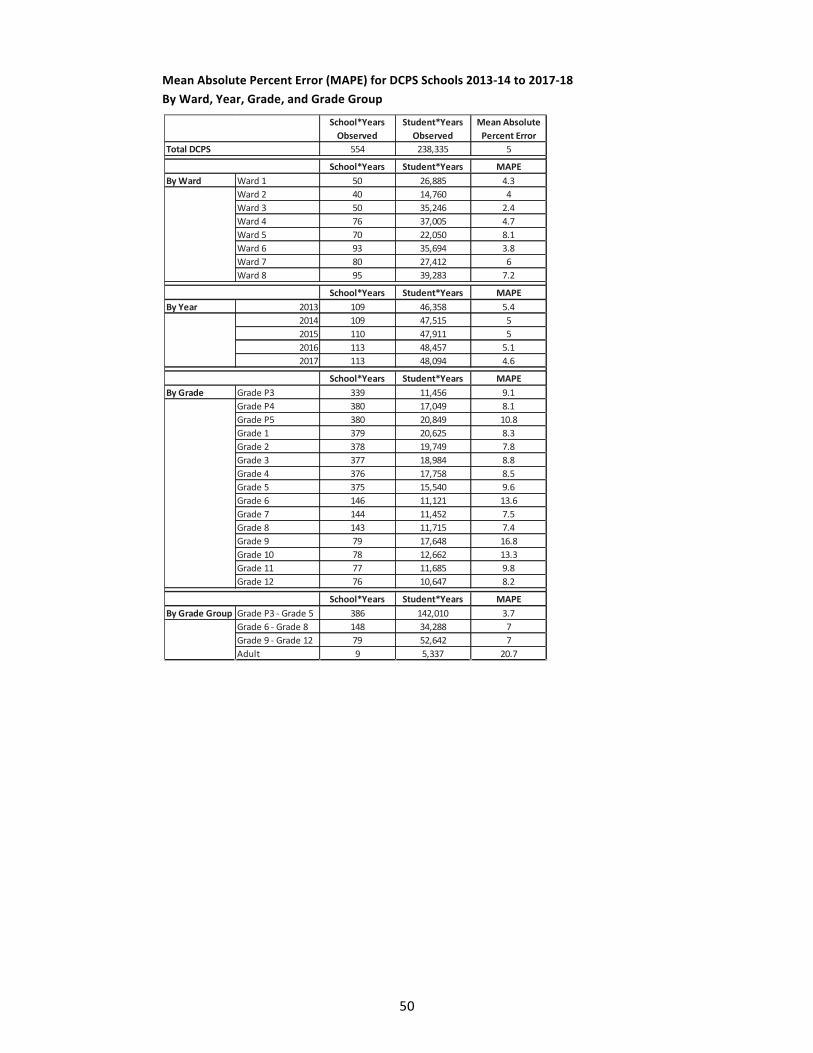
50
MeanAbsolutePercentError(MAPE)forDCPSSchools2013-14to2017-18ByWard,Year,Grade,andGradeGroup
School*YearsObserved
Student*YearsObserved
MeanAbsolutePercentError
554 238,335 5
School*Years Student*Years MAPEByWard Ward1 50 26,885 4.3
Ward2 40 14,760 4Ward3 50 35,246 2.4Ward4 76 37,005 4.7Ward5 70 22,050 8.1Ward6 93 35,694 3.8Ward7 80 27,412 6Ward8 95 39,283 7.2
School*Years Student*Years MAPEByYear 2013 109 46,358 5.4
2014 109 47,515 52015 110 47,911 52016 113 48,457 5.12017 113 48,094 4.6
School*Years Student*Years MAPEByGrade GradeP3 339 11,456 9.1
GradeP4 380 17,049 8.1GradeP5 380 20,849 10.8Grade1 379 20,625 8.3Grade2 378 19,749 7.8Grade3 377 18,984 8.8Grade4 376 17,758 8.5Grade5 375 15,540 9.6Grade6 146 11,121 13.6Grade7 144 11,452 7.5Grade8 143 11,715 7.4Grade9 79 17,648 16.8Grade10 78 12,662 13.3Grade11 77 11,685 9.8Grade12 76 10,647 8.2
School*Years Student*Years MAPEByGradeGroup GradeP3-Grade5 386 142,010 3.7
Grade6-Grade8 148 34,288 7Grade9-Grade12 79 52,642 7Adult 9 5,337 20.7
TotalDCPS

51
SummaryofResultsforDCPS(MAPE)ResultsbyWardThevaluesofMAPEwerehighestforWards5,8,and7(8.1%,7.2%,and6.0%respectively)andlowestforWard3 (2.4%)–meaningprojectionsdeviatedmore fromactualenrollmentsWards5,7,and8and less inWard3.Differencesintheaccuracyofprojectionscandependonanumberoffactors,suchasmigrationrates,variabilityinmovementbetweenpublicandpubliccharterschools,and/ortheeffectivenessofschoolprincipalsandotherofficialsatnegotiatingaccurateenrollmentprojectionsduring theprojectionprocess.Thisdescriptiveanalysiscannotdeterminetherelativeimportanceofthoseprocesses,butourlateranalysisofprojectionerrors intheblindstudyrevisitsthisissueandprovidesevidencethatstudentmobilityfromschooltoschoolisanimportantpartoftheexplanation.ResultsbyYearValuesofMAPEwerehighestin2013-14(5.4%)andlowestin2017-18(4.6%).Inotherwords,theresultsoftheDCPSmethodandprocesshavebeenimprovinginrecentyears,atleastbythisstatisticalmeasure.Thisanalysisisnotabletoestablishwhysuchanimprovementmightbeoccurring.Theimprovementcouldreflectmigrationpatternsorschoolchoicepatterns in2017beingapproximatelythesameastheaverageofpreviousyears,orpossiblyanimprovementintheprojectionprocessitself.ResultsbyGradeValuesofMAPEwerehighestingrades9,6,10,andKindergarten(16.8%,13.6%,13.3%,and10.8%respectively).Errorsinenrollmentprojectionstendtobelargestatthegradelevelswherestudentstypicallytransitionintohighschool,intomiddleschool,andintoelementaryschool.Anotherimportantresultisthattheerrorsatanygivengradeleveltendtoexceedtheerrorsforentireschools,asapercentofenrollment.MAPEsbygradelevelrangefrom7.4% to16.8%,butoverallMAPEs at the school level averageonly 5.0%. This result suggests that errorprocessesaresomewhatindependentforadjacentgrades–thatthefactorsgoverningdeviationsinenrollmentforonegrademaybesomewhatdifferentfromfactorsaffectingadjacentgradesatthesameschool.
ResultsbyGradeGroup
Many DCPS schools have all their grade levels in one of these groups. Other schools, including schools witheducationcampuses,mayhaveenrollmentsinseveralofthesecategories.ValuesofMAPEarebyfarhighestforadultenrollments(20.7%withaverysmallsample)andlowestforelementaryenrollments(3.7%)
TheseresultscorrespondroughlytohistoricalaverageMAPEvaluesforstandardcohort-componentprojectionmethods,asestimatedbytheNCESforD.C.publicschoolenrollmentsdatingbacktoSY1984-85.(6.6%forhighschool,4.3%forPre-Kindergartento8thgrade).ThiscomparisontoNCESdataisuseful inthatitcanprovideasenseoftherelativeunpredictabilityofD.C.enrollmentstopublicschoolenrollmentsinotherstates.NCESresultsshowthatprojectionsofD.C.publicschoolenrollmenthistoricallyhavefarhighererrorratesthanprojectionsforotherstates.Hence,projectionsforindividualschoolscanonlybesoaccurateifprojectionsforallofDCPStypicallyhave large errors, because of the District of Columbia’s unique demographic, economic, and politicalcircumstances.

52
ProjectiontoEnrollmentRatios(P/E)Background
ComparedtotheMeanAbsolutePercentError(MAPE),theratioofProjectiontoEnrollmentisasimplemeasure,butonethatprovidesmoreinformation.TheratioofProjectiontoEnrollmentisshownintheequationbelow:
𝑃𝑃/𝐸𝐸 =𝐸𝐸&𝐸𝐸(
WhereMAPEhasthepropertyoftreatingpositiveerrorsthesameasnegativeerrors,P/Eallowsthereadertodistinguishbetweenerrorswheretheprojectionwastoolow(P/E<1)anderrorswheretheprojectionwastoohigh(P/E>1).
TheabilitytodiscernhigherrorsfromlowerrorshaspracticalsignificancefortheDCPSprojectionprocess.Ifaschool’sresourceallocationisbasedonenrollmentprojections,anerrorwheretheprojectionistoolowmeansthatschoolreceivesfewerresourcesthanitrequiresforitsactualenrollment.Conversely,iftheprojectionistoohigh,suchanerrorisinnocuousormayevenbebeneficialiftheschooldoesn’thavetoreimbursetheextramoney.Suchasymmetricalconsequencesofprojectionerrorshowthatprojectionmethodologiesshouldbeconsiderednotonlyforthetotalmagnitudeoferrorsinenrollmentprojection,butalsofortherelativefrequencyoferrorsthatmisshighorlow.
The table below provides a simple guide for easy interpretation of P/E ratios. Yellow represents errors ofconsequence to the school – errors where the projection is lower than the audited enrollment, so a schoolsupposedlyreceivesfewerresourcesthanitrequires.Grayrepresentsenrollmentprojectionsthatareessentiallycorrect,andbluerepresentserrorswheretheprojectionishigherthantheauditedenrollment,whichimpliesthata better projectionwould have shifted some resources to other schools in theDistrict. As a general rule forvisualizing the magnitude of projection errors, we chose to divide projection/enrollment ratios into sevencategoriestocorrespondtothenumberofstudentsunder-orover-projectedperclassroomof25students.
GuidetointerpretingRatiosofProjectedtoAuditedEnrollmentsWithimpactpresentedinUnitsofStudentsperClass
Projection/EnrollmentRatio Impactper25-StudentClassSize
0.899orless Projectiontoolowby3ormorestudentsperclass
0.900–0.939 Projectiontoolowby2studentsperclass
0.940–0.979 Projectiontoolowby1studentperclass
0.980–1.019 Sameprojectedasenrolled
1.020–1.059 Projectiontoohighby1studentperclass
1.060–1.099 Projectiontoohighby2studentsperclass
1.100ormore Projectiontoohighby3ormorestudentsperclass
Figure17GuidetoInterpretingRatiosofProjectedtoAuditedEnrollments

53
SummaryofResultsDCPS(P/E)
Thefigurebelowshowsthedistributionofprojectiontoenrollmentratiosfor1-YearprojectionsbyDCPSfortheschoolyears2013-14to2017-18.Theresultthatstandsoutisthatcaseswheretheprojectionistoohighfortheenrollment (blue) have outnumbered caseswhere the projection is too low for the enrollment (yellow). Thisasymmetricalpatternsuggeststhatfewschoolsareshortchangedbyunder-projectionsbutthattheallocationofresourcesmightbesomewhatinefficientoverallasaresult.Theavailabledatadonotprovideclearindicationsofwhysuchasymmetry isoccurring. Possiblysomeof theasymmetrycouldbecoming fromtheexistingcohortsurvivalmethodology,school-anddistrict-levelenrollmenttrendsmovingslightlybutsystematicallyawayfromthetrendsofthepreviousfewyears.Itisalsopossiblethatsomeoftheasymmetrycouldariseduringthestagesatwhichadjustmentsaremadetothecohortsurvivalprojections,ifthoseprojectionadjustmentstendtooccurmore frequently inonedirection than theother. Whatever the source, the factof asymmetry in enrollmentprojectioninafewhistoricalyearsdoesnotprovethatasymmetrywouldcontinueinthefuture.Hence,policymakersareencouragedtobecognizantofproblemsbothwiththemagnitudeandthedirectionofprojectionserrors, but recommend a primary focus on efforts to reduce the magnitude of projection error. Statisticalprocesses leading to themagnitude of error are fairly well studied, so efforts to improvemethodologies byreducingtheoverallmagnitudeofprojectionerrorare likelytobemorerobustthaneffortstoaddressrecentasymmetryinprojectionerror.Furthermore,iftheoverallmagnitudeofprojectionerrorcanbedecreased,themagnitudeofanyasymmetrywillalsobedecreased.
ResultsbyWard
Wards2,1,and3hadthehighestpercentageofprojectionsthatmatchedauditedenrollments(54.3%,46.8%,and46.4%respectively).Wards5,8,and7hadthelowestpercentage(20%,21.3%,and28.6%respectively).
Thedistributionoflowandhighprojectionerrorsalsovariedbyward:
• Ward 4 hadmore projection errors thatwere too low than too high, but in all otherwards the highprojectionerrorsoutnumberedthelowones.
• InWard5afull22.7%ofprojectionsexceededtheauditedenrollmentsbyaratioof1.1orgreater,anequivalenttothreestudentsmoreprojectedthanenrolledper25-studentclass.
Figure18RatiosofProjectedtoAuditedEnrollmentsforDCPSsSchools2013-14to2017-18

54
• Ward3wasnotable inthatwhileasignificantshareof itsenrollmentprojectionshadsomeerror, theerrorsweresmall,almostneverexceedingonestudenttoohighortoolowper25-studentclass.
Amajorfindingisthatwardsdiffernotonlyintheabsolutemagnitudeoftheirenrollmenterrors,butalsointhesymmetryofthoseerrors.
SeeAppendixC:Figures2Athrough2HshowprojectiontoenrollmentratioscalculatedseparatelyforeachWard.
ResultsbyYear
Results by year ratios of projected to audited enrollments show a trend toward projection errors beingconsistently on the high side. 49.6% of projected school enrollments for SY2017/18 exceeded the actualenrollmentsbyaratioof1.02orgreater.
SeeAppendixC:Figures3Athrough3E
ResultsbyGrade
Ingradeskindergarten,11,and12,theprojectionerrorsareskewedlowoverall.Conversely,ingrades9and10,theprojection errorswereparticularly likely to skewhigh, resulting in projections that significantly exceededactualenrollments.
These results suggest additional concerns to consider in developing models and processes for enrollmentprojections.TheMAPEstatisticsdemonstratedtheenrollmentprojectionsaresubjecttouncertaintyatschooltransitionyearslikegrades6and9,buttheP/Estatisticsalsosuggestthatthecohortsurvivalmethodand/ortheadjustmentprocesshasbeenproducinghigherthanexpectedprojectionsthroughthehighschoolyears.
SeeAppendixC:Figures4Athrough4Oshowtheprojectiontoenrollmentratioscalculatedseparatelyforeachgradelevel.
ResultsbyGradeGroup
Thetendencyforprojectionerrorstoskewhighisevidentattheelementary(PK3to5),middleschool(6to8),andhighschool (9 to12) levels.Adultenrollmentprojections skewed low in thevery smallnumbersof casesobserved.
SeeAppendixC:Figures5Athrough5Dshowsprojectiontoenrollmentratioscalculatedforgroupsofgrades.

55
FindingsforCharterSchools
Thetablebelowshowsmeanabsolutepercenterror (MAPE) forPCSschools,byward,year,grade,andgradegroupofprojectionsandenrollmentsofPublicCharterSchoolsfortheschoolyears2016-17and2017-18only.Forotheryears,projectiondataforPCSschoolswereavailableattheLEAlevelbutnottheschoollevel.
MeanAbsolutePercentError(MAPE)forPCSSchools2016-17to2017-18
EquivalentDCPSMAPE
238 84,884 5.1 5.1
Schools Students PCSMAPE DCPSMAPEByWard Ward1 21 11,040 4 4.3
Ward2 6 2,565 6.7 4Ward3 0 0 0 2.4Ward4 39 11,696 3.6 4.7Ward5 60 21,228 6.9 8.1Ward6 32 9,374 4.6 3.8Ward7 40 13,275 4.1 6Ward8 40 15,706 5.6 7.2
Schools Students PCSMAPE DCPSMAPEByYear 2016 118 41,491 6 5.1
2017 120 43,393 4.3 4.6
Schools Students PCSMAPE DCPSMAPEByGrade GradeP3 115 6,541 14.1 9.1
GradeP4 120 7,088 11.4 8.1GradeP5 113 6,600 12.5 10.8Grade1 109 6,067 8.7 8.3Grade2 108 5,679 9.2 7.8Grade3 105 5,233 8.1 8.8Grade4 94 4,730 8.6 8.5Grade5 96 4,803 11.1 9.6Grade6 94 5,572 11.7 13.6Grade7 91 4,992 9.4 7.5Grade8 87 4,487 9.8 7.4Grade9 46 4,969 25.3 16.8Grade10 41 3,412 12.9 13.3Grade11 38 2,777 9.1 9.8Grade12 37 2,385 11.8 8.2
Schools Students PCSMAPE DCPSMAPEByGradeGroup GradeP3–5 167 46,323 5.7 3.7
Grade6-8 96 15,051 7.7 7Grade9–12 46 13,543 7.9 7Adult 10 7,482 4.1 20.7
TotalPCS
School*Years Student*Years MeanAbsolutePercentError

56
PCSFindingsforMeanAbsolutePercentError(MAPE)
Acrossthetwo-yearcomparison,theMAPEvaluesforPCSschoolswerecomparableinthatthesamegradesthathadhighlevelsofuncertaintyintheirabsoluteerrorsinDCPSschoolsalsohadhighlevelsofuncertaintyinthosegrades inPCSschools.UnlikeDCPSschools,PCSschoolshadaboutthesameabsoluteprojectionerrorsacrosswards.PCSschoolsshowedverystrongreductionsinprojectionerrorfromthe2016-17tothe2017-18schoolyears.
FindingsforProjection/EnrollmentRatios(P/E)
Thefigurebelowshowsdistributionsofprojectiontoenrollmentratios(P/E)forPCSschools.OnepointofinterestisthatPCSschoolsaremuchlikeDCPSschoolsinproducingprojectionsthataremorelikelytoskewhigh(bluecolor)thanlow(yellowcolor).
SeeAppendixC-Figure7,8,and9inbyWard,byGradegroup,andbyYear,respectively
ResultsforbyYearandforIndividualSchools
SeeAppendix C - Table 4 is a table of projection to enrollment ratios for eachDCPS school in each year, forreferencepurposes.
SeeAppendixC-Table5isatableofprojectiontoenrollmentratiosforeachPCSschoolin2016-17andin2017-18,forreferencepurposes.
Figure19RatiosofProjectedtoAuditedEnrollmentsforPSCSchools2016-17to2017-18

57
BlindStudyofEnrollmentProjectionsCooperativeStrategiesconductedaseriesofblindstudyenrollmentprojectionstoevaluatetheaccuracybasedontheapplicationofdifferentprojectionratioswithinthecohortsurvivalmodel.Thequestionposedintheblindstudyis,“Howaccuratearenextyearenrollmentprojectionswhenusingonlythesimplemathematicalmodelthatappliesa standard setofprojection ratiosbasedonhistoricDCPSandPCS school-leveldataand survivalratios?”
A survival ratio is defined as the percentage of students that progress from grade to grade, year to year. Aprojectionratioisthefactorthatisappliedtothehistoricalenrollmenttocalculateprojectedenrollment.Inthisstudy,projectionratioswerecalculatedbyapplyingdifferentaveragesofhistoricalsurvivalratios.
Thisexercisewasconductedusingtwodifferenttimeperiodsofhistoricalenrollmentdata,2008-09through2015-16and2008-09through2016-17.Duetoextensiveboundarychangesimplementedinthe2014-15schoolyear,theprojectionratiosusedintheblindstudywerelimitedtotwoandthreeyearsofhistoricalsurvivalratios.
Theprojectionratiosusedintheblindstudiesaredescribedbelow.
ProjectionRatiosUsed Description
2-YearSimpleAverage Simple average of the most recent two years of survival ratios byschoolbygrade.
2-YearWeightedAverage
Weightedaverageofthelasttwoyearsofsurvivalratios,byschoolbygrade. The previous years’ ratiowill have higher influence on theprojectionratio.
Weights exponentially decay from 1 (at the most recent year ofavailabledata)to0.05(atthefirstyearofavailabledataoroneyearsbeforethemostrecentyearofdata,whicheverislarger).
3-YearSimpleAverage Simpleaverageof themost recent threeyearsof survival ratiosbyschoolbygrade.
3-YearWeightedAverage
Weightedaverageofthelastthreeyearsofsurvivalratiosbyschoolbygrade.Thelastyears’ratiowillhavethehighestinfluenceontheprojectionratio,thenthenextyearprior,andsoon.
Weights exponentially decay from 1 (at the most recent year ofavailabledata)to0.05(atthefirstyearofavailabledataortwoyearsbeforethemostrecentyearofdata,whicheverislarger).
The intent of this exercisewas to compare the output fromeach set of enrollment projections to the actualauditedenrollmenttodeterminewhichprojectionratiosyieldsthegreatestnumberofschoolsmostaccurately.It should be noted that one single approach regarding which projection ratios to use may not be the bestapplicationforeachschoolandmayfluctuatefromyeartoyear.Forexample,ifaboundarychangeoccurs2yearspriortothedevelopmentofenrollmentprojections,usingprojectionratiosformorethan2yearswouldnotlikelybeappropriate.Inthiscase,a2yearsimpleaverageor2yearweightedaveragewouldlikelybemoreappropriate.

58
Forallblindstudyprojections,allschoolswereprojectedassumingtheirmostrecentgradeconfigurationinthehistoricaldataused.Forexample,ifin2016-17aschoolhadagradeconfigurationofkindergartenthrough4th,the projectionwould reflect kindergarten through 4th, but the actual enrollment for comparisonmay reflectkindergartenthrough5th.
ThechartsbelowcompareeachoftheprojectionsforDCPSandPCSschoolsindependently.Thenumbersandbars in each chart correspond to the number of schools projected that were closest to the actual auditedenrollmentforeachprojectiontype.ThisshowsthatforDCPS,the3-yearsimpleaverageresultedinmoreschools(35)closertotheactualauditedenrollmentthanallotherprojections.ForPCS,the2-yearweightedresultedinmoreschools(36)closertotheactualauditedenrollmentthanallotherprojections.
Figure20NumberofDCPSSchoolsProjectedClosesttotheActualAuditedEnrollmentforEachProjectionType
3127
20 20
35
14
0
5
10
15
20
25
30
35
40
2YearSimple2016-
17
2YearSimple2017-
18
2YearWeighted2016-17
2YearWeighted2017-18
3YearSimple2017-
18
3YearWeighted2017-18
DCPS
3133 32
36 35
24
0
5
10
15
20
25
30
35
40
2YearSimple2016-
17
2YearSimple2017-
18
2YearWeighted2016-17
2YearWeighted2017-18
3YearSimple2017-
18
3YearWeighted2017-18
PCS
Figure21NumberofPCSSchoolsProjectedClosesttotheActualAuditedEnrollmentforEachProjectionType

59
BecausePCSschoolsyieldedasimilarnumberofschoolsmoreaccuratewith36usingthe2-yearweightedand35usingthe3yearsimple,adeeperanalysisofthenetandabsoluteerrorofallschoolsprojectsthatthe2-yearweightedprojectionyieldslesserror.ThetablebelowillustratesthepercenterrorforthetwomodelsforPCSschools.
PCSErrorAnalysisProjectionModel NetProjectionError AbsoluteProjectionError2YearWeightedAverage -4% 12%3YearSimpleAverage 7% 22%
Basedonthisinformation,thebaselineprojectionsdevelopedforDCPSschoolsarebasedonthe3-yearsimpleaverageofsurvivalratiosandtheprojectionsforPCSschoolsarebasedonthe2-yearweightedaverageofsurvivalratios.

60
StudentMobilityinD.C.PublicandPublicCharterSchools
Alongwithneighborhoodcharacteristics(“demand”factors)andschoolcharacteristics(“supply”factors),studentmobilityisanadditionalcharacteristicofaschoolthatcanaffecthowwellprojectionmethodsmatchprojectedtoactualenrollment.
Standardcohortsurvivalmodelsofenrollmentincorporatenetstudentmobility.Thegradetogradesurvivalratiothatisusedforenrollmentprojectionsisafunctionthatincludesthestudentswhomovedintoaschoolforagivengrade,minusthestudentswhomovedoutoftheschoolafterthepreviousgrade.Thesurvivalratioinherentlycapturesinaggregatetheneteffectsofstudentdropout,studentsbeingheldback,andstudentsskippingoveragrade.
Wedefinestudentmobilityasafunctionofgrossmobility,whichcanbethoughtofastheextenttowhichtheindividualswithinstudentpopulationchangefromyeartoyear,evenifoverallenrollmentremainssteady.Thisformofstudentmobilitywouldbeexpectedtohavesomerelationshiptotheamountofuncertaintyinenrollmentprojections.Ifaschoolhasbeenexperiencing“churn”inthepast,thenfutureenrollmentscouldbelikelytodepartfromthetrajectoryofpastenrollments,subjecttochangesintheratethatstudentsaremovingin,theratethattheyaremovingout,orboth.Incontrast,aschoolwithsmallerlevelsofstudentmobilitycanbeexpectedtohavefutureenrollmentsthataremorestableandeasilypredictedbycohortsurvivalmodels,eveniftheschoolshavehadsimilarprogressionratiosinthepast.
Wedefinestudentmobilityasapropertyofaschoolinthetransitionbetweenadjacentgrades,notofthegradesthemselves.Assuch,studentmobilityisafunctionofthreevalues:
Ø S,thenumberofstudentsenrolledintheschoolatgradeXinyearY,whostayenrolledinthesame
schoolatgradeX+1inyearY+1.Ø I,thenumberofstudentsnotenrolledintheschoolatgradeXinyearY,butwhomoveintotheschool
forenrollmentingradeX+1inyearY+1.Ø O,thenumberofstudentsenrolledintheschoolatgradeXinyearY,butwhomoveoutoftheschool
andarenotenrolledingradeX+1inyearY+1.
In ourdefinition, a student’smovement inor out canoccur as a result of residentialmobility, school choice,dropping out, or any other factor that determines enrollment.We propose the following equation to definestudentmobilityMfromgradeXtoX+1inyearYtoY+1:
M=(O(X,Y)+I(X+1,Y+1))/(S(X+1,Y+1)+O(X,Y)+I(X+1,Y+1))
Underthisdefinition,movementoutandmovementinaredefinedaspositivevalues,sovaluesofMcanrangefrom0to1,with0meaningnoturnover(allthestudentsarestayers)and1meaningcompleteturnover(allthestudentsaremoversinormoversout).

61
Two transitions of concern are the transition from elementary tomiddle school from grade 5 to 6, and thetransitionfrommiddletohighschoolfromgrade8to9.Tocalculatemobilityforthesegradetransitions,weuseDCPS records of official feeder patterns from elementary to middle and from middle to high school. PCSinformationonfeederschoolswasnotavailable.Inlightofthisdatadifficultyandofthepotentialuniquenessofstudentmobilityat these transitions,wehaveproducedandanalyzedallmobility informationundermultipleinclusioncriteria:allgradesPK3–12,gradesK–12,andgradesPK3–12excludingtransitionsfromgrades5–6and8–9.
Wedevelopedseparateinformationon“out”and“in”movement,ofwhichthesumofthosetwovalueswasthetotalmeasurementofchurn(ontheconditionthat“out”ismeasuredatonegradeleveland“in”ismeasuredatthefollowinggradelevel).Aftercomparingresultsfortheseandothermeasures,wedeterminedthattheoverallchurnwasacrucialdeterminantofthemagnitudeofprojectionerror,andthat,furthermore,highlevelsof“churn”werealmostinvariablyacombinationofhighlevelsofstudentsmoving“in”ANDhighlevelsofstudentsmoving“out”.Sensitivitymodelsthatexaminedseparatelyschoolsthatwereexperiencingrapidchangesinenrollment(Where“in”wasmuchhigherorlowerthan“out”)confirmedthatourstoryaboutoverallchurnwasrobusttoselectiontoremovesuchcases
Thetablebelowshowsresultsforsummarystatisticsonstudentmobility,bygradetransition,byyear,byward,andbytypeofschool.WenotethreesignificantfindingsaboutstudentmobilityintheDistrictofColumbiaschools.
1. Studentmobilityhasbeendecreasingoverthelastthreeyears.2. StudentmobilityishighestinWards7and8,andlowestinWard3.3. StudentmobilityishigherforPCSschoolsthanforDCPSschools,onaverage.
MobilityIndexforIndividualSchools
SeeAppendixC-Tables6,7,and8aretablesofmobilityIndicesforeachschoolineachyear(2014–2016),forreferencepurposes.

62
Summary Statistics for Student Mobility in D.C. Schools, SY2014 to SY2017 *Note:DuetoincompletedataonfeederschoolsforthePCSsystem,totalvaluesexcludemobilityfromgrade5to6andfromgrade8to9.
Stay Moveout Movein Mobility
GradeP3–P4 12,493 4,607 8,789 0.517GradeP4–K 13,940 6,976 7,998 0.518GradeK–1 15,221 6,508 5,835 0.448Grade1–2 16,327 4,562 3,874 0.341Grade2–3 15,836 4,218 3,652 0.332Grade3–4 13,774 4,972 4,456 0.406Grade4–5 12,001 5,191 4,869 0.456Grade5-6 3,830 11,088 11,003 0.852Grade6–7 11,375 2,856 2,704 0.328Grade7-8 11,225 2,351 2,234 0.29Grade8–9 2,122 10,643 13,356 0.919Grade9–10 9,930 5,910 2,632 0.462Grade10–11 8,970 3,268 2,718 0.4Grade11–12 8,698 2,701 2,186 0.36Total* 149,790 54,120 51,947 0.415
SY14toSY15* 46,690 19,043 17,778 0.441SY15toSY16* 50,483 17,149 17,101 0.404SY16toSY17* 52,617 17,928 17,068 0.399
Ward1* 13,426 3,935 3,702 0.363Ward2* 2,926 961 892 0.388Ward3* 9,749 1,754 2,866 0.322Ward4* 24,636 6,625 6,669 0.35Ward5* 20,362 7,493 6,863 0.414Ward6* 14,863 5,017 4,479 0.39Ward7* 27,888 11,402 10,479 0.44Ward8* 32,934 15,030 13,520 0.464
PCS* 61,890 26,349 23,489 0.446DCPS* 87,809 27,257 28,458 0.388

63
WhatMattersMost:FactorsAffectingProjectionAccuracy
Theresearchon“whatmattersmost”analyzeshowneighborhoodandschoolcharacteristicscorrelatedwiththeaccuracy of 1-year enrollment projections conducted by a standard cohort projectionmodel, for the case ofDistrictofColumbiapublicandcharterschoolsforschoolyear2017-18.
TheobjectiveofthisresearchwastodeterminehowtheinformationmightbeusedtoinformtheprocessDCPSand PCS use to produce 1-year enrollment projections. The methodology described for assessing howneighborhood and school characteristics were associated with results of a “blind” study compared historicalenrollmentstotheenrollmentsthatwouldhavebeenprojectedbasedonacohortsurvivalmodelusingpreviousyears’data.
Keyfindingsfromthisanalysisincludethefollowing:
Ø ForDCPSschools,thesinglemostimportantcharacteristicthatpredictedprojectionerrorwastheschool’sstudentmobility,orhowmanystudentsenteredandlefttheschoolfromyeartoyear.
Ø ForDCPSschools,someotherneighborhoodandschoolcharacteristicswereassociatedwithprojectionerrors,probablybyinfluencingstudentmobility.
Ø ForPCSschools,thecompletioninthepreviousyearofconstructionthatresultedinashiftinstatedschoolcapacity,wasassociatedwithprojectionerror. Inotherwords,a recent suddenshift in stated schoolcapacitywasassociatedwithprojectionerror– inotherwords, a cohort survivalmodel alone cannotanticipatefutureeffectsofrecentchangesinschoolcapacity.
This research concludes by discussing how these findingsmight be incorporated into the existing process fordevelopingenrollmentprojections.
ObjectivesofthisAnalysis
This study identifies neighborhood and school characteristics that make a standard cohort survival modelparticularly susceptible to projection errors. There are twoways such an analysis could be used to improveprojectionmethodologiesandprocedures.
1.) Identifyadditionalvariablestoincorporateinastatisticalmethodologyforenrollmentprojections2.) Identify characteristics to guide and justify decisions for the human process of adjusting enrollment
projectionsaftertheinitialstatisticalmethodologyisused
Weseethisstudyasbeingprimarilyofuseforthesecondobjective.DCPSandotherschoolsystemsuseastandardcohortsurvivalmethod(describedelsewhereinthisproject)toproducebaselinesetsofenrollmentprojections.

64
MethodsofthisAnalysis
ThisanalysisincludesthefollowingdataforeachDCPSandPCSschool:
• Theoutcomeof interest is thedifferencebetweenactualenrollment in2017-18andtheenrollmentabasiccohortsurvivalmodelwouldhaveprojected,asdescribedinBlindStudyofEnrollmentProjectionsportionofthisreport.
• Theassociationsbetweenblindstudyprojectionerrors,andcharacteristicsoftheneighborhoodsinthehighschoolcatchmentareaofthatschoolwereexplored.ThisinformationcomesfromtheDemandandSupplyFactorsAffectingEnrollmentProjectionssectionofthereport
• Theassociationsbetweenblindstudyprojectionerrorsandthetimingofchangesinschoolcharacteristicssuchasgrosssquarefootage,studentcapacity,andrecentcompletionofrenovation,incaseswheresuchinformationisavailable.ThisinformationcomesfromDemandandSupplyFactorsAffectingEnrollmentProjectionssectionofthisreport
• Theassociationbetweenblindstudyprojectionerrorandthestudentmobilityintoandoutofeachgrade.Foreachgrade,“stayers”aredefinedasstudentswhoattendedtheschool(oritsfeederschools)inthepreviousgradeinthepreviousyearandwhoattendtheschoolinthecurrentgradeinthecurrentyear.“In”studentsmovedintotheschoolinthecurrentyear,and“out”studentsmovedoutoftheschoolfromthepreviousyear,eitherbychangingschoolsorbyleavingschool.ThisinformationcomesfromStudentMobilityinD.C.PublicandPublicCharterSchoolssectionofthereport
• The relationship between blind study projection error and the schools’ racial and ethnic diversity asdefinedbythepercentBlack/AfricanAmerican,percentwhiteandpercentHispanicateachschoolwasexamined.ThisinformationwasbasedonthestudentdatafilesprovidedbyOSSE.
• Therelationshipbetweenblindstudyprojectionerrorandtheschool’sfrequencyofbeingafirstchoiceinthe online school choice application and lottery (plus a control variable for PCS schools that do notparticipateinthelottery)wasexamined.ThisdatawasprovidedbyMySchoolD.C.
Themainanalysisisaseriesofsimpleordinaryleastsquaresregressionsattheschoollevel,performedoneatatimeforeachpotentialexplanatoryvariableand includingcontrols forwhether theschoolserveselementary,middle,orhighschoolstudents.
Ln(projectedenrollment/actualenrollment)=
b0+b1(oneneighborhoodorschoolcharacteristic)+b2(schoolservesmiddleschoolstudents)+b3(schoolserveshighschoolstudents)
Inaddition to theresultsshownhere, setsofsensitivityanalyseswererun foranumberofalternativemodelspecificationsandsamplingframes,suchasthefollowing:
Ø ModelsofothergradegroupsthanthePK3–12usedinthemainanalysis:K–12onlyandgrades1–5,7–8,and10-12only(nofeederschools).
Ø Enrollmentprojectionsbasedonaverageandweightedaveragesofsurvivalratiosforthemostrecent2and3years
Ø Alternativespecificationsforthedependentandindependentvariablesintheanalysis.Ø Multivariatemodels that includegroupsof the independentvariablesestimated together in thesame
model.Ø AcombinedmodelforDCPSandPCSschoolsestimatedtogether.
Theseanalysesshowednosubstantivedifferencefromthefindingsthatfollow.

65
Findings
The table below shows summaries of the coefficients from models for the associations between 2017-18projectionerrorasmeasuredintheblindstudyandthe3-yearaveragevaluesfortheneighborhoodandschoolcharacteristicsthatmighthavearelationshipwithprojectionerror.TheanalysesincluderesultsforDCPSschools(sample size = 113) and PCS schools (sample size = 110). Rather than present the results in their originalcoefficients,standarderrors,andsignificancevalues,wehaveprovidedadescriptionofthenatureoftheresultforcoefficientsthatwerestatisticallysignificant.
AverageNeighborhoodandSchoolCharacteristicsAssociatedwithProjectionErrorinSY2017Basedon3-YearAveragesfrom2014-2016
ForDCPSSchools AssociationwithMagnitudeof
ProjectionErrorsAssociation with Direction ofProjectionErrors
CharacteristicsofHighSchoolCatchmentArea Smalltotalpopulation Greatererror (Some)upwarderrorLower%ofAdultswhoareCollegeGraduates Greatererror (Some)upwarderrorLowmedianhomesaleprices Greatererror (Some)upwarderrorNumberofBuildingPermitsIssued --- --- SchoolandOtherCharacteristics StudentMobility(IntoANDOutofSchool) Greatererror (Some)upwarderrorFeworNoSelectionsasFirstLotteryChoice Greatererror ---ProportionofBlack/AfricanAmericanStudents Greatererror (Some)upwarderrorProportionofHispanic/LatinoStudents --- ---
ForPublicCharterSchoolsCharacteristicsofHighSchoolCatchmentArea --- ---Smalltotalpopulation --- ---Lower%ofAdultswhoareCollegeGraduates --- ---Lowmedianhomesaleprices --- ---NumberofBuildingPermitsIssued --- --- SchoolandOtherCharacteristics StudentMobility(IntoANDOutofSchool) Greatererror (Some)upwarderrorFeworNoSelectionsasFirstLotteryChoice --- ---ProportionofBlack/AfricanAmericanStudents --- ---ProportionofHispanic/LatinoStudents --- ---

66
FortheDCPSschools,threeoftheneighborhoodcharacteristicswereassociatedwithlowerprojectionerrors,atleastwhenconsideredseparately.
• Alargerpopulationinthehighschoolcatchmentarea• Higherproportionofcollegegraduatesintheadultpopulation• Highermedianhomesalevalues
All were associated with “improved” performance by the blind study, in the sense that errors had smallermagnitudeandprojectionswerelesslikelytoexceedactualenrollments.(Onaverage,theblindstudyforDCPSin2017projectedenrollmentsthatwereslightlyhigherthantheactualenrollments.)Conversely,neighborhoodswithsmallerpopulations,lowereducationlevels,andlowermedianhomesalevalueswerenotaswellservedbythebasiccohortsurvivalmodel.
FortheDCPSschools,thefollowingadditionalcharacteristicswerealsoassociatedwithprojectionerrors.
• Higher levels of studentmobility and a higher percentage of Black/African American students in thestudentbodywereassociatedwithalargermagnitudeoferrorinenrollmentprojection,andinprojectionsthatexceededactualenrollments.
• Beingfrequentlypickedasafirstchoiceinthestudentlotterywasassociatedwithasmallermagnitudeofprojectionerror.
Theseresultsforprojectionerrorinourblindstudy–inparticular,ourresultsforstudentmobilityandrace-mighthelpusunderstandsomeofthepatternsinprojectionerrorthathavebeenobservedinactualDCPSprojections.Intheanalysisfromtheblindstudy,thelargemagnitudeoferrorobservedforschoolswithahighproportionofBlack/African American students is largely explained by the fact that DCPS schools with high proportions ofBlack/AfricanAmericanstudentsalsoexperiencehighlevelsofchurn.Itmakessensethatsubstantialmobilityinandoutofschoolsfromeachgradeleveltothenextwouldleadtomoredifficultyinmakingaccurateenrollmentprojections.Differences in studentmobilityacross schoolsmightalsoexplainwhypastDCPSprojectionshaveshown differences in the magnitude of projection error across Wards, with more significant errors inpredominantlyAfrican-AmericanWards5, 7 and8. Differences in studentmobility across schoolsmight alsoexplainwhypastDCPSprojectionshaveshowndifferencesinthemagnitudeofprojectionerroracrossWards.
Please note that these findings come from an analysis of projection error in the blind study of hypotheticalprojections,sotheirimplicationsforactualDCPSprojectionsarenotproven.Someoftheschool-leveldifferencesinerrorsintheactualDCPSprojectionscouldbecausedbydifferencesintheadjustmentprocessthatoccursafterthe initial cohort-component projections are completed. For example, if schools differ systematically in howfrequentlyadjustmentsarerequested,inhowfrequentlyadjustmentsaregranted,and/orinhowfrequentlythegrantedadjustmentsareaccurate,noneofthoseprocesseswouldbedetectableinouranalysisbasedondatafromtheblindstudy.
ThebottomhalfofthetableaboveshowstheresultsofthesamemodelsestimatedforPCSschools.Asisthecasefor DCPS schools, higher levels of student mobility were associated with a larger magnitude of error andprojectionsthatexceededactualenrollmentsinthePCSschools.Otherneighborhoodandschoolcharacteristics,however,showednoclearassociationswithprojectionerror.
The table below shows results from an additional set of analyses. The variables tested for associations withprojection errorwereNOT the average values from2016butwere instead the amount that the 2016 valuesdeviatedfromthe2014-2016average.Theseanalysesweredesignedinresponsetoconcernsthatthestandardcohortsurvivalmodel,byusingaveragedenrollmentinformationfromearlieryears,mightbetoolatetorespondtosuddenrecentchangesintheenrollmentenvironment.

67
Theresultsfromthetablebelowsuggestthatsuddenchangesinschoolandneighborhoodcharacteristicsarenot“missed”byacohortsurvivalmodel,withonepossibleexception. Inthemodels forPCSschools,achange instudentcapacityin2016predictedachangeinenrollmentin2017thatwasNOTanticipatedbythecohortsurvivalmodel.The“changeinstudentcapacity”variableintheDCPSmodelhadsimilarsigns,butthecoefficientsweresmaller than the threshold for statistical significance.Therewasalsoa statistically significant coefficient forasuddenincreaseinstudentmobilityforthePCSschoolsonly,butaclearexplanationforthisresultwasnotfound.Previous-YearShiftsinNeighborhoodandSchoolCharacteristicsAssociatedwithProjectionErrorinSY2017Basedon2016ValuesComparedto3-YearAveragesfrom2014-2016
ForDCPSSchools
AssociationwithMagnitudeofProjectionErrors
Association with Direction ofProjectionErrors
CharacteristicsofHighSchoolCatchmentArea SmallTotalPopulation --- ---Lower%ofAdultswhoareCollegeGraduates --- ---Lowmedianhomesaleprices --- ---NumberofBuildingPermitsIssued --- --- SchoolandOtherCharacteristics StudentMobility(IntoANDOutofSchool) --- ---FeworNoSelectionsasFirstLotteryChoice --- ---ProportionofBlack/AfricanAmericanStudents --- ---ProportionofHispanic/LatinoStudents --- ---GrossSquareFootage --- ---CompletionofBuildingRenovation --- ---SchoolCapacity
ForPublicCharterSchoolsCharacteristicsofHighSchoolCatchmentArea SmallTotalPopulation --- ---Lower%ofAdultswhoareCollegeGraduates --- ---Lowmedianhomesaleprices --- ---NumberofBuildingPermitsIssued --- --- SchoolandOtherCharacteristics StudentMobility(IntoANDOutofSchool) Lesserror ---FeworNoSelectionsasFirstLotteryChoice --- ---ProportionofBlack/AfricanAmericanStudents --- ---ProportionofHispanic/LatinoStudents --- ---GrossSquareFootage --- ---CompletionofBuildingRenovation --- ---SchoolCapacity Greatererror Downwarderror
TheresultsindicatethatforDCPSschools,severalneighborhood,school,andothercharacteristicsmightbeusedtoidentifyschoolsforwhichabaselinecohortsurvivalmodelismoresubjecttoerror.However,theseresultsareestimatedforeachvariableseparately,soitisnotclearhowmanyorwhichofthesevariablesshouldbeusedtoidentifyaschoolasacandidateforprojectionadjustment.
Toturntheseresultsintoasetofpotentialrecommendationsforpersonsinvolvedintheenrollmentprojectionprocess, we looked for empirical or practical evidence for focusing on one variable. Normally, multivariableregressioncouldbeusedasonesourceofevidence,butourmultivariatemodelswithallthevariablestogether

68
containedtoomanyunknownsforclearinterpretationsoftheresults(thatis,thestandarderrorsexpandeduntilnothingwas statistically significant anymore.) As an alternative approach,we examined possible associationsbetweentheneighborhoodandschoolcharacteristicsthatmightsuggestwhetheronevariableismediatingtheothers.
Wefocusedonthestudentmobilityvariable,thecharacteristicwiththeclearestpotentialmechanismformakingprojectionslessaccurate.Iftherearealotofstudentsmovingintoandoutofaschoolfromyeartoyear,thenthere are twodimensions of uncertainty that couldmakeprojections less accurate– variability in howmanystudentsmoveintotheschool,andvariabilityinhowmanystudentsmoveout.Thehypothesisisthatincreasedmobility is the reason that other neighborhood and school characteristics are associated with less accurateprojections.
Forexample,aschoolinaneighborhoodwithlowmedianhomesalevaluesmightexperiencehigherthanaverage“churn”fromyeartoyear,whichtendstoresultinlessaccurateenrollmentprojections.Ifso,thenaprojectionadjustmentbasedonstudentmobilityalonewouldbesufficient,andanadditionaladjustmentforlowmedianhomevalueswouldbeanincorrectover-adjustment.

69
Thetablebelowshowscorrelationcoefficientsbetweenstudentmobilityandtheothervariablesthatshowedasignificantrelationshipwithprojectionerrors.Simplecorrelationresultscannotbeconclusive,buttheseresultsshowanearlyperfectcorrespondence.EachDCPSvariablethatissignificantlyassociatedwithprojectionerrorisalsomoderately correlatedwith studentmobility, and in the predicted direction. Similarly, for PCS schools,studentmobility is a significant predictor of projection error, but none of the other variables are, and thosevariablesarealsonotclearlycorrelatedwithstudentmobility,exceptforacorrelationbetweenpercentblackandmobilitythatissubstantialbutstillsmallerthanthesamecorrelationinDCPSschools.CorrelationsBetweenStudentMobilityandOtherKeyVariablesCharacteristicsAssociatedwithProjectionErrorinDCPSSchoolsareallCorrelatedwithStudentMobility
Howthesefindingsmightbeused
Basedonthefindingsoutlined,wesuggestthattherecouldbevalueingathering,sharing,andusinginformationaboutstudentmobilitytoassistintheprocessofadjustingenrollmentprojectionsfollowingtheinitialbaselineprojectionsdevelopedusingthecohortsurvivalmethod.Schoolswithhighermobilityshouldbeanalyzedmorecloselywhileschoolswithlowmobilityshouldbeleftaloneunlessthereisacompellingreasontoadjust.
ForDCPSSchools
CorrelationwithStudentMobility
AssociationwithProjectionErrorinTableAbove
SmallTotalPopulation -0.19 Significant,Negative
Lower%ofAdultswhoareCollegeGraduates -0.25 Significant,Negative
LowMedianHomeSalePrices -0.28 Significant,Negative
ProportionofBlackorAfricanAmericanStudents 0.49 Significant,Positive
ForPublicCharterSchools
SmallTotalPopulation 0.19 NoSignificantAssociation
Lower%ofAdultswhoareCollegeGraduates 0.12 NoSignificantAssociation
LowMedianHomeSalePrices -0.02 NoSignificantAssociation
ProportionofBlack/AfricanAmericanStudents 0.32 NoSignificantAssociation

70
Section 6: Proposed Process and Methodology for Developing EnrollmentProjectionsbySchool:Based on this study it is recommended that the District of Columbia should develop baseline enrollmentprojectionsbasedonthecohortsurvivalmethodwithadocumentedreviewandapprovalprocessincludingcleardocumentation of any adjustments made to the baseline enrollment projections. Further, an audit of theenrollmentprojectionprocessshouldbeconductedeverythreeyearsbyanoutsideentity.
Today,theOfficeoftheDeputyMayorforEducationhassufficientauthoritytooverseetheschedule,policies,andprocedurestobeusedbyOSSEandLEAsinthisprocess.Whileelementsoftheprocessarecentralized,thereareotherstepsthatmustbeundertakenbytheappropriateagencyoragenciesbasedonexpertiseandauthority.The recommendations presented here are intended to make the overall process more timely, efficient,transparent, and accurate. A centralized datamanagement system allows for the creation of a public portalestablishingtransparentaccesstorelevantdata.Longitudinaldatasetsusedinthisstudyinclude:
• Historical audited enrollment data for 10 years byDCPS and charter school, by grade, andby specialpopulation
• Studentdemographicandspecialpopulationdatawithaddressesfor5years,includingschoolandgrade• Livebirthcountsbyaddressoraggregatedtoelementaryboundaries• DCPSfeederpatterninformation• Grosssquarefootageofschoolfacilities(DCPSandPCS)• Capacityoffacilities(DCPSandPCS)• Enrollmentcapsofcharterschools• FacilityconditionofDCPS• Previousenrollmentprojections
Thefollowingaresuggestedstrategiesforstreamliningdatamanagement:
1. OSSE,asanentityindependentfromDCPSandPCSB,shouldcollect,maintain,andprovidetoLEAsandprivateschoolsinformationonenrollmentofallD.C.residents.
2. LEAsshoulduseonestudent informationsystemhousedinacentralorganization. It isrecommendedthatOSSEhousethecentralstudent informationsystembecause itcurrentlyhousesandmaintainsallenrollmentdatausedinthisstudy.
3. AllD.C.agenciesshouldusealongitudinallyconsistentnomenclatureforschoolnames,schoolIDs,grades,grade assignment, race/ethnicity, and should implement a SPED designation across LEAs and privateschools.
4. AllD.C.agencies,asdetailedbelow,shouldmaintainlongitudinaldatasetsofdemandandsupplyfactorsthat may affect future enrollment through data agreements and protocols with other D.C. agencies,including:
o D.C.DepartmentofHealth–livebirthcountsbyresidence(addressofmother)o D.C.OfficeofPlanning-populationandhousingdata(includingagelevelpopulationprojections
andprojectedresidentialgrowth)o D.C.DepartmentofGeneralServices-FacilitiesConditionReportsfordataonDCPSschoolsiting,
size,condition,enrollmentcapacityandcapitalplans,usingstandarddefinitions.

71
o PublicCharterSchoolBoard-enrollmentceilingsofcharterLEAso CharterLEAs-dataandinformationaboutprograms,andservicesprovided,aswellasdataon
school siting, facility size, condition, enrollment capacity and capital plans, using standarddefinitions
ThefollowingisarecommendedprocessfortheDistrictofColumbiatofollowinthedevelopmentofenrollmentprojections:
Step1:Maintainthemostrecent10yearsofhistoricalenrollmentdata,includingrace,ethnicity,gender,specialeducation,language,address,inalongitudinaldatabaseandcompileitbyschool,LEA,grade,andsubgroupsusingOSSEdesignatedschoolnumbersandnames.Responsibleagency:OSSE
Historicalenrollmentdatausedshouldbefinalauditedenrollmentbyschool,bygrade,asprovidedbyOSSE.Itisimportant that this data comes from the same point in time each year and it is important to note that theprojectionswillprojecttothatsamepointintimeforeachyear.Aminimumof5yearsofhistoricaldatashouldbeanalyzed;however,10yearsofhistoricaldataisideal.Thisdataisusedtocalculatesurvivalratiosfromgradetograde,yeartoyear,toanalyzetrendsforprojectingfutureenrollment.
Step2:Collectthemostrecent15yearsofbirthdatabytheaddressofthemotherfromtheDepartmentofHealthandaggregatethedatabyelementaryattendanceboundary.Responsibleagency:OSSE
Residentlivebirthcounts,bytheaddressofthemother,shouldbeobtainedfromtheDepartmentofHealthtothe smallest geography available. In this study, the data was available by address and aggregated to theelementaryattendanceboundarylevel.Thefirstyearofbirthdatacollectedshouldbe5yearspriortothefirstyearofhistoricalenrollmentdataused. Thebirthdatashouldbeascurrentaspossible. Thisdata isusedtoprojectPK3,PK4,andkindergartenenrollmentbycalculatingthepercentageofstudentsthatappearataschool3,4,and5yearsafterthebirthyear.
Inthisstudy,livebirthcountswereavailablethrough2016andprojectedkindergartenenrollmentthrough2021-22.Forprojectedkindergartenenrollmentafter2021-22,anaverageofthelastthreeyearsoflivebirthcountswasused. Ifprojected livebirthcountsareavailablebasedonthe latestyearofactual livebirthcounts inthefuture,werecommendthatdatabeusedinlieuofa3-yearaverageoflivebirthcountstoprojectPK3,PK4,andkindergartenenrollment.
Step 3: Identify geographic feeder patterns that define the assignment of students from school to school.Responsibleagency:OSSE
Totheextentpossible,feederassignmentsshouldbeusedincalculatingsurvivalratiosoftransitiongrades(i.e.5thto6thgrade).Incaseswherethereisnoassignedfeeder,asystem-widetotalfeedershouldbeapplied.WhilemostDCPSschoolshavegeographicfeedersthatareclean,meaningforexample,100%ofanelementaryschool’sgeographicfeederassignmentistoonemiddleschool,therealityisthatnotnecessarily100%ofthestudentswillactuallyattendtheirgeographicallyassignedmiddleschool.TheymayattendaPCSschool,an“out-of-boundary”DCPSmiddleschool,oraprivateschoolformiddleschool.Thisisnotunusualinschoolsystemsthathaverobustschoolchoiceofferings.Theactualobserveddeviationsfromthegeographicalfeederassignmentsarenaturallycapturedinthehistoricalsurvivalratios.

72
Step4:Calculateacohortsurvivalratioofstudentsfrombirthtokindergartenandgradetograde,yeartoyearforthe10yearsofhistoricaldata.Responsibleagency:OSSE
After compilinghistoricalenrollment, livebirth counts,and feederpatterns, survival ratiosarecalculatedandanalyzed.
Step5:Applytheprojectionratiostoeachgrade,byschool,byyearfortenyears,producingthebaselinenextyear,five-year,andten-yearenrollmentprojectionsbyschool.Responsibleagency:OSSE
Aprojectionratioforeachgradeshouldbedevelopedtobeappliedtoactualenrollmenttocalculatetheprojectedenrollmentateachschool,bygrade,byyear.Inthisstudy,thelast3yearsofsurvivalratioswereaveragedandused as the projection ratio forDCPS schools; and theweighted averageof the last 2 yearswas used as theprojectionratioforPCSschools.ThisisbasedontheresultsoftheBlindStudyofEnrollmentProjectionssectionofthisreport.However,whatisthebestapproachfordeterminingprojectionratiosoneyear,maynotbethebestapproachthefollowingyear.Somefactorsthatshouldbeconsideredwhendeterminingprojectionratiosmayincludewhenboundarychangesoccur,newfacilitiesareopened,schoolclosures,programchanges,etc.
IntheBaselineEnrollmentProjectionsbySchoolsectionprovidedinthisstudy,PK3andPK4enrollmentbyschoolwerekeptflatatthecurrentenrollmentduetoPKspecificclassroomspacelimitations.
Step6:Usingstudent-leveldata,calculatethemobilityindexofstudentsin,studentsoutandstudentsstaying.Responsibleagency:OSSE
Step7:Eachyear,makeavailableonOSSEwebsiteandprovideeachLEAwithnextyearandfive-yearbaselineenrollmentprojections for every school, alongwithhistoric enrollmentdata, survival ratios, livebirth counts,supply data (including but not limited to capacity, square footage, facility condition, enrollment ceiling/caps,school location, program offerings, grade configuration, planned school/program closings and openings, andboundarychanges),demandfactors(includingbutnotlimitedtoresidentialbuildingpermits,lotterydata),andmobility index inan interactiveweb-portal like theDCPSportal currently inuse. Responsibleagencies:OSSE,DCPS,andPCSB
Step8:Developsystem-wideenrollmentprojections(DCPSandPCSschoolscombined)bygrade,byyear,fortenyearstobeusedinternally,toalignpost-baselineadjustedenrollmentprojections.Responsibleagency:OSSE
A larger sample size (i.e., system-wide)enrollmentprojectionswill yieldmoreaccurate results thana smallersamplesize(i.e.,by-school)enrollmentprojections.Therefore,inadditiontobaselineenrollmentprojectionsattheschoollevel,asystem-wideenrollmentprojectionshouldbemadeforthetotalstudentenrollment(DCPSandPCSstudents).Itshouldbenotedthatthesumofschool-levelprojectionswillneverbe100%equaltoaseparateenrollmentprojectiondoneforthetotalstudentpopulation.
IntheSystem-wideEnrollmentProjectionssectionprovidedinthisstudy,PK3andPK4enrollmentwereprojectedbasedonthelastyearofbirthtoPK3andbirthtoPK4survivalratiosprovidingatargetPKenrollmentnumbertoguideby-schoolpost-baselineadjustments.

73
Step9:UsingtheinteractivewebportaldescribedinStep7,DCPSandPCSBreviewsOSSE’sbaselineprojectionbyschoolbygradeandsubgroupandadjuststhenextyearbygradeandbyschoollevelbaselineprojectionsbasedona reviewof informationprovided in thewebportal;withDCPSandPCSBdocumenting the reasons for allrequestedadjustmentsonthewebportal.Responsibleagencies:DCPSandPCSB
DCPSandotherschoolsystemsusevariantsonastandardcohortsurvivalmethodtoproduce5-and10-yearenrollment projections in Master Facilities Plans, and as a baseline step in the process of producing 1-yearenrollmentprojections.Thereisageneralunderstandingthatalthoughthecohortsurvivalmethodhasnoclearsubstituteasafoundationforenrollmentprojections,adjustmentstothebaselineenrollmentprojectionsmaybenecessaryto improvethoseprojections. However,forthetypesof informationcommonlyusedforprojectionadjustments, the standard cohort survival method already has some of this information “baked in” themethodology,whichwouldmakefurtheradjustmentinappropriate.
Knowing what factors might predict high levels of error in the baseline enrollment projections, i.e., whereadjustmentswerelikelytobeneeded,wasexplored.Thebaselineenrollmentprojectionsprovidenoinformationaboutwhich schools it is projectingwithprecision, andwhich schools it is projectingwithahigherdegreeofuncertainty. In response to these concerns, the following recommendations for identifying appropriateadjustmentstomakeandappropriatecircumstancesinwhichtomakethoseadjustments.
Recommended adjustment #1: Identify schools for projection adjustments based on student mobility andchangesinschoolphysicalandadministrativestructure.
Theanalysisofneighborhood(“demand”),school (“supply”),studentmobility,and lottery informationhasledustorecommendasmallsetofoutsidefactorsthatindicateitislikelytobeappropriatetomakeexpertadjustmentstothebaselinecohortsurvivalmethod-basedenrollmentprojections.Theclearestindicatorthatabaselinecohortsurvivalmethod-basedenrollmentprojectionmaybeinsufficient,isthestudentmobilityofagivenschool.Schoolswithhighstudentmobilityhavealotofdifferentstudentsfromonegradetothenext,evenifthesurvivalratioofenrollmentsisfairlyconstant.Intheanalyses,asimplecohortsurvivalmodelprovidedconsistentlyaccurateenrollmentprojectionsforlowmobilityschoolsbuttendedtohavemoreerrorforhighmobilityschools.
AsdescribedintheStudentMobilityinD.C.PublicandPublicCharterSchoolssectionofthisreport,levelsthatconstitute“high”or“lowmobility”canbeevaluatedbasedonthedistributionofobservedstudentmobility.Inthisstudy,mobilityisgenerallydefinedforagivengradebycounting“In”(studentsmovinginforthatgrade),“Out”(studentsmovingoutafterthepreviousgrade),and“Stay”(studentswhostayfromonegradetothenext).Ifmobilityiscalculatedas(“In”+“Out”)/(“In”+“Out”+“Stay”),theningeneral,a school with an overall studentmobility above 0.5 (not counting the transition grades from feederschools)mightbeconsideredahighmobilityschool,andaschoolwithanoverallstudentmobilitybelow0.3mightbeconsideredalowmobilityschool.
Schools with high mobility should receive careful analysis and should be considered for adjustment. A basic cohort survival method-based enrollment projection may be more susceptible to error for such schools. Additionally, the uncertainty of long-term enrollment projections may be increased for high-mobility schools, so adjustments to improve the stability of these projections are recommended. If a school has high mobility one year, it may not in the future or vice versa which is why we note, as Step 6, calculating the mobility index on an annual basis and providing the information in the portal.

74
Conversely,schoolswithlowmobilityshouldonlyhaveadjustmentsmadetothebaselinecohortsurvivalmethod-basedenrollmentprojectionsincaseswherethereisacompellingcaseforsuchanadjustment.For such schools, levels and changes in school and neighborhood characteristics are usually capturedadequately by the cohort survivalmethod, and subsequent adjustments are likely to “double count”factorsthataffectenrollment–onceinthecohortmethod,thenagaininasubsequentadjustment.
Additionalrecommendationsforadjustmentsareasfollows.
• Schoolclosings,consolidations,andopenings,aswellasplannedorrecentlycompletedchangesinschool capacity, for structural or administrative reasons, are appropriate factors for projectionadjustments, as the future effects of these changes appear not to be adequately captured in astandardbaselinecohortsurvivalmodel.
• Differences inneighborhoodorpopulationcharacteristics suchashomevaluesor theeducationalattainment of the population in the school catchment area, should not be used for projectionadjustmentsundermostcircumstances.Thereissomeevidencethatanyrelationshiptoprojectionerror for such characteristics is largely mediated through student mobility so that adjustmentdecisions guided by student mobility are sufficient. Similarly, differences in parents’ lotterypreferencesforschoolsappeartobeassociatedwithstudentmobility.
• There is no evidence, based on the factors of this study, that expected or recent changes inneighborhoodor population characteristics indicate a need for projection adjustments. (Typically,when neighborhoods turn over or new construction occurs, the impact on student enrollment issomewhatgradualandtendstobecapturedinacohortsurvivalmethod.Sincewearerecommendingthat enrollment projections for 10 years be produced annually and reviewed annually, growth ordeclineduetochangesinneighborhoodorpopulationcharacteristicswilllikelybecapturedthereby.)Additional data collection and/or analysis of very long-term projections could possibly uncover arelationshipthathasnotyetbeendemonstrated.
Recommendedadjustment#2:PK3,PK4,Adult,UG,andSPEDUG.
Thebaselineenrollmentprojectionsprovidedinthisstudy,projectedPK3,PK4,Adult,UG,andSPEDUGenrollments, do not follow the cohort survival method but reflects the actual 2017-18 enrollments.Adjustments shouldbemade if data is available to support them. Forexample, if there is aplannedincreaseinPKofferingsatparticularschools,adjustmentsshouldbemadetoincreasePKenrollment.
Step10:DCPSandPCSBsharetheirpreliminaryadjustedprojection(baselineplusadjustmentsanddocumentedrationale)withtheDCPSlocalschoolsandcharterLEAs,whowillbeabletoreviewthepreliminaryprojectionsalongwithalldataprovidedontheinteractivewebportal,including,butnotlimitedtohistoricenrollmentdata,survival ratios, live birth counts, supply data (including but not limited to capacity, square footage, facilitycondition, enrollment ceiling/caps, school location, program offerings, grade configuration, plannedschool/program closings and openings, and boundary changes), demand factors (including but not limited toresidentialbuildingpermits,lotterydata),andmobilityindexandbaselineenrollmentprojectionoftheirschoolandeitherproposedocumentedadjustmentstothepreliminaryadjustedenrollmentprojectionofDCPSandPCSBoraccept thepreliminaryadjustedenrollmentprojection fromtheir LEAcentraloffice. Responsibleagencies:DCPS,PCSB,DCPSschools,CharterLEAs

75
Step11:FollowingthebackandforthbetweenDCPSandlocalschoolsandPCSBandLEAs,DCPSandPCSBsubmittheirfinalnextyearandfive-yearprojectionstotheODME.Responsibleagencies:DCPSandPCSB
Step12:ODMErollsuptheDCPSandPCSBprojectionsfromthefinalschoolandDCPS/PCSBapprovedprojections(Step11)andcomparesthemtoOSSE’sbaseline(Step5)andOSSE’ssystem-wideenrollmentprojections(Step8).Responsibleagency:ODME
Step13:ODMEworkswithDCPSandPCSBtoreconciletheprojectionsbygrade,withtheinternalsystem-wideenrollmentprojections(Step8)—makingsuretheyalignwiththesystem-wideenrollmentprojectionsbygrade,andbysubgroup,bygradedevelopedinStep8asmuchasreasonablypossible.Responsibleagencies:ODME,DCPS,andPCSB
Thefollowingisanexampleofwherethepost-baselineenrollmentprojectionsroll-upbyschool,bygrademaydeviatefromthesystem-wideenrollmentprojections:
PKclassroomcapacityshouldbeakeyconsiderationinjustifyinganyadjustmentstoPKenrollmentprojections.IfchangesinPKpolicyand/orPKcapacityoccurandareaccountedforintheby-schoolpost-baselineenrollmentprojections,thetotalPKenrollmentprojectionsroll-upmayexceedthesystem-widePKenrollmentprojectionsandshouldbedocumentedassuch.
Thetablebelowillustratesasystem-wide(DCPSandPCSstudents)enrollmentprojectionbasedona3-yearsimpleaverageofsurvivalratios.

76
Step14:ODMEcertifiesthenextyearprojectionandprovidescommentsonthefive-yearprojection.Responsibleagency:ODME
Uponcompletionofthebaselineandpost-baselineenrollmentprojections,adocumentedreviewandapprovalprocessshouldbeconductedbytheDME.Allassumptionsandadjustmentsshouldbefullydocumentedbyanypartiesproducingbaselineenrollmentprojectionsormakingschool leveladjustmentsandareavailabletoanyrequestingentityuponrequest.Theroll-upofthepost-baselineenrollmentprojectionsbyschool,bygradeisthefinalenrollmentprojectiontobecertified.It isimportanttonotethatwhiletheseshouldaligntothesystem-wideenrollmentprojectionsdevelopedinStep8asmuchasreasonablypossible,thereareinstancesasdescribedin Step 13 that may justify deviations from the system-wide enrollment projections and should be clearlydocumented.
Step 15: Annual enrollment projection review. Enrollment projections should be compared with the actualauditedenrollment system-wideby grade; andby school, by grade; aswell as for special populations. This isimportantinthecontinuedimprovementoftheenrollmentprojectionprocess.Asdiscrepanciesarefound,itisgoodpractice to try to determine the root of the error so that itmaybe considered in subsequent updates.Responsibleagency:OSSE
ProjectedEnrollment-3YearSimpleAverage-System-wideGrade 2018-19 2019-20 2020-21 2021-22 2022-23 2023-24 2024-25 2025-26 2026-27 2027-28PK3 5,716 5,885 5,761 5,761 5,761 5,761 5,761 5,761 5,761 5,761PK4 7,226 7,269 7,484 7,326 7,326 7,326 7,326 7,326 7,326 7,326K 7,435 7,636 7,682 7,909 7,742 7,742 7,742 7,742 7,742 7,7421 7,205 7,180 7,374 7,418 7,638 7,477 7,477 7,477 7,477 7,4772 6,924 6,926 6,902 7,089 7,131 7,342 7,187 7,187 7,187 7,1873 6,575 6,696 6,698 6,675 6,855 6,897 7,100 6,951 6,951 6,9514 6,354 6,366 6,483 6,485 6,463 6,637 6,677 6,875 6,730 6,7305 6,178 6,235 6,247 6,362 6,364 6,342 6,513 6,552 6,746 6,6046 5,830 5,902 5,957 5,968 6,078 6,080 6,059 6,222 6,259 6,4457 5,134 5,753 5,824 5,878 5,889 5,998 5,999 5,979 6,140 6,1778 4,830 5,058 5,668 5,738 5,791 5,802 5,909 5,911 5,890 6,0499 5,859 6,305 6,603 7,399 7,490 7,559 7,573 7,713 7,715 7,68810 4,297 4,313 4,641 4,860 5,446 5,513 5,564 5,575 5,677 5,67911 4,289 4,040 4,055 4,364 4,570 5,120 5,184 5,232 5,241 5,33812 3,888 4,056 3,821 3,835 4,127 4,321 4,842 4,902 4,947 4,957
Adult 4,951 4,951 4,951 4,951 4,951 4,951 4,951 4,951 4,951 4,951UG 141 141 141 141 141 141 141 141 141 141
SPEDUG 384 384 384 384 384 384 384 384 384 384GrandTotal 93,216 95,096 96,676 98,543 100,147 101,393 102,389 102,881 103,265 103,587
Source:CooperativeStrategies
ProjectedEnrollment-3YearSimpleAverage-System-wideGrade 2018-19 2019-20 2020-21 2021-22 2022-23 2023-24 2024-25 2025-26 2026-27 2027-28PK 12,942 13,154 13,245 13,087 13,087 13,087 13,087 13,087 13,087 13,087K-5 40,671 41,039 41,386 41,938 42,193 42,437 42,696 42,784 42,833 42,6916-8 15,794 16,713 17,449 17,584 17,758 17,880 17,967 18,112 18,289 18,6719-12 18,333 18,714 19,120 20,458 21,633 22,513 23,163 23,422 23,580 23,662Other 5,476 5,476 5,476 5,476 5,476 5,476 5,476 5,476 5,476 5,476K-12 74,798 76,466 77,955 79,980 81,584 82,830 83,826 84,318 84,702 85,024
GrandTotal 93,216 95,096 96,676 98,543 100,147 101,393 102,389 102,881 103,265 103,587Source:CooperativeStrategies

77
UseofEnrollmentProjections:Enrollment projections are important administrative responsibilities associated with district, LEA and schoolbudgeting,staffing,andfacilityplanning,includingforschoolopenings,closingsandconsolidations—withinLEAsandacrosssectors.Enrollmentprojectionsbasedonschoolofattendanceareuseful forbudgetdevelopment,staffplanning,anddeterminingthenumberofavailablelotteryseatseachyear.Knowinghowmanystudentspergrade at a school provides guidance on determining how many teachers per grade level may be needed.Enrollmentprojectionsbasedonboundaryofresidenceareusefulforplanningschoolfacilitiesand/orattendanceboundaries.Knowingifthestudentpopulationinaboundaryisincreasingordecreasingprovidesguidanceforcapitalplanning.
DCPS and PCS will benefit from the recommendations outlined above and especially centralized datamanagement.Adefinedprocessofprojectingandreviewingenrollmentshouldallowforimprovedefficienciesthat should expedite the process for finalizing enrollment projections for purposes budgeting, staffing, andidentifyingthenumberofavailablelotteryseatsavailable.
Even as projections are essential tools for planning and budgeting, it is important to note, that in the highlydynamicandcomplicatedsystemintheDistrictofColumbia,enrollmentprojectionsdonotcapturethecomplexityofenrollmentorattendancepatterns.Itisalsothecasethatthereisnosimpledemandandsupplyrelationship.Theenrollmentprojectionsreflecthistoricpublicpoliciesthatgovernandregulatethesupplyofschools.Thiswastruewithsegregationandthendesegregation;withthepoliciesthatintroducedDCPS“out-of-boundary”choiceinthe1970s;forschoolchoiceexpandedtoprivatelyoperatedcharters;andwiththeexpansionofearlychildhoodeducation.EachofthesepolicyactionshashadadramaticeffectontheenrollmentofthepublicschoolsintheDistrictofColumbia.

78
Section7:Historical/ProjectedEnrollmentHistoricalEnrollmentHistoricalenrollmentintheDistrictofColumbia(DCPSandPCSschools),basedontheofficialauditedenrollment,increased20,840students,orapproximately29.5percent,fromthe2008-09tothe2017-18schoolyear.
Thedarkershadesofbluerepresentsmallercohortswhilethedarkershadesofredrepresentlargercohortsincomparisontothehistorical,andalloftheprojecteddistrict-wideenrollment.1
HistoricalEnrollment-System-wideGrade 2008-09 2009-10 2010-11 2011-12 2012-13 2013-14 2014-15 2015-16 2016-17 2017-18PK3 2,561 3,135 3,985 4,515 4,929 5,131 5,382 5,333 5,591 5,682PK4 4,506 5,076 5,596 6,263 6,499 6,724 6,658 6,976 6,938 7,036K 5,064 5,188 5,939 6,292 6,980 7,163 7,264 7,309 7,561 7,4611 4,971 5,020 5,240 5,757 6,163 6,773 7,019 7,043 7,126 7,2032 5,072 4,908 4,915 5,054 5,629 5,990 6,642 6,764 6,804 6,7993 5,049 4,993 4,873 4,791 4,991 5,453 5,819 6,427 6,555 6,5634 4,540 4,891 4,877 4,629 4,631 4,804 5,257 5,655 6,248 6,2965 4,633 4,513 4,825 4,754 4,575 4,629 4,784 5,199 5,531 6,1036 4,453 4,516 4,391 4,550 4,627 4,433 4,593 4,637 4,970 5,2037 4,526 4,394 4,439 4,236 4,559 4,596 4,404 4,528 4,581 4,9038 4,477 4,451 4,307 4,310 4,202 4,397 4,515 4,351 4,473 4,4899 6,251 6,179 5,849 5,823 6,253 5,615 5,818 5,785 5,785 5,83810 4,280 4,430 4,495 4,179 4,210 4,104 3,976 4,012 4,224 4,56211 3,664 3,682 3,841 3,580 3,739 3,488 3,619 3,645 3,734 4,11112 3,389 3,300 3,404 3,101 3,315 2,980 3,177 3,274 3,370 3,763
Adult 2,816 3,067 3,712 3,810 4,151 4,768 4,488 4,545 4,692 4,951UG 396 449 246 1,049 729 1,884 1,592 1,451 1,388 141
SPEDUG NA NA NA NA NA NA 368 376 382 384GrandTotal 70,648 72,192 74,934 76,693 80,182 82,932 85,375 87,310 89,953 91,488
Source:OSSEAuditedEnrollment
HistoricalEnrollment-System-wideGrade 2008-09 2009-10 2010-11 2011-12 2012-13 2013-14 2014-15 2015-16 2016-17 2017-18PK 7,067 8,211 9,581 10,778 11,428 11,855 12,040 12,309 12,529 12,718K-5 29,329 29,513 30,669 31,277 32,969 34,812 36,785 38,397 39,825 40,4256-8 13,456 13,361 13,137 13,096 13,388 13,426 13,512 13,516 14,024 14,5959-12 17,584 17,591 17,589 16,683 17,517 16,187 16,590 16,716 17,113 18,274Other 3,212 3,516 3,958 4,859 4,880 6,652 6,448 6,372 6,462 5,476K-12 60,369 60,465 61,395 61,056 63,874 64,425 66,887 68,629 70,962 73,294
GrandTotal 70,648 72,192 74,934 76,693 80,182 82,932 85,375 87,310 89,953 91,488Source:OSSEAuditedEnrollment

79
HistoricalenrollmentintheDCPSschools,basedontheofficialauditedenrollment,increased2,698students,orapproximately6percent,fromthe2008-09tothe2017-18schoolyear.
Thedarkershadesofbluerepresentsmallercohortswhilethedarkershadesofredrepresentlargercohortsincomparisontothehistorical,andalloftheprojecteddistrict-wideenrollment.
1
HistoricalEnrollment-DCPSGrade 2008-09 2009-10 2010-11 2011-12 2012-13 2013-14 2014-15 2015-16 2016-17 2017-18PK3 1,498 1,712 2,121 2,105 2,161 2,197 2,276 2,310 2,362 2,374PK4 2,749 2,895 3,114 3,291 3,409 3,368 3,339 3,522 3,467 3,423K 3,355 3,277 3,732 3,790 4,123 4,179 4,108 4,208 4,224 4,2011 3,471 3,299 3,256 3,687 3,741 4,109 4,141 4,163 4,181 4,0932 3,582 3,389 3,235 3,205 3,546 3,682 4,098 4,107 3,995 3,9393 3,654 3,481 3,373 3,233 3,182 3,450 3,618 4,078 4,040 3,8554 3,247 3,458 3,275 3,162 3,082 3,050 3,341 3,590 3,951 3,8785 3,155 2,932 3,160 3,016 2,799 2,843 2,781 3,097 3,259 3,5866 2,405 2,512 2,314 2,348 2,279 2,237 2,233 2,070 2,310 2,3067 2,344 2,295 2,389 2,203 2,338 2,355 2,304 2,274 2,144 2,3628 2,459 2,375 2,347 2,357 2,194 2,396 2,509 2,311 2,324 2,1699 4,292 4,007 3,654 3,706 3,972 3,654 3,855 3,767 3,273 3,34710 2,881 2,864 2,900 2,682 2,558 2,444 2,438 2,558 2,580 2,76011 2,624 2,490 2,639 2,424 2,355 2,235 2,249 2,316 2,435 2,60212 2,538 2,370 2,383 2,114 2,028 1,869 2,046 2,130 2,223 2,514
Adult 972 979 1,430 1,394 1,378 1,428 1,393 1,253 1,079 408UG 171 224 246 414 363 871 675 526 484 141
SPEDUG NA NA NA NA NA NA 116 125 131 137GrandTotal 45,397 44,559 45,568 45,131 45,508 46,367 47,520 48,405 48,462 48,095
Source:OSSEAuditedEnrollment
HistoricalEnrollment-DCPSGrade 2008-09 2009-10 2010-11 2011-12 2012-13 2013-14 2014-15 2015-16 2016-17 2017-18PK 4,247 4,607 5,235 5,396 5,570 5,565 5,615 5,832 5,829 5,797K-5 20,464 19,836 20,031 20,093 20,473 21,313 22,087 23,243 23,650 23,5526-8 7,208 7,182 7,050 6,908 6,811 6,988 7,046 6,655 6,778 6,8379-12 12,335 11,731 11,576 10,926 10,913 10,202 10,588 10,771 10,511 11,223Other 1,143 1,203 1,676 1,808 1,741 2,299 2,184 1,904 1,694 686K-12 40,007 38,749 38,657 37,927 38,197 38,503 39,721 40,669 40,939 41,612
GrandTotal 45,397 44,559 45,568 45,131 45,508 46,367 47,520 48,405 48,462 48,095Source:OSSEAuditedEnrollment

80
HistoricalenrollmentinthePCSschools,basedontheofficialauditedenrollment,increased18,142students,orapproximately72percent,fromthe2008-09tothe2017-18schoolyear.
Thedarkershadesofbluerepresentsmallercohortswhilethedarkershadesofredrepresentlargercohortsincomparisontothehistorical,andalloftheprojecteddistrict-wideenrollment.
1
HistoricalEnrollment-PCSGrade 2008-09 2009-10 2010-11 2011-12 2012-13 2013-14 2014-15 2015-16 2016-17 2017-18PK3 1,063 1,423 1,864 2,410 2,768 2,934 3,106 3,023 3,229 3,308PK4 1,757 2,181 2,482 2,972 3,090 3,356 3,319 3,454 3,471 3,613K 1,709 1,911 2,207 2,502 2,857 2,984 3,156 3,101 3,337 3,2601 1,500 1,721 1,984 2,070 2,422 2,664 2,878 2,880 2,945 3,1102 1,490 1,519 1,680 1,849 2,083 2,308 2,544 2,657 2,809 2,8603 1,395 1,512 1,500 1,558 1,809 2,003 2,201 2,349 2,515 2,7084 1,293 1,433 1,602 1,467 1,549 1,754 1,916 2,065 2,297 2,4185 1,478 1,581 1,665 1,738 1,776 1,786 2,003 2,102 2,272 2,5176 2,048 2,004 2,077 2,202 2,348 2,196 2,360 2,567 2,660 2,8977 2,182 2,099 2,050 2,033 2,221 2,241 2,100 2,254 2,437 2,5418 2,018 2,076 1,960 1,953 2,008 2,001 2,006 2,040 2,149 2,3209 1,959 2,172 2,195 2,117 2,281 1,961 1,963 2,018 2,512 2,49110 1,399 1,566 1,595 1,497 1,652 1,660 1,538 1,454 1,644 1,80211 1,040 1,192 1,202 1,156 1,384 1,253 1,370 1,329 1,299 1,50912 851 930 1,021 987 1,287 1,111 1,131 1,144 1,147 1,249
Adult 1,844 2,088 2,282 2,416 2,773 3,340 3,095 3,292 3,613 4,543UG 225 225 NA 635 366 1,013 917 925 904 NA
SPEDUG NA NA NA NA NA NA 252 251 251 247GrandTotal 25,251 27,633 29,366 31,562 34,674 36,565 37,855 38,905 41,491 43,393
Source:OSSEAuditedEnrollment
HistoricalEnrollment-PCSGrade 2008-09 2009-10 2010-11 2011-12 2012-13 2013-14 2014-15 2015-16 2016-17 2017-18PK 2,820 3,604 4,346 5,382 5,858 6,290 6,425 6,477 6,700 6,921K-5 8,865 9,677 10,638 11,184 12,496 13,499 14,698 15,154 16,175 16,8736-8 6,248 6,179 6,087 6,188 6,577 6,438 6,466 6,861 7,246 7,7589-12 5,249 5,860 6,013 5,757 6,604 5,985 6,002 5,945 6,602 7,051Other 2,069 2,313 2,282 3,051 3,139 4,353 4,264 4,468 4,768 4,790K-12 20,362 21,716 22,738 23,129 25,677 25,922 27,166 27,960 30,023 31,682
GrandTotal 25,251 27,633 29,366 31,562 34,674 36,565 37,855 38,905 41,491 43,393Source:OSSEAuditedEnrollment

81
SummaryofEnrollmentProjectionsThefollowingenrollmentprojectionsweredevelopedaspartofthisstudyfortheDistrictofColumbia:
• Baselineenrollmentprojectionsbyschool (Step5ofSection6:ProposedProcessandMethodologyforDevelopingEnrollmentProjectionsbySchool)
• System-wide enrollment projections (Step 8 of Section 6: Proposed Process and Methodology forDevelopingEnrollmentProjectionsbySchool)
• Enrollmentprojectionsbasedonresidence
Itshouldbenotedthattheoverallhistoricalenrollmentbetweenthebaselinebyschoolandelementaryboundary(residence) projections differ (due to being different data sets) and therefore the enrollment projectionspresentedalsodiffer.Inaddition,aggregatingthedatadifferentlywillyielddifferentresults.
BaselineEnrollmentProjectionsbySchoolEnrollmentprojectionsbased on school of attendanceareuseful forbudgetdevelopment and staff planning.Knowinghowmanystudentspergradeataschoolprovidesguidanceondetermininghowmanyteacherspergrade levelmaybeneeded. Theseenrollmentprojections relate toStep5ofSection6:ProposedProcessandMethodologyforDevelopingEnrollmentProjectionsbySchool
FeederPatternsGeographicfeederpatternswereincorporatedbasedondataavailableontheDCPSwebsiteforschoolyears2014-15 through2018-19 (https://dcps.dc.gov/boundaries). In a few cases, a different feeder patternwas appliedbasedonareviewofgeocodedstudentsandwheretheyattendedthefollowingyear.Thesecases,ifapplicable,arenotedintheenrollmentprojectionsbyschoolprofiles.
BirthDataResidentlivebirthcountsbyaddresswereprovidedbytheDistrictofColumbiaDepartmentofHealth,aggregatedbyelementaryboundary,andusedtoprojectkindergartenenrollmentforschoolsassignedtothoseboundaries.InthecasesofPCSelementaryschoolsandDCPSelementaryschoolswithnoassignedboundary,city-widelivebirthcountswereusedtoprojectkindergartenenrollment.Itshouldbenotedthatactuallivebirthcountsareavailablethrough2016andprojectkindergartenenrollmentthrough2021-22.Toprojectkindergartenthrough2027-28,anaveragenumberoflivebirthsforthe3mostrecentyearsofavailabledatawasused.
EnrollmentProjectionMethodologyProjectedPK3,PK4,Adult,UG,andSPEDUGenrollmentsdonotfollowthecohortsurvivalmethodbutreflecttheactual2017-18enrollments.
Basedonthefindingsoftheblindstudydescribedpreviouslyinthisreport,thebaselineenrollmentprojectionsweredevelopedusingthecohortsurvivalmethodusinga3-yearsimpleaverageofsurvivalratiosforDCPSschoolsanda2-yearweightedaverageofsurvivalratiosforPCSschools.Additionaladjustmentsbeyondtheseandwhatisnotedintheenrollmentprojectionsbyschoolprofileswerenotapplied.WerecommendthatDCPSandPCS
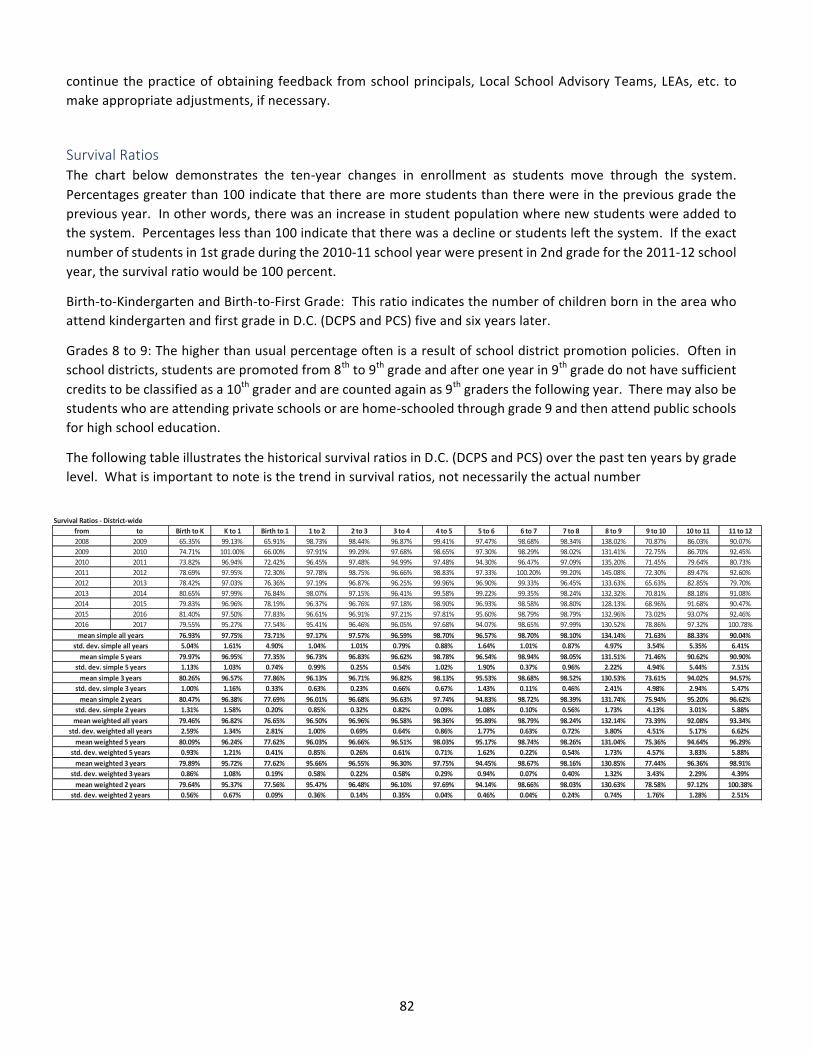
82
continuethepracticeofobtaining feedback fromschoolprincipals,LocalSchoolAdvisoryTeams,LEAs,etc. tomakeappropriateadjustments,ifnecessary.
SurvivalRatiosThe chart below demonstrates the ten-year changes in enrollment as students move through the system.Percentagesgreaterthan100indicatethattherearemorestudentsthantherewereinthepreviousgradethepreviousyear.Inotherwords,therewasanincreaseinstudentpopulationwherenewstudentswereaddedtothesystem.Percentageslessthan100indicatethattherewasadeclineorstudentsleftthesystem.Iftheexactnumberofstudentsin1stgradeduringthe2010-11schoolyearwerepresentin2ndgradeforthe2011-12schoolyear,thesurvivalratiowouldbe100percent.
Birth-to-KindergartenandBirth-to-FirstGrade:ThisratioindicatesthenumberofchildrenbornintheareawhoattendkindergartenandfirstgradeinD.C.(DCPSandPCS)fiveandsixyearslater.
Grades8to9:Thehigherthanusualpercentageoftenisaresultofschooldistrictpromotionpolicies.Ofteninschooldistricts,studentsarepromotedfrom8thto9thgradeandafteroneyearin9thgradedonothavesufficientcreditstobeclassifiedasa10thgraderandarecountedagainas9thgradersthefollowingyear.Theremayalsobestudentswhoareattendingprivateschoolsorarehome-schooledthroughgrade9andthenattendpublicschoolsforhighschooleducation.
ThefollowingtableillustratesthehistoricalsurvivalratiosinD.C.(DCPSandPCS)overthepasttenyearsbygradelevel.Whatisimportanttonoteisthetrendinsurvivalratios,notnecessarilytheactualnumber
SurvivalRatios-District-widefrom to BirthtoK Kto1 Birthto1 1to2 2to3 3to4 4to5 5to6 6to7 7to8 8to9 9to10 10to11 11to122008 2009 65.35% 99.13% 65.91% 98.73% 98.44% 96.87% 99.41% 97.47% 98.68% 98.34% 138.02% 70.87% 86.03% 90.07%2009 2010 74.71% 101.00% 66.00% 97.91% 99.29% 97.68% 98.65% 97.30% 98.29% 98.02% 131.41% 72.75% 86.70% 92.45%2010 2011 73.82% 96.94% 72.42% 96.45% 97.48% 94.99% 97.48% 94.30% 96.47% 97.09% 135.20% 71.45% 79.64% 80.73%2011 2012 78.69% 97.95% 72.30% 97.78% 98.75% 96.66% 98.83% 97.33% 100.20% 99.20% 145.08% 72.30% 89.47% 92.60%2012 2013 78.42% 97.03% 76.36% 97.19% 96.87% 96.25% 99.96% 96.90% 99.33% 96.45% 133.63% 65.63% 82.85% 79.70%2013 2014 80.65% 97.99% 76.84% 98.07% 97.15% 96.41% 99.58% 99.22% 99.35% 98.24% 132.32% 70.81% 88.18% 91.08%2014 2015 79.83% 96.96% 78.19% 96.37% 96.76% 97.18% 98.90% 96.93% 98.58% 98.80% 128.13% 68.96% 91.68% 90.47%2015 2016 81.40% 97.50% 77.83% 96.61% 96.91% 97.21% 97.81% 95.60% 98.79% 98.79% 132.96% 73.02% 93.07% 92.46%2016 2017 79.55% 95.27% 77.54% 95.41% 96.46% 96.05% 97.68% 94.07% 98.65% 97.99% 130.52% 78.86% 97.32% 100.78%
76.93% 97.75% 73.71% 97.17% 97.57% 96.59% 98.70% 96.57% 98.70% 98.10% 134.14% 71.63% 88.33% 90.04%5.04% 1.61% 4.90% 1.04% 1.01% 0.79% 0.88% 1.64% 1.01% 0.87% 4.97% 3.54% 5.35% 6.41%79.97% 96.95% 77.35% 96.73% 96.83% 96.62% 98.78% 96.54% 98.94% 98.05% 131.51% 71.46% 90.62% 90.90%1.13% 1.03% 0.74% 0.99% 0.25% 0.54% 1.02% 1.90% 0.37% 0.96% 2.22% 4.94% 5.44% 7.51%80.26% 96.57% 77.86% 96.13% 96.71% 96.82% 98.13% 95.53% 98.68% 98.52% 130.53% 73.61% 94.02% 94.57%1.00% 1.16% 0.33% 0.63% 0.23% 0.66% 0.67% 1.43% 0.11% 0.46% 2.41% 4.98% 2.94% 5.47%80.47% 96.38% 77.69% 96.01% 96.68% 96.63% 97.74% 94.83% 98.72% 98.39% 131.74% 75.94% 95.20% 96.62%1.31% 1.58% 0.20% 0.85% 0.32% 0.82% 0.09% 1.08% 0.10% 0.56% 1.73% 4.13% 3.01% 5.88%79.46% 96.82% 76.65% 96.50% 96.96% 96.58% 98.36% 95.89% 98.79% 98.24% 132.14% 73.39% 92.08% 93.34%2.59% 1.34% 2.81% 1.00% 0.69% 0.64% 0.86% 1.77% 0.63% 0.72% 3.80% 4.51% 5.17% 6.62%80.09% 96.24% 77.62% 96.03% 96.66% 96.51% 98.03% 95.17% 98.74% 98.26% 131.04% 75.36% 94.64% 96.29%0.93% 1.21% 0.41% 0.85% 0.26% 0.61% 0.71% 1.62% 0.22% 0.54% 1.73% 4.57% 3.83% 5.88%79.89% 95.72% 77.62% 95.66% 96.55% 96.30% 97.75% 94.45% 98.67% 98.16% 130.85% 77.44% 96.36% 98.91%0.86% 1.08% 0.19% 0.58% 0.22% 0.58% 0.29% 0.94% 0.07% 0.40% 1.32% 3.43% 2.29% 4.39%79.64% 95.37% 77.56% 95.47% 96.48% 96.10% 97.69% 94.14% 98.66% 98.03% 130.63% 78.58% 97.12% 100.38%0.56% 0.67% 0.09% 0.36% 0.14% 0.35% 0.04% 0.46% 0.04% 0.24% 0.74% 1.76% 1.28% 2.51%
meanweighted3yearsstd.dev.weighted3yearsmeanweighted2years
std.dev.weighted2years
meansimple2yearsstd.dev.simple2yearsmeanweightedallyears
std.dev.weightedallyearsmeanweighted5years
std.dev.weighted5years
std.dev.simple3years
meansimpleallyearsstd.dev.simpleallyearsmeansimple5years
std.dev.simple5yearsmeansimple3years

83
ThefollowingtableillustratesthehistoricalsurvivalratiosinDCPSoverthepasttenyearsbygradelevel.
ThefollowingtableillustratesthehistoricalsurvivalratiosinPCSoverthepasttenyearsbygradelevel.
SurvivalRatios-DCPSfrom to BirthtoK Kto1 Birthto1 1to2 2to3 3to4 4to5 5to6 6to7 7to8 8to9 9to10 10to11 11to122008 2009 41.28% 98.33% 43.32% 97.64% 97.18% 94.64% 90.30% 79.62% 95.43% 101.32% 162.95% 66.73% 86.43% 90.32%2009 2010 46.95% 99.36% 41.01% 98.06% 99.53% 94.08% 91.38% 78.92% 95.10% 102.27% 153.85% 72.37% 92.14% 95.70%2010 2011 44.46% 98.79% 46.38% 98.43% 99.94% 93.74% 92.09% 74.30% 95.20% 98.66% 157.90% 73.40% 83.59% 80.11%2011 2012 46.48% 98.71% 43.89% 96.18% 99.28% 95.33% 88.52% 75.56% 99.57% 99.59% 168.52% 69.02% 87.81% 83.66%2012 2013 45.75% 99.66% 46.32% 98.42% 97.29% 95.85% 92.25% 79.92% 103.33% 102.48% 166.55% 61.53% 87.37% 79.36%2013 2014 45.61% 99.09% 45.34% 99.73% 98.26% 96.84% 91.18% 78.54% 103.00% 106.54% 160.89% 66.72% 92.02% 91.54%2014 2015 45.96% 101.34% 46.22% 99.18% 99.51% 99.23% 92.70% 74.43% 101.84% 100.30% 150.14% 66.36% 95.00% 94.71%2015 2016 45.47% 99.36% 45.66% 95.96% 98.37% 96.89% 90.78% 74.59% 103.57% 102.20% 141.63% 68.49% 95.19% 95.98%2016 2017 44.79% 96.90% 44.06% 94.21% 96.50% 95.99% 90.76% 70.76% 102.25% 101.17% 144.02% 84.33% 100.85% 103.24%
45.20% 99.06% 44.69% 97.54% 98.43% 95.84% 91.11% 76.29% 99.92% 101.61% 156.27% 69.88% 91.16% 90.52%1.66% 1.18% 1.79% 1.76% 1.23% 1.69% 1.25% 3.12% 3.70% 2.25% 9.57% 6.44% 5.38% 8.04%45.52% 99.27% 45.52% 97.50% 97.99% 96.96% 91.53% 75.65% 102.80% 102.54% 152.64% 69.48% 94.09% 92.97%0.44% 1.59% 0.91% 2.34% 1.15% 1.35% 0.89% 3.65% 0.73% 2.40% 10.76% 8.69% 4.93% 8.73%45.41% 99.20% 45.32% 96.45% 98.13% 97.37% 91.41% 73.26% 102.55% 101.22% 145.26% 73.06% 97.01% 97.98%0.59% 2.22% 1.12% 2.52% 1.52% 1.67% 1.11% 2.17% 0.91% 0.95% 4.39% 9.82% 3.33% 4.60%45.13% 98.13% 44.86% 95.09% 97.43% 96.44% 90.77% 72.67% 102.91% 101.68% 142.82% 76.41% 98.02% 99.61%0.48% 1.74% 1.13% 1.24% 1.32% 0.63% 0.01% 2.71% 0.94% 0.73% 1.69% 11.20% 4.00% 5.13%45.34% 98.79% 45.03% 96.63% 97.96% 96.59% 91.15% 74.35% 101.99% 101.79% 150.06% 72.85% 95.12% 95.21%0.82% 1.61% 1.21% 2.23% 1.27% 1.43% 1.02% 3.23% 2.25% 1.98% 9.59% 8.74% 5.26% 7.90%45.18% 98.26% 44.87% 95.69% 97.46% 96.65% 91.06% 72.87% 102.61% 101.67% 145.72% 76.49% 97.83% 99.05%0.49% 1.78% 1.00% 2.18% 1.25% 1.16% 0.73% 2.88% 0.71% 1.50% 6.43% 9.58% 3.96% 5.90%44.96% 97.50% 44.43% 94.71% 96.94% 96.27% 90.84% 71.57% 102.47% 101.31% 143.84% 80.84% 99.63% 101.63%0.40% 1.48% 0.87% 1.37% 1.08% 0.84% 0.46% 1.91% 0.63% 0.54% 1.91% 8.18% 2.87% 3.78%44.82% 97.02% 44.14% 94.30% 96.58% 96.03% 90.76% 70.94% 102.31% 101.22% 143.91% 83.57% 100.58% 102.90%0.21% 0.74% 0.48% 0.53% 0.56% 0.27% 0.01% 1.15% 0.40% 0.31% 0.72% 4.77% 1.70% 2.19%
meanweighted3yearsstd.dev.weighted3yearsmeanweighted2years
std.dev.weighted2years
meansimple2yearsstd.dev.simple2yearsmeanweightedallyears
std.dev.weightedallyearsmeanweighted5years
std.dev.weighted5years
std.dev.simple3years
meansimpleallyearsstd.dev.simpleallyearsmeansimple5years
std.dev.simple5yearsmeansimple3years
SurvivalRatios-PCSfrom to BirthtoK Kto1 Birthto1 1to2 2to3 3to4 4to5 5to6 6to7 7to8 8to9 9to10 10to11 11to122008 2009 24.07% 100.70% 22.60% 101.27% 101.48% 102.72% 122.27% 135.59% 102.49% 95.14% 107.63% 79.94% 85.20% 89.42%2009 2010 27.76% 103.82% 24.99% 97.62% 98.75% 105.95% 116.19% 131.37% 102.30% 93.38% 105.73% 73.43% 76.76% 85.65%2010 2011 29.35% 93.79% 26.04% 93.20% 92.74% 97.80% 108.49% 132.25% 97.88% 95.27% 108.01% 68.20% 72.48% 82.11%2011 2012 32.21% 96.80% 28.41% 100.63% 97.84% 99.42% 121.06% 135.10% 100.86% 98.77% 116.79% 78.03% 92.45% 111.33%2012 2013 32.67% 93.24% 30.03% 95.29% 96.16% 96.96% 115.30% 123.65% 95.44% 90.09% 97.66% 72.78% 75.85% 80.27%2013 2014 35.04% 96.45% 31.51% 95.50% 95.36% 95.66% 114.20% 132.14% 95.63% 89.51% 98.10% 78.43% 82.53% 90.26%2014 2015 33.87% 91.25% 31.98% 92.32% 92.33% 93.82% 109.71% 128.16% 95.51% 97.14% 100.60% 74.07% 86.41% 83.50%2015 2016 35.92% 94.97% 32.16% 97.53% 94.66% 97.79% 110.02% 126.55% 94.94% 95.34% 123.14% 81.47% 89.34% 86.31%2016 2017 34.76% 93.20% 33.48% 97.11% 96.40% 96.14% 109.58% 127.51% 95.53% 95.20% 115.91% 71.74% 91.79% 96.15%
31.74% 96.03% 29.02% 96.72% 96.19% 98.47% 114.09% 130.26% 97.84% 94.43% 108.18% 75.34% 83.64% 89.45%3.93% 4.00% 3.75% 3.02% 2.90% 3.76% 5.11% 4.03% 3.17% 3.02% 8.90% 4.35% 7.25% 9.50%34.45% 93.82% 31.83% 95.55% 94.98% 96.07% 111.76% 127.60% 95.41% 93.46% 107.08% 75.70% 85.18% 87.30%1.24% 1.97% 1.24% 2.05% 1.63% 1.50% 2.76% 3.07% 0.27% 3.43% 11.70% 4.11% 6.26% 6.16%34.85% 93.14% 32.54% 95.66% 94.46% 95.92% 109.77% 127.40% 95.32% 95.89% 113.22% 75.76% 89.18% 88.65%1.03% 1.86% 0.82% 2.90% 2.04% 1.99% 0.23% 0.81% 0.34% 1.08% 11.51% 5.08% 2.69% 6.64%35.34% 94.08% 32.82% 97.32% 95.53% 96.96% 109.80% 127.03% 95.23% 95.27% 119.53% 76.60% 90.56% 91.23%0.82% 1.25% 0.93% 0.30% 1.24% 1.16% 0.32% 0.68% 0.42% 0.10% 5.11% 6.88% 1.73% 6.96%34.11% 94.21% 31.62% 96.29% 95.35% 96.72% 111.49% 128.36% 96.01% 94.70% 111.38% 75.40% 87.21% 90.18%2.29% 2.51% 2.45% 2.33% 1.93% 2.31% 3.55% 2.98% 1.93% 2.67% 10.07% 4.35% 5.90% 7.78%34.91% 93.60% 32.76% 96.50% 95.40% 96.28% 110.13% 127.50% 95.38% 95.01% 114.40% 74.91% 89.56% 91.35%0.82% 1.46% 0.96% 1.83% 1.51% 1.30% 1.52% 1.55% 0.29% 1.93% 9.11% 4.65% 3.84% 6.10%34.93% 93.43% 33.19% 97.00% 95.94% 96.34% 109.66% 127.37% 95.42% 95.30% 116.58% 73.54% 91.15% 93.93%0.60% 0.98% 0.68% 1.17% 1.21% 0.98% 0.21% 0.49% 0.27% 0.46% 5.19% 4.52% 1.63% 5.25%34.81% 93.28% 33.42% 97.13% 96.32% 96.22% 109.60% 127.46% 95.50% 95.21% 116.26% 72.20% 91.67% 95.68%0.35% 0.53% 0.40% 0.13% 0.53% 0.49% 0.13% 0.29% 0.18% 0.04% 2.18% 2.93% 0.74% 2.97%
meanweighted3yearsstd.dev.weighted3yearsmeanweighted2years
std.dev.weighted2years
meansimple2yearsstd.dev.simple2yearsmeanweightedallyears
std.dev.weightedallyearsmeanweighted5years
std.dev.weighted5years
std.dev.simple3years
meansimpleallyearsstd.dev.simpleallyearsmeansimple5years
std.dev.simple5yearsmeansimple3years

84
EnrollmentProjectionsBaselineenrollmentprojectionsbyschoolweredevelopedfortheDCPSandPCSschoolsintheDistrictofColumbiausing the official audited enrollment by school, by grade from 2008-09 through 2017-18 provided by OSSE(https://osse.dc.gov/enrollment). The enrollment projections were developed using the cohort survivalmethodology.A3-yearsimpleaverageofsurvivalratioswasusedtoprojectDCPSschoolenrollmentanda2-yearweightedaverageofsurvivalratioswasusedtoprojectPCsschoolenrollment.Livebirthcountswereusedtoprojectkindergartenenrollment;PK,Adult,UG,andSPEDUGwerekeptflatatthecurrent2017-18enrollment.
Thedarkershadesofbluerepresentsmallercohortswhilethedarkershadesofredrepresentlargercohortsincomparisontothehistorical,andalloftheprojecteddistrict-wideenrollment.
ProjectedEnrollment-System-wide(Baseline)Grade 2018-19 2019-20 2020-21 2021-22 2022-23 2023-24 2024-25 2025-26 2026-27 2027-28PK3 5,682 5,682 5,682 5,682 5,682 5,682 5,682 5,682 5,682 5,682PK4 7,036 7,036 7,036 7,036 7,036 7,036 7,036 7,036 7,036 7,036K 7,447 7,624 7,663 7,880 7,717 7,717 7,717 7,717 7,717 7,7171 7,170 7,165 7,329 7,356 7,565 7,414 7,414 7,414 7,414 7,4142 6,877 6,846 6,844 6,998 7,020 7,230 7,084 7,084 7,084 7,0843 6,611 6,684 6,657 6,647 6,796 6,809 7,023 6,879 6,879 6,8794 6,218 6,268 6,329 6,283 6,271 6,418 6,426 6,635 6,492 6,4925 6,038 5,906 5,953 5,995 5,935 5,942 6,079 6,082 6,295 6,1496 5,612 5,475 5,415 5,447 5,495 5,438 5,433 5,567 5,560 5,7687 5,070 5,452 5,330 5,276 5,310 5,360 5,318 5,315 5,451 5,4398 4,766 4,958 5,322 5,211 5,173 5,209 5,286 5,247 5,240 5,3789 5,916 6,451 6,675 6,908 6,732 6,724 6,762 6,846 6,870 6,87710 4,068 4,161 4,572 4,704 4,861 4,735 4,737 4,765 4,828 4,85311 4,125 3,663 3,765 4,148 4,273 4,387 4,273 4,281 4,304 4,35912 3,826 3,872 3,444 3,528 3,899 4,023 4,114 4,010 4,015 4,039
Adult 4,951 4,951 4,951 4,951 4,951 4,951 4,951 4,951 4,951 4,951UG 363 363 363 363 363 363 363 363 363 363
SPEDUG 384 384 384 384 384 384 384 384 384 384GrandTotal 92,160 92,941 93,714 94,797 95,463 95,822 96,082 96,258 96,565 96,864
Source:CooperativeStrategies
ProjectedEnrollment-System-wide(Baseline)Grade 2018-19 2019-20 2020-21 2021-22 2022-23 2023-24 2024-25 2025-26 2026-27 2027-28PK 12,718 12,718 12,718 12,718 12,718 12,718 12,718 12,718 12,718 12,718K-5 40,361 40,493 40,775 41,159 41,304 41,530 41,743 41,811 41,881 41,7356-8 15,448 15,885 16,067 15,934 15,978 16,007 16,037 16,129 16,251 16,5859-12 17,935 18,147 18,456 19,288 19,765 19,869 19,886 19,902 20,017 20,128Other 5,698 5,698 5,698 5,698 5,698 5,698 5,698 5,698 5,698 5,698K-12 73,744 74,525 75,298 76,381 77,047 77,406 77,666 77,842 78,149 78,448
GrandTotal 92,160 92,941 93,714 94,797 95,463 95,822 96,082 96,258 96,565 96,864Source:CooperativeStrategies

85
Thedarkershadesofbluerepresentsmallercohortswhilethedarkershadesofredrepresentlargercohortsincomparisontothehistorical,andalloftheprojecteddistrict-wideenrollment.
ProjectedEnrollment-DCPSGrade 2018-19 2019-20 2020-21 2021-22 2022-23 2023-24 2024-25 2025-26 2026-27 2027-28PK3 2,374 2,374 2,374 2,374 2,374 2,374 2,374 2,374 2,374 2,374PK4 3,423 3,423 3,423 3,423 3,423 3,423 3,423 3,423 3,423 3,423K 4,222 4,310 4,325 4,449 4,360 4,360 4,360 4,360 4,360 4,3601 4,190 4,205 4,291 4,300 4,425 4,339 4,339 4,339 4,339 4,3392 3,948 4,039 4,058 4,139 4,147 4,271 4,187 4,187 4,187 4,1873 3,870 3,888 3,983 3,996 4,074 4,074 4,203 4,116 4,116 4,1164 3,766 3,783 3,809 3,894 3,901 3,983 3,979 4,117 4,027 4,0275 3,554 3,450 3,466 3,507 3,570 3,590 3,667 3,663 3,799 3,7076 2,446 2,343 2,365 2,376 2,412 2,487 2,488 2,551 2,537 2,6467 2,390 2,525 2,427 2,452 2,463 2,498 2,580 2,583 2,653 2,6358 2,432 2,469 2,592 2,501 2,532 2,543 2,583 2,668 2,669 2,7429 3,521 3,952 4,065 4,099 3,977 3,991 4,011 4,062 4,106 4,11410 2,374 2,517 2,822 2,900 2,932 2,846 2,862 2,877 2,917 2,95311 2,675 2,293 2,434 2,731 2,815 2,829 2,748 2,764 2,779 2,81412 2,473 2,543 2,188 2,314 2,604 2,689 2,690 2,613 2,629 2,643
Adult 408 408 408 408 408 408 408 408 408 408UG 193 193 193 193 193 193 193 193 193 193
SPEDUG 137 137 137 137 137 137 137 137 137 137GrandTotal 48,396 48,852 49,360 50,193 50,747 51,035 51,232 51,435 51,653 51,818
Source:CooperativeStrategies
ProjectedEnrollment-DCPSGrade 2018-19 2019-20 2020-21 2021-22 2022-23 2023-24 2024-25 2025-26 2026-27 2027-28PK 5,797 5,797 5,797 5,797 5,797 5,797 5,797 5,797 5,797 5,797K-5 23,550 23,675 23,932 24,285 24,477 24,617 24,735 24,782 24,828 24,7366-8 7,268 7,337 7,384 7,329 7,407 7,528 7,651 7,802 7,859 8,0239-12 11,043 11,305 11,509 12,044 12,328 12,355 12,311 12,316 12,431 12,524Other 738 738 738 738 738 738 738 738 738 738K-12 41,861 42,317 42,825 43,658 44,212 44,500 44,697 44,900 45,118 45,283
GrandTotal 48,396 48,852 49,360 50,193 50,747 51,035 51,232 51,435 51,653 51,818Source:CooperativeStrategies

86
Thedarkershadesofbluerepresentsmallercohortswhilethedarkershadesofredrepresentlargercohortsincomparisontothehistorical,andalloftheprojecteddistrict-wideenrollment.
Baseline enrollment projections by school are included in an interactivedashboard [insert linkhere]which isavailableonthedcauditor.orgwebsite.Alldataandassumptionsareincludedinthisdashboard.
ProjectedEnrollment-PCSGrade 2018-19 2019-20 2020-21 2021-22 2022-23 2023-24 2024-25 2025-26 2026-27 2027-28PK3 3,308 3,308 3,308 3,308 3,308 3,308 3,308 3,308 3,308 3,308PK4 3,613 3,613 3,613 3,613 3,613 3,613 3,613 3,613 3,613 3,613K 3,225 3,314 3,338 3,431 3,357 3,357 3,357 3,357 3,357 3,3571 2,980 2,960 3,038 3,056 3,140 3,075 3,075 3,075 3,075 3,0752 2,929 2,807 2,786 2,859 2,873 2,959 2,897 2,897 2,897 2,8973 2,741 2,796 2,674 2,651 2,722 2,735 2,820 2,763 2,763 2,7634 2,452 2,485 2,520 2,389 2,370 2,435 2,447 2,518 2,465 2,4655 2,484 2,456 2,487 2,488 2,365 2,352 2,412 2,419 2,496 2,4426 3,166 3,132 3,050 3,071 3,083 2,951 2,945 3,016 3,023 3,1227 2,680 2,927 2,903 2,824 2,847 2,862 2,738 2,732 2,798 2,8048 2,334 2,489 2,730 2,710 2,641 2,666 2,703 2,579 2,571 2,6369 2,395 2,499 2,610 2,809 2,755 2,733 2,751 2,784 2,764 2,76310 1,694 1,644 1,750 1,804 1,929 1,889 1,875 1,888 1,911 1,90011 1,450 1,370 1,331 1,417 1,458 1,558 1,525 1,517 1,525 1,54512 1,353 1,329 1,256 1,214 1,295 1,334 1,424 1,397 1,386 1,396
Adult 4,543 4,543 4,543 4,543 4,543 4,543 4,543 4,543 4,543 4,543UG 170 170 170 170 170 170 170 170 170 170
SPEDUG 247 247 247 247 247 247 247 247 247 247GrandTotal 43,764 44,089 44,354 44,604 44,716 44,787 44,850 44,823 44,912 45,046
Source:CooperativeStrategies
ProjectedEnrollment-PCSGrade 2018-19 2019-20 2020-21 2021-22 2022-23 2023-24 2024-25 2025-26 2026-27 2027-28PK 6,921 6,921 6,921 6,921 6,921 6,921 6,921 6,921 6,921 6,921K-5 16,811 16,818 16,843 16,874 16,827 16,913 17,008 17,029 17,053 16,9996-8 8,180 8,548 8,683 8,605 8,571 8,479 8,386 8,327 8,392 8,5629-12 6,892 6,842 6,947 7,244 7,437 7,514 7,575 7,586 7,586 7,604Other 4,960 4,960 4,960 4,960 4,960 4,960 4,960 4,960 4,960 4,960K-12 31,883 32,208 32,473 32,723 32,835 32,906 32,969 32,942 33,031 33,165
GrandTotal 43,764 44,089 44,354 44,604 44,716 44,787 44,850 44,823 44,912 45,046Source:CooperativeStrategies

87
System-wideEnrollmentProjectionsBased on the system-wide enrollment projections, using the total student population, it is anticipated thatenrollmentwillcontinuetoincreaseoverthenexttenyearsbyapproximately12,099students,amajorityofthatgrowthanticipatedinthefirstfive[5]years.Thesystem-wideenrollmentprojectionsweredevelopedusingthecohortsurvivalmethodology.A3-yearsimpleaverageofsurvivalratioswasused.LivebirthcountswereusedtoprojectPKandkindergartenenrollment;Adult,UG,andSPEDUGwerekeptflatatthecurrent2017-18enrollment.Thesearetheprojectionsthatthepost-baselineenrollmentprojectionbyschoolroll-upshouldbereconciledto.Theseenrollmentprojections relate toStep8of Section6:ProposedProcessandMethodology forDevelopingEnrollmentProjectionsbySchool
Thedarkershadesofbluerepresentsmallercohortswhilethedarkershadesofredrepresentlargercohortsincomparisontothehistorical,andalloftheprojecteddistrict-wideenrollment.
ProjectedEnrollment-3YearSimpleAverage-System-wideGrade 2018-19 2019-20 2020-21 2021-22 2022-23 2023-24 2024-25 2025-26 2026-27 2027-28PK3 5,716 5,885 5,761 5,761 5,761 5,761 5,761 5,761 5,761 5,761PK4 7,226 7,269 7,484 7,326 7,326 7,326 7,326 7,326 7,326 7,326K 7,435 7,636 7,682 7,909 7,742 7,742 7,742 7,742 7,742 7,7421 7,205 7,180 7,374 7,418 7,638 7,477 7,477 7,477 7,477 7,4772 6,924 6,926 6,902 7,089 7,131 7,342 7,187 7,187 7,187 7,1873 6,575 6,696 6,698 6,675 6,855 6,897 7,100 6,951 6,951 6,9514 6,354 6,366 6,483 6,485 6,463 6,637 6,677 6,875 6,730 6,7305 6,178 6,235 6,247 6,362 6,364 6,342 6,513 6,552 6,746 6,6046 5,830 5,902 5,957 5,968 6,078 6,080 6,059 6,222 6,259 6,4457 5,134 5,753 5,824 5,878 5,889 5,998 5,999 5,979 6,140 6,1778 4,830 5,058 5,668 5,738 5,791 5,802 5,909 5,911 5,890 6,0499 5,859 6,305 6,603 7,399 7,490 7,559 7,573 7,713 7,715 7,68810 4,297 4,313 4,641 4,860 5,446 5,513 5,564 5,575 5,677 5,67911 4,289 4,040 4,055 4,364 4,570 5,120 5,184 5,232 5,241 5,33812 3,888 4,056 3,821 3,835 4,127 4,321 4,842 4,902 4,947 4,957
Adult 4,951 4,951 4,951 4,951 4,951 4,951 4,951 4,951 4,951 4,951UG 141 141 141 141 141 141 141 141 141 141
SPEDUG 384 384 384 384 384 384 384 384 384 384GrandTotal 93,216 95,096 96,676 98,543 100,147 101,393 102,389 102,881 103,265 103,587
Source:CooperativeStrategies
ProjectedEnrollment-3YearSimpleAverage-System-wideGrade 2018-19 2019-20 2020-21 2021-22 2022-23 2023-24 2024-25 2025-26 2026-27 2027-28PK 12,942 13,154 13,245 13,087 13,087 13,087 13,087 13,087 13,087 13,087K-5 40,671 41,039 41,386 41,938 42,193 42,437 42,696 42,784 42,833 42,6916-8 15,794 16,713 17,449 17,584 17,758 17,880 17,967 18,112 18,289 18,6719-12 18,333 18,714 19,120 20,458 21,633 22,513 23,163 23,422 23,580 23,662Other 5,476 5,476 5,476 5,476 5,476 5,476 5,476 5,476 5,476 5,476K-12 74,798 76,466 77,955 79,980 81,584 82,830 83,826 84,318 84,702 85,024
GrandTotal 93,216 95,096 96,676 98,543 100,147 101,393 102,389 102,881 103,265 103,587Source:CooperativeStrategies

88
EnrollmentProjectionsBasedonResidenceEnrollmentprojectionsbasedonboundaryofresidenceareusefulforplanningschoolfacilitiesand/orattendanceboundaries.Knowingifthestudentpopulationinaboundaryisincreasingordecreasingprovidesguidanceforcapitalplanning.WhilethisenrollmentprojectionisnotgermanetotheprocessrecommendationsinSection6:ProposedProcessandMethodologyforDevelopingEnrollmentProjectionsbySchool,theseenrollmentprojectionscanbeextremelyusefulinfacilityandboundaryplanning.
HistoricalEnrollmentStudentdatabyaddresspointsforschoolyears2013-14through2017-18,providedbyOSSE,weregeocodedandaggregatedtotheDCPSelementaryboundaries.HistoricalenrollmentintheDistrictofColumbia(DCPSandPCSschools),basedonthestudentdata,increased9,194students,orapproximately11percent,fromthe2013-14tothe2017-18schoolyear.Itshouldbenotedthattheoverallhistoricalenrollmentbetweenthebaselinebyschooland elementary boundary (residence) projections differ (due to being different data sets) and therefore theenrollment projections presented also differ. In addition, aggregating the data differently will yield differentresults.
Thedarkershadesofbluerepresentsmallercohortswhilethedarkershadesofredrepresentlargercohortsincomparisontothehistorical,andalloftheprojecteddistrict-wideenrollment.
1
HistoricalEnrollment-System-wide(basedonResidence)Grade 2013-14 2014-15 2015-16 2016-17 2017-18PK3 5,133 5,495 5,333 5,608 5,686PK4 6,734 6,801 6,983 6,949 7,041K 7,174 7,268 7,319 7,578 7,4651 6,787 7,036 7,056 7,139 7,2222 6,005 6,659 6,789 6,827 6,8203 5,479 5,848 6,464 6,594 6,6024 4,826 5,294 5,701 6,293 6,3395 4,648 4,830 5,250 5,601 6,1596 4,452 4,649 4,703 5,036 5,2707 4,617 4,468 4,603 4,665 4,9728 4,425 4,604 4,429 4,566 4,5679 6,085 6,510 6,499 6,552 6,06610 4,370 4,284 4,350 4,610 4,68711 3,786 3,916 4,034 4,115 4,22012 3,267 3,415 3,702 3,629 3,862
Adult 4,788 4,234 4,176 4,971 4,951UG 159 940 509 NA NA
GrandTotal 82,735 86,251 87,900 90,733 91,929Source:OSSEStudentData
HistoricalEnrollment-System-wide(basedonResidence)Grade 2013-14 2014-15 2015-16 2016-17 2017-18PK 11,867 12,296 12,316 12,557 12,727K-5 34,919 36,935 38,579 40,032 40,6076-8 13,494 13,721 13,735 14,267 14,8099-12 17,508 18,125 18,585 18,906 18,835Other 4,947 5,174 4,685 4,971 4,951K-12 65,921 68,781 70,899 73,205 74,251
GrandTotal 82,735 86,251 87,900 90,733 91,929Source:OSSEStudentData

89
BirthDataResidentlivebirthcountsbyaddresswereprovidedbytheDistrictofColumbiaDepartmentofHealth,aggregatedbyelementaryboundary,andusedtoprojectkindergartenenrollmentofstudentslivingwithineachelementaryboundary.Itshouldbenotedthatactuallivebirthcountsareavailablethrough2016andprojectkindergartenenrollmentthrough2021-22.Toprojectkindergartenthrough2027-28,anaveragenumberoflivebirthsforthe3mostrecentyearsofavailabledatawasused.
SurvivalRatiosThefollowingtableillustratesthehistoricalsurvivalratiosinD.C.(basedonthestudentdata)overthepasttenyearsbygradelevel.
EnrollmentProjectionsEnrollmentprojectionsweredevelopedbasedontheresidenceofwherestudents(DCPSandPCS)livewithinDCPSelementaryboundaries.Theenrollmentprojectionsweredevelopedusingthecohortsurvivalmethodology.A3-yearsimpleaverageofsurvivalratioswasused.Livebirthcountswereusedtoprojectkindergartenenrollment;PKandAdultwerekeptflatatthecurrent2017-18enrollment.
SurvivalRatios-System-wide(basedonResidence)from to BirthtoK Kto1 Birthto1 1to2 2to3 3to4 4to5 5to6 6to7 7to8 8to9 9to10 10to11 11to122013 2014 80.69% 98.08% 77.03% 98.11% 97.39% 96.62% 100.08% 100.02% 100.36% 99.72% 147.12% 70.40% 89.61% 90.20%2014 2015 79.94% 97.08% 78.34% 96.49% 97.07% 97.49% 99.17% 97.37% 99.01% 99.13% 141.16% 66.82% 94.16% 94.54%2015 2016 81.58% 97.54% 77.97% 96.75% 97.13% 97.35% 98.25% 95.92% 99.19% 99.20% 147.93% 70.93% 94.60% 89.96%2016 2017 79.59% 95.30% 77.75% 95.53% 96.70% 96.13% 97.87% 94.09% 98.73% 97.90% 132.85% 71.54% 91.54% 93.85%

90
Thedarkershadesofbluerepresentsmallercohortswhilethedarkershadesofredrepresentlargercohortsincomparisontothehistorical,andalloftheprojecteddistrict-wideenrollment.
ProjectedEnrollment-System-wide(basedonResidence)Grade 2018-19 2019-20 2020-21 2021-22 2022-23 2023-24 2024-25 2025-26 2026-27 2027-28PK3 5,686 5,686 5,686 5,686 5,686 5,686 5,686 5,686 5,686 5,686PK4 7,041 7,041 7,041 7,041 7,041 7,041 7,041 7,041 7,041 7,041K 7,530 7,736 7,824 8,095 7,885 7,885 7,885 7,885 7,885 7,8851 7,263 7,337 7,519 7,616 7,879 7,674 7,674 7,674 7,674 7,6742 6,998 7,027 7,098 7,284 7,374 7,638 7,432 7,432 7,432 7,4323 6,663 6,842 6,879 6,952 7,124 7,220 7,484 7,276 7,276 7,2764 6,440 6,493 6,677 6,715 6,799 6,966 7,054 7,317 7,116 7,1165 6,285 6,374 6,443 6,625 6,659 6,750 6,918 7,010 7,281 7,0746 5,929 6,053 6,120 6,186 6,394 6,407 6,508 6,672 6,768 7,0397 5,244 5,893 6,022 6,090 6,157 6,372 6,381 6,483 6,650 6,7418 4,944 5,219 5,859 5,988 6,049 6,119 6,324 6,339 6,442 6,5989 6,497 6,989 7,359 8,290 8,454 8,541 8,616 8,912 8,915 9,07610 4,266 4,569 4,929 5,193 5,855 5,978 6,044 6,105 6,327 6,33611 4,412 4,017 4,302 4,638 4,890 5,517 5,621 5,704 5,756 5,96912 3,944 4,124 3,752 4,018 4,335 4,576 5,158 5,258 5,335 5,385
Adult 4,951 4,951 4,951 4,951 4,951 4,951 4,951 4,951 4,951 4,951GrandTotal 94,093 96,351 98,461 101,368 103,532 105,321 106,777 107,745 108,535 109,279
Source:CooperativeStrategies
ProjectedEnrollment-System-wide(basedonResidence)Grade 2018-19 2019-20 2020-21 2021-22 2022-23 2023-24 2024-25 2025-26 2026-27 2027-28PK 12,727 12,727 12,727 12,727 12,727 12,727 12,727 12,727 12,727 12,727K-5 41,179 41,809 42,440 43,287 43,720 44,133 44,447 44,594 44,664 44,4576-8 16,117 17,165 18,001 18,264 18,600 18,898 19,213 19,494 19,860 20,3789-12 19,119 19,699 20,342 22,139 23,534 24,612 25,439 25,979 26,333 26,766Other 4,951 4,951 4,951 4,951 4,951 4,951 4,951 4,951 4,951 4,951K-12 76,415 78,673 80,783 83,690 85,854 87,643 89,099 90,067 90,857 91,601
GrandTotal 94,093 96,351 98,461 101,368 103,532 105,321 106,777 107,745 108,535 109,279Source:CooperativeStrategies

91
InteractiveDashboardAll information used in this process has been placed in an interactive dashboard, which is available atdcauditor.org.DuetoFERPAprivacyrequirements,anysubgroupinformationthatisrepresentativeoflessthan10studentsorencompassesallstudentsmayhavebeensuppressed.
School-leveldataavailableonthedashboardincludes:
BackgroundDataSheet
• LEA• Address• Schoollocationmap(includesprogramlocationsoverthepast10years)• Cluster• Ward• Yearsopen• Totalenrollment(2017-18)• Historicalenrollment(2008-2017)• Capacity(permanentandtemporary)• Buildingsquarefootage• Racialmakeup• Specialeducationpercentage*
o Levels1-4*• Freeorreducedlunchpercentage*• LimitedEnglishproficiency(LEP)percentage*• Atriskpercentage*• Mobilitystatus
o 2015-2017

92
• Highschoolboundaryo Buildingpermitcountsbyyearo Totalpopulation(2017)o Medianhomevalue(2017)
BaselineProjectionSheet
• Feederpatterninformation• Birthdata(2009-2017)• Historicalenrollment(2008-2017)• Survivalratios• Baselineprojectedenrollment(2018-19–2027-28)
ResidenceProjectionSheet
• Historicalandprojectedenrollment(2013-14–2027-28)• Birthsbyboundary(2003-2016)• Survivalratios
*DenotesdatathatissubjecttosuppressionduetoFERPArequirements.
1ThefollowingschoolsarenotincludedinthehistoricalenrollmentanalyzedinthisstudybutareincludedinthetotalOSSEAuditedEnrollmentReport:
• Non-Public• GeneralEducationResidentialStudents• InspiringYouthProgram(Incarcerated)• MayaAngelouAcademyatNewBeginnings• HeadstartPhase2• HeadstartSpanishDevelopment

93
ConclusionPredictingfuturepublic-schoolenrollment,particularlyinadynamicschoolchoiceenvironmentliketheDistrictof Columbia, is challenging. Potential changes in the regional economy, school openings and closings, andchangingperceptionsofschoolqualityallinteractinwaysthatrequireongoingcollectionandanalysisofdatabypeoplewithlocalknowledgeandwithtechnicalskills.Evenwithsoundprocessesforcapturinglocalknowledgeandusingtechnicalsupport,thereisnocrystalballforprojectingenrollment.
TheStudyTeamapproachedtheresearchtofocusonimprovingtheaccuracyofenrollmentprojections intheDistrictofColumbia.Ineachstudyeffort,thequestionofimpactonaccuracywasraised.InSection1:DynamicCityandSchools,thequestionwas“whatfactorsappearedtoaffecttheschoolsupplyandparentaldemandandwhat information isneededtomakeaccurateprojections?” InSection2and3:BestPracticesandPractices inComparableCities thequestionwas,“canwefindprocessesormethods fromothercitiesandstates thatwillimprovetheaccuracyofDC’senrollmentprojections?”InSection4:ProcessandMethods,thequestionswere“whatprocessesandmethodsareusedbytheagencies?”and“dotheyleadtoaccurateprojections?”InSection5:TestingandDevelopingMethods,wecomparedtheprojectionsdonebyDCPSandPCStoactualenrollmentstounderstandwhatmightberequiredtoimprovethemethods;andwetestedastandardprojectionmethodologyinablindstudytodeterminewhetheritwaspossibletoachieveaccurateprojectionsusingestablishedindustryplanningstandardmethods,andfinally,wetestedahypothesisthathighlevelsofstudentmobilitywouldstronglycorrelatetohighlevelsofprojectionerror.
Theprimaryconcernthroughthestudywashowtoimproveprojectionsbyschoolsincetheimpactoferrorsattheschoollevelcansignificantlyaffectresourceequityforlocalschoolbudgets.Errorsinschoollevelprojectionscanaffectwhetheraneighborhoodwillhaveaccesstoadequatecapacityinaschoolbeingplannedanddesigned.Errorsinschoollevelprojectionscanaffectwhetheracharterenrollmentcapisappropriate,orwhetheranewcharterisauthorized.Itisclearfromthestudythatgettingaccurateprojectionsbyschoolbygradeisextremelydifficult.
Whilethedataandinformationcollectionandcompilationwasonerous,theTeamfoundmuchgoodprocessandmethodologyusedbytheDistrict.IftheDistrictadoptstheproposedrecommendations,therewouldbeamuchclearerpathtoshortandlong-termenrollmentprojectionsandincreasedaccuracyattheDistrictbygradelevel.Byusingawell-managedsetofat least tenyearsof longitudinalstudentandschool-leveldataandapplyingacohortsurvivalratiotobirthsandgradetogradechange,theDistrictshouldbeabletoreliablyprojectitsnextyearbudgetrequirementsbygradeandsub-groupandsupportlong-termenrollmentprojectionsandplanning.
However,thereareintrinsicchallengestoaccurateprojectionsinmobilepopulationsthataresmall,assomanyD.C.publicschoolsare.Becauseoftheinherentchallengestothis,thestudymayraisesomeotherquestions.
Wehopethisstudywillopenupdialogueinthecityonschoolplanningandbudgeting.Officialsandcitizensalikecanusethefindingsandquestionsraisedbythisstudytoexploreimprovementstopubliceducationplanningandbudgeting processes, to the benefit of the public schools for the families and communities in the District ofColumbia,notjustforthemoment,butforgenerationstocome.

94
Acknowledgements
OnbehalfofCooperativeStrategiesinpartnershipwiththe21stCenturySchoolFundandtheUrbanInstitute,wewouldliketoextendourappreciationtotheOfficeoftheD.C.AuditorfortheopportunitytoprovidethisStudyofEnrollmentinD.C.PublicSchoolsIncludingCurrentMethodologyandFutureProjections.Inaddition,wewouldliketothanktheagenciesthatprovidedthedataanalyzedinthisstudy.
Theyinclude:
• Association of Independent Schools ofGreaterWashington
• D.C. Health, Center for Policy Planning &Evaluation
• D.C.OfficeofPlanning(OP)• D.C.PublicCharterSchoolBoard(PCSB)• DepartmentofGeneralServices(DGS)• DistrictofColumbiaPublicSchools(DCPS)• MySchoolD.C.
• Office of the Deputy Mayor of Education(DME)
• OfficeoftheChiefFinancialOfficer(OCFO)• Office of the Chief Technology Officer
(OCTO)• Office of the State Superintendent of
Education(OSSE)• PublicCharterSchools(PCS)

95
CooperativeStrategies3325HilliardRomeRd.,HilliardOH,43026
www.coopstrategies.comTracyRichter,President,Partner
ScottLeopold,PartnerDavidSturtz,Partner
AnnHoffsis,SeniorDirectorAlexBoyer,AssociateDirector
21stCenturySchoolFundThurgoodMarshallCenter
181612thStreetNWWashington,DC20009www.21csf.org
MaryFilardo,ExecutiveDirectorNancyHuvendick,DCProgramDirector
WillPerkins,ResearchandPolicyAssociate
UrbanInstitute2100MStreetNW,Washington,DC20037
https://www.urban.orgStevenMartin,SeniorResearchAssociate
MeganGallagher,SeniorResearchAssociateYipengSu,ResearchAnalyst
ConstanceLindsay,ResearchAssociatePeterTatian,SeniorFellowandResearchDirectorforUrban-GreaterDC
GrahamMacDonald,ChiefDataScientist

Agency Comments

97
GOVERNMENT OF THE DISTRICT OF COLUMBIA Executive Office of Mayor Muriel Bowser
Office of the Deputy Mayor for Education
_____________________________________________________________________________________________ John A. Wilson Building | 1350 Pennsylvania Ave., NW, Suite 513 | Washington, DC 20004
September 14, 2018 Kathleen Patterson District of Columbia Auditor 717 14th Street NW, Suite 900 Washington, DC 20005 Dear Ms. Patterson: The Deputy Mayor for Education (DME) and District education agencies appreciate the opportunity to review and respond to your comprehensive and informative report, Study of Enrollment in D.C. Public Schools, researched and written by Cooperative Strategies, the Urban Institute, and the 21st Century School Fund. As the authors’ found, the next year enrollment projection process is complex and challenging due to Washington, DC’s high choice school system and our growing population. Even recognizing this, total general education enrollment projections of District of Columbia Public Schools (DCPS) and the public charter local education agencies (LEAs), under DME’s management, have been quite accurate and we are already implementing many of the gold standard approaches recommended. The District’s population started growing after 2000 and is now over 700,000 residents. Our child population has also increased by approximately 23,600 children between 2010 and 2017. Families have more confidence in our schools, as evidenced by the growing public school enrollment and the growing share of all Washington, DC students choosing to enroll in the public school system instead of private schools. Washington, DC’s educational system is also dynamic, as the report accurately noted. All families – regardless of economic status – deserve options, which include DCPS schools of right; DCPS out of boundary, selective, and citywide schools; and public charter schools. Our enrollment policies support school choice as opposed to assigning students to just one school option based on geography. DCPS and the DC Public Charter School Board have opened and closed schools over the last decade, and public charter school locations have changed depending on facility availability and replication and expansion of programs. The District has made historic investments in DCPS school modernizations over the last 10 years. We have also increased the public charter school facility allotment recently and committed to doing so for three additional fiscal years.
98
_____________________________________________________________________________________________ John A. Wilson Building | 1350 Pennsylvania Ave., NW, Suite 513 | Washington, DC 20004
DME is committed to ensuring that the DCPS and public charter next-year enrollment projections are as accurate as possible so that schools have the funds they need and the city has the appropriate amount of money budgeted. The projections are critical to ensure that LEAs receive sufficient funding to operate their schools, in both the DCPS and charter school sectors. Accurate budgeting also ensures that the city does not have to face a budget shortfall: if the projections are too low, the District must find contingency funds after the budget has already been approved and committed. Currently, DME manages the enrollment projection process and submits the final Uniform per Student Funding Formula (UPSFF) grade and special need enrollment projections to the Office of Budget and Performance to be considered by the Mayor and included in her budget. The DCPS sector-wide UPSFF enrollment projections take into account mid-year enrollment, since DCPS is the system of right in the District of Columbia and they tend to gain net two percent in enrollment during the course of the school year. DCPS’s total general enrollment projections have been between 97% and 99% accurate compared to DCPS’s highest enrollment for FY14 through FY17. We found a number of the study’s findings informative. First, it was helpful to learn about other enrollment project practices from comparable school districts and states. DCPS has been implementing what is considered the gold standard for the past 10 years, the cohort survival method and adjustment of projections based on expert on-the-ground knowledge through a centralized portal. Second, the authors’ analysis of the accuracy of the DCPS and public charter school projections was also informative, as they showed that the accuracy of DCPS enrollment projections has improved over time. The study provided information about how close the projections were and in which direction they were off – some wards’ projections were quite accurate (particularly Ward 3) while others wards (particularly Wards 5, 7, and 8) were less accurate than the average. We found it very interesting that student mobility contributes to inaccuracies when just the cohort survival method (without the expert adjustments that are implemented by DCPS and the public charter LEAs) is compared to the audited enrollments. We had hoped that the authors would have analyzed how accurate the DCPS district-wide grade-band projections (e.g., early childhood, elementary, middle, and high school grades) were compared to the October audited enrollment instead of just at the school level. DCPS adjusts funding and resources to individual schools if the schools are identified as being under projected. DCPS will continue to analyze how close its grade band projections are to actual enrollment. The authors identified the need to do long-term five or 10 year enrollment projections at the individual school level for facility planning purposes, separate from enrollment projections as a next year budgeting exercise. DME agrees and recognizes the importance of long-term projections; five and 10 year school-level enrollment projections were included in the 2018 Master Facilities Plan scope of work commissioned in February 2018. These longer-term enrollment projections are critical to inform more immediate modernization efforts as well future capital plans. The findings from this study, in addition to the analysis provided in the forthcoming 2018 Master Facilities Plan, will help inform how we address five and 10 enrollment projections in the future. The authors recommend that the administration compile longitudinal information, at the school, facility, and neighborhood levels, to help assist with both the one-year enrollment projections for budgeting and longer-term facility enrollment projection processes. The DC Cross Sector Collaboration Task Force, commissioned by Mayor Bowser and co-chaired by the Deputy Mayor for Education, came to the same conclusion. The forthcoming report from this Task Force will recommend

99
_____________________________________________________________________________________________ John A. Wilson Building | 1350 Pennsylvania Ave., NW, Suite 513 | Washington, DC 20004
that such data and information be compiled by DME to help support the decisions made around opening and siting of schools and programs. This effort will also benefit the enrollment projection (short and long term) process as well. There is substantial overlap in the specific metrics recommended by the study authors and the Task Force, and the DME will consider incorporating the additional data metrics the authors recommended. While the majority of the report was informative, there are sections that we believe are inaccurate. The authors did not clarify that the DCPS projections process involves two internal steps resulting in the overall DCPS LEA-level projections. The report fails to include how the DCPS Office of Strategic School Planning and Enrollment provides the DCPS Office of the Chief Business Officer the school-level projections. The Office of the Chief Business Officer then develops DCPS’s LEA UPSFF projections, which include the additional 2% for mid-year mobility. DME itself does not add the 2% to DCPS’ enrollment projections. Additionally, the Office of the Chief Business Officer provides the LEA-level DCPS UPSFF enrollment projections to DME, not directly to the Office of the Chief Financial Officer, as stated in the report. Further, the report did not accurately or comprehensively describe the factors that the DCPS Office of Strategic School Planning and Enrollment uses when developing the school-level projections. The office does not take facility capacities into account for kindergarten through 12th grade projections; however, it does flag for DCPS internal review when projections exceed facility capacities. In the entry grade section of the report, the DCPS team also relies on cohort survival for its estimations for kindergarten and education campuses (pre-K through 8th grade). In addition, the DCPS Office of Strategic School Planning and Enrollment relies on district-wide grade band totals to monitor trends at the school level and district level, not just during the principal petition process. Finally, we want to clarify that while the report stated that public charter schools do not use estimates of their conversion rate to set their number of seats in the lottery, we know that some charters do set lottery seats and enrollment targets based on past conversion or capture from the lottery. We also must object to some recommendations. The authors recommend that the Office of the State Superintendent for Education (OSSE) take responsibility of the processes that LEAs are already performing well. This recommendation fundamentally intrudes on the Mayor’s prerogative to assign tasks to different agencies and offices – such as the DME or OSSE. Recommending that OSSE own responsibility to run individual school-level cohort analysis will not necessarily increase the accuracy of an admittedly difficult task. Legislating how LEAs and the District as a whole conduct their enrollment methodologies in such a dynamic and changing environment could potentially introduce more error. More importantly, shifting the responsibility of working with the LEAs away from DME to OSSE misses the critical role that DME plays in the development of the Mayor’s budget. Additionally, while we agree that conducting long-term enrollment projections are critical for facility planning, we do not believe it needs to be conducted simultaneously during the budget development. The budgetary enrollment projection process happens in a relatively short time period. DME believes the long-term projections should be coordinated with the Master Facilities Plan process, including the information provided annually.

100
_____________________________________________________________________________________________ John A. Wilson Building | 1350 Pennsylvania Ave., NW, Suite 513 | Washington, DC 20004
In sum, we appreciate this substantial piece of work that will inform not only our projections, but other aspects of research and planning, within the government and by others. We also look forward to working with our schools, school communities, and agencies to continue to improve upon our processes and help plan for the future. Sincerely,
Ahnna Smith, Interim Deputy Mayor for Education

Appendices

102
Appendix A - Page 1
Appendix A - Section 1: Dynamic City and Schools
First Choice Schools 2014-2016 Top 10 Schools Listed as First Choice Schools in My School DC Lottery
Top 10 Schools listed as a first choice in the 2014-2015 lottery
Top 10 Schools listed as a first choice in the 2015-2016 lottery
School NameCount of First
ChoiceSchool Without Walls High School 623Washington Latin PCS – Middle School 537Mundo Verde Bilingual PCS 485Two Rivers PCS 485Oyster-Adams Bilingual School 444Brent Elementary School 396Duke Ellington School of the Arts 382KIPP DC – LEAP Academy PCS 357McKinley Technology High School 348Capital City PCS – Lower School 329Source: Urban Institute tabulation of My School DC Lottery Data
School NameCount of First
ChoiceSchool Without Walls High School 594Washington Latin PCS – Middle School 486Mundo Verde Bilingual PCS 459Two Rivers PCS 452Washington Yu Ying PCS 433Oyster-Adams Bilingual School 408Duke Ellington School of the Arts 392KIPP DC – LEAP Academy PCS 346Brent Elementary School 345KIPP DC – College Preparatory PCS 329
Source: Urban Institute tabulation of My School DC Lottery Data

103
Appendix A - Page 2
Top 10 schools listed as a first choice in the 2016-2017 lottery
Top 10 Schools listed as a first choice in 2016-2017 lottery, by grade level
School NameCount of First
ChoiceWashington Latin PCS – Middle School 602School Without Walls High School 570Mundo Verde Bilingual PCS 469Rocketship DC PCS 419School-Within-School 404Creative Minds International PCS 397Washington Yu Ying PCS 386Two Rivers PCS at 4th Street 362Brent Elementary School 353Oyster-Adams Bilingual School (Oyster) 350
Source: Urban Institute tabulation of My School DC Lottery Data
Washington Latin PCS – Middle School PCS 602 - - - - - - - 295 152 93 62 - - - -School Without Walls High School DCPS 570 - - - - - - - - - - - 456 69 38 7Mundo Verde Bilingual PCS PCS 469 198 98 73 35 30 17 13 5 - - - - - - -Rocketship DC PCS PCS 419 94 66 113 83 63 - - - - - - - - - -School-Within-School DCPS 404 156 88 59 34 26 18 16 7 - - - - - - -Creative Minds International PCS PCS 397 161 65 53 43 28 18 13 8 8 - - - - - -Washington Yu Ying PCS PCS 386 163 85 70 42 26 - - - - - - - - - -Two Rivers PCS at 4th Street PCS 362 81 33 35 27 21 34 39 33 32 19 8 - - - -Brent Elementary School DCPS 353 94 84 43 40 30 26 18 18 - - - - - - -Oyster-Adams Bilingual School (Oyster) DCPS 350 - 150 74 53 43 30 - - - - - - - - -
7 8 9 10 11 121 2 3 4 5 6School Name SectorCount of
First Choice
PK3 PK4 K

104
Appendix A - Page 3
Top 10 schools listed as a first choice for PK3 in 2016-2017
School Name SectorCount of First
ChoiceMundo Verde Bilingual PCS PCS 198KIPP DC – LEAP Academy PCS PCS 168Washington Yu Ying PCS PCS 163Creative Minds International PCS PCS 161Ross Elementary School DCPS 158School-Within-School DCPS 156KIPP DC – Discover Academy PCS PCS 129Peabody Elementary School DCPS 114Hyde-Addison Elementary School DCPS 105DC Bilingual PCS PCS 101

105
Appendix A - Page 4
Top 10 schools listed as a first choice for 6th Grade in 2016-2017
Top 10 schools listed as a first choice for 9th Grade in 2016-2017
School Name SectorCount of First
ChoiceWashington Latin PCS – Middle School PCS 152Deal Middle School DCPS 121District of Columbia International School (Spanish Language Program) PCS 102BASIS DC PCS PCS 71MacFarland Middle School Dual Language Program DCPS 55KIPP DC – KEY Academy PCS PCS 53Howard University Middle School of Mathematics and Science PCS PCS 52Stuart-Hobson Middle School DCPS 52KIPP DC – AIM Academy PCS PCS 45District of Columbia International School (Chinese Language Program) PCS 44
School Name SectorCount of First
ChoiceSchool Without Walls High School DCPS 456KIPP DC – College Preparatory PCS PCS 271Duke Ellington School of the Arts DCPS 261Benjamin Banneker High School DCPS 226McKinley Technology High School DCPS 201Wilson High School DCPS 140Washington Leadership Academy PCS PCS 137Columbia Heights Education Campus 9-12 (CHEC) DCPS 135Washington Latin PCS – Upper School PCS 100Empowering Males High School DCPS 84

106
Appendix A - Page 5
Master Longitudinal Data Set See attached excel sheet “MasterLongitudinalDataSet.xlsx” for more information.
65 Independent and Religious Private Schools
DC PRIVATE SCHOOL School Type AISGW; DCOSP; AIMS Address Zip Ward
Academia De La Recta Porta Christian Day School
Independent Private Schools DCOSP 7614 Georgia Avenue NW 20012 4
Academy for Ideal Education Independent Private Schools DCOSP 4501 Dix Street NE 20019 5
Aidan Montessori School Independent Private Schools AISGW/DCOSP 2700 27th Street, NW 20008 3
Annunication School Archdiocese of Washington AISGW/DCOSP 3810 Massachusetts Ave.,
NW 20016 3
Archbishop Carroll HS Archdiocese of Washington AISGW/DCOSP 4300 Harewood Road NE 20017 5
Beauvoir, The National Cathedral Elem. School
Independent Private Schools AISGW/DCOSP 500 Woodley Road, NW 20016 3
Blessed Sacrament Archdiocese of Washington AISGW/DCOSP 5841 Chevy Chase
Parkway 20015 3
Blythe Templeton Academy Independent Private Schools DCOSP 921 Pennsylvania Avenue,
SE 2003 6
Calvary Christian Academy Independent Private Schools DCOSP 806 Rhode Island Avenue
NE 20018 5
Capitol Hill Day School Independent Private Schools AISGW 210 South Carolina
Avenue, SE 20003 6
Christian Family Montessori School Independent Private Schools DCOSP 201 Allison Street NW,
Suite B 20011 4
Cornerstone School Independent Private Schools AIMS/DCOSP 3742 Ely Place SE 20019 7
Dupont Park Adventist School (Alabama Ave.)
Independent Private Schools DCOSP 3942 Alabama Avenue SE 20020 7
Dupont Park Adventist School (Mass. Ave.)
Independent Private Schools DCOSP 3985 Massachusetts
Avenue SE 20020 7
Edmund Burke School Independent Private Schools AISGW/DCOSP/AIM 4101 Connecticut Avenue,
NW 20008 3
Emerson Prepartory School Independent Private Schools AIMS/DCOSP 1816 12th St, NW 20009 4
Georgetown Day School (High School) Independent Private Schools AISGW/DCOSP 4200 Davenport Street
NW 20016 3
Georgetown Day School (Lower/Mid. School)
Independent Private Schools AISGW/DCOSP 4530 MacArthur Blvd.,
NW 20007 3
Georgetown Visitation Preparatory School
Independent Private Schools AISGW/DCOSP 1524 35th Street, NW 20007 3

107
Appendix A - Page 6
DC PRIVATE SCHOOL School Type AISGW; DCOSP; AIMS Address Zip Ward
Gonzaga College High School Independent Private Schools AISGW/DCOSP 19 Eye Street, NW 20001 6
Holy Trinity School Archdiocese of Washington AISGW/DCOSP 1325 36th Street, NW 20007 2
Howard University Early Learning Program
Independent Private Schools DCOSP 531 College Street NW 20059 1
Jewish Primary Day School of the Nation's Capital (North Campus); Also Milton Gottesman Jewish Day School of the Nation's Capital
Independent Private Schools AISGW/DCOSP/AIM 6045 16th Street NW 20011 4
Jewish Primary Day School of the Nation's Capital (South Campus) Also Milton Gottesman Jewish Day School of the Nation's Capital
Independent Private Schools AISGW/DCOSP/AIM 4715 16th Street NW 20011 4
Kuumba Learning Center Independent Private Schools DCOSP 3328-3332 MLK Jr. Avenue
SE 20032 8
Little Flower Montessori School Independent Private Schools DCOSP 3029 16th Street NW 20009 1
Little Folks School Independent Private Schools AISGW 3247 Q Street NW 20007 2
Lowell School Independent Private Schools AISGW/DCOSP/AIM 1640 Kalmia Road, NW 20012 4
Maret School Independent Private Schools AISGW/AIM 3000 Cathedral Avenue,
NW 20008 3
Mysa School Independent Private Schools NA 1801 35th St. NW (Filmore
School) 20007 2
National Cathedral School Independent Private Schools AISGW/DCOSP/AIM 3612 Woodley NW 20016 3
National Child Research Center Independent Private Schools AISGW/AIM 3209 Highland Place, NW 20008 3
National Presbyterian School Independent Private Schools AISGW/DCOSP/AIM 4121 Nebraska Avenue,
NW 20016 3
Our Lady of Victory School Archdiocese of Washington DCOSP 4755 Whitehaven Parkway 2007 3
Parkmont School Independent Private Schools AISGW/DCOSP/AIM 4842 16th Street, NW 20011 4
Preparatory School of DC Independent Private Schools DCOSP 4501 16th Street NW 20011 4
Randall Hyland Private School Independent Private Schools DCOSP 4339 Bowen Road SE 20019 7
Roots Activity Learning Center Independent Private Schools DCOSP 6222 North Capitol St.,
NW 20011 4
Sacred Heart Bilingual School Archdiocese of Washington DCOSP 1625 Park Road, NW 20010 1
San Miguel School Indepenent Catholic DCOSP 7705 Georgia Avenue NW 20012 4

108
Appendix A - Page 7
DC PRIVATE SCHOOL School Type AISGW; DCOSP; AIMS Address Zip Ward
Sheridan School Independent Private Schools AISGW/DCOSP/AIM 4400 36th Street, NW 20008 3
Sidwell Friends School Independent Private Schools AISGW/DCOSP/AIM 3825 Wisconsin Avenue,
NW 20016 3
St. Albans School (Washington, DC) Independent Private Schools AISGW/DCOSP/AIM 3101 Wisconsin Ave., NW 20016 3
St. Anselm's Abbey School (Washington, DC)
Independent Private Schools AISGW/DCOSP/AIM 4501 South Dakota
Avenue, NE 20017 5
St. Anthony Catholic School Archdiocese of Washington DCOSP 3400 12th Street, NE 2017 5
St. Augustine Catholic Academy Archdiocese of Washington DCOSP 1421 V St., NW 20009 5
St. Columba's Nursery School Independent Private Schools AISGW 4201 Albemarle Street NW 20016 3
St. Francis Xavier Catholic Academy Archdiocese of Washington DCOSP 2700 O St., SE 20020 7
St. John's College High School Independent Private Schools AISGW/DCOSP 2607 Military Road, NW 20015 4
St. Patrick's Episcopal Day School Independent Private Schools AISGW 4700 Whitehaven
Parkway, NW 20007 3
St. Peter's School Archdiocese of Washington DCOSP 422 Third Street SE 20003 6
St. Thomas More Academy Archdiocese of Washington DCOSP 4265 Fourth Street SE 20032 8
The Bishop Walker School for Boys Independent Private Schools AISGW/DCOSP
3640 Martin Luther King, Jr. Avenue SE; (Holy
Communion Campus) 20032 8
The Bishop Walker School for Boys Independent Private Schools AISGW/DCOSP
2683 Douglass Road SE; (Washington View
Campus) 20020 8
The Bridges Academy Independent Private Schools DCOSP 6119 Georgia Avenue NW 20011 4
The Field School Independent Private Schools AISGW/DCOSP 2301 Foxhall Road, NW 20007 3
The Kingsbury Day School Independent Private Schools AISGW/DCOSP/AIM 5000 14th Street, NW 20011 4
The Lab School of Washington Independent Private Schools AISGW/AIM 4759 Reservoir Road, NW 20007 3
The Monroe School Independent Private Schools DCOSP 601 50th Street NE 20019 5
The River School Independent Private Schools AISGW/AIM 4880 MacArthur
Boulevard, NW 20007 3
Washington International School Independent Private Schools AISGW 3100 Macomb Street, NW 20008 3
Washington Jesuit Academy Independent Private Schools AISGW/AIM 900 Varnum Street, NE 20017 5

109
Appendix A - Page 8
DC PRIVATE SCHOOL School Type AISGW; DCOSP; AIMS Address Zip Ward
Washington School for Girls Archdiocese of Washington AISGW/DCOSP 1901 Mississippi Avenue,
SE, THE ARC; 20020 8
Washington School for Girls Archdiocese of Washington AISGW/DCOSP 1600 Morris Road, S.E
(VIEW Campus) 20020 8
The Children's House of Washington Independent Private Schools 3133 Dumbarton St., NW 20007 2

110
Appendix B – Page 1
Appendix B - Processes & Methods in Comparable Cities
Interview Questions for Comparable Districts
District – Survey Questions
1. Contact information: a. School District Name b. Your name c. Title d. Email e. Phone
2. Does your school district develop enrollment projections (internally or with external organizations)?
a. Yes b. No
(if yes, continue with survey)
3. Who develops the enrollment projections for your school district? a. Consultants b. Internal staff c. Other (please specify)
4. How many years are enrollment projections developed for? a. 1 year b. 5 years c. 10 years d. Other (please specify)
5. What is the primary purpose of these enrollment projections? a. Budgeting b. Facility Planning

111
Appendix B – Page 2
c. Both equally d. Other (please specify)
6. What is the level of detail the enrollment projections are developed to? (Please select all that apply.)
a. District-wide b. By grade c. By school d. By geographic region e. Other (please specify)
7. Are enrollment projections made public or used internally only? a. Public b. Internal c. Other (please specify)
8. Are there state regulations that need to be followed in the development of enrollment projections?
a. Yes b. No c. Other (please specify)
9. What factors do you believe impacts enrollment in your District? (Please select all that apply.)
a. Charter schools (openings, closings, growth, etc.) b. Capacity c. Enrollment caps (on public, charter, private schools, etc.) d. Lottery and/or magnet schools e. Program placement and movement f. Open enrollment (inter- and intra-district) g. Choice h. Transfers i. Facility planning (opening and closing) j. Redistricting/Boundary changes k. Policy changes l. New housing development

112
Appendix B – Page 3
m. Economic growth/decline n. Private/non-public schools (openings, closings, growth, etc.) o. Homeschool (growth, decline, etc.) p. Other (please specify)

113
Appendix B – Page 4
District – Interview Questions (face-to-face)
1. District Contact information (of interviewee): a. School District Name b. Name c. Title d. Email e. Phone
(if yes, to question 2 on survey – Do you develop enrollment projections?)
2. What is the data used to develop the enrollment projections? a. Live births? b. Housing? c. How much historical enrollment? What kind of historical enrollment (official
headcount, ADM, etc.)?
3. What is the methodology used to develop the enrollment projections? a. Cohort model? b. Housing Model? c. Feedback collected?
4. Why do you believe the factors (checked in q. 9 of survey) impact enrollment and how are they factored into the development of enrollment projections?
a. Charter schools (openings, closings, growth, etc.) b. Capacity c. Enrollment caps (on public, charter, private schools, etc.) d. Lottery and/or magnet schools e. Program placement and movement f. Open enrollment (inter- and intra-district) g. Choice h. Transfers i. Facility planning (opening and closing) j. Redistricting/Boundary changes k. Policy changes l. New housing development

114
Appendix B – Page 5
m. Economic growth/decline n. Private/non-public schools (openings, closings, growth, etc.) o. Homeschool (growth, decline, etc.) p. Other (please specify)
If yes to question 8 on survey (Are there state regulations that need to be followed in the development of enrollment projections?)
5. What are the state regulations that need to be followed in the development of enrollment projections? (provide description and documentation)
Based on answer to question 5 on survey (What is the primary purpose of these enrollment projections?)
6. Elaborate on how the enrollment projections are used to budget and/or plan (or other).
(if no to question 2 on survey – Do you develop enrollment projections?)
7. How do you budget or plan? (Does the state provide enrollment projections to you? Please elaborate.)

115
Appendix B – Page 6
State Agency – Interview Questions (face-to-face)
1. State Agency Contact information (of interviewee): a. State Agency Name b. Name c. Title d. Email e. Phone
2. Are enrollment projections developed or utilized by the state? a. Yes
i. Developed ii. Utilized (provided by District)
b. No c. Other
If yes to #2: (developed by state):
3. Are enrollment projections approved by school districts? Is there an appeals process? (If so, please describe processes.)
4. Who develops the enrollment projections for the state? a. Consultants b. Internal staff c. Other (please specify)
5. How many years are enrollment projections developed for? a. 1 year b. 5 years c. 10 years d. Other (please specify)
6. What is the level of detail the enrollment projections are developed to? (Please select all that apply.)
a. District-wide b. By grade c. By school d. By geographic region e. Other (please specify)
7. What is the data used to develop the enrollment projections? a. Live births?

116
Appendix B – Page 7
b. Housing? c. How much historical enrollment? What kind of historical enrollment (official
headcount, ADM, etc.)? 8. What is the methodology used to develop the enrollment projections?
a. Cohort model? b. Housing Model? c. Feedback collected?
9. Are any of the following factored into the development of enrollment projections? If so, how?
a. Charter schools (openings, closings, growth, etc.) b. Capacity c. Enrollment caps (on public, charter, private schools, etc.) d. Lottery and/or magnet schools e. Program placement and movement f. Open enrollment (inter- and intra-district) g. Choice h. Transfers i. Facility planning (opening and closing) j. Redistricting/Boundary changes k. Policy changes l. New housing development m. Economic growth/decline n. Private/non-public schools (openings, closings, growth, etc.) o. Homeschool (growth, decline, etc.) p. Other (please specify)
If yes to #2: (utilized - provided by District):
10. Are there guidelines/regulations school districts must follow for development of enrollment projections submitted to the state? (i.e., methodology, data, documentation, etc.) (Provide description and get documentation, if available)
11. Does the state need to review/approve the enrollment projections submitted by school districts? (If so, please describe approval process.)
12. What is the primary purpose of enrollment projections at the state level? a. Plan for state share of education operating budget b. Plan for state share of capital outlay facility / capital funding approvals c. Both equally d. Other (please specify)

117
Appendix B – Page 8
If no to #2:
1. How are school facilities planned/funded? 2. How are budgets established?

118
Appendix B – Page 9
Sample District Letter

119
Appendix B – Page 10
Sample State Letter

120
Appendix C – Page 1
Appendix C – Testing and Developing Methods for D.C. Projection to Enrollment Ratios by Ward for DCPS
FIGURE 2A – 2H Ratios of Projected to Audited Enrollments for DCPS Schools 2013/14 to 2017/18, By Ward 2A: Ward 1 2B: Ward 2 2C: Ward 3 2D: Ward 4 2E: Ward 5 2F: Ward 6

121
Appendix C – Page 2
2G: Ward 7 2H: Ward 8
Projection to Enrollment Ratios by Year for DCPS
FIGURE 3A – 3E Ratios of Projected to Audited Enrollments for DCPS Schools 2013/14 to 2017/18, By Year 3A: SY 2013/14 3B: SY 2014/15
3C: SY 2015/16 3D: SY 2016/17

122
Appendix C – Page 3
3E: SY 2017/18

123
Appendix C – Page 4
Projection to Enrollment Ratios by Grade for DCPS
FIGURE 4A – 4O Ratios of Projected to Audited Enrollments for DCPS Schools 2013/14 to 2017/18, By Grade 4A: Grade P3 4B: Grade P4
4C: Grade P5 (Kindergarten) 4D: Grade 1
4E: Grade 2 4F: Grade 3
4G: Grade 4 4H: Grade 5
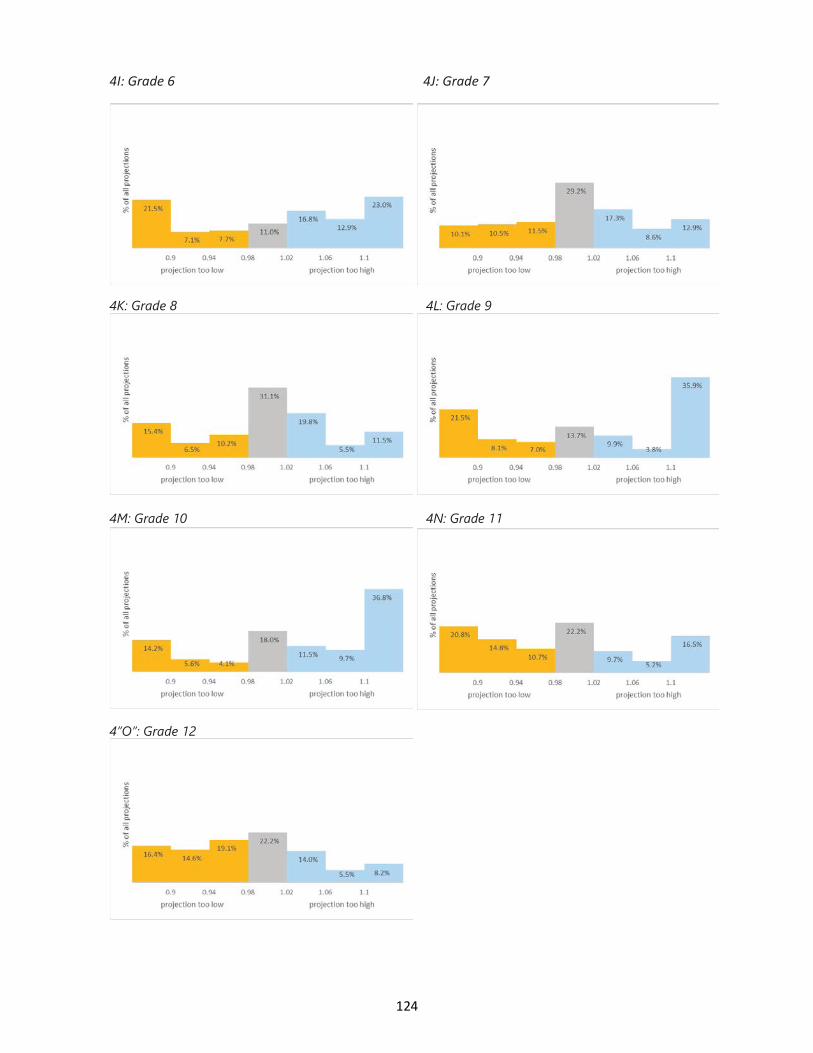
124
Appendix C – Page 5
4I: Grade 6 4J: Grade 7
4K: Grade 8 4L: Grade 9 4M: Grade 10 4N: Grade 11 4”O”: Grade 12

125
Appendix C – Page 6
Projection to Enrollment Ratios by Grade Group for DCPS
FIGURE 5A – 5D Ratios of Projected to Audited Enrollments for DCPS Schools 2013/14 to 2017/18, By Grade Group 5A: Grade P3 – Grade 5 5B: Grade 6 – Grade 8
5C: Grade 9 – Grade 12 5D: Adult

126
Appendix C – Page 7
Projection to Enrollment Ratios by Ward for PCS
FIGURE 7A – 7H Ratios of Projected to Audited Enrollments for PCS Schools 2016/17 to 2017/18, By Ward 7A: Ward 1 7B: Ward 2 7C: Ward 3 (no schools) 7D: Ward 4 7E: Ward 5 7F: Ward 6
7G: Ward 7 7H: Ward 8

127
Appendix C – Page 8
Projection to Enrollment Ratios by Grade Group for PCS
FIGURE 8A – 8D Ratios of Projected to Audited Enrollments for PCS 2016/17 to 2017/18, By Grade Group 8A: Grade P3 – Grade 5 8B: Grade 6 – Grade 8
8C: Grade 9 – Grade 12 8D: Adult

128
Appendix C – Page 9
Projection to Enrollment Ratios by Year for PCS
FIGURE 9A – 9B Ratios of Projected to Audited Enrollments for PCS Schools 2016/17 to 2017/18, By Year 9A: SY 2016/17 9B: SY 2017/18

129
Appendix C – Page 10
Projection to Enrollment Ratios by Year, by School for DCPS
TABLE 4 Ratios of Projected to Audited Enrollments for DCPS Schools 2013/14 to 2017/18: By School and Year
NamePerSLIMS S_ID Ward Year Audited Enrollment
Projection / Enrollment Ratio
Aiton ES 202 7 2013 247 1.08
Aiton ES 202 7 2014 262 0.94
Aiton ES 202 7 2015 260 1.01
Aiton ES 202 7 2016 251 1.06
Aiton ES 202 7 2017 243 1.08
Amidon-Bowen ES 203 6 2013 342 0.89
Amidon-Bowen ES 203 6 2014 345 1.07
Amidon-Bowen ES 203 6 2015 356 1.02
Amidon-Bowen ES 203 6 2016 350 1.01
Amidon-Bowen ES 203 6 2017 351 0.99
Anacostia HS 450 8 2013 751 0.89
Anacostia HS 450 8 2014 661 1.14
Anacostia HS 450 8 2015 597 1.01
Anacostia HS 450 8 2016 449 1.27
Anacostia HS 450 8 2017 379 1.12
Ballou HS 452 8 2013 678 1.06
Ballou HS 452 8 2014 755 0.85
Ballou HS 452 8 2015 933 0.85
Ballou HS 452 8 2016 930 1.13
Ballou HS 452 8 2017 880 1.03
Ballou STAY 462 8 2013 578 0.84
Ballou STAY 462 8 2014 591 0.83
Ballou STAY 462 8 2015 477 1.01
Ballou STAY 462 8 2016 466 1.04
Ballou STAY 462 8 2017 495 0.98
Bancroft ES 204 1 2013 490 0.97
Bancroft ES 204 1 2014 508 1
Bancroft ES 204 1 2015 521 1
Bancroft ES 204 1 2016 530 0.99
Bancroft ES 204 1 2017 544 0.98
Barnard ES 205 4 2013 583 1.03
Barnard ES 205 4 2014 602 1
Barnard ES 205 4 2015 637 1
Barnard ES 205 4 2016 649 0.99
Barnard ES 205 4 2017 642 1.01

130
Appendix C – Page 11
TABLE 4 (CONTINUED) Ratios of Projected to Audited Enrollments for DCPS Schools 2013/14 to 2017/18: By School and Year
NamePerSLIMS S_ID Ward Year Audited Enrollment
Projection / Enrollment Ratio
Beers ES 206 7 2013 422 0.93
Beers ES 206 7 2014 438 1
Beers ES 206 7 2015 437 1
Beers ES 206 7 2016 464 0.94
Beers ES 206 7 2017 484 0.96
Benjamin Banneker HS 402 1 2013 430 1.06
Benjamin Banneker HS 402 1 2014 449 1
Benjamin Banneker HS 402 1 2015 454 1
Benjamin Banneker HS 402 1 2016 481 1.03
Benjamin Banneker HS 402 1 2017 482 1.01
Brent ES 212 6 2013 359 1.01
Brent ES 212 6 2014 368 0.99
Brent ES 212 6 2015 384 0.99
Brent ES 212 6 2016 404 1
Brent ES 212 6 2017 425 0.95
Brightwood EC 213 4 2013 615 1
Brightwood EC 213 4 2014 639 1
Brightwood EC 213 4 2015 709 0.95
Brightwood EC 213 4 2016 755 0.97
Brightwood EC 213 4 2017 737 1.06
Brookland EC at Bunker Hill 346 5 2013 249 1.02
Brookland EC at Bunker Hill 346 5 2014 225 1.03
Brookland EC at Bunker Hill 346 5 2015 0 0
Brookland EC at Bunker Hill 346 5 2016 0 0
Brookland EC at Bunker Hill 346 5 2017 0 0
Brookland MS 347 5 2013 0 0
Brookland MS 347 5 2014 0 0
Brookland MS 347 5 2015 315 0.72
Brookland MS 347 5 2016 254 1.22
Brookland MS 347 5 2017 238 1.03
Browne EC 404 5 2013 349 1.03
Browne EC 404 5 2014 353 0.99
Browne EC 404 5 2015 333 1
Browne EC 404 5 2016 309 1.07
Browne EC 404 5 2017 325 0.98

131
Appendix C – Page 12
TABLE 4 (CONTINUED) Ratios of Projected to Audited Enrollments for DCPS Schools 2013/14 to 2017/18: By School and Year
NamePerSLIMS S_ID Ward Year
Audited Enrollment
Projection / Enrollment Ratio
Bruce Monroe ES at Park View 296 1 2013 465 0.97
Bruce Monroe ES at Park View 296 1 2014 465 1.01
Bruce Monroe ES at Park View 296 1 2015 470 1.01
Bruce Monroe ES at Park View 296 1 2016 473 1
Bruce Monroe ES at Park View 296 1 2017 473 1.01
Bunker Hill ES 219 5 2013 0 0
Bunker Hill ES 219 5 2014 0 0
Bunker Hill ES 219 5 2015 156 0.97
Bunker Hill ES 219 5 2016 195 0.93
Bunker Hill ES 219 5 2017 200 1
Burroughs EC 220 5 2013 278 1.03
Burroughs EC 220 5 2014 297 0.92
Burroughs EC 220 5 2015 285 0.88
Burroughs EC 220 5 2016 290 1
Burroughs EC 220 5 2017 282 1.11
Burrville ES 221 7 2013 354 1.02
Burrville ES 221 7 2014 360 0.96
Burrville ES 221 7 2015 326 1.15
Burrville ES 221 7 2016 325 1.01
Burrville ES 221 7 2017 300 1.16
Capitol Hill Montessori at Logan 360 6 2013 288 1.04
Capitol Hill Montessori at Logan 360 6 2014 310 1.06
Capitol Hill Montessori at Logan 360 6 2015 330 1.02
Capitol Hill Montessori at Logan 360 6 2016 361 1.03
Capitol Hill Montessori at Logan 360 6 2017 365 1
Cardozo EC 454 1 2013 681 1
Cardozo EC 454 1 2014 781 0.9
Cardozo EC 454 1 2015 783 1.02
Cardozo EC 454 1 2016 796 0.98
Cardozo EC 454 1 2017 788 1.11
CHOICE Academy at Emery 947 5 2013 9 0
CHOICE Academy at Emery 947 5 2014 5 5.4
CHOICE Academy at Emery 947 5 2015 2 4.5
CHOICE Academy at Emery 947 5 2016 5 0.6
CHOICE Academy at Emery 947 5 2017 1 5

132
Appendix C – Page 13
TABLE 4 (CONTINUED) Ratios of Projected to Audited Enrollments for DCPS Schools 2013/14 to 2017/18: By School and Year
NamePerSLIMS S_ID Ward Year Audited Enrollment
Projection / Enrollment Ratio
Cleveland ES 224 1 2013 303 1.03
Cleveland ES 224 1 2014 308 1
Cleveland ES 224 1 2015 319 1
Cleveland ES 224 1 2016 321 1.01
Cleveland ES 224 1 2017 317 1.03
Columbia Heights EC (CHEC) 442 1 2013 1266 1.04
Columbia Heights EC (CHEC) 442 1 2014 1384 0.92
Columbia Heights EC (CHEC) 442 1 2015 1393 1
Columbia Heights EC (CHEC) 442 1 2016 1336 1.06
Columbia Heights EC (CHEC) 442 1 2017 1240 1.12
Coolidge HS 455 4 2013 433 1.04
Coolidge HS 455 4 2014 395 1.01
Coolidge HS 455 4 2015 384 1
Coolidge HS 455 4 2016 346 1.11
Coolidge HS 455 4 2017 310 1.18
CW Harris ES 247 7 2013 269 1.12
CW Harris ES 247 7 2014 291 0.96
CW Harris ES 247 7 2015 293 1.05
CW Harris ES 247 7 2016 285 1.05
CW Harris ES 247 7 2017 278 1.02
Deal MS 405 3 2013 1248 1.02
Deal MS 405 3 2014 1312 1
Deal MS 405 3 2015 1341 1
Deal MS 405 3 2016 1476 0.94
Deal MS 405 3 2017 1475 1.03
Dorothy Height ES 349 4 2013 0 0
Dorothy Height ES 349 4 2014 0 0
Dorothy Height ES 349 4 2015 0 0
Dorothy Height ES 349 4 2016 518 1
Dorothy Height ES 349 4 2017 479 1.1
Drew ES 231 7 2013 168 0.92
Drew ES 231 7 2014 201 0.85
Drew ES 231 7 2015 247 0.9
Drew ES 231 7 2016 253 1.03
Drew ES 231 7 2017 272 1.02

133
Appendix C – Page 14
TABLE 4 (CONTINUED) Ratios of Projected to Audited Enrollments for DCPS Schools 2013/14 to 2017/18: By School and Year
NamePerSLIMS S_ID Ward Year Audited Enrollment
Projection / Enrollment Ratio
Duke Ellington School of the Arts 471 2 2013 541 0.98
Duke Ellington School of the Arts 471 2 2014 523 0.99
Duke Ellington School of the Arts 471 2 2015 525 1
Duke Ellington School of the Arts 471 2 2016 502 1.06
Duke Ellington School of the Arts 471 2 2017 566 0.99
Dunbar HS 467 5 2013 628 0.93
Dunbar HS 467 5 2014 653 0.95
Dunbar HS 467 5 2015 653 1.02
Dunbar HS 467 5 2016 584 1.13
Dunbar HS 467 5 2017 617 1
Eastern HS 457 6 2013 783 1.08
Eastern HS 457 6 2014 1025 0.98
Eastern HS 457 6 2015 967 1.08
Eastern HS 457 6 2016 818 1.21
Eastern HS 457 6 2017 769 1.07
Eaton ES 232 3 2013 470 1.01
Eaton ES 232 3 2014 475 1
Eaton ES 232 3 2015 478 1
Eaton ES 232 3 2016 477 1
Eaton ES 232 3 2017 476 1
Eliot-Hine MS 407 6 2013 292 0.93
Eliot-Hine MS 407 6 2014 257 1.07
Eliot-Hine MS 407 6 2015 209 1.14
Eliot-Hine MS 407 6 2016 200 0.94
Eliot-Hine MS 407 6 2017 203 1.04
Garfield ES 238 8 2013 266 0.95
Garfield ES 238 8 2014 284 0.98
Garfield ES 238 8 2015 317 0.94
Garfield ES 238 8 2016 301 1.03
Garfield ES 238 8 2017 301 0.99
Garrison ES 239 2 2013 280 0.92
Garrison ES 239 2 2014 244 1.18
Garrison ES 239 2 2015 244 1.06
Garrison ES 239 2 2016 253 0.95
Garrison ES 239 2 2017 250 1

134
Appendix C – Page 15
TABLE 4 (CONTINUED) Ratios of Projected to Audited Enrollments for DCPS Schools 2013/14 to 2017/18: By School and Year
NamePerSLIMS S_ID Ward Year Audited Enrollment
Projection / Enrollment Ratio
Hardy MS 246 2 2013 371 1.09
Hardy MS 246 2 2014 386 1.03
Hardy MS 246 2 2015 374 1.01
Hardy MS 246 2 2016 374 1.07
Hardy MS 246 2 2017 392 0.98
Hart MS 413 8 2013 561 0.95
Hart MS 413 8 2014 479 1.19
Hart MS 413 8 2015 381 1.13
Hart MS 413 8 2016 349 0.98
Hart MS 413 8 2017 337 0.99
HD Cooke ES 227 1 2013 396 1.01
HD Cooke ES 227 1 2014 400 1.03
HD Cooke ES 227 1 2015 397 1
HD Cooke ES 227 1 2016 420 0.96
HD Cooke ES 227 1 2017 404 1.08
HD Woodson HS 464 7 2013 762 0.99
HD Woodson HS 464 7 2014 639 1.13
HD Woodson HS 464 7 2015 660 0.88
HD Woodson HS 464 7 2016 634 1
HD Woodson HS 464 7 2017 488 1.24
Hearst ES 258 3 2013 287 1
Hearst ES 258 3 2014 291 1
Hearst ES 258 3 2015 316 0.95
Hearst ES 258 3 2016 312 1.01
Hearst ES 258 3 2017 312 1.01
Hendley ES 249 8 2013 521 1
Hendley ES 249 8 2014 503 1.05
Hendley ES 249 8 2015 463 1.1
Hendley ES 249 8 2016 445 1.07
Hendley ES 249 8 2017 379 1.16
Houston ES 251 7 2013 274 1.05
Houston ES 251 7 2014 279 1.01
Houston ES 251 7 2015 275 1.05
Houston ES 251 7 2016 299 0.94
Houston ES 251 7 2017 269 1.08

135
Appendix C – Page 16
TABLE 4 (CONTINUED) Ratios of Projected to Audited Enrollments for DCPS Schools 2013/14 to 2017/18: By School and Year
NamePerSLIMS S_ID Ward Year Audited Enrollment
Projection / Enrollment Ratio
Hyde-Addison ES 252 2 2013 334 1.02
Hyde-Addison ES 252 2 2014 305 1.11
Hyde-Addison ES 252 2 2015 316 1.01
Hyde-Addison ES 252 2 2016 329 1.02
Hyde-Addison ES 252 2 2017 320 1.04
Incarc. Youth Prog., Correctional Detention Facility 480 7 2013 26 1.5
Incarc. Youth Prog., Correctional Detention Facility 480 7 2014 28 0.86
Incarc. Youth Prog., Correctional Detention Facility 480 7 2015 34 0.71
Incarc. Youth Prog., Correctional Detention Facility 480 7 2016 48 0.59
Incarc. Youth Prog., Correctional Detention Facility 480 7 2017 40 0.95
Janney ES 254 3 2013 627 1.02
Janney ES 254 3 2014 693 0.97
Janney ES 254 3 2015 731 1
Janney ES 254 3 2016 722 1.01
Janney ES 254 3 2017 737 0.99
Jefferson Middle School Academy 433 6 2013 299 1.03
Jefferson Middle School Academy 433 6 2014 277 1.1
Jefferson Middle School Academy 433 6 2015 273 1.03
Jefferson Middle School Academy 433 6 2016 305 0.91
Jefferson Middle School Academy 433 6 2017 314 0.99
JO Wilson ES 339 6 2013 433 1
JO Wilson ES 339 6 2014 466 1
JO Wilson ES 339 6 2015 505 0.98
JO Wilson ES 339 6 2016 495 1.04
JO Wilson ES 339 6 2017 509 1
Johnson MS 416 8 2013 271 1.08
Johnson MS 416 8 2014 291 0.98
Johnson MS 416 8 2015 291 1.02
Johnson MS 416 8 2016 252 1.11
Johnson MS 416 8 2017 255 0.96
Kelly Miller MS 421 7 2013 513 0.95
Kelly Miller MS 421 7 2014 546 1.04
Kelly Miller MS 421 7 2015 450 1.25
Kelly Miller MS 421 7 2016 449 0.98
Kelly Miller MS 421 7 2017 387 1.11

136
Appendix C – Page 17
TABLE 4 (CONTINUED) Ratios of Projected to Audited Enrollments for DCPS Schools 2013/14 to 2017/18: By School and Year
NamePerSLIMS S_ID Ward Year Audited Enrollment
Projection / Enrollment Ratio
Ketcham ES 257 8 2013 306 0.88
Ketcham ES 257 8 2014 309 1.02
Ketcham ES 257 8 2015 313 1.02
Ketcham ES 257 8 2016 309 1.02
Ketcham ES 257 8 2017 310 0.98
Key ES 272 3 2013 381 1.01
Key ES 272 3 2014 383 1.02
Key ES 272 3 2015 386 1.02
Key ES 272 3 2016 397 1.02
Key ES 272 3 2017 417 0.97
Kimball ES 259 7 2013 330 0.99
Kimball ES 259 7 2014 348 1
Kimball ES 259 7 2015 356 0.99
Kimball ES 259 7 2016 372 0.96
Kimball ES 259 7 2017 325 1.18
King ES 344 8 2013 410 1.12
King ES 344 8 2014 372 1.1
King ES 344 8 2015 394 0.99
King ES 344 8 2016 374 1.09
King ES 344 8 2017 346 1.12
Kramer MS 417 8 2013 368 0.85
Kramer MS 417 8 2014 333 1.11
Kramer MS 417 8 2015 247 1.28
Kramer MS 417 8 2016 193 1.26
Kramer MS 417 8 2017 194 1.06
Lafayette ES 261 4 2013 689 1
Lafayette ES 261 4 2014 697 1
Lafayette ES 261 4 2015 700 0.99
Lafayette ES 261 4 2016 761 0.94
Lafayette ES 261 4 2017 816 0.98
Langdon EC 262 5 2013 349 1.27
Langdon EC 262 5 2014 340 1
Langdon EC 262 5 2015 300 0.87
Langdon EC 262 5 2016 323 0.97
Langdon EC 262 5 2017 324 1.03

137
Appendix C – Page 18
TABLE 4 (CONTINUED) Ratios of Projected to Audited Enrollments for DCPS Schools 2013/14 to 2017/18: By School and Year
NamePerSLIMS S_ID Ward Year Audited Enrollment
Projection / Enrollment Ratio
Langley ES 370 5 2013 280 1
Langley ES 370 5 2014 289 1
Langley ES 370 5 2015 278 1.11
Langley ES 370 5 2016 284 1.04
Langley ES 370 5 2017 275 1.03
LaSalle Backus EC 264 4 2013 342 0.87
LaSalle Backus EC 264 4 2014 349 1.02
LaSalle Backus EC 264 4 2015 341 1.03
LaSalle Backus EC 264 4 2016 369 0.95
LaSalle Backus EC 264 4 2017 363 1.02
Leckie ES 266 8 2013 374 0.99
Leckie ES 266 8 2014 478 0.85
Leckie ES 266 8 2015 519 0.92
Leckie ES 266 8 2016 552 0.98
Leckie ES 266 8 2017 558 1.07
Ludlow-Taylor ES 271 6 2013 299 0.98
Ludlow-Taylor ES 271 6 2014 340 0.99
Ludlow-Taylor ES 271 6 2015 370 0.95
Ludlow-Taylor ES 271 6 2016 373 1.08
Ludlow-Taylor ES 271 6 2017 414 0.95
Luke C Moore HS 884 5 2013 364 1.08
Luke C Moore HS 884 5 2014 350 1.09
Luke C Moore HS 884 5 2015 297 1.21
Luke C Moore HS 884 5 2016 266 1.28
Luke C Moore HS 884 5 2017 251 1.21
MacFarland MS 420 4 2013 0 0
MacFarland MS 420 4 2014 0 0
MacFarland MS 420 4 2015 0 0
MacFarland MS 420 4 2016 69 1.04
MacFarland MS 420 4 2017 132 1.07
Malcolm X ES at Green 308 8 2013 225 0.96
Malcolm X ES at Green 308 8 2014 244 0.9
Malcolm X ES at Green 308 8 2015 238 0.97
Malcolm X ES at Green 308 8 2016 237 1.05
Malcolm X ES at Green 308 8 2017 256 1.01

138
Appendix C – Page 19
TABLE 4 (CONTINUED) Ratios of Projected to Audited Enrollments for DCPS Schools 2013/14 to 2017/18: By School and Year
NamePerSLIMS S_ID Ward Year Audited Enrollment
Projection / Enrollment Ratio
Mamie D Lee School 265 5 2013 62 1.08
Mamie D Lee School 265 5 2014 56 1.1
Mamie D Lee School 265 5 2015 0 0
Mamie D Lee School 265 5 2016 0 0
Mamie D Lee School 265 5 2017 0 0
Mann ES 273 3 2013 287 1.05
Mann ES 273 3 2014 302 1
Mann ES 273 3 2015 360 0.94
Mann ES 273 3 2016 379 1
Mann ES 273 3 2017 400 1
Marie Reed ES 284 1 2013 377 1
Marie Reed ES 284 1 2014 393 1
Marie Reed ES 284 1 2015 399 0.99
Marie Reed ES 284 1 2016 398 1.01
Marie Reed ES 284 1 2017 427 0.93
Maury ES 274 6 2013 339 0.98
Maury ES 274 6 2014 366 0.99
Maury ES 274 6 2015 383 0.99
Maury ES 274 6 2016 387 1.03
Maury ES 274 6 2017 407 0.99
McKinley Middle School 435 5 2013 193 1.02
McKinley Middle School 435 5 2014 202 1.03
McKinley Middle School 435 5 2015 226 1.1
McKinley Middle School 435 5 2016 213 0.99
McKinley Middle School 435 5 2017 241 0.92
McKinley Technology HS 458 5 2013 674 1.11
McKinley Technology HS 458 5 2014 645 1.08
McKinley Technology HS 458 5 2015 656 0.99
McKinley Technology HS 458 5 2016 619 1.08
McKinley Technology HS 458 5 2017 620 1.03
Miner ES 280 6 2013 426 1.11
Miner ES 280 6 2014 398 1.02
Miner ES 280 6 2015 398 1.01
Miner ES 280 6 2016 384 1.03
Miner ES 280 6 2017 345 1.1

139
Appendix C – Page 20
TABLE 4 (CONTINUED) Ratios of Projected to Audited Enrollments for DCPS Schools 2013/14 to 2017/18: By School and Year
NamePerSLIMS S_ID Ward Year Audited Enrollment
Projection / Enrollment Ratio
Moten ES 285 8 2013 362 0.93
Moten ES 285 8 2014 395 1.01
Moten ES 285 8 2015 423 1
Moten ES 285 8 2016 405 1.04
Moten ES 285 8 2017 401 1.04
Murch ES 287 3 2013 626 0.97
Murch ES 287 3 2014 620 1.09
Murch ES 287 3 2015 625 1.01
Murch ES 287 3 2016 572 1.04
Murch ES 287 3 2017 573 1
Nalle ES 288 7 2013 369 0.89
Nalle ES 288 7 2014 384 0.99
Nalle ES 288 7 2015 391 1
Nalle ES 288 7 2016 391 1
Nalle ES 288 7 2017 387 1.04
Noyes EC 290 5 2013 305 0.87
Noyes EC 290 5 2014 289 1.06
Noyes EC 290 5 2015 192 1.11
Noyes EC 290 5 2016 197 1
Noyes EC 290 5 2017 195 0.96
Orr ES 291 8 2013 355 1.07
Orr ES 291 8 2014 384 0.97
Orr ES 291 8 2015 421 0.95
Orr ES 291 8 2016 408 1.06
Orr ES 291 8 2017 404 1.04
Oyster-Adams Bilingual School 292 3 2013 661 1.01
Oyster-Adams Bilingual School 292 3 2014 650 1.01
Oyster-Adams Bilingual School 292 3 2015 663 0.97
Oyster-Adams Bilingual School 292 3 2016 674 1.01
Oyster-Adams Bilingual School 292 3 2017 677 1
Patterson ES 294 8 2013 356 0.94
Patterson ES 294 8 2014 380 0.99
Patterson ES 294 8 2015 404 1
Patterson ES 294 8 2016 394 1.04
Patterson ES 294 8 2017 374 1.04

140
Appendix C – Page 21
TABLE 4 (CONTINUED) Ratios of Projected to Audited Enrollments for DCPS Schools 2013/14 to 2017/18: By School and Year
NamePerSLIMS S_ID Ward Year Audited Enrollment
Projection / Enrollment Ratio
Payne ES 295 6 2013 258 1.01
Payne ES 295 6 2014 277 1
Payne ES 295 6 2015 308 0.94
Payne ES 295 6 2016 300 0.99
Payne ES 295 6 2017 315 1
Peabody ES 301 6 2013 228 1
Peabody ES 301 6 2014 227 1
Peabody ES 301 6 2015 227 1.01
Peabody ES 301 6 2016 230 1
Peabody ES 301 6 2017 227 1
Phelps Architecture Construction and Engineering HS 478 5 2013 319 1.28
Phelps Architecture Construction and Engineering HS 478 5 2014 323 1.09
Phelps Architecture Construction and Engineering HS 478 5 2015 306 1.17
Phelps Architecture Construction and Engineering HS 478 5 2016 328 0.86
Phelps Architecture Construction and Engineering HS 478 5 2017 260 1.2
Plummer ES 299 7 2013 416 0.98
Plummer ES 299 7 2014 428 1.01
Plummer ES 299 7 2015 409 1.14
Plummer ES 299 7 2016 391 1.04
Plummer ES 299 7 2017 375 1.04
Powell ES 300 4 2013 406 1.05
Powell ES 300 4 2014 446 0.98
Powell ES 300 4 2015 512 0.97
Powell ES 300 4 2016 534 0.99
Powell ES 300 4 2017 548 0.98
Randle Highlands ES 316 7 2013 335 1.08
Randle Highlands ES 316 7 2014 360 0.92
Randle Highlands ES 316 7 2015 339 1.07
Randle Highlands ES 316 7 2016 333 1.03
Randle Highlands ES 316 7 2017 325 1.05
Raymond EC 302 4 2013 543 1
Raymond EC 302 4 2014 581 0.96
Raymond EC 302 4 2015 572 1.02
Raymond EC 302 4 2016 613 0.95
Raymond EC 302 4 2017 589 1.06

141
Appendix C – Page 22
TABLE 4 (CONTINUED) Ratios of Projected to Audited Enrollments for DCPS Schools 2013/14 to 2017/18: By School and Year
NamePerSLIMS S_ID Ward Year Audited Enrollment
Projection / Enrollment Ratio
River Terrace ES 304 7 2013 0 0
River Terrace ES 304 7 2014 0 0
River Terrace ES 304 7 2015 125 0.87
River Terrace ES 304 7 2016 131 1
River Terrace ES 304 7 2017 137 1.04
Ron Brown College Preparatory High School 436 7 2013 0 0
Ron Brown College Preparatory High School 436 7 2014 0 0
Ron Brown College Preparatory High School 436 7 2015 0 0
Ron Brown College Preparatory High School 436 7 2016 105 1.42
Ron Brown College Preparatory High School 436 7 2017 209 1.05
Ron Brown MS 425 7 2013 0 0
Ron Brown MS 425 7 2014 0 0
Ron Brown MS 425 7 2015 0 0
Ron Brown MS 425 7 2016 0 0
Ron Brown MS 425 7 2017 0 0
Roosevelt HS at MacFarland 459 4 2013 438 1.01
Roosevelt HS at MacFarland 459 4 2014 476 0.91
Roosevelt HS at MacFarland 459 4 2015 482 1.06
Roosevelt HS at MacFarland 459 4 2016 667 0.9
Roosevelt HS at MacFarland 459 4 2017 698 0.98
Roosevelt STAY at MacFarland 456 4 2013 850 0.78
Roosevelt STAY at MacFarland 456 4 2014 802 0.82
Roosevelt STAY at MacFarland 456 4 2015 776 0.85
Roosevelt STAY at MacFarland 456 4 2016 613 0.78
Roosevelt STAY at MacFarland 456 4 2017 515 1
Ross ES 305 2 2013 161 1
Ross ES 305 2 2014 166 1.01
Ross ES 305 2 2015 167 1.01
Ross ES 305 2 2016 171 1.01
Ross ES 305 2 2017 174 1
Savoy ES 307 8 2013 408 1
Savoy ES 307 8 2014 408 1.02
Savoy ES 307 8 2015 349 1.16
Savoy ES 307 8 2016 315 1.09
Savoy ES 307 8 2017 267 1.2

142
Appendix C – Page 23
TABLE 4 (CONTINUED) Ratios of Projected to Audited Enrollments for DCPS Schools 2013/14 to 2017/18: By School and Year
NamePerSLIMS S_ID Ward Year Audited Enrollment
Projection / Enrollment Ratio
School Within School at Goding 175 6 2013 205 0.97
School Within School at Goding 175 6 2014 248 0.98
School Within School at Goding 175 6 2015 289 1
School Within School at Goding 175 6 2016 307 1.02
School Within School at Goding 175 6 2017 308 1
School Without Walls at Francis Stevens 409 2 2013 284 1.34
School Without Walls at Francis Stevens 409 2 2014 414 0.79
School Without Walls at Francis Stevens 409 2 2015 441 1
School Without Walls at Francis Stevens 409 2 2016 471 0.97
School Without Walls at Francis Stevens 409 2 2017 473 1.02
School Without Walls HS 466 2 2013 585 0.98
School Without Walls HS 466 2 2014 590 0.98
School Without Walls HS 466 2 2015 589 0.98
School Without Walls HS 466 2 2016 584 1
School Without Walls HS 466 2 2017 592 0.99
Seaton ES 309 6 2013 253 1
Seaton ES 309 6 2014 295 0.95
Seaton ES 309 6 2015 311 1.04
Seaton ES 309 6 2016 341 1
Seaton ES 309 6 2017 371 1
Sharpe Health School 312 4 2013 67 1.05
Sharpe Health School 312 4 2014 60 1.11
Sharpe Health School 312 4 2015 0 0
Sharpe Health School 312 4 2016 0 0
Sharpe Health School 312 4 2017 0 0
Shepherd ES 313 4 2013 304 1.03
Shepherd ES 313 4 2014 318 1
Shepherd ES 313 4 2015 330 0.99
Shepherd ES 313 4 2016 360 0.99
Shepherd ES 313 4 2017 364 1.01
Simon ES 315 8 2013 296 0.94
Simon ES 315 8 2014 293 1.05
Simon ES 315 8 2015 301 1.01
Simon ES 315 8 2016 276 1.05
Simon ES 315 8 2017 274 0.97

143
Appendix C – Page 24
TABLE 4 (CONTINUED) Ratios of Projected to Audited Enrollments for DCPS Schools 2013/14 to 2017/18: By School and Year
NamePerSLIMS S_ID Ward Year Audited Enrollment
Projection / Enrollment Ratio
Smothers ES 322 7 2013 290 1.05
Smothers ES 322 7 2014 275 1.1
Smothers ES 322 7 2015 274 1.04
Smothers ES 322 7 2016 253 1.1
Smothers ES 322 7 2017 252 1.02
Sousa MS 427 7 2013 295 1
Sousa MS 427 7 2014 284 1
Sousa MS 427 7 2015 255 1.01
Sousa MS 427 7 2016 255 1
Sousa MS 427 7 2017 228 1.14
Stanton ES 319 8 2013 585 0.97
Stanton ES 319 8 2014 578 1.05
Stanton ES 319 8 2015 526 1.02
Stanton ES 319 8 2016 520 0.99
Stanton ES 319 8 2017 493 1.03
Stoddert ES 321 3 2013 381 1.07
Stoddert ES 321 3 2014 418 1.02
Stoddert ES 321 3 2015 432 0.98
Stoddert ES 321 3 2016 435 1
Stoddert ES 321 3 2017 438 0.97
Stuart-Hobson MS 428 6 2013 417 0.9
Stuart-Hobson MS 428 6 2014 423 1
Stuart-Hobson MS 428 6 2015 424 1
Stuart-Hobson MS 428 6 2016 431 0.99
Stuart-Hobson MS 428 6 2017 422 1.02
Takoma EC 324 4 2013 442 0.91
Takoma EC 324 4 2014 442 1.03
Takoma EC 324 4 2015 468 1.02
Takoma EC 324 4 2016 468 1
Takoma EC 324 4 2017 473 0.99
Thomas ES 325 7 2013 414 0.97
Thomas ES 325 7 2014 408 1.06
Thomas ES 325 7 2015 411 1.03
Thomas ES 325 7 2016 409 1.03
Thomas ES 325 7 2017 384 1.11

144
Appendix C – Page 25
TABLE 4 (CONTINUED) Ratios of Projected to Audited Enrollments for DCPS Schools 2013/14 to 2017/18: By School and Year
NamePerSLIMS S_ID Ward Year Audited Enrollment
Projection / Enrollment Ratio
Thomson ES 326 2 2013 289 0.96
Thomson ES 326 2 2014 272 1.02
Thomson ES 326 2 2015 287 0.96
Thomson ES 326 2 2016 313 0.95
Thomson ES 326 2 2017 308 0.99
Truesdell EC 327 4 2013 480 1.06
Truesdell EC 327 4 2014 526 0.93
Truesdell EC 327 4 2015 588 0.97
Truesdell EC 327 4 2016 679 0.93
Truesdell EC 327 4 2017 698 1.03
Tubman ES 328 1 2013 509 1.01
Tubman ES 328 1 2014 498 1.05
Tubman ES 328 1 2015 545 0.92
Tubman ES 328 1 2016 542 1.03
Tubman ES 328 1 2017 535 0.98
Turner ES 329 8 2013 403 0.92
Turner ES 329 8 2014 392 1.08
Turner ES 329 8 2015 460 0.92
Turner ES 329 8 2016 484 1.03
Turner ES 329 8 2017 463 1.11
Tyler ES 330 6 2013 507 1.06
Tyler ES 330 6 2014 522 1.05
Tyler ES 330 6 2015 520 1.03
Tyler ES 330 6 2016 514 1.03
Tyler ES 330 6 2017 525 1
Van Ness ES 331 6 2013 0 0
Van Ness ES 331 6 2014 0 0
Van Ness ES 331 6 2015 86 1.27
Van Ness ES 331 6 2016 171 0.84
Van Ness ES 331 6 2017 215 1.02
Walker-Jones EC 332 6 2013 454 0.98
Walker-Jones EC 332 6 2014 465 1
Walker-Jones EC 332 6 2015 449 1.07
Walker-Jones EC 332 6 2016 451 1.04
Walker-Jones EC 332 6 2017 435 1.09

145
Appendix C – Page 26
TABLE 4 (CONTINUED) Ratios of Projected to Audited Enrollments for DCPS Schools 2013/14 to 2017/18: By School and Year
NamePerSLIMS S_ID Ward Year Audited Enrollment
Projection / Enrollment Ratio
Washington Metropolitan HS (formerly YEA) 474 1 2013 280 1.02
Washington Metropolitan HS (formerly YEA) 474 1 2014 244 1.24
Washington Metropolitan HS (formerly YEA) 474 1 2015 150 1.67
Washington Metropolitan HS (formerly YEA) 474 1 2016 125 1.56
Washington Metropolitan HS (formerly YEA) 474 1 2017 195 1.02
Watkins ES 333 6 2013 545 0.98
Watkins ES 333 6 2014 500 1.04
Watkins ES 333 6 2015 463 1.04
Watkins ES 333 6 2016 436 1
Watkins ES 333 6 2017 428 1
West EC 336 4 2013 258 0.99
West EC 336 4 2014 267 1.02
West EC 336 4 2015 303 0.92
West EC 336 4 2016 315 1
West EC 336 4 2017 330 1.04
Wheatley EC 335 5 2013 442 1.05
Wheatley EC 335 5 2014 463 0.94
Wheatley EC 335 5 2015 359 1.27
Wheatley EC 335 5 2016 321 1.07
Wheatley EC 335 5 2017 324 1.01
Whittier EC 338 4 2013 362 0.91
Whittier EC 338 4 2014 350 1
Whittier EC 338 4 2015 365 0.96
Whittier EC 338 4 2016 341 1.07
Whittier EC 338 4 2017 325 1.02
Wilson HS 463 3 2013 1696 1.05
Wilson HS 463 3 2014 1788 0.95
Wilson HS 463 3 2015 1791 1.04
Wilson HS 463 3 2016 1749 1.01
Wilson HS 463 3 2017 1829 0.96
Youth Services Center 861 5 2013 89 0.88
Youth Services Center 861 5 2014 76 0.93
Youth Services Center 861 5 2015 77 0.95
Youth Services Center 861 5 2016 88 0.93
Youth Services Center 861 5 2017 52 1.75

146
Appendix C – Page 27
Projection to Enrollment Ratios by Year, by School for PCS
TABLE 5 Ratios of Projected to Audited Enrollments for PCS Schools 2016/17: By School
School Name School Code Ward(s)
Audited Enrollment
Projection / Enrollment Ratio
Academy of Hope Adult PCS 233 5,8 375 1.00 Achievement Preparatory Academy PCS - Wahler Place Elementary School 217 8 464 1.10 Achievement Preparatory Academy PCS - Wahler Place Middle School 1100 8 468 1.15 AppleTree Early Learning Center PCS - Columbia Heights 140 1 160 1.02 AppleTree Early Learning Center PCS - Lincoln Park 3073 6 60 1.00 AppleTree Early Learning Center PCS - Oklahoma Avenue 1137 7 134 0.85 AppleTree Early Learning Center PCS - Southeast 3072 8 169 0.99 AppleTree Early Learning Center PCS - Southwest 141 6 108 1.00 BASIS DC PCS 3068 2 597 1.00 Breakthrough Montessori PCS 289 4 81 1.01 Bridges PCS 142 5 328 0.90 Briya PCS 126 1,4,5 644 1.17 Capital City PCS - High School 1207 4 333 1.00 Capital City PCS - Lower School 184 4 325 1.00 Capital City PCS - Middle School 182 4 325 1.00 Carlos Rosario International PCS 1119 1,5 2064 1.05 Cedar Tree Academy PCS 188 8 385 1.04 Center City PCS - Brightwood 1103 4 276 1.04 Center City PCS - Capitol Hill 1104 6 238 0.95 Center City PCS - Congress Heights 1105 8 253 0.95 Center City PCS - Petworth 1106 4 257 0.97 Center City PCS - Shaw 1107 6 234 0.96 Center City PCS - Trinidad 1108 5 184 0.90 Cesar Chavez PCS for Public Policy - Capitol Hill 153 6 332 0.79 Cesar Chavez PCS for Public Policy - Chavez Prep 127 1 306 0.84 Cesar Chavez PCS for Public Policy - Parkside High School 109 7 359 0.94 Cesar Chavez PCS for Public Policy - Parkside Middle School 102 7 278 0.91 City Arts & Prep PCS 210 5 522 1.13 Community College Preparatory Academy PCS 216 6,8 476 1.06 Creative Minds International PCS 3069 5 341 1.09 DC Bilingual PCS 199 5 410 1.01 DC Prep PCS - Anacostia Elementary School 276 8 203 0.99 DC Prep PCS - Benning Elementary School 1110 7 449 1.00 DC Prep PCS - Benning Middle School 218 7 281 1.01 DC Prep PCS - Edgewood Elementary School 130 5 447 1.00

147
Appendix C – Page 28
TABLE 5 (CONTINUED) Ratios of Projected to Audited Enrollments for PCS Schools 2016/17: By School
School Name School Code Ward(s)
Audited Enrollment
Projection / Enrollment Ratio
DC Prep PCS - Edgewood Middle School 196 5 330 1.03 DC Scholars PCS 3070 7 505 1.00 Democracy Prep Congress Heights PCS 234 8 656 1.03 District of Columbia International School 248 1 520 0.94 E.L. Haynes PCS - Elementary School 1206 4 345 1.02 E.L. Haynes PCS - High School 1138 4 450 1.00 E.L. Haynes PCS - Middle School 146 1 348 0.99 Eagle Academy PCS - Capitol Riverfront 1125 6 144 0.94 Eagle Academy PCS - Congress Heights 195 8 734 0.96 Early Childhood Academy PCS 138 8 229 0.85 Elsie Whitlow Stokes Community Freedom PCS 159 5 350 1.00 Excel Academy PCS 1113 8 702 0.91 Friendship PCS - Armstrong 269 5 438 0.98 Friendship PCS - Blow Pierce Elementary School 361 7 388 0.96 Friendship PCS - Blow Pierce Middle School 362 7 230 1.11 Friendship PCS - Chamberlain Elementary School 363 6 387 1.02 Friendship PCS - Chamberlain Middle School 364 6 330 0.97 Friendship PCS - Collegiate Academy 186 7 751 0.97 Friendship PCS - Online 268 4 145 1.08 Friendship PCS - Southeast Academy 113 8 553 1.00 Friendship PCS - Technology Preparatory High School 1164 8 233 0.91 Friendship PCS - Technology Preparatory Middle School 1124 8 257 0.90 Friendship PCS - Woodridge Elementary School 365 5 305 1.09 Friendship PCS - Woodridge Middle School 366 5 199 1.03 Goodwill Excel Center PCS 297 2 382 1.36 Harmony DC PCS - School of Excellence 245 5 97 0.52 Hope Community PCS - Lamond 131 4 321 1.01 Hope Community PCS - Tolson 114 5 561 1.12 Howard University Middle School of Mathematics and Science PCS 115 1 278 1.07 IDEA PCS 163 7 262 0.82 Ideal Academy PCS 134 4 300 1.02 Ingenuity Prep PCS 200 8 376 1.00 Inspired Teaching Demonstration PCS 3064 5 414 1.00 KIPP DC - AIM Academy PCS 116 8 373 1.06 KIPP DC - Arts and Technology Academy PCS 236 7 277 1.05

148
Appendix C – Page 29
TABLE 5 (CONTINUED) Ratios of Projected to Audited Enrollments for PCS Schools 2016/17: By School
School Name School Code Ward(s)
Audited Enrollment
Projection / Enrollment Ratio
KIPP DC - College Preparatory Academy PCS 1123 5 594 1.07 KIPP DC - Connect Academy PCS 209 5 325 1.08 KIPP DC - Discover Academy PCS 1122 8 352 1.07 KIPP DC - Grow Academy PCS 1129 6 328 1.06 KIPP DC - Heights Academy PCS 3071 8 461 0.97 KIPP DC - KEY Academy PCS 189 7 337 0.97 KIPP DC - LEAP Academy PCS 132 7 198 1.00 KIPP DC - Lead Academy PCS 190 6 418 1.00 KIPP DC - Northeast Academy PCS 242 5 326 1.03 KIPP DC - Promise Academy PCS 1121 7 525 1.01 KIPP DC - Quest Academy PCS 237 7 365 1.09 KIPP DC - Spring Academy PCS 214 5 335 0.99 KIPP DC - Valor Academy PCS 243 7 223 1.01 KIPP DC - WILL Academy PCS 121 6 346 1.00 Kingsman Academy PCS 267 6 216 0.72 LAYC Career Academy PCS 104 5 185 0.97 Latin American Montessori Bilingual PCS 193 4 426 1.07 Lee Montessori PCS 228 1 145 1.06 Mary McLeod Bethune Day Academy PCS 135 5 402 0.89 Maya Angelou PCS - High School 101 4 209 1.00 Maya Angelou PCS - Young Adult Learning Center 137 5 101 0.67 Meridian PCS 165 7 692 0.84 Monument Academy PCS 260 7 76 0.95 Mundo Verde Bilingual PCS 3065 1 563 1.00 National Collegiate Preparatory PCHS 1120 6 275 1.02 Paul PCS - International High School 222 5 487 1.09 Paul PCS - Middle School 170 8 242 1.14 Perry Street Preparatory PCS 161 4 306 0.98 Richard Wright PCS for Journalism and Media Arts 3067 4 300 1.12 Rocketship DC PCS - Rise Academy 286 6 441 1.45 Roots PCS 173 8 118 1.13 SEED PCS of Washington DC 174 4 361 1.05 Sela PCS 197 7 177 1.05 Shining Stars Montessori Academy PCS 3066 4 203 1.01 Somerset Preparatory Academy PCS 187 5 324 1.00

149
Appendix C – Page 30
TABLE 5 (CONTINUED) Ratios of Projected to Audited Enrollments for PCS Schools 2016/17: By School
School Name School Code Ward(s)
Audited Enrollment
Projection / Enrollment Ratio
St. Coletta Special Education PCS 1047 8 251 1.00 The Children's Guild PCS 255 5 342 0.91 The Next Step El Proximo Paso PCS 168 1 393 1.00 Thurgood Marshall Academy PCS 191 8 388 1.00 Two Rivers PCS - 4th St 198 6 527 1.01 Two Rivers PCS - Young 270 5 226 0.99 Washington Global PCS 263 6 174 0.97 Washington Latin PCS - Middle School 125 4 362 1.00 Washington Latin PCS - Upper School 1118 4 335 1.02 Washington Leadership Academy PCS 283 5 110 1.18 Washington Mathematics Science Technology PCHS 178 5 277 0.93 Washington Yu Ying PCS 1117 5 571 1.02 Youthbuild PCS 128 1 117 1.01

150
Appendix C – Page 31
TABLE 5 (CONTINUED) Ratios of Projected to Audited Enrollments for PCS Schools 2017/18: By School
School Name School Code Ward(s)
Audited Enrollment
Projection / Enrollment Ratio
Academy of Hope Adult PCS 233 5,8 387 0.99 Achievement Preparatory Academy PCS - Wahler Place Elementary School 217 8 486 1.04 Achievement Preparatory Academy PCS - Wahler Place Middle School 1100 8 476 1
AppleTree Early Learning Center PCS - Columbia Heights 140 1 162 0.99
AppleTree Early Learning Center PCS - Lincoln Park 3073 6 60 1
AppleTree Early Learning Center PCS - Oklahoma Avenue 1137 7 143 0.98
AppleTree Early Learning Center PCS - Southeast 3072 8 181 0.94
AppleTree Early Learning Center PCS - Southwest 141 6 108 0.98
BASIS DC PCS 3068 2 598 1.02
Breakthrough Montessori PCS 289 4 135 1
Bridges PCS 142 5 399 0.95
Briya PCS 126 1,4,5 673 1.05
Capital City PCS - High School 1207 4 335 0.99
Capital City PCS - Lower School 184 4 324 1
Capital City PCS - Middle School 182 4 334 0.98
Carlos Rosario International PCS 1119 1,5 2121 1
Cedar Tree Academy PCS 188 8 381 0.95
Center City PCS - Brightwood 1103 4 263 1.02
Center City PCS - Capitol Hill 1104 6 260 0.96
Center City PCS - Congress Heights 1105 8 256 0.97
Center City PCS - Petworth 1106 4 252 0.99
Center City PCS - Shaw 1107 6 236 0.98
Center City PCS - Trinidad 1108 5 202 0.88
Cesar Chavez PCS for Public Policy - Capitol Hill 153 6 259 1.21
Cesar Chavez PCS for Public Policy - Chavez Prep 127 1 294 0.97
Cesar Chavez PCS for Public Policy - Parkside High School 109 7 367 0.93
Cesar Chavez PCS for Public Policy - Parkside Middle School 102 7 257 0.97
City Arts & Prep PCS 210 5 499 1.06
Community College Preparatory Academy PCS 216 6,8 600 1
Creative Minds International PCS 3069 5 441 1
DC Bilingual PCS 199 5 440 0.97
DC Prep PCS - Anacostia Elementary School 276 8 304 1
DC Prep PCS - Benning Elementary School 1110 7 453 1
DC Prep PCS - Benning Middle School 218 7 335 0.98
DC Prep PCS - Edgewood Elementary School 130 5 451 1

151
Appendix C – Page 32
TABLE 5 (CONTINUED) Ratios of Projected to Audited Enrollments for PCS Schools 2017/18: By School
School Name School Code Ward(s)
Audited Enrollment
Projection / Enrollment Ratio
DC Prep PCS - Edgewood Middle School 196 5 332 0.99
DC Scholars PCS 3070 7 515 1
Democracy Prep Congress Heights PCS 234 8 645 1.05
District of Columbia International School 248 1 804 1.01
E.L. Haynes PCS - Elementary School 1206 4 348 1
E.L. Haynes PCS - High School 1138 4 430 1.04
E.L. Haynes PCS - Middle School 146 1 353 0.99
Eagle Academy PCS - Capitol Riverfront 1125 6 166 0.9
Eagle Academy PCS - Congress Heights 195 8 770 0.97
Early Childhood Academy PCS 138 8 246 1.01
Elsie Whitlow Stokes Community Freedom PCS 159 5 350 1
Excel Academy PCS 1113 8 643 1.08
Friendship PCS - Armstrong 269 5 395 1.21
Friendship PCS - Blow Pierce Elementary School 361 7 387 1.02
Friendship PCS - Blow Pierce Middle School 362 7 242 1.03
Friendship PCS - Chamberlain Elementary School 363 6 377 1.03
Friendship PCS - Chamberlain Middle School 364 6 323 1.07
Friendship PCS - Collegiate Academy 186 7 685 1.03
Friendship PCS - Online 268 4 180 0.84
Friendship PCS - Southeast Academy 113 8 559 0.99
Friendship PCS - Technology Preparatory High School 1164 8 253 1.06
Friendship PCS - Technology Preparatory Middle School 1124 8 255 1
Friendship PCS - Woodridge Elementary School 365 5 297 1.08
Friendship PCS - Woodridge Middle School 366 5 218 1.01
Goodwill Excel Center PCS 297 2 358 0.98
Harmony DC PCS - School of Excellence 245 5 94 1.32
Hope Community PCS - Lamond 131 4 288 1.14
Hope Community PCS - Tolson 114 5 467 1.23 Howard University Middle School of Mathematics and Science PCS 115 1 278 1.05
IDEA PCS 163 7 306 0.92
Ideal Academy PCS 134 4 289 1.04
Ingenuity Prep PCS 200 8 496 0.96
Inspired Teaching Demonstration PCS 3064 5 446 1
KIPP DC - AIM Academy PCS 116 8 378 1
KIPP DC - Arts and Technology Academy PCS 236 7 347 1

152
Appendix C – Page 33
TABLE 5 (CONTINUED) Ratios of Projected to Audited Enrollments for PCS Schools 2017/18: By School
School Name School Code Ward(s)
Audited Enrollment
Projection / Enrollment Ratio
KIPP DC - College Preparatory Academy PCS 1123 5 713 0.98
KIPP DC - Connect Academy PCS 209 5 325 1
KIPP DC - Discover Academy PCS 1122 8 351 1
KIPP DC - Grow Academy PCS 1129 6 321 1
KIPP DC - Heights Academy PCS 3071 8 461 0.98
KIPP DC - KEY Academy PCS 189 7 338 1.01
KIPP DC - LEAP Academy PCS 132 7 198 1
KIPP DC - Lead Academy PCS 190 6 405 1.01
KIPP DC - Northeast Academy PCS 242 5 330 1
KIPP DC - Promise Academy PCS 1121 7 520 1
KIPP DC - Quest Academy PCS 237 7 391 1
KIPP DC - Spring Academy PCS 214 5 410 1
KIPP DC - Valor Academy PCS 243 7 307 1
KIPP DC - WILL Academy PCS 121 6 321 1.04
Kingsman Academy PCS 267 6 252 1.04
LAYC Career Academy PCS 104 5 137 1.38
Latin American Montessori Bilingual PCS 193 4 462 1
Lee Montessori PCS 228 1 177 1
Mary McLeod Bethune Day Academy PCS 135 5 458 1
Maya Angelou PCS - High School 101 4 170 1.22
Maya Angelou PCS - Young Adult Learning Center 137 5 136 0.95
Meridian PCS 165 7 636 1.09
Monument Academy PCS 260 7 116 1.03
Mundo Verde Bilingual PCS 3065 1 578 1.04
National Collegiate Preparatory PCHS 1120 6 277 1.04
Paul PCS - International High School 222 5 480 1.01
Paul PCS - Middle School 170 8 228 1.16
Perry Street Preparatory PCS 161 4 351 0.89
Richard Wright PCS for Journalism and Media Arts 3067 4 282 1.12
Rocketship DC PCS - Legacy Prep 1016 5 106 3.25
Rocketship DC PCS - Rise Academy 286 6 527 1
Roots PCS 173 8 118 1.01
SEED PCS of Washington DC 174 4 363 0.98
Sela PCS 197 7 202 0.99
Shining Stars Montessori Academy PCS 3066 4 274 1

153
Appendix C – Page 34
TABLE 5 (CONTINUED) Ratios of Projected to Audited Enrollments for PCS Schools 2017/18: By School
School Name School Code Ward(s)
Audited Enrollment
Projection / Enrollment Ratio
Somerset Preparatory Academy PCS 187 5 375 1.17
St. Coletta Special Education PCS 1047 8 247 1.01
Sustainable Futures PCS 1000 7 46 2.71
The Children's Guild PCS 255 5 375 0.99
The Next Step El Proximo Paso PCS 168 1 418 0.95
Thurgood Marshall Academy PCS 191 8 383 1.03
Two Rivers PCS - 4th St 198 6 528 1
Two Rivers PCS - Young 270 5 284 1
Washington Global PCS 263 6 196 1.12
Washington Latin PCS - Middle School 125 4 367 0.99
Washington Latin PCS - Upper School 1118 4 331 1.01
Washington Leadership Academy PCS 283 5 204 0.94
Washington Mathematics Science Technology PCHS 178 5 228 1.24
Washington Yu Ying PCS 1117 5 579 0.98
Youthbuild PCS 128 1 119 0.97

154
Appendix C – Page 35
TABLE 6 Mobility Measures for DCPS Schools 2015/16 to 2017/18: By School and Year
School Name School Code Ward Year
Total Stayer
Total Inflow
Total Outflow
Mobility Ratio
AITON ES 202 Ward 7 2015 158 63 44 0.40 AITON ES 202 Ward 7 2016 177 48 53 0.36 AITON ES 202 Ward 7 2017 146 66 60 0.46 AMIDON BOWEN ES 203 Ward 6 2015 242 84 38 0.34 AMIDON BOWEN ES 203 Ward 6 2016 236 86 43 0.35 AMIDON BOWEN ES 203 Ward 6 2017 238 88 39 0.35 ANACOSTIA HS 450 Ward 8 2015 214 136 160 0.58 ANACOSTIA HS 450 Ward 8 2016 210 141 168 0.60 ANACOSTIA HS 450 Ward 8 2017 228 124 184 0.57 BALLOU HS 452 Ward 8 2015 296 391 32 0.59 BALLOU HS 452 Ward 8 2016 394 371 59 0.52 BALLOU HS 452 Ward 8 2017 425 433 88 0.55 BALLOU STAY 462 Ward 8 2015 22 153 200 0.94 BALLOU STAY 462 Ward 8 2016 23 148 211 0.94 BALLOU STAY 462 Ward 8 2017 25 200 282 0.95 BANCROFT ES 204 Ward 4 2015 389 81 22 0.21 BANCROFT ES 204 Ward 4 2016 432 53 12 0.13 BANCROFT ES 204 Ward 4 2017 425 76 11 0.17 BARNARD ES 205 Ward 4 2015 447 116 51 0.27 BARNARD ES 205 Ward 4 2016 467 114 53 0.26 BARNARD ES 205 Ward 4 2017 490 91 53 0.23 BEERS ES 206 Ward 7 2015 288 102 50 0.35 BEERS ES 206 Ward 7 2016 326 96 46 0.30 BEERS ES 206 Ward 7 2017 341 101 40 0.29 BENJAMIN BANNEKER HS 402 Ward 1 2015 297 145 32 0.37 BENJAMIN BANNEKER HS 402 Ward 1 2016 344 134 18 0.31 BENJAMIN BANNEKER HS 402 Ward 1 2017 338 144 31 0.34 BRENT ES 212 Ward 6 2015 270 80 40 0.31 BRENT ES 212 Ward 6 2016 308 64 31 0.24 BRENT ES 212 Ward 6 2017 314 79 24 0.25 BRIGHTWOOD EC 213 Ward 4 2015 502 158 41 0.28 BRIGHTWOOD EC 213 Ward 4 2016 537 172 56 0.30 BRIGHTWOOD EC 213 Ward 4 2017 551 145 67 0.28 BROOKLAND MS 347 Ward 5 2015 45 262 14 0.86 BROOKLAND MS 347 Ward 5 2016 172 79 67 0.46 BROOKLAND MS 347 Ward 5 2017 142 96 44 0.50

155
Appendix C – Page 36
TABLE 6 (CONTINUED) Mobility Measures for DCPS Schools 2015/16 to 2017/18: By School and Year
School Name School
Code Ward Year Total
Stayer Total
Inflow Total
Outflow Mobility
Ratio BROWNE EC 404 Ward 5 2015 201 95 66 0.44 BROWNE EC 404 Ward 5 2016 200 73 71 0.42 BROWNE EC 404 Ward 5 2017 220 80 38 0.35 BRUCE MONROE ES AT PARK VIEW 296 Ward 1 2015 354 70 40 0.24 BRUCE MONROE ES AT PARK VIEW 296 Ward 1 2016 346 81 38 0.26 BRUCE MONROE ES AT PARK VIEW 296 Ward 1 2017 361 68 32 0.22 BUNKER HILL ES 219 Ward 5 2015 <10 142 <10 1.00 BUNKER HILL ES 219 Ward 5 2016 112 57 10 0.37 BUNKER HILL ES 219 Ward 5 2017 138 40 18 0.30 BURROUGHS EC 220 Ward 5 2015 178 65 62 0.42 BURROUGHS EC 220 Ward 5 2016 192 62 42 0.35 BURROUGHS EC 220 Ward 5 2017 186 59 43 0.35 BURRVILLE ES 221 Ward 7 2015 219 53 70 0.36 BURRVILLE ES 221 Ward 7 2016 234 53 37 0.28 BURRVILLE ES 221 Ward 7 2017 196 69 74 0.42 C W HARRIS ES 247 Ward 7 2015 171 96 61 0.48 C W HARRIS ES 247 Ward 7 2016 172 84 50 0.44 C W HARRIS ES 247 Ward 7 2017 172 88 51 0.45 CAPITOL HILL MONTESSORI SCHOOL AT LOGAN 360 Ward 6 2015 231 34 47 0.26 CAPITOL HILL MONTESSORI SCHOOL AT LOGAN 360 Ward 6 2016 261 42 34 0.23 CAPITOL HILL MONTESSORI SCHOOL AT LOGAN 360 Ward 6 2017 275 36 45 0.23 CARDOZO EC 454 Ward 1 2015 344 278 301 0.63 CARDOZO EC 454 Ward 1 2016 405 321 288 0.60 CARDOZO EC 454 Ward 1 2017 427 336 274 0.59 CHOICE ACADEMY 947 Ward 1 2015 <10 <10 <10 1.00 CHOICE ACADEMY 947 Ward 1 2016 <10 <10 <10 1.00 CHOICE ACADEMY 947 Ward 1 2017 <10 <10 <10 1.00 CLEVELAND ES 224 Ward 1 2015 222 55 41 0.30 CLEVELAND ES 224 Ward 1 2016 226 54 31 0.27 CLEVELAND ES 224 Ward 1 2017 224 60 38 0.30

156
Appendix C – Page 37
TABLE 6 (CONTINUED) Mobility Measures for DCPS Schools 2015/16 to 2017/18: By School and Year
School Name School
Code Ward Year Total
Stayer Total
Inflow Total
Outflow Mobility
Ratio COLUMBIA HEIGHTS EC (CHEC) 442 Ward 1 2015 759 472 188 0.47 COLUMBIA HEIGHTS EC (CHEC) 442 Ward 1 2016 818 455 231 0.46 COLUMBIA HEIGHTS EC (CHEC) 442 Ward 1 2017 825 409 260 0.45 COOKE HD ES 227 Ward 1 2015 268 89 50 0.34 COOKE HD ES 227 Ward 1 2016 284 111 37 0.34 COOKE HD ES 227 Ward 1 2017 270 102 60 0.38 COOLIDGE HS 455 Ward 4 2015 151 119 134 0.63 COOLIDGE HS 455 Ward 4 2016 162 100 128 0.58 COOLIDGE HS 455 Ward 4 2017 166 134 184 0.66 DEAL MS 405 Ward 3 2015 1139 202 16 0.16 DEAL MS 405 Ward 3 2016 1249 228 28 0.17 DEAL MS 405 Ward 3 2017 1254 221 41 0.17 DOROTHY HEIGHTS ES 349 Ward 4 2015 <10 422 <10 1.00 DOROTHY HEIGHTS ES 349 Ward 4 2016 351 114 68 0.34 DOROTHY HEIGHTS ES 349 Ward 4 2017 327 88 94 0.36 DREW ES 231 Ward 7 2015 144 76 26 0.41 DREW ES 231 Ward 7 2016 193 41 15 0.22 DREW ES 231 Ward 7 2017 185 61 23 0.31 DUNBAR HS 467 Ward 5 2015 310 164 156 0.51 DUNBAR HS 467 Ward 5 2016 318 208 224 0.58 DUNBAR HS 467 Ward 5 2017 324 282 268 0.63 EASTERN HS 457 Ward 6 2015 572 208 201 0.42 EASTERN HS 457 Ward 6 2016 531 189 306 0.48 EASTERN HS 457 Ward 6 2017 529 218 318 0.50 EATON ES 232 Ward 3 2015 350 120 10 0.27 EATON ES 232 Ward 3 2016 352 120 <10 0.26 EATON ES 232 Ward 3 2017 358 118 <10 0.26 ELIOT HINE MS 407 Ward 6 2015 156 48 117 0.51 ELIOT HINE MS 407 Ward 6 2016 136 59 91 0.52 ELIOT HINE MS 407 Ward 6 2017 138 65 72 0.50 ELLINGTON SCHOOL OF THE ARTS 471 Ward 1 2015 315 173 10 0.37 ELLINGTON SCHOOL OF THE ARTS 471 Ward 1 2016 323 205 12 0.40 ELLINGTON SCHOOL OF THE ARTS 471 Ward 1 2017 356 210 21 0.39

157
Appendix C – Page 38
TABLE 6 (CONTINUED) Mobility Measures for DCPS Schools 2015/16 to 2017/18: By School and Year
School Name School
Code Ward Year Total
Stayer Total
Inflow Total
Outflow Mobility
Ratio GARFIELD ES 238 Ward 8 2015 175 109 61 0.49 GARFIELD ES 238 Ward 8 2016 191 88 61 0.44 GARFIELD ES 238 Ward 8 2017 203 73 47 0.37 GARRISON ES 239 Ward 2 2015 144 48 63 0.44 GARRISON ES 239 Ward 2 2016 138 66 48 0.45 GARRISON ES 239 Ward 2 2017 153 60 51 0.42 HARDY MS 246 Ward 2 2015 259 114 87 0.44 HARDY MS 246 Ward 2 2016 263 108 97 0.44 HARDY MS 246 Ward 2 2017 265 127 92 0.45 HART MS 413 Ward 8 2015 282 92 164 0.48 HART MS 413 Ward 8 2016 247 101 160 0.51 HART MS 413 Ward 8 2017 241 96 184 0.54 HD WOODSON HS 464 Ward 7 2015 324 200 97 0.48 HD WOODSON HS 464 Ward 7 2016 369 213 143 0.49 HD WOODSON HS 464 Ward 7 2017 346 123 195 0.48 HEARST ES 258 Ward 3 2015 207 96 13 0.34 HEARST ES 258 Ward 3 2016 225 82 20 0.31 HEARST ES 258 Ward 3 2017 227 85 14 0.30 HENDLEY ES 249 Ward 8 2015 289 135 91 0.44 HENDLEY ES 249 Ward 8 2016 275 139 86 0.45 HENDLEY ES 249 Ward 8 2017 239 115 111 0.49 HORACE MANN ES 273 Ward 3 2015 237 118 <10 0.34 HORACE MANN ES 273 Ward 3 2016 268 110 <10 0.29 HORACE MANN ES 273 Ward 3 2017 293 107 10 0.29 HOUSTON ES 251 Ward 7 2015 184 62 36 0.35 HOUSTON ES 251 Ward 7 2016 189 79 40 0.39 HOUSTON ES 251 Ward 7 2017 182 56 51 0.37 HYDE ADDISON ES 252 Ward 2 2015 207 91 17 0.34 HYDE ADDISON ES 252 Ward 2 2016 212 100 24 0.37 HYDE ADDISON ES 252 Ward 2 2017 142 162 54 0.60 J O WILSON ES 339 Ward 6 2015 345 105 48 0.31 J O WILSON ES 339 Ward 6 2016 339 99 67 0.33 J O WILSON ES 339 Ward 6 2017 344 117 60 0.34 JANNEY ES 254 Ward 3 2015 561 165 <10 0.23 JANNEY ES 254 Ward 3 2016 584 134 <10 0.19 JANNEY ES 254 Ward 3 2017 570 166 <10 0.23

158
Appendix C – Page 39
TABLE 6 (CONTINUED) Mobility Measures for DCPS Schools 2015/16 to 2017/18: By School and Year
School Name School
Code Ward Year Total
Stayer Total
Inflow Total
Outflow Mobility
Ratio JEFFERSON MIDDLE SCHOOL ACADEMY 433 Ward 6 2015 135 121 47 0.55 JEFFERSON MIDDLE SCHOOL ACADEMY 433 Ward 6 2016 182 113 91 0.53 JEFFERSON MIDDLE SCHOOL ACADEMY 433 Ward 6 2017 208 106 121 0.52 JOHNSON JOHN HAYDEN MS 416 Ward 8 2015 203 77 87 0.45 JOHNSON JOHN HAYDEN MS 416 Ward 8 2016 168 77 91 0.50 JOHNSON JOHN HAYDEN MS 416 Ward 8 2017 176 79 65 0.45 KELLY MILLER MS 421 Ward 7 2015 335 107 175 0.46 KELLY MILLER MS 421 Ward 7 2016 343 106 157 0.43 KELLY MILLER MS 421 Ward 7 2017 297 90 178 0.47 KETCHAM ES 257 Ward 8 2015 192 80 50 0.40 KETCHAM ES 257 Ward 8 2016 201 66 50 0.37 KETCHAM ES 257 Ward 8 2017 203 76 48 0.38 KEY ES 272 Ward 3 2015 287 95 18 0.28 KEY ES 272 Ward 3 2016 294 101 17 0.29 KEY ES 272 Ward 3 2017 312 105 <10 0.26 KIMBALL ES 259 Ward 7 2015 223 99 39 0.38 KIMBALL ES 259 Ward 7 2016 239 102 35 0.36 KIMBALL ES 259 Ward 7 2017 234 66 71 0.37 KING M L ES 344 Ward 8 2015 249 105 56 0.39 KING M L ES 344 Ward 8 2016 254 90 68 0.38 KING M L ES 344 Ward 8 2017 221 98 77 0.44 KRAMER MS 417 Ward 8 2015 177 65 224 0.62 KRAMER MS 417 Ward 8 2016 144 44 197 0.63 KRAMER MS 417 Ward 8 2017 135 59 182 0.64 LAFAYETTE ES 261 Ward 4 2015 541 154 <10 0.23 LAFAYETTE ES 261 Ward 4 2016 541 219 <10 0.29 LAFAYETTE ES 261 Ward 4 2017 588 227 <10 0.28 LANGDON EC 262 Ward 5 2015 178 89 113 0.53 LANGDON EC 262 Ward 5 2016 222 62 17 0.26 LANGDON EC 262 Ward 5 2017 216 69 38 0.33

159
Appendix C – Page 40
TABLE 6 (CONTINUED) Mobility Measures for DCPS Schools 2015/16 to 2017/18: By School and Year
School Name School
Code Ward Year Total
Stayer Total
Inflow Total
Outflow Mobility
Ratio LANGLEY EDUCATION CAMPUS 370 Ward 5 2015 170 73 44 0.41 LANGLEY EDUCATION CAMPUS 370 Ward 5 2016 189 69 40 0.37 LANGLEY EDUCATION CAMPUS 370 Ward 5 2017 164 70 62 0.45 LASALLE-BACKUS EC 264 Ward 4 2015 233 87 35 0.34 LASALLE-BACKUS EC 264 Ward 4 2016 230 121 35 0.40 LASALLE-BACKUS EC 264 Ward 4 2017 244 96 32 0.34 LECKIE ES 266 Ward 8 2015 304 162 50 0.41 LECKIE ES 266 Ward 8 2016 320 188 59 0.44 LECKIE ES 266 Ward 8 2017 353 163 62 0.39 LUDLOW-TAYLOR ES 271 Ward 6 2015 235 72 29 0.30 LUDLOW-TAYLOR ES 271 Ward 6 2016 271 55 39 0.26 LUDLOW-TAYLOR ES 271 Ward 6 2017 291 76 28 0.26 LUKE MOORE ALTERNATIVE HS 884 Ward 5 2015 16 139 <10 0.90 LUKE MOORE ALTERNATIVE HS 884 Ward 5 2016 29 136 <10 0.83 LUKE MOORE ALTERNATIVE HS 884 Ward 5 2017 27 185 <10 0.88 MACFARLAND MS DUAL LANGUAGE PROGRAM 420 Ward 4 2015 <10 <10 <10 MACFARLAND MS DUAL LANGUAGE PROGRAM 420 Ward 4 2016 <10 69 <10 1.00 MACFARLAND MS DUAL LANGUAGE PROGRAM 420 Ward 4 2017 61 71 <10 0.55 MALCOLM X ES AT GREEN 308 Ward 8 2015 111 81 63 0.56 MALCOLM X ES AT GREEN 308 Ward 8 2016 144 64 56 0.45 MALCOLM X ES AT GREEN 308 Ward 8 2017 144 85 52 0.49 MARIE REED ES 284 Ward 4 2015 294 51 38 0.23 MARIE REED ES 284 Ward 4 2016 292 60 40 0.26 MARIE REED ES 284 Ward 4 2017 297 82 19 0.25 MAURY ES 274 Ward 6 2015 293 48 20 0.19 MAURY ES 274 Ward 6 2016 296 49 22 0.19 MAURY ES 274 Ward 6 2017 314 54 20 0.19 MCKINLEY MIDDLE SCHOOL 435 Ward 5 2015 122 101 35 0.53 MCKINLEY MIDDLE SCHOOL 435 Ward 5 2016 141 73 38 0.44 MCKINLEY MIDDLE SCHOOL 435 Ward 5 2017 145 96 37 0.48 MCKINLEY TECHNOLOGY HS 458 Ward 5 2015 393 243 47 0.42 MCKINLEY TECHNOLOGY HS 458 Ward 5 2016 437 165 36 0.32 MCKINLEY TECHNOLOGY HS 458 Ward 5 2017 411 209 31 0.37 MINER ES 280 Ward 6 2015 279 65 62 0.31 MINER ES 280 Ward 6 2016 281 57 48 0.27 MINER ES 280 Ward 6 2017 213 86 96 0.46

160
Appendix C – Page 41
TABLE 6 (CONTINUED) Mobility Measures for DCPS Schools 2015/16 to 2017/18: By School and Year
School Name School
Code Ward Year Total
Stayer Total
Inflow Total
Outflow Mobility
Ratio MOTEN ES 285 Ward 8 2015 263 109 58 0.39 MOTEN ES 285 Ward 8 2016 273 92 73 0.38 MOTEN ES 285 Ward 8 2017 248 113 83 0.44 MURCH ES 287 Ward 3 2015 438 185 17 0.32 MURCH ES 287 Ward 3 2016 436 136 27 0.27 MURCH ES 287 Ward 3 2017 422 151 <10 0.27 NALLE ES 288 Ward 7 2015 250 90 51 0.36 NALLE ES 288 Ward 7 2016 257 77 60 0.35 NALLE ES 288 Ward 7 2017 275 71 55 0.31 NOYES EC 290 Ward 5 2015 123 40 82 0.50 NOYES EC 290 Ward 5 2016 120 58 26 0.41 NOYES EC 290 Ward 5 2017 117 60 42 0.47 ORR ES 291 Ward 8 2015 252 122 68 0.43 ORR ES 291 Ward 8 2016 277 85 62 0.35 ORR ES 291 Ward 8 2017 297 68 47 0.28 OYSTER ADAMS BILINGUAL SCHOOL 292 Ward 3 2015 516 144 24 0.25 OYSTER ADAMS BILINGUAL SCHOOL 292 Ward 3 2016 553 112 17 0.19 OYSTER ADAMS BILINGUAL SCHOOL 292 Ward 3 2017 549 124 13 0.20 PATTERSON ES 294 Ward 8 2015 244 118 74 0.44 PATTERSON ES 294 Ward 8 2016 272 86 62 0.35 PATTERSON ES 294 Ward 8 2017 255 89 67 0.38 PAYNE ES 295 Ward 6 2015 198 74 28 0.34 PAYNE ES 295 Ward 6 2016 205 66 35 0.33 PAYNE ES 295 Ward 6 2017 185 92 53 0.44 PEABODY ES (CAPITOL HILL CLUSTER) 301 Ward 6 2015 107 52 91 0.57 PEABODY ES (CAPITOL HILL CLUSTER) 301 Ward 6 2016 111 54 85 0.56 PEABODY ES (CAPITOL HILL CLUSTER) 301 Ward 6 2017 118 49 80 0.52 PHELPS ARCHITECTURE CONSTRUCTION AND ENGINEERING HS 478 Ward 5 2015 173 89 37 0.42 PHELPS ARCHITECTURE CONSTRUCTION AND ENGINEERING HS 478 Ward 5 2016 181 127 26 0.46 PHELPS ARCHITECTURE CONSTRUCTION AND ENGINEERING HS 478 Ward 5 2017 177 83 35 0.40

161
Appendix C – Page 42
TABLE 6 (CONTINUED) Mobility Measures for DCPS Schools 2015/16 to 2017/18: By School and Year
School Name School
Code Ward Year Total
Stayer Total
Inflow Total
Outflow Mobility
Ratio PLUMMER ES 299 Ward 7 2015 280 93 70 0.37 PLUMMER ES 299 Ward 7 2016 287 72 50 0.30 PLUMMER ES 299 Ward 7 2017 260 87 56 0.35 POWELL ES 300 Ward 4 2015 367 101 24 0.25 POWELL ES 300 Ward 4 2016 395 89 30 0.23 POWELL ES 300 Ward 4 2017 430 74 21 0.18 RANDLE HIGHLANDS ES 316 Ward 7 2015 225 73 58 0.37 RANDLE HIGHLANDS ES 316 Ward 7 2016 236 63 39 0.30 RANDLE HIGHLANDS ES 316 Ward 7 2017 225 66 35 0.31 RAYMOND EC 302 Ward 4 2015 384 104 77 0.32 RAYMOND EC 302 Ward 4 2016 422 129 52 0.30 RAYMOND EC 302 Ward 4 2017 445 103 72 0.28 RIVER TERRACE ES 304 Ward 7 2015 <10 41 <10 1.00 RIVER TERRACE ES 304 Ward 7 2016 22 27 <10 0.57 RIVER TERRACE ES 304 Ward 7 2017 31 16 <10 0.34 RON BROWN COLLEGE PREPARATORY HS 436 Ward 7 2015 <10 <10 <10 RON BROWN COLLEGE PREPARATORY HS 436 Ward 7 2016 <10 97 <10 1.00 RON BROWN COLLEGE PREPARATORY HS 436 Ward 7 2017 82 127 <10 0.62 ROOSEVELT HS 459 Ward 4 2015 142 220 66 0.67 ROOSEVELT HS 459 Ward 4 2016 217 344 83 0.66 ROOSEVELT HS 459 Ward 4 2017 323 355 158 0.61 ROOSEVELT STAY 456 Ward 4 2015 <10 173 <10 1.00 ROOSEVELT STAY 456 Ward 4 2016 13 132 <10 0.91 ROOSEVELT STAY 456 Ward 4 2017 26 262 <10 0.91 ROSS ES 305 Ward 2 2015 124 25 12 0.23 ROSS ES 305 Ward 2 2016 119 36 12 0.29 ROSS ES 305 Ward 2 2017 125 33 14 0.27 SAVOY ES 307 Ward 8 2015 236 65 65 0.36 SAVOY ES 307 Ward 8 2016 226 57 57 0.34 SAVOY ES 307 Ward 8 2017 199 50 66 0.37 SCHOOL WITHIN SCHOOL AT GODING 175 Ward 6 2015 220 32 <10 0.16 SCHOOL WITHIN SCHOOL AT GODING 175 Ward 6 2016 241 34 23 0.19 SCHOOL WITHIN SCHOOL AT GODING 175 Ward 6 2017 244 34 19 0.18

162
Appendix C – Page 43
TABLE 6 (CONTINUED) Mobility Measures for DCPS Schools 2015/16 to 2017/18: By School and Year
School Name School
Code Ward Year Total
stayer Total
Inflow Total
Outflow Mobility
Ratio
SCHOOL WITHOUT WALLS @ FRANCIS-STEVENS 409 Ward 2 2015 286 111 40 0.35 SCHOOL WITHOUT WALLS @ FRANCIS-STEVENS 409 Ward 2 2016 323 109 32 0.30 SCHOOL WITHOUT WALLS @ FRANCIS-STEVENS 409 Ward 2 2017 339 94 31 0.27 SCHOOL WITHOUT WALLS SHS 466 Ward 2 2015 385 198 <10 0.35 SCHOOL WITHOUT WALLS SHS 466 Ward 2 2016 405 179 <10 0.31 SCHOOL WITHOUT WALLS SHS 466 Ward 2 2017 414 178 <10 0.31 SEATON ES 309 Ward 6 2015 216 48 27 0.26 SEATON ES 309 Ward 6 2016 235 63 32 0.29 SEATON ES 309 Ward 6 2017 259 68 36 0.29 SHEPHERD ES 313 Ward 4 2015 211 90 24 0.35 SHEPHERD ES 313 Ward 4 2016 248 81 21 0.29 SHEPHERD ES 313 Ward 4 2017 269 66 12 0.22 SIMON ES 315 Ward 8 2015 200 71 36 0.35 SIMON ES 315 Ward 8 2016 185 69 46 0.38 SIMON ES 315 Ward 8 2017 179 75 37 0.38 SMOTHERS ES 322 Ward 7 2015 166 70 63 0.44 SMOTHERS ES 322 Ward 7 2016 161 60 52 0.41 SMOTHERS ES 322 Ward 7 2017 148 72 55 0.46 SOUSA MS 427 Ward 7 2015 185 66 103 0.48 SOUSA MS 427 Ward 7 2016 195 57 108 0.46 SOUSA MS 427 Ward 7 2017 170 58 139 0.54 STANTON ES 319 Ward 8 2015 353 118 80 0.36 STANTON ES 319 Ward 8 2016 362 117 55 0.32 STANTON ES 319 Ward 8 2017 351 113 71 0.34 STODDERT ES 321 Ward 3 2015 312 102 16 0.27 STODDERT ES 321 Ward 3 2016 314 120 <10 0.28 STODDERT ES 321 Ward 3 2017 290 148 28 0.38 STUART-HOBSON MS (CAPITOL HILL CLUSTER) 428 Ward 6 2015 292 132 32 0.36 STUART-HOBSON MS (CAPITOL HILL CLUSTER) 428 Ward 6 2016 298 132 44 0.37 STUART-HOBSON MS (CAPITOL HILL CLUSTER) 428 Ward 6 2017 309 113 49 0.34 TAKOMA EC 324 Ward 4 2015 338 96 41 0.29 TAKOMA EC 324 Ward 4 2016 334 101 45 0.30 TAKOMA EC 324 Ward 4 2017 340 100 41 0.29

163
Appendix C – Page 44
TABLE 6 (CONTINUED) Mobility Measures for DCPS Schools 2015/16 to 2017/18: By School and Year
School Name School
Code Ward Year Total
Stayer Total
Inflow Total
Outflow Mobility
Ratio THOMAS ES 325 Ward 7 2015 272 107 75 0.40 THOMAS ES 325 Ward 7 2016 255 106 76 0.42 THOMAS ES 325 Ward 7 2017 252 98 89 0.43 THOMSON ES 326 Ward 2 2015 199 52 28 0.29 THOMSON ES 326 Ward 2 2016 218 61 20 0.27 THOMSON ES 326 Ward 2 2017 216 60 23 0.28 TRUESDELL EC 327 Ward 4 2015 403 136 33 0.30 TRUESDELL EC 327 Ward 4 2016 465 167 35 0.30 TRUESDELL EC 327 Ward 4 2017 516 138 56 0.27 TUBMAN ES 328 Ward 1 2015 377 120 43 0.30 TUBMAN ES 328 Ward 1 2016 385 104 62 0.30 TUBMAN ES 328 Ward 1 2017 375 134 46 0.32 TURNER ES 329 Ward 8 2015 265 156 44 0.43 TURNER ES 329 Ward 8 2016 300 143 78 0.42 TURNER ES 329 Ward 8 2017 317 112 78 0.37 TYLER ES 330 Ward 6 2015 374 81 62 0.28 TYLER ES 330 Ward 6 2016 369 82 67 0.29 TYLER ES 330 Ward 6 2017 382 85 60 0.28 VAN NESS ES 331 Ward 6 2015 <10 55 <10 1.00 VAN NESS ES 331 Ward 6 2016 73 53 <10 0.46 VAN NESS ES 331 Ward 6 2017 139 42 10 0.27 WALKER-JONES EC 332 Ward 6 2015 280 100 74 0.38 WALKER-JONES EC 332 Ward 6 2016 290 112 85 0.40 WALKER-JONES EC 332 Ward 6 2017 302 96 72 0.36 WASHINGTON METROPOLITAN HS 474 Ward 1 2015 31 52 12 0.67 WASHINGTON METROPOLITAN HS 474 Ward 1 2016 33 69 17 0.72 WASHINGTON METROPOLITAN HS 474 Ward 1 2017 28 153 13 0.86 WATKINS ES (CAPITOL HILL CLUSTER) 333 Ward 6 2015 324 135 52 0.37 WATKINS ES (CAPITOL HILL CLUSTER) 333 Ward 6 2016 297 140 42 0.38 WATKINS ES (CAPITOL HILL CLUSTER) 333 Ward 6 2017 301 127 32 0.35 WEST EC 336 Ward 4 2015 207 68 18 0.29 WEST EC 336 Ward 4 2016 223 67 33 0.31 WEST EC 336 Ward 4 2017 218 83 44 0.37 WHEATLEY EC 335 Ward 5 2015 237 80 122 0.46 WHEATLEY EC 335 Ward 5 2016 213 83 78 0.43 WHEATLEY EC 335 Ward 5 2017 195 98 62 0.45
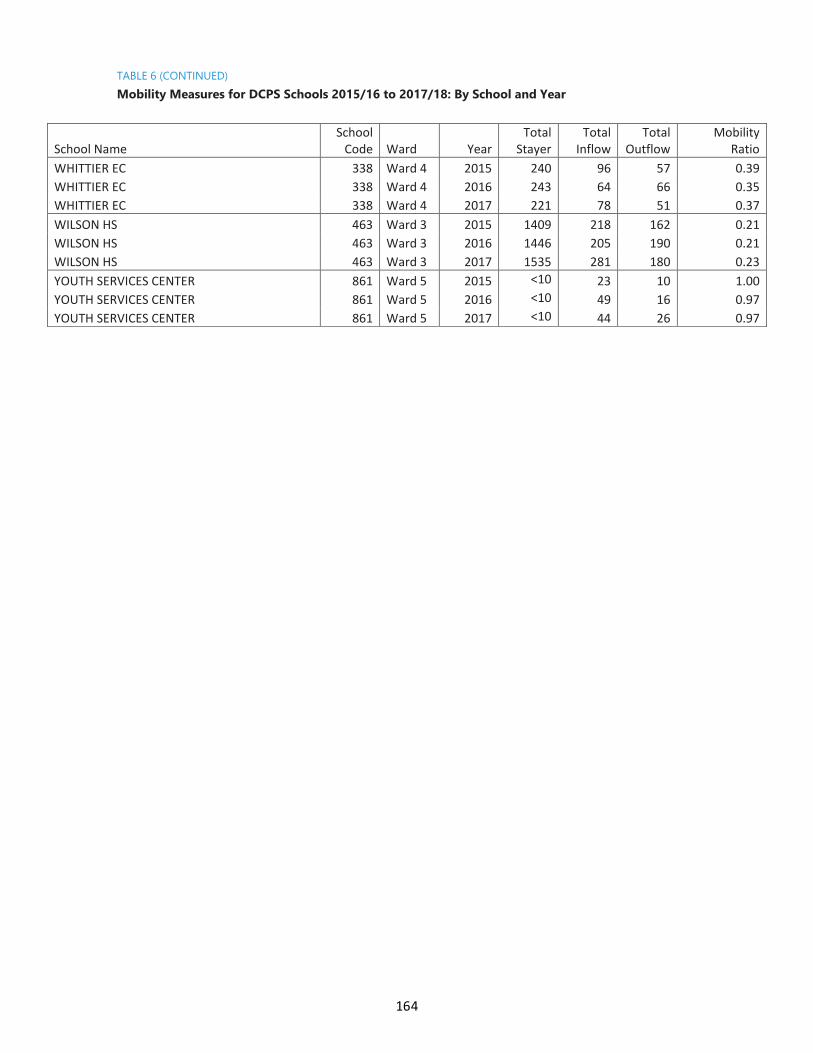
164
Appendix C – Page 45
TABLE 6 (CONTINUED) Mobility Measures for DCPS Schools 2015/16 to 2017/18: By School and Year
School Name School
Code Ward Year Total
Stayer Total
Inflow Total
Outflow Mobility
Ratio WHITTIER EC 338 Ward 4 2015 240 96 57 0.39 WHITTIER EC 338 Ward 4 2016 243 64 66 0.35 WHITTIER EC 338 Ward 4 2017 221 78 51 0.37 WILSON HS 463 Ward 3 2015 1409 218 162 0.21 WILSON HS 463 Ward 3 2016 1446 205 190 0.21 WILSON HS 463 Ward 3 2017 1535 281 180 0.23 YOUTH SERVICES CENTER 861 Ward 5 2015 <10 23 10 1.00 YOUTH SERVICES CENTER 861 Ward 5 2016 <10 49 16 0.97 YOUTH SERVICES CENTER 861 Ward 5 2017 <10 44 26 0.97

165
Appendix C – Page 46
TABLE 7 Mobility Measures for PCS Schools 2015/16 to 2017/18: By School and Year
School Name School Code Ward Year Total
Stayer Total
Inflow Total
Outflow Mobility
Ratio ACHIEVEMENT PREPARATORY PCS-ES 217 Ward 8 2015 130 132 92 0.63 ACHIEVEMENT PREPARATORY PCS-ES 217 Ward 8 2016 132 257 108 0.73 ACHIEVEMENT PREPARATORY PCS-ES 217 Ward 8 2017 277 134 133 0.49 ACHIEVEMENT PREPARATORY PCS-MS 1100 Ward 8 2015 166 205 52 0.61 ACHIEVEMENT PREPARATORY PCS-MS 1100 Ward 8 2016 202 256 33 0.59 ACHIEVEMENT PREPARATORY PCS-MS 1100 Ward 8 2017 240 236 27 0.52 APPLETREE EARLY LEARNING PCS- SOUTHEAST 3072 Ward 8 2015 60 27 92 0.66 APPLETREE EARLY LEARNING PCS- SOUTHEAST 3072 Ward 8 2016 46 36 113 0.76 APPLETREE EARLY LEARNING PCS- SOUTHEAST 3072 Ward 8 2017 52 37 91 0.71 APPLETREE EARLY LEARNING PCS-COLUMBIA HEIGHTS 140 Ward 1 2015 53 12 81 0.64
APPLETREE EARLY LEARNING PCS-COLUMBIA HEIGHTS 140 Ward 1 2016 57 23 79 0.64
APPLETREE EARLY LEARNING PCS-COLUMBIA HEIGHTS 140 Ward 1 2017 56 25 80 0.65
APPLETREE EARLY LEARNING PCS-LINCOLN PARK 3073 Ward 6 2015 12 <10 35 0.76 APPLETREE EARLY LEARNING PCS-LINCOLN PARK 3073 Ward 6 2016 19 14 29 0.69 APPLETREE EARLY LEARNING PCS-LINCOLN PARK 3073 Ward 6 2017 18 <10 29 0.68 APPLETREE EARLY LEARNING PCS-OKLAHOMA AVENUE 1137 Ward 7 2015 47 33 83 0.71
APPLETREE EARLY LEARNING PCS-OKLAHOMA AVENUE 1137 Ward 7 2016 39 26 90 0.75
APPLETREE EARLY LEARNING PCS-OKLAHOMA AVENUE 1137 Ward 7 2017 46 25 70 0.67
APPLETREE EARLY LEARNING PCS-SOUTHWEST 141 Ward 6 2015 31 17 44 0.66 APPLETREE EARLY LEARNING PCS-SOUTHWEST 141 Ward 6 2016 30 19 57 0.72 APPLETREE EARLY LEARNING PCS-SOUTHWEST 141 Ward 6 2017 39 <10 55 0.61 BASIS DC PCS 3068 Ward 2 2015 237 332 31 0.61 BASIS DC PCS 3068 Ward 2 2016 283 300 36 0.54 BASIS DC PCS 3068 Ward 2 2017 310 288 31 0.51 BREAKTHROUGH MONTESSORI PCS 289 Ward 4 2015 <10 <10 <10 BREAKTHROUGH MONTESSORI PCS 289 Ward 4 2016 <10 39 <10 1.00 BREAKTHROUGH MONTESSORI PCS 289 Ward 4 2017 64 28 19 0.42

166
Appendix C – Page 47
TABLE 7 (CONTINUED) Mobility Measures for PCS Schools 2015/16 to 2017/18: By School and Year
School Name School Code Ward Year Total Stayer
Total Inflow
Total Outflow
Mobility Ratio
BRIDGES PCS 142 Ward 5 2015 189 67 50 0.38 BRIDGES PCS 142 Ward 5 2016 208 69 80 0.42 BRIDGES PCS 142 Ward 5 2017 254 89 38 0.33 BRIYA PCS 126 Ward 1 2015 <10 <10 16 0.70 BRIYA PCS 126 Ward 1 2016 <10 <10 15 0.74 BRIYA PCS 126 Ward 1 2017 14 <10 15 0.63 CAPITAL CITY PCS- HS 1207 Ward 4 2015 190 106 <10 0.38 CAPITAL CITY PCS- HS 1207 Ward 4 2016 219 93 16 0.33 CAPITAL CITY PCS- HS 1207 Ward 4 2017 222 113 21 0.38 CAPITAL CITY PCS-ES 184 Ward 4 2015 233 58 58 0.33 CAPITAL CITY PCS-ES 184 Ward 4 2016 232 59 67 0.35 CAPITAL CITY PCS-ES 184 Ward 4 2017 241 51 61 0.32 CAPITAL CITY PCS-MS 182 Ward 4 2015 142 178 <10 0.57 CAPITAL CITY PCS-MS 182 Ward 4 2016 150 175 <10 0.55 CAPITAL CITY PCS-MS 182 Ward 4 2017 158 176 <10 0.53 CARLOS ROSARIO INTERNATIONAL PCS 1119 Ward 1 2015 <10 <10 <10 CARLOS ROSARIO INTERNATIONAL PCS 1119 Ward 1 2016 <10 <10 <10 CARLOS ROSARIO INTERNATIONAL PCS 1119 Ward 1 2017 <10 <10 <10 CEDAR TREE ACADEMY PCS 188 Ward 8 2015 182 62 114 0.49 CEDAR TREE ACADEMY PCS 188 Ward 8 2016 168 66 155 0.57 CEDAR TREE ACADEMY PCS 188 Ward 8 2017 189 65 136 0.52 CENTER CITY PCS - BRIGHTWOOD 1103 Ward 4 2015 166 81 17 0.37 CENTER CITY PCS - BRIGHTWOOD 1103 Ward 4 2016 191 69 <10 0.29 CENTER CITY PCS - BRIGHTWOOD 1103 Ward 4 2017 202 44 <10 0.20 CENTER CITY PCS - CAPITOL HILL 1104 Ward 6 2015 112 129 34 0.59 CENTER CITY PCS - CAPITOL HILL 1104 Ward 6 2016 117 114 50 0.58 CENTER CITY PCS - CAPITOL HILL 1104 Ward 6 2017 133 108 42 0.53 CENTER CITY PCS - CONGRESS HEIGHTS 1105 Ward 8 2015 167 69 35 0.38 CENTER CITY PCS - CONGRESS HEIGHTS 1105 Ward 8 2016 147 91 27 0.45 CENTER CITY PCS - CONGRESS HEIGHTS 1105 Ward 8 2017 153 89 25 0.43 CENTER CITY PCS - PETWORTH 1106 Ward 4 2015 181 70 20 0.33 CENTER CITY PCS - PETWORTH 1106 Ward 4 2016 164 73 19 0.36 CENTER CITY PCS - PETWORTH 1106 Ward 4 2017 180 54 19 0.29
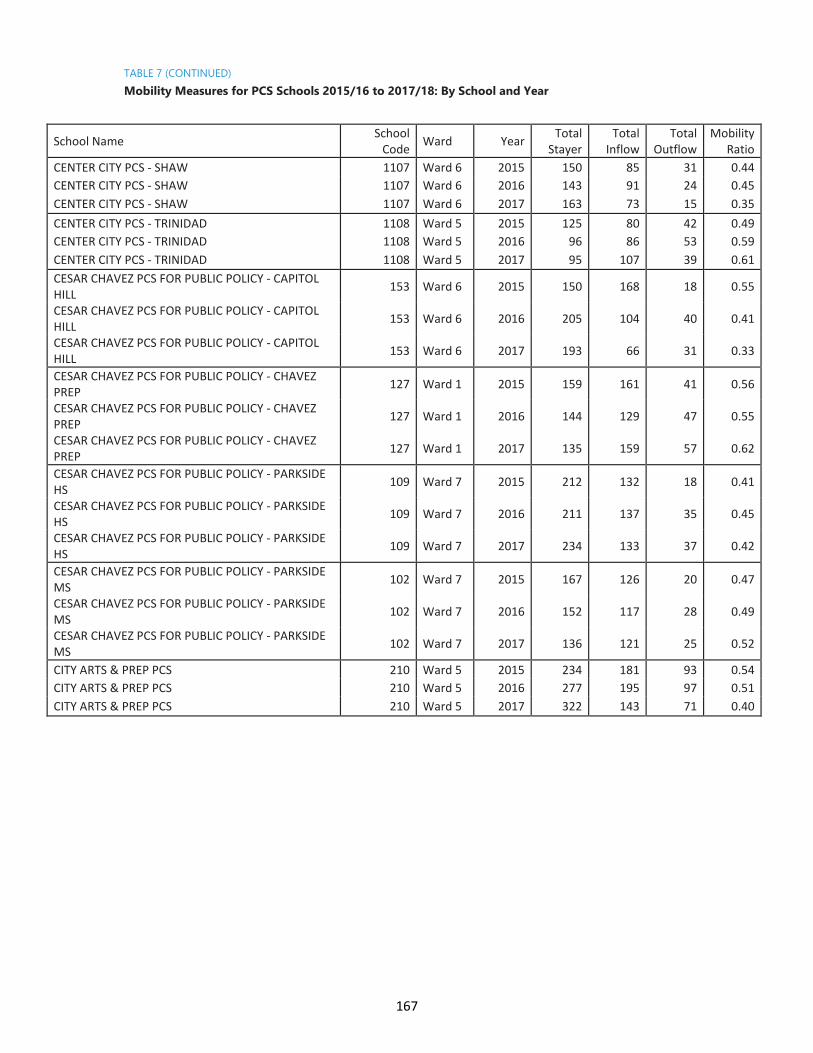
167
Appendix C – Page 48
TABLE 7 (CONTINUED) Mobility Measures for PCS Schools 2015/16 to 2017/18: By School and Year
School Name School Code Ward Year Total
Stayer Total
Inflow Total
Outflow Mobility
Ratio CENTER CITY PCS - SHAW 1107 Ward 6 2015 150 85 31 0.44 CENTER CITY PCS - SHAW 1107 Ward 6 2016 143 91 24 0.45 CENTER CITY PCS - SHAW 1107 Ward 6 2017 163 73 15 0.35 CENTER CITY PCS - TRINIDAD 1108 Ward 5 2015 125 80 42 0.49 CENTER CITY PCS - TRINIDAD 1108 Ward 5 2016 96 86 53 0.59 CENTER CITY PCS - TRINIDAD 1108 Ward 5 2017 95 107 39 0.61 CESAR CHAVEZ PCS FOR PUBLIC POLICY - CAPITOL HILL 153 Ward 6 2015 150 168 18 0.55
CESAR CHAVEZ PCS FOR PUBLIC POLICY - CAPITOL HILL 153 Ward 6 2016 205 104 40 0.41
CESAR CHAVEZ PCS FOR PUBLIC POLICY - CAPITOL HILL 153 Ward 6 2017 193 66 31 0.33
CESAR CHAVEZ PCS FOR PUBLIC POLICY - CHAVEZ PREP 127 Ward 1 2015 159 161 41 0.56
CESAR CHAVEZ PCS FOR PUBLIC POLICY - CHAVEZ PREP 127 Ward 1 2016 144 129 47 0.55
CESAR CHAVEZ PCS FOR PUBLIC POLICY - CHAVEZ PREP 127 Ward 1 2017 135 159 57 0.62
CESAR CHAVEZ PCS FOR PUBLIC POLICY - PARKSIDE HS 109 Ward 7 2015 212 132 18 0.41
CESAR CHAVEZ PCS FOR PUBLIC POLICY - PARKSIDE HS 109 Ward 7 2016 211 137 35 0.45
CESAR CHAVEZ PCS FOR PUBLIC POLICY - PARKSIDE HS 109 Ward 7 2017 234 133 37 0.42
CESAR CHAVEZ PCS FOR PUBLIC POLICY - PARKSIDE MS 102 Ward 7 2015 167 126 20 0.47
CESAR CHAVEZ PCS FOR PUBLIC POLICY - PARKSIDE MS 102 Ward 7 2016 152 117 28 0.49
CESAR CHAVEZ PCS FOR PUBLIC POLICY - PARKSIDE MS 102 Ward 7 2017 136 121 25 0.52
CITY ARTS & PREP PCS 210 Ward 5 2015 234 181 93 0.54 CITY ARTS & PREP PCS 210 Ward 5 2016 277 195 97 0.51 CITY ARTS & PREP PCS 210 Ward 5 2017 322 143 71 0.40
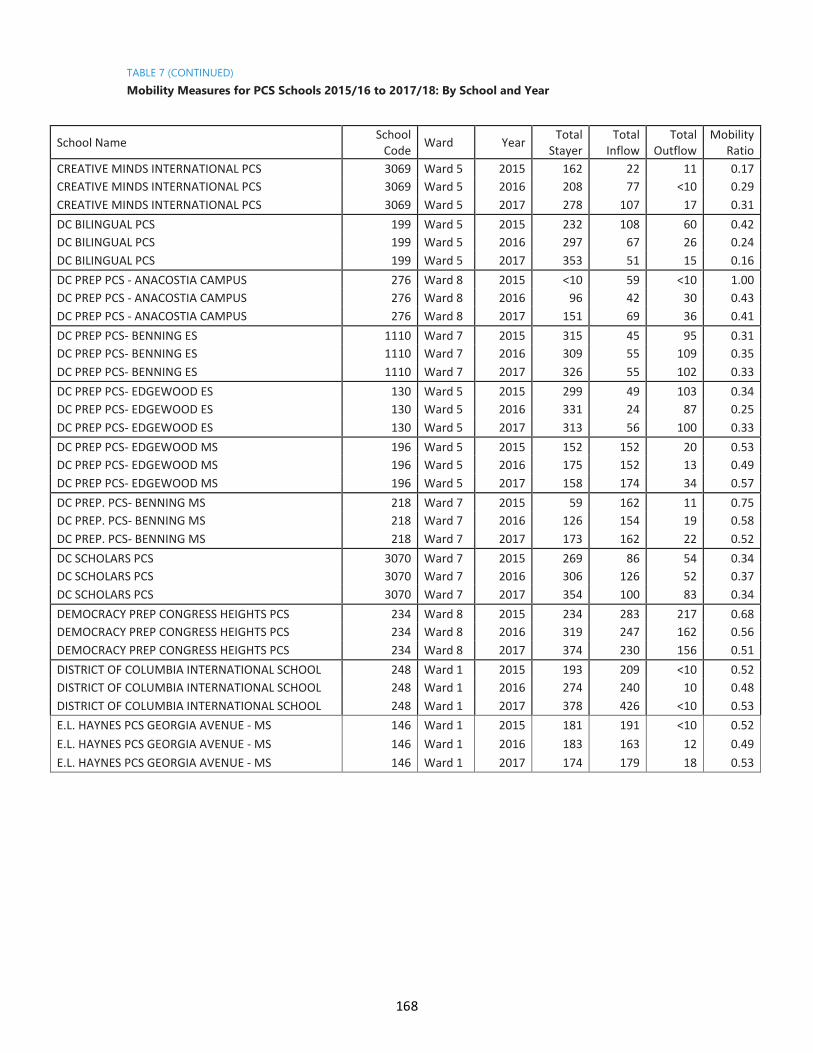
168
Appendix C – Page 49
TABLE 7 (CONTINUED) Mobility Measures for PCS Schools 2015/16 to 2017/18: By School and Year
School Name School Code Ward Year Total
Stayer Total
Inflow Total
Outflow Mobility
Ratio CREATIVE MINDS INTERNATIONAL PCS 3069 Ward 5 2015 162 22 11 0.17 CREATIVE MINDS INTERNATIONAL PCS 3069 Ward 5 2016 208 77 <10 0.29 CREATIVE MINDS INTERNATIONAL PCS 3069 Ward 5 2017 278 107 17 0.31 DC BILINGUAL PCS 199 Ward 5 2015 232 108 60 0.42 DC BILINGUAL PCS 199 Ward 5 2016 297 67 26 0.24 DC BILINGUAL PCS 199 Ward 5 2017 353 51 15 0.16 DC PREP PCS - ANACOSTIA CAMPUS 276 Ward 8 2015 <10 59 <10 1.00 DC PREP PCS - ANACOSTIA CAMPUS 276 Ward 8 2016 96 42 30 0.43 DC PREP PCS - ANACOSTIA CAMPUS 276 Ward 8 2017 151 69 36 0.41 DC PREP PCS- BENNING ES 1110 Ward 7 2015 315 45 95 0.31 DC PREP PCS- BENNING ES 1110 Ward 7 2016 309 55 109 0.35 DC PREP PCS- BENNING ES 1110 Ward 7 2017 326 55 102 0.33 DC PREP PCS- EDGEWOOD ES 130 Ward 5 2015 299 49 103 0.34 DC PREP PCS- EDGEWOOD ES 130 Ward 5 2016 331 24 87 0.25 DC PREP PCS- EDGEWOOD ES 130 Ward 5 2017 313 56 100 0.33 DC PREP PCS- EDGEWOOD MS 196 Ward 5 2015 152 152 20 0.53 DC PREP PCS- EDGEWOOD MS 196 Ward 5 2016 175 152 13 0.49 DC PREP PCS- EDGEWOOD MS 196 Ward 5 2017 158 174 34 0.57 DC PREP. PCS- BENNING MS 218 Ward 7 2015 59 162 11 0.75 DC PREP. PCS- BENNING MS 218 Ward 7 2016 126 154 19 0.58 DC PREP. PCS- BENNING MS 218 Ward 7 2017 173 162 22 0.52 DC SCHOLARS PCS 3070 Ward 7 2015 269 86 54 0.34 DC SCHOLARS PCS 3070 Ward 7 2016 306 126 52 0.37 DC SCHOLARS PCS 3070 Ward 7 2017 354 100 83 0.34 DEMOCRACY PREP CONGRESS HEIGHTS PCS 234 Ward 8 2015 234 283 217 0.68 DEMOCRACY PREP CONGRESS HEIGHTS PCS 234 Ward 8 2016 319 247 162 0.56 DEMOCRACY PREP CONGRESS HEIGHTS PCS 234 Ward 8 2017 374 230 156 0.51 DISTRICT OF COLUMBIA INTERNATIONAL SCHOOL 248 Ward 1 2015 193 209 <10 0.52 DISTRICT OF COLUMBIA INTERNATIONAL SCHOOL 248 Ward 1 2016 274 240 10 0.48 DISTRICT OF COLUMBIA INTERNATIONAL SCHOOL 248 Ward 1 2017 378 426 <10 0.53 E.L. HAYNES PCS GEORGIA AVENUE - MS 146 Ward 1 2015 181 191 <10 0.52 E.L. HAYNES PCS GEORGIA AVENUE - MS 146 Ward 1 2016 183 163 12 0.49 E.L. HAYNES PCS GEORGIA AVENUE - MS 146 Ward 1 2017 174 179 18 0.53

169
Appendix C – Page 50
TABLE 7 (CONTINUED) Mobility Measures for PCS Schools 2015/16 to 2017/18: By School and Year
School Name School Code Ward Year Total
Stayer Total
Inflow Total
Outflow Mobility
Ratio E.L. HAYNES PCS KANSAS AVENUE - ES 1206 Ward 4 2015 242 44 89 0.35 E.L. HAYNES PCS KANSAS AVENUE - ES 1206 Ward 4 2016 250 49 59 0.30 E.L. HAYNES PCS KANSAS AVENUE - ES 1206 Ward 4 2017 252 52 78 0.34 E.L. HAYNES PCS KANSAS AVENUE - HS 1138 Ward 4 2015 233 110 <10 0.34 E.L. HAYNES PCS KANSAS AVENUE - HS 1138 Ward 4 2016 275 125 <10 0.33 E.L. HAYNES PCS KANSAS AVENUE - HS 1138 Ward 4 2017 276 154 25 0.39 EAGLE ACADEMY PCS - CAPITOL RIVERFRONT 1125 Ward 6 2015 93 18 33 0.35 EAGLE ACADEMY PCS - CAPITOL RIVERFRONT 1125 Ward 6 2016 79 30 40 0.47 EAGLE ACADEMY PCS - CAPITOL RIVERFRONT 1125 Ward 6 2017 96 30 37 0.41 EAGLE ACADEMY PCS - CONGRESS HEIGHTS 195 Ward 8 2015 530 99 170 0.34 EAGLE ACADEMY PCS - CONGRESS HEIGHTS 195 Ward 8 2016 506 103 199 0.37 EAGLE ACADEMY PCS - CONGRESS HEIGHTS 195 Ward 8 2017 506 157 159 0.38 EARLY CHILDHOOD ACADEMY PCS 138 Ward 8 2015 157 52 59 0.41 EARLY CHILDHOOD ACADEMY PCS 138 Ward 8 2016 145 41 74 0.44 EARLY CHILDHOOD ACADEMY PCS 138 Ward 8 2017 143 52 62 0.44 ELSIE WHITLOW STOKES COMMUNITY FREEDOM PCS 159 Ward 5 2015 287 15 <10 0.07
ELSIE WHITLOW STOKES COMMUNITY FREEDOM PCS 159 Ward 5 2016 289 30 <10 0.11
ELSIE WHITLOW STOKES COMMUNITY FREEDOM PCS 159 Ward 5 2017 290 29 <10 0.10
EXCEL ACADEMY PCS 1113 Ward 8 2015 408 243 100 0.46 EXCEL ACADEMY PCS 1113 Ward 8 2016 463 186 145 0.42 EXCEL ACADEMY PCS 1113 Ward 8 2017 409 172 137 0.43 FRIENDSHIP PCS - ARMSTRONG 269 Ward 5 2015 <10 357 <10 1.00 FRIENDSHIP PCS - ARMSTRONG 269 Ward 5 2016 279 92 83 0.39 FRIENDSHIP PCS - ARMSTRONG 269 Ward 5 2017 269 65 84 0.36 FRIENDSHIP PCS - BLOW PIERCE ES 361 Ward 7 2015 254 72 82 0.38 FRIENDSHIP PCS - BLOW PIERCE ES 361 Ward 7 2016 242 68 116 0.43 FRIENDSHIP PCS - BLOW PIERCE ES 361 Ward 7 2017 241 83 112 0.45 FRIENDSHIP PCS - BLOW-PIERCE MS 362 Ward 7 2015 85 71 16 0.51 FRIENDSHIP PCS - BLOW-PIERCE MS 362 Ward 7 2016 79 130 11 0.64 FRIENDSHIP PCS - BLOW-PIERCE MS 362 Ward 7 2017 107 135 26 0.60
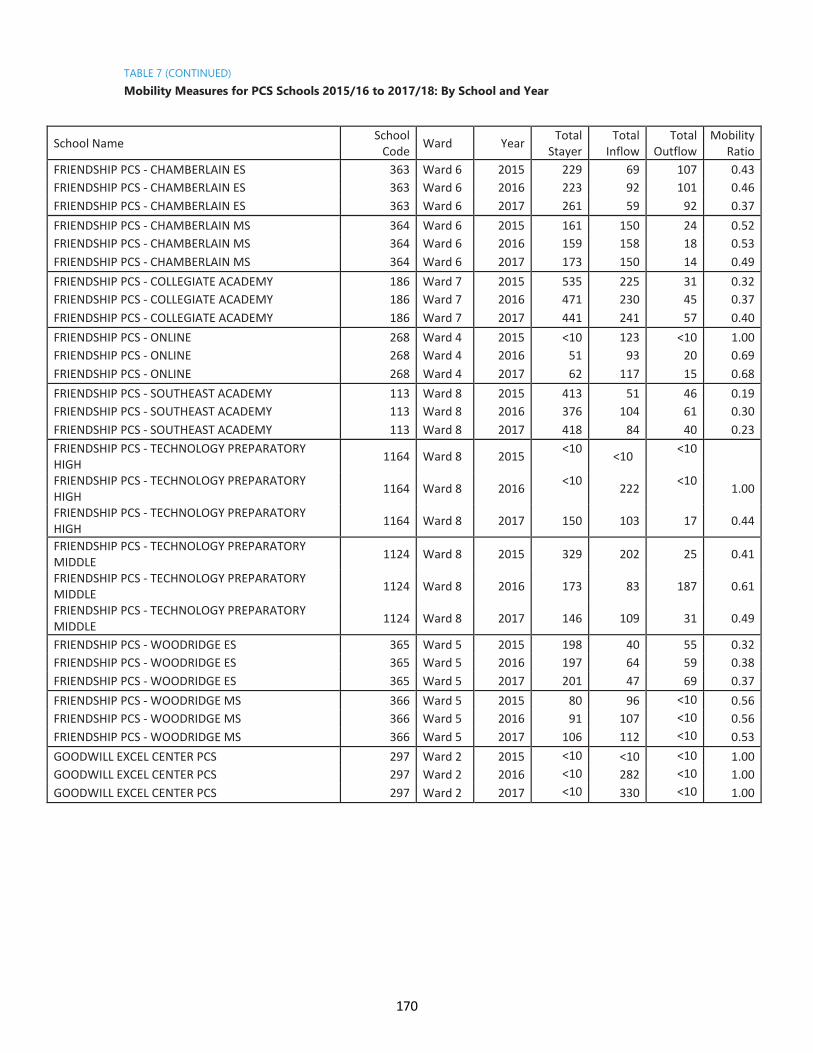
170
Appendix C – Page 51
TABLE 7 (CONTINUED) Mobility Measures for PCS Schools 2015/16 to 2017/18: By School and Year
School Name School Code Ward Year Total
Stayer Total
Inflow Total
Outflow Mobility
Ratio FRIENDSHIP PCS - CHAMBERLAIN ES 363 Ward 6 2015 229 69 107 0.43 FRIENDSHIP PCS - CHAMBERLAIN ES 363 Ward 6 2016 223 92 101 0.46 FRIENDSHIP PCS - CHAMBERLAIN ES 363 Ward 6 2017 261 59 92 0.37 FRIENDSHIP PCS - CHAMBERLAIN MS 364 Ward 6 2015 161 150 24 0.52 FRIENDSHIP PCS - CHAMBERLAIN MS 364 Ward 6 2016 159 158 18 0.53 FRIENDSHIP PCS - CHAMBERLAIN MS 364 Ward 6 2017 173 150 14 0.49 FRIENDSHIP PCS - COLLEGIATE ACADEMY 186 Ward 7 2015 535 225 31 0.32 FRIENDSHIP PCS - COLLEGIATE ACADEMY 186 Ward 7 2016 471 230 45 0.37 FRIENDSHIP PCS - COLLEGIATE ACADEMY 186 Ward 7 2017 441 241 57 0.40 FRIENDSHIP PCS - ONLINE 268 Ward 4 2015 <10 123 <10 1.00 FRIENDSHIP PCS - ONLINE 268 Ward 4 2016 51 93 20 0.69 FRIENDSHIP PCS - ONLINE 268 Ward 4 2017 62 117 15 0.68 FRIENDSHIP PCS - SOUTHEAST ACADEMY 113 Ward 8 2015 413 51 46 0.19 FRIENDSHIP PCS - SOUTHEAST ACADEMY 113 Ward 8 2016 376 104 61 0.30 FRIENDSHIP PCS - SOUTHEAST ACADEMY 113 Ward 8 2017 418 84 40 0.23 FRIENDSHIP PCS - TECHNOLOGY PREPARATORY HIGH 1164 Ward 8 2015 <10 <10 <10
FRIENDSHIP PCS - TECHNOLOGY PREPARATORY HIGH 1164 Ward 8 2016 <10 222 <10 1.00
FRIENDSHIP PCS - TECHNOLOGY PREPARATORY HIGH 1164 Ward 8 2017 150 103 17 0.44
FRIENDSHIP PCS - TECHNOLOGY PREPARATORY MIDDLE 1124 Ward 8 2015 329 202 25 0.41
FRIENDSHIP PCS - TECHNOLOGY PREPARATORY MIDDLE 1124 Ward 8 2016 173 83 187 0.61
FRIENDSHIP PCS - TECHNOLOGY PREPARATORY MIDDLE 1124 Ward 8 2017 146 109 31 0.49
FRIENDSHIP PCS - WOODRIDGE ES 365 Ward 5 2015 198 40 55 0.32 FRIENDSHIP PCS - WOODRIDGE ES 365 Ward 5 2016 197 64 59 0.38 FRIENDSHIP PCS - WOODRIDGE ES 365 Ward 5 2017 201 47 69 0.37 FRIENDSHIP PCS - WOODRIDGE MS 366 Ward 5 2015 80 96 <10 0.56 FRIENDSHIP PCS - WOODRIDGE MS 366 Ward 5 2016 91 107 <10 0.56 FRIENDSHIP PCS - WOODRIDGE MS 366 Ward 5 2017 106 112 <10 0.53 GOODWILL EXCEL CENTER PCS 297 Ward 2 2015 <10 <10 <10 1.00 GOODWILL EXCEL CENTER PCS 297 Ward 2 2016 <10 282 <10 1.00 GOODWILL EXCEL CENTER PCS 297 Ward 2 2017 <10 330 <10 1.00

171
Appendix C – Page 52
TABLE 7 (CONTINUED) Mobility Measures for PCS Schools 2015/16 to 2017/18: By School and Year
School Name School Code Ward Year Total Stayer
Total Inflow
Total Outflow
Mobility Ratio
HARMONY DC PCS-SCHOOL OF EXCELLENCE 245 Ward 5 2015 36 66 16 0.69 HARMONY DC PCS-SCHOOL OF EXCELLENCE 245 Ward 5 2016 57 39 29 0.54 HARMONY DC PCS-SCHOOL OF EXCELLENCE 245 Ward 5 2017 40 54 33 0.69 HOPE COMMUNITY PCS - LAMOND 131 Ward 4 2015 188 82 83 0.47 HOPE COMMUNITY PCS - LAMOND 131 Ward 4 2016 205 59 59 0.37 HOPE COMMUNITY PCS - LAMOND 131 Ward 4 2017 187 61 58 0.39 HOPE COMMUNITY PCS - TOLSON 114 Ward 5 2015 352 125 28 0.30 HOPE COMMUNITY PCS - TOLSON 114 Ward 5 2016 367 122 36 0.30 HOPE COMMUNITY PCS - TOLSON 114 Ward 5 2017 340 101 88 0.36 HOWARD UNIVERSITY MIDDLE SCHOOL OF MATHEMATICS AND SCIENCE PCS 115 Ward 1 2015 114 139 47 0.62
HOWARD UNIVERSITY MIDDLE SCHOOL OF MATHEMATICS AND SCIENCE PCS 115 Ward 1 2016 149 128 19 0.50
HOWARD UNIVERSITY MIDDLE SCHOOL OF MATHEMATICS AND SCIENCE PCS 115 Ward 1 2017 166 112 30 0.46
IDEA PCS 163 Ward 7 2015 98 114 10 0.56 IDEA PCS 163 Ward 7 2016 121 105 25 0.52 IDEA PCS 163 Ward 7 2017 151 155 12 0.53 IDEAL ACADEMY PCS 134 Ward 4 2015 160 88 44 0.45 IDEAL ACADEMY PCS 134 Ward 4 2016 122 150 52 0.62 IDEAL ACADEMY PCS 134 Ward 4 2017 149 118 35 0.51 INGENUITY PREP PCS 200 Ward 8 2015 132 76 23 0.43 INGENUITY PREP PCS 200 Ward 8 2016 209 100 37 0.40 INGENUITY PREP PCS 200 Ward 8 2017 284 137 51 0.40 INSPIRED TEACHING DEMONSTRATION PCS 3064 Ward 5 2015 242 76 26 0.30 INSPIRED TEACHING DEMONSTRATION PCS 3064 Ward 5 2016 304 66 21 0.22 INSPIRED TEACHING DEMONSTRATION PCS 3064 Ward 5 2017 336 67 23 0.21 KINGSMAN ACADEMY PCS 267 Ward 6 2015 <10 163 <10 0.99 KINGSMAN ACADEMY PCS 267 Ward 6 2016 68 77 13 0.57 KINGSMAN ACADEMY PCS 267 Ward 6 2017 82 152 18 0.67 KIPP DC PCS AIM ACADEMY 116 Ward 8 2015 139 193 22 0.61 KIPP DC PCS AIM ACADEMY 116 Ward 8 2016 137 235 14 0.65 KIPP DC PCS AIM ACADEMY 116 Ward 8 2017 149 229 21 0.63 KIPP DC PCS ARTS & TECHNOLOGY ACADEMY 236 Ward 7 2015 106 39 84 0.54 KIPP DC PCS ARTS & TECHNOLOGY ACADEMY 236 Ward 7 2016 119 49 95 0.55 KIPP DC PCS ARTS & TECHNOLOGY ACADEMY 236 Ward 7 2017 163 55 98 0.48

172
Appendix C – Page 53
TABLE 7 (CONTINUED) Mobility Measures for PCS Schools 2015/16 to 2017/18: By School and Year
School Name School Code Ward Year Total
Stayer Total
Inflow Total
Outflow Mobility
Ratio KIPP DC PCS COLLEGE PREP ACADEMY 1123 Ward 5 2015 254 174 17 0.43 KIPP DC PCS COLLEGE PREP ACADEMY 1123 Ward 5 2016 321 251 27 0.46 KIPP DC PCS COLLEGE PREP ACADEMY 1123 Ward 5 2017 430 283 43 0.43 KIPP DC PCS CONNECT ACADEMY 209 Ward 5 2015 173 34 112 0.46 KIPP DC PCS CONNECT ACADEMY 209 Ward 5 2016 183 31 115 0.44 KIPP DC PCS CONNECT ACADEMY 209 Ward 5 2017 183 32 125 0.46 KIPP DC PCS DISCOVER ACADEMY 1122 Ward 8 2015 182 57 130 0.51 KIPP DC PCS DISCOVER ACADEMY 1122 Ward 8 2016 192 50 130 0.48 KIPP DC PCS DISCOVER ACADEMY 1122 Ward 8 2017 195 49 152 0.51 KIPP DC PCS GROW ACADEMY 1129 Ward 6 2015 175 30 115 0.45 KIPP DC PCS GROW ACADEMY 1129 Ward 6 2016 193 27 112 0.42 KIPP DC PCS GROW ACADEMY 1129 Ward 6 2017 165 48 147 0.54 KIPP DC PCS HEIGHTS ACADEMY 3071 Ward 8 2015 281 132 102 0.45 KIPP DC PCS HEIGHTS ACADEMY 3071 Ward 8 2016 289 147 116 0.48 KIPP DC PCS HEIGHTS ACADEMY 3071 Ward 8 2017 304 157 121 0.48 KIPP DC PCS KEY ACADEMY 189 Ward 7 2015 141 195 17 0.60 KIPP DC PCS KEY ACADEMY 189 Ward 7 2016 157 174 <10 0.53 KIPP DC PCS KEY ACADEMY 189 Ward 7 2017 140 198 14 0.60 KIPP DC PCS LEAD ACADEMY 190 Ward 6 2015 268 153 18 0.39 KIPP DC PCS LEAD ACADEMY 190 Ward 6 2016 283 134 125 0.48 KIPP DC PCS LEAD ACADEMY 190 Ward 6 2017 269 136 122 0.49 KIPP DC PCS LEAP ACADEMY 132 Ward 7 2015 89 <10 181 0.68 KIPP DC PCS LEAP ACADEMY 132 Ward 7 2016 93 <10 111 0.55 KIPP DC PCS LEAP ACADEMY 132 Ward 7 2017 95 <10 92 0.50 KIPP DC PCS NORTHEAST ACADEMY 242 Ward 5 2015 57 172 <10 0.76 KIPP DC PCS NORTHEAST ACADEMY 242 Ward 5 2016 149 177 11 0.56 KIPP DC PCS NORTHEAST ACADEMY 242 Ward 5 2017 154 176 <10 0.55 KIPP DC PCS PROMISE ACADEMY 1121 Ward 7 2015 273 232 106 0.55 KIPP DC PCS PROMISE ACADEMY 1121 Ward 7 2016 365 155 124 0.43 KIPP DC PCS PROMISE ACADEMY 1121 Ward 7 2017 373 147 121 0.42 KIPP DC PCS QUEST ACADEMY 237 Ward 7 2015 150 168 73 0.62 KIPP DC PCS QUEST ACADEMY 237 Ward 7 2016 195 169 97 0.58 KIPP DC PCS QUEST ACADEMY 237 Ward 7 2017 216 175 127 0.58

173
Appendix C – Page 54
TABLE 7 (CONTINUED) Mobility Measures for PCS Schools 2015/16 to 2017/18: By School and Year
School Name School Code Ward Year Total
Stayer Total
Inflow Total
Outflow Mobility
Ratio KIPP DC PCS SPRING ACADEMY 214 Ward 5 2015 89 119 <10 0.58 KIPP DC PCS SPRING ACADEMY 214 Ward 5 2016 184 146 15 0.47 KIPP DC PCS SPRING ACADEMY 214 Ward 5 2017 262 148 <10 0.43 KIPP DC PCS VALOR ACADEMY 243 Ward 7 2015 <10 119 <10 1.00 KIPP DC PCS VALOR ACADEMY 243 Ward 7 2016 38 184 <10 0.83 KIPP DC PCS VALOR ACADEMY 243 Ward 7 2017 99 208 20 0.70 KIPP DC PCS WILL ACADEMY 121 Ward 6 2015 169 129 19 0.47 KIPP DC PCS WILL ACADEMY 121 Ward 6 2016 139 208 14 0.61 KIPP DC PCS WILL ACADEMY 121 Ward 6 2017 124 197 30 0.65 LATIN AMERICAN MONTESSORI BILINGUAL PCS 193 Ward 4 2015 298 11 12 0.07 LATIN AMERICAN MONTESSORI BILINGUAL PCS 193 Ward 4 2016 316 29 <10 0.10 LATIN AMERICAN MONTESSORI BILINGUAL PCS 193 Ward 4 2017 368 11 12 0.06 LAYC CAREER ACADEMY PCS 104 Ward 1 2015 <10 68 <10 1.00 LAYC CAREER ACADEMY PCS 104 Ward 1 2016 14 59 <10 0.81 LAYC CAREER ACADEMY PCS 104 Ward 1 2017 <10 <10 <10 1.00 LEE MONTESSORI PCS 228 Ward 5 2015 46 16 11 0.37 LEE MONTESSORI PCS 228 Ward 5 2016 74 20 15 0.32 LEE MONTESSORI PCS 228 Ward 5 2017 115 18 17 0.23 MARY MCLEOD BETHUNE PCS 135 Ward 5 2015 250 100 43 0.36 MARY MCLEOD BETHUNE PCS 135 Ward 5 2016 261 79 52 0.33 MARY MCLEOD BETHUNE PCS 135 Ward 5 2017 272 101 36 0.33 MAYA ANGELOU PCS - HS 101 Ward 7 2015 50 24 10 0.40 MAYA ANGELOU PCS - HS 101 Ward 7 2016 55 92 10 0.65 MAYA ANGELOU PCS - HS 101 Ward 7 2017 54 107 14 0.69

174
Appendix C – Page 55
TABLE 7 (CONTINUED) Mobility Measures for PCS Schools 2015/16 to 2017/18: By School and Year
School Name School Code Ward Year Total
Stayer Total
Inflow Total
Outflow Mobility
Ratio MERIDIAN PCS 165 Ward 1 2015 425 205 69 0.39 MERIDIAN PCS 165 Ward 1 2016 464 151 96 0.35 MERIDIAN PCS 165 Ward 1 2017 432 145 93 0.36 MONUMENT ACADEMY PCS 260 Ward 6 2015 <10 34 <10 1.00 MONUMENT ACADEMY PCS 260 Ward 6 2016 <10 70 <10 1.00 MONUMENT ACADEMY PCS 260 Ward 6 2017 46 70 <10 0.62 MUNDO VERDE BILINGUAL PCS 3065 Ward 5 2015 366 115 10 0.25 MUNDO VERDE BILINGUAL PCS 3065 Ward 5 2016 486 39 31 0.13 MUNDO VERDE BILINGUAL PCS 3065 Ward 5 2017 445 98 25 0.22 NATIONAL COLLEGIATE PREPARATORY PCHS 1120 Ward 8 2015 161 90 18 0.40 NATIONAL COLLEGIATE PREPARATORY PCHS 1120 Ward 8 2016 124 115 34 0.55 NATIONAL COLLEGIATE PREPARATORY PCHS 1120 Ward 8 2017 146 131 25 0.52 PAUL PCS - INTERNATIONAL HS 222 Ward 4 2015 234 150 18 0.42 PAUL PCS - INTERNATIONAL HS 222 Ward 4 2016 258 193 26 0.46 PAUL PCS - INTERNATIONAL HS 222 Ward 4 2017 301 179 37 0.42 PAUL PCS - MS 170 Ward 4 2015 139 80 28 0.44 PAUL PCS - MS 170 Ward 4 2016 105 130 <10 0.57 PAUL PCS - MS 170 Ward 4 2017 107 121 20 0.57 PERRY STREET PREPARATORY PCS 161 Ward 5 2015 177 102 160 0.60 PERRY STREET PREPARATORY PCS 161 Ward 5 2016 161 120 61 0.53 PERRY STREET PREPARATORY PCS 161 Ward 5 2017 220 80 37 0.35 RICHARD WRIGHT PCS FOR JOURNALISM AND MEDIA ARTS 3067 Ward 6 2015 151 103 <10 0.43
RICHARD WRIGHT PCS FOR JOURNALISM AND MEDIA ARTS 3067 Ward 6 2016 156 115 21 0.47
RICHARD WRIGHT PCS FOR JOURNALISM AND MEDIA ARTS 3067 Ward 6 2017 182 100 16 0.39
ROCKETSHIP DC PCS 286 Ward 8 2015 <10 <10 <10 ROCKETSHIP DC PCS 286 Ward 8 2016 <10 343 <10 1.00 ROCKETSHIP DC PCS 286 Ward 8 2017 297 145 85 0.44 ROOTS PCS 173 Ward 4 2015 42 37 13 0.54 ROOTS PCS 173 Ward 4 2016 45 43 23 0.59 ROOTS PCS 173 Ward 4 2017 83 16 11 0.25

175
Appendix C – Page 56
TABLE 7 (CONTINUED) Mobility Measures for PCS Schools 2015/16 to 2017/18: By School and Year
School Name School Code Ward Year Total
Stayer Total
Inflow Total
Outflow Mobility
Ratio SEED PCS 174 Ward 7 2015 220 118 21 0.39 SEED PCS 174 Ward 7 2016 205 142 21 0.44 SEED PCS 174 Ward 7 2017 209 154 44 0.49 SELA PCS 197 Ward 4 2015 52 43 18 0.54 SELA PCS 197 Ward 4 2016 98 38 16 0.36 SELA PCS 197 Ward 4 2017 135 28 15 0.24 SHINING STARS MONTESSORI ACADEMY PCS 3066 Ward 5 2015 48 56 12 0.59 SHINING STARS MONTESSORI ACADEMY PCS 3066 Ward 5 2016 106 50 34 0.44 SHINING STARS MONTESSORI ACADEMY PCS 3066 Ward 5 2017 148 61 30 0.38 SOMERSET PREPARATORY ACADEMY PCS 187 Ward 8 2015 108 157 37 0.64 SOMERSET PREPARATORY ACADEMY PCS 187 Ward 8 2016 158 155 22 0.53 SOMERSET PREPARATORY ACADEMY PCS 187 Ward 8 2017 196 179 32 0.52 ST. COLETTA SPECIAL EDUCATION PCS 1047 Ward 7 2015 <10 248 <10 1.00 ST. COLETTA SPECIAL EDUCATION PCS 1047 Ward 7 2016 130 45 <10 0.26 ST. COLETTA SPECIAL EDUCATION PCS 1047 Ward 7 2017 123 52 <10 0.32 THE CHILDREN'S GUILD DC PCS 255 Ward 5 2015 <10 313 <10 1.00 THE CHILDREN'S GUILD DC PCS 255 Ward 5 2016 122 215 89 0.71 THE CHILDREN'S GUILD DC PCS 255 Ward 5 2017 203 172 59 0.53 THE NEXT STEP EL PROXIMO PASO PCS 168 Ward 1 2015 <10 <10 <10 THE NEXT STEP EL PROXIMO PASO PCS 168 Ward 1 2016 <10 <10 <10 THE NEXT STEP EL PROXIMO PASO PCS 168 Ward 1 2017 <10 <10 <10 THURGOOD MARSHALL ACADEMY PCS 191 Ward 8 2015 189 123 18 0.43 THURGOOD MARSHALL ACADEMY PCS 191 Ward 8 2016 211 125 26 0.42 THURGOOD MARSHALL ACADEMY PCS 191 Ward 8 2017 218 165 29 0.47 TWO RIVERS PCS-4TH STREET 198 Ward 6 2015 383 102 23 0.25 TWO RIVERS PCS-4TH STREET 198 Ward 6 2016 368 118 34 0.29 TWO RIVERS PCS-4TH STREET 198 Ward 6 2017 378 114 32 0.28 TWO RIVERS PCS-YOUNG 270 Ward 5 2015 <10 128 <10 1.00 TWO RIVERS PCS-YOUNG 270 Ward 5 2016 141 44 15 0.30 TWO RIVERS PCS-YOUNG 270 Ward 5 2017 192 54 17 0.27

176
Appendix C – Page 57
TABLE 7 (CONTINUED) Mobility Measures for PCS Schools 2015/16 to 2017/18: By School and Year
School Name School Code Ward Year Total
Stayer Total
Inflow Total
Outflow Mobility
Ratio WASHINGTON GLOBAL PCS 263 Ward 6 2015 <10 97 <10 1.00 WASHINGTON GLOBAL PCS 263 Ward 6 2016 82 90 12 0.55 WASHINGTON GLOBAL PCS 263 Ward 6 2017 84 112 24 0.62 WASHINGTON LATIN PCS - HIGH SCHOOL 1118 Ward 4 2015 221 84 <10 0.28 WASHINGTON LATIN PCS - HIGH SCHOOL 1118 Ward 4 2016 237 93 <10 0.29 WASHINGTON LATIN PCS - HIGH SCHOOL 1118 Ward 4 2017 239 92 <10 0.29 WASHINGTON LATIN PCS - MS 125 Ward 4 2015 168 186 <10 0.53 WASHINGTON LATIN PCS - MS 125 Ward 4 2016 171 188 <10 0.53 WASHINGTON LATIN PCS - MS 125 Ward 4 2017 177 190 <10 0.52 WASHINGTON LEADERSHIP ACADEMY 283 Ward 5 2015 <10 <10 <10 WASHINGTON LEADERSHIP ACADEMY 283 Ward 5 2016 <10 100 <10 1.00 WASHINGTON LEADERSHIP ACADEMY 283 Ward 5 2017 89 115 <10 0.57 WASHINGTON MATHEMATICS SCIENCE TECHNOLOGY PCHS 178 Ward 5 2015 163 113 17 0.44
WASHINGTON MATHEMATICS SCIENCE TECHNOLOGY PCHS 178 Ward 5 2016 165 115 26 0.46
WASHINGTON MATHEMATICS SCIENCE TECHNOLOGY PCHS 178 Ward 5 2017 147 81 38 0.45
WASHINGTON YU YING PCS 1117 Ward 5 2015 442 52 <10 0.12 WASHINGTON YU YING PCS 1117 Ward 5 2016 484 35 <10 0.08 WASHINGTON YU YING PCS 1117 Ward 5 2017 502 29 <10 0.06

About ODCAThe mission of the Office of the District of Columbia Auditor (ODCA) is to support the Council of the District of Columbia by making sound recommendations that improve the effectiveness, efficiency, and accountability of the District government.
To fulfill our mission, we conduct performance audits, non-audit reviews, and revenue certifications. The residents of the District of Columbia are one of our primary customers and we strive to keep the residents of the District of Columbia informed on how their government is operating and how their tax money is being spent.
Office of the District of Columbia Auditor717 14th Street N.W.Suite 900Washington, DC 20005
Call us: 202-727-3600Email us: [email protected] us: https://twitter.com/ODCA_DCVisit us: www.dcauditor.org
Information presented here is the intellectual property of the Office of the District of Columbia Auditor and is
copyright protected. We invite the sharing of this report, but ask that you credit ODCA with authorship when any
information, findings, or recommendations are used. Thank you.

www.dcauditor.org