Embed Size (px)
Citation preview

Vol. 7(15), pp. 1238-1249, 21 April, 2013
DOI: 10.5897/AJBM10.286
ISSN 1993-8233 © 2013 Academic Journals
http://www.academicjournals.org/AJBM
African Journal of Business Management
Full Length Research Paper
A study of cost efficiency of Indian commercial banks- An impact of mergers
Pardeep Kaur and Gian Kaur
Punjab School of Economics, Guru Nanak Dev University, Amritsar-143005, Punjab, India.
Accepted 15 November, 2010
This paper investigates the cost efficiency of Indian public and private sector banks over the period 1990-2008 with unbalanced panel data by employing non-parametric data envelopment analysis technique (DEA). In this paper, an attempt is also made to examine the determinants of cost efficiency of banks by employing panel data least square regression model. The study found that private sector banks are more efficient than public sector banks with average cost efficiency score 73.4 for public sector banks as of 76.3 for the private sector banks in the country. The findings of this study suggest that the dominant source of cost inefficiency among Indian commercial banks is allocative efficiency rather than technical inefficiency. The study has examined the impact of merger activity on the cost efficiency of Indian banks by employing OLS model and found the positive and significant impact of merger activity on efficiency. Among other factors associated positively and significantly with the efficiency are the size and profitability of banks and suggesting that banks with higher ROA exhibits higher efficiency scores. Key words: Efficiency, DEA, profitability, banks, regression, mergers.
INTRODUCTION Over the last few decades, banking sector in India has experienced fundamental changes following banks and other financial institutions reforms starting in the early 1990‟s. The Indian banking sector has witnessed the reforms in order to enhance the efficiency and pro-ductivity of the banks. The financial sector reforms have strengthened the fundamentals of the Indian economy and transformed the environment in which banks operates. India embarked on a strategy of economic reforms in the wake of a serious balance of payment crisis in 1991 (Mohan, 2006). In Indian banking sector, the policy makers adopted a cautious approach for introducing reform measures on the recommendation of Narishmam Committee I (1991), Narishmam Committee II (1997) and Verma Committee (1999). The main objective of the banking sector reforms was to improve the efficiency of banks and to promote a diversified and
competitive financial system. One of the outcomes of such reforms was the conso-
lidation of the banking industry through mergers and acquisitions. Technological progress and financial dere-gulation have played an important role in accelerating the process of merger and acquisition in Indian banking industry. Due to technological progress, the scale at which financial services and products are produced has expanded which provide an opportunity for the banks to increase their size and scale of production. At that, time mergers of banking institutions emerged as an important strategy for growing the size of banks. Size of the bank plays a significant role to enter the global financial market.
Merger can be defined as a means of unification of two players into single entity. Merger is a process of combining two business entities under the common
*Corresponding author. E-mail: [email protected].
JEL Classification: G21, G2.

ownership.
The Indian banking sector consists of the Reserve Bank of India, which is the central bank, commercial banks and co-operative banks. Commercial banks in India play dominate role in the Indian economy and accounted for 90% of the total assets of banking system. Commercial banks in India can be sub-divided into two major categories - scheduled banks, which are subject to statutory requirement, and non-scheduled banks, which are not. As on March 2009, commercial banks in India consisted of 162 scheduled commercial banks, comprised 84 Regional Rural Banks (RRBs), 27 Public sector banks (PSBs), includes 20 nationalized banks and State Bank of India and its 6 subsidiaries (after merger of State Bank of Saurashtra with State Bank of India w.e.f August, 2008).
The main objective of this paper is to examine the efficiency of Indian public and private sector banks and to study the impact of mergers on the cost efficiency of participating banks. It has been well studied in the literature of determinants of bank efficiency that the merger is not only the factor that could explain some of the differences in efficiency scores. Therefore, other environmental and bank specific factors have been considered to examine the differences in efficiency across banks. The efficiency of banks between 1990-2008 is examined using the non-parametric DEA approach. The determinants of Indian banks efficiency scores are evaluated by using the regression analysis. MERGERS IN INDIAN BANKING SECTOR
Mergers and acquisitions in Indian banking sector have initiated through the recommendations of Narasimham committee II in 1998, when its report recommended a drastic reduction in the number of public sector unit banks from the set of 27. The committee recommended that merger between strong banks/ financial institutions would make for greater economic and commercial sense and would be a case where the whole is greater than the sum of its parts and have a “force multiplier effect”. (Narasimham committee II, chapter, para 5.13 -5.15).
Mergers come with several benefits such as creation of synergies, economics of scale, cost reduction, and quickly acquire new technologies, skills, markets, and resources. There are several reasons for mergers the primary ones are deregulation and technology. Deregulation has given banks opportunities to explore new business markets and mergers seem an attractive route to them. Technology has helped rationalize costs and delivery channels. Therefore, technology and deregulation have been considered as the drivers for bank mergers. Table 1 clearly depicted that 21 M/As took place during post reform period with as many as 17 mergers taking place during 1999. Therefore, the pace of mergers gathered momentum during 1999, leading to a marked decline in the number of private and foreign banks. Recently, the
Kaur and Kaur 1239 Reserve Bank of India under section 45 of the banking regulation Act, 1949 in case of some troubled banks suggested the compulsory merger with stronger banks. These included the merger of Global Trust Bank with Oriental Bank of Commerce in August 2004, Ganesh Bank of Kurndwad Ltd. with Federal Bank Ltd. in September 2006 and the merger of United Western Bank with IDBI Ltd. in October 2006. LITERATURE REVIEW Review of studies on efficiency of banks
Berger and Humphrey (1997) in their study provide an extensive review of studies on the efficiency of banking sector. They pointed out that, majority of studies focused on the banking markets of well-developed countries with particular emphasis on the US market.
Bhattacharyya et al. (1997) used DEA to measure the productive efficiency of 70 Indian commercial banks in the period 1986-1991. They found that the public sector banks are the most efficient banks as compared to foreign banks and private banks. They also found a temporal decline in the performance of public sector banks.
Das (1997) used the cross-section data and DEA to examine the efficiency of 65 major banks for the year 1995. He found that Indian banks were more technically efficient than allocatively efficient.
Mukherjee et al. (2002) examined the technical efficiency of 68 Indian commercial banks for the period 1996-1999 and found that public sector banks are more efficient than both private and foreign banks.
Ram and Ray (2004) also found that public sector banks performed better than private sector banks but not differently from foreign banks. All these studies have compared the efficiency of public, private, and foreign banks by using a common frontier and such comparisons are not justified on the ground that public, private, and foreign banks are operated under different legal and regulatory frameworks.
Chen (2004) conducted a study to examine the efficiency difference between Taiwan‟s publicly, private owned banks, and the impact of the Asian financial crisis on the efficiency of Taiwan banking sector. He used data envelopment analysis and panel data ranging from 1994 to 2004 on 44 banks to measure cost, allocative and technical efficiency of Taiwan‟s banks. He employed intermediation approach and conducted sensitivity analysis to determine the appropriate inputs and outputs. He found that Asian financial crisis has depreciated cost, allocative and technical efficiency in Taiwanese banks and suggested that banks rate of return and bank loans on bad loans are major reason for this.
Ariff and Can (2008) attempted to investigate the cost and profit efficiency of Chinese commercial banks over the period from 1995 to 2004. They used non-parametric

1240 Afr. J. Bus. Manage.
Table 1. Banks merged in India since liberalization.
Merger
Year Acquirer Bank Target Bank Motive of merger Type of merger
1993 Punjab National Bank New Bank of India Restructuring of weak bank Forced merger
1993 Bank of India Bank of Karad Ltd. Restructuring of weak bank Forced merger
1995 State Bank of India Kashinath Seth Bank Restructuring of weak bank Forced merger
1997 Oriental Bank of Commerce Punjab Co-operative Bank Ltd. Restructuring of weak bank Forced merger
1997 Oriental Bank of Commerce Bari Doab Bank Ltd. Restructuring of weak bank Forced merger
1999 Union Bank of India Sikkim Bank Ltd. Restructuring of weak bank Forced merger
2000 HDFC Bank Ltd. Times Bank To achieve scale and scope economies Voluntary merger
2001 ICICI Bank Bank of Madura To achieve scale and scope economies Voluntary merger
2002 ICICI Bank ICICI Limited To achieve the objective of universal banking Voluntary merger
2002 Bank of Baroda Benaras State Bank Ltd. Restructuring of weak bank Forced merger
2003 Punjab National Bank Nedungadi Bank Ltd. Restructuring of weak bank Forced merger
2004 Bank of Baroda South Gujarat Local Area Bank Restructuring of weak bank Forced merger
2004 Oriental Bank of Commerce Global Trust Bank Restructuring of weak bank Forced merger
2005 Centurion Bank Bank of Punjab To achieve scale and scope economies Voluntary merger
2006 Federal Bank Ganesh Bank of Kurandwad Restructuring of weak bank Forced merger
2006 IDBI Bank United western Bank Restructuring of weak bank Forced merger
2006 Centurion Bank of Punjab Lord Krishna Bank Expansion of size Voluntary merger
2007 ICICI Bank Sangli Bank Expansion of size Voluntary merger
2007 Indian Overseas Bank Bharat overseas Bank Restructuring of weak bank Compulsory merger
2008 HDFC Bank Centurion Bank of Punjab Expansion of size and benefits of scope economics Voluntary merger
Source: Compiled from Report on Trend and Progress of Banking in India, RBI, various issues.
data envelopment analysis technique to obtain the cost efficiency and profit efficiency of banks. The study is based on unbalanced panel data of 28 Chinese banks, totaling 230 observations. They also used Tobit regression analysis to study the influence of ownership type, profile, profitability, and key environmental changes on the efficiency of china‟s banks. Tobit regression analysis suggests that banks that are more profitable tend to be more efficient. The relationship between non-interest income to total income and efficiency also turned out to be significant.
Burki and Niazi (2006) studied the impact of financial reforms on banking efficiency of state-owned, private, and foreign banks in Pakistan. They employed DEA to measure efficiency of banks and used time series cross-section data of 40 commercial banks from 1991 to 2000. The researchers also applied maximum likelihood Tobit regression analysis to identify the determinants of banking efficiency in Pakistan. The results from Tobit regression analysis suggest a positive association between bank size and cost efficiency whereas the size is not significantly associated with the allocative efficiency of banks.
Sathye (2003) used DEA to evaluate the productive efficiency of Indian banks for the period 1997-1998. He used two DEA models to calculate the efficiency scores of public, private, and foreign sector banks. He found that efficiency scores of public and private owned banks were lower as compared to the public sector and foreign sector
banks. Ataullah et al. (2004) employed DEA to make a com-
parative analysis of commercial banks in India and Pakistan during the period 1988-1998. For efficiency measurement, they employed two input-output specifi-cations. The results indicated the presence of space for improvement in the efficiency of banks in these countries. Merger and bank efficiency The substantial merger wave that affected the banking industries of many countries has spurred large literature on the effects of mergers on the efficiency and bank performance. In particular, some studies support the view that consolidation via merger is beneficial because more efficient bank mergers substitute less efficient ones .Greater bank size can yield economies of scale and scope, increase diversification, opportunities and greater cost savings (Berger et al., 1999).
The available empirical evidence on the effects of bank mergers is mixed. Most studies focus on the effects in terms of bank performance measures, few studies address the impact on customers‟s welfare by examining the effects on prices (Bonasccorsi and Hardy, 2005).
The cost efficiency effects of such mergers have been particularly well studied. Studies on Italian banks (Resti, 1998) confirm economics of scale in the case of M/As

among domestic small banks.
Vennet (1996) studied the impact of mergers on the efficiency of European Union banking industry by using some key financial ratios and stochastic frontier analysis for the period 1988-1993 and found that merger improves the efficiency of participating banks. Akhavein et al. (1997) examined the price and efficiency effects of mega mergers on US banking industry and found that after merger banks have experienced higher level of profit efficiency than before merger. Berger and Humphrey (1998) found very little improvement in efficiency for merger and acquisition of either large or small banks. Rhoades (1998) attempted to summarize nine case studies by nine authors, on the efficiency effects of bank mergers. The findings indicated that four out of nine case studies have shown mergers successful in improving efficiency of banks in majority of cases and the acquiring banks were more efficient than their peer group. Peng and Wang (2004) studied the cost efficiency and the effect of mergers on Taiwanese banking sector, by using the panel data from 1997 to 1999. He found a statistically significant relationship between merger and cost efficiency and significant efficiency differences between merged and non-merged banks.
Gourlay et al. (2006) analyzed the efficiency gains from mergers among Indian banks over the period 1991-1992 to 2004-2005 and observed that the merger led to improvement of efficiency for the merging banks. RBI (2008) also drives the same conclusions and found that public sector banks have been able to get higher level of efficiency than private sector banks during post merger period. Wu (2006) in his study for the Australian banks for the period 1983-2001 observed that post merger efficiency of banks is not closely related with pre-merger efficiency rather it has also been affected by other pre and post-merger factors of banks. Wu (2008) examined the X-efficiency gains from mergers and acquisitions among the 34 listed commercial banks in Taiwan. He found that banks were not experiencing any efficiency gains from mergers due to the fact that efficiency gains might emerge more than three years after the merger completion and losses from bad loans may erode the efficiency gains from mergers and acquisitions.
METHODOLOGY
There are diverse ways to measure the efficiency of banks but
researchers and analysts do not agree upon a single method of measuring the efficiency of DMU‟s. Berger and Humphrey (1997) provide an extensive account of 130 studies that applied different frontier efficiency analysis for 21 countries. Two approaches are frequently used for the estimation of bank efficiency, in the literature of banking efficiency. These are parametric and non-parametric approaches. Parametric approaches include Stochastic Frontier Analysis and Thick Frontier Approach. Among all parametric approaches, SFA (Stochastic Frontier Analysis), also sometimes referred to as econometric approach is widely used to measure the efficiency of DMU‟s. SFA specifies a functional from profit, cost and production relationship among inputs, outputs, and environmental
Kaur and Kaur 1241 factors and allows for random error. The SFA assumes a composed error model where inefficiencies are assumed to follow an asymmetric distribution, usually the half normal are exponential distribution, usually the standard normal (Ferrier and Lovell, 1990; Lang and Welzel, 1999).
Contrary to parametric approach, non-parametric approach requires few assumptions about the estimated frontier and does not assume a specific functional from to represent the cost and production functions. Among, a non-parametric approach, DEA is used extensively to estimate the efficiency of DMU's. DEA is a mathematical, linear programming based approach. To measure the efficiency of DMU‟s under input orientation and constant return to scale, Charnes et al. (1978) first proposed it and this model is
known as CCR model. DEA is based on a concept of efficiency very similar to the microeconomic one; the main difference is that the DEA production frontier is not determined by some functional form, but it is generated from the actual data for the evaluated firms (Casu and Philip, 2003). Later, Banker et al. (1984) extended CCR model to allow variable return to scale. The CRS assumption of DEA is suitable only when all DMU‟s are operating at an optimal scale. However, in practical situation many factors like imperfect competition, regulatory and legal framework put constraints on
DMU‟ s not to be operating at optimal scale. As a result, the use of CRS when some DMU are not operating at optimal scale will result in measures of technical efficiency, which are confounded by scale efficiencies (Philip, 1999). Data envelopment analysis is a mathe-matical programming approach for characterizing the relationship among multiple inputs and outputs and has been a proven way to measure bank performance (Charnes et al., 1990; Seiford and Zhu, 1999).
Data envelopment analysis
DEA computes the efficiency of banks on the basis of estimated piece-wise linear frontier made up by a set of efficient banks. The banks that lie on the frontier are treated as best practice banks and obtain efficiency score equal to one whereas the banks that do not lie on the frontier are relatively inefficient and their efficiency score
lie in the range of zero and one. The DEA approach decomposed the CE into its two different components, TE (technical efficiency) and AE (allocative efficiency). Technical efficiency reflects the ability of a firm to maximize output from a given set of inputs whereas alloacitve efficiency reflects the ability of the firm to use these inputs in optimal proportions, given their respective prices where the cost of production is minimum. Technical efficiency implies that there is no waste in using inputs to produce specific quantity of output. A firm is said to be technically efficient when it cannot increase any output or decrease any input without reducing the quantities of other outputs or inputs. Combing these two measures provides a measure of cost efficiency. A firm is said to be cost efficient when it is both alloactively as well as technically efficient.
Following Farell et al. (1957), this paper has used the input price vector to specify and obtain a measure of cost efficiency (CE) for each bank by solving this envelopment form of linear programming
problem: Mini wixi* subject to:
0 kgokig yy
xigo*-0 igg x

1242 Afr. J. Bus. Manage.
0 Where wi = vector of input prices for ith bank
yi = vector of output levels for ith bank
*ix = cost minimizing vector of input quantities
= n×1vector of constants Thus, the cost efficiency of any given bank is obtained as the ratio of minimum cost to the observed cost written as follows:
CE =
*i i
i i
w x
w x On the other hand, allocative efficiency is the ratio of cost efficiency
to technical efficiency, thus AE = TE
CE
. This procedure of cost efficiency includes any slacks into allocative efficiency because the slacks reflect sub optimal input mix (Ferrier and Lovell, 1990). Measuring technical efficiency
The technical efficiency is obtained by using the following input oriented DEA model.
MaxZ0 =
z
i
ikok
n
i
kgok
xv
y
1
1
subject to:
1
1
1
z
i
igi
h
k
kgik
xv
y
where
k , vi =
, g = 1,2,...,n, k= 1,2,.....,h, i=1,2,......,z uk , vi = weights given to output k and input i . ykg = quantity of output k achieved by DMU g xig = quantity of input i used by DMU g n = number of DMUs h = number of outputs z = number of inputs
= a non-Archimedean (infinitesimal) constant One of the distinct feature of these models is that the weights uk, vr are positive and unknown. The values of u and v are found in such a way that the efficiency of g
th DMU is maximized. This model is in
a ratio form and one of the key problems related with the ratio form
is that it has an infinite number of solutions. The above fractional form can be transformed in a straight forward way into the following liner programs.
CCR efficiency measure (linear form)
MaxZ0 =
n
i
kgok y1
subject to:
011
z
i
igi
h
k
kgk xvy
11
z
i
ikok xv
k , vi =
, g = 1,2,...,n, k= 1,2,.....,h, i=1,2,......,z Measurement of Inputs and outputs in banking
It is well known in the literature of banking efficiency studies, the choice of input and output variables significantly affects the efficiency scores of banks, and at the same time, it is not an easy task to measure and define bank input and output variables. There is considerable disagreement among researchers about the constituents of inputs and outputs of the banking industry. Since many bank services are priced implicitly by offering below market interest rates on deposits, the observed revenue flow offer poor guidance regarding the relative importance of various outputs (Berger and Humphrey, 1992). Mainly two different approaches have appeared in the literature regarding the measurement of inputs and outputs of banks. These approaches are the production and intermediation approach. The production approach treated loans and deposits as outputs and measured in terms of the number of accounts and transactions serviced during a particular period. A shortcoming of this approach is that it considers only
operating costs and excludes the interest expenses. In contrast, the intermediation approach views banks as financial intermediaries that collect funds from units in surplus and then transform these resources into loans and other investments. According to this approach, bank outputs are measured in monetary values and total costs include all operating and interest expenses thus providing a more thorough picture of the economic viability of a bank.
Berger and Humphrey (1997) pointed out that neither of the two
approaches is suitable for defining the inputs and outputs because these approaches cannot fully capture the dual role of banks as producers of services and being financial intermediaries between savers and investors. Nevertheless, they suggested that, the production approach might be more suitable for branch level efficiency studies whereas intermediation approach is well suitable for measuring bank level efficiency. This is because, at the branch level, investment decisions are mostly not under the control of branches whereas at the bank level motive of management will be
to reduce total cost and not just non-interest expenses. In banking literature, researches have given priority to intermediation approach.
In this paper, a modified version of intermediation approach is used for the selection of input and output variables. The selected input variables are 1) Labor (measured in terms of number of full time employees, 2) Loanable funds (measured as the sum of deposits and borrowings and 3) Physical capital comprising fixed
assets and book value of premises at the end of the year. The output variables used for the estimation of efficiency are 1) Non-interest income and 2) Net-interest income (measured as the
Kaur and Kaur 1243
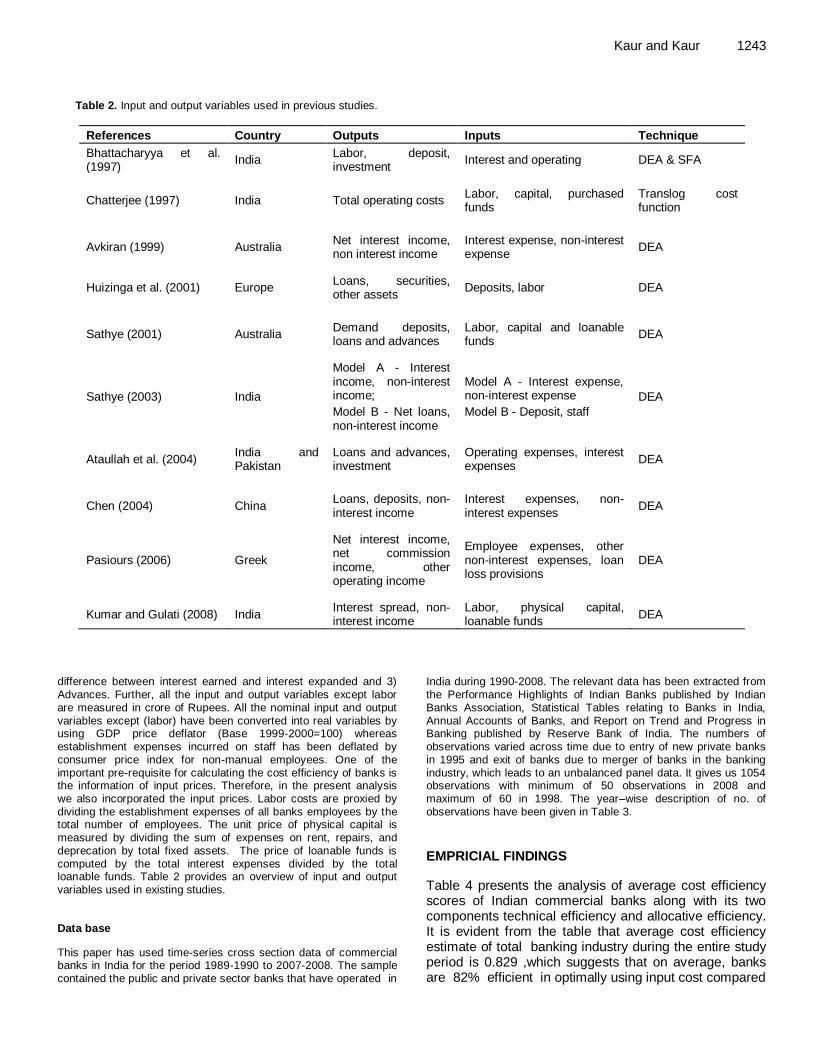
Table 2. Input and output variables used in previous studies.
References Country Outputs Inputs Technique
Bhattacharyya et al. (1997)
India Labor, deposit, investment
Interest and operating DEA & SFA
Chatterjee (1997) India Total operating costs Labor, capital, purchased funds
Translog cost function
Avkiran (1999) Australia Net interest income, non interest income
Interest expense, non-interest expense
DEA
Huizinga et al. (2001) Europe Loans, securities, other assets
Deposits, labor DEA
Sathye (2001) Australia Demand deposits, loans and advances
Labor, capital and loanable funds
DEA
Sathye (2003) India
Model A - Interest income, non-interest income;
Model B - Net loans, non-interest income
Model A - Interest expense, non-interest expense
Model B - Deposit, staff
DEA
Ataullah et al. (2004) India and Pakistan
Loans and advances, investment
Operating expenses, interest expenses
DEA
Chen (2004) China Loans, deposits, non-interest income
Interest expenses, non-interest expenses
DEA
Pasiours (2006) Greek
Net interest income, net commission income, other operating income
Employee expenses, other non-interest expenses, loan loss provisions
DEA
Kumar and Gulati (2008) India Interest spread, non-interest income
Labor, physical capital, loanable funds
DEA
difference between interest earned and interest expanded and 3) Advances. Further, all the input and output variables except labor are measured in crore of Rupees. All the nominal input and output
variables except (labor) have been converted into real variables by using GDP price deflator (Base 1999-2000=100) whereas establishment expenses incurred on staff has been deflated by consumer price index for non-manual employees. One of the important pre-requisite for calculating the cost efficiency of banks is the information of input prices. Therefore, in the present analysis we also incorporated the input prices. Labor costs are proxied by dividing the establishment expenses of all banks employees by the total number of employees. The unit price of physical capital is
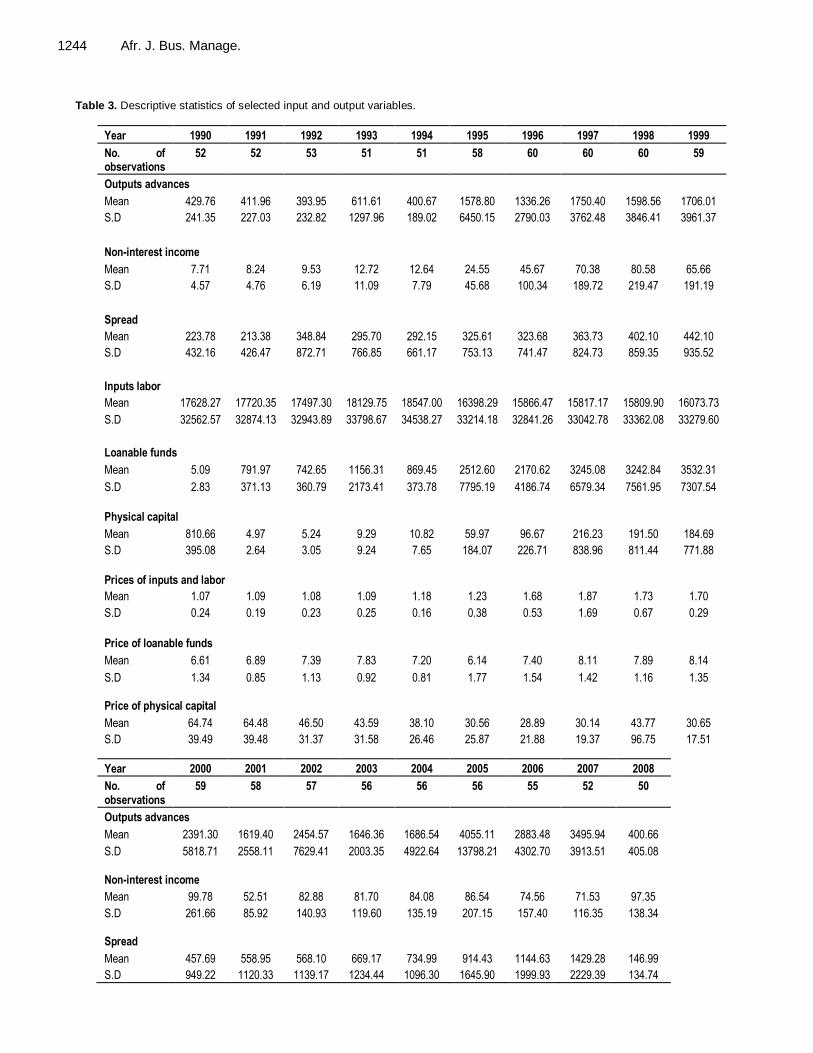
measured by dividing the sum of expenses on rent, repairs, and deprecation by total fixed assets. The price of loanable funds is computed by the total interest expenses divided by the total loanable funds. Table 2 provides an overview of input and output variables used in existing studies. Data base
This paper has used time-series cross section data of commercial banks in India for the period 1989-1990 to 2007-2008. The sample contained the public and private sector banks that have operated in
India during 1990-2008. The relevant data has been extracted from the Performance Highlights of Indian Banks published by Indian Banks Association, Statistical Tables relating to Banks in India,
Annual Accounts of Banks, and Report on Trend and Progress in Banking published by Reserve Bank of India. The numbers of observations varied across time due to entry of new private banks in 1995 and exit of banks due to merger of banks in the banking industry, which leads to an unbalanced panel data. It gives us 1054 observations with minimum of 50 observations in 2008 and maximum of 60 in 1998. The year–wise description of no. of observations have been given in Table 3.
EMPRICIAL FINDINGS
Table 4 presents the analysis of average cost efficiency scores of Indian commercial banks along with its two components technical efficiency and allocative efficiency. It is evident from the table that average cost efficiency estimate of total banking industry during the entire study period is 0.829 ,which suggests that on average, banks are 82% efficient in optimally using input cost compared
1244 Afr. J. Bus. Manage.
Table 3. Descriptive statistics of selected input and output variables.
Year 1990 1991 1992 1993 1994 1995 1996 1997 1998 1999
No. of observations
52 52 53 51 51 58 60 60 60 59
Outputs advances
Mean 429.76 411.96 393.95 611.61 400.67 1578.80 1336.26 1750.40 1598.56 1706.01
S.D 241.35 227.03 232.82 1297.96 189.02 6450.15 2790.03 3762.48 3846.41 3961.37
Non-interest income
Mean 7.71 8.24 9.53 12.72 12.64 24.55 45.67 70.38 80.58 65.66
S.D 4.57 4.76 6.19 11.09 7.79 45.68 100.34 189.72 219.47 191.19
Spread
Mean 223.78 213.38 348.84 295.70 292.15 325.61 323.68 363.73 402.10 442.10
S.D 432.16 426.47 872.71 766.85 661.17 753.13 741.47 824.73 859.35 935.52
Inputs labor
Mean 17628.27 17720.35 17497.30 18129.75 18547.00 16398.29 15866.47 15817.17 15809.90 16073.73
S.D 32562.57 32874.13 32943.89 33798.67 34538.27 33214.18 32841.26 33042.78 33362.08 33279.60
Loanable funds
Mean 5.09 791.97 742.65 1156.31 869.45 2512.60 2170.62 3245.08 3242.84 3532.31
S.D 2.83 371.13 360.79 2173.41 373.78 7795.19 4186.74 6579.34 7561.95 7307.54
Physical capital
Mean 810.66 4.97 5.24 9.29 10.82 59.97 96.67 216.23 191.50 184.69
S.D 395.08 2.64 3.05 9.24 7.65 184.07 226.71 838.96 811.44 771.88
Prices of inputs and labor
Mean 1.07 1.09 1.08 1.09 1.18 1.23 1.68 1.87 1.73 1.70
S.D 0.24 0.19 0.23 0.25 0.16 0.38 0.53 1.69 0.67 0.29
Price of loanable funds
Mean 6.61 6.89 7.39 7.83 7.20 6.14 7.40 8.11 7.89 8.14
S.D 1.34 0.85 1.13 0.92 0.81 1.77 1.54 1.42 1.16 1.35
Price of physical capital
Mean 64.74 64.48 46.50 43.59 38.10 30.56 28.89 30.14 43.77 30.65
S.D 39.49 39.48 31.37 31.58 26.46 25.87 21.88 19.37 96.75 17.51
Year 2000 2001 2002 2003 2004 2005 2006 2007 2008
No. of observations
59 58 57 56 56 56 55 52 50
Outputs advances
Mean 2391.30 1619.40 2454.57 1646.36 1686.54 4055.11 2883.48 3495.94 400.66
S.D 5818.71 2558.11 7629.41 2003.35 4922.64 13798.21 4302.70 3913.51 405.08
Non-interest income
Mean 99.78 52.51 82.88 81.70 84.08 86.54 74.56 71.53 97.35
S.D 261.66 85.92 140.93 119.60 135.19 207.15 157.40 116.35 138.34
Spread
Mean 457.69 558.95 568.10 669.17 734.99 914.43 1144.63 1429.28 146.99
S.D 949.22 1120.33 1139.17 1234.44 1096.30 1645.90 1999.93 2229.39 134.74

Kaur and Kaur 1245
Table 3 cont.
Inputs labor
Mean 15941.47 14935.26 14556.54 14908.64 14917.18 14989.66 15542.51 16667.35 17443.40
S.D 32743.46 30224.00 29379.20 29549.27 25760.12 28980.42 28329.10 27188.45 26962.62
Loanable funds
Mean 5051.20 3348.15 4715.59 3239.69 3302.13 6258.26 4419.80 5240.76 3452.41
S.D 11705.74 4866.64 13353.89 3961.59 8721.76 19694.91 6053.39 5693.27 2892.12
Physical capital
Mean 195.40 110.80 180.21 100.21 91.04 115.49 80.20 87.34 105.38
S.D 730.26 347.56 731.87 307.79 508.37 329.11 207.77 211.68 294.02
Prices of inputs and labor
Mean 1.88 2.12 2.13 2.27 2.42 2.60 2.80 2.75 3.05
S.D 0.34 0.51 0.44 0.47 0.55 0.92 0.71 0.53 0.79
Price of loanable funds
Mean 7.64 632.66 7.33 6.60 5.33 4.58 4.60 4.98 13.12
S.D 1.05 389.22 1.25 0.90 1.47 0.81 0.66 0.69 10.77
Price of physical capital
Mean 31.56 33.67 36.13 40.38 40.78 41.41 41.89 43.59 137.88
S.D 18.07 18.01 18.32 19.04 17.85 18.76 17.03 20.26 213.05
All rupees values have been deflated by using GDP deflator with base 1999-2000.
to the best practice banks, operating under same working conditions. As depicted in Table 4, cost efficiency of private sector banks is 76.3% followed by 73.4% of public sector banks during the entire study period, which indicates that the private sector banks have the potential for cost saving by 23.7% or in other words, private sector banks have and could use only 76.3% of resources actually employed to produce the given level of output.
Table 4 also indicates that public sector banks can cut their costs by 26.6% to become fully efficient banks and to capture the position of best practice frontier. The findings of this study reported that private sector banks have performed better than public sector banks in cost savings with the given state of technology. The decomposition of CE into its two components clearly indicates that in each year, allocative inefficiency is always higher than technical inefficiency. It implies that the dominant source of cost inefficiency among Indian commercial banks is allocative inefficiency rather than technical inefficiency. It suggests that managers of Indian banks are relatively good in using the minimum level of inputs at a given level of outputs but they were not good in selecting the optimal mix of inputs at given prices. Impact of merger activity on cost efficiency Here an attempt is made to investigate the factors, which affect the efficiency of commercial banks in India. The
efficiency of banks is not only influenced by the merger activity, rather many variables affect the efficiency of banks. Several bank and industry specific factors may influence a particular bank‟s efficiency level. Some of these factors may be neither inputs nor outputs in the production process, but rather circumstances faced by a particular bank (Sufian and Mazid, 2007). It is apparent from the analysis that the efficiency scores differ among different banks in India. The analysts, bank managers and policy makers are interested in determining whether their differences are significant or not in statistical sense. This can be done by using regression analysis. As the efficiency scores derived from DEA model is bounded between 0 and 1, an application of simple regression model may provide biased results and application of Tobit regression more appropriate than simple regression model. However, Alexander and Jaforullah (2004) pointed out that 100% efficiency or 0% inefficiency is a valid score and no higher (or lower) score is possible, by definition. In this sense, the data are not truly censored at one (or 0), OLS is therefore quite appropriate.
Following Burki and Niazi (2003), Alexander and Joforullah (2004) and Ketkar and Ketkar (2008), in this paper, Panel Least Square Fixed Effect Regression model has been used. Therefore, the cost efficiency scores obtained by DEA model is considered as dependent variable and regressed on a range of independent variables by using panel data least square method of fixed effects models.

1246 Afr. J. Bus. Manage.
Table 4. Average cost efficiency, technical efficiency and allocative efficiency of Indian banks.
Year Cost efficiency Technical efficiency Allocative efficiency
PSBs PVTs CBs PSBs PVTs CBs PSBs PVTs CBs
1989-90 0.787 0.813 0.802 0.913 0.880 0.898 0.865 0.924 0.893
1990-91 0.792 0.792 0.796 0.931 0.931 0.92 0.853 0.853 0.866
1991-92 0.669 0.728 0.697 0.865 0.838 0.853 0.767 0.872 0.816
1992-93 0.781 0.649 0.709 0.895 0.889 0.892 0.867 0.713 0.789
1993-94 0.595 0.825 0.704 0.851 0.916 0.882 0.686 0.9 0.787
1994-95 0.632 0.720 0.68 0.819 0.83 0.825 0.764 0.851 0.81
1995-96 0.594 0.415 0.496 0.797 0.803 0.800 0.744 0.515 0.618
1996-97 0.735 0.799 0.77 0.839 0.893 0.869 0.868 0.895 0.883
1997-98 0.744 0.754 0.75 0.877 0.92 0.903 0.845 0.817 0.83
1998-99 0.757 0.817 0.79 0.885 0.895 0.891 0.851 0.909 0.882
1999-00 0.762 0.821 0.795 0.883 0.889 0.887 0.86 0.919 0.892
2000-01 0.820 0.769 0.795 0.901 0.895 0.887 0.917 0.862 0.881
2001-02 0.763 0.815 0.791 0.892 0.896 0.894 0.851 0.907 0.881
2002-03 0.985 0.798 0.764 0.909 0.901 0.905 0.799 0.882 0.842
2003-04 0.723 0.816 0.772 0.918 0.904 0.911 0.786 0.899 0.845
2004-05 0.775 0.737 0.756 0.934 0.873 0.903 0.831 0.842 0.837
2005-06 0.796 0.763 0.779 0.924 0.883 0.904 0.86 0.859 0.859
2006-07 0.751 0.826 0.79 0.946 0.93 0.939 0.799 0.889 0.84
2007-08 0.492 0.842 0.649 0.945 0.919 0.934 0.513 0.911 0.693
Average 0.734 0.763 0.741 0.891 0.889 0.889 0.807 0.854 0.829
The explanatory variables that have been considered to explain DEA cost efficiency are size of bank, profitability, exposure to off-balance sheet activities, quality of staff, operational risk and two dummies (DUMMERGER and DUMPUBLIC). DUMMERGER denotes the dummy variable equal to 1 for banks that have participated in the merger activity during the study period 0 for non-merged banks. Similarly, DUMPUBLIC indicates the dummy variable equal to 1 for public sector banks and 0 for otherwise.
The following regression equation has been fitted to explain efficiency scores. The econometric software package E-views version 5.1 is used to estimate the parameters.
SIZE+ ROA+ QSTAFF+ OFFBALAN
CE+ ORISK+ DUMERGER+α 7 DUMPUBLIC
εi is the disturbance term and εi = νi +µi, where νi = capturing the unobserved bank specific effect and µi = idiosyncratic error
Where EFF denotes the DEA efficiency scores derived at first stage.
Table 5 provides the description of these factors and their hypothesized relationship with efficiency of banks. Table 6 provides the results of panel least square regression analysis. It has been clear from the table; the sign of the estimated regression co-efficient are in
accordance with priori expectations. In the present paper, logarithm of total assets is used to explain the SIZE of banks. From the Table 6, it is observed that the value of SIZE co-efficient has been worked out to be (0.046476) for all CBs and the co-efficient have a positive sign. Further, SIZE co-efficient is noted to be highly significant at 1% level of significance. It implies that efficiency of large banks is higher than that of small ones. These results are consistent with the results obtained by Favero and Papi (1995), Hauner (2004), which highlighted that cost efficiency, is positively related to size of banks.
As discussed earlier, the ROA has been used as a proxy variable for banks profitability. Profitability denotes the ability of a bank to earn in excess to the expenditure incurred on handling all the related operations. It has been observed from the Table 6 that ROA reveals a positive relationship and the value of ROA co-efficient is noted to be (0.045745) for all CB‟s. The value of co-efficient is found to be significant at 1% level of significance. Therefore, ROA has proved to be a major determinant for cost efficiency of banks in India. The findings of this analysis indicate that higher level of profitability of banks leads to lower level of cost inefficiency and vice-versa. These findings are supported by the findings of previous studies (Isik and Hassan, 2002; Verma and Kumara, 2002-2003; Sufian and Habibullah (2009).
QSTAFF has also been considered as major deter-minant of cost efficiency of commercial banks in

Kaur and Kaur 1247
Table 5. Description of the variables used in the regression analysis.
Variable Description Hypothesized relationship
with efficiency Remarks
SIZE Natural logarithm of total assets
+
Is used as a proxy to examine the association of size with cost efficiency and it is expected to take a positive sign
ROA Net profits over total assets
+
Is used as a proxy variable to examine the relationship between profitability and efficiency. A positive relationship is expected.
Quality of staff (QSTAFF)
Establishment expenses over total no. of employees
+/- Is used as a proxy variable for overheads cost and there is no prori expectation on the variable sign.
Exposure to off balance sheet activities
(OFFBALANCE)
Non –interest income over total assets
+/- Is used as a proxy for banks diversification strategy. A positive relationship is expected.
Operational risk
(ORISK)
Total loans over total assets
+
Is used as a measure of risk taking behavior of bank management. The variable is expected to have a positive sign.
DUMMERGER
Dummy variable that takes a value 1 for banks that participate in merger activity, 0 otherwise
+
Is used to examine the impact of merger on the efficiency of banks. This variable is expected to have positive sign.
DUMPUB
Dummy variable that takes a value 1 for public sector banks, 0 otherwise
+/-
Is used to examine the association between bank ownership and efficiency. There is no priori expectation on the variable sign.
Table 6. Regression explaining efficiency scores.
Explanatory variables Estimated co-efficient
t-value
Intercept 0.578428 15.33321***
SIZE 0.046476 4.119974***
ROA 0.045745 11.62231***
QSTAFF 0.002046 0.389742
OFFBALANCE 0.001999 0.260417
OPERATIONALRISK 0.000015 0.052745
DUMMERGER 0.037739 2.500176**
DUMPUBLIC -0.087674 -6.242362***
R-square 0.315888
Adjusted R-squared 0.299251
F-statistics 18.98709
***, ** Significant at 1 and 5% level of significance. Source: Authors‟ calculations.
India. Table 6 provides that the value of quality of staff co-efficient is (-0.002046) and the results delineate a negative sign of co-efficient but it is not significant at any conventional level of significance.
The ratio of non-interest income to total assets has been used to investigate the influence of banks diversi-fication strategy into non-tradinational activities and it is considered as another important variable that affects the cost efficiency of banks in India. The empirical findings suggest that the value of OFFBALANCE co-efficient turns out to be (0.001999) and it is not statistically significant. The findings suggest that banks tend to become more cost efficient as they increasingly engage themselves in modern banking activities. The above finding is consisted with the findings of earlier findings by Kwan (2006) and Sufian and Mazid (2007), which highlighted the positive impact OFFBALANCE sheet activities on bank‟s effi-ciency. Loans/TA ratio can be considered as another

1248 Afr. J. Bus. Manage. important variable affecting cost efficiency of commercial banks in India. It indicates the risk taking behavior of bank management. It shows positive co-efficient and suggest that banks with higher loans to asset ratio tend to have higher efficiency levels.
Further to investigate the relationship between owner-ship of bank and bank‟s efficiency, in this paper a dummy variable, DUMPUBLIC is introduced as an explanatory variable in the regression model. It has been observed from the Table 6 that the value of DUMPUBLIC co-efficient is found to be highly significant at 1% level of significance. It implies that public sector banks enjoy lower efficiency scores than private owned banks. Dummy variable merger, also show a positive association with cost efficiency of banks. It implies that merged banks gain access to cost saving technologies or spread their fixed cost over a larger base, thus reducing average cost. Conclusion Applying, a non-parametric DEA approach, this paper examines the cost, technical and allocative efficiency of Indian banks over the period 1990-1991-2007-2008. This paper also shed light on the bank specific and environmental factors affecting cost efficiency of public and private banks in India. The findings of this study suggest that over the entire study period, average cost efficiency of public sector banks was found to be 73.4 and for private sector banks is 76.3%. The findings suggest that public sector banks (except State Bank of India and its associates) are lagging far behind their counterparts in terms of efficiency and public sector banks needs to transform their business strategies to raise their efficiency levels and to attain position in the global financial market. According to the empirical findings, the size, profitability, and merger activity has significant impact on the CE of banks in India. The findings of this study suggested that the Government and banking authorizes should have to promote mergers. As mergers resulted in expansion of banks and it enables banks to raise money from the capital markets. The Indian financial system requires very large banks to absorb various risks that have emerged from operating in local and global market. The prime factors for future mergers in Indian banking industry included the Basel–II environment, challenges of free convertibility and requirement of large investment banks. Therefore, the Government and policy makers should be more cautious in promoting merger as a way to reap economies of scale and scope. REFERENCES
Akhavein JD, Berger AN, Humphrey DB (1997). “The Effects of Bank
Mergers on Efficiency and Prices: Evidence from the Profit Function”
Rev. Ind. Organ. 12:95-139. Alexander WRJ, Jaforullah M (2004). Explaining efficiency differences
of New Zealand secondary schools (Economics Discussion Papers Series No. 403). University of Otago. Retrieved from http:// hdl.handle.net/10523/899.
Ariff M, Can L (2008). Cost and profit efficiency of Chinese banks: A non-parametric analysis. China Econ. Rev. 19(2):260-273.
Ataullah A, Cockerill T, Le H (2004). “Financial Liberalization and Bank
Efficiency: A Comparative Analysis of India and Pakistan”. Appl. Econ. 36(17):1915-1924.
Avkiran NK (1999). “The Evidence on Efficiency Gains: The Role of
Mergers and the Benefits to the Public,” J. Bank. Financ. 23:1013. Banker RD, Charnes A, Cooper WW (1984). “Some Models for
Estimating Technical and Scale Inefficiencies in Data Envelopment
Analysis”, Manage. Sci. 30(9):1078-1092. Berger AN, Demsetz RS, Strahan PE (1999). “The Consolidation of the
Financial Service Industry: Causes, Consequences and Implications
for the Future” J. Bank. Financ. 23(2-4):135-194. Berger AN, Humphrey DB (1992). Measurement and Efficiency Issues
in Commercial Banking. University of Chicago Press, Volume ISBN:
0-226-30885-5, pp.245-300. Berger AN, Humphrey DB (1997). “Efficiency of Financial Institutions:
International Survey and Directions for Future Research”, Eur. J.
Oper. Res. 98(2):175-212. Berger AN, Udell GF (1998). The Economics of Small Business
Finance: The Roles of Private Equity and Debt Markets in the
Financial Growth Cycle. 22:1-12. Bhattacharyya A, Lovell CAK, Sahay P (1997). “The impact of
liberalization on the productive efficiency of Indian commercial banks”
Eur. J. Oper. Res. 98:332-345. Bonaccorsi E, Hardy CD (2005). Financial sector liberalization, bank
privatization, and efficiency: Evidence from Pakistan. J. Bank.
Financ., 29(8-9):2381-2406. Burki A, Niazi GSK (2006). “Impact of financial reforms on efficiency of
state-owned, private and foreign banks in Pakistan” CMER Working
Paper No.06-49, Lahore University of Management Sciences. Casu B, Philip M (2003). "A comparative study of efficiency in European
banking," Appl. Econ. Taylor and Francis J. 35(17):1865-1876.
Charnes A, Cooper WW, Huang ZM, Sun DB (1990). “Polyhedral Cone-RatioDEA Models with An Illustrative Application To Large Commercial Banks,” J. Econ. pp.73-91.
Charnes A, Cooper WW, Rhodes E (1978). “Measuring the Efficiency of Decision Making Units”, Eur. J. Oper. Res. 2:429-444.
Chatterjee G (1997), “Scale Economies in Banking – Indian Experience
in Deregulated Era”, Reserve Bank of India Occasional Papers 18(1):37-59.
Chen T-Y (2004). „„A study of cost efficiency and privatization in
Taiwan‟s banks: the impact of the Asian Financial Crisis” Ser. Ind. J. 24(5):137-151.
Das A (1997). “Measurement of productive efficiency and its decomposition in Indian banking firms”, Asian Econ. Rev. 39(3):422-
39. Farell MJ (1957). “ The Measurement of Productive Efficiency” J. Royal
Statistical Society, Series A-120:253-290.
Ferrier GD, Lovell CAK (1990). “Measuring Cost Efficiency in Banking: Econometric and Linear Programming Evidence,” J. Econom. 46:229-245.
Huizinga HP, Nelissen JHM, Vander VR (2001). Efficiency Effects of Bank Mergers and Acquisitions in Europe. Tinbergen Institute Discussion Paper 088/3. Rotterdam.
Humphrey DB (1993), “Cost and Technical Change: Effects from Bank Deregulation,” J. Prod. Anal. 4:9-34.
Isik IMK Hassan (2002). “Technical, Scale and Allocative Efficiencies of
Turkish Banking Industry” J. Bank. Financ. 26:719-766. Ketkar KW, Ketkar SL (2008). Performance and Profitability of Indian
Banks in the Post Liberalization Period. Presented at The 2008 World
Congress on National Accounts and Economic Performance Measures for Nations, May 13 -17, 2008, Washington DC.
Lang G, Welzel P (1999). “Mergers among German Cooperative Banks:
A Panel-based Stochastic Frontier Analysis”, Small Bus. Econ. 13:273-286.
Mohan R (2006). “Reforms, Productivity and Efficiency in Banking: The
Indian Experience,” Reserve Bank India Bulletin pp.279-293. Mukherjee A, Nath P, Pal MN (2002). “Performance benchmarking and

strategic homogeneity of Indian banks,” Int. J. Bank Market. 20(3):122-139.
Peng Ya-Hui, Wang Kehlun (2004). “Cost Efficiency and the Effects of
Mergers on the Taiwanese Banking Industry”, Ser. Ind. J. 24(4):21-39.
Ram Mohan TT, Ray S (2004) “ Productivity growth and efficiency of
Indian banking : a comparison of public , private and foreign banks, working paper No 2004/27, Department of Economics , University of Connecticut , Store ct.
Reserve Bank of India (2008). “Report on Currency and Finance” September 2008.
Resti A (1998). “Regulation Can Foster Mergers, Can Mergers Foster
Efficiency? The Italian Case” J. Econ. Bus. 50:157-169. Rhoades Stephen A (1998). "The Efficiency Effects of Bank Mergers:
An Overview of Case Studies of Nine Mergers," J. Bank. Financ.
22:273-291. Sathye M (2001). “X-Efficiency in Australian Banking: An Empirical
Investigation”. J. Bank. Financ. 25:613-630.
Sathye M (2003). “Efficiency of Banks in a Developing Economy: the Case of India.” EJOR 148(3):662-671.
Seiford LM, Zhu J (1999). Profitability and marketability of the top 55
U.S. commercial banks. Manage. Sci. 45(9):1270-1288.
Kaur and Kaur 1249 Sufian F, Abdul Mazid MZ (2007) “Deregulation, Consolidation and
Banks Effciiency in Singapore: Evidence from Event Study Window Approach and Tobit Analysis” Int. Rev. Econ. 54: 261-283.
Sufian F, Habibullah M Shah (2009) “Do Mergers and Acquisitions leads to a Higher Technical and Scale Efficiency?
Vennet RV (1996). The effect of mergers and acquisitions on the
efficiency and profitability of EC credit institutions. J. Bank. Finan. 20:1531-1558.
Wu S (2006). The Wallis Report and Implications of Bank Mergers for
Efficiencies. School Working Paper -Economic Series 2006 SWP 2006/12
Wu WH (2008). The Second Financial Reform and the Development of
Financial Industry in Taiwan. Rev. Pac. Basin Finan. Mark. Pol., 11, 75 (2008). DOI: 10.1142/S0219091508001271 Evidence from Malaysia” Afr. J. Bus. Manage. 3(8):340-349.


![Indian Banks - PSU Banks[1]](https://img.dokumen.tips/doc/110x75/577d36f51a28ab3a6b946f03/indian-banks-psu-banks1.jpg)


