Embed Size (px)
Citation preview
A STUDY OF WARMTH SENSATION PRODUCED BY
MILLIMETER WAVE EXPOSURE
Takeshi KONNO(1), Masahiro HANAZAWA (2), Soichi WATANABE (3), Masao TAKI (4), and Hiroshi SHIRAI (5)
(1)Department of Electrical, Electronic, and Communication Engineering, Faculty of Science and Engineering,Chuo University, 1 – 13 – 27 Kasuga, Bunkyo, Tokyo 112 – 8551 Japan. E-mail: [email protected]
(2)National Institute of Information and Communications Technology, 4 – 2 – 1 Nukuikitamachi, Koganei,Tokyo 184 – 8795 Japan. E-mail: [email protected]
(3)As (2) above, but E-mail: [email protected]
(4)Tokyo Metropolitan University, 1 – 1 Minamiosawa, Hachioji, Tokyo 192 – 0397, Japan.E-mail: [email protected]
(5)As (1) above, but E-mail: [email protected]
ABSTRACT
The distributions of Specific Absorption Ratio (SAR) and temperature rise in a human body exposed to millimeter wave(MMW) have been evaluated by theoretical and numerical methods with a one-dimensional multi-layer model. Thismodel consists of three layers i.e. skin, fat, and muscle, which are modeled as surface region of a human body. From ourcalculation, significant SAR and temperature rise appear only around the skin surface compared with the case of exposureat lower frequencies. Our study shows that incident power density of 5mW/cm2, which is a safety guideline level inMMW region, can make perceivable warmth sensation, which is not adverse health effects (warmth pain).
INTRODUCTION
Recently, the concern with various applications of millimeter wave (MMW) has been growing from the viewpoint ofeffective using of radio frequency. Since it is expected to increase the public exposure to MMW in near future, detailedinvestigation on the health effect of MMW exposure is indispensable. Commencing with [1], there have been severalstudies on MMW effects. They have been reported that as almost energy of MMW is absorbed by the body surface, it isimportant to protect superficial organs, such as skin and eye [1, 2]. Particularly for skin, MMW exposure mainly causeswarmth sensation. The safety guidelines for MMW ([3, 4], etc), therefore, have been determined based on the threshold ofthe warmth sensation. However, these safety guidelines do not agree with each others because the biological basis of theexposure period is poorly established. Furthermore, the definition of spatial average is not clear except ICNIRP, althoughICNIRP does not clearly describe the rationale of the spatial average. In addition, most studies on the warmth sensationdealt with microwave (MW) and infrared-rays (IR) while the warmth sensation caused by MMW has not been studiedenough. To clarify these problems, it is necessary to investigate the characteristics of the warmth sensation, especiallydependences on frequency, exposure area and exposure period because these parameters are important to set guidelinelevels.
The objective of this study, therefore, is to investigate the relationship between frequency, power absorption (SAR),temperature rise, and warmth sensation. We also consider the variations in power absorption and temperature rise withdifferent polarization, incident angle, and skin thickness.
METHODS
In this study, absorbed energy i.e. Specific Absorption Ratio (SAR) and temperature rise are evaluated by using simplebut very-high-spatial resolution model. The penetration depth of MMW for the human body is very shallow so that wewill focus only near the body surface. The structure near the body surface is approximated as the semi-infinite three-layer
1
Skin Fat MuscleAir
1.2 mm 11.85 mm
Incident Wave
Zair
Zskin Zfat Zmuscle
1.2 mm 11.85 mm
(a) (b)
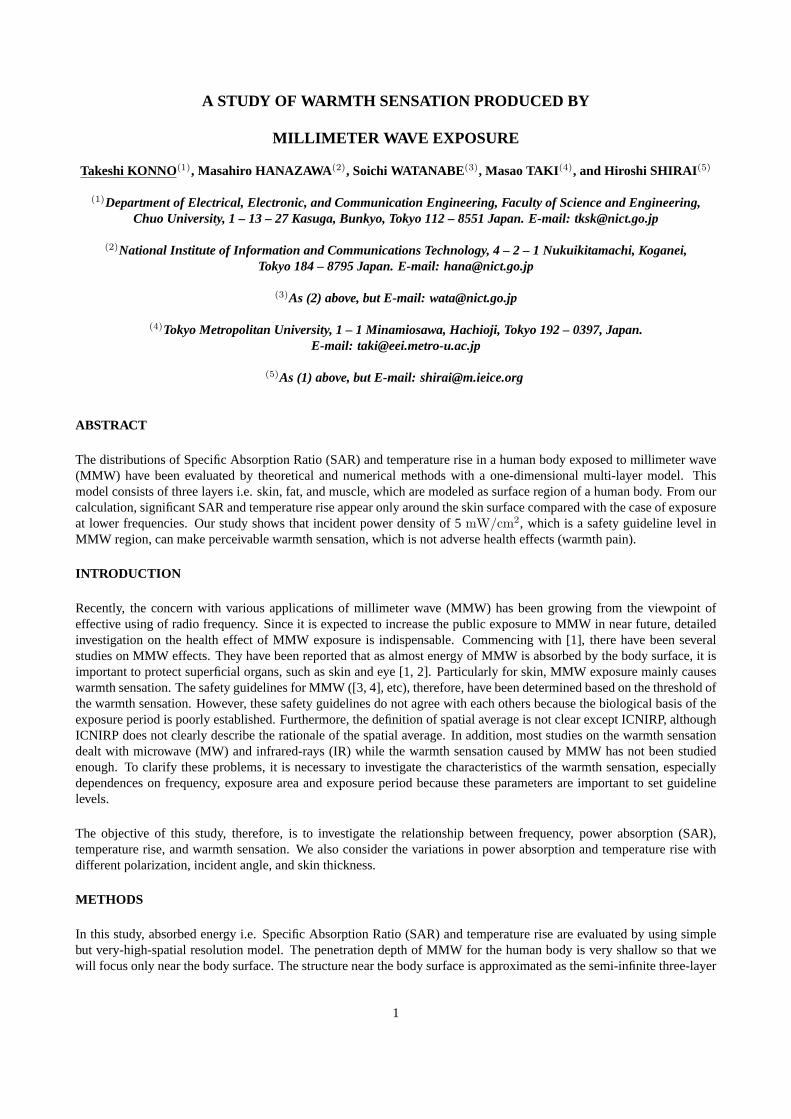
Figure 1: (a) 1-D model near the body surface. (b) Transmission line model (Ztissue: Characteristic impedance of eachtissue) .
———————————————————————————–
(i.e. skin, fat, and muscle) model. Fig.1(a) shows the model. Thickness of each tissue is also shown in Fig.1(a).
The distribution of SAR is calculated by using analytical transmission line methods (cf. Fig.1(b)). This method hasbeen known that it becomes simple to analyze the electromagnetic distribution of inner tissues by solving each boundarycondition as linear simultaneous equations. Substituting electric field distribution to Eq.(1), we will obtain the SARdistribution ;
SAR =σ|E|2
ρ[W/kg] (1)
whereE is the RMS value of the electric field strength [V/m],σ is the tissue conductivity [S/m], andρ is the tissue massdensity[kg/m3]. The distribution of temperature rise is obtained by solving Bio-heat equation considered SAR as heatsource. According to [5], Bio-heat equation is expressed by this equation ;
Cp∂T
∂t= K∇2T + A0 + ρ(SAR)−B(T − Tb) (2)
whereC is the tissue specific heat[J/kg · ◦C], T is the tissue temperature[◦C], K is the tissue thermal conductivity[W/m · ◦C], A0 is the tissue metabolic heat production[W/m3], B is the term associated with blood flow[W/m3 · ◦C],andTb is the blood temperature[◦C]. The boundary condition between air and skin for (2) is given by ;
−K∂T
∂n= h(Ts − Te) (3)
whereh is the convection coefficient[W/m2 · ◦C], andTs, Te are surface temperature, and temperature of the air, re-spectively. These equations are numerically calculated with those difference forms. The spatial resolution is 0.01 mmand the time step is 0.1 msec. It is assumed that deep body temperature stays at constant as 37◦C. In this study, incidentpower density is assumed to be Japanese guideline value 5mW/cm2 under the controlled environment, and the examinedfrequencies were 2.45, 10, 30, 60, and 100 GHz.
RESULT AND DISCUSSION
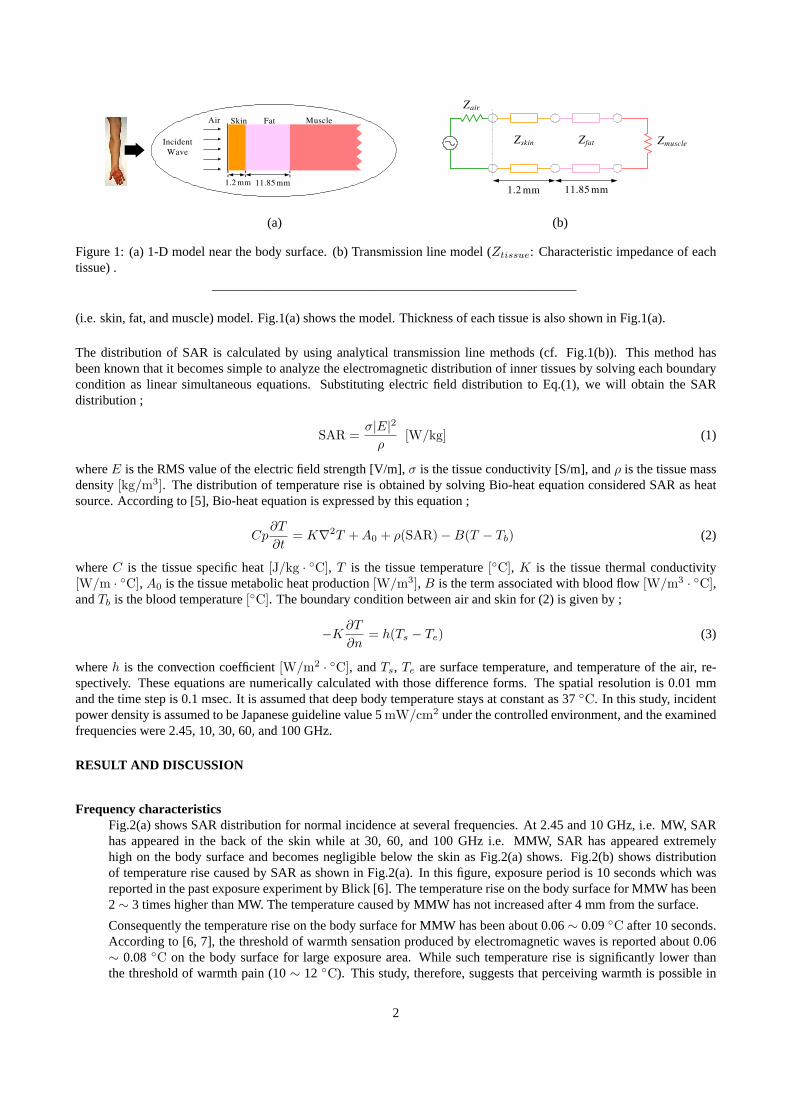
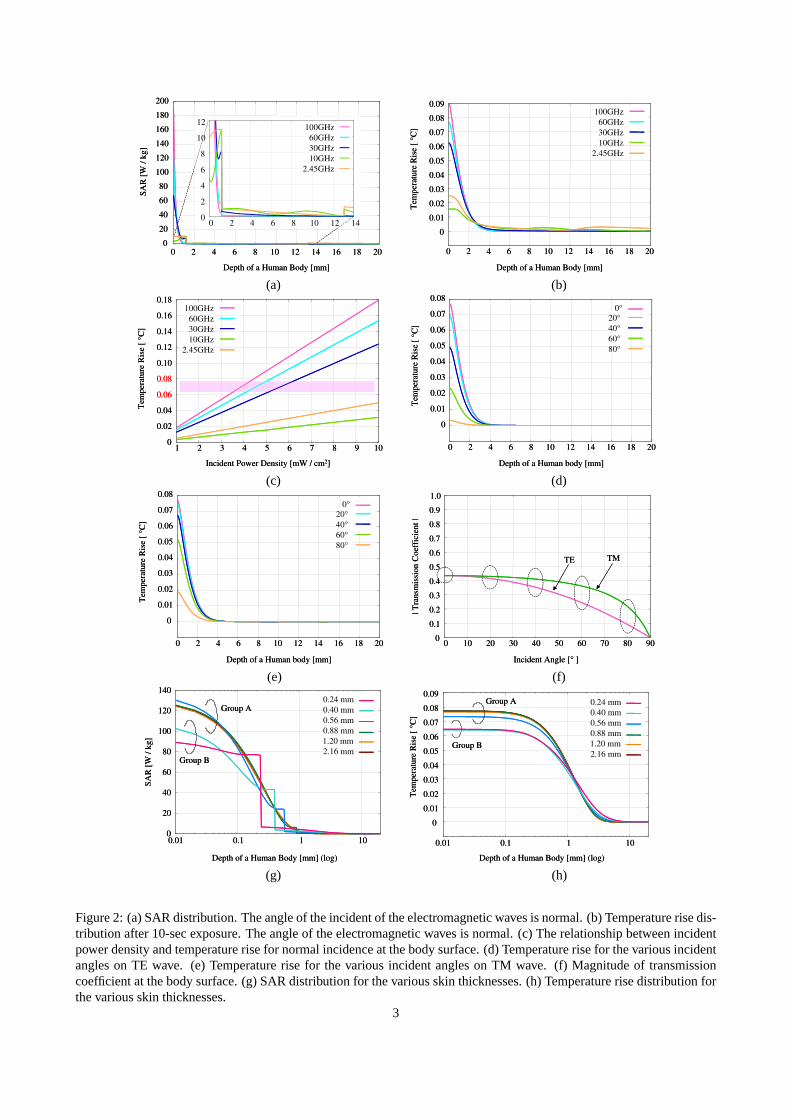
Frequency characteristicsFig.2(a) shows SAR distribution for normal incidence at several frequencies. At 2.45 and 10 GHz, i.e. MW, SARhas appeared in the back of the skin while at 30, 60, and 100 GHz i.e. MMW, SAR has appeared extremelyhigh on the body surface and becomes negligible below the skin as Fig.2(a) shows. Fig.2(b) shows distributionof temperature rise caused by SAR as shown in Fig.2(a). In this figure, exposure period is 10 seconds which wasreported in the past exposure experiment by Blick [6]. The temperature rise on the body surface for MMW has been2∼ 3 times higher than MW. The temperature caused by MMW has not increased after 4 mm from the surface.
Consequently the temperature rise on the body surface for MMW has been about 0.06∼ 0.09◦C after 10 seconds.According to [6, 7], the threshold of warmth sensation produced by electromagnetic waves is reported about 0.06∼ 0.08 ◦C on the body surface for large exposure area. While such temperature rise is significantly lower thanthe threshold of warmth pain (10∼ 12 ◦C). This study, therefore, suggests that perceiving warmth is possible in
2
0
20
40
60
80
100
120
140
160
180
200
0 2 4 6 8 10 12 14 16 18 20
SAR
[W /
kg]
Depth of a Human Body [mm]
0
2
4
6
8
10
12
0 2 4 6 8 10 12 14
100GHz60GHz30GHz10GHz
2.45GHz
0
20
40
60
80
100
120
140
160
180
200
0 2 4 6 8 10 12 14 16 18 20
SAR
[W /
kg]
Depth of a Human Body [mm]
0
2
4
6
8
10
12
0 2 4 6 8 10 12 14
100GHz60GHz30GHz10GHz
2.45GHz
0
0.01
0.02
0.03
0.04
0.05
0.06
0.07
0.08
0.09
0 2 4 6 8 10 12 14 16 18 20
Tem
pera
ture
Ris
e [ °
C]
Depth of a Human Body [mm]
100GHz60GHz30GHz10GHz
2.45GHz
0
0.01
0.02
0.03
0.04
0.05
0.06
0.07
0.08
0.09
0 2 4 6 8 10 12 14 16 18 20
Tem
pera
ture
Ris
e [ °
C]
Depth of a Human Body [mm]
100GHz60GHz30GHz10GHz
2.45GHz
(a) (b)
0
0.02
0.04
0.06
0.08
0.10
0.12
0.14
0.16
0.18
1 2 3 4 5 6 7 8 9 10
Tem
pera
ture
Ris
e [ °
C]
Incident Power Density [mW / cm2]
100GHz60GHz30GHz10GHz
2.45GHz
0
0.02
0.04
0.06
0.08
0.10
0.12
0.14
0.16
0.18
1 2 3 4 5 6 7 8 9 10
Tem
pera
ture
Ris
e [ °
C]
Incident Power Density [mW / cm2]
100GHz60GHz30GHz10GHz
2.45GHz
0
0.01
0.02
0.03
0.04
0.05
0.06
0.07
0.08
0 2 4 6 8 10 12 14 16 18 20
Tem
pera
ture
Ris
e [ °
C]
Depth of a Human body [mm]
0°20°40°60°80°
0
0.01
0.02
0.03
0.04
0.05
0.06
0.07
0.08
0 2 4 6 8 10 12 14 16 18 20
Tem
pera
ture
Ris
e [ °
C]
Depth of a Human body [mm]
0°20°40°60°80°
(c) (d)
0
0.01
0.02
0.03
0.04
0.05
0.06
0.07
0.08
0 2 4 6 8 10 12 14 16 18 20
Tem
pera
ture
Ris
e [ °
C]
Depth of a Human body [mm]
0°20°40°60°80°
0
0.01
0.02
0.03
0.04
0.05
0.06
0.07
0.08
0 2 4 6 8 10 12 14 16 18 20
Tem
pera
ture
Ris
e [ °
C]
Depth of a Human body [mm]
0°20°40°60°80°
0
0.1
0.2
0.3
0.4
0.5
0.6
0.7
0.8
0.9
1.0
0 10 20 30 40 50 60 70 80 90
| Tra
nsm
issi
on C
oeff
icie
nt |
Incident Angle [° ]
TE TM
0
0.1
0.2
0.3
0.4
0.5
0.6
0.7
0.8
0.9
1.0
0 10 20 30 40 50 60 70 80 90
| Tra
nsm
issi
on C
oeff
icie
nt |
Incident Angle [° ]
TE TM
(e) (f)
0
20
40
60
80
100
120
140
0.01 0.1 1 10
SAR
[W /
kg]
Depth of a Human Body [mm] (log)
2.16 mm1.20 mm0.88 mm0.56 mm0.40 mm0.24 mm
Group A
Group B
0
20
40
60
80
100
120
140
0.01 0.1 1 10
SAR
[W /
kg]
Depth of a Human Body [mm] (log)
2.16 mm1.20 mm0.88 mm0.56 mm0.40 mm0.24 mm
Group A
Group B
0
0.01
0.02
0.03
0.04
0.05
0.06
0.07
0.08
0.09
0.01 0.1 1 10
Tem
pera
ture
Ris
e [ °
C]
Depth of a Human Body [mm] (log)
2.16 mm1.20 mm0.88 mm0.56 mm0.40 mm0.24 mmGroup A
Group B
0
0.01
0.02
0.03
0.04
0.05
0.06
0.07
0.08
0.09
0.01 0.1 1 10
Tem
pera
ture
Ris
e [ °
C]
Depth of a Human Body [mm] (log)
2.16 mm1.20 mm0.88 mm0.56 mm0.40 mm0.24 mmGroup A
Group B
(g) (h)
Figure 2: (a) SAR distribution. The angle of the incident of the electromagnetic waves is normal. (b) Temperature rise dis-tribution after 10-sec exposure. The angle of the electromagnetic waves is normal. (c) The relationship between incidentpower density and temperature rise for normal incidence at the body surface. (d) Temperature rise for the various incidentangles on TE wave. (e) Temperature rise for the various incident angles on TM wave. (f) Magnitude of transmissioncoefficient at the body surface. (g) SAR distribution for the various skin thicknesses. (h) Temperature rise distribution forthe various skin thicknesses.
3
incident power density with 5mW/cm2 for MMW. Fig.2(c) shows the relationship between incident power densityand temperature rise on the body surface. Horizontal pink line is the threshold temperature rise of warmth sensationfor large exposure area. This result leads us to the conclusion that at higher frequencies, the threshold of the incidentpower density to cause the warmth sensation is lower.
Characteristics of polarized wave and incident angleFig.2(d) and (e) show the distribution of temperature rise after 10 seconds at 60 GHz, for TE wave and TM wave,respectively. The parameters of these figures are incident angle. As Fig.2(d) and (e) show, normal incidence (0◦)has been the highest distribution while the distribution has decreased as increasing incident angle. Compared TMwave with TE wave, the temperature rise for TM wave has been higher than TE wave with the incident angle. Themagnitude of the transmission coefficient of TE wave is different from that of TM wave as shown in Fig.2(f). At theincident angle between60◦ and80◦, the deviations of the temperature rise between TE and TM wave are maximum,which is coincide with the deviation of the transmission coefficient.
Consideration of difference of the skin thicknessSince surface structure is different in various body parts, we have evaluated SAR and temperature rise with variousskin thicknesses. Fig.2(g) and (h) are shown the variations in SAR and temperature rise with different skin thickness.These calculations are assumed as 60 GHz, normal incidence, and 10-second exposure duration. The results can bedivided into two groups, as Fig.2(g) and (h) shown. That is, SAR and temperature rise within Group A are higherdistributions than Group B. This difference is attributable to the skin thickness, that is whether the skin is thickerthan the penetration depth or not. The penetration depth in skin for 60 GHz is about 0.48 mm. In the cases of 0.24mm and 0.40 mm i.e. Group B, which are thinner than the penetration depth, the energy proceeding through theskin layer may get to the fat layer before its sufficient attenuation. As the result, since reflection energy becomeshigh compared with the other skin thicknesses within Group A, the power absorption in the skin layer is smallerin Group B. Therefore, it can be concluded that SAR and temperature rise in the exposure region, where the skinthickness is thinner than the penetration depth such as palpebra or prepuceare, are low.
CONCLUSION
We have calculated the distribution of SAR and temperature rise by using analytical transmission methods and Bio-heatequation with very-high-spatial resolution (0.01 mm). The main results obtained are described below. (1) In the case ofhigher frequency, the threshold of incident power density for warmth sensation has become lower. (2) TM wave havecaused higher temperature rise than TE wave at the same incident angle. (3) SAR and temperature rise in exposure regionof skin thickness which is thinner than the penetration depth have been low.
REFERENCES
[1] Gandhi O. et. al., “Absorption of millimeter waves by human beings and its biological implications,”IEEE Trans.Microwave Theory Tech,Vol.34, pp.228-235, 1986.
[2] Elder J. A. et. al.,U. S. Environmental Protection Agency, Research Triangle Park., NC27711, Document EPA–600/8–83–026F
[3] GUIDELINES FOR LIMITING EXPOSURE TO TIME-VARYING ELECTRIC, MAGNETIC, AND ELECTRO-MAGNETIC FIELDS (UP TO 300 GHz)., ICNIRP, 1998.
[4] IEEE recommended practice for the measurement of potentially hazardous electromagnetic fields, 2kHz to 300GHz.,ANSI/IEEE, C95.3-1992
[5] H. H. Pennes, “Analysis of tissue and arterial blood temperature in resting forearm,”J. Appl. Phys., vol.1, pp.93–122,1948.
[6] D. W. Blick, et. al., “Thresholds of microwave-evoked warmth sensations in human skin,”Bioelectromagnetics.,vol.18, pp.403–409, 1997.
[7] P. J. Riu, “A Thermal Model for Human Thresholds of Microwave–Evoked Warmth Sensations,”Bioelectromagnetics.,vol.18, pp.578–583, 1997.
4