Embed Size (px)
Citation preview

A STRUCTURED APPROACH TO RISK MANAGEMENT FOR SOUTH AFRICAN SMEs by YOLANDẾ SMIT Thesis submitted in fulfilment of the requirements for the degree Doctor of Technology: Internal Auditing in the Faculty of Business at the Cape Peninsula University of Technology Supervisor: Prof. Dr. J.A. Watkins Cape Town March 2012

ii
DECLARATION
I, Yolandé Smit, declare that the contents of this thesis represent my own
unaided work, and that the thesis has not previously been submitted for
academic examination towards any qualification. Furthermore, it
represents my own opinions and not necessarily those of the Cape
Peninsula University of Technology.
Signed Date

iii
ABSTRACT
Risk, prevalent in all organisational activities influences the achievement
or non-achievement of organisational goals. This necessitates the need
for a structured process for effective risk management.
Traditionally, risk management strategies were centred on insurance
solutions, however due to changes in the business landscape,
organisations moved towards an integrated, holistic strategy-focused risk
discipline. Small and Micro Enterprise (SME) owner-managers are
however largely ignorant about the risks faced by their enterprises. They
still respond reactively to risk by utilising risk avoidance and risk transfer
techniques. These non-structured approaches to risk impede on SME
growth and success, limiting their role to providing employment,
contributing to investment, and contributing to the economy as a whole.
In this research study a SME risk architecture framework that can be used
concurrently with corporate governance frameworks as well as the
organisation’s performance measurement system is proposed resulting in
a structured approach to managing SME risks. The proposed SME
architecture framework consists of three interrelated components, namely:
SME risk consciousness, focusing on risk sources most commonly
identified as obstacles to SME success and survival.
The SME risk management process that constitutes the steps SME
owner-managers should follow in addressing risk sources.
The SME risk management framework providing owner-managers
with a mechanism to deal with risks at all organisational levels
through effective risk planning, risk implementation and risk
evaluation processes.

iv
ACKNOWLEDGEMENTS
I wish to thank: Prof. Dr. J.A. Watkins for his expert advice, support and guidance.
Ms Ronel van der Merwe for her statistical expertise.
My colleagues in the Business Faculty for their support.
My husband who showed patience and understanding through this
long process.

v
DEDICATION
In memory of my late grandfather, Johannes Groenewald.

vi
1. TABLE OF CONTENTS
Declaration ii
Abstract iii
Acknowledgements iv
Dedication v
CHAPTER ONE: SCOPE OF THE RESEARCH SYNOPSIS 1 1.1
INTRODUCTION
3
1.2 BACKGROUND TO THE RESEARCH PROBLEM
3
1.3 RESEARCH PROBLEM STATEMENT
4
1.4
RESEARCH HYPOTHESIS, SUBQUESTIONS AND OBJECTIVES
5
1.5 1.5.1 1.5.2 1.5.2.1 1.5.2.2 1.5.3 1.5.3.1 1.5.3.2 1.5.3.3 1.5.3.4 1.5.3.5 1.5.4 1.5.4.1 1.5.4.2
CURRENT STATUS OF THE RESEARCH AREA Background The concept of risk Risk defined Risk and performance Risk management Evolution of risk management Risk management defined Risk management process SME risk elements Evolution of risk management to enterprise risk management Enterprise risk management defined Value-adding enterprise risk management Impediments to risk management
6 6 7 7 8 9 9 9
10 11
12 14 15 16
vii
1.6 1.7 1.8
RESEARCH DESIGN DELINEATION OF THE RESEARCH CONTRIBUTION OF THE RESEARCH
17
18
19
CHAPTER TWO: RISK MANAGEMENT – A LITERATURE REVIEW SYNOPSIS 20 2.1
INTRODUCTION 22
2.2
RISK DEFINED 24
2.3 2.3.1 2.3.2 2.3.3 2.3.4 2.3.5
SOURCES OF RISK Approach one Approach two Approach three Approach four Approach five
28 28 29 31 31 32
2.4 2.5 2.6 2.7 2.8 2.9 2.9.1 2.9.2 2.10 2.10.1 2.10.2 2.10.2.1 2.10.2.2 2.10.2.3 2.10.2.4
WHAT CONSTITUTES RISK MANAGEMENT ACTIVITIES? RISK MANAGEMENT OBJECTIVES DEFINING RISK MANAGEMENT DRIVERS OF OPERATIONAL RISK MANAGEMENT REQUIREMENTS FOR EFFECTIVE RISK MANAGEMENT APPROACHES TO THE ESTABLISHMENT OF A RISK MANAGEMENT FUNCTION The top-down approach The bottom-up approach THE RISK MANAGEMENT PROCESS An overview of the risk mapping process Risk management planning Defining the organisational context of risk Objectives and outcomes Identifying the risk criteria Scoping the risk identification and assessment process
35
36
37
39
41
42 42 43
44 45 48 48 49 50
50

viii
2.10.3 2.10.4 2.10.4.1 2.10.4.2 2.10.4.3 2.10.5 2.10.5.1 2.10.6 2.11 2.12
Identification of risk Risk assessment activities Risk assessment guidelines Risk assessment process Benefits forthcoming from risk assessment activities Selection and implementation of risk treatment options Risk control Monitoring, review and continuous improvement of risk actions RATIONALES FOR RISK MANAGEMENT WHICH ENHANCES VALUE CONCLUSION
50 59 60 61
71
72 73
79
82
83
CHAPTER THREE: ENTERPRISE RISK MANAGEMENT – A LITERATURE REVIEW
SYNOPSIS 85
3.1 3.2 3.2.1 3.2.2 3.3 3.4 3.5 3.5.1 3.6 3.6.1 3.6.2 3.6.3 3.6.3.1 3.6.3.2 3.6.3.3 3.6.3.4 3.6.3.5 3.6.3.6
INTRODUCTION KEY DRIVERS OF AN ERM APPROACH Operational and market forces Legislation enforcement and Code of Conduct guidance DEFINING ERM CHARACTERISTICS OF AN INTEGRATED RISK MANAGEMENT APPROACH ERM MATURITY CONTINUUM Organisations’ ERM evolvement INTEGRATED RISK MANAGEMENT Introductory notes pertaining to integrated risk management Approaches to ERM The ERM process Activity one – environment and strategy Activity two – risk identification Activity three – risk assessment and prioritising Activity four – risk mitigation and control Activity five – information and communication Activity six – monitoring, reporting and continuous improvement
87
89 89
91
93
95
96 97
98
99
100 103 106 106 107 109 110
110

ix
3.7 3.7.1 3.7.1.1 3.7.1.2 3.8 3.9 3.10 3.10.1 3.10.2 3.10.3 3.10.4 3.10.5 3.11
ENTERPRISE-WIDE RISK MANAGEMENT FRAMEWORKS The four frameworks Generic six-stage risk model Mapping organisational strategy to the four ERM frameworks VALUE-ADDING ERM IMPEDIMENTS TO EFFECTIVE ERM PROGRAMMES RISK MANAGEMENT: CASE STUDY EVIDENCE Risk practices in Danish companies Risk practices in Western European, Asian/Pacific and North American companies Risk practices in United Arab Emirates (Dubai) companies Risk practices in United Kingdom companies Risk practices in German companies THE FUTURE OF ERM APPLICATIONS
111 111 112
113
115
118
121 122
123
124 125 126
126
CHAPTER FOUR: A PERSPECTIVE OF SME RISK MANAGEMENT IN SOUTH AFRICA – A LITERATURE REVIEW
SYNOPSIS
130
4.1 4.2 4.3 4.3.1 4.3.2 4.3.3 4.4 4.4.1 4.4.2 4.4.3 4.5 4.6 4.7
INTRODUCTION DEFINING SMEs IMPORTANCE OF SMEs TO THE ECONOMY SME contribution internationally SME contribution to the African and South African economy Rationale for supporting SMEs KEY UNDERPINNINGS FOR A SUCCESSFUL ENTERPRISE Defining and measuring enterprise success Growth and sustainability Critical success factors PROBLEMS EXPERIENCED BY SMEs EXPLOITING RISK RISK MANAGEMENT FOR SMALL BUSINESS
132
133
136 137
139 142
143 144 146 149
151
160
161

x
4.8 4.9 4.10 4.11
DRIVERS OF RISK MANAGEMENT IN SMALL BUSINESS COMPONENTS OF RISK IN SMEs THE MANAGEMENT OF SME RISK RATIONALE FOR DEVELOPING A STRATEGIC RISK MANAGEMENT STRATEGY
165
167
173
174
CHAPTER FIVE: SURVEY DESIGN AND METHODOLOGY
SYNOPSIS
177
5.1 5.2 5.3 5.4 5.5 5.6 5.7 5.8 5.9
INTRODUCTION ETHICAL CONSIDERATIONS RATIONALE FOR USING A POSITIVISTIC (PHENOMENOLOGICAL) RESEARCH PARADIGM DATA COLLECTION METHOD AND SOURCES IDENTIFICATION OF TARGET POPULATION THROUGH SAMPLING SURVEY DESIGN THE TARGET POPULATION MEASUREMENT SCALES SURVEY QUESTIONNAIRES
179
180
184
186
188
190
193
194
196
CHAPTER SIX: ANALYSIS AND INTERPRETATION OF SURVEY DATA
SYNOPSIS
197
6.1 6.2 6.2.1 6.2.2 6.2.3 6.2.4
INTRODUCTION ANALYSIS METHOD Data validation and validation of survey results Data format Preliminary analysis Inferential statistics
199
200 200 201 201 201

xi
6.2.5 6.2.6 6.2.7 6.3 6.3.1 6.3.2 6.3.3 6.3.4 6.3.5 6.3.6 6.4
Technical report with graphical displays Assistance to researcher Sample ANALYSIS Reliability of the research instrument Descriptive statistics Univariate graphs Factor analysis Chi-square tests Log linear analysis DISCUSSIONS AND CONCLUSIONS
203 203 203
203 203 204 206 219 222 226
230
CHAPTER SEVEN: FORMULATION OF A STRUCTURED RISK MANAGEMENT MODEL FOR SOUTH AFRICAN SMEs SYNOPSIS 232 7.1 7.2 7.3 7.4 7.4.1 7.4.1.1 7.4.1.2 7.4.1.3 7.4.1.4 7.4.2 7.4.2.1 7.4.2.2 7.4.2.3 7.4.3 7.4.4 7.5 7.5.1 7.5.1.1 7.5.1.2 7.5.1.3 7.5.1.4 7.5.2 7.6 7.6.1
INTRODUCTION SME RISK ARCHITECTURE MODEL SME RISK CONSCIOUSNESS SME RISK MANAGEMENT PROCESS Risk context and strategy Organisational environment Defining objectives Resource requirements Risk criteria Risk decisions Risk identification Risk assessment Risk response and action planning Communication Monitoring, review and continuous improvement SME RISK MANAGEMENT FRAMEWORK SME risk management framework components Planning Implementation Results Measurement Application of the SME risk management framework HYPOTHESIS, SUBQUESTION AND OBJECTIVES RE-VISITED Subquestions
235
236
237
243 244 244 245 246 247 247 248 254 260 264 265
269 269 271 272 272 273
274
275 275

xii
7.6.2 7.6.3 7.7
Research objectives Research hypothesis FINAL CONCLUSION
277 279
279
BIBLIOGRAPHY
281
LIST OF FIGURES Figure 1:
Detailed layout of Chapter 1 - Scope of the research
Figure 1.1: Chapter 1 - Scope of the research Figure 1.2:
Core activities in the silo-based risk management process
Figure 1.3:
Evolution of the risk management process (Source: Adapted from Miccolis, Hively and Merkley, s.a.:xxiii)
Figure 2:
Detailed layout of Chapter 2 - Risk management: A literature review
Figure 2.1: Chapter 2 - Risk management positioning Figure 2.2: Main drivers of operational/business risk
(Source: Young, 2006:46) Figure 2.3: Top-down and bottom-up approaches to risk
management (Source: Young, 2006:48) Figure 2.4: The basic risk management process (Source:
Adapted DEAT, 2006:Online; and Leopoulos et al., 2006:323)
Figure 2.5: The full risk management process (Source: Adapted DEAT, 2006:Online; Leopoulos et al., 2006:323)
Figure 2.6: Graphic presentation of the likelihood and impact of potential risk (Source: Young, 2006:70)
Figure 2.7: Key risk mitigating decisions (Source: Young, 2006:90)
Figure 2.8: Overview of the risk management process (Source: Bowden et al., 2001:9)
Figure 3: Detailed layout of Chapter 3 – Enterprise risk management: A literature review
Figure 3.1: Chapter 3 – Enterprise risk management positioning
Figure 3.2: A journey to enterprise risk management (Source: Bowling et al., 2003:17; and Bowling & Rieger, 2005:25)
Figure 3.3: Measurement-driven approach to ERM (Source: Adapted from Miccolis et al.,
2 3
11
13
21 22
40
44
46
47
71
75
81
86
87
96

xiii
s.a.:xxxiii-xxxiv) Figure 3.4: Process control approach to ERM for
procurement department (Source: Miccolis et al., s.a.:xxxv)
Figure 3.5: Key objectives of the enterprise risk management process (Source: Bowling et al., 2003:18)
Figure 3.6: The enterprise risk management process (Source: Adapted from White, 1995:36; and Funston, 2003:61)
Figure 4: Detailed layout of Chapter 4 - A perspective of SME risk management in South Africa: A literature review
Figure 4.1: Chapter 4 - Risk management in SMEs’ positioning
Figure 4.2: Components of SMEs’ total risk as per Wynant and Hatch (Source: Adapted from St-Pierre & Bahri, 2006:550)
Figure 4.3: Components of SMEs’ total risk as per Twarabimenye (Source: Adapted from St-Pierre & Bahri, 2006:550)
Figure 4.4: Components of SMEs’ total risk as per Carlton (Source: Adapted from St-Pierre & Bahri, 2006:551)
Figure 4.5: Cotner and Fletcher’s total risk composition (Source: Adapted from St-Pierre & Bahri, 2006:551)
Figure 5: Detailed layout of Chapter 5 - Survey design and methodology
Figure 5.1: Chapter 5 - Survey design and methodology positioning
Figure 5.2: Continuum of participants’ consent (Source: Saunders et al., 2000:134)
Figure 6: Detailed layout of Chapter 6 - Analysis and interpretation of survey data
Figure 6.1: Chapter 6 - Analysis of results positioning Figure 6.2: Annual turnover Figure 6.3: Number of permanent employees Figure 6.4: Type of entity Figure 6.5: Age of business Figure 6.6: Owner qualifications Figure 6.7: Executive management qualifications Figure 6.8: Support received from external consultants Figure 6.9: History of financial problems Figure 6.10: Reasons for experiencing financial problems Figure 6.11: Business objectives and strategies clearly
defined Figure 6.12: Importance of type of risk Figure 6.13: Understanding of risks Figure 6.14: Extent to which risk is discussed
101
102
104
105
131
132
168
169
170
171
178
179
181
198 199 206 207 207 208 209 209 210 211 211
212 213 213 214

xiv
Figure 6.15: Interest in a risk framework Figure 6.16: Motivation to implement a risk framework Figure 6.17: Status of risk management framework Figure 6.18: Functions where formal risk identification
takes place Figure 6.19: Actions engaged in when risks are identified Figure 6.20: Way of implementing risk management
activities Figure 6.21: Obstacles to implementing a risk management
framework Figure 6.22: Feedback of study Figure 6.23: Comparison between structured risk
management and turnover of SME Figure 6.24: Comparison between structured risk
management and number of permanent employees
Figure 6.25: Comparison between structured risk management and type of entity
Figure 6.26: Comparison between structured risk management and qualification of owner
Figure 6.27: Comparison between structured risk management and external support to management areas
Figure 6.28: Comparison between structured risk management and clearly defined objectives and strategies
Figure 6.29: Comparison between structured risk management and understanding of risk
Figure 6.30: Comparison between structured risk management and formal risk assessment
Figure 6.31: Comparison between structured risk management and improvement of internal controls
Figure 6.32: Comparison between structured risk management and engagement of identified activity
Figure 6.33: Comparison between structured risk management and obstacles to implementing
Figure 6.34: Comparison between structured risk management and intellectual capital
Figure 6.35: Comparison between structured risk management and cost
Figure 6.36: Comparison between structured risk management and skills
Figure 6.37: Comparison between structured risk management and the importance of management risk
Figure 6.38: Comparison between structured risk management and commercial risk
Figure 7: Detailed layout of Chapter 7 - Formulation of a
215 215 216
216 217
217
218 219
345
346
347
348
350
351
352
355
356
357
358
359
360
361
362
363

xv
structured risk management model for South African SMEs
Figure 7.1: Chapter 7 - Formulation of a structured risk management model for South African SMEs’ positioning
Figure 7.2: Holistic depiction of the SME risk architecture model
Figure 7.3: SME risk consciousnesses Figure 7.4: Areas or processes of importance Figure 7.5: SME risk elements Figure 7.6: The SME risk management process Figure 7.7: Risk context and strategy subprocesses Figure 7.8: The risk decision process Figure 7.9: Risk identification process flow Figure 7.10: The risk assessment process Figure 7.11: Schematic depiction of risk response and
action planning process Figure 7.12: Placement of the monitoring, review and
continuous improvement activities in the organisational environment and risk management process
Figure 7.13: The SME risk management framework Figure 7.14: The risk management framework components
234
235
236 237 238 242 243 244 248 253 254
263
268 269 270
LIST OF TABLES Table 2.1: Examples of pure and speculative risks
(Source: Waring & Glendon, 1998 cited by DEAT, 2006:Online)
Table 2.2: The interchangeability of various terms (Source: Bennett, 2005 cited by DEAT, 2006:Online)
Table 2.3: A risk evaluation matrix table scoring 2 functions (Source: DEAT, 2006:Online)
Table 2.4: A risk evaluation scoring categorisation example (Source: DEAT, 2006:Online)
Table 2.5: Risk assessment framework incorporating a heat map (Source: Young, 2006:68)
Table 2.6: Comparison of the risk control terminology (Source: Adapted DEAT, 2006:Online)
Table 3.1: Risk control terms used (Source: DEAT, 2006:Online)
Table 4.1: Criteria for different SME categories in retail sector (Source: Adapted from Von Broembsen, 2003:Online; South Africa, 1996:Online; and South Africa, 2004:Online)
29
65
66
67
68
73
109
134

xvi
Table 4.2: Contribution to employment by firm size (Source: Berry et al., 2002:25)
Table 4.3: Contribution to GDP by firm size (Source: Berry et al., 2002:28)
Table 4.4: The total risk components of SMEs (Source: Adapted from St-Pierre & Bahri, 2006:551)
Table 5.1: Impact of various factors on purposive sampling (Source: Adapted Saunders et al., 2000:171)
Table 6.1: Cronbach’s Alpha coefficients for survey measuring instrument
Table 6.2: Descriptive statistics for all the variables Table 6.3: Descriptive statistics for all variables
(mean, median, standard deviation and range)
Table 6.4: Original variables and corresponding factor loadings from the rotated factor pattern
Table 6.5: Contingency table – presence of structured/non-structured risk management approach compared to the annual turnover of SME
Table 6.6: Chi-square test for comparisons Table 6.7: Contingency table - presence of
structured/non-structured risk management approach compared to the number of permanent employees of SME
Table 6.8: Chi-square test for comparisons Table 6.9: Contingency table - presence of
structured/non-structured risk management approach compared to entity type
Table 6.10: Chi-square test for comparisons Table 6.11: Contingency table – presence of
structured/non-structured risk management approach compared to SME owner qualification
Table 6.12: Chi-square test for comparisons Table 6.13: Contingency table – presence of
structured/non-structured risk management approach compared to external support at marketing management (MM)
Table 6.14: Chi-square test for comparisons Table 6.15: Contingency table – presence of
structured/non-structured risk management approach compared to external support at human resource
management (HRM)
140
141
172
189
319 322
205 220
344 344 345 345 346 346 347 347 348 348 349

xvii
Table 6.16: Chi-square test for comparisons Table 6.17: Contingency table – presence of
structured/non-structured risk management approach compared to external support at public relation management (PRM)
Table 6.18: Chi-square test for comparisons Table 6.19: Contingency table – presence of
structured/non-structured risk management approach compared to whether business objectives and strategies are clearly defined
Table 6.20: Chi-square test for comparisons Table 6.21: Contingency table – presence of
structured/non-structured risk management approach compared to understanding of risk
Table 6.22: Chi-square test for comparisons Table 6.23: Contingency table – presence of
structured/non-structured risk management approach compared to formal risk assessment in finance
Table 6.24: Chi-square test for comparisons Table 6.25: Contingency table – presence of
structured/non-structured risk management approach compared to formal risk assessment in human resources
Table 6.26: Chi-square test for comparisons Table 6.27: Contingency table – presence of
structured/non-structured risk management approach compared to formal risk assessment in operational processes
Table 6.28: Chi-square test for comparisons Table 6.29: Contingency table – presence of
structured/non-structured risk management approach compared to improvement of internal controls
Table 6.30: Chi-square test for comparisons Table 6.31: Contingency table – presence of
structured/non-structured risk management approach compared to engagement in the identified activity
Table 6.32: Chi-square test for comparisons Table 6.33: Contingency table – presence of
structured/non-structured risk management approach compared to experiencing of obstacles
Table 6.34: Chi-square test for comparisons
349 349 350 351 351 352 352 353 353 353 354 354 354 355 356 356 357 357 358

xviii
Table 6.35: Contingency table – presence of structured/non-structured risk management approach compared to lack of intellectual capital
Table 6.36: Chi-square test for comparisons Table 6.37: Contingency table – presence of
structured/non-structured risk management approach compared to cost as an obstacle
Table 6.38: Chi-square test for comparisons Table 6.39: Contingency table – presence of
structured/non-structured risk management approach compared to lack of skills as an obstacle
Table 6.40: Chi-square test for comparisons Table 6.41: Contingency table – presence of
structured/non-structured risk management approach compared to
importance of management risk
Table 6.42: Chi-square test for comparisons Table 6.43: Contingency table - presence of
structured/non-structured risk management approach compared to
importance of commercial risk
Table 6.44: Chi-square test for comparisons Table 6.45: Variables that were taken up in the log
linear analysis
Table 6.46: Results of the log linear analysis Table 6.47: Maximum likelihood (analysis of variance) Table 7.1: An example of a risk history database Table 7.2: An example of a risk register - level 1 Table 7.3: Table 7.4:
Risk volatility calculation Risk register - level 2
358 359 359 360 360 361 361 362 362 363 227 228 229 250 251 255 258
APPENDIXES
Appendix A: Survey questionnaire
298
Appendix B: Descriptive statistics for each variable
305
Appendix C: Cronbach Alpha coefficients
316
Appendix C1: Table 6.1: Cronbach’s Alpha coefficient for survey measuring instrument
318
Appendix C2: Table 6.2: Descriptive statistics for all the

xix
variables
321
Appendix D: Univariate statistics
327
Appendix E: Appendix F:
Factor analysis Significant associations between dependent variable and response variables
331 344
Appendix G: Contingency tables for new1 vs rest of variables
364
Appendix H: Log linear analysis
393

20
CHAPTER 1
SCOPE OF THE RESEARCH SYNOPSIS
Risk, prevalent in all organisational activities impacts directly on enterprise
performance, thus necessitating the need to manage it. The importance of
modern risk management, which entails a holistic approach, is widely
acknowledged in all organisational spheres, however a plethora of
obstacles impede on the ability of Small and Micro Enterprises (SME’s) to
implement enterprise risk management principles from a holistic
perspective. As a result, SMEs follow an unstructured approach to risk
management, which in turn impacts negatively on the risk efficiency of the
SME industry. To facilitate SME business success, particularly taking into
account the valued contribution of SME’s to local economic development,
a structured risk management model is proposed in this research study
that would notably reduce the risk exposure of SMEs, thus ensuring
sustainability and competitiveness.
The formulation of a structured risk management model will be based on
analogies drawn from case study research where SME owner-managers in
the retail sector in the Western Cape, South Africa, were selected as the
unit of analysis. Questionnaires will be used to gather information from
which it will be analysed using descriptive and inferential statistics.
The content of Chapter 1, along with the relative positioning of the various
topics which will be addressed therein, is graphically depicted in Figure 1.

21
INTRODUCTION BACKGROUND TO THE RESEARCH PROBLEM
RESEARCH PROBLEM STATEMENT
RESEARCH HYPOTHESIS, SUBQUESTIONS AND OBJECTIVES
CURRENT STATUS OF THE RESEARCH AREA: Background The concept of risk
o Risk defined o Risk and performance
Risk management o Evolution of risk
management o Risk management
defined o Risk management
process o SME risk elements o Evolution of risk
management to enterprise risk management
Enterprise risk management defined o Value-adding enterprise
risk management o Impediments to risk
management
RESEARCH DESIGN
DELINEATION OF THE RESEARCH
CONTRIBUTION OF THE RESEARCH
Figure 1: Detailed layout of Chapter 1 - Scope of the research.

22
CHAPTER ONE SCOPE OF THE RESEARCH 1.1 INTRODUCTION
The analytical process, which will be followed within the ambit of this
doctoral thesis, is graphically depicted in Figure 1.1, placing the chapters
in context with the overall thesis objectives, and furthermore indicating the
relative positioning of this chapter.
Figure 1.1: Chapter 1 - Scope of the research.
1.2 BACKGROUND TO THE RESEARCH PROBLEM
South African SME owner-managers are not knowledgeable about
assessing enterprises’ risk factors impacting on their business
CHAPTER ONE
Scope of the research
CHAPTER TWO
Risk management – A literature review
CHAPTER THREE
Enterprise risk management – A literature review
CHAPTER FOUR
A perspective of SME risk management in South Africa
– A literature review
CHAPTER FIVE
Survey design and methodology
CHAPTER SIX
Analysis and interpretation of survey data
CHAPTER SEVEN
Formulation of a structured risk management model for South
African SMEs

23
environments. They do not actively engage in prioritising risk factors
according to the risk impact and probability, resulting in inefficient control
actions taken to manage these risks. The realisation of these risks may
result in the occurrence of negative consequences for the affected
enterprise as reflected in the high failure rate of between 70% and 80% of
South African SMEs (Van Eeden et al., 20031 cited by Mutezo, 2005:37).
The SME contribution potential to the local economic development should
not be trivialised, as studies have shown that SMEs, in particular in
Western Europe and Japan, are a main contributor to local economic
development. The same maxim should hold true of South African SMEs,
however research has shown that SME policies as dictated by policy
makers and the reality of South African SMEs, do not map to each other.
South African SMEs are very heterogeneous and require more specific
organisational related support than the generic support which are provided
at present (Kesper, 2000:1). The facilitation of effective SME policy
necessitates the collection and analysis of SME information to counter
decision-making based on unobjective and unreliable information
regarding SME characteristics (Berry, 2002:14).
The development of a flexible integrated risk management model
structured to the needs of SMEs will aid the South African policy makers
and SME enterprises, in the identification and management of SME risk
characteristics. Such a dispensation would culminate in improved SME
management, as well as in the collection and analysis of SME-specific
information to aid in the creation of more effective SME policies.
1.3 RESEARCH PROBLEM STATEMENT
Against the above background the research problem to be researched
within the ambit of this thesis reads as follows: ‘No structured approach to
1 Van Eeden, S., Viviers, S. & Venter, D. 2003. A comparative study of selected problems encountered by small businesses in the Nelson Mandela, Cape Town and Egoli metropoles. Management Dynamics, 12(3):13-23.

24
risk management exists for South African SMEs in the retail trade,
adversely impacting on the risk efficiency of the industry’.
1.4 RESEARCH HYPOTHESIS, SUBQUESTIONS AND OBJECTIVES
A hypothesis-generating approach first mooted by Glaser and Strauss
(1967:39-40), will be used in this research study. The following research
hypothesis (Collis & Hussey, 2003:231), the latter defined by Silverman
(1993:1), as a ‘testable proposition’, is derived from the research problem:
H0 A structured approach to risk management for South African SMEs
would significantly limit their risk exposure, and improve the risk
efficiency of the industry.
The investigative subquestions to be researched in support of the stated
research hypothesis reads as follows:
Does a general absence of risk management knowledge by SME
owners, adversely impact on the risk efficiency of SMEs?
To what extent can a small organisation like an SME successfully
adopt a structured approach to risk management?
How can control mechanisms for risk exposure be mapped into a
structured approach to risk management, to effectively control risks of
SMEs?
Can a structured approach to risk management, which normally
encompasses complex mechanisms, be formulated so as to have an
effective application within SMEs in terms of simplicity and ease of
application?
How can a structured approach to risk management be effectively
implemented within South African SMEs, to the benefit of the industry
as a whole?
The following research objectives are set to be achieved by the results
obtained from the investigative questions:
To formulate a structured risk management model specifically
aimed at reducing the risks associated with South African SMEs.

25
To determine the level of risk knowledge of South African SME
owner-managers.
To determine the current use of risk management models by SME
owner-managers, and the adequacy of the current risk methodology
applied.
To develop a simplistic risk management model.
To determine the implementation viability of the proposed
formulated risk management model for South African SMEs, and
associated potential benefits, which can be gleaned from such an
application.
1.5 CURRENT STATUS OF THE RESEARCH AREA
From a literature review perspective, the focus in this thesis will be
directed at risk management structures applicable to SMEs both locally
and abroad. This analysis will include a literature review of the concept of
risk management from an empirical perspective within the South African
SME context. To provide the reader with a holistic perspective of the
research and aid in the understanding of the primary theme of the thesis, a
brief overview of the status of the research area, is provided.
1.5.1 Background
The SME contribution to the South African economy, excluding medium
enterprises, can roughly be estimated at 20% of the Gross Domestic
Product (GDP) (Abedian et al., 20012 cited by Berry, Von Blottnitz,
Cassim, Kesper, Rajaratnam & Van Seventer, 2002:28). Although
medium and large enterprises dominate the South African economy based
on their GDP contributions, SMEs have a pivotal role to play in generating
employment and the upgrading of human capital (Berry et al., 2002:4).
2 Abedian, I., Falkena, H., Coovadia, C., Davel, G., Madungandaba, J., Masilela, E. & Rees, S. 2001. SME’s Access to Finance in South Africa – A supply side regulatory review. Policy Board for Financial Services and Regulation. [Online]. www.ijr.org.za/publications/pdfs/TA_2005_complete.pdf

26
The Western Cape manufacturing sector is the third largest contributor to
the South African manufacturing output and employment, where SMEs
comprise the majority of manufacturing firms. Although these enterprises
have a positive outlook on economic conditions, research has shown that
increased sales amongst 65% of these organisations, did not map to
significantly increased employment opportunities. This is attributable to
unfavourable macroeconomic conditions, as well as internal factors such
as inadequate internal operations (Kesper, 2000:13-15).
Research has furthermore shown the lack of business skills amongst
entrepreneurs as a shortcoming, which maps to the requirement of
education and training within SMEs, also considered as factors inhibiting
SME growth (Berry et al., 2002:65). The lack of general business acumen
of SME owner-managers necessitates the need for the development and
utilisation of a managerial mechanism to manage the occurrence and
impact of risk events within SMEs, thus contributing towards SME
sustainability.
1.5.2 The concept of risk
To provide the reader with insight into the primary theme of the thesis, the
concept of risk will be discussed by providing a definition of risk and
furthermore elaborating upon the concepts of risk and performance.
1.5.2.1 Risk defined
Various definitions of risk exist, each with a different perspective based on
the industry to which it is being applied. Insurance-based industries define
risk as stated by Valsamakis, Vivian and Du Toit (2000:35), as: “A
deviation from the expected value. It implies the presence of uncertainty,
where there may be uncertainty as to the occurrence of an event
producing a loss, and uncertainty as regards the outcome of the event;
where the degree of risk is interpreted with reference to the degree of

27
variability and not with reference to the frequency with which the event will
occur or to the probability that it will display a particular outcome”.
The following business-focused definition of risk is provided by Andersen
and Terp (2006:31): “Risk has been defined as internal and external
uncertainties, events, or circumstances that the company must understand
and manage effectively as it executes its strategies to achieve business
objectives and create shareholder value”. From the above two definitions,
the obvious analogy to be drawn is that the concept of uncertainty is
embedded in risk, where the prevalence of risk impacts on the
achievement of business objectives.
1.5.2.2 Risk and performance
There are clear tangent planes between risk and performance as risk
impacts directly on the degree of performance achieved. Performance can
be defined through the measurement of effectiveness and efficiency
(Anthony, 19653 cited by Ritchie & Brindley, 2007:306). ‘Efficiency’ refers
to the input-output consumption ratio, while ‘effectiveness’ refers to the
achievement of the planned outcome. A more balanced view of
performance can be determined through the use of the Balanced
Scorecard (Niven, 2002:1-24), which incorporates the financial
perspective, internal perspective, customer perspective and innovative and
learning perspective of an organisation, with each of these four spheres
contributing to performance measurement.
In the context of business decisions, increased risk is traditionally
perceived to result in increased returns. Risk as a result impacts on the
effectiveness and efficiency of operations and not solely on catastrophic
events such as total business failure. The importance of managing risk
and thereby the achievement of organisational performance cannot be
underestimated.
3 Anthony, R.N. 1965. Planning and Control Systems: A Framework for Analysis. Harvard University School of Business Administration, Division of Research, Boston.

28
1.5.3 Risk management
Risk management can be evaluated in terms of the evolution of the
concept, providing definitions thereof, describing the risk management
process, and identification of SME risk elements.
1.5.3.1 Evolution of risk management
The evolution of risk management was mooted by the recognition of
management as a profession (Kloman, 19844 cited by Valsamakis, Vivian
& Du Toit, 1996:13). Management is tasked with the responsibility of
protecting and securing the income-generating assets of an organisation
(Valsamakis et al., 1996:13-14). This entails the development of a
structured function in terms of which an organisational risk strategy is set,
and risk managers partake through a formal mechanism to deal with
change.
1.5.3.2 Risk management defined
Risk management, as it relates to a service business, is defined by
Hollman and Forrest (1991:49-50) as: “The protection of a firm’s assets
and profits. It is a systematic method of using a firm’s resources –
physical, financial, and human capital – to realise certain objectives
concerning pure loss exposures. Pure loss is one where there is a chance
of loss, but no chance of gain”.
From the above the analogy can be drawn that risk management is a
structured approach that utilises various techniques to manage an
organisation’s exposure. Such a function is relatively easy to perform by
executive management, usually the owner-manager, within the context of
SMEs. As a rule, the SME executive manager is more actively involved in
the process and the implementation of policies (in contrast with larger
4 Kloman, H.F. 1984. Risk management: 1990 and beyond. Risk Management, March:33.

29
organisations), and has a holistic perspective of risk facing the
organisation (Watt, 2007:35).
1.5.3.3 Risk management process
Two fundamental activities, namely the control of risk and the managing of
risk outcome underpin the risk management process. Each of these
fundamental processes encompass a series of activities that may vary in
complexity. The risk management process, determined by a departmental
risk strategy, consists of the following subprocesses (Bowden, Lane &
Martin, 2001:8-15; and Valsamakis et al., 2000:25-27):
Step 1 - Risk identification: Risk identification involves the
comprehensive identification of risks that can impact on the
organisation’s subprocesses.
Step 2 - Risk evaluation: This is the core process of risk
management. During risk evaluation, the level of risk is quantified
by determining the frequency with which events will occur and the
impact of the consequences. Step 3 - Risk control: Risk treatment measures are evaluated or
designed by management and implemented, to control the impact
of the risk. Risk identification is usually executed by management,
while the implementation processes are usually executed by staff.
Risk control measures include:
Risk transferring or risk sharing, where risks are transferred or
shared with third parties, for example insurance.
Risk reduction that limits the occurrence of risk or the impact of
the risk.
Risk acceptance by the organisation as a result of cost-benefit
analysis or other factors.
Step 4 - Risk monitoring: This step entails the monitoring and
evaluation of the effectiveness of the control mechanisms employed
by the organisation.

30
Due to the evolving nature of risk, business processes and the business
environment, the risk management process should be reviewed and
adapted continuously to safeguard the organisation’s resources, and
comply with the defined risk strategy. A schematical depiction of the core
activities in the risk management process is provided in Figure 1.2 below.
Figure 1.2: Core activities in the silo-based risk management process.
1.5.3.4 SME risk elements
In South Africa, SMEs experience difficulty in securing finance because of
the high level of risk and insufficient level of return associated with the
industry (Pretorius et al., 20035 cited by St-Pierre & Bahri, 2006:547).
Clear tangent planes exist if compared with other developing countries
such as Malaysia, where SMEs face similar obstacles (Rahman,
Mahmood & Rahman, 2003:Online; and St-Pierre & Bahri, 2006:547).
5 Pretorius, M., Shaw, G. & Van Vuuren, J. 2003. Business plans in bank decision-making when financing new ventures. Paper presented at 48th World Conference International Council for Small Business, Belfast.
DE
PA
RTM
EN
TAL/P
RO
CE
SS
RIS
K S
TRA
TEG
Y
CO
NTIN
UO
US
IMP
RO
VE
ME
NT
RISK IDENTIFICATION
RISK EVALUATION
RISK CONTROL
RISK MONITORING

31
A small business characteristic impacting on risk and subsequently on
management practices employed, is the difficulty experienced in
separating ‘owner-manager property’ from ‘business property’. Other
complex SME elements embedded in typical business operations such as
variable, not easily identifiable and unique owner-manager objectives,
further influence the risk composition (LeCornu, McMahon, Forsaith &
Stanger, 1996:1-14; Naffziger, Hornsby & Kuratko, 1994:29-42; and Julien
& Marchesnay, 19966 cited by St-Pierre & Bahri, 2006:550).
The traditional approach to SME risk is biased in favouring the lender’s
financial-based risk analysis. Modern risk measurement matrixes
recognise the multifaceted nature of the SMEs’ total risk. Various authors
such as Carlton (1999:Online), Cotner and Fletcher (2000:27-33), and St-
Pierre (20047) cited by St-Pierre and Bahri (2006:550-551), recognise that
total risk constitutes ‘financial risk’ as well as ‘business risk’, with business
risk comprising risk categories such as management risk (inadequate
management knowledge, etc.), commercial risk (client risk, market
importance, etc.) and technological risk (research and development
activities, use of technology, etc.).
1.5.3.5 Evolution of risk management to enterprise risk management
Historically, risk has been viewed from an insurance perspective, with
limited integration with other managerial functions. This silo approach to
risk is questioned by Strutt (19898) and Kloman (19879), cited by
Valsamakis et al. (2000:18), favouring a more holistic risk management
approach. The increase in global competition and the volatility of
international markets have elevated risk management to the forefront of
business thinking. An integrated risk management approach or Enterprise
6 Julien, P.A. & Marchesnay, M. 1996. L’entrepreneuriat. Ếconomica. 7 St-Pierre, J. 2004. La gestion du risqué: comment améliorer le financement des PME et favoriser leur développement. Presses de l’Université du Québec, Quebec. 8 Strutt, R.S.G. 1989. The reality of risk management. Paper presented at the Institute of Risk Management AIRMIC Conference, April:3-6. 9 Kloman, H.R. 1987. Risk management … by many other names. Risk Management, June:56-62.

32
Risk Management (ERM) approach is suggested by Valsamakis et al.
(2000:21), that is “comprehensive, inclusive and proactive”.
The evolution from ‘risk management’ to ‘ERM’ is intended to transform
silo-based risk management practices to a cross-functional risk
management activity, where risk identification, evaluation and
management impact on the achievement of an organisation’s objectives.
Integrated risk management lends itself to a coordinated approach in
managing strategic and operational-tactical processes. As a result, the
management of risk is not focused purely on the management of negative
events, but also on the realisation of opportunities (Henriksen &
Uhlenfeldt, 2006:122-126).
Figure 1.3 below provides a schematic depiction of the evolution of the risk
management process.
Figure 1.3: Evolution of the risk management process (Source: Adapted from Miccolis,
Hively and Merkley, s.a.:xxiii).
Past
Current
RISK
SCO
PE
Traditional insurance (financial focus)
Process risk management (silo approach)
Enterprise risk management: - Strategic - Operational - Financial
RISK APPROACH

33
1.5.4 Enterprise risk management defined
The Committee of Sponsoring Organisations of the Treadway Commission
(COSO, 2004:Online), defines ERM as follows: “Enterprise risk
management is a process, effected by an entity’s board of directors,
management and other personnel, applied in strategy setting and across
the enterprise, designed to identify potential events that may affect the
entity, and manage risk to be within its risk appetite, to provide reasonable
assurance regarding the achievement of entity objectives”.
A simplified definition of ERM is provided by Miccolis et al. (S.a.:xxii),
defining ERM as: “A rigorous and coordinated approach to assessing and
responding to all risks that affect the achievement of an organization’s
strategic and financial objectives. This includes both upside and downside
risks”.
A broad definition of ERM focuses on the achievement of business
objectives through the participation of all stakeholders at every level of the
organisation. It should be noted that ERM constitutes multidirectional,
repetitive processes, where activities influence one another with the
primary differentiating factor, the focus on strategy.
Strategy-focused integrated risk management frameworks such as
DeLoach’s enterprise-wide risk management framework (DeLoach,
2000:213), COSO’s enterprise risk management framework (COSO,
2004:Online), FERMA’s risk management standard (FERMA, 2003:Online)
and the Australian/New Zealand risk management framework (AS/NZS
4360, 2004:Online), incorporate a holistic perspective on the management
of the total risk portfolio of an organisation (Henriksen & Uhlenfeldt,
2006:111-112). A generic six-stage enterprise risk management
framework can be extrapolated from the abovementioned frameworks,
which maps to the risk management process as described in Paragraph
1.5.3.3, taking into consideration the strategic step of objective-setting as
the starting point in the process. Within the context and application of

34
ERM, top management’s first step is to develop the company’s strategy
and objectives, driven by its mission and vision. It is of interest to note that
the differentiating factor ‘strategy’, should not be limited to the
implementation of strategy, but should actively include strategy
formulation, which incorporates the two-sided perspective of risk focusing
on negative and positive risk occurrences (Henriksen & Uhlenfeldt,
2006:112-124). As a result, prior to undertaking risk management
activities, the organisational risk philosophy and risk tolerance should be
established in order to formulate an organisational risk strategy for the
management of risk. The organisational risk philosophy is based on the
organisational goals and the shareholders’ or owners’ expectations. Risk
tolerance in turn is based on the financial resources the organisation has
to its disposal, as well as the amount the organisation is willing to lose
(Banks & Dunn, 2003:73).
Risk taking is implicit in all business activities. Without calculated risk
taking, business stagnation occurs as opportunities such as market
expansion and product innovation are curtailed. As a result,
entrepreneurs will favour a risk approach that focuses on and optimises
positive outcomes, while managing potential exposure (Watt, 2007:36-37).
1.5.4.1 Value-adding enterprise risk management
By embedding an ERM system into an organisations’ strategic and
operational processes, risk can be managed from a holistic and systematic
perspective. Such an ERM approach would enable organisations to focus
on positive risk occurrences that foster sustainable growth through
improved decision-making, and proactive risk management. An integrated
risk management practice would enhance the organisation’s flexibility,
providing a competitive advantage over competitors who do not utilise
such a framework (Schrøder, 2006:65-66).
The incorporation of ERM practices within an organisation, provides
managers with a common language to define and manage risk.

35
Furthermore, an effective risk assessment process and framework would
support the organisation’s strategies and risk acceptance by creating an
optimum balance between risk, control and growth, eliminating
unacceptable risks and strategic errors (DeLoach, 2000:208).
For large and small organisations alike, ERM entails the development of
organisational objectives, the identification of risks which may impact on
the defined objectives, and the development of a process to manage the
risk in an organisation. Small organisations have an advantage as far as
ERM is concerned in that it is easier for management to be actively
involved in ERM processes, than it would be in larger organisations. The
development and implementation of an ERM system in a small
organisation’s processes would therefore be easier, especially if the
following value-adding capabilities (Watt, 2007:33-40) of small
organisations’ ERM practices are promoted:
The organisation’s focus is directed at its mission and vision
without straying.
The organisation complies with best practices.
A reduction in insurance premiums can be achieved.
Avoid the overmanagement of risks, i.e. risk should be managed in
a cost-effective manner.
1.5.4.2 Impediments to risk management
The potential obstacles impacting on the effective implementation of ERM
are elaborated upon below:
Organisational culture i.e. the attitude of employees towards ERM is
an obstacle to effective ERM implementation (Truslow,
2003:Online; and Miccolis et al., s.a.:5).
The priority of senior management is identified by Merkley
(2001:25-27) as an obstacle impacting effective ERM
implementation. Senior managers should show active support of
ERM and drive the process (Chapman, 2001:30-37).

36
The reluctance to discuss sensitive issues on an organisation-wide
basis further impacts on the success of an ERM implementation
(Funston, 2003:59-63).
Inherent complexities embedded in the ERM process necessitate
the need for the allocation of the process to a specific
organisational unit to ensure ERM continuity and consistency
(Nakada & Tange, 2003:30-31).
A lack of ERM tools, formulised processes and risk understanding
are obstacles to effective and efficient ERM implementation
(Miccolis et al., s.a.:5).
1.6 RESEARCH DESIGN
In this thesis the concept of applied research will be undertaken, as the
concept refers to research, which has been designed to apply its findings
to solving a specific, existing problem. Furthermore, the research will be
undertaken in the social world, as social science has to do with how things
are and why (Babbie, 2005:12).
The research will furthermore have an empirical/theoretical underpinning.
In this respect, empirical is defined as ‘based on, or guided by the results
of observation’, while theoretical is defined as ‘contemplative of the mind
or intellectual faculties’ (Remenyi, Williams, Money & Swartz, 2002:31;
and Leedy & Ormrod, 2001:101).
This dualistic approach (empirical/theoretical) was specifically selected
since empirical research in business and management requires intensive
interaction with people, while theoretical research in business and
management requires an intensive textual investigation (Leedy & Ormrod,
2001:101).
This empirical/theoretical research approach would by its very nature call
for the application of methodological triangulation. In this respect, both a
positivistic (quantitative) and phenomenological (qualitative) research

37
paradigms will apply (Leedy & Ormrod, 2001:102). This approach is
supported by Babbie (2005:25), who expresses the opinion that “…
recognizing the distinction between qualitative and quantitative research
doesn’t mean that you must identify your research activities with one to the
exclusion of the other. A complete understanding of a topic often requires
both techniques”.
Case study research will form the primary research method since a
contemporary phenomenon (SME risk) within its real life context will be
examined where the boundaries between phenomenon and context are
not clearly defined. Yin (1994:1), states that case study research is
especially applicable to the social sciences as well as professional fields
such as the management sciences. More specific, an experimental case
study will be conducted as the proposed research will examine difficulties
associated with implementing new procedures and techniques in
organisations and evaluating the benefits (Collis & Hussey, 2003:68-70).
The research unit of analysis (Yin, 1994:20-27), will be owner-managers of
SMEs, drawn from a sample (Collis & Hussey, 2003:155), made up of
members (population) of owner-managers of SMEs in the Western Cape
forming the sampling frame (Vogt, 1993:202). Furthermore, purposive
sampling (Cooper & Emory, 1995:228), will serve as the sampling method,
in terms of which 158 SME owner-managers will be selected. Data
collection will be via questionnaires executed within the ambit of a survey
(Remenyi et al., 2002:290). Data analysis will be conducted using
descriptive and inferential statistics (Cooper & Schindler, 2006:463-468,
492).
1.7 DELINEATION OF THE RESEARCH
The research in this thesis will be limited to SME’s in the South African
retail trade. Furthermore, the research will only extend to include owner-
managers of SMEs in the Western Cape.

38
1.8 CONTRIBUTION OF THE RESEARCH
The output of this research will culminate in the formulation of a structured
risk management model for SMEs. This model will enable SME owner-
managers to recognise the various risks they are subjected to from day to
day and assist them in responding appropriately to these risks.
Furthermore, the proposed risk model has the potential to enhance policy-
makers understanding of SME risk and to aid in the formulation of more
effective SME policies. Ultimately, through the formulation of a structured
risk management model, the contribution of the research will limit the
number of SMEs that fail in South Africa as a result of poor risk
management.

39
CHAPTER 2
RISK MANAGEMENT – A LITERATURE REVIEW SYNOPSIS
Uncertainty gives rise to risk as it influences the achievement or non-
achievement of organisational goals. This necessitates the need for a
structured organisational process in terms of which risks are effectively
managed. SME management in general should be tasked with identifying
the appropriate approach to risk classification and assessment for
achieving optimal results.
A well-developed risk management process will usually comprise risk
planning, which forms the foundation of the risk management process,
where goals and objectives are determined to be used as reference in the
measurement of the adequacy of the risk process. This is followed by a
hybrid of qualitative and quantitative risk identification techniques,
identifying key risks usually sourced through the use of a consultative
approach in terms of which input is gleaned from as many stakeholders as
possible. Risk identification is followed by risk assessment, where risks
can be evaluated at various organisational levels according to the
frequency and impact of risk occurrence. This can assist with the
prioritisation of risk factors to determine the organisational importance
thereof.
Selecting the risk mitigation options encompasses the next step in the risk
management process. By following the comprehensive risk process,
informed decisions can be taken to engage in various risk options such as
risk avoidance, risk acceptance, risk transfer and risk mitigation. The final
step of the risk management process includes risk monitoring, whereby
the effectiveness of the process is measured within the boundaries
determined by management, while taking into account the constantly
changing internal and external organisational environment and the
resulting effect on organisational activities.

40
Greater transparency in organisational activities, increased risk
awareness, corporate accountability, and the safeguarding of
organisational assets are all rationales for engaging in risk management.
Traditional risk management approaches are however inefficient due to
their segmented approach to risk without regard to the tangent planes
between the various risk elements. This necessitates the need for the
development and application of an all-inclusive enterprise risk
management approach.
The content of Chapter 2, along with the relative positioning of the topics,
is graphically depicted in Figure 2.
INTRODUCTION
RISK DEFINED
SOURCES OF RISK Approach one Approach two Approach three Approach four Approach five
WHAT CONSTITUTES RISK MANAGEMENT ACTIVITIES?
RISK MANAGEMENT OBJECTIVES
DEFINING RISK MANAGEMENT
DRIVERS OF OPERATIONAL RISK MANAGEMENT
APPROACHES TO THE ESTABLISHMENT OF A RISK MANAGEMENT FUNCTION The top-down approach The bottom-up approach
REQUIREMENTS FOR EFFECTIVE RISK MANAGEMENT
THE RISK MANAGEMENT PROCESS An overview of the risk mapping process Risk management planning
o Defining the organisational context of risk o Objectives and outcomes o Identifying the risk criteria o Scoping the risk identification and
assessment process Identification of risk Risk assessment activities
o Risk assessment guidelines o Risk assessment process o Benefits forthcoming from risk
assessment activities Selection and implementation of risk
treatment options o Risk control
Monitoring, review and continuous improvement of risk actions
RATIONALE FOR RISK MANAGEMENT WHICH ENHANCES VALUE
CONCLUSION
Figure 2: Detailed layout of Chapter 2 – Risk management: A literature review.
41
CHAPTER 2 RISK MANAGEMENT – A LITERATURE REVIEW 2.1 INTRODUCTION
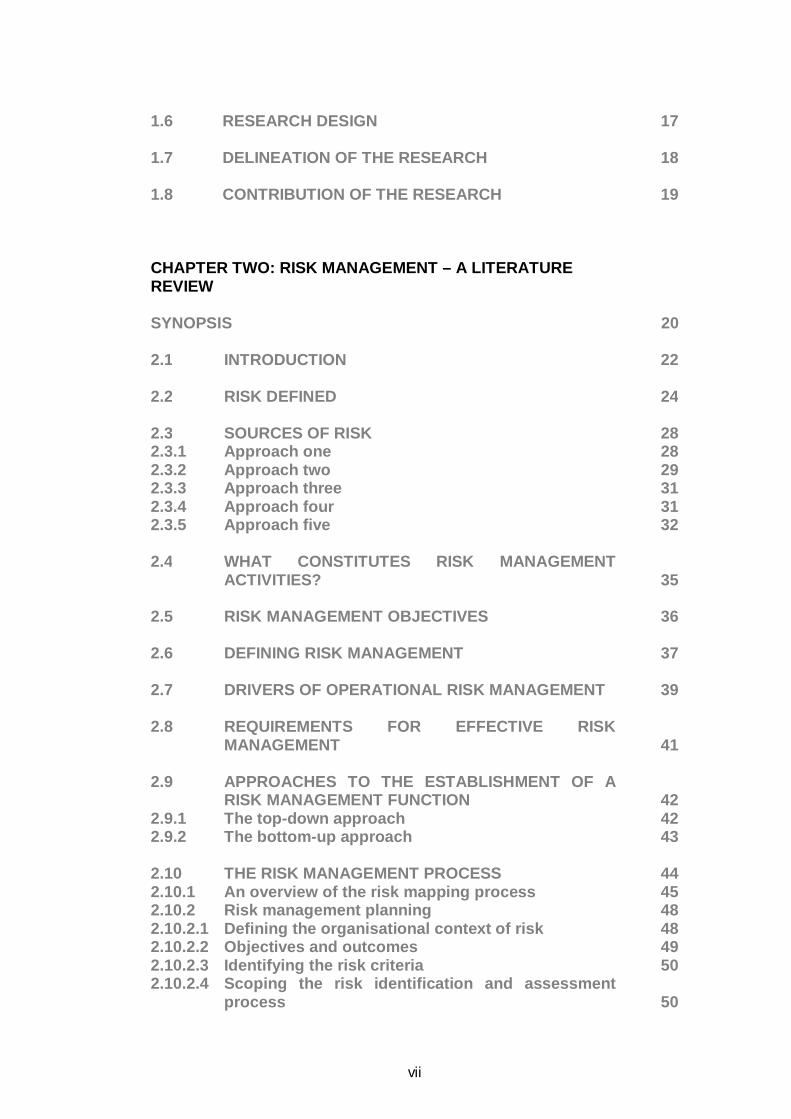
The analytical process followed thus far is graphically depicted in Figure
2.1, placing the chapters in context with the overall thesis objectives, and
furthermore indicating the relative positioning of this chapter.
Figure 2.1: Chapter 2 – Risk management positioning.
The premise of risk is uncertainty, where the achievement of objectives is
subjected to the occurrence and/or non-occurrence of events (IIA, 2010:
Online). Uncertainty, and thereby risk, prevails in all spheres of life,
business, the economy and the environment, where volatile market
relations increase uncertainty in environments within which organisations
operate (DEAT, 2006:Online; and Tchankova, 2002:290).
CHAPTER ONE
Scope of the research
CHAPTER TWO
Risk management – A literature review
CHAPTER THREE
Enterprise risk management – A literature review
CHAPTER FOUR
A perspective of SME risk management in South Africa
– A literature review
CHAPTER FIVE
Survey design and methodology
CHAPTER SIX
Analysis and interpretation of survey data
CHAPTER SEVEN
Formulation of a structured risk management model for South
African SMEs

42
Risk is inherent to all business activities and it affects all managerial levels
(Towers Perrin, 2008:Online; Bowling, Julien & Rieger, 2003:16;
Tchankova, 2002:290; and Spira & Page, 2003:641). Business executives
are faced with risks arising from external forces outside their immediate
control, such as distressed financial markets, mergers and acquisitions,
disruptive technology changes and geopolitical instabilities (Towers Perrin,
2008:Online). These external forces combine with a myriad of internal
forces, such as changes in the governing structures of organisations, and
need to be managed (Bowling et al., 2003:16; and Spira & Page,
2003:641).
Managing risk has always been an inherent responsibility of management.
However, changing conditions such as increased specialisation,
globalisation of trade, and interconnectivity between organisations have
changed organisations’ risk appetite10. Media coverage coupled with
communication advances, leaves little organisational manoeuvrability in
times of crises, which forces organisations to adopt a more structured
approach in the handling of risks (Andersen & Terp, 2006:44-45; and
Kimball, 2000:1).
To effectively manage or control risk however, the nature, probability of
occurrence, and impact of the risks need to be determined. The risk
management process provides an effective, structured approach for the
identifying, evaluation and controlling of risks (DEAT, 2006:Online). While
effectively controlled risk exposures limit the potential impact of losses, it
does not eliminate undesirable events from occurring. A structured
evaluation of the risk environment facilitates preparedness for addressing
risk and provides financial protection to shield the organisation from the full
impact of the adverse event. The rationale for employing risk management
actions in many organisations is that a controlled risk environment will
reduce the occurrence of unexpected events, as well as the total cost of
10 IIA. 2010. Risk appetite is defined as, “…the level of risk that an organization is willing to accept”.[Online]. http://www.theiia.org [6/5/2011]

43
risk, thereby releasing funds for other value-adding purposes (Andersen &
Terp, 2006:44-45).
Properly managed, risk fuels growth and opportunity (Towers Perrin,
2008:Online). Organisations embark on various initiatives, which may
result in a spectrum of outcomes, in order to secure market share. The
possibility of these outcomes being realised, determine the associated risk
in the organisation’s activities. Risk is embedded in all organisational
activities and spheres of management. Management is however faced
with the challenge that risk-taking is an essential element for promoting
innovation and change, however it is increasingly difficult to execute risk
activities in a risk management environment (Borgelt & Falk, 2007:122).
Innovation requires unconventional and entrepreneurial thinking and can
only exist when management allows and promotes well-considered risk-
taking, executed and controlled by an informed and skilled work force. The
amount of risk ignorance in an organisation is proportionate to the amount
and type of risk management solutions required to counter potential
negativity associated with risk taking. This places the onus on
management striving for change or innovation to establish and foster a
knowledge culture that is supportive of controlled risk-taking (Borgelt &
Falk, 2007:122).
2.2 RISK DEFINED
Uncertainty arises in situations where decision-makers have incomplete
knowledge, information or understanding of activities and their possible
consequences. As a result, uncertainty exists due to people’s ‘knowledge
vacuum’ of future events. The level of perceived uncertainty depends on
the availability of information to evaluate the possibility of outcomes, as
well as on the decision-makers’ ability to evaluate the information
(Valsamakis et al., 2000:31-32). In its extreme form, uncertainty refers to
the total absence of information or awareness of a potential event
occurring, regardless of its outcome (Ritchie & Brindley, 2007:305-306).

44
Uncertainty therefore pertains to the possibility of an event realising, and
the outcome of the realised event.
The concept of risk may be regarded as interrelated to uncertainty given
the perception that uncertainty gives rise to risk. Events with outcomes
that lack predictability hold risks, although such outcomes may be
assigned objective probabilities. Risk prone outcomes therefore hold the
possibility of numerous values, with the particular value being
unpredictable (Valsamakis et al., 2000:31-32; and DEAT, 2006:Online). In
a business context, uncertainty and by implication risk, impacts on the
achievement of organisational objectives (McNamee, 1998:7).
Risk is embedded in economic activities through various economic
resource outflows, which are invariably undertaken without knowing
whether positive economic inflows will result (Kimball, 2000:4) According
to Spekman and Davis (2004:416-417), the following aspects of risk
should be considered:
It is context specific.
It can be defined as objective (i.e. inherent in card games) or subjective
(i.e. an individual’s assessment of a situation motivates him to take
certain actions).
It is determined on a personal and organisational level (Spira & Page,
2003:640-661).
Risk-taking is influenced by group behaviour as opposed to individual
actions (Giliberto & Varaiya, 198911 cited by Spekman & Davis,
2004:416-417).
There are almost infinite definitions of risk which is governed by the
specific discipline it occurs in (Kimball, 2000:4; and Ritchie & Marshall,
199312 cited by Ritchie & Brindley, 2007:305). It is important to define risk
in a manner that does not limit such definition within a specific context.
From a generic perspective, risk can be defined as, “… the possibility of 11 Giliberto, S.M. & Varaiya, N. 1989. The winner’s curse and bidder competition in acquisitions: evidence from failed bank auctions. Journal of Finance, 44(1):59-75. 12 Ritchie, R.L. & Marshall, D.V. 1993. Business Risk Management. London: Chapman Hall.

45
deviation in an expected outcome” (Spekman & Davis, 2004:416). With the
growing emphasis on risk management as a systematic process, it is
important to provide a more rigorous definition of risk, enforcing the fact
that risk implies a level of uncertainty.
Valsamakis et al. (1996:24-27; 2000:32-35) propose the following
definition for the concept of risk: “Risk is defined as the variation of the
actual outcome from the expected outcome. Risk therefore implies the
presence of uncertainty. Managing risk implies not only the financial
provision for the consequences of an event, but the effort to:
Reduce or minimise the likelihood of the loss-producing event
occurring.
Reduce or minimise the adverse effects once the event has occurred”.
Sitkin and Pablo (1992:913) cited by Ritchie and Brindley (2007:305) define
risk as: “… the extent to which there is uncertainty about whether
potentially significant and/or disappointing outcomes of decisions will be
realised”.
The Collins English Dictionary (1998:132814) cited by Borgelt and Falk
(2007:123), defines risk as “to be in peril”.
Briers (2000:8) define risk as: “Risk is a human behaviour with imperfect
knowledge about future outcomes that can vary intended rewards”.
Most definitions of risk address the following risk elements (Ritchie &
Brindley, 2007:305-306):
The probability of an event occurring or its outcome.
The consequences of the event or its outcome.
The causal pathway leading to the event.
13 Sitkin, S.B. & Pablo, A.L. 1992. Reconceptualizing the determinants of risk behaviour. Academy of Management Review,17(1):9-38. 14 Collins English Dictionary. 1998. Collins English Dictionary (Australian), 4th Edition, London: Harper-Collins.

46
The probability of an event occurring can be expressed in either ‘objective’
or ‘subjective’ terms, using different measuring scales. Consequences
can also be expressed from various perspectives, including simultaneous
multiple perspectives, e.g. a failure of a new product launch may impact
adversely on the organisation’s reputation as well as its financial
performance. Managers typically regard risk as the downside effect of an
outcome specifically tied to the notion of economic loss (Chiles &
McMackin, 199615 cited by Spekman & Davis, 2004:416). One should
however exercise due care in limiting risk consequences to negative
occurrence only, as the rationale for risk taking creates the potential
opportunity to create positive outcomes (McNamee, 1998:70; and Ritchie
& Brindley, 2007:306). The third element of risk namely the ‘causal
pathway’, refers to the nature of the event, the sources of the event, and
the causes created by the realisation of the event, which impact on the
probability of the event occurring and the severity of the event’s outcomes
(Ritchie & Brindley, 2007:305-306).
It is of importance for the reader to note that risks are not limited to purely
catastrophic events, but also refers to potential events that impact on the
effectiveness and efficiency of operations influencing the ongoing
performance of an organisation. As a rule, management would however
focus on those events that may have a significant impact on the
organisation’s performance or risk profile. Furthermore, the
interconnectedness of risk should be taken into account since it does not
only affect a specific activity, but in addition impacts on various related and
seemingly unrelated activities. Potentially all organisational activities are
exposed to risk, although the risk impact may be reduced through other
organisational processes (Ritchie & Brindley, 2007:310).
15 Chiles, T. & McMackin, J. 1996. Integrating variable risk preferences, trust, and transaction cost economics. Academy of Management Review, 21(1):73-100.

47
2.3 SOURCES OF RISK
Academic authors from time to time use the concept of a ‘risk approach’
for which 5 approaches were developed to classify and define risk.
However, risks in the managerial discipline will by nature imply that only
certain risks embedded in corporate activities will concern this discipline
(Valsamakis et al., 1996:27-28; 2000:35). Irrespective of the risk
environment or the definition of risk used, it is essential to determine the
type of risk expected and to rationalise it relative to the nature of the
activity or organisation (DEAT, 2006:Online). The five risk approaches
referred to above, are elaborated upon below to provide clarity on risk
classification definition.
2.3.1 Approach one
A risk classification may be drawn according to the possible outcome,
differentiating between pure and speculative risks. Pure risks have no
chance of gain and are typically insurable such as environmental and
safety risks. The focus is therefore directed towards ‘loss management’ as
opposed to ‘risk and uncertainty management’ (Williams, Smith & Young,
1998:26-27). In contrast, speculative risks, also termed business risks,
can have positive or negative outcomes. Examples are interest rate risks,
research and development risks, etc (Andersen & Terp, 2006:31). Pure
loss concerns the ultimate outcome of either loss or no loss, while
speculative loss concern the outcome of either a loss or a gain (Williams et
al., 1998:7-8). Pure loss is therefore assessed on a one-dimensional
scale, while speculative risks require two separate assessments relating to
positive and negative outcomes (DEAT, 2006:Online). The management
of these two risk categories differ in that pure risk outcomes can often be
mitigated by risk management techniques, while speculative risk outcomes
(which are conventional uninsurable risks), are usually managed through
hedging (Valsamakis et al., 1996:27-28; 2000:35). Table 2.1 (Waring &

48
Glendon, 199816 cited by DEAT, 2006:Online) depicts a list of pure and
speculative risks that are considered threats and hazards to an
organisation.
Table 2.1: Examples of pure and speculative risks (Source: Waring & Glendon, 1998
cited by DEAT, 2006:Online).
HAZARDS AND THREATS (OBJECTS OF RISK MANAGEMENT) Pure risk topics Speculative risk topics
Occupational health and safety Financial/credit risks
Fire Investments
Security Business risk
Environmental Political risks
Quality assurance Social/cultural risks
IT reliability Human resources
Business interruption Marketing
Flood IT strategy
Earthquake etc Total quality management etc
2.3.2 Approach two
According to Williams et al. (1998:66-68) and Tchankova (2002:293-295),
a general risk classification differentiates between physical, social and
economic sources. Further in-depth classification of risk is essential to
facilitate efficient risk identification. As a result, the sources of risk can be
identified according to the environment in which they prevail as elaborated
upon below:
Physical environment: The influence of the environment on people
as well as people’s impact on the environment are important
elements in this source of risk. The physical environment can also be
a source of opportunity, e.g. a region’s climate can be a positive
factor to tourism.
Social environment: Sources of risks are mooted from changes in
people’s values, human behaviour and interaction, and the state of
16 Waring, A. & Glendon, A.I. 1998. Managing Risk. London: Thompson Learning.

49
social structures, e.g. employees’ skills and loyalty may have a
profound impact on the organisation’s success; changing attitude
towards minority groups can provide access to a new talent pool.
Political environment: The ruling party of the land affects
organisations in different ways, e.g. decreasing subsidies to certain
sectors. The political environment in international trade is complex
and can extend its influence in a number of ways, e.g. differences in
the ruling system leads to different attitudes and policies towards
trade; opportunities are created by fiscal and monetary policy.
Operational environment: Risks and opportunities are created by
the operational environment, e.g. manufacturing activities may
cause employees harm; the operational environment may improve
the employee’s personal environment.
Economic environment: Globalisation creates a global market that
needs separate consideration, e.g. on an international front,
depression and recession are the result of interdependent economic
systems. Locally, credit policy and interest rates may be sources of
risk to organisations.
Legal environment: Risk and opportunities arise from the disparity
of new laws. Internationally, the complexity increases due to
variations in the legal system, which may lead to conflict amongst
business partners. The upside is that the legal system provides a
framework for organisations to function in, thereby providing stability
to the organisations and society alike.
Cognitive environment: People’s perception of risk compared to the
reality thereof, is a source of risk. The evaluation of uncertainty and
the methods used to determine whether a risk is real, are considered
in this environment.

50
2.3.3 Approach three
Doherty (198517), and Greene and Serbein (198318), cited by Valsamakis
et al. (1996:27-28; 2000:35), classify risks into the following categories:
Marketing risk.
Financial risk.
Environmental risk.
Property and personnel, and personnel and production; or resource
management risk.
2.3.4 Approach four
The Institute of Risk Management South Africa’s (IRMSA) Enterprise Risk
Management Code of Practice (200419) cited by DEAT (2006:Online)
classifies business risks into the following categories:
Strategic risk: Risks impacting on business strategy and
organisational long-term plans.
Value-based risk: Risks impacting on the monetary value of an
item.
Process-based risk: Risk impacting on the way an activity is
performed or a process is executed.
Information-based risk: Risk impacting on the availability, quality
and quantity of information used for decision-making.
People-based risk: Risk arising from the occurrence or non-
occurrence of people’s activities.
Environmental risk: Risk impacting on the micro- and
macroenvironment.
Compliance risk: Risk arising from compliance or non-compliance
with standards, policies, laws, regulations, etc.
17 Doherty, N.A. 1985. Corporate risk management - A financial exposition. New York: McGraw-Hill. 18 Greene, M.R. & Serbein, O.N. 1983. Risk management: Text and cases. Virginia: Reston Publishing. 19 Institute of Risk Management South Africa (IRMSA). 2004. Enterprise Risk Management – Code of Practice.

51
Asset risk: Risk impacting on the organisation’s assets, e.g. cash,
investments, property, assets.
2.3.5 Approach five
The Institute of Chartered Accountants in England and Wales (ICAEW,
1999b20) cited by Fraser and Henry (2007:392-393), provides guidance to
organisations implementing the ‘Turnbull Report’, renamed the ‘UK
Corporate Governance Code’ (UK Code, 2010:Online), by classifying
risks into the following categories:
Financial risk,
business risk including strategic risk,
compliance risk,
operational risk, and
other risks.
The relative importance of the cited risk categories differs among business
industries. For example, the construction industry regards the following
risks (in order of importance), as the risk categories impacting on their
business environment: Financial risk, technical risk, time risk, operational
risk, environmental risk and political risk. The following risks impact on
operations in the oil industry (in order of importance): Financial risk,
technical risk, operational risk, environmental risk, time risk and political
risk (Baker, Ponniah & Smith, 1999:101).
Behavioural risk is an important risk in all spheres of an organisation.
Some of the largest losses suffered by organisations are due to the
encouragement of risky behaviour in for example bonus and reward
schemes. Although risk-taking is paramount to organisational growth, the
importance of balancing the risk should be acknowledged by executives,
who encounter a broad range of risks and pressures from external sources
such as shareholders and government. Executives should therefore take
20 ICAEW. 1999b. Implementing Turnbull – A Boardroom Briefing. Institute of Chartered Accountants in England and Wales Audit Facility, London.
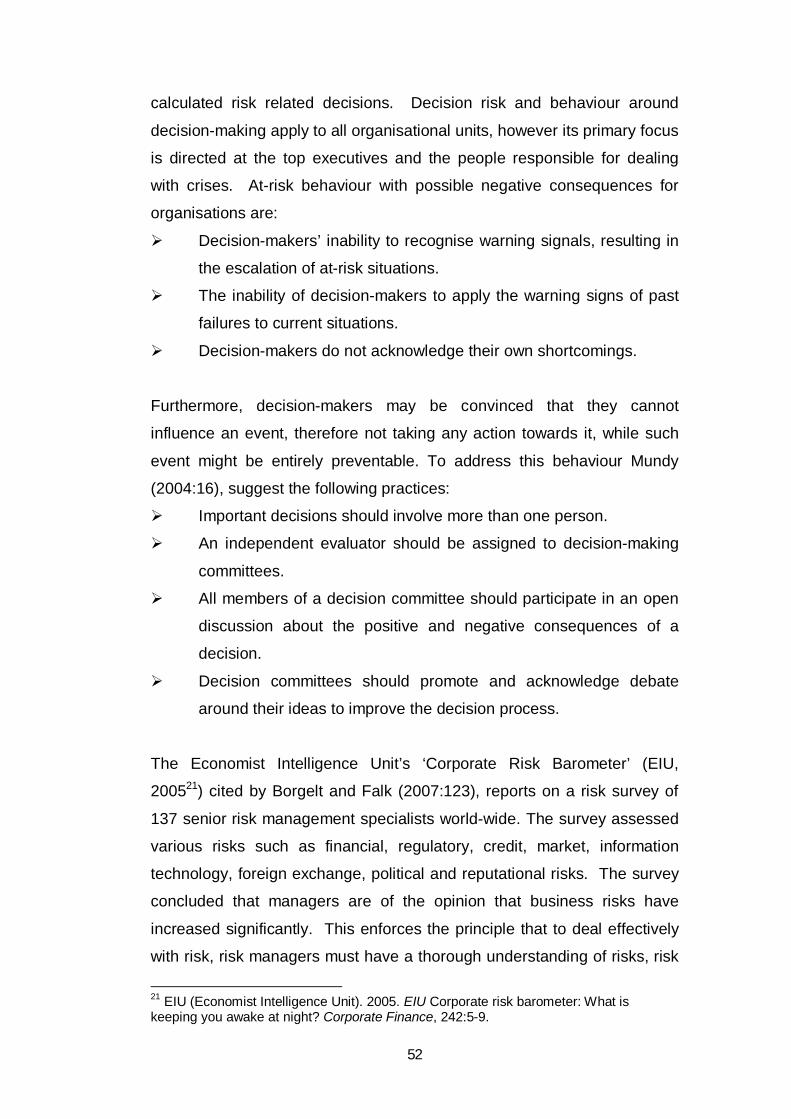
52
calculated risk related decisions. Decision risk and behaviour around
decision-making apply to all organisational units, however its primary focus
is directed at the top executives and the people responsible for dealing
with crises. At-risk behaviour with possible negative consequences for
organisations are:
Decision-makers’ inability to recognise warning signals, resulting in
the escalation of at-risk situations.
The inability of decision-makers to apply the warning signs of past
failures to current situations.
Decision-makers do not acknowledge their own shortcomings.
Furthermore, decision-makers may be convinced that they cannot
influence an event, therefore not taking any action towards it, while such
event might be entirely preventable. To address this behaviour Mundy
(2004:16), suggest the following practices:
Important decisions should involve more than one person.
An independent evaluator should be assigned to decision-making
committees.
All members of a decision committee should participate in an open
discussion about the positive and negative consequences of a
decision.
Decision committees should promote and acknowledge debate
around their ideas to improve the decision process.
The Economist Intelligence Unit’s ‘Corporate Risk Barometer’ (EIU,
200521) cited by Borgelt and Falk (2007:123), reports on a risk survey of
137 senior risk management specialists world-wide. The survey assessed
various risks such as financial, regulatory, credit, market, information
technology, foreign exchange, political and reputational risks. The survey
concluded that managers are of the opinion that business risks have
increased significantly. This enforces the principle that to deal effectively
with risk, risk managers must have a thorough understanding of risks, risk
21 EIU (Economist Intelligence Unit). 2005. EIU Corporate risk barometer: What is keeping you awake at night? Corporate Finance, 242:5-9.

53
management practices as well as the methods used to optimise such risk
management practices.
Despite the increase in business risk, Wince-Smith (2005:2522) cited by
Borgelt and Falk (2007:123), states that: “You can’t innovate and grow
unless you’re willing to take risks. However, in the current regulatory and
tort environment, companies are more focused on risk reduction than ever
before”. The organisation’s focus on risk reduction is primarily due to the
need for shareholders to protect their investments and reduce at-risk
behaviour by closely monitoring management’s actions and aiding in good
governance practices (Gilson, 199023, Jensen, 199324, Shleifer & Vishny,
198625 cited by Borgelt & Falk, 2007:123). According to the results from
the corporate barometer survey reputational risk, i.e. any risk that can
influence an organisation’s reputation is perceived as the most important
risk organisation’s face. The importance of reputational risk is emphasised
as being, “… almost three times that of financial, terrorism or political risk
exposure and almost four times that of crime and natural disaster risk
exposure” (EIU, 2005:526 cited by Borgelt & Falk, 2007:124). The growing
importance of reputational risk is due to the shifting of risk managers’
focus from financial to less understood areas, with reputational and
regulatory issues as the most critical areas. This indicates that there is a
direct correlation between the potential of risks in certain areas and the
lack of knowledge or understanding in that same area. The employment
of risk management techniques is however obstructed by the fact that
such techniques can only be applied to risks that are accurately perceived
by employees as threatening the organisation’s resources (Tchankova,
2002:295-297; and Borgelt & Falk, 2007:124). There are numerous risk
approaches to use in the classification of risk and the evaluation thereof
consequently, to ensure optimum results, it is essential that management 22 Wince-Smith, D. 2005. Innovate at your own risk. Harvard Business Review, 83(5):25. 23 Gilson, S. 1990. Bankruptcy, boards, banks and blockholders. Journal of Financial Economics, 27:355-387. 24 Jensen, M. 1993. The modern industrial revolution exists and the failure of internal control systems. The Journal of Finance, July:831-880. 25 Shleifer, A. & Vishny, R. 1986. Large shareholders and corporate control. Journal of Political Economy, 94:461-488. 26 Refer to footnote 21.

54
select and plan what approach to use to mitigate the risk (DEAT,
2006:Online).
2.4. WHAT CONSTITUTES RISK MANAGEMENT ACTIVITIES?
In its most elementary form, risk management implies the actions taken by
an organisation to alter its risk/return profile of future economic benefits
flowing to the organisation. As a rule, the term frequently used for an
attempt by managers to reduce risk, is known as ‘hedging’. Should
however management increase the organisation’s risk exposure because
of the possibility to increase profits, the term frequently used for this action
is known as ‘speculating’ (Cummins, Phillips & Smith, 1998:30).
According to Cummins et al. (1998:30), there are numerous ways in which
organisations can alter their risk exposure or risk profile, for example:
Diversification: Diversification can limit an organisation’s net risk.
Operating leverage: Expenditures can be linked to revenue.
Organisations can structure their expenditure to increase when
revenue is high (for example the use of manual labour instead of
automated processes), and decrease when revenue is low
(automated processes require economic outflow regardless of the
level of revenue).
Financial leverage: The organisation’s choice of debt versus
equity finance is a risk management technique.
Distribution of cash flow: Organisations can use derivative
securities to alter the distribution of their cash flows.
Accounting practices: Accounting practices can be used to
ensure relative stable earnings.
The objective of risk management is not the elimination of risk. In practice,
organisations decide amongst the types and degrees of risk exposure,
engaging in those activities that can result in a competitive advantage and
laying off others through the use of the capital markets, or accepting minor

55
exposures while ensuring against catastrophic ones (Stulz, 199627 cited by
Kimball, 2000:4).
Risk management is an essential part of organisational processes in that it
helps the organisation in the effective achievement of its goals. It is a
continuous process that is directly influenced by the changes in the
internal and external organisational environment, and enforces the need
for continuous risk identification and control (Tchankova, 2002:290).
2.5. RISK MANAGEMENT OBJECTIVES
Organisations vary in size, forms of incorporation and complexity. As a
result, the objectives of risk management vary among organisations and
are dependent on the organisation’s risk environment. Some of the more
generic objective according to Andersen and Terp (2006:31-32) includes:
Greater transparency: To assist executive management, owners
and potential investors in evaluating the significant organisational
exposures and appropriateness of management action in dealing
with risk.
Increase risk awareness: To create an organisational culture where
all managerial decisions incorporate risk awareness and all
employees are conversant in the effective handling of risks in their
organisational areas.
Control risk environment: To limit the probability and potential
severity of possible losses and ensure adequate financial protection
against possible losses. To establish organisational awareness to
effectively deal with significant risks. To reduce the total cost of
risk28.
Operate within risk appetite level: To enhance the probability of
achieving organisational goals.
27 Stulz, R. 1996. Rethinking Risk Management. Journal of Applied Corporate Finance. Fall:8-24. 28 The cost of risk is the sum of insurance costs, un-reimbursed losses, risk control and prevention cost and administrative costs (Valsamakis et al., 2000:171).

56
2.6 DEFINING RISK MANAGEMENT
One of the originating causes in the development of present-day risk
management can be attributed to the evolution of the managerial
discipline, into a professional function (Valsamakis et al., 2000:18).
Every organisation faces unforeseen circumstances that can adversely
impact on its operations, reputation and ultimately its continuity. Although
these negative events may never realise, the organisation should provide
for contingency plans to reduce the severity and variability, if and when the
losses do realise (Hollman & Forrest, 1991:49; and Valsamakis et al.,
2000:18-19). The management of risk and uncertainty is important for
organisations as these two interconnected elements result in a cost known
as ‘the cost of risk’, that is exerted because of the presence of uncertainty.
The cost of risk can be categorised as:
The cost of the loss.
The cost of the uncertainty reflected in e.g. the misallocation of
resources.
Risk and uncertainty by nature do not focus solely on negative events, but
also create opportunities. Organisations would therefore seek to manage
their affairs in order to obtain maximum value from these events. The way
in which organisations address and manage these risks and uncertainties
to reduce the probability of the event occurring as well as limit the adverse
effect once the events occurred, is commonly referred to as ‘risk
management’. The risk management process is universal in its application,
and may involve both individuals and organisations. It is practised by
organisations because of its incentives to reduce the cost of risk and
uncertainty, while striving to obtain maximum value (Hollman & Forrest,
1991:49; Williams et al., 1998:14-15; and Valsamakis et al., 1996:54-56).
Traditionalists regard risk management as a discipline centred purely on
the management of pure risks (Valsamakis et al., 1996:54-56). Kloman

57
(198729) cited by Valsamakis et al. (2000:18-19) and Williams et al.
(1998:26-27), urge that a differentiation between pure and speculative
risks impedes on the development of an integrated view of this discipline.
Risk management should encompass all aspects of risks, both pure and
speculative (Robinson & Kunath, 198130 cited by Valsamakis et al.,
1996:54-56; 2000:18-19), eliminating, reducing or controlling risks and
securing the value from opportunities presented (Andersen & Terp,
2006:31).
According to Truslow (2003:Online), risks should be viewed as the level of
uncertainty surrounding an outcome, as this uncertainty creates volatility in
an organisation’s income stream. Truslow (2003:Online), defines risk
management as follows: “Risk management … encompasses the actions
we take to minimize the uncertainty of our expected results and to reduce
volatility”. This concept is also reflected by Cummins et al. (1998:30), who
states that: “Risk management can be roughly defined as any set of
actions taken by individuals or corporations in an effort to alter the risk
arising from their primary lines of business”.
Briers (2000:8) defines risk management as: “The process of intervention
in economic and behavioural risk dynamics so that the value of the
organisation is enhanced”. The managerial nature of risk management, in
terms of which efforts are focused on assisting organisations in achieving
their goals and objectives in an effective and efficient manner, is further
echoed by Williams et al. (1998:26-27), who defines risk management as:
“… a general management function that seeks to assess and address the
causes and effects of uncertainty and risk on an organisation”.
The managerial nature of risk management reflected in the planning,
coordinating and directing of risk control and financing is incorporated in
the definition of risk management by Valsamakis et al. (2000:22) namely:
29 Refer to footnote 9. 30 Robinson, R. & Kunath, L. 1981. A dynamic approach to risk management. Risk Management, September.

58
“Risk management is a managerial function aimed at protecting the
organisation, its people, assets and profits, against the physical and
financial consequences of event risk”. Implicit in this definition is the
strategic nature of risk decisions, the inclusion of people and processes in
the risk activities, and the proactive nature of this discipline. Although
perceived as a simple construct, risk management is a complex process
incorporating a diversity of measurement systems and potential outcomes
(Ritchie & Brindley, 2007:305-306).
2.7 DRIVERS OF OPERATIONAL RISK MANAGEMENT
The realisation of operational or business risks can lead to material
damages and losses to an organisation. The first step in the
establishment of a formal risk management function is therefore the
identification of risk drivers in an organisation. By identifying the risk
drivers, organisations can gain a better understanding of the risk
influencing factors, thereby assisting management in developing a risk
management strategy (Young, 2006:46-47).
The main drivers of business risk/operational risk (Young, 2006:46) are
depicted in Figure 2.2 and can be categorised as:
Management drivers,
external drivers, and
internal drivers.
External drivers impacting on an organisation originate from other
organisations and sources that can manifest itself through, for example,
regulatory requirements, market events and competition. Internal drivers
arise from the execution of organisational activities and processes
performed to manage the organisation effectively.
59
The third major business risk driver is the management driver that
emphasises the importance of business risk management through
mechanisms such as performance measures, governance and
accountability. By creating more risk awareness throughout all levels of an
organisation, management can improve the manner in which the
organisation operates. Through its risk awareness actions, management
can create a positive control environment in which business risks can be
identified and managed, opportunities harvested, and the organisational
process realigned to improve risk management (Young, 2006:46-47).
MANAGEMENT DRIVERS Accountability and governance Risk awareness Monitoring of risk Cost effectiveness Change Performance measures Standards
EXTERNAL DRIVERS Regulatory requirements Market events Stakeholder performance Competition Reputation
Operational risk management drivers Operational risk management framework and strategy
INTERNAL DRIVERS Products and services Operational losses Capital requirements Technology and systems Business strategy Innovation Processes Staff requirements and
needs
Figure 2.2: Main drivers of operational/business risk (Source: Young, 2006:46).

60
Organisations should be aware that implementing risk management
activities is a time-consuming activity, especially when the process is not
seen as a value-adding activity in terms of the profits of the organisation.
The management of business risk should be introduced into an
organisation systematically, and management’s support and buy-in should
be gained through the progression of the process (Young, 2006:46-47).
2.8 REQUIREMENTS FOR EFFECTIVE RISK MANAGEMENT
Organisational processes, systems and governance are all important
aspects of risk management. Another influencing factor is the culture of
an organisation, comprising the following elements (Truslow, 2003:Online):
Organisational activities should be based on informed, calculated
and structured decisions.
Consistent long-term growth with low volatility should be strived for.
In the organisational hierarchy of importance are firstly, soundness,
then profitability and then growth.
In addition, an organisational structure should be established for allocating
risk management responsibilities. Furthermore, comprehensive risk
policies and processes should be developed and implemented in
controlling risk. Control over the processes should be exercised through
regular supervision by an independent group. With the growing realisation
of the importance of risk management, management should allocate this
independent oversight role to internal audit. However, good corporate
governance practices advocate the use of a separate risk management
function for risk oversight. Internal audit’s role is to provide management
and the board with independent assurance regarding adequacy of the risk
functions, and the degree by which organisational objectives are achieved
(Young, 2006:34).
Unexpected problems culminating in adverse risk situations would make
significant demands on an organisations’ money, time and resources, and
may cause reputational damage. Conversely, the absence of such

61
problems enables organisations to utilise their resources more effectively.
Sound risk management therefore provides a competitive advantage over
time by providing flexibility to the organisation in capital investment
decisions (Truslow, 2003:Online).
2.9 APPROACHES TO THE ESTABLISHMENT OF A RISK MANAGEMENT FUNCTION
In establishing a business risk management function, organisations can
use a ‘top-down’ or a ‘bottom-up’ approach (Young, 2006:47-48; and
Pickford, 2001:54). These two approaches are elaborated upon below.
2.9.1 The top-down approach
The top-down risk mapping approach addresses risk from a corporate
perspective, by identifying and analysing existing risks in each part of the
organisation, taking into account the interconnectedness of risk in terms of
each other and the organisation as a whole (Pickford, 2001:54). On a
generic level, the process as a rule would be initiated by the board of
directors when they agree on the need for the implementation of a risk
management function. Managerial activities in setting up this process will
include the formulation of a business risk definition; defining business risk
categories; allocating initial responsibilities for the development and
implementation of the risk process and obtaining management support for
the process (Young, 2006:47-48). According to Pickford (2001:54), the risk
mapping approach comprises the following subprocesses:
Risk identification: Risks that affect the organisation as a whole are
identified, through e.g. the use of publicly available information.
These risks are communicated to key employees, who by way of
brainstorming sessions are then tasked to identify internal
organisational risks.
Risk evaluation: The results of the risk identification activities are
then analysed in terms of probability and impact, which is usually

62
depicted by means of matrices representing the different levels of
probability and impact.
Risk profiling: The results of the risk evaluation are then
extrapolated into a risk profile, where risks are grouped into risk
categories ranging from high-probability, negligible outcomes to low-
probability, high-severity disasters. Risk mitigation priority strategies
can then be formulated according to the risk profile information.
Risk quantification: Risk categories can further be analysed
through the estimation of actual losses, frequencies and confidence
limits. Expert opinions combined with valid loss data can be used in
these estimations.
Risk consolidation: Departmental or subsidiary risk analysis should
be elevated to a corporate level. This may involve either a
mathematical process or a qualified team may be used to perform a
subjective risk profiling analysis.
2.9.2 The bottom-up approach
The bottom-up risk approach involves all organisational employees. It is
imperative that when risks occur, they are managed as close as possible
to the originating source in order to reduce or eliminate the potential
adverse effects. As a result, all levels of employees should be involved in
the identification and categorising of risks pertaining to their respective
responsibilities. In order for management to receive accurate data on
which to base their control decisions and resulting control actions, a
bottom-up risk approach should be used. However, an interface between
the bottom-up and top-down approach should be established in order to
secure optimal risk information flow and coordination of activities (Young,
2006:47-48).
Page and Spira (2004a31) cited by Fraser and Henry (2007:394), support
the use of a bottom-up risk management approach where preliminary risk
31 Page, M. & Spira, L. 2004a. The Turnbull Report, Internal Control and Risk Management: The Developing Role of Internal Audit. ICAS, Edinburgh.

63
evaluations are performed by junior teams, followed up with risk
assessments performed by more senior employees. Alternatively, Control
Self-Assessment (CSA) provides for an effective mechanism (e.g. use of
questionnaires or workshops) to identify risks, enhancing management’s
understanding of the process, and gaining their cooperation and
involvement (Skinner & Spira, 2003:28-35; and Mustafa & Kennard,
200432 cited by Fraser & Henry, 2007:394). The top-down and bottom-up
approach to risk management is graphically depicted in Figure 2.3.
Figure 2.3: Top-down and bottom-up approaches to risk management (Source: Young,
2006:48).
2.10 THE RISK MANAGEMENT PROCESS
Any organisation needs to ensure that it has an effective and efficient risk
management process in place (Financial Committee of the Institute of
Chartered Accountants in England and Wales, 2002:20). Although
authors in the field of risk management differ on the exact composition of
the elements of the risk management process, there are certain generic
steps which are usually considered in this process to provide assurance to
32 Mustafa, E. & Kennard, P. 2004. The new balancing act. Internal Auditing and Business Risk, January:37-40.
Risk culture
Obtaining support
Allocate responsibility
Define risk categories
Define operational risk
Understand definition of operational risk
Identify risk exposure
Implement controls
Eliminate/minimise risk
Reporting
BOTTOM-UP APPROACH
TOP-DOWN APPROACH

64
management that organisational risks are being effectively managed
(DEAT, 2006:Online; and Young, 2006:31-32).
2.10.1 An overview of the risk mapping process
Although the practice of risk management is likely to differ amongst
organisations depending on the potential effect of risk on the organisation,
the process will usually comprise the following well-established steps
(Young, 2006:31-32; Financial Committee of the Institute of Chartered
Accountants in England and Wales, 2002:20; Bandyopadhyay et al.,
199933, Tummala & Leung, 199934 cited by Kendrick, 2004:70; Crouhy,
Galai & Mark, 2006:2; Valsamakis et al., 1996:63-64; 2000:25; Andersen
& Terp, 2006:34; DEAT, 2006:Online; and Williams et al., 1998:30-31):
Risk identification: Identify, rank and source risks in an
organisation.
Risk assessment: Select the most appropriate risk management
approach using qualitative and quantitative techniques.
Risk response: Implement controls to manage risks.
Risk monitoring and reporting: Monitor the effectiveness of the risk
response.
The Financial Committee of the Institute of Chartered Accountants in
England and Wales (2002:20), advocates a fifth element of the risk
management process, namely ‘organisational learning and effective
improvements’. According to Leopoulos, Kirytopoulos and Malandrakis
(2006:322), and the DEAT (2006:Online), the risk management process
can be extended to incorporate risk planning that precedes the risk
identification step. The basic steps of the risk management process are
graphically depicted in Figure 2.4.
33 Bandyopadhyay, K. et al. 1999. A framework for integrated risk management in information technology. Management Decision, 37(5):437-444. 34 Tummala, V.M.R. & Leung, Y.H. 1999. Applying a risk management process (RMP) to manage cost risk for an EHV transmission line project. International Journal of Project Management, 17(4):223-235.

65
Figure 2.4: The basic risk management process (Source: Adapted DEAT, 2006:Online;
and Leopoulos et al., 2006:323).
Uncontrolled residual risk, remaining after the risk management actions
were taken, can cause an organisation significant harm. To manage the
residual risk and compensate organisations for incidents that occur,
organisations can incorporate a risk financing element into the risk
management process. Valsamakis et al. (2000:22), makes reference to
the financing element by stating that a risk management function ‘involves
planning, coordinating and directing the risk control and risk financing
activities in the organisation’ (DEAT, 2006:Online; and Williams et al.,
1998:30-31). The full risk management process, including the financing
element, is depicted in Figure 2.5.
Risk management
Risk planning Risk identification Risk assessment
Risk response control
Risk monitoring and review
Organisational learning and improvements

66
Figure 2.5: The full risk management process (Source: Adapted DEAT, 2006:Online;
and Leopoulos et al., 2006:323).
Although the nature of the risk management elements implies a sequence
of events, risk management is not necessarily a sequential process, as
any of the elements can influence the risk programme. Furthermore,
overlapping can occur amongst the risk management elements (Williams
et al., 1998:29-30).
Some authors such as Chapman and Ward (199735) cited by Leopoulos et
al. (2006:323), prefer a more analytical segmentation of the risk
management process as opposed to the steps discussed in Figure 2.5.
The ‘segmental’ risk management approach and the basic five-stage
approach however, follow the same approach and concepts with the
primary difference being the development of the risk management plan
stage which guides the implementation of the risk management process
(Leopoulos et al., 2006:322-323).
35 Chapman, C. & Ward, S. 1997. Project risk management: Processes, Techniques and Insight. Chichester: John Wiley & Sons.
Risk management process
Risk management model
Risk planning Risk identification and assessment
Risk control Risk financing
Risk monitoring and review
Organisational learning and improvement

67
2.10.2 Risk management planning
Prior to embarking on a risk management process, risk management
planning is essential as it serves as a foundation for all risk management
activities. A vital element in the planning phase is the establishment of risk
management goals and objectives, as these serve as a benchmark
against which the success or failure of the programme is measured.
Indicative of the goals and objectives, is the risk methodology
underpinning the process (Williams et al., 1998:30-31).
According to Bowden et al. (2001:8), in the planning phase, organisations
should define the context and risk management criteria by:
Defining the organisational environment or context within which the
risk assessment will be undertaken.
Formulating the primary objectives and outcomes required.
Identifying the criteria against which the risks can be measured.
Defining the core elements needed to structure the risk identification
and measurement process.
2.10.2.1 Defining the organisational context of risk
The objective of defining the organisational context of risk is to ensure that
all organisational stakeholders understand their responsibilities and
accountabilities, and to identify possible weak areas that may influence the
organisation’s ability to manage risk. At a minimum, the following should
be considered when defining the organisational context of risk (Bowden et
al., 2001:8-11):
Organisational operations/activities.
Organisational policies, goals and objectives.
Measurable performance objectives.
Defining all stakeholders involved.
The ability of the organisation to exert control over its business risk,
stakeholder requirements, legal considerations and financial aspects.

68
Various methods can be used and sources consulted in gathering such
information, e.g. review of strategic and operational documents, analysing
organisational charts to determine management responsibilities, interviews
with stakeholders and researching best practices in industry.
Organisations should act with care when addressing stakeholder
concerns, as they themselves could introduce business risks by having
different organisational expectations than envisaged by management. As
stakeholders represent a broad range of the community, i.e. employees,
customers, suppliers, authorities, community, government and special
interest groups, their organisational expectations by implication are
diverse. It is therefore imperative that an analysis of stakeholder interest
should determine the type of stakeholders, their concerns and their
influence over organisational activities. Stakeholder expectations are a
dynamic organisational influence, which may react to any stimulus by the
organisation, industry, ethical and other considerations (Bowden et al.,
2001:8-11).
2.10.2.2 Objectives and outcomes
Departmental, process and project performance objectives are dependent
on the organisational objectives and the phase of the project cycle or
organisational activity. The following serves as example (Bowden et al.,
2001:11):
During the planning stage of a project or process, the requirements
usually mirror the corporate policy expectations.
In the design phase, the focus is more directed at technology criteria
and stakeholder acceptance.
During the delivery, operational and marketing stages, the attention
is directed at specific criteria such as cost control, time schedule
control and performance quality control.

69
2.10.2.3 Identifying the risk criteria
Risk assessment activities comprise comparing the forecast levels of risk
against predetermined risk management performance targets in order to
determine the risk actions. Where circumstances deem practical, these
criteria should be defined when establishing the risk management context
and reviewed when the risk evaluation outcomes are available (Bowden et
al., 2001:11).
2.10.2.4 Scoping the risk identification and assessment process
When executing a programme of risk evaluation and strategy
development, organisations should ensure that inadequate resources (e.g.
lack of time, finances, etc), do not adversely impact on the process results.
Frequently, issues are not timely addressed resulting in organisations
taking on risk that they otherwise would not have engaged in, if they had a
better understanding of the possible consequences. The importance of
scoping during risk identification and evaluation process would ensure that
the risk analysis is adequately focused (Bowden et al., 2001:12).
2.10.3 Identification of risk
The second phase of the risk management process is risk identification, as
risks cannot be managed if they are not identified (Valsamakis et al.,
2000:81; and Young, 2006:33). This forms the foundation for the next
steps of risk analysis and control, and enables organisations to learn of
the areas in which it is exposed to risk. Adequately executed risk
identification ensures effective risk management as unidentified sources of
losses escalate into unmanageable events with unexpected outcomes
(Williams et al., 1998:64-66; Green & Trieschmann, 198436 cited by
Tchankova, 2002:290). The focus is not only directed at the inability to
36 Green, M.R. & Trieschmann, J.S. 1984. Risk and Insurance. Cincinnati: South-Western Publishing.

70
identify loss causing risks, but also includes the inability to identify
opportunistic events. The effect of the non-identification of positive risks
equates to the effect of non-identification of negative risks (Dickson &
Hastings, 198937 cited by Tchankova, 2002:291). Risk identification
entails the identification of all possible organisational risks and
opportunities, as well as the conditions giving rise to these risks and
opportunities. Risk identification therefore facilitates the effective studying
of areas and activities where organisational resources are at risk, affecting
their ability to achieve their business goals (Williams et al., 1998:64-80;
Tchankova, 2002:291; and McNamee, 1998:29).
According to Valsamakis et al. (1996:87-88; 2000:25-26), risk identification
should be regarded as the single most important activity of the risk
management process, and should be approached in a systematic way.
Risk identification techniques are designed to gather information on:
The sources of risk: Elements of the organisational environment
with possible positive or negative outcomes, e.g. market conditions.
The objective of risk identification is the identification of all types of
risk. Possible sources of risk according to Williams et al. (1998:66-
68) and Tchankova (2002:293-295), should therefore be broadly
construed to include:
o The physical environment, e.g. weather.
o The social environment, e.g. human values.
o The political environment, e.g. influences on monetary policies.
o The legal environment, e.g. inconsistency due to different legal
standards.
o The operational environment, e.g. manufacturing activities may
harm employees.
o The economic environment, e.g. inflation, interest rates.
o The cognitive environment, e.g. what is perceived and what
actually exist.
37 Dickson, G.C.A. & Hastings, W.J. 1989. Corporate Risk Management. London: Witherby & Co.

71
Hazards/risk factors: Conditions that increase the probability of a
loss or its impact and that arise in one or several environments, e.g.
incorrect market expectations forecast by management may increase
the probability of a loss.
Perils: The cause of the loss, e.g. a fire in a warehouse. A
characteristic of a peril is that it only has a negative connotation
(Hance et al., 199138 cited by Tchankova, 2002:292).
Exposures to risk: Objectives/circumstances that may be affected
by a possible loss or gain (Williams et al., 1998:30-31,64-66; and
Tchankova, 2002:292).
Organisational exposures are identified during the risk identification phase.
Several formalised methods are available to organisations, and are usually
used in combination to identify the broad organisational risk environment.
The first step is evaluating the organisational processes to determine the
method by which the organisation achieves its overall objectives, and what
influences can prevent the organisation from achieving these objectives.
In conjunction with this activity, the past organisational and community
experiences are assessed while attempting to project new organisational
exposures that will arise in the future due to changes in the environment,
e.g. legislative, market, and economic changes. The degree of exposure
will vary in that some exposures could have catastrophic effects on an
organisation, but is highly unlikely to occur. In comparison, other
exposures might have a relative insignificant effect on the organisation,
but may occur frequently (Andersen & Terp, 2006:34-36).
A systematic risk identification approach (Valsamakis et al., 2000:25), is
achieved by considering the organisation’s risks in the macro- and
microorganisational environments. Macro risk identification concerns the
identification of significant risk sources, which may have severe adverse
financial implications for the organisation. Micro risk identification is
pivotal to physical risk management, as it identifies subsources of risks
38 Hance, B.J., Caron, C. & Sandman, P.M. 1991. Industry Risk Communication Manual. Boca Raton: Lewis Publishers.

72
within the main risk areas. According to Valsamakis et al. (2000:36-38),
macro risk identification comprises three categories in the corporate
environment, namely:
Inherent business risks: This includes all the organisational
activities, decisions and events, which impact on the earning levels of
the organisation. These risks are inherent to the main business of
the organisation and cause fluctuations in the earnings of the
organisation. Two categories of inherent risks can be defined,
namely:
o Unsystematic risk: Unsystematic or specific risk is tied to the
organisation and unrelated to the rest of the economy.
o Systematic risk: Systematic or market risk stems from events,
which influence the economy as a whole.
Various methods can be used to identify possible risks, namely
(McNamee, 1998:34-35):
o Analogies to similar activities.
o History of the activity.
o Industry surveys centred on the critical issues.
Incidental risks: These risks flow naturally from organisational
activities, but are regarded as incidental as they do not form part of
the primary business of the organisation. However, they are regarded
as necessary to ensure business continuity.
Event (pure) risks: Are non-speculative risks with only a downside
potential. They can usually be attributed to specific events and are
traditionally, insurable.
McNamee (1998:29), employ a different methodology in the approach to
risk identification, namely an exposure analysis, an environmental
analysis, and a threat scenario approach:
Exposure analysis: In the exposure approach, the focus is directed at
assets since they are exposed to risk in achieving organisational
objectives. This approach works best in processes that are mainly
dependent on their assets for achieving their goals, for example
73
manufacturing activities and inventory processes. Consideration is given to
these asset attributes, namely asset size, asset type, asset portability and
asset location. Assets include:
Tangible assets, e.g. machinery and buildings.
Financial assets, e.g. cash and investments.
Human assets, e.g. employee experience.
Intangible assets, e.g. reputation, information.
In the exposure approach, threats and risks are investigated that may
have a material impact on the assets (McNamee, 1998:29-30).
Environmental analysis: Organisations exist in an external environment
that consists of various subenvironments, where both current and future
activities may hold risks and threats, which may impact on the
achievement of organisational goals. These subenvironments are:
The physical environment, e.g. weather, location.
The economic environment, e.g. inflation, interest rates.
The governmental environment, e.g. existing and proposed laws,
regulations.
The competition, e.g. direct and indirect competition.
Customers.
Suppliers, which includes unions.
Technology.
The environmental approach is best suited for service-orientated
processes and processes that are highly regulated or competitive, e.g.
sales functions, customer service processes, internal service functions
such as accounting, etc. All organisations are exposed to some or other
level of environmental risks. The environmental analysis is a highly
subjective process as ‘speculation’ is generated on the current state of the
environments, and how they may change in the future. This ‘speculation’
is multidimensional, as it considers various inputs and should be done in
collaboration with management (McNamee, 1998:30-32).
Threat scenarios: This approach is best suited to situations of fraud or
security issues, and require a specialist to facilitate the process. Threat

74
scenarios are bound to certain time periods, since the consequences of
threats change over time. Threat scenarios may be for specific times such
as hours, or forecast for short-, medium- or long-term scenarios. Short
time threats are categorised as errors, omissions, delays and fraud. The
threat scenario process consists of documenting the asset subjected to the
risk, the specific threat, consequences of the threat, and methods the
threat is usually realised by. Thereafter, attention is given to controls to
mitigate or eliminate the risks (McNamee, 1998:32-33).
In selecting the optimum approach, cognisance should be taken of the
nature of the organisation. More often than not, risk identification is
executed by using all three approaches, where one approach is the
primary method and the other two approaches ensure the whole spectrum
of risks are covered, to provide a complete perspective for planning
purposes.
Bowden et al. (2001:12), proclaim the use of a three-element risk
identification process, namely:
Identification of risk events.
Estimation of the probability of the occurrence.
Description of the consequences of the realised events.
This process involves the formulation of a comprehensive list of risk
events that may impact all organisational activities. The estimated
probability and consequences of the risks are evaluated, taking
cognisance of the effectiveness of current controls or future anticipated
controls that may influence the risk.
Various sources of information and methods may be utilised during the risk
identification phase, which amongst others, may include:
Scenario brainstorming.
Industry benchmarking.
Expert judgements from the project team, internal advisors and
external advisors pertaining to commercial or technical issues.
Analysis of past, present and projected future operations.

75
Document assessments, e.g. contracts, technical manuals, etc.
Analysis of historic losses.
Analysis of operating reports and financial statements.
Internally created survey or checklist.
A schematic depiction of organisational activities and
interrelationship to all stakeholders (Bowden et al., 2001:12-13;
Hollman & Forrest, 1991:51-53; Andersen & Terp, 2006:24-36;
Chapman, 2001:147-160; and DEAT, 2006:Online).
Qualitative and quantitative risk identification techniques are used in the
risk identification process. It is of importance to note that these techniques
are not necessarily used in isolation, and may be used in a combination
approach to achieve optimum benefits from both approaches (Leopoulos
et al., 2006:323). Sophisticated techniques such as knowledge
management systems may be used to assist management in the risk
identification process (Kirytopoulos et al., 2001b39 cited by Leopoulos et
al., 2006:323). Knowledge management tools include the development
and maintenance of risk history registers, which store the risk history of the
organisation to be used in the forecasting of future projects. It is of
importance that attention is directed not only at the maintenance of such
risk databases, but also to ensue that continuous scrutiny is directed at
opportunities to enhance this register (Nonaka & Takeuchi, 199540 cited by
Leopoulos et al., 2006:323). All risks identified using the abovementioned
methods should be communicated to the designated individuals for
analysis and evaluation (Leopoulos et al., 2006:323).
Other sophisticated techniques (White, 1995:36-41), which may be used in
risk identification include:
Failure Mode and Effects Analysis (FMEA): FMEA represents a
structured brainstorming session to identify possible problems, which
39 Kirytopoulos, K., Leopoulos,V., Malandrakis, C. & Tatsiopoulos, I. 2001b. Innovative knowledge system for project risk management. Advances in Systems Science (WSES Press):505-510. 40 Nonaka, I. & Takeuchi, H. 1995. The Knowledge Creating Company. Oxford: Oxford University Press.

76
may occur in a process or system. The concept behind FMEA is that
each process and system can be broken down into parts and
analysed.
Fault Tree Analysis (FTA) and Event Tree Analysis (ETA): FTA
and ETA are systematic methods to identify the originating cause of
a specific condition and the consequences forthcoming from an
event. The underlying premise of FTA and ETA is that events are
mutually exclusive and therefore do not identify common mode or
failures.
Hazard and Operability Study (HAZOP): It is a brainstorming
technique used to identify risks pertaining to specific components.
The major criticism levied against this method is the failure to
address interdependencies between elements.
Cost Benefit Analysis (CBA) and Risk Benefit Analysis (RBA):
CBA is founded on the principle that alternatives can be selected by
comparing the benefits and disadvantages of each choice. It is a
method for estimating and quantifying risk. The concepts
underpinning RBA is that expected benefits from a choice are
balanced against the expected risks. It is assumed that
organisations are prepared to undertake increasing risk but only
when the expected benefits increase proportionately.
Human Reliability Analysis (HRA): HRA is a technique used to
identify events where human interactions may lead to potential
failure.
Sensitivity Analysis (SA): SA is based on grading the significance
of future effect scenarios (‘what if’ questions). Criticism of this
technique is that it leads to over-simplification of problems and the
exclusion of many considerations.
Hertz type simulation: This computer simulation model analyse
scenarios, where key variables simultaneously impact on a situation.
Monte Carlo simulation: The Monte Carlo simulation technique
allocates values to variables on the basis of their probability of
occurrence.

77
Risk perception techniques: Historical data is projected on future
choices. However, time influences on behavioural changes are not
taken into account.
Delphi method: This technique aggregates expert opinions.
Expert system: This technique uses artificial intelligence to emulate
an expert’s reasoning process.
Most of the abovementioned techniques are based on dividing a process
into its elementary components for analysis. This reductionist view fails to
consider the interactions between components and new risks that may
arise as a result of the interaction with the internal and external
environment (White, 1995:41).
Risk discovery contemplates all exposures, including direct losses such as
the need to replace stolen property and indirect losses such as loss of key
employees through death or retirement (Hollman & Forrest, 1991:51-53).
Risk identification is not a static process, but should be the focus of
continued evolution. Changes in the environment due to the
macroeconomic frame, changes in the political dispensation, social
changes etc, require continuous identification of new risks. The
identification of risks is therefore not only limited to existing risks impacting
the organisation at present, but also anticipated new risks that the
organisation may encounter in the future (Williams et al., 1998:64-66; and
Tchankova, 2002:293). For each identified risk, the following should be
captured in a key risk register (Bowden et al., 2001:13):
A brief description of the risk identified.
The various possible causes of the risk and the consequences if
realised.
The main organisational area where the risk may occur.
The critical success factors that may be affected if the risk does
realise.
An evaluation of the probability of occurrence and the expected
impact.
The department/person responsible for managing the risk.

78
It is important to acknowledge that no single risk identification method is
sufficient to identify all risks. A combination of methods is therefore
proposed to ensure that the identification is as encompassing as possible.
Furthermore, the various risk identification methods have been developed
in response to industry-specific problems with certain methods more
suitable for some industries than others. From the above the analogy can
be drawn that risk identification should not be undertaken in isolation, but
as a consultative approach with involvement from as many people as
possible (Valsamakis et al., 1996:99-100; 2000:92).
2.10.4 Risk assessment activities
Risk identification is followed by risk assessment and analysis. It does not
suffice to focus only on identifying hazards, risk factors and exposures.
Equally important is the process of gaining an understanding of the nature
of these events, their causality, and the process whereby they create a
loss or gain. Virtual risks, i.e. perceptions of risks and uncertainty, should
also be analysed since these may have a profound impact on the
management of an organisation. Risk measurement represents a
systematic process that evaluates the probability of event occurrence and
the value of a loss or gain on a two-axis matrix of frequency and impact by
way of qualitative or quantitative techniques (Williams et al., 1998:30-31;
Pickford, 2001:55; and DEAT, 2006:Online). When determining the
financial effect or consequence of an event, the indirect effects should also
be determined as these may be significant (Williams et al., 1998:77).
Deshotels (1995)41 cited by DEAT (2006:Online), states that the concept
of risk is complicated due to the narrow focus of the society on event
consequences without considering the probability of the event. The
purpose of these risk assessment activities is to classify risks in prioritised
groups aiding in the development of a risk management strategy (Bowden
et al., 2001:13-14). Any risk management system must have the capability
to assess and manage risk; therefore a risk measurement methodology
41 Deshotels, R. & Zimmerman, R.D. 1995. Cost Effective Risk Assessment for Process Design. New York: McGraw-Hill.
79
should be formulated to allow comparisons to be made between the
different types of risk (Young, 2006:33).
According to Valsamakis et al. (2000:26), risk evaluation and assessment,
together with risk identification, provide the foundation for risk
management actions and are therefore the most important steps in the risk
management process. It is of importance to note that in practice, the risk
identification phase and the risk measurement phase are to a certain
extent, likely to occur simultaneously, as a level of risk importance must be
reached before attention is directed at the management of a particular risk.
2.10.4.1 Risk assessment guidelines
Before any risk is assessed, the nature and scope of the risk should be
determined. Olsson (200242) cited by DEAT (2006:Online), suggests that
the following risk characteristic be determined:
The duration of the risk, i.e. time.
The probable size of the risk, i.e. exposure.
The probability of the risk occurring, i.e. probability.
The degree of variance between the risk outcome and the expected
outcome, i.e. volatility.
The difficulty in understanding the risk, i.e. complexity.
The types of risks involved, i.e. interrelationships.
The controllability of the risk, i.e. influence.
The cost of addressing the risk and the benefits gained from such
actions, i.e. cost-effectiveness.
The consistency of the risk over time, i.e. life cycle.
It is essential that clear guidelines are established for the risk assessment
process, to ensure that adequate measuring of risks is achieved
throughout an organisation. The following principles should be adhered to
(Young, 2006:66):
42 Olsson, C. 2002. Risk Management in Emerging Markets. Harlow: Prentice Hall.

80
Reliability: To achieve accurate risk measurement, the information
should be validated.
Auditable: The risk identification and assessment process must be
auditable in order to assure management that the use of information
was indeed objective and accurate.
Objectivity: Risks should be measured by using standardised and
objective criteria.
Consistency: Risk data should be applied and used in a consistent
way to facilitate comparisons between different departments,
business areas, etc.
Relevance: The data used to identify risk should be relevant to the
organisation, therefore allowing management to make accurate
decisions based on the risk measurement.
Transparency: Risk reporting and assessment should be done in a
way that encourages transparency.
Completeness: All material risks should be identified and
processed.
2.10.4.2 Risk assessment process
Risk assessment can be performed at various organisational levels
(DEAT, 2006:Online), namely:
At a strategic level, where the results of the assessment can alter
the organisation’s focus or business direction.
At a group or macro level, where the results of the assessment can
influence the nature or activities of the organisation.
At a micro or operational level, where the results of the
assessment can change the working methods or the process.
The risk assessment process is initiated by the gathering of additional
information from sources such as audit reports, budget plans, and
discussions with management, to perform a complete evaluation of all
significant risks impacting on the organisation. These risks would have
been identified during the risk identification phase, but are updated and

81
verified during these information gathering sessions, especially in
circumstances where there was a change in the business or operating
environment (Young, 2006:57-68).
The process of risk assessment includes both simplex and complex
methods. Simplistic techniques such as an educated guess or gut-feel of
management or in-house experts should not be underestimated, and the
use of sophisticated techniques like a Monte Carlo simulation, should not
be overestimated (Andersen & Terp, 2006:36-37). Various sophisticated
techniques such as ‘fuzzy sets’ and ‘neural networks’ exist, however due
to their complexity are not likely to be adopted for use by the industry and
especially SMEs (Carr & Tah, 200143 cited by Leopoulos et al., 2006:323).
Organisations should determine the level of sophistication that will provide
them with appropriate information for decision-making purposes. Further
prerequisites for successful risk assessment are management’s support,
adequate time and adequate resources. Various risk assessment
techniques may be applied simultaneously depending on the
circumstances of the organisation, while a risk assessment workplan
should follow a rigorous methodology to analyse risk. It is essential that
organisations define the methodology they intend using before the
commencement of the risk assessment phase. Organisations should
however take cognisance of the fact that whatever methodology they
intend using, is founded on data, analytical procedures and
recommendations based on human judgements by specialists and non-
specialists alike. This necessitates the importance of ongoing risk
monitoring, and a repetitive risk assessment activity (Andersen & Terp,
2006:36-37).
According to Baker et al. (1999:98-99), risk analysis techniques are
usually grouped into qualitative and quantitative techniques. A qualitative
technique is an assessment expressed in relative terms pertaining to the
43 Carr, V. & Tah, J. 2001. A fuzzy approach to construction project risk assessment and analysis: construction project risk management system. Advance Engineering Software, 32:847-857.

82
risk effect and frequency, e.g. high risk versus medium or low risk, and is a
subjective technique dependent on various variables such as the analyst’s
experience. Techniques used vary according to industry, but some
regularly used methods include personal and corporate experience,
judgement and brainstorming. Medium or high risk events identified
through qualitative analysis, should be subject to quantitative assessment
and scrutiny. Quantitative techniques provide numerical probabilities of
consequence and frequency, that are usually based on mathematical or
computer models modifying the results obtained from qualitative analysis.
Quantitative analysis draws on values derived from historical databases or
estimated values, which incorporate elements of subjectivity. Quantitative
techniques used include according to Hyatt, 200344 cited by DEAT
(2006:Online) and Baker et al. (1999:98-99), expected net present value,
algorithms, decision matrixes, decision trees, break-even analysis, fault
tree analysis and simulation. In a survey conducted by Baker et al.
(1999:98-99), the majority of respondents agreed with the generally
accepted approach that qualitative and quantitative techniques
complement each other and are best use in a combination approach, one
after the other. A small minority i.e. 20% of respondents preferred the sole
use of qualitative methods, probably because of insufficient data available
for quantitative use.
To minimise the bias that is associated with qualitative (subjective)
assessments, the following methods can be applied (Williams et al.,
1998:79-80):
Statistical measurement: The use of observable facts and data to
substantiate subjective estimates facilitates the use of statistical
processes to measure the subjective risks.
Pattern or profile measurement: Subjective risks are classified in
accordance with the aggregate risk pattern of the activity/department
in relation to established risk standards. As a result, subjective risks
44 Hyatt, N. 2003. Guidelines for Process Hazard Analysis. Hazards Identification and Risk Analysis 3rd Edition. Canada: Dyadem Press.

83
are measured by comparing the overall risk pattern against similar
activities, with similar characteristics, and similar judgements.
Peer activities: Group decision tools such as the Delphi technique
can be used to group the experience and intuition of a larger group of
experts, whereafter consensus is reached based on their expertise.
These group decision tools attempt to eliminate personal bias.
Not all risks exposures are equally important to an organisation, and as a
result there is a need to prioritise risks so as to direct managerial focus at
the more significant risks requiring mitigation. The prioritisation process is
diagnostic in nature and entails the measuring of the risk dimension of
each exposure by determining the potential impact or consequence of the
exposure and the probability of occurrence (White, 1995:35-36; Wideman,
199245 cited by Leopoulos et al., 2006:323; Baccarini & Archer, 200146
cited by Leopoulos et al., 2006:323; Andersen & Terp, 2006:36-37; and
Hollman & Forrest, 1991:53). Loss frequency or loss probability is the
measure of the number of loss events, which occur within a defined period
(Valsamakis et al., 1996:107-109). Both the term’s probability and
consequence are often described by other terms. The following terms
tabulated in Table 2.2 below as described by Bennett (2005)47 cited by
DEAT (2006:Online), are used interchangeably depending on the
information available for use.
45 Wideman, R.M. 1992. Project and Program Risk Management: A Guide to Managing Project Risk and Opportunities. Pennsylvania: PMI. 46 Baccarini, D. & Archer, R. 2001. The risk ranking of projects: a methodology. International Journal of Project Management, 19:139-145. 47 Bennett, L.G. 2005. Understanding Risk Assessment. National Safety and Occupational Hygiene Journal, 65(2), March/April.

84
Table 2.2: The interchangeability of various terms (Source: Bennett, 2005 cited by
DEAT, 2006:Online).
OCCURRENCE DESCRIPTION
TERM USED VALUE EXAMPLE
How often function Likelihood Regularly, annually
Frequency 3 x per year
Probability 1 in 50 chance
How severe function Consequence In R, $, £, injury
Severity In R, $, £, injury
Impact In R, $, £, injury
How long function Exposure Hours, days, years
If a two-dimension risk matrix is used, risk at the assessment stage
according to DEAT (2006:Online) can be described as follows:
Risk= likelihood x consequence OR Risk= likelihood x severity
Risk= frequency x consequence OR Risk=frequency x severity
Risk= probability x consequence OR Risk=probability x severity
However, risk can be assessed three-dimensionally where the probability
of occurrence is conditional on an exposure dimension in time. By
incorporating the exposure element, the risk formula according to DEAT
(2006:Online) is adapted to the following:
Risk = Likelihood x Exposure x Consequence
More specific, the risk evaluation process comprises identifying all risk
exposures, determining the possible probability of occurrence, as well as
the possible consequences of each identified risk and assigning a value to
the determined levels. Numerical values are usually assigned for each of
the probability levels and consequence levels e.g. 1 = extremely low, 2 =
low, 3 = medium, 4 = high and 5 = very high. Once these values are
imported into the risk formula, the calculated scores become a risk rating

85
value. Provided the consistent application of these values, the risk score
for each identified risk can be compared and risks prioritised. A risk matrix
(refer to Table 2.3), can be compiled to graphically depict the risk rating for
a two-element risk formula with the axis representing risk consequence
and risk probability (DEAT, 2006:Online).
Table 2.3: A risk evaluation matrix table scoring 2 functions (Source: DEAT,
2006:Online).
CO
NSE
QU
ENC
E/SE
VER
ITY
5 Extreme 5 10 15 20 25
4
Very
Severe
4 8 12 16 20
3
Severe
3 6 9 12 15
2
Moderate
2 4 6 8 10
1
Minor
1 2 3 4 5
Value level
descriptor
1
Very
unlikely
Rare – if
ever
2
Unlikely
Seldom
3
Likely
Occasional
4
Very likely
Frequently
5
Almost
certain
Often –
daily
LIKELIHOOD/FREQUENCY/PROBABILITY
Key
Extremely high
Very high risk
High risk
Medium risk
Low risk
Germain et al. (199848) cited by DEAT (2006:Online), based on the work of
W.T. Fine, proposes a format, as shown in Table 2.4, for depicting a three-
dimensional risk formula incorporating likelihood, consequence and
exposure. This enables organisations to prioritise risks, based on the risk
48 Germain, L.G., Arnold, R.M., Rowan, J.R. & Roane, J.R. 1998. Safety, Health and Environmental Management - A Practitioner’s Guide. Georgia: International Risk Management Institute.

86
scores, in order to determine a risk profile for the risk situations assessed
(DEAT, 2006:Online).
Table 2.4: A risk evaluation scoring categorisation example (Source: DEAT,
2006:Online).
RISK SCORE – LIKELIHOOD X EXPOSURE X CONSEQUENCE
LIKELIHOOD *: L
Might well be expected (happens often)
Quite possible
Unusual but possible
Only remotely possible (has happened somewhere)
Conceivable but very unlikely (hasn’t happen yet)
Practically impossible (once in a million)
Virtually impossible (approaches the impossible)
* The probability of a loss when the hazardous event
does occur
Value
10.0
6.0
3.0
1.0
0.5
0.2
0.1
EXPOSURE *: E Continuous
Frequently (daily)
Occasionally (weekly)
Unusual (monthly)
Rare (a few per year)
Very rare (yearly)
No exposure
* How frequently the hazardous event occurs
Value 10.0
6.0
3.0
2.0
1.0
0.5
0.0
CONSEQUENCE: C
Catastrophic (many fatalities, or damage over R10
million)
Disaster (a few fatalities or damage over R1 million)
Very serious (one fatality or damage over R100 000)
Serious (serious injury or damage over R10 000)
Important (temporary disablement or damage over R1
000)
Noticeable (minor or damage over R100)
R = L x E x C: The risk score (magnitude of the risk ) is
derived by multiplying the likelihood value times the
exposure value times the consequence value
RISK CLASSIFICATION Very high risk: Consider discontinuing the operation
High risk: Immediate correction required
Substantial risk: Correction needed
Possible risk: Attention is indicated
Low risk: Risk perhaps acceptable as is
RISK SCORE Over 400
200 – 400
70 – 200
20 – 70
Under 20

87
Embedded in the risk formula of Young (2006:68-69), depicted in Table
2.5, are the elements of risk consequence and risk probability, however
the differentiating factor is the inclusion of internal control measures to
determine the residual risk. Internal controls are evaluated and rated
according to their effectiveness on the following scale:
1 = ineffective
2 = partially effective
3 = totally effective.
Table 2.5: Risk assessment framework incorporating a heat map (Source: Young,
2006:68).
Operational
risk
exposure
(inherent
risk)
Operational risk factors Impact Probability
(likelihood
X impact)
Internal
control
measures
Control
rating
(1-3)
Residual
risk
(H/M/L)
People Processes Systems External (Value
or
H/M/L)
(H/M/L)
Likelihood (H/M/L)
Internal
fraud
H L H x L = M Segregation
of duties
2 M
The residual risk, represented as the net effect after taking control actions
into account, is a product of the probability rating and the control rating.
When residual risk is rated as high, it is regarded as a key risk indicator.
Key risk indicators require management focus so that proactive action can
be taken to prevent the risk from occurring.
Business risk measurement is not an exact science as there is no
foolproof way of combining the individual likelihood of loss and the impact
of loss into an overall measurement of business risk. For a more accurate
risk measurement, a combination of qualitative and quantitative measures
should be used. However, if quantitative information is unavailable or
High Medium Low

88
inaccurate, organisations may use a qualitative approach in generating the
risk rating. Organisations should however be aware that using either one
of these approaches as the sole measurement technique is not ideal as
quantitative measurement is too rigid, while qualitative measurement is
often too vague and subjective. The optimum balance is achieved by
using a hybrid approach expressing risk in numerical terms (Young,
2006:69).
The next step is the validation of the risk data by reviewing the residual
risk. The loss history can be compared to the results of the assessment
with any large discrepancies indicating a need to review the assessment
results, e.g. when the assessment results indicate a low fraud residual
risk, while the actual loss is calculated as high. A review may indicate that
such a discrepancy is due to internal control measures that were
implemented since for instance a fraud incident, thereby reducing the
residual risk (Young, 2006:69).
During the mapping of the identified risk scenarios to enable ranking, there
are according to Andersen and Terp (2006:36-37), several factors to
consider, namely:
Risk scenarios with the estimated highest annual impact on the
organisation.
Risk scenarios that potentially threaten the continuity of the
organisation.
Risk scenarios that require the least amount of resources to correct
the possible problem.
Williams et al. (1998:79), stipulate additional guidelines that should be
considered when assessing the importance of risk:
The importance of risk is more skewed towards the loss impact than
the probability of the loss; the importance is whether the loss can
impair the organisation’s progress in achieving its vision.
Furthermore, a loss may be due to a single event or multiple events.

89
In determining the potential loss impact, the financial effect of all
resulting losses that may occur as a result of an incident, should be
considered.
A single event may negatively influence numerous persons,
activities, processes, facilities, etc.
The ultimate financial effect of an event may exceed the sum of all
direct and indirect losses, that are apparent during the forecast of the
event.
In assessing the loss severity, both the amount of the loss and the
time period should be taken into account. The anticipated loss is
easier to manage if the probable loss amount is spread over a
number of years, as supposed to a loss that should be financed
within a limited period.
The last step is the formal reporting of the assessment results to
management. The purpose of reporting is:
To provide risk information to facilitate effective risk management
decisions.
To reflect the organisation’s risk exposure.
To serve as a platform for risk control and risk financing activities.
The risk assessment process is graphically depicted in Figure 2.6,
indicating the probability and impact of the risk occurrence.

90
Figure 2.6: Graphic presentation of the likelihood and impact of potential risk (Source:
Young, 2006:70).
For example, should an organisation falls into the upper right hand
quadrant, the organisation has a high likelihood of risk occurring with a
corresponding high impact of loss. Similarly, if an organisation falls into
the lower left hand quadrant, there is a low probability of risk occurring with
a resulting low impact of loss. This enables organisations to determine the
urgency of risk attention required (Young, 2006:70).
A variety of risk measurement techniques can be used depending on the
specific needs of the organisation. The risk assessment process enables
the prioritisation of risk, thereby providing a basis for the selection of risk
management techniques to prevent or minimise the effect of business risk
(Hollman & Forrest, 1991:53; and Young, 2006:70).
2.10.4.3 Benefits forthcoming from risk assessment activities
According to the DEAT (2006:Online), the basic steps performed during
risk assessment are flexible enough to be applied to identify, evaluate and
judge a broad range of risks. The risk assessment activities further aids in
achieving statutory and regulatory compliance with, for example,
Medium risk High risk
Low risk Medium risk
Likelihood of risk
Sev
erity
of l
oss
(R v
alue
)
Requires management’s urgent attention
91
occupational health and safety regulations. The advantages of risk
assessment also filter through to risk control, resulting in proactive action
to avoid incidents, as opposed to reactively addressing risk. Suitable risk
control standards, processes and management systems can be developed
based on the detailed knowledge of risk characteristics as well as risk
causes. These risk controls can be proactively incorporated into processes
reducing or eliminating the causes of risk.
2.10.5 Selection and implementation of risk treatment options
The risk assessment phase serves as the basis for the next step in the risk
management process, namely the selection and implementation of risk
treatment options (Leopoulos et al., 2006:323). In the selection and
implementation of the risk treatment phase, management is tasked with
assessing the acceptability of risk to an organisation. This risk judgement
is made by taking the following elements into account (DEAT,
2006:Online):
The activity’s or organisational loss-bearing capacity.
The organisational risk appetite, i.e. the level of risk that is
acceptable to the organisation.
Liability exposure, e.g. statutory requirements, contracts, etc.
Social implications, e.g. social responsibility towards community.
Moral responsibility, e.g. safe working environment for employees.
Impact on reputation, e.g. specifically listed companies is vulnerable
to reputational damage impacting on share price.
Financial criteria.
During this phase, the appropriate response to the identified risks is
developed, whereafter risk treatment actions are prioritised according to
the level of the identified risk exposure. Risks with higher levels of
exposure should receive treatment before the lower levels of risks are
addressed. The event’s timing should however be considered in that
attention should be directed at risk that is expected to occur first, before
attention is directed at risks that are expected to happen at a later stage,

92
even though these risks may have higher exposure (Leopoulos et al.,
2006:323).
Although different terminology is used (refer to Table 2.6), the risk
response action options include financing techniques and operational
techniques such as avoidance (if feasible), mitigation (if manageable),
transfer (if applicable) and retention (if acceptable) (Hollman & Forrest,
1991:53; and Leopoulos et al., 2006:323). While operational techniques
are designed to alter a loss exposure, financing techniques are designed
to provide funds for losses that occur, thereby minimising the adverse
consequences (Hollman & Forrest, 1991:53).
Table 2.6: Comparison of the risk control terminology (Source: Adapted DEAT,
2006:Online).
TERMS USED IN RISK CONTROL MEANING
Finance Safety Risk Management
Decline Terminate Elimination/avoidance Some risks can be avoided by not
entering into, stopping the activity or
refraining from performing specific
hazardous activities
Acceptance Tolerating Acceptance/retention Where the risk return properties are
acceptable, or low risk outcomes can be
expected, the risk exposure is accepted
Mitigation Treating Reduction / mitigation Where action can be taken to reduce
the impact of the risk(s) to an
acceptable exposure level
Manage Transferring Transferring Where specific control activities are
applied to minimise risk exposure
through transferring or outsourcing the
risky activity to another party
2.10.5.1 Risk control
More specific, risk control is perceived as any series of activities that
prevents losses or reduces their severity, or it can be viewed as complex
methodology which encompasses numerous definitions and disciplines
(Valsamakis et al., 2000:107; and Williams et al., 1998:30-31). Risk

93
control is therefore defined by Valsamakis et al. (2000:107) as, “… a
method of countering risk”, which is exercised at the source of the risk.
Young (2006:33) defines risk control as, “… the application of techniques
to reduce the probability of loss. It aims to eliminate or minimise the
potential effect of the identified risk exposures”.
The objective of risk control activities are:
To eliminate or reduce the risk factors giving rise to a loss.
To minimise the actual loss if preventative controls were not fully
effective.
To avoid potential catastrophic events.
To enhance the understanding of risks throughout all organisational
levels.
Risk control activities should be directed at controlling risk implicit
uncertainties, namely the severity of losses and the likelihood of loss
occurrence (Valsamakis et al., 2000:27,107; and Young, 2006:88-91).
Executive management should take ownership of the risk control function
by driving the process and providing support, while line management is
usually responsible for the implementation and monitoring of risk control
(DEAT, 2006:Online). A risk control programme, embedding all risk
control activities, entails an analysis of all risk factors, i.e. the cause of
loss, as well as action plans and procedures for risk management (Young,
2006:88-91).
According to Young (2006:88-91), in designing, implementing, evaluating
and improving risk controls, organisations should familiarise themselves
with the characteristics of good controls, namely:
Controls should be logical, focused and verifiable.
Controls should be timely and accurate.
Controls should be reviewed and adjusted when deficiencies are
identified.
Controls should be improved continuously due to changing
conditions.

94
To minimise organisational risks, organisations should embed three types
of risk controls into their management processes:
Preventative controls: These controls are designed and
implemented to proactively prevent loss events from occurring.
Detective controls: These controls identify loss events as soon as
they occur, to limit the effect of the occurrence on the organisation.
Contingency controls: These controls help ensure the sustainability
of an organisation once a risk event has occurred.
Risk control activities are primarily directed at the downside of risk in order
to prevent the negative consequences of a risk event or to reduce the
severity of the event (Young, 2006:88-91).
Operational risk control techniques:
After risks are graphically mapped in terms of impact and likelihood, risk
mitigating decisions can be taken, as depicted in Figure 2.7, and executed
through risk action plans.
High
Low Likelihood High
Figure 2.7: Key risk mitigating decisions (Source: Young, 2006:90).
Risk action plans should as a minimum:
Assign responsibility for coordinating risk efforts and assign
ownership of risks to individuals/groups.
Sev
erity
(val
ue)
Transfer the potential effect of the loss event
Avoid the business/activity that could result in losses
Improve internal control measures to counter/prevent a loss event from occurring
Accept the consequences of the potential loss event when it occurs

95
Provide additional analysis and mitigation actions needed.
Specify the time schedule of activities.
Determine the outcome of the activities.
Assign responsibility for following up actions.
These risk decisions should be taken in accordance with the organisation’s
risk appetite for achieving organisational objectives (Bowden et al.,
2001:14; Andersen & Terp, 2006:36-37; and Young, 2006:88-91).
The four options approach:
Conceptually, four options are available when deciding on the appropriate
risk management action:
Risk avoidance: Avoidance represents a decision not to engage in a
particular high risk activity/exposure/process or to refrain from any
risk event-related action to completely eliminate an anticipated
exposure. Risk avoidance has limited use in practice, since to avoid
industry-related risks, the organisation never has to enter the
industry, or immediate leave the industry. On a sophisticated level,
risk avoidance could entail refraining from buying or selling from any
organisation that is exposed to the particular industry. In the modern
economy with complex interactions between organisations, such a
risk strategy would be difficult to implement (Hollman & Forrest,
1991:54; Andersen & Terp, 2006:38-39; and Young, 2006:31-32).
Risk acceptance: Risk acceptance is usually exercised when the
likelihood of a risk occurring is extremely low or when the impact of
the risks is negligible (Young, 2006:31-32).
Risk transfer: During risk transfer, the ultimate exposure is
transferred to another entity outside of the organisation. Risk
transfer examples include using sub-contractors, outsourcing
activities to independent vendors, using insurance where the cost of
the loss when realised is carried by the insurance company.
Organisations using risk transfer as the selected option, should take
cognisance of possible residual risk exposure that may cause a
possible loss to the organisation (Andersen & Terp, 2006:41; and
Young, 2006:31-32).

96
Risk mitigation: The risk mitigation approach can be viewed either
as a holistic approach in reducing risk by addressing both risk
severity and probability (Young, 2006:31-32), or as comprising two
subcategories of risk prevention, directed at reducing the probability
of a loss occurring, and risk reduction, directed at reducing the
severity of a loss (Hollman & Forrest, 1991:54-55; and Andersen &
Terp, 2006:39-40). The economic slowdown with the accompanied
organisational drive for cost reduction renewed the focus on risk
mitigation activities as an alternative to conventional insurance.
Organisations can incorporate risk mitigating activities though actions
such as product diversification, thus reducing their dependency on a
single source of income (Mundy, 2004:13-14). When successful risk
mitigation occurs, the events distribution of outcome follow a more
bell-shaped curve, therefore less extreme, benefiting organisations in
that less equity capital is required as opposed to if it had not
undertaken risk mitigation activities. Economical risk mitigation
actions can contribute towards a higher return for shareholders
(Kimball, 2000:9,11). Risk mitigation efforts may however be
ineffective due to various factors such as agency risk49, a risk’s ability
to change form or shift, as well as the incremental failure of risk
management activities over a long period of time. Organisations
become desensitised to risk, which lead to the gradual decline in risk
mitigating activities, resulting in the accumulation of seemingly
insignificant failures into a major loss (Kimball, 2000:9).
Risk avoidance, acceptance, transfer and mitigation refer to risk options
available to an organisation when managing its risk exposure. These
however do not address the specific steps management will follow in
giving effect to its choice. These choices should not be seen as to operate
in isolation, since in practice they are usually used in a combination
approach to ensure an all inclusive and systematic review of the overall
organisational exposure. Management is tasked with determining and
49 Agency risk is when an employee inadvertently or purposefully fails to follow risk mitigating policies and procedures (Kimball, 2000:11).

97
implementing a risk management process that is appropriate for the
organisation (Hollman & Forrest, 1991:59; Andersen & Terp, 2006:37-38;
and Young, 2006:33). Specific action taken by management in response
to risk is insurance, geographic and product line diversification, screening
and monitoring customers, relationship development, interpartnership
structures, developing risk management awareness and risk management
competencies, etc. (Kimball, 2000:11; and Ritchie & Brindley, 2007:310).
Management should assess the existence and character of residual risk,
which is left after all risk efforts were made to avoid, control or share risks.
If the residual risk is at an unacceptable level, it should be managed,
reported on, and additional risk treatment methods be implemented in
addressing such risks (Bowden et al., 2001:14-15). In addition to residual
risk, control risk should also be considered. Control risks culminate as a
result of risk controls which fail resulting in ineffective internal controls.
Both residual risk and inherent control risks should receive management’s
attention (McNamee, 1998:81).
Risk financing: Risk financing is a technique used to treat risk by
reimbursing losses that occur despite the implemented risk control efforts.
Risk financing techniques do not alter the loss exposure itself, but provide
funds for losses incurred, as well as for the recovering of loss events when
risk control failed, or where risks cannot be managed adequately (Hollman
& Forrest, 1991:56-57; Williams et al., 1998:30-31; and Andersen & Terp,
2006:42). Organisations need to select the most efficient risk financing
method, by taking cognisance of each risk control method’s advantages
and costs. The following aspects according to Young (2006:34), DEAT
(2006:Online) and Valsamakis et al. (2000:27-28), should be considered: The retention of risk (internal financing) under a self-funding plan.
Within such a dispensation losses are financed using internal funds
such as retained earnings, reserves and provisions, e.g. losses are
financed and ‘hidden’ in a repair account.
The combination of internal and external funding, i.e. shared funding.
Commercial insurance serves as an example, where the insurance
98
premium is reduced in response to the insured’s agreement to pay an
excess or deductible amount, should a loss occur.
Transfer funding/external funding, where the cost of risk is transferred
to a third party through e.g. commercial insurance. Traditional
insurance policies do not provide cover for all types of losses, which
may necessitate the need for additional insurance purchases.
2.10.6 Monitoring, review and continuous improvement of risk actions
Risk monitoring is the final stage of the risk management process in terms
of which an organisation ensures the effectiveness of its risk management
techniques and activities within the boundaries set by organisational
policies and procedures (Hollman & Forrest, 1991:63; and Young,
2006:34). If existing controls are found inefficient, risk controls should be
revised or new controls implemented, thereby facilitating continuous
improvement in the organisation (DEAT, 2006:Online).
Continuous monitoring at all organisational levels, is important to any risk
management process against the background of a constantly changing
environment e.g. legislation, market conditions and competitors.
Management should be informed of new developments and the potential
impact of these on the organisation’s risk exposure. These changes
necessitate the need for continuous evaluation and adjustment to controls
and risk measures. Such monitoring and review should be executed
through internal and external audit, regular investigations (e.g. system
testing), and regular reporting. Such mechanisms should contain clear
and relevant information and organisational management reviews in terms
of which management and shareholders are kept informed about the
organisation’s risk exposure, risk control actions taken and the
organisational preparedness to deal with risk events (Kubitscheck,
2000:41; Bowden et al., 2001:14-15; and Andersen & Terp, 2006:44).

99
The detailed risk management process, concluded with the final phase of
risk review, monitoring and continuous improvement, is graphically
depicted in Figure 2.8.

100
Part trans-ferred
No
Yes
No
Part re-tained
Yes
Implement risk action plans
Prepare risk action
Assess risk treatment options
Identify risk treatment options Co
mm
unic
atio
n an
d co
nsul
t
Define risk targets & criteria
Establish the context
Identify risk events
Assess Assess Likelihood Consequences
Short-list and rank risk events
Compare event and total risk Assess existing risk with targets and criteria management practice against risk profiles
Evaluate and rank risk
Risk acceptable?
Accept
Reduce likelihood
Reduce consequence
Transfer in full or part
Avoid
Consider feasibility benefits and costs
Recommend risk treatment options
Formulate risk treatment strategy
Prepare risk treatment plans
Reduce likelihood
Reduce consequence
Risk acceptable?
Retain
Mon
itor
and
rev
iew
Avoid
Figure 2.8: Overview of the risk management process (Source: Bowden et al., 2001:9).
Transfer in full or part

101
During monitoring, review, and continuous improvement, organisational
attention is directed at confirming the actual implementation of risk
reduction methods, the effectiveness thereof, as well as the identification
of new risks in order to limit risk exposure (Bowden et al., 2001:14-15).
2.11 RATIONALES FOR RISK MANAGEMENT WHICH ENHANCES VALUE
Managers’ personal bias may have an influence on risk management
priorities in that they may have large investments in an organisation i.e.
their skills etc., which they wish to safeguard. Managers as a rule are
concerned with risks that may have an adverse impact on organisational
profits, and may lead to possible bankruptcy. Furthermore, times of
economic slowdown or general financial distress including bankruptcy,
may lead to the replacement of the current management. In addition,
management as a result may be willing to enter into arrangements where
they engage in risk management activities that reduce profit in good
economic times, while supplementing the organisational income in bad
times (Cummins et al., 1998:30).
Corporate accountability, in particular the manner in which organisations
engage in their fiduciary duties, necessitates managers to adopt a rational,
defensible method to determine how risk management cost is to be spent.
By assessing risk, managers are able to differentiate between acceptable
and unacceptable risk events, and as a result enable them to capture and
process information to assist them in the development of a risk
management strategy (Bowden et al., 2001:15). Furthermore, a sound risk
management policy provides owners with confidence in the capabilities of
the organisation in managing risk; owners can thus direct their attention to
less manageable speculative risks, which they seek to avoid (Hollman &
Forrest, 1991:64).

102
In addition to the reasons discussed above, managerial motives for risk
management according to Valsamakis et al. (2000:16-17), can further
include the following:
Cost beneficial activities in risk management are undertaken with the
emphasis on achieving efficient long-term risk-return trade-offs.
People are prepared to forgo a part of the existing wealth to
safeguard the remainder of the wealth. People are risk adverse,
which can lead to actions which are not always cost-beneficial. This
influences the risk management programme.
The design and implementation of a risk management programme
can serve as a by-product of other managerial actions, e.g. the
implementation of a quality assurance programme may be due to the
organisation’s strive for excellence, and not in response to a
managerial need to reduce liability resulting from defective products.
Authoritative reasons such as regulatory compliance can drive risk
management activities.
The versatility of the risk management process facilitates its use in that it
provides a generic framework to identify and manage all types of risks
throughout all divisional levels of an organisation. The framework requires
continuous review by which continued improvement in controlling risk is
effected (DEAT, 2006:Online). It thereby aids in aligning the organisation,
whereby the organisational objectives are clearly visible and understood,
positive and negative risks in achieving the objectives are identified and
understood, and risk responses i.e. controls, are aligned (Anderson,
s.a:40-42).
2.12 CONCLUSION
Under the auspices of a traditional risk management approach,
organisations use disaggregated methods to manage risk, causing a silo-
based risk approach (Liebenberg & Hoyt, 2003:39). Within the ambit of
such a dispensation, risks were either categorised into hazards, financial,
operational, technological and strategic risks, and managed in isolation.

103
Due to the silo-based risk approach, no coordination of risk management
activities occurred and the identification of possible new risks were
neglected (Rao & Marie, 2007:10-11).
Traditional risk management typically views risk as individual hazards,
failing to consider the interconnectedness of risks. Risks are identified
without allocating responsibility for risk ownership, and employees in
general tend to shy away from accepting any responsibility towards risks
(Banham, 2004:68). In addition, some organisations tend to limit their
attention to insurable risk, while others neglect to link business risks to
business objectives, leading to a large volume of identified risks not being
linked to the organisation’s critical objectives (McCuaig, 2000:18).
Although many organisations have a risk-related department such as a
compliance function, these departments are generally not well-developed
and have a narrow scope within which they operate. Activities are centred
on a control base or regulatory base, and do not encompass a broad risk
view to manage risk effectively. In addition, many of these departments do
not sufficiently link risk management processes to business strategy. In
today’s business environment, traditional risk management activities do
not suffice (Bowling et al., 2003:16-17). It is non-refutable that risk
management should be approached in a holistic and integrated fashion.
Management should be tasked with applying the risk management steps
consistently at all levels in the organisation. The value of risk
management is attributable to its proactive nature, identifying risks that
can influence the strategic direction of an organisation (Kubitscheck,
2000:39).
The mismanagement of risk can lead to financial loss, reputational loss,
decreased shareholder value and the destruction of the organisation.
Therefore, in today’s business environment, organisations need to adopt
an enterprise risk management approach (Rao & Marie, 2007:10-11).

104
CHAPTER 3
ENTERPRISE RISK MANAGEMENT – A LITERATURE
REVIEW
SYNOPSIS
Traditionally, the scope of risk management was narrowly focused on
hazard or property/liability risks, while risk management strategies centred
on insurance solutions. However, changes in the business landscape
underpinned organisations’ move towards a more integrated,
comprehensive and strategy-focused risk management discipline, defined
as Enterprise Risk Management (ERM).
Organisations’ response to risk evolves along an ERM maturity continuum,
where the initial compliance focused activities are refined and optimised
affecting an integrated, strategy-aligned risk process. Although
organisations’ ERM activities can be executed by using various
approaches, a generic ERM process of risk identification, risk
measurement, risk mitigation and risk monitoring can be more suitably
applied.
Various frameworks go beyond the traditional risk management focus by
advocating a link to strategy and strategic risks. However, on evaluation of
these frameworks, it is evident that inefficiencies exist as strategy
formation, business and growth opportunities, and guidance in the risk
evaluation and communication process, are not addressed.
Embedding ERM into an organisation, holds many advantages such as
helping the organisation meet its vision. However, various limitations
impede on the successful implementation of ERM, as evidenced in
surveys conducted in organisations in Denmark, Western Europe, United
Arab Emirates, United Kingdom and Germany.

105
The content of Chapter 3, along with the relative positioning of the topics,
is graphically depicted in Figure 3.
Figure 3: Detailed layout of Chapter 3 – Enterprise risk management: A literature review.
INTRODUCTION
KEY DRIVERS OF AN ERM APPROACH Operational and market forces Legislation enforcement and
Code of Conduct guidance
ERM MATURITY CONTINUUM Organisations’ ERM
evolvement
CHARACTERISTICS OF AN INTEGRATED RISK MANAGEMENT APPROACH
DEFINING ERM
INTEGRATED RISK MANAGEMENT Introductory notes
pertaining to integrated risk management
Approaches to ERM The ERM process
o Activity one - environment and strategy
o Activity two - risk identification
o Activity three - risk assessment and prioritising
o Activity four - risk mitigation and control
o Activity five -information and communication
o Activity six - monitoring, reporting and continuous improvement
ENTERPRISE-WIDE RISK MANAGEMENT FRAMEWORKS The four frameworks
o Generic six-stage risk model
o Mapping organisational strategy to the four ERM frameworks
IMPEDIMENTS TO EFFECTIVE ERM PROGRAMS
RISK MANAGEMENT: CASE STUDY EVIDENCE Risk practices in Danish companies Risk practices in Western European,
Asian/Pacific and North American companies
Risk practices in United Arab Emirates (Dubai) companies
Risk practices in United Kingdom companies
Risk practices in German companies
VALUE -ADDING ERM
THE FUTURE OF ERM APPLICATIONS

106
CHAPTER 3
ENTERPRISE RISK MANAGEMENT – A LITERATURE
REVIEW
3.1 INTRODUCTION
The analytical process followed thus far, is graphically depicted in Figure
3.1, which places the chapters in context with the overall thesis objectives,
and furthermore indicates the relative positioning of this chapter.
Figure 3.1: Chapter 3 - Enterprise risk management positioning.
Enterprise Risk Management (ERM)50 differs considerably from traditional
risk management (Miccolis et al., s.a.:xviii). The difference between ERM
and more traditional ways of managing risks is that an ERM approach is
50 ERM is synonymous with integrated risk management, holistic risk management, enterprise-wide risk management, business risk management, consolidated risk management and strategic risk management.
CHAPTER ONE
Scope of the research
CHAPTER TWO
Risk management – A literature review
CHAPTER THREE
Enterprise risk management – A literature review
CHAPTER FOUR
A perspective of SME risk management in South Africa
– A literature review
CHAPTER FIVE
Survey design and methodology
CHAPTER SIX
Analysis and interpretation of survey data
CHAPTER SEVEN
Formulation of a structured risk management model for South
African SMEs

107
focused on a high-level oversight of an organisation’s entire risk portfolio,
as opposed to managing risks in isolation, i.e. the ‘silo-approach’
(Banham, 2004:65-71; and Beasley, Chen, Nunez & Wright, 2006:49).
Traditionally, the scope of risk management has been narrowly focused
with the scope of risks confined to purely hazard or property/liability risks,
while risk management strategies centred on insurance solutions. The
traditional approach has tended to treat the occurrence of risk purely as a
downside phenomenon, with little to no focus on the impact on the
organisation’s bottom-line objectives. This culminated in the focus of risk
being vested in an insurance solution, regardless of the risk materiality
(Miccolis et al., s.a.:xviii).
According to Briers (2000:17), changes in the business world and the
increasing complexity of the business environment were the driving forces
in the evolution of multifaceted risk management disciplines. Changes
such as the increased usage of computer technology, the development of
new business models, the increasing awareness of corporate reputation,
the increase in international business rivals, the emphasis shifting from the
value of tangible assets to intellectual capital, and a whole host of positive
and negative changes have created new and additional risks in the minds
of executives. Currently, risk management is used to address uncertainty
where there is no history to guide organisations.
The underlying premise of ERM is that every organisation’s goal is to
provide value to its stakeholders. Management therefore needs to
determine how much uncertainty it is willing to accept while still
contributing towards shareholder value. As events have a dualistic
character of both risk and opportunity, it holds either a potential to erode or
enhance value. ERM processes enable an organisation’s management to
effectively deal with uncertainty and in the process, enhance the
organisation’s capacity to build value (COSO, 2004:Online).
The development of an ERM programme that has the capability to deal
with all types of risk facing every part of the organisation, is aimed at by

108
many organisations. From a holistic perspective, this aim seems relatively
simple, yet many companies face numerous difficulties in the execution of
this aim as different views of risk and organisational silos, impact on the
implementation of such a programme. Despite these and other difficulties
encountered, there is considerable momentum within the business
community to develop a common approach to risk management which is
based on an approach that addresses all types of risk an organisation may
encounter. Organisations desire a holistic, integrated and consistent risk
management model, that will satisfy their needs to respond to risk
effectively (Briers, 2000:128).
3.2 KEY DRIVERS OF AN ERM APPROACH
The ERM movement has been driven by a few significant factors. The
increasing complexity of business, with a shift in firm’s vulnerability and
levels of criticality, has changed the risk profile of most corporate
organisations (Briers, 2000:128). Best practices, guided by well-debated
published reports and legislative enforcement by acts such as the
Sarbanes-Oxley Act (SOX, 2002:Online), changed the risk landscape of
organisations.
3.2.1 Operational and market forces
An organisational ERM approach is more often than not attributed to a
combination of external and internal factors. Internal factors are centred
on an emphasis to maximise shareholder wealth. This is achieved through
an integrated risk approach, reducing inefficiencies, which culminates from
the traditional silo-based risk approach, and results in the stabilisation of
earnings by preventing the aggregation of risks from different sources
(Cumming & Hirtle, 2001:1-17; Lam, 2001:16-20; Miccolis & Shah, 200051
cited by Liebenberg & Hoyt, 2003:40-41; and CFO Research Services, 51 Miccolis, J. & Shah, S. 2000. Enterprise Risk Management: An Analytic Approach. Tillinghast-Towers Perrin.[Online]. http://www.tillinghast.com/tillinghast/publications/reports/Enterprise_Risk_Management_An_Analytic_Approach/erm2000.pdf.

109
200252 cited by Liebenberg & Hoyt, 2003:40-41). Integrated risk
management eliminates the duplication of risk management activities by
exploiting natural leverages. As ERM enables organisations to improve
their understanding of the aggregate risk inherent in different activities,
managers can allocated the firm’s resources more effectively, leading to
improved capital efficiency and improving the firm’s return on equity
(Pickford, 2001:124; Meulbroek, 2002:56-70; and Liebenberg & Hoyt,
2003:41).
A further key driver underpinning ERM development relates to the
interdependencies between risks. Previously, no risk information sharing
within the same organisation occurred, as each process, activity and
department were management in isolation, and potential
interdependencies between risks across various activities, would have
gone unnoticed. Managers are now realising that risks in one part of an
organisation are likely to have an impact on other parts of the organisation
as risks do not as a rule, occur in isolation (Briers, 2000:129). The ERM
structure provides management with an integrated risk framework, that
enables the identification of risk interdependencies (Liebenberg & Hoyt,
2003:41).
The use of advanced Information Technology (IT) has enabled firms to
model complex business activities, thereby improving their understanding
of the interdependencies between firm-wide risks (Jablonowski, 2001:30-
35; and Liebenberg & Hoyt, 2003:41). The increased availability of
outsourcing options for advanced IT modelling activities has made ERM
available to a wider range of firms that lack specialised risk related
knowledge. However, recent survey evidence suggests that the
implementation of ERM programmes is slowed down by organisations’
52 CFO Research Services. 2002. Strategic Risk Management: New Disciplines, New Opportunities. CFO Publishing Corp., March.[Online]. http://www.aon.com/about/publications/pdf/issues/aon_cfo_report.pdf.

110
perceived lack of technological tools (Miccolis & Shah, 200053 cited by
Liebenberg & Hoyt, 2003:41).
External influences such as globalisation, industry consolidation and
deregulation, increased competition and legislative pressures to comply
with corporate governance, are some of the drivers of the enterprise-wide
risk management approach (Lam & Kawamoto, 1997:30-34; Miller,
1992:311-332; and Liebenberg & Hoyt, 2003:40). ERM enables
organisations to make better risk decisions as risks are incorporated in the
organisations’ strategy, in turn leading to an improvement in shareholder
value (Lam & Kawamoto, 1997:30-34; and Meulbroek, 2002:56-70).
A further source of value that can be derived from the implementation of
ERM programmes is the availability of improved information about the
organisation’s risk profile. Outsiders will likely experience difficulty in
assessing the risk profile and to a limited extent, the financial position of
an organisation. ERM enables organisations to enhance the quality and
scope of their risk reporting to outsiders, and to confirm the organisation’s
commitment to the process of risk management, resulting in a reduction of
the cost of external capital as well as the level of regulatory scrutiny
(Meulbroek, 2002:56-70; and Liebenberg & Hoyt, 2003:41).
3.2.2 Legislation enforcement and Code of Conduct guidance
The codes of conduct driving the ERM process is Basel II (Basel II,
2004:Online), the Dey report with its recommendations incorporated in the
Risk Management Policy and the Integrated Risk Management Framework
issued by the Treasury Board of the Canadian Secretariat (Canadian
Treasury Board, 1999:Online), the King report on Corporate Governance
(King II, 2002:Online; and King III, 2009:Online) and The United Kingdom
Corporate Governance Code (UK Code, 2010:Online). Basel II for
instance explicitly prescribes that operational risk must be adequately
53 Refer to footnote 51.

111
managed, while King III recommends that the board of directors should
assume the responsibility for identifying key risk areas which should be
regularly monitored, and the Dey report in Canada makes transparent the
expectation that firms should formally assess their risk management
processes and begin to disclose both the risk management processes and
their results.
The amalgamation of the recommendations by the Cadbury Committee
(Cadbury Committee, 1992), Greenbury Committee (Greenbury, 1995),
Hampel Committee (Hampel Committee, 1998) and Turnbull Committee
(Internal Control Working Party, 1999) into the Combined Code of the
Committee on Corporate Governance (Combined Code on Corporate
Governance, 2003:Online), which was amended and renamed as the UK
Corporate Governance Code (UK Code, 2010:Online), are compulsory to
all premier listed companies on the London Stock Exchange with effect 29
June 2010. This code states that: “The board should maintain sound risk
management and internal control systems”, and, “The board should, at
least annually, conduct a review of the effectiveness of the company’s risk
management and internal control system and should report to
shareholders that they have done so”.
In addition, regulations such as the Sarbanes-Oxley Act (SOX,
2002:Online), require the adoption of a control framework such as the
control framework of the Committee of Sponsoring Organisations of the
Treadway Commission (COSO, 2004:Online), which has become a
standard for accounting. The COSO framework was initially focused on
internal control, but the publication of COSO’s ERM framework (COSO,
2004:Online), incorporates the importance of risk management into good
business practice (Abrams, Von Känel, Müller, Pfitzmann & Ruschka-
Taylor, 2007:220).
Driven by the need to improve their insight into their business processes,
to understand and manage risks, to align risk management with the
organisation’s strategy, and to create greater transparency, organisations

112
must develop a strategy-linked approach to define, manage and monitor
risks from internal and external sources in their organisations (Abrams et
al., 2007:232).
3.3 DEFINING ERM
To fully understand ERM, a basic definition of enterprise risk is provided
by Dickinson (2001:361) as: “… the extent to which the outcome from the
corporate strategy of a company may differ from those specified in its
corporate objectives, or the extent to which they fail to meet these
objectives”. The corporate strategy derived from the corporate objectives
is tied to a certain risk profile, which is formulated by taking into account
various factors that might impact on the organisation’s activities and
processes.
Valsamakis et al. (2000:22), adopted a risk management definition that
reflects the managerial nature and integrated approach of risk
management. Implicit to the definition, is management’s involvement in
strategic decision-making: “Risk management is a managerial function
aimed at protecting the organisation, its people, assets, and profits,
against the physical and financial consequences (adverse) of event risk. It
involves planning, coordinating and directing the risk control and the risk
financing activities in the organisation” (Valsamakis et al., 2000:22).
The Federation of European Risk Management Associations (FERMA,
2003:Online), also addresses the strategic nature of risk management.
According to FERMA, risk management is a systematic process of
addressing risks that are attached to a company’s strategic objectives, by
ensuring that sustained benefit is achieved within all activities and
processes.
According to Schrøder (2006:66), ERM is: “… a holistic systematic and
integrated approach to the management of all key risks and opportunities
with the intent of maximizing shareholder value for the enterprise as a

113
whole”. ERM is defined by Miccolis et al. (S.a.: xxii), as: “A rigorous and
coordinated approach to assessing and responding to all risks that affect
the achievement of an organization’s strategic and financial objectives.
This includes both upside and downside risks”. Briers (2000:8),
formulated the following definition of risk management, namely: “Risk
Management is the process of intervention in economic and behavioural
risk dynamics so that the value of the organisation is enhanced”.
The well-publicised COSO ERM framework (COSO, 2004:Online), defines
ERM as follows: “ERM is a process, effected by an entity’s board of
directors, management and other personnel, applied in strategy setting
and across the enterprise, designed to identify potential events that may
affect the entity, and manage risk to be within its risk appetite, to provide
reasonable assurance regarding the achievement of entity objectives”.
According to Abrams et al. (2007:221), an evaluation of the numerous
ERM definitions show that they share three critical characteristics, namely
in that ERM should be:
Integrated: ERM must span all the lines of business.
Comprehensive/inclusive: ERM must include all types of risk.
Strategic: ERM must be aligned with the overall business strategy
and objectives of the organisation.
As companies begin to manage risk, they realise that they cannot manage
it in an isolated manner by activity, process or department alone, but
rather in an inclusive, integrated way throughout the organisation. Such
an integrated risk management practice entails the defining of risk
(positive risk, i.e. opportunities and negative risk), the establishment of risk
tolerances, the formulation of policies and procedures dealing with risk, the
inclusion of risk in all decision-making processes, taking into account the
interconnectedness of risks, and the reporting of risk in a consistent
manner, all within the boundaries of a single business strategy of the
organisation (Abrams et al., 2007:222).

114
3.4 CHARACTERISTICS OF AN INTEGRATED RISK MANAGEMENT
APPROACH
Global competition and volatile markets have necessitated the need for
risk management. A modern business environment requires a holistic risk
management approach that is comprehensive, inclusive and proactive
(Valsamakis et al., 2000:20-22). These three entities are expanded upon
below:
Comprehensive: In order to be comprehensive, three key aspects
of an organisation should be considered, namely:
o The organisation’s strategy.
o The organisation’s business processes.
o The organisation’s human capital, i.e. its people.
Inclusive: Risk management should include all the decision-making
levels of an organisation. Strategically, the organisation’s board
must provide a clearly defined framework setting the risk tolerance
of the organisation. The framework should provide guidance as to
the risk action, i.e. levels of risk acceptance, the identification of
risks to be transferred, and the identification of risks to be insured.
Management should therefore fully understand risk management
principles, and the process of embedding an integrated risk
management culture throughout all business processes in the
organisation. All operational levels of the organisation should be
involved in the risk management process to counter inconsistent
risk management approaches or risk management practised in
departmental silos that may hold unnecessary risk for the
organisation.
Proactive: Risk events should be anticipated in advance with risk
responses taken by way of risk control and risk financing activities.
Proactive risk management includes risk management in general
management activities, and prohibits the practice of isolated risk
management functions.

115
3.5 ERM MATURITY CONTINUUM
Changing business environments brought about by global competition,
technological change and the aim to attain a competitive advantage, are
motivating organisations to implement risk management processes
(Brindley, 200454 cited by Ritchie & Brindley, 2007:303).
According to Abrams et al. (2007:222-224), business response to risk
evolves along an ERM maturity continuum as depicted in Figure 3.2.
Figure 3.2: A journey to enterprise risk management (Source: Bowling et al., 2003:17;
and Bowling & Rieger, 2005:25).
Organisations initially engage in risk management activities by complying
with laws and regulations. These activities are refined and ERM progress
is made by optimising current activities to ensure sustainability. In the final
stage of an organisation’s ERM evolvement, management engages in
continuous risk management, in order to attain a competitive advantage.
54 Brindley, C.S. (ed.). 2004. Supply Chain Risk. Aldershot: Ashgate Publishing.
LEVEL 1 Compliance Policy /procedure Checklist orientation
LEVEL 2 Control Control framework Checklist orientation
LEVEL 3 Process Process view Across departments Efficiency/effec-tiveness
LEVEL 4 Risk management Common risk language Prioritising of effort
LEVEL 5 ERM Holistic risk review tied to strategy Risk management as a process High value
Value
FINANCIAL
STRATEGY
MANAGEMENT
OPERATIONS
Time

116
3.5.1 Organisations’ ERM evolvement
According to Abrams et al. (2007:222-224), an initial risk focus is limited to
compliance procedures in order to limit or avoid penalties due to regulation
transgressions. Compliance focus is centred on manual audit and control
procedures, in addition to existing procedures. These audit and control
procedures carry additional overhead cost and additional strain on
manpower availability in terms of time and expertise. Furthermore, these
additional activities are not integrated into business processes, and the
value derived from them is limited to corrective action and accurate
reporting on realised risk events.
The realisation that compliance activities should be sustainable and that
compliance procedures need to adapt to changing regulations, lead
organisations to the improvement stage. The initial focus of most
organisations will be on cost-efficiency, through the improvement of
compliance and control procedures achieved by the implementation of
standardised enterprise-wide procedures and automated compliance
status monitoring. These automated controls will over time replace
redundant control procedures, by incorporating more effectively designed
random audit checks and controls. In turn, this will help the organisation in
achieving segregation of responsibilities and an increase in accountability
(Abrams et al., 2007:222-224).
Compliance activities place strain on the resources of organisations,
resulting in organisations realising the benefit of integrating risk and
compliance activities into the organisations’ business strategy. The
improvement of business processes and the elimination of duplicate
business activities as a rule result in cost-savings and timely action in the
detection of potential risks. As the organisation further integrates risk
management, it becomes more transparent and preventative in its risk
management activities, reducing remediation costs (Abrams et al.,
2007:222-224).

117
As the organisation’s risk management activities evolve, it enters the
transformation stage, whereby an enterprise-wide risk management
approach is followed. In the transformation stage, the organisation
differentiates between risks and opportunities, by following well-defined
risk policies and regulations. During this stage, it is focused on simplifying,
standardising and rationalising processes by incorporating automated
control points into business activities, to replace manual controls.
Inefficiencies and unnecessary costs are usually identified in this stage of
risk evolution. By standardising processes throughout the enterprise, it
allows for common event infrastructure that collects information from
internal and external sources. This information is analysed and
incorporated into the business processes, to align these processes with
the holistic impact of internal and external events (Abrams et al.,
2007:222-224).
By holistically managing events, risks and opportunities linked to events
are identified and business activities are optimised. Automated processes
and policies are embedded in the organisation with a holistic risk response
and mitigation strategy. The focus is on optimising the automated
processes, to avoid substandard processes (Abrams et al., 2007:222-224).
3.6 INTEGRATED RISK MANAGEMENT
The scope of traditional risk management is limited to insurable risks.
These risks are managed in isolation at the source of the risk, i.e.
departmental or process or activity, through insurance, financial products
and internal controls to protect the organisation against its negative
economic impact. However, mismanagement, fraud and other irregularities
as was evident in companies such as Enron, WorldCom, Parmalat, and
Fidentia, placed pressure from corporate bodies such as COSO and from
legislation such as the Sarbanes-Oxley Act in the US, on organisations to
take greater accountability in managing risk on an enterprise-wide basis
(Schrøder, 2006:65). Unlike the traditional risk management approach,

118
holistic risk management transforms risk management from a ‘defensive’
activity to an ‘offensive, strategic’ process (Liebenberg & Hoyt, 2003:37).
3.6.1 Introductory notes pertaining to integrated risk management
Organisations are recognising the growing importance of managing risk
from a holistic perspective, since a ‘silo’ approach may not detect
significant risks or direct risks to less visible areas within the organisation,
thereby creating a false sense of security. The ‘silo mentality’ by
addressing risk in isolation and separating responsibility for different types
of risk, is no longer sufficient (Pickford, 2001:124). An effective risk
management policy and programme, with the support of the most senior
managers, should integrate ERM into the organisational culture. The
strategy should be translated into tactical and operational objective.
Furthermore, all employees should incorporate the managing of risk into
their portfolios. ERM leads to operational efficiency by encouraging
accountability, performance measurement and reward (FERMA,
2003:Online).
The benefit forthcoming from such an effort, is an improved understanding
of organisational risks. This understanding will at a minimum eliminate
unnecessary transactions, and enable the organisation to take advantage
of diversification (Pickford, 2001:124).
Traditional risk management has the effect that while an organisation
attempts to manage one type of risk, it may inadvertently create another.
To counter such an occurrence, organisations should use a consistent risk
methodology in measuring, controlling and managing risk by taking into
account the interconnectedness of risks, in terms of the ERM approach
(Pickford, 2001:123).
Well-executed risk management according to FERMA (2003:Online):
Address all risks.
Adds sustainable value to all business activities.

119
Imparts an understanding of the positive events (opportunities) and
negative events (risks) that can influence the organisation.
Reduces the probability of failing to achieve the organisation’s
objectives. Risk management should be a strategy-aligned, ongoing
activity throughout the organisation, subject to continuous
improvement. Furthermore, it should meticulously address all past,
present and future risks impacting on an organisation.
3.6.2 Approaches to ERM
According to Miccolis et al. (S.a.:xxxiii-xxxiv), two general ERM
approaches have emerged within the risk management arena, namely a
‘measurement-driven’ approach and a ‘process-control’ approach. These
approaches are not mutually exclusive, and share many common
characteristics with the differentiating factor their emphasis on certain
areas. Both these approaches display strengths and weaknesses, which
are elaborated upon below.
Approach 1 - Measurement-driven approach: This approach,
graphically depicted in Figure 3.3, focuses on identifying key risks
facing an organisation by taking into account the event’s materiality
and probability of occurrence.

120
Figure 3.3: Measurement-driven approach to ERM (Source: Adapted from Miccolis et
al., s.a.:xxxiii-xxxiv).
Risk reduction activities, in line with predetermined risk strategies,
are directed at the most relevant material risks. Management’s
attention is therefore directed at the most critical risk areas in the
organisation. A weakness of this approach, is the escalating nature
of risk. Seemingly insignificant risks can trigger a series of events
that initially appear small with a low probability of occurrence,
however which can quickly escalate to become significant risks while
management’s attention was directed at other risks (Miccolis et al.,
s.a.:xxxiii-xxxiv).
I. Assess risk
III. Exploit risk
IV. Keep ahead
Identify risk factors
Prioritise risk factors
Classify high-priority risk factors
Strategic risk factors
Manageable risk factors
Finance
Risk factors that cannot be mitigated
Residual risk factors
Mitigate
Model and quantify
Manageable risk factors
Shape risk factors
II. Shape risk

121
Approach 2 - Process-control approach: This approach focuses
on key business processes and the uncertainties embedded in the
execution of the business plan. The objective is to ensure informed
decision-making, by linking the process steps, reporting
relationships, methodologies and data collection, thereby managing
the events in a consistent and coherent manner while reducing the
possibility of unexpected occurrences. The process-control approach
does not categorise risk according to materiality, however it focuses
on the management of processes through the reliable, meticulous
management of business processes. This approach implicitly implies
that good processes can manage risk, but inherent to this
assumption is the risk that suboptimum processes cannot manage
risk due to lack of proper execution and monitoring (Miccolis et al.,
s.a.:xxxiii-xxxiv). An applied process-control approach is graphically
depicted in Figure 3.4.
Figure 3.4: Process control approach to ERM for procurement department (Source:
Miccolis et al., s.a.:xxxv).
The following generic processes occur in both the measurement-driven
and the process-control approach (Miccolis et al., s.a.:xxxiii-xxxiv):
Risk identification: Determining the risks across business functions
and units in the organisation.
Risk measurement: Determining the potential impact of these risk
factors.
Systems and data
Supplier strategy Supplier selection policy Ethical standards
Supplier qualification Integrated contracting process Commodity management
Supplier alliances Procurement professionals Procurement policy committee
Supplier status reports Spending by supplier contract Commodity benchmark
Supplier rating system Purchasing transaction analysis by contract Commodity planning
Procurement data warehouse Capture external data Procurement system
Business and risk mana-gement processes
Metho-dologies
Mana-gement reports
People Business strategy and policies
II. Shape risk

122
Risk mitigation: Determining the optimum approach in
managing/eliminating the risks.
Risk monitoring: Evaluating whether the risk mitigation strategy is
effective.
There is no single correct ERM approach. In practice, organisations are
likely to adopt a mixture of both of these approaches into their ERM
activities (Miccolis et al., s.a.:xxxii).
3.6.3 The ERM process
The starting point of all ERM activities is the availability of an effective and
efficient infrastructure to support the process, followed by the risk analysis
steps, which include risk identifying, sourcing and measurement. The
process includes management devising a risk management strategy as
well as the implementation of the formulated strategy. To ensure the
efficient and effective working of the processes, the risks, the risk
strategies, and the implementation activities should be monitored on a
continuous basis. All these activities should be performed keeping the
main objectives of the ERM process in mind as graphically depicted in
Figure 3.5 (Bowling et al., 2003:18).

123
Figure 3.5: Key objectives of the enterprise risk management process (Source: Bowling
et al., 2003:18).
COSO (2004:Online) identifies four categories within which an
organisation should achieve its objectives. These should be cascaded
through the organisation and aligned to the organisation’s mission,
strategic objectives, and strategy. COSO (2004:Online) elaborates on
these four categories as follows:
Strategic: High level objectives, linked with and supporting the
organisation’s mission.
Operational: Effective and efficient use of organisational resources,
addressing the organisation’s business objectives.
Reporting: Reliability of reporting, i.e. accuracy, timeliness,
appropriateness, etc.
Compliance: Organisational compliance with applicable laws and
regulations.
Communication
Develop strategy
Implement
Monitoring
Analyse
STRATEGY Strategy is linked to risk
management processes Roles and responsibilities of all
employees are understood
IMPLEMENT Risk management is
understood in the organisation Risks are managed across
processes in an efficient and integrated fashion
Monitoring activities are well-respected
MONITORING Common ERM approach is
used across all monitoring processes
Activities add value through communication and follow up of key issues
INFRASTRUCTURE Aligned risk policies,
processes, charters Resources that support a
value adding ERM process Ability to communicate
across organisation about risks
Policy
Common language
Infrastructure

124
By categorising the organisation’s objectives, the focus is directed at the
different ERM aspects. ERM will aid in the achievement of internal
objectives within the organisation’s control such as reliability of reporting,
and compliance with laws and regulations. As far as external objectives
such as operational and strategic activities are concerned (which are not
always within the organisation’s control), ERM can provide reasonable
assurance that management is informed of the organisation’s level of
achievement of these goals (COSO, 2004:Online).
An ERM process can be broadly categorised into six main activities, which
consist of further subprocesses as depicted in Figure 3.6. ERM is not
strictly a ‘serial process’; it is a ‘multidirectional process’, in which activities
influence each other (COSO, 2004:Online).
Figure 3.6: The enterprise risk management process (Source: Adapted from White,
1995:36; and Funston, 2003:61).
Environment & Strategy
Risk identification
Risk assessment
Evaluation
Risk mitigation & Control
Information & Communication
Monitoring & Continuous
improvement
Risk analysis Risk
identification Risk description Risk estimation
ERM
Perceiving hazards
Identifying failures
Recognising adverse consequences
Estimate significance of the risk
Judging acceptability of the risk
Comparing risks against benefits
125
The six activities representative of the ERM process are elaborated upon
in detail below.
3.6.3.1 Activity one - environment and strategy
The essential first step in the ERM process is the evaluation of the
external and internal environment in which the organisation operates, with
the internal environment encompassing the organisation’s strategy for
achieving its objectives, the organisational culture including internal
controls, and the risk appetite of the organisation (Funston, 2003:60-62).
An important element of the ERM process is the internal control
environment as deficiencies in this environment are often the cause of risk
and control breakdowns (Funston, 2003:60-62). The internal control
environment consists of an organisation’s and the employees’ ethical
values, management’s operating style, and philosophy and the
assignment of authority and responsibility (COSO, 2004:Online).
3.6.3.2 Activity two - risk identification
The next activity in the ERM process is the development of a risk
identification framework (Funston, 2003:60-62), where the organisation’s
exposure to uncertainty is identified (FERMA, 2003:Online). The
identification process requires in-depth knowledge of the organisation,
along with various factors such as the organisation’s market, the
environment (legal, social, political and cultural), a thorough understanding
of the organisation’s strategic and operational objectives, the
organisation’s critical success factors and the threats and opportunities
that may impact the achievement of these organisational objectives. A
useful tool in the identification of the information is a SWOT analysis, a
matrix conducted by the organisation by which Strengths, Weaknesses,
Opportunities and Threats are identified. Risk identification is a meticulous
process, and an organisation should ensure that all significant
organisational processes are identified and that all the risks originating

126
from these processes are defined. Furthermore, any volatility related to
these processes should be identified and categorised (FERMA,
2003:Online; and DEAT, 2006:Online).
In the risk identification phase, both internal and external events that may
impact an organisation’s objectives should be identified, along with the risk
or opportunity it represents. Value creating opportunities are channelled
back to management’s strategy or objective-setting process (COSO,
2004:Online). Management’s attention should not be focused solely on
risks that result in organisational failure or crisis, but also at events that
influence the effectiveness and efficiency of the organisation’s activities,
and have a significant impact on the organisation’s performance or risk
profile. Furthermore, management should take cognisance of the nature of
risk, i.e. its interconnectedness. Potentially all activities in an organisation
are exposed to risk, although the impact of the risk may be influenced by
actions taken by other parties in the organisation (Ritchie & Brindley,
2007:310).
The development of a risk framework and a generic risk language to foster
better risk understanding, is a main characteristic of the ERM approach
(Selim & McNamee, 1999:159-174). In helping to identify key risks to the
organisation, workshops may be facilitated, where unrestricted information
sharing and debate are encouraged. This can provide valuable information
in the identification, assessment and management of risks (Hodge,
2002:18-22).
3.6.3.3 Activity three - risk assessment and prioritising
Risk evaluation methods usually encompass the determination of risk
impact and the probability or likelihood of risks occurring. A weighting
should be allocated to risk impact and risk probability (Funston, 2003:60-
62).

127
Although risk probability and risk impact are two important factors to
consider, it is usually not enough. It is argued that estimates of probability
are only relevant for risks that have already occurred, meaning risks which
have a history. Basing reliance on such risk analysis may give an
organisation a false sense of security as these organisations rarely
prepare themselves for relevant high impact, low likelihood risks which
may have the most destructive consequences. For high impact, low
probability risks, the organisation’s state of risk preparedness are very
important. The organisation should allocate its resources based on the
potential risk impact and its ability to manage such risks. The focus is
therefore not to address all possible sources of risk. For example, it is
impossible to anticipate all sources of risk to an organisation’s computer
network, but it is possible to address the degree of disruption caused by
the risk of say a network failure and the organisation’s preparedness to
address it (Funston, 2003:60-62). The next step is risk prioritisation, which
usually involves a risk matrix of risk probability and risk impact, with the
results categorised as high, low or medium risks (Page & Spira, 2004:33-
34).
During the risk description process, the identified risks should be depicted
in a structured format such as a table. An adequately designed table can
facilitate the description and evaluation of risks, and furthermore help to
ensure a comprehensive risk identification, description and assessment
process. By assessing each risk according to probability and impact, key
risks can be prioritised for management action. Risk management should
be incorporated in the initial start-up phases of projects, and continued
throughout the project (FERMA, 2003:Online). Most organisations
recognise the importance of incorporating an ERM process in their
organisation, as it helps in the analysis of information, and translates the
information into value-adding activities (Chapman, 2001:33).
Quantitative, semi-quantitative or qualitative risk estimation methods may
be used in terms of risk likelihood and impact. After the completion of a
risk analysis, the estimated risks should be compared against the
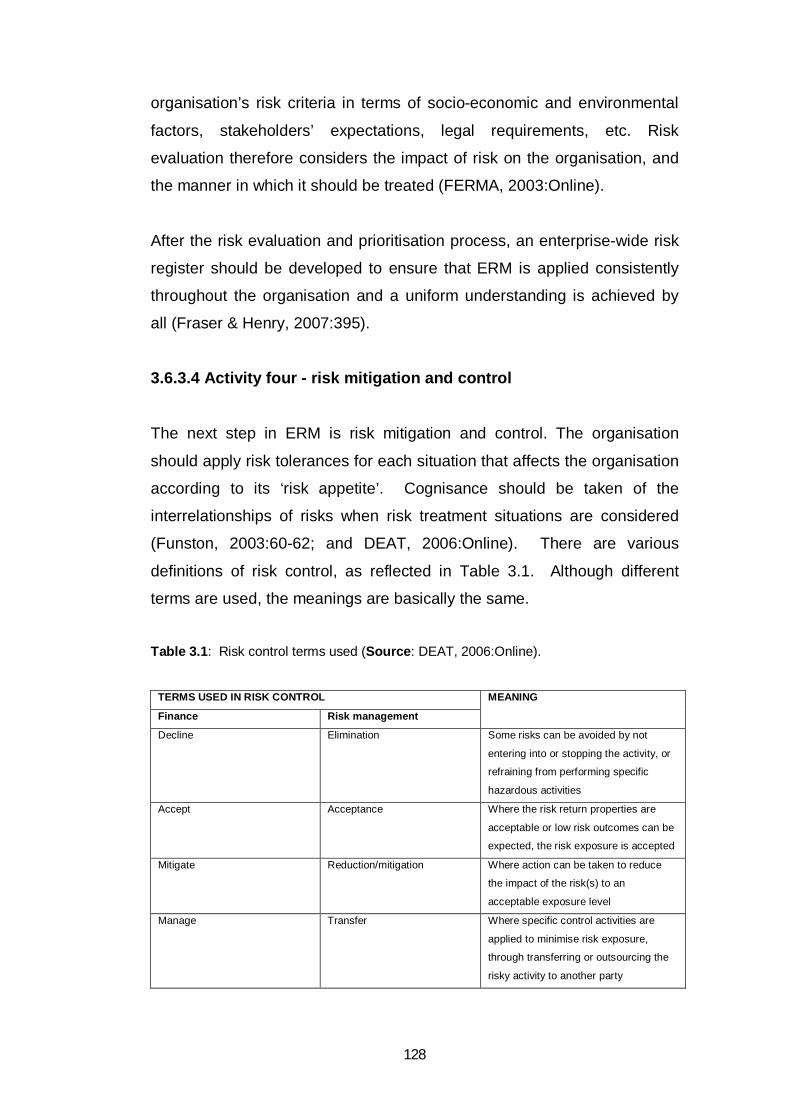
128
organisation’s risk criteria in terms of socio-economic and environmental
factors, stakeholders’ expectations, legal requirements, etc. Risk
evaluation therefore considers the impact of risk on the organisation, and
the manner in which it should be treated (FERMA, 2003:Online).
After the risk evaluation and prioritisation process, an enterprise-wide risk
register should be developed to ensure that ERM is applied consistently
throughout the organisation and a uniform understanding is achieved by
all (Fraser & Henry, 2007:395).
3.6.3.4 Activity four - risk mitigation and control
The next step in ERM is risk mitigation and control. The organisation
should apply risk tolerances for each situation that affects the organisation
according to its ‘risk appetite’. Cognisance should be taken of the
interrelationships of risks when risk treatment situations are considered
(Funston, 2003:60-62; and DEAT, 2006:Online). There are various
definitions of risk control, as reflected in Table 3.1. Although different
terms are used, the meanings are basically the same.
Table 3.1: Risk control terms used (Source: DEAT, 2006:Online).
TERMS USED IN RISK CONTROL MEANING
Finance Risk management
Decline Elimination Some risks can be avoided by not
entering into or stopping the activity, or
refraining from performing specific
hazardous activities
Accept Acceptance Where the risk return properties are
acceptable or low risk outcomes can be
expected, the risk exposure is accepted
Mitigate Reduction/mitigation Where action can be taken to reduce
the impact of the risk(s) to an
acceptable exposure level
Manage Transfer Where specific control activities are
applied to minimise risk exposure,
through transferring or outsourcing the
risky activity to another party

129
3.6.3.5. Activity five - information and communication
Organisations have begun to realise the importance of regularly gathering
risk information within the organisation as well as the significant amount of
effort required for the maintenance of a risk information system. ERM
enables organisations to use this risk information to identify possible risks
resulting from an organisation’s decisions, and to proactively address such
risks. A risk information system requires effective processes, an
appropriate infrastructure, accurate information, and timely reporting in
order for management to make informed decisions (Funston, 2003:60-62).
3.6.3.6. Activity six - monitoring, reporting and continuous improvement
To successfully manage risk, continuous risk tolerance and risk threshold
monitoring are required. By continuously monitoring situations, problem
areas can be identified timeously before they escalate into a crisis
situation. ERM can facilitate improved governance through the use of key
metrics, and a reporting system to gauge the effectiveness of risk
management processes (Funston, 2003:60-62; and DEAT, 2006:Online).
The ERM process should be driven by executive and senior management.
They should ensure that an organisation’s structure, along with ERM
implementation policies, is in place to support the ERM process. A two-
way risk information flow should be established between those closest to
the risk and senior management. Risk information will help senior
managers formulate the organisation’s risk policy, and those closest to the
risks should be empowered to take action to prevent a small risk from
escalating (Dickinson, 2001:364).

130
3.7 ENTERPRISE-WIDE RISK MANAGEMENT FRAMEWORKS55
DeLoach EWRM (DeLoach, 2000:5-8), COSO’s ERM (COSO,
2004:Online), the Australian/New Zealand Risk Management Standard
4360:2004 (AS/NZS 4360, 2004:Online) and the Federation of European
Risk Management Associations (FERMA, 2003:Online), all claim to go
beyond the traditional risk management focus. These frameworks focus on
all organisational activities where risks can be created, therefore a holistic
risk management approach. These frameworks all proclaim to have a link
to strategy and strategic risks. This is a sound dispensation considering
the importance of addressing risk during the strategy formation process as
the impact of such risks can have organisational wide repercussions. The
frameworks therefore go beyond the traditional narrowly-focused risk
approach, and incorporate all types of risks such as strategic risk,
operational risk, compliance risk, financial risk, etc. However on
evaluation of these frameworks, it becomes clear that the focus is primarily
limited to strategy implementation, strategic risks and traditional technical-
economical processes. The frameworks fail to address new business and
growth opportunities, and no guidance is given regarding the risk
evaluation and communication process, i.e. the prioritisation of key risks,
and the communication of these risks horizontally and vertically to all
levels in the organisation; in particular to those who are ultimately
responsible for decision-making (Henriksen & Uhlenfeldt, 2006:107-109).
3.7.1 The four frameworks
The enterprise risk frameworks proclaiming a link to strategy according to
Henriksen and Uhlenfeldt (2006:111-126) are:
DeLoach’s Enterprise-Wide Risk Management (EWRM) - Strategies
for Linking Risk and Opportunity (DeLoach, 2000:1-244). The focus
of this document is directed at definitions, specific guidelines on risk
identification, risk assessment and various methods of risk control.
55 Reference to ERM ‘frameworks’ incorporate ERM ‘standards’.

131
The Committee of Sponsoring Organisations of the Treadway
Commission (COSO) - Enterprise Risk Management Integrated
Framework (COSO, 2004:Online). Represents a framework
structure, recommendations for key risk management activities and
guidelines for internal support.
The Institute of Risk Management (IRM), the Association of
Insurance and Risk Managers (AIRMIC) and the National Forum for
Risk Management in the Public Sector (ALARM) combined efforts in
the formulation of a risk document labelled FERMA (2003:Online),
which provides a framework as a generic guideline for ERM.
The Australian/New Zealand Risk Management Standard 4360
(AS/NZS 4360, 2004:Online) comprise in-depth commentaries and
various application techniques regarding ERM.
All four frameworks follow a similar methodology regarding risk
identification, assessment and risk response. By following the standards
set out in the models, management can improve the quality of its strategic,
tactical and operational decisions.
3.7.1.1 Generic six-stage risk model
The risk management processes in the four frameworks can be juxtaposed
into a single generic model (Henriksen & Uhlenfeldt, 2006:113-114),
consisting of six clear identifiable stages, which are elaborated upon
below:
Stage 1 - objective setting: The organisational objectives and the
risk management processes are aligned to the organisation’s vision,
mission and objectives, and formulated by executive management.
Stage 2 - risk identification: Management should identify internal
and external events resulting from organisational actions and
decisions that have a potential impact on the achievement of the
organisational objectives, and the execution of the strategies.
Various identification techniques such as industry assessment,
scenario analysis and capability analysis may be used.

132
Stage 3 - risk assessment: Events are evaluated in terms of a
classical risk evaluation model, where the probability of the risk
occurring and the impact of the risk on the achievement of the
organisational objectives, are measured.
Stage 4 - risk response: Based on the risk analysis, events are
prioritised along with the determination of risk responses such as risk
avoidance, risk reduction, risk transfer or risk acceptance.
Stage 5 - action planning: Action plans are formulated and
implemented in line with each risk response. Accountability is
enforced through the appointment of risk owners.
Stage 6 - control activities: The development and implementation
of control actions should be initiated to ensure effective and efficient
execution of the risk response.
Risk management processes should not be seen as a sequential once-off
process, as all activities influence each another. Due to the evolving and
dynamic business environment, previously defined risk actions and
responses can become obsolete and new risks may culminate from
business activities. The evolving risk landscape necessitates the need for
constant monitoring and effective risk communication.
3.7.1.2 Mapping organisational strategy to the four ERM frameworks
According to Henriksen and Uhlenfeldt (2006:114-124), the logic behind
the focus on enterprise-wide risk is to transform risk management into a
cross-functional activity, where risk identification, assessment and
management are tied to the achievement of the organisational objectives
on all levels. ERM provides a platform for the development of a common
risk language, and the sharing of risk information across all organisational
levels and areas. The four frameworks provide a holistic perspective on
the organisational risk portfolio addressing the interrelatedness of risk,
thereby contributing towards coordinated risk responses. The frameworks
aim to influence organisational direction, i.e. strategy formation and do not
limit their focus solely on strategy implementation.

133
The four frameworks claim to address the tangent planes between risk
management processes and organisational strategy. DeLoach’s EWRM
framework (DeLoach, 2000:93-96), recognises that risk management
should be incorporated into strategic activities at an early stage and also
link risks to strategy formation. Although the importance of the tangent
planes between risk management and strategic management are
recognised by the other three frameworks, these limit risk activities to risk
identification, evaluation and management of risks, that impact
predetermined organisational objectives and strategies. As a result, the
focus is limited to strategy execution.
In all four frameworks, the focus of risk management activities can be
mapped to the achievement of predefined objectives and strategies within
operational-tactical areas. Notwithstanding, the frameworks make limited
reference to the process of risk consolidation, i.e. the identification,
quantification, incorporation of risks in a risk framework, the risk prioritising
process and risk communication process to key decision-makers. An
effective risk consolidation process forms the underpinning foundation in
the formulation of good strategic decisions, and guides the organisation in
efficient resource allocation.
The strategic focus character of integrated risk management frameworks,
relating to both ‘loss avoidance activities’ and ‘value-adding opportunities’,
are frequently addressed by such holistically focused frameworks.
Although all four frameworks claim to incorporate opportunity, only
AS/NZS deals with it dynamically, while the other frameworks’ focus is
directed towards negative risk and loss avoidance. Such focus is however
of little value if growth opportunities and strategy formation are not
considered simultaneously. Only the Australian and New Zealand
standard allows the inclusion of strategy formation in the strategic process,
due to the standard’s neutral stance regarding the strategy process.

134
According to Henriksen and Uhlenfeldt (2006:125-126), all four
frameworks contribute to the refinement of risk management by striving to
establish an integrated risk platform. By using any one of these
frameworks, organisations can establish a common risk management
platform and by using a common risk language, they can communicate
and manage risks throughout all organisational processes and levels.
These attributes of creating a risk platform, establishing a common risk
language and communication throughout all levels, activities and
processes, are important preconditions to the claim of ‘holistic risk
management’. To substantiate the claim of enterprise-wide risk
management, these frameworks should address all processes in an
organisation where key risks can be created. This includes the strategy
process from the formation of strategy, to strategy choice, to the
implementation of strategy.
3.8 VALUE-ADDING ERM
Embedding ERM into an organisation holds many advantages. Bowling et
al. (2003:16-22) supported by Bowling and Rieger (2005:26), states that
the primary benefits from implementing an enterprise risk management
approach are:
ERM increases the confidence of stakeholders and investors by
improving good corporate governance processes.
ERM also helps the organisation to focus its risk effort on key
business risks reducing the overall cost of risk management.
ERM enhances communication, thereby creating a better
understanding and recognition of risks throughout the organisation.
ERM can lead to an increase in revenue without increasing risk
through the organisation’s better understanding of the
interdependencies between the various risks and their potential
impact on the organisational strategy.
Successful ERM practices reduce the overall risk profile, which
lowers the cost of capital.

135
ERM leads to a better allocation of capital, consistent with the
organisational risk profile.
It has been recognised by various authors such as DeLoach (2000:40),
Liebenberg and Hoyt (2003:37-52), Funston (2003:59-63), Chapman
(2003:30-35), and Schrøder (2006:65), that the risk management process
considers both the ‘negative side’ of risk as well as the ‘positive side’. ERM
helps organisations improve their decision-making by incorporating risk
management into their planning activities, thereby improving the
shareholder value. Holistic risk management helps an organisation
understand and proactively manage risks, as it provides a common
methodology whereby the magnitude of risk can be determined and the
risk interactions assessed. The established ERM platform improves
flexibility and speed as well as enhancing risk awareness (Schrøder,
2006:66). Since organisations are better positioned to identify risks
impacting on their strategic direction, they can implement actions that will
enhance their chances of success, thereby securing a competitive
advantage over their rivals (Kubitscheck, 2000:39). This strategic
advantage is also addressed by COSO (2004:Online) and Abrams et al.
(2007:221), recognising that integrated risk management fosters improved
information gathering and risk identification on a higher organisational
level. This leads to improved risk responses, i.e. risk avoidance,
reduction, sharing, and acceptance, that are aligned to the organisational
strategy. It is argued that integrated risk management fosters improved
risk awareness that leads to improved operational and strategic decisions
(Liebenberg & Hoyt, 2003:38).
COSO (2004:Online) recognises that value is optimised when
management aligns strategy and objectives, and effectively allocates
resources to achieve an equilibrium between growth, return and related
risks. ERM according to COSO (2004:Online), encompasses:
Aligning risk appetite and strategy: In selecting the most
appropriate strategic action, management takes cognisance of the

136
organisation’s risk appetite, thereby developing effective risk
management mechanisms.
Reducing operational volatility: ERM enables organisations to
develop improved capabilities to identify potential risks and
determine risk responses, reducing surprises and associated costs or
losses.
Identifying and managing multiple and cross-enterprise risks:
ERM helps organisations identify composite risks impacting on their
objectives, as well as improving risk responses.
Seizing opportunities: A holistic perspective enables management
to identify and proactively realise opportunities.
In addition according to Funston (2003:60), ERM helps an organisation:
In improving the execution of its business plan through an improved
understanding of the nature of risks, and how these impact on
organisational objectives.
In instilling confidence with the organisation in its ability to execute its
business strategy.
In providing reasonable assurance about the reliability and
effectiveness of key risk management processes and to determine
the achievability of organisational objectives.
Proponents of ERM are ad idem that implementing ERM in an
organisation holds numerous advantages such as lowering earnings and
stock-price volatility, decreasing external capital loss, increasing capital,
creating synergies between risk management activities, improved
decision-making, increased transparency and speed, process robustness,
risk mitigation, avoidance of reputation damage and increased
accountability which in turn increase investor confidence and add value to
shareholders (Cumming & Hirtle, 2001:1-17; Lam, 2001:16-20; Meulbroek,
2002:56-70; Miccolis & Shah, 200056 cited by Liebenberg & Hoyt, 2003:38;
COSO, 2004:Online; and Abrams et al., 2007:222-224).
56 Refer to footnote 51.

137
ERM holds value for publicly traded and non-publicly traded organisations
alike. In contrast to shareholder value that features in publicly trading
organisations, the ERM benefits for non-listed companies are directed
towards providing management with information regarding cash flow risks
or stakeholder risks. Regardless of the organisational form, ERM can
serve as an important management tool (Miccolis et al., s.a.:xxviii).
ERM helps an organisation meet its vision (COSO, 2004:Online). By
embedding ERM in an organisation, management can ensure that all
significant risks are identified and addressed, and that organisations will
have the confidence to view risk as an opportunity to add value (Bowling
et al., 2003:17).
3.9 IMPEDIMENTS TO EFFECTIVE ERM PROGRAMMES
From the aforegoing analysis, the analogy can be drawn that ERM is a
value-adding process, however certain limitations do exist. Inherent
limitations such as faulty judgement, the determination of the cost-benefit
analysis between risk and control, errors, circumvention of controls and
control overriding preclude management from absolute certainty in the
achievement of the organisation’s objectives (COSO, 2004:Online).
Adopting an ERM approach brings about an organisational culture change
that, to ensure success, requires support from top management, including
the board (Merkley, 2001:25-27; Dickinson, 2001:360-366; Smiechewicz,
2001:21-27; Meulbroek, 2002:56-70; Chapman, 2003:30-35; Truslow,
2003:Online; Barrese & Scordis, 2003:26-29; and Schrøder, 2006:66). It
is the responsibility of the board to determine the risk appetite and
formulate the risk management policy of the organisation in guiding the
organisation’s risk activities. However, the board’s (perceived) insufficient
risk management knowledge and its compromising attitude (Weinstein,
Blacker & Mills, 2003:Online; and Schrøder, 2006:67) may be a key
obstacle to ERM, as it impedes in-depth and open risk discussions.

138
Another potential barrier to ERM could be management’s priorities
(Merkley, 2001:25-27; and Schrøder, 2006:67), as well as its reluctance to
discuss sensitive information in different organisational units (Funston,
2003:59-63; Kleffner, Lee & McGannon, 2003:53-73; and Schrøder,
2006:68). To overcome these obstacles, top management should assume
ownership of the ERM process by having a visible ERM champion who
actively supports the process in order to ensure buy-in from lower level
employees and to foster a ‘positive tone’ at the top regarding risk
management. This positive risk mentality should filter down through the
organisation and create a strong and positive risk management culture in
support of the risk management process (Chapman, 2001:30-37; and
Schrøder, 2006:67). However, if employees are of the opinion that the
delegated risk management responsibilities are deemed to impact
negatively on them if difficulties are encountered, they would be inclined to
be less open and honest about potential weaknesses (Skinner & Spira,
2003:28-35).
A further barrier to EMR activities stems from the uncertainty about how
ERM adds value to an organisation (Kleffner et al., 2003:53-73). To
overcome this, strong support for risk management activities, along with
clearly defined and communicated expectations of the value the
organisation aims to derive from the ERM process, is crucial in
establishing a strong risk culture (Prince, 2000:21-23; Barrese & Scordis,
2003:26-29; and Schrøder, 2006:67).
Successful risk management is underpinned by a stable and predictable
reporting structure, where risk responsibilities are clearly defined and
allocated to appropriate personnel (DeLoach, 2000:91-103; Chapman,
2001:30-37; and Schrøder, 2006:68). However, modern organisations with
a ‘flatter’ organisational design hold a challenge to risk management, in
that such structures are incompatible with the ‘tight’, hierarchical reporting
systems required by ERM (Weinstein, 2002:Online; and Schrøder,
2006:68).

139
A further prerequisite to ERM success, is that executive management
must assume primary responsibility for risk management in its respective
areas (DeLoach, 2000:236-240; Truslow, 2003:Online; and Schrøder,
2006:68). However, the complex nature of risk management requires
expertise that is best utilised if placed in one organisational unit that is
responsible for supervising the process. This will ensure continuity of risk
management actions, as well as consistency in application (Nakada &
Tange, 2003:30-31; and Haubenstock, 199957 cited by Schrøder 2006:68).
In practice, this is difficult to implement as specialised knowledge, skills
and experience are required for such a unit (Haubenstock, 199958,
Sadgrove 199659, cited by Schrøder, 2006:68), as well as a more active
organisational role that goes beyond traditional consultation activities,
which may be in contrast to the current organisational culture (Schrøder,
2006:68).
To be successful, ERM should be aligned (as close as possible), to the
management teams in the various units as this alignment aids in improving
their understanding of the business functions they support (Truslow,
2003:Online; and Schrøder, 2006:67). Further key elements for ensuring
ERM success is the alignment of the risk management strategy with the
organisation’s overall business strategy, and the integration of risk
management into the organisational processes, as risks are the best
managed as close as possible to the source of the risk (Chapman,
2001:30-37; Smiechewicz, 2001:21-27; and Schrøder, 2006:68-69).
Each employee interprets and understands business risks differently,
which necessitates the formulation of a common risk language to ensure
that risk is viewed in a consistent and similar way by all parties in the
organisation (Chapman, 2001:30-37; Smiechewicz, 2001:21-27; and
Schrøder, 2006:69). A major obstacle in ERM implementation is the
57 Haubenstock, M. 1999. Organizing a financial institution to deliver enterprise-wide risk management. The Journal of Lending & Credit Risk Management, 81(6):46-52. 58 Refer to footnote 57. 59 Sadgrove, K. 1996. The Complete Guide to Business Risk Management. London: Grower.

140
absence of a common risk language, which supports discussions around
risks, both holistically and departmentally, and risk management methods
(Nielson, Kleffner & Lee, 2005:286).
Barrese and Scordis (2003:26-29), and Schrøder (2006:69), point to the
fact that risk management concepts, applications and capabilities must be
imbedded into the organisation’s corporate training curriculum. The
importance of training and learning is emphasised by Weinstein et al.
(2003:Online) and Schrøder (2006:69), who state that organisational and
individual learning should support the ERM process.
Further obstacles highlighted by various authors to effective ERM
implementation are:
Difficulties in quantifying the risks, the wide span of the risk universe
and managers’ inability to understand simple risk tools (Kleffner et
al., 2003:53-73; Bologa, 2003:9; and Schrøder, 2006:69).
The lack of quality data, limited access to data due to inadequate
integration between systems, lack of data mapping and risk
modelling tools, which some authors regard as the largest obstacles
in effective ERM application (Prince, 2000:21-23; Chapman,
2003:30-35; Liebenberg & Hoyt, 2003:37-52; and Schrøder 2006:69).
The segmental approach towards different types of risks that still
prevails in organisations (Levine, 2004:31-37; and Schrøder
2006:69). 3.10 RISK MANAGEMENT: CASE STUDY EVIDENCE
The results of surveys regarding the risk management practices of Danish,
Western European, Asian/Pacific, North American, United Arab Emirates,
United Kingdom and German companies are briefly elaborated upon
below to provide the reader with substantiated case study evidence of risk
management in practice.

141
3.10.1 Risk practices in Danish companies
Danish companies seem to favour a more fragmented risk management
approach whereby emphasis is placed on the structured management of
financial and hazardous risks. Operational and strategic risk management
are practised on a stand-alone basis, in a less structured and formal way.
In the majority of companies, boards evaluated risk types separately,
limiting the organisation’s risk appetite. This may be attributed to Danish
company boards’ inadequate risk management knowledge (Weinstein et
al., 2003:Online; and Schrøder 2006:76), and therefore uncertainty about
ERM’s value-adding capabilities (Kleffner et al., 2003:53-73; and
Schrøder, 2006:78). This in turn leads to the low ERM priority within the
country (Merkley, 2001:25-27; and Schrøder 2006:78). The most important
obstacle experienced is the lack of a common risk language and the low
recognition of ERM benefits. Although the process of developing and
establishing a common risk language can initially be seen as
overwhelming, it is surprising that a lack of a common risk language is
cited as a barrier as this has to a large extent to do with defining and
describing relevant risks From survey results it is evident that factors
related to the risk management process such as data quality,
competencies, measuring and quantification processes are seen as
obstacles opposed to organisational culture aspects, such as lack of
support from executive management and the availability and use of risk
techniques (Schrøder, 2006:75).
The responsibility for the management, controlling and reporting of
strategic and operational risks is allocated to individual business units and
differ according to how units are structured. Organisations view the
centralisation of the risk management function as conducive to
bureaucracy and the elimination of units independence (Schrøder,
2006:79). This is in contrast to the viewpoint of Nakada and Tange
(2003:30-31) and Haubenstock (199960) cited by Schrøder (2006:79), that
60 Refer to footnote 57.

142
one organisational unit should be responsible for the supervising of the
ERM process to ensure continuity and consistency. However, the
decentralised risk role is in line with the reservations of Haubenstock
(199961) and Sadgrove’s (199662) cited by Schrøder (2006:79), about a
single point of responsibility, as this function requires specialised
knowledge, skills and experience. As a result, the view by Schrøder
(2006:79) that the risk management function will be most successful when
it is set up as a staff function to provide support, facilitation and co-
ordination to line management.
In summary, survey evidence showed that Danish companies have not
embraced holistic risk management as a management discipline due to
inadequate executive commitment. Risk management is practised in silos
across organisations, based on different risk types. It is furthermore
evident that risk management delegation, as practiced by some Danish
organisations, is practical and compatible with recommendations from
various authors in that one function should be responsible for supervising
the risk management process (Schrøder, 2006:70-83).
3.10.2 Risk practices in Western European, Asian/Pacific and North American companies
Survey results from the 2007 Towers Perrin Risk/Opportunity Study
(Towers Perrin, 2008:Online), conducted on medium and large enterprises
in Western European, Asian/Pacific, North American and other regions,
show that top management recognises the value-adding benefits of risk
management, and does not perceive it merely as applying to threats to
operations and assets. Although top managements identify workforce skills
and experience as the primary opportunity for their organisations, it is
ranked with the lowest amount of management confidence in
managements’ ability to effectively manage workforce risks and
opportunities.
61 Refer to footnote 57. 62 Refer to footnote 59.

143
The top five risks and opportunities on a global cross-industry basis
(regardless of company size or geographical dispersion) are:
Risks:
Business continuity,
customer demand,
competition,
technology, and
business development.
Opportunities:
Employee skills and experience,
competition,
business continuity,
business development, and
customer demand.
It is evident from this study that there is not only one best approach to risk
management. Organisations’ perception of business risks and their risk
management approach will vary amongst organisations and organisational
management. Event management (risks and opportunities), should be
aligned to the organisation’s business strategy and its risk tolerance.
However, the primary differentiating factor in successful risk management
is organisational culture. The risk management process is important, but a
participative workforce and an organisational culture that embraces
enterprise-wide integrated risk and opportunity management contributes
toward organisational success (Towers Perrin, 2008:Online).
3.10.3 Risk practices in United Arab Emirates (Dubai) companies
In a survey done on more than 100 organisations in Dubai, the United
Arab Emirates, managers and executive managers identified numerous

144
obstacles to ERM (Rao & Marie, 2007:14). Survey results were grouped
into three categories, namely:
Banks.
Non-Banking Finance Companies (NBFC), consisting of finance
companies, Islamic finance companies and insurance companies.
Miscellaneous Companies (MISC), consisting of domestic hotels and
services, trading companies and manufacturing companies.
Although executive managers of banks realise ERM’s value-adding
capabilities, they experience significant frustration and dissatisfaction with
the current ERM practices in their organisations. The most important ERM
obstacles experienced by executives in the banking category are
processes, skills, tools, organisational culture, ERM costs and
organisational structure. This is followed by the secondary obstacles
identified by banks as time availability, intellectual capital and technology.
Companies in the NBFC category identified culture, time availability, costs,
processes, organisational structure and risk tools as the largest hurdle to
ERM compared to skills, intellectual capital and technology as less
important obstacles. Companies in the MISC category experienced
culture, time and costs as the major obstacles to ERM. From the survey
results it is evident that businesses encounter several obstacles to ERM
implementation, with the type and degree of obstacles experienced
varying according to the types of organisation (Rao & Marie, 2007:15).
3.10.4 Risk practices in United Kingdom companies
A United Kingdom survey was conducted on over 100 companies in the
oil, gas and construction industry regarding risk analysis methods used,
the organisation’s policy on responding to risk, and risks encountered
during operations. The survey results showed that the majority of
organisations are of the opinion that their organisation uses a mixture of
qualitative and quantitative risk analysis techniques, with personal and
corporate experience, engineering judgement, and brainstorming the best

145
qualitative techniques, while break-even analysis and decision trees are
some of the techniques best suited for quantitative use. Organisations’
most frequent risk response was risk reduction by training and educating
staff and improving their work conditions; then risk transfer followed by risk
retention as the least used method. One of the main survey results is that
current risk management practices should be further refined by allocating
more resources and time to the risk management process (Baker et al.,
1999:94-102).
3.10.5 Risk practices in German companies
In a study done (Fatemi & Glaum, 2000:4) on German firms listed on the
Frankfurt Stock Exchange, respondents were required to rank the goals of
their risk management efforts. The primary goal of risk management is to
ensure the survival of the organisation, with the second most important
goal an increase in the organisation’s market value. Other important goals
listed in order of importance, are:
Influencing the behaviour of subsidiaries and organisational
management.
Adding value through increasing the organisation’s profitability.
Contributing towards a more stable cash flow.
Reducing the volatility of earnings.
3.11 THE FUTURE OF ERM APPLICATIONS
To improve the ERM process, as well as organisational performance and
employee efficiency, McWhorter, Matherly and Frizzell (2006:50-55),
suggest the implementation of a Strategic Performance Measurement
System (SPMS). According to the researchers, SPMS and ERM have
several common characteristics such as promoting a holistic enterprise
view, educating employees about strategic objectives, and alignment with
corporate strategy. SPMS is linked to corporate strategy through
performance measures, while ERM is linked through risk management.

146
Beasley et al. (2006:49-55), suggest clear tangent planes between the
balanced scorecard as a performance measurement tool and ERM.
Balanced scorecards help organisations measure their achievement of
their strategic objectives, while ERM processes help management in
defining events that will have a positive and negative impact on the
achievement of the organisational goals.
The alignment of risks and strategy are embedded in the successful
implementation of ERM, as risks and strategy are vital to strategic
planning and performance assessment. Strategy is furthermore also
considered part and parcel of an organisation’s balanced scorecard
framework as this performance measurement tool translates the
organisation’s mission and strategy into specific and measurable
performance indicators in the four areas of learning and growth for
employees, internal business processes, customer satisfaction and
financial performance (Beasley et al., 2006:49-55).
Characteristics shared by ERM and balanced scorecard systems
according to Beasley et al. (2006:49-55), are:
Strategy-aligned focus: Both ERM and the balanced scorecard are
aligned to strategy with the ultimate objective of achieving the
organisation’s overall strategy.
Enterprise-wide view: ERM and the balanced scorecard have a
holistic strategy approach by viewing risks and performance
measurement on an enterprise-wide basis.
Focus on interdependencies: Both processes focus on an
integrated strategic approach.
Top-down approach: For both ERM and the balanced scorecard to
work effectively, top management must support these processes
actively.
Consistent approach: Both processes follow a consistent approach
across all organisational levels and processes, regardless of the
number of individuals involved and the extend of their experiences.

147
Emphasis on accountability: ERM and the balanced scorecard
promote individual accountability.
Continuous processes: Both processes are ‘continuous’ in nature.
The balanced scorecard focuses on continuous improvement, while
ERM’s focus is directed at the constant evaluation and monitoring of
risks.
By integrating the balanced scorecard into the ERM process,
management’s focus on risk is enhanced as the new integrated process
allows for a broader focus on risks by linking risk management to strategic
performance measurement. The balanced scorecard process also
benefits from the ERM process. The learning and growth perspective are
enhanced as employees become more risk conscious through the
balanced scorecard process of capturing information about risk
management objectives and performance measurement. A strong risk
management focus furthermore would foster a strong and improved
internal business process through the risk management activities of
eliminating or reducing risks within key business processes. Improved
business processes would lead to improved balanced scorecard
perspectives relating to customer satisfaction and financial performance.
As a result, the benefits derived from such an integrated process will
enhance the ERM process and increase balanced scorecard effectiveness
(Beasley et al., 2006:49-55).
By using two separate scorecards linked to the organisational strategy,
management will have an all inclusive analytical control and information
system that can be utilised in the monitoring of organisational processes,
and in resolving negative variances (Simons, 200063 cited by Calandro &
Lane, 2006:34). Using dual scorecards will assist managers in spending
the appropriate amount of time and attention on both performance
measurement and risks. This will eliminate the business reality where
managers spend a disproportionate amount of time focusing on
63 Simons, R. 2000. Performance Measurement & Control Systems for Implementing Strategy. Upper Saddle River: Prentice Hall.

148
performance at the expense of risk management, which in turn may lead
to unnecessary levels of risk taking (Calandro & Lane, 2006:34).

149
CHAPTER 4
A PERSPECTIVE OF SME RISK MANAGEMENT IN SOUTH
AFRICA – A LITERATURE REVIEW
SYNOPSIS
Although limited in size, SMEs dominate local and international economies
in numbers. The inherent characteristics of SMEs afford these enterprises
the potential to absorb unskilled labour, nurture and develop
entrepreneurial skills, satisfy the needs of the local market, etc. However,
in the African and South African economies, these benefits are not
forthcoming, due to the high failure rate of SMEs.
The impediments to SME success are numerous and varied, and include
inherent organisational obstacles such as poor managerial skills and
education and training; industry-related problems such as the
entrepreneur’s inability to understand market expectations, and poor
market access; and economy-based obstacles such as interest rate
fluctuations.
SME owner-managers are primarily responsible for the management of
their enterprises’ activities. Studies conducted confirmed SME owner-
managers’ ignorance pertaining to the risks their enterprises face from
internal and external sources, including risks emanating from
entrepreneurial actions. SME risk management techniques are primarily
limited to risk avoidance actions, and to a lesser extent, risk transfer
through insurance activities. Most risk activities tend to be construed
reactively, thereby affecting the availability of enterprise resources in
addressing these risks.
By embedding a structured approach to enterprise risk management within
SMEs, potential benefits such as cost reductions, reducing the

150
overmanagement of risks and organisational alignment towards the SME’s
mission and objectives can be realised.
The content of Chapter 4, along with the relative positioning of the topics,
is graphically depicted in Figure 4.
INTRODUCTION
DEFINING SMEs
IMPORTANCE OF SMEs TO THE ECONOMY SME contribution internationally SME contribution to the African and
South African economy Rationale for supporting SMEs
PROBLEMS EXPERIENCED BY SMEs EXPLOITING RISK
RISK MANAGEMENT FOR SMALL BUSINESS
DRIVERS OF RISK MANAGEMENT IN SMALL BUSINESS
COMPONENTS OF RISK IN SMEs
THE MANAGEMENT OF SME RISK
RATIONALE FOR DEVELOPING A STRATEGIC RISK MANAGEMENT STRATEGY
KEY UNDERPINNINGS FOR A SUCCESSFUL ENTERPRISE Defining and measuring enterprise success Growth and sustainability Critical success factors
Figure 4: Detailed layout of Chapter 4 – A perspective of SME risk management in South Africa: A literature review.

151
CHAPTER 4 A PERSPECTIVE OF SME RISK MANAGEMENT IN SOUTH
AFRICA – A LITERATURE REVIEW 4.1 INTRODUCTION
The analytical process followed thus far is graphically depicted in Figure
4.1, which places the chapters in context with the overall thesis objectives,
and furthermore indicates the relative positioning of this chapter.
Figure 4.1: Chapter 4 - Risk management in SMEs’ positioning.
SMEs operate in the same environment as their larger counterparts, but
without the associated benefits such as adequate capital and extended
human resources of the larger organisations (Ntlhane, 1995:112-113).
SMEs encounter increasing competitive pressure fuelled by globalisation,
CHAPTER ONE
Scope of the research
CHAPTER TWO
Risk management – A literature review
CHAPTER THREE
Enterprise risk management – A literature review
CHAPTER FOUR
A perspective of SME risk management in South
Africa – A literature review
CHAPTER FIVE
Survey design and methodology
CHAPTER SIX
Analysis and interpretation of survey data
CHAPTER SEVEN
Formulation of a structured risk management model for South
African SMEs

152
legislation and the relaxing of trade barriers, as well as an increase in
market expansion due to emerging technologies and innovation. Small
and medium enterprises often flourish on their adaptability and agility such
as their close proximity to their customers, their openness towards new
ways of working, and their risk-taking approach, however many micro-,
small and medium enterprises are susceptible to major ‘external shocks’
(Berry, 2002:14; and Laforet & Tann, 2006:374). Although SMEs
experience difficulties in absorbing and coping with such obstacles, they
need to develop the ability to deal with the organisations’ ever increasing
challenges, i.e. risks (Leopoulos, 2006:226).
SME owner-managers need to escalate the importance of risk
management in their organisations or could suffer catastrophic
consequences if they are ill prepared for the outcome of a possible risk.
This calls for the requirement that entrepreneurs in SMEs need to be
conversant with risk identification and analysis in order to manage risks
from a diverse range of sources (Schultz, 2001:1-2). By incorporating risk
management into SME operations, SMEs are better equipped to exploit
their resources, thereby enabling organisations to transform an
expenditure activity into an activity that can yield a positive return
(Kirytopoulos, Leopoulos & Malandrakis, 2001:338-339; and Banham,
2004:68).
4.2 DEFINING SMEs
Although the term SME or SMME is used interchangeably worldwide,
there is no common definition of these terms. The geographical
placement of SMEs as well as country-specific legislation influences the
numerous SME definitions (Leopoulos, 2006:225). SMEs encompass a
broad range of organisational entities, from family businesses employing
over a hundred employees (termed medium enterprises), to survivalist,
self-employed entities, i.e. informal microenterprises (Berry et al.,
2002:14).

153
In South Africa, the National Small Business Act, Act 102 of 1996 (South
Africa, 1996:Online) amended by Act 29 of 2004 (South Africa,
2004:Online), classify small organisations into four categories, namely
microenterprises, including survivalist enterprises; very small enterprises;
small enterprises; and medium enterprises. The differentiating factor
between these categories, excluding microenterprises, is the number of
employees. For microenterprises the criterion is turnover level (Von
Broembsen, 2003:Online; South Africa, 1996:Online; and South Africa,
2004:Online). Table 4.1 depicts the small organisations’ category
classification.
Table 4.1: Criteria for different SME categories in retail sector (Source: Adapted from
Von Broembsen, 2003:Online; South Africa, 1996:Online; and South Africa,
2004:Online).
SURVIVALIST MICRO VERY SMALL SMALL MEDIUM
No paid
employees
1 – 5 employees Less than 10 paid
employees
(amended to 20
employees: Act 29,
2004)
Less than 50
employees
Less than 100
employees
(amended to 200
employees: Act 29,
2004)
Income is less
than minimum
income level or
the poverty line
Turnover less than
VAT registration
limit (R300
000/year)
N/A N/A N/A
Findings from a baseline study conducted in Africa and Latin America
returned that the micro- and small enterprise sectors are far larger than
recognised in most official published statistics, as inclusion to the latter is
limited to registered firms. The most prevalent entity structure in SMEs is
the very small enterprise (Liedholm, 2002:228-231). This is also
confirmed by Berry et al. (2002:13-14), who emphasises that out of an
estimated 1,6 million to 3 million South African SMEs, the microenterprises
dominate with an estimate of 1,2 to 2,8 million businesses, thus between
69% and 80% of all SMEs are microenterprises. By analysing the
composition of business activities it was identified that while many SMEs
engage in trading activities, a substantial number of them are involved in

154
manufacturing activities. Furthermore SMEs’ customer networks are
limited in that they sell primarily to the final consumer as opposed to other
firms (Liedholm, 2002:228-231).
Various SME characteristics distinguish this sector from larger
organisations, namely:
Owner-managers are the key drivers of SMEs. In the majority of
SMEs, business decision-making is done by the owner-manager
(Ramsey, Ibbotson, Bell & Gray, 2003:254; and Watt, 2007:33-34).
The owner’s ability to determine their needs in all relevant fields is
limited, and decision-making is usually guided by short-term business
pressures (Leopoulos, 2006:226).
Agency behaviour is least likely to occur in small enterprises in the
SME sector, as this sector has the highest degree of ownership
control, and hence limited need for other directors to exercise control
functions (Bennett & Robson, 2004:97; and Watt, 2007:33-34).
In comparison to larger organisations that satisfy an expressed
reliable demand, SMEs address customers’ expressed demands as
well as uncover their unexpressed needs (Salles, 2006:229).
SME decision-makers constantly encounter situations where they are
required to make decisions at different levels and with varied
implications (Leopoulos, 2006:226; and Salles, 2006:229).
Larger organisations have a structured approach to problem-solving,
while SMEs deal with problems as they arise and in a tacit way
(Leopoulos, 2006:226; and Salles, 2006:229). This unstructured
method allows for quick decision-making in order to follow
opportunity (Leopoulos, 2006:226).
SMEs usually deploy financed-based, informal and unstructured
performance measure systems to provide feedback on the quality of
decision-making (Hudson, Lean & Smart, 2001:804-813; and
Leopoulos, 2006:226).
SMEs rarely have a coordinated approach to guide their interactions
with their environment, in contrast to larger organisations that usually

155
have well-defined procedures directing the company (Salles,
2006:229).
The SME owner-managers ‘own’ most of the risk as they are usually
the main or sole suppliers of operating capital (Watt, 2007:33-34).
SMEs have a small number of employees with a low employee
turnover (Watt, 2007:33-34).
4.3 IMPORTANCE OF SMEs TO THE ECONOMY
The SME sector dominates the economy, by taking cognisance of the
number of micro and small enterprises active in the economy. The
research of Watt (2007:33-34), returned that there were approximately 4,3
million business enterprises in the United Kingdom (UK) at the beginning
of 2004. Of these enterprises, 99,3% were small (between 0 – 49
employees), 0,6% were medium sized (50 – 249 employees) and 0,1% were large (250 or more employees). Small enterprises accounted for
46,8% of employment and 37% of turnover in the UK. Furthermore, 72,8%
of all enterprises were sole proprietorships and partnerships comprising
solely the owner-managers, and companies with only an employee
director. The turnover of these enterprises was an estimated combined
£190 billion.
Another important economic influence by SMEs is their contribution to
investment. Although there is limited information available on SME
investment contribution, it is evident that SMEs have a very low investment
behaviour compared to their contribution to employment and production.
A possible argument for this behaviour is that SMEs struggle to secure
sufficient finance to undertake investments, or the poor business
conditions experienced by SMEs (Berry et al., 2002:30,79).
The importance of small businesses is recognised in numerous African
countries such as Togo, Uganda, Ghana, Cote d’Ivoire, Nigeria, Kenya,

156
Malawi, Burkina Faso as well as others. According to Harper (198464)
cited by Rwigema and Karungu (1999:101-124), SMEs are dominant in
numbers in most economies, First World countries and Third World
countries alike. In First World countries like the United States of America
and the United Kingdom, small enterprises play an important role in the
economy accounting for an estimated one-third of industrial employment
and a lower percentage of output (Harper, 1984:2665 cited by Rwigema &
Karungu, 1999:101-124). In Third World countries where SMEs dominate
economically active enterprises, SME prosperity is considered far more
important than in First World countries (Rwigema & Karungu, 1999:101-
124).
4.3.1 SME contribution internationally
From experience gleaned from industrialised countries, particularly
Western Europe and Japan, SMEs form an integral part of local economic
development (Kesper, 2000:1). SMEs in Canada, the United States of
America and various other European countries play a major role in
employment creation, therefore contributing to social stability. 99% of all
European Union enterprises are SMEs, employing almost 100 million
people, i.e. over two-thirds of all private employment in Europe. This
strong SME base, through its taxation on profit and wages, provide
support (through their monetary contributions) to the social needs of
European countries. Although medium enterprises feature in SMEs, the
overwhelming majority (over 90%) of SMEs are microenterprises with
fewer than ten employees (European Commission, 2003:Online). It is of
interest to note that inequalities do exist amongst SMEs with some SMEs
flourishing in the current economic climate, while others are struggling to
survive. Furthermore, growth rates for smaller enterprises are higher,
however their probability of survival is lower (Berry, 2002:10-11; and
Leopoulos, 2006:225). In East Asian countries, especially Japan, Taiwan
and Korea, SMEs have a significant influence on the economy. Japanese
64 Harper, A. 1984. Small business in the Third World. New York: John Wiley. 65 Refer to footnote 64.
157
SMEs play a pivotal role in the economy, principally through
subcontracting with larger organisations. In Taiwan, SMEs play an
important role in the economy by themselves, without the dependency on
larger organisations such as in the Japanese SME sector. Internationally,
the best performing economies, specifically Taiwan and Hong Kong, are
predominantly based on small enterprises. Research has shown that
where SMEs play a major role in the economy, both growth and income
distribution performances are positively influenced (Berry, 2002:10-11).
In Latin America, SME performance over the next two decades will be
crucial to improve the current economic performance. The importance of
the SME sector in Latin America is due to:
The high income inequality in most of the countries in Latin America
coupled with a disproportionate share of capital invested in the large
scale sector with minimum employment created by this sector, while
the rest of the labour force has a lower capital labour ratio to work
with.
Slow economic growth that characterised the economy over the last
few years.
Greater market openness and a greater role for the market in the
allocation of resources.
A higher degree of fiscal prudence to keep inflation within target
levels.
A high degree of similarity exists between South Africa and Latin America,
and as a result, the same level of importance can be attributed to the
South African SMEs in the local economy (Berry, 2002:5).
SMEs can make an important contribution to a country’s economic
performance, whether it is the United States of America (Audretsch, 2000:
Online), Japan (Urata & Kawai, 199866 cited by Berry, 2002:10),
66 Urata, S. & Kawai, H. 1998. Technological Progress by Small and Medium Enterprises in Japan. Paper prepared for the June 11,12, 1998 World Bank Workshop on Small and Medium Enterprises.

158
developing East Asia (Berry & Mazumdar, 199267 cited by Berry, 2002:10),
Africa (Mead & Liedholm, 1998:61-74), or Latin America (Berry, 2002:10).
The important role in a country’s economy is attributed to SME flexibility
and ability to innovate (Gunasekaran, Forker & Kobu, 2000:316-335), as
well as the potential to provide employment opportunities and support
large-scale manufacturing enterprises (Tan, Smith & Saad, 2006:239).
4.3.2 SME contribution to the African and South African economy
The importance of SMEs to a country’s economy (Ntsika, 2001:Online;
Kuratko & Hodgetts, 2007:5-8; and Hisrich & Peters, 2002:1568 cited by
Watson, 2004:15), is well-documented. The activities of SME enterprises
in Africa (McGrath & King, 199969 cited by Rogerson, 2001a:267), are of
vital importance to the promotion of economic growth, job creation and the
mitigation of poverty. However, research conducted on SMEs in Africa by
Mead and Liedholm (1998:61-74), confirmed that on average there are
more SME closures than expansions, with approximately only 1% of
microenterprises growing from five or less employees to ten or more. It
has long been debated that SMEs are pivotal to employment creation and
economic growth, particularly in countries with a high unemployment rate,
such as South Africa, estimated at up to 40% (Friedrich, 2004:51; and
Watson, 2004:15).
Upgrading the role of the SME sector in the South African economy to
improve economic growth through increasing competitiveness, generating
employment and redistributing income (Berry et al., 2002:1; Kesper,
200270 cited by Rogerson, 2004:765; 2006:54-55; and GCIS,
2002:Online), have been the focus of new development policies since the
democratic transition (Rogerson, 2004:765; and Rogerson, 2006:54-55). 67 Berry, A. & Mazumdar, D. 1992. Small-Scale Industry in East and Southeast Asia: A Review of the Literature and Issues. Asian-Pacific Economic Literature, 5(2),September. 68 Hisrich, R.D. & Peters, M.P. 2002. Entrepreneurship 5th Edition. New York: McGraw-Hill. 69 McGrath, S. & King, K. 1999. Enterprise in Africa: new context; renewed challenges. [In: King, K. & McGrath, S. (ed.). IT Publications, 1-12, London]. 70 Kesper, A. 2002. Tracing trajectories of successful manufacturing SMMEs in South Africa. Unpublished PhD dissertation. University of the Witwatersrand, Johannesburg.

159
The South African Government tabled the National Small Business Act of
1996, amended by Act 29 of 2004, to provide equal standing to SME
enterprises (Rwigema & Venter 2004:315; and Ntsika, 2001:Online) in
South Africa’s economy. The vital role played by the SME sector in the
South African economy in addressing sustainable development, was
highlighted by the 2003 Human Development Report (UNDP, 2003:5-16)
for South Africa (Rogerson, 2004:765).
In South Africa, it is estimated that 90% of all formal businesses are small,
medium or microenterprises (Rwigema & Karungu, 1999:101-124). The
SME sector is one of the largest contributors to the South African
economy. In 1995, SMEs contributed 32,7% to South African GDP and
44% to employment. This increased to a 36,1% GDP contribution in 2001,
and a 53,9% employment contribution (Ntsika, 2001:Online; and Friedrich,
2004:51). The SME is not only seen as an employment creator, but also
acts as an absorbent of retrenched people coming from the private and
public sectors (Ntsika, 2001:Online). The contribution of employment (in
2000) by firm size is depicted in Table 4.2 with the contribution to GDP (in
2000) by firm size depicted in Table 4.3.
Table 4.2: Contribution to employment by firm size (Source: Berry et al., 2002:25).
DATA SOURCE
USED
SURVIVALIST &
MICRO
VERY SMALL SMALL MEDIUM LARGE TOTAL
Ntsika 2000,
Stats SA 2000 &
OHS* 2000
In %
No of jobs
Informal:
26.1%
2,705,000
‘micro formal”
12.8%
1,332,003
12.1%
1,252,298
15.3%
1,591,046
33.7%
3,488,653
100%
10,369,000 * OHS: October household surveys from Statistics South Africa

160
Table 4.3: Contribution to GDP by firm size (Source: Berry et al., 2002:28).
DATA
SOURCE
USED
SURVIVALIST MICRO VERY
SMALL SMALL MEDIUM LARGE TOTAL
Ntsika
2000
In %
In
million:R
5.8%
47,027
13.9%
112,314
15.1%
121,607
65.2%
527,070
100%
808,017
Although the SME sector is responsible for over 60% of new jobs, largely
due to the emergence of new microenterprise formations, and SMEs
seemingly contributing a relative significant amount to GDP and
employment, it compares poorly to Asian countries, where SME
employment contribution is estimated at 80% (Friedrich, 2004:51; and
Watson & Godfrey, s.a:Online). Even in countries less developed than
South Africa, their SME sector contributes a much higher proportion to the
GDP and employment (OECD, 1997b71 cited by Watson & Godfrey,
s.a:Online; and UNDP, 2003:12). It is noted that the majority of South
African SMEs are micro- and survivalist enterprises, which show no signs
of enterprise growth. It seems that a ‘jobless growth’ strategy (Bloch &
Kesper, 2000a72,b73 cited by Kesper, 2000:8) is followed due to
inadequate firm dynamics, resulting in SMEs’ conservative contribution to
employment compared to other countries.
The South African Government has identified the SME sector as the
means to achieve accelerated economic growth. However, this objective
has not been achieved, partly due to enterprises’ high failure rate of 80%
(DAIL, 200474, DISP, 200375 cited by Watson, 2004:3; and Van Niekerk,
71 OECD. 1997b. Small Business Research and Policy. Organisation for Economic Co-operation and Development. [Online]. http://strategic.ic.gc.ca/epic/internet/insbrp-rppe.nsf/en/rd00259e.html 72 Bloch, R. & Kesper, A. 2000a. Supporting the Small and Medium Manufacturing Sector in the Western Cape. Unpublished report for the Council for Scientific and Industrial Research, Pretoria. 73 Bloch, R. & Kesper, A. 2000b. Supporting the Small and Medium Manufacturing Sector in the Highveld Production Region. Unpublished report for the Council for Scientific and Industrial Research, Pretoria. 74 DAIL. 2004. Daily News. [Online]. http:///www.dailynews.co.za

161
2005:ii) in the SME sector. As SME growth depends to a larger extent on
macroeconomic growth, the abvious analogy can be drawn that the limited
microeconomic growth of the past few years has inhibited SMEs’
developing to their full growth potential (Berry et al., 2002:93; and Watson,
2004:23-27). SME failure can further be partly ascribed to the lack of
management skills. South African SMEs do not aspire to corporate
governance best practices such as the implementation of King II (King II,
2002:Online) and King III (King III, 2009:Online). Risk management, a
component of King II and King III, is therefore also regarded as an optional
organisational activity, and not as a vital component to organisational
success (Van Niekerk, 2005:ii).
4.3.3 Rationale for supporting SMEs
Internationally, the economic potential for wealth distribution, economic
growth and employment opportunities are recognised as value-adding
capabilities of SMEs. According to Rwigema and Karungu (1999:101-124)
and Berry et al. (2002:10), governments have been and are in the process
of assisting SMEs for various reasons such as:
SMEs have a capacity to absorb labour, which is usually drawn from
the unskilled workforce.
SMEs provide an opportunity and testing basis for the development
of entrepreneurial traits such as entrepreneurship and innovation.
SMEs employ local technology and accommodate the needs of poor
people, arguably to a greater extent than the output delivered by
larger enterprises using foreign technology.
SMEs’ profits are not tied to long production runs, and as a result
they can produce smaller quantities of goods to regional or local
markets.
SMEs are geographically dispersed across the country, ensuring a
distribution of employment opportunities.
75 DISP. 2003. SMMEs failure blamed on poor management. Dispatch Online.[Online]. http://www.dispatchonline.co.za
162
Local resources such as technology, raw material, equipment, etc.,
are more likely to be used by SMEs, reducing the demand for foreign
exchange.
Scarce resources such as capital and managerial skills are used to a
lesser extent by SMEs than larger enterprises. However, even
though SMEs require less managerial resources, they do need
competent management in order to survive.
4.4 KEY UNDERPINNINGS FOR A SUCCESSFUL ENTERPRISE
Although a number of research initiatives have been conducted on small
enterprise success, no significant progress has been made. This can be
attributed to researchers’ lack of acknowledgment of problems specific to
small enterprises (Curran & Blackburn, 2001:228-24076 cited by Naicker,
2006:26; and Beaver, 2002:213), due to the uniqueness of each
enterprise’s characteristics, objectives and qualities, as well as the
influence exerted by the type of industry (Gadenne, 1998:Online) the small
enterprise prevails in. Furthermore, different perceptions surrounding the
definition of success (Beaver, 2002:213; and Naicker, 2006:26), and
identifying a suitable methodological approach (Watson, Hogarth-Scott &
Wilson, 1998:217-238), have adversely impacted on successful research.
Research has however shown that various internal and external factors
impact on small enterprise success such as competition, entrepreneurial
choices and objectives, enterprise culture, education, training and
experience amongst others. Prior research conducted on small enterprise
success focused on either personal and enterprise characteristics or
success measured in financial measures (Perrren, 1999:366-385;
2000:58-68), without agreement being reached (Watson et al., 1998:217-
238), on enterprise success factors (Naicker, 2006:26).
76 Curran, J. & Blackburn, R.A. 2001. Researching the Small Enterprise. London: Sage.

163
4.4.1 Defining and measuring enterprise success
Although success is often measured in terms of financial ratios such as
profitability or growth figures, far more difficulty is experienced when trying
to determine factors that lead to success. While there is no commonly
defined measure of business success, there are general influences that
impact on the success of potential enterprises (Beaver, 2002:98; Alsbury,
2001:14-38; and Naicker, 2006:27-28). The relationship between success
and intentional behaviour such as management strategies, organisational
objectives and personal characteristics (Gadenne, 1998:Online), and
organisational characteristics such as firm size and access to finance
(Wiklund, 1999:37-48), have been the topic of numerous research studies.
Naicker (2006:27-28), emphasise the importance of organisational size
and access to finance in that larger enterprises and enterprises with
adequate financing are more likely to be successful than their
counterparts.
Success factor measurement indicators were examined in Gadenne’s
study of small enterprises in Australia (primarily enterprises employing less
than ten employees), differentiating amongst different industries including
retail, manufacturing and servicing (Gadenne, 1998:Online). Statistical
analysis returned unique success factors pertaining to each industry.
Success in retail is positively influenced by a ‘value for money’ factor
(Gadenne, 1998:Online), consisting of competitive pricing, quality, high
sales turnover and cost reduction. Success in manufacturing was
positively mapped to competitive pricing and knowledge of competitors,
while in the service industry, success was positively mapped to training,
inclusiveness of decision-making and job satisfaction. One common
success attribute in all three industries was access to financial resources,
either contributed by the owner or drawn from the organisational profits
and cash flows. Regardless of the success factors mentioned, the
analogy can be drawn that success measurement indicators are highly
unique, cascaded down to the level of each SME owner and each
organisation (Gadenne, 1998:Online; and Naicker, 2006:28-29).

164
According to Probst and Raisch (2005:91) and Naicker (2006:32-33), four
key factors of success are proclaimed in virtually most authoritative
managerial publications, namely a high growth rate, organisational ability
of continuous adaptiveness, highly visionary organisational leadership and
success-oriented organisational culture. However, sustainable success
requires an equilibrium between these characteristics as the downfall of
failed companies more often than not are attributed to excessive growth,
unmanaged change, autocratic leadership and an excessive success
culture (Probst & Raisch, 2005:91,101; and Naicker, 2006:32-33).
Cornwall and Naughton (2003:62), measure success along different
attributes, namely financial growth, growth in total employment and profits,
and customer and employee satisfaction.
Kesper (2000:4-5) and Watson (2004:1-2), claim that throughout African
SMEs, entrepreneurship is the most important factor for economic growth
and success and not enterprise size. Entrepreneurship encompasses both
personal and corporate entrepreneurship (Zhara et al., 200077 cited by
Laforet & Tann, 2006:365), with the latter embodying an enterprise’s
innovation, influencing an enterprise’s performance. Personal
characteristics of the entrepreneur impact directly and indirectly on the
success of the enterprise. Organisational success factors indirectly
influenced by the entrepreneur (Choueke & Armstrong, 2000:236), are
organisational culture, a shared value system, an inclusive environment
where employees’ contributions are valued, the use of core competencies
and job satisfaction by the owner-manager and other employees.
Entrepreneurial characteristics that are conducive to success refer to
technical and mental ability, human relation capabilities, a goal-orientated
approach and creativity (Simpson, Tuck & Bellamy, 2004:481-491). In a
study conducted by Friedrich (2004:51) on South African SMEs, it was
emphasised that a vital key to enterprise success is ‘personal initiative’,
consisting of the owner’s characteristics such as being a self-starter,
77 Zhara, S.A., Neubaum, D.O. & Huse, M. 2000. Entrepreneurship in medium size companies: exploring the effects of ownership and governance systems. Journal of Management, 26(5):947-976.

165
having a proactive approach, specifically regarding risk management, and
persistent actions. In addition to a proactive business approach,
innovation and learning, goal-setting and achievement orientation were
linked to enterprise success. Where SME owners follow a reactive
business approach including reactive risk management practices, the
enterprise was more likely to fail. The external environment also exerts a
significant influence on the success of an enterprise. A successful
entrepreneur is positively influenced by a combination (Simpson et al.,
2004:481-491; and Naicker 2006:29-32) of internal factors, e.g.
knowledge, experiences and personality and outside influences of society
and the environment.
According to Laforet and Tann (2006:363), innovation is a critical attribute
to maintain or increase organisational market share and as a result aids in
assuring enterprise survival and success. Research has shown that SMEs’
ability to successfully innovate, depends on their capability to plan ahead,
the existence of a clear organisational strategy, and the ability to manage
strategically, which is reflected in their market-oriented approach, their
willingness to learn, innovate and take risks (Georgellis, Joyce & Woods,
2000:7-17; Beaver & Prince, 2002:28-37; and Salavou, Baltas & Lioukas,
2004:1091-1112). The SME risk-taking characteristic was confirmed by a
study conducted on American SMEs (Blumentritt, 2004:27-33; and Laforet
& Tann, 2006:366), confirming that the most innovative enterprises were
competitively aggressive and encouraged greater risk-taking.
4.4.2 Growth and sustainability
According to Fiol (2001:691-69978) cited by Naicker (2006:38), the
sustainability of organisations is founded partly on one key attribute,
namely constantly changing competitive advantage, derived from tacit
knowledge, human assets and procedures. Labour markets, capital
markets and product markets are some of the most important areas
78 Fiol, C.M. 2001. Revisiting an identity-based view of sustainable competitive advantage. Journal of Management, 27(5):691-699.

166
influencing SMEs’ growth (Berry et al., 2002:50-51). In SMEs, the owner-
manager is generally tasked with the strategic decision on how to grow the
enterprise. The strategic choice is based on cost comparisons, the
entrepreneur’s perception of the business environment and associated
aspirations. Even though market conditions may be favourable
(Bamberger, 199479 cited by Kesper, 2000:9), the entrepreneur may
decide not to grow his enterprise based on the above influencing factors.
Where enterprise growth is measured in terms of turnover and
employment level, the managerial choices (O’Gorman, 2001:60-75), of
where to compete, how to compete and a combination of the two
elements, are the primary influencing factors. O’Gorman (2001:60-75) and
Naicker (2006:39) claim that research evidence indicates that high growth
enterprises build on their existing strengths and limit the scope of their
activities to a central skill or competencies. Research conducted on the
reasons for SME growth and success (Choueke & Armstrong, 2000:227-
238), identified a ‘missing perspective’ with a positive influence on the
enterprise, namely the ‘tone at the top’, i.e. the culture of the organisation
as practised by top management (Naicker, 2006:39-40). Technological
change, innovation and entrepreneurship are seen as critical factors to
enterprise growth encompassing aspects such as the personal
characteristics of the owner-manager, attitudes, education and spontaneity
of the entrepreneur (Berry et al., 2002:50-51).
Enterprises that are starting up, face different obstacles than existing
enterprises seeking to grow (Liedholm, 2002:240). For enterprises not
aiming to grow, or aiming to expand only a little, a small amount of working
capital is needed to fulfil their needs. Research findings show that only
one percent of enterprises seeking growth or aiming to grow beyond 10
employees succeed in meeting their growth objective. Research has
shown that these enterprises have a higher level of human capital
79 Bamberger, I. 1994. Developing competitive advantage in small and medium-sized firms. [In: Bamberger, I. (ed.). Product/Market Strategies of Small and Medium-sized Enterprises. Aldershot: Avebury].

167
consisting of experience and education, are more likely engaged in
manufacturing opposed to trading, and display more complex marketing
patterns than stagnating, growthless SMEs (Liedholm & Mead, 199980
cited by Liedholm, 2002:232). As a result, in addressing growth, attention
should not solely be directed at working capital, but at the complex set of
requirements needed for this purpose (Liedholm, 2002:232-236), which
are expanded upon below:
Organisational age: A strong inverse relationship exists between
organisational age and growth, with younger enterprises generating
more jobs per enterprise. However, organisational age is also
attributed to closure, in that over 50% of micro- and small enterprise
closures occur within the first three years of start-up. These statistics
are also reflected in the Global Entrepreneurship Monitor (GEM)
2001, where statistics returned a low survival rate amongst South
African start-up enterprises (Watson, 2004:1-2).
Organisational start-up size: There is a strong inverse relationship
between start-up size and growth, with small organisations adding
more jobs per enterprise compared to the larger organisations. In
South American and African micro- and small enterprises, research
has shown that the small size of the organisation does not impede on
organisational survival; however growing micro- and small
enterprises are more prone to survive than non-growing enterprises.
Industry sector: On aggregate, it appears that manufacturing and
service enterprises have higher growth rates than enterprises in the
trading sector.
Location: Urbanised enterprises experience a higher growth rate
than rural enterprises.
Country: This variable also exerts an influence on organisational
growth.
Gender of the entrepreneur: Male-run enterprises grow seemingly
more rapidly than female-run enterprises due to arguably females’
80 Liedholm, C. & Mead, D. 1999. Small Enterprises and Economic Development: the Dynamic Role of Micro- and Small Enterprises. London: Routledge.

168
risk adversity (Downing & Daniels, 1992:21), and discrimination
practices.
Human capital: Research confirms that human capital has a
significant influence on enterprise growth, in that SME entrepreneurs
with training and prior work experience show higher SME growth
than their counterparts.
SME performance therefore depends not only on the removal of obstacles
through supportive public policies, but also on industrial and organisational
structures, the flexibility of the enterprise and most importantly, the
capabilities and vision of the entrepreneur (Kesper, 2000:1).
4.4.3 Critical success factors
Caution should be levied against viewing SMEs as smaller versions of
larger enterprises, as SMEs do not in any way resemble large
organisations. Generally, SMEs experience a scarcity of resources
(OECD, 200281 cited by Wong, 2005:266-269; and Jun & Cai, 2003:192-
203) such as time, financial and human resources. The nature of smaller
enterprises expose them to a greater degree to knowledge loss, since
larger enterprises can offer employees higher salaries, which when
accepted, result in the loss of employee embedded knowledge to the
smaller enterprise. Innovation should be promoted and nurtured in SMEs,
where employees are encouraged to generate new ideas, knowledge and
solutions, thus fostering a culture that emphasises problem-seeking and -
solving (Goh, 2002:23-30) and open-mindedness (Stonehouse &
Pemberton, 1999:131-144). Equally important is the organisational culture
of the enterprise, whereby mistakes are viewed as an investment process
that facilitates learning whereby employees have more freedom to explore
new opportunities. Care should therefore be taken when developing
critical success factors for SMEs, to ensure that the specific needs and
situations are thoroughly understood (Wong, 2005:266-269).
81 OECD. 2002. OECD Small and Medium Enterprise Outlook. Organisation for Economic Co-operation and Development, Paris.

169
Studies have identified a number of factors influencing enterprise
expansion and success. A fundamental element (McGrath & King,
1996:Online; and Manu, 1998:682 cited by Rogerson, 2001a:268-270), that
has a positive impact on an organisation’s growth is the depth of human
capital or brain power. The importance of human capital as a critical
success factor was also confirmed in a study conducted on African
enterprises where it was determined that successful entrepreneurs more
likely have education and training beyond the primary school level (King &
McGrath, 1999:1383 cited by Rogerson, 2001a:268-270). Education and
experience also have an influence on employment growth, as only a small
number of SMEs will positively contribute to employment, with these SMEs
characterised by highly trained and educated entrepreneurs who employ
skilled labour (Kesper, 2000:8). The merit of this finding is based on the
argument that entrepreneurs with a greater level of education and training
are more able to adapt their businesses to the ever-changing business
environment (Rogerson, 2001a:268-270). According to Rogerson
(2008:70-71), in order to deal effectively with issues such as globalisation,
“… strategies to improve individuals and enterprises level of knowledge
and skills …” (King et al., 2002:2884 cited by Rogerson, 2008:70-71), are
needed as training and skills are essential for SMEs to acquire the
knowledge to “… learn to grow …” (McGrath & King 1999:21185 cited by
Rogerson, 2008:70-71) and to “… move up the value chain …” (Kraak
2005:58). In the Global Entrepreneurship Monitor, authors Orford, Wood,
Fischer, Herrington and Segal (2003:56), confirm the importance of
education, training and experience as core elements to enterprise
success. Smith and Perks (2006:17-26) and Perks (200486) cited by
82 Manu, G. 1998. Enterprise Development in Africa: Strategies for Impact and Growth. Small Enterprise Development, 9(4):4-13. 83 King, K. & McGrath, S. (ed.). 1999. Enterprise in Africa: Between Poverty and Growth. London: Intermediate Technology Publications. 84 King, K., McGrath, S., Rogerson, C. & Visser, K. 2002. Learning-led competitiveness: a challenge for South African development. Africa Insight, 32(3):28-35. 85 McGrath, S. & King, K. 1999. Learning to grow? The importance of education and training for small and micro-enterprise development.[In: King, K. & McGrath, S. (ed.). Enterprise in Africa: Between Poverty and Growth. London: Intermediate Technology Publications]. 86 Perks, S. 2004. The entrepreneurial skills necessary for growth of micro entrepreneurs: an empirical study. [In: Grundling, J.P. & Olivier, N. (ed.). Proceedings 3rd International

170
Rogerson (2008:70-71), differentiate between four types of essential skills
needed to start up a microenterprise, namely:
Personal skills,
technical skills,
business operation skills, and
managerial skills.
However, taking the importance of training and skills into account,
McGrath (2005a:587) cited by Rogerson (2008:70-71) cautions that skills
are not the only answer to the challenges facing SME development.
Improvement of the investment climate for microenterprises also hinges on
enhanced access to finance for entrepreneurs (Clarke, Eifert,
Habyarimana, Kapery, Kaplan, Schwartz & Ramachandran, 2006:63-76).
Access to finance from banks, non-banking institutions and public
institutions, is essential to SMEs, specifically the enterprises displaying the
potential to grow (St-Pierre & Bahri, 2006:547). The financial need
experienced by entrepreneurs differentiates according to the kind of SME
and the different phases of SME development, commencing with the start-
up phase through to the stable phase. It is of interest to note that SME
finance needs decrease where SMEs utilise accounting records (Angela
Motsa & Associates 2004:Online), such as cash books, records of
accounts receivable, inventory records and active debtor management.
Finance, skills, business training and less rigid regulations are the key
elements to promote entrepreneurship, enhance the enterprise
environment, and improve competitiveness and capacity in the SME
enterprise (Rogerson, 2008:62-67).
4.5 PROBLEMS EXPERIENCED BY SMEs
SME owner-managers are most conversant with their enterprises, but are
frequently not able to identify all the factors impacting on their enterprise Conference: Entrepreneurship in Africa Sustainable Globalisation. Pretoria: Tshwane University of Technology]. 87 McGrath, S. 2005a. Skills Development in Very Small and Micro Enterprises. Cape Town: HSRC Press.
171
activities and/or overrate the significance of external factors, while
underrating internal weaknesses (Manning, 199688 cited by Kesper,
2000:12; and Bloch & Kesper, 2000a89, b90 cited by Kesper, 2000:12). This
view is also reiterated by Kaplinsky and Morris (1999:717-737) and Kesper
(1999b:137-164), who state that SME owner-managers believe that the
primary obstacles to their survival is external to the enterprise. In contrast
to these beliefs, research on technology upgrading of SMEs in South
Africa (Dunne, 1999:24; Kaplinsky & Morris, 1999:717-737; Kesper
1999a:14-15; 1999b:137-159; and Kesper 2000:14-15), suggest that
SMEs should devote more attention to internal weaknesses by improving
their internal operations.
Entrepreneurs usually experience difficulty in identifying factors, which
impede on enterprise growth (Berry et al., 2002:50). According to Dockel
and Ligthelm (2002:291) cited by Naicker (2006:17), problems experienced
by SMEs can be categorised as follows:
Economic problems: Problems relating to the state of the economy,
e.g. employment opportunities.
Industry-related problems: Problems relating to the type of industry
in which the enterprise operates, which may include demand and
supply factors, obstacles to entry and level of competitiveness in the
industry.
Enterprise-based problems: Problems relating to internal difficulties
experienced by the enterprise such as resource availability, i.e.
finance, entrepreneurship and the effective use of these resources.
The importance of the above three categories of problems, call for closer
scrutiny thereof:
88 Manning, C. 1996. Market access for small and medium-sized producers in South Africa: the case of the furniture industry. Unpublished PhD. Thesis. University of Sussex, Brighton. 89 Refer to footnote 72. 90 Refer to footnote 73. 91 Dockel, J.A. & Ligthelm, A.A. 2002. Factors that contribute to small business survival. Pretoria: University of South Africa.

172
Economy-based problems
The performance of the South African SME sector depends largely on
macroeconomic conditions and industrial or market structures (Kesper,
2000:7-8). A survey on business success factors of SMEs in Gauteng
(Ligthelm & Cant, 2002:19-25; and Naicker, 2006:16), returned that in the
macroeconomic environment, crime was perceived as the largest problem,
followed by inflation, unemployment, interest and exchange rates. SME
success is tied in with the local economic conditions as the SME sector’s
market growth usually takes place at the same rate as the macroeconomy
as a whole, therefore should there be an economic downturn, SMEs will
usually also experience difficulty (Berry et al., 2002:85). All categories of
SMEs identify declining demand levels and a lack of customers’
purchasing power as one of their core constraints (Berry et al., 2002:86;
and Leopoulos, 2006:226).
Enterprise-based problems
In surveys on Latin America and South African micro- and small
enterprises, it was found that less than 50% of business closures were
attributed to business failures, i.e. financial or economical infeasibility due
to insufficient demand and inadequate working capital. The remainder of
closures are attributed to personal reasons or the availability of better
options or Government interference (Liedholm, 2002:232-234).
Internal factors such as human resource problems encompassing poor
staff planning, multifunctional management, high employee turnover rate,
inadequately trained employees, low productivity and difficulties in
recruiting quality staff (Beaver, 2002:102; Berry et al., 2002:51;
Williamson, 2000:27; Ligthelm & Cant, 2002:34; and Watt, 2007:34-35),
are considered to be impediments to SME success. SMEs face several
challenges involving the need to increase the level of human capital and
assuring the effective use of such resources. It is argued that the roles of
labour, labour markets and skill levels are the most important factors
contributing to small enterprise growth (Berry et al., 2002:51). South
Africa in particular is prone to underinvestment in human capital with low

173
levels of foremen, mid-management, staff motivation skills and team-
building skills. This need is reflected in SME owner-managers’ response
identifying human capital investment as the second most important aspect
where assistance is required after market development (Berry et al.,
2002:61-62,65).
Training and education further influence the owner-managers’ perception
of business success (Ligthelm & Cant, 2002:34; King & McGrath,
2002:3192 cited by Naicker, 2006:16-17,28; and Devey, Skinner & Valodia,
2002:2293 cited by Naicker, 2006:16-17,28), as owners with management
qualifications regard their business as very successful compared to
owners without management qualifications. Managerial skills not only
influence owners’ perceptions about their business, but various literature
sources (Viviers, Van Eden & Venter, 2001:1194 cited by Watson, 2004:1-
2), acknowledge that a lack of managerial skills and training is an
important cause of enterprise failure (Naicker, 2006:18), complemented by
a lack of experience and a lack of organisational culture acting as an
impediment to the establishment of SMEs.
In a study conducted on enterprise success factors in SMEs in Gauteng,
South Africa, it was concluded that a lack of technical and managerial
skills (Brink, Cant & Ligthelm, 2003:Online; and Rogerson, 2008:70-71)
impedes on business development. Research conducted on SME failures
in South Africa returned that failure is primarily caused by a lack of
management skill and training. This finding is confirmed (Radipere & Van
Scheers, 2005:40995 cited by Rogerson, 2008:70-71), by 90% of a sample
92 King, K. & McGrath, S. 2002. Globalization, Enterprise and Knowledge Symposium. Oxford: s.n. 93 Devey, R., Skinner, C. & Valodia, I. 2002. The informal economy in South Africa. Johannesburg: The Development Policy Research Unit. 94 Viviers, S., Van Eeden, S. & Venter, D. 2001. Identifying small business problems in the South African context for proactive entrepreneurial education. Global International Enterprise. S.l.:s.n. 95 Radipere, S. & Van Scheers, L. 2005. Investigating whether a lack of marketing and managerial skills is the main cause of business failure in South Africa. South African Journal of Economic and Management Sciences, 8:402-411.
174
of 1 000 entrepreneurs who believe that SME failure is due to a lack of
managerial skills.
The owner-manager’s characteristics (O’Gorman, 2001:60-75), may also
act as a barrier to growth in that the personality, managerial skills and style
including the entrepreneur’s and/or management’s negative attitude
towards change, may negatively influence an enterprise (Leopoulos,
2006:226; and Naicker, 2006:39). Other operational problems
encountered according to Leopoulos (2006:226), are:
The use of uncoordinated changes in management practices without
accompanied strategic planning and continued observation (Smart,
Maull, Childe & Radnor, 2004:2-12).
Limited resources to effect improvements.
Lower productivity compared to larger enterprises (European
Commission, 2003:Online).
Lack of organisational dynamics to grow beyond a one-person
operation (Rogerson, 2004:770-771).
According to Berger and Udell (2001:Online), and Reynolds and Lancaster
(2006:396-397), a high percentage of small organisations fail in the first
five years of trading, often as a result of overtrading and financial strain.
Access to finance as a constraint on SME development has therefore
featured prominently in a number of studies. With regard to funding
secured from banks, SMEs encounter various obstacles, with lenders
perceiving SMEs as non-transparent in the utilisation of the funding, while
SMEs complain that their business risk is overrated, resulting in harsh
financing conditions impeding on their competitiveness (St-Pierre & Bahri,
2006:547). Internationally, this view is mapped in the following countries
(St-Pierre & Bahri, 2006:547):
Malaysian bankers regard SMEs as non-performers and thus
exercise a cautionary attitude towards them (Rahman et al.,
2003:Online).
Belgium bankers regard SMEs as extremely high risk entities, given
the difference between management objectives and banker

175
objectives (Janssen & Wtterwulghe, 199896 cited by St-Pierre &
Bahri, 2006:547).
South African bankers are no different in their perspective of SME’s as
their international counterparts. South African bankers are less inclined to
finance SMEs (Pretorius & Shaw, 2004:Online), due to their perceived
high level of risk and a weak expected return (St-Pierre & Bahri,
2006:547). The difficulty experienced in access to finance is most
prominent in micro- and informal enterprises and considered to be the
main obstacle to their development (Kubheka 2006:Online97 cited by
Rogerson, 2008:62-67). This is emphasised by South African
microenterprise surveys, with the inaccessibility to finance listed as one of
the primary external constraints faced by SMEs. Some of the factors that
contribute to the complex financing problem are insufficient knowledge of
the SME entrepreneurs e.g. their inability to draw up a business plan; the
lender’s inability to determine the SME’s credit risk attributed to a lack of
enterprise information; and general communication issues (Berry et al.,
2002:65,68,77), leading to low levels of entrepreneurship and a high
failure rate (Kotze & Smit, 2008:35; and Rajaram, 2008:62) among South
African SMEs. According to Rogerson (2001b:127) and Skinner (2005:35-
40), emerging African SME entrepreneurs, also experience a lack of credit
as a major constraint. These entrepreneurs are dependent on personal
savings or loans from relatives and friends as the source of their start-up
capital. High interest rates, lack of credit history and collateral, and a
complex finance application process, are some of the factors contributing
to the low usage of formal bank loans.
Access to finance encompasses different kinds of finance to fulfil the
varying needs ranging from long-term capital to short-term capital, to
equity finance and debt finance, with longer-term finance more difficult to
obtain. The inaccessibility to different kinds of finance has a negative 96 Janssen, F. & Wtterwulghe, R. 1998. L’influence de l’interprénétration du dirigeant et de son enterprise sur l’endettement bancaire des PME: état de la question. Paper presented at 4ième Congrès International Francophone de la PME, Metz, France, October. 97 Kubheka, B. 2006. Small business survey highlights.[Online]. http://www.finmarktrust.org.za.

176
effect on SMEs, as most enterprises need long-term and short-term
finance to succeed. SME finance demand is also multifaceted due to
enterprises’ different needs for capital to run their operations, the different
resources they can invest and the varying accessibility to external finance.
A further aspect that influences finance is that financial institutions provide
grants more easily to older and/or larger firms, than younger and/or
smaller firms, supporting the underlying assumption that micro- and young
enterprises are less creditworthy than the larger enterprises. Further
research however needs to be conducted to determine if the higher failure
rate is a cause or a consequence of the higher credit rejections (Berry et
al., 2002:70,96).
Interest rates furthermore form an integral part of SME finance. Interest
rates have a dualistic purpose by regulating the supply of finance as well
as the demand for finance. Equalisation is effected through a risk premium
that is levied on riskier loans in proportion to the perceived risk, in addition
to the prime rate. This results in higher interest rates charged to the SME
sector and particularly on longer-term loans (Berry et al., 2002:71).
Accessibility and availability of finance due to inadequate credit
information in the credit assessment process, SMEs’ inexperience in the
loan application process, and high loan transactions costs are the typical
reasons for failures in SME financing world-wide (Berry et al., 2002:70,96).
It is therefore important to develop an effective and efficient process
whereby all SME dimensions are evaluated when measuring the
borrower’s risk. According to Allegret in Chanel-Reynaud and Bloy
(200198) cited by St-Pierre and Bahri (2006:547), “… the approach
adopted by the banks within the framework of their financial diagnosis is
unsuitable to the context in which enterprises, in particular the SME’s,
currently evolve. In this way, the new financial diagnosis of an enterprise
must be capable of taking into account the turbulence and recurring
bumps that have affected enterprises since the early 80’s”. The
98 Chanel-Reynaud, G. & Bloy, E. 2001. La banque et le reisque PME, Lyon: Presses universitaires de Lyon.

177
development of a more inclusive SME risk measurement framework will
enable lenders to make rapid and objective decisions based on the actual
business environment, while SME management cannot criticise the
banking environment of over-valuating the risk. At present, few risk
evaluation models exist which allow for an overall evaluation of SME risk.
The lack of suitable risk models is emphasised by the banking sector’s
continued reliance on financial models where information is derived by
way of financial statements, since this information is considered more
objective than information obtained from other sources, as stated by the
following sources:
Lévy and Sauvage, 200399 as cited by St-Pierre and Bahri,
(2006:548), for the quotation system of the Banque de France.
Müller, 2003100 cited by St-Pierre and Bahri (2006:548) for
Switzerland.
St-Pierre, 2004101 cited by St-Pierre and Bahri (2006:548) for
Canada.
These lenders, along with others, do not take into account the
shortcomings of financial information. Factors that have an impact on the
financial performance of an organisation include the structure of the
enterprise and the quality of business practices, along with numerous
other risk factors (St-Pierre & Bahri, 2006:548).
However, some studies refute the access to finance obstacle argument.
Levy (1996102) cited by Berry et al. (2002:77), in a survey of 134 small
South African enterprises, found that access to finance was an important
but not primary obstacle, even in younger enterprises. It was identified that
debt-free enterprises’ debtless structure was due to either a reluctance to
borrow, or high interest rates.
99 Lévy, J. & Sauvage, F. 2003. La cotation de la Banque de France et le ratio McDonough. Bulletin de la Banque de France,112. [Online]. www.banque-France.fr/fr/telechar/bulletin/etu112_1 . 100 Müller, H.-U. 2003. Notation interne: exemple Crédit Suisse. [Online]. www.cvci.ch/upload/Public/Discours/Zuberbuhler03.ppt . 101 Refer to footnote 7. 102 Levy, B. 1996. The Business Environment for Industrial Small and Medium Enterprises. Informal Discussion Paper 11. World Bank, Washington DC.

178
Industry-related problems
According to Viviers et al. (2001:11103) cited by Naicker (2006:18,28),
Huang and Brown (1999:73-85) and Watt (2007:34-35), market-related
factors that exert the most negative influence on enterprise success are
increased competition, limited market size, low demand, inefficient
marketing, poor competitor understanding, poor location and market
understanding and the inability to identify the target market. South African
SMEs are hampered by a structural problem in that they, contrary to SMEs
in other developing countries, do not complement larger organisations with
spesialised products or services. Instead, they compete with larger
enterprises in the same product markets (Qualmann, 2000:41104 cited by
Rogerson, 2004:770-771), albeit for different consumer segments.
In conclusion, the following SME problems (Berry et al., 2002:73; and
Laforet & Tann, 2006:374) need to be addressed:
Insufficient entrepreneurship, i.e. lack of knowledge, training,
networking and skills.
Lack of good business opportunities.
Inadequate entrepreneurial business acumen.
Low capital availability due to, e.g. low savings rate.
Information availability difficulties.
Market fragmentation and customer dependency.
Difficulty in securing finance.
Pressures exerted on interest rates due to default rate and the need
to cover transactions costs.
For SME owner-managers, it is important to identify the most problematic
areas in managing their small enterprise. By identifying the problem
areas, owner-managers can address problems through education, training
and information-gathering activities (Huang & Brown, 1999:73-85).
103 Refer to footnote 94. 104 Qualmann, R. 2000. Economic development and employment promotion in South Africa: analysis with special reference to SMME promotion and strategy options for the German Development Cooperation. Unpublished report. Bonn: GTZ

179
4.6 EXPLOITING RISK
Successful enterprises tend to have the following factors in common
(Engle, 2009:20):
Conservative debt-equity ratios, i.e. balance sheet.
Highly efficient cost control actions.
Commitment and substantial investment in new technology.
Eagerness to enter new markets which hold growth prospects.
Dynamic business model that can accommodate change.
An understanding of the risks impacting on the organisation.
Procedures to deal with risks effectively.
Embedded in risk are both a negative and a positive risk factor. In the
extreme form, there is a strong positive correlation between the size of the
risk and the benefit to be obtained. Although this strong positive risk
correlation exists, most people consciously avoid risky situations.
However, by analysing potential risks, managers can extrapolate the high
rewards, and the negative risk component can become relatively
insignificant. According to Zeckhauser and Sandoski (2009:76-77), the
following steps should be considered in exploiting risky situations:
Key risk drivers or risk factors need to be determined.
Not all decision-making needs to be done quickly. By experimenting
the downside risk is reduced, but not the upside reward.
A risk-tolerant environment should be created that encourages
creative thinking.
Educated risk-taking should be encouraged.
According to Plourd (2009:68-69), the importance of risk management is
now escalated above issues such as long-term and short-term financing
constrains. Proclaiming the existence of a risk management strategy is
insufficient, enterprises need to actively engage in risk management
practices to address the convergence of major risks as experienced in the
current economic climate where the credit crisis risk, fluctuating
commodity prices, increased Government debt, rising unemployment and

180
declining consumer spending are impacting on enterprises, individually
and combined.
The use of ERM may be viewed as a business competency enabling
managers to optimise opportunities associated with risks (Hofmann,
2009:14). ERM should apply basic risk management activities, embedding
the risk champion’s knowledge of exposures across the entire scope of an
enterprise’s risks such as strategic risks, operational risks, financial risks
and regulatory compliance risks (Engle, 2009:20), and should not be
reduced to a process based solely on risk formulas (Bradford, 2009:4-28).
ERM’s effectiveness depends to a large degree on efficient and correct
data collection (Banham, 2004:69). Effective ERM is enforced through
forcing management to look beyond the current decisions needed to
operate the enterprise and instead foster an understanding of how the
enterprise can avoid or react to significant business changes impacting on
it (Engle, 2009:20). ERM enables an enterprise to handle exposure to
accidental losses in an economical and effective manner. A structured risk
management approach enables an enterprise to pursue its strategies
aggressively and efficiently, as management can anticipate the risk
exposure of each activity engaged in, thus achieving more acceptable
results at a reduced cost (Ntlhane, 1995:27).
4.7 RISK MANAGEMENT FOR SMALL BUSINESS
Risk and risk management are a major concern for all companies,
especially small and medium-sized enterprises, which are particularly
sensitive to business risk and competition (Blanc Alquier & Lagasse
Tignol, 2006:273). A substantial number of larger organisations have
developed a risk management culture consisting of complex procedures
and executed by teams of experts. In smaller organisations such as SMEs,
such integrated risk management processes do not exist (Ntlhane,
1995:106-107; and Dupré, 2009:17). In SMEs the risk management
function usually resides with the owner’s assessment of threats and
opportunities pertaining to the enterprise (Watt, 2007:33-34). Although risk

181
management principles are common to all types of enterprises, the owner-
manager’s risk perception and his attitude towards risk management
influence the adequacy of the enterprise’s risk management actions
deployed (Ntlhane, 1995:106-107).
Implied in SME risk management is the core principle that entrepreneurial
or management focus should be aimed at recognising future uncertainty,
deliberating risks, identifying possible manifestations and effects, and
formulating plans to address such risks and reduce or eliminate their
impact on the enterprise (Ntlhane, 1995:27). One of the skills required of
entrepreneurs is the ability to identify and analyse risks to ensure that
advantage is taken of calculated risks (Watson, 2004:84-85). This
managerial focus is of vital importance for SMEs, where risk identification
and control depend on the risk personality of the entrepreneur (Ntlhane,
1995:27). Owner-managers, when considering implementing an ERM
programme or evaluating existing risk procedures, should take cognisance
of the following (Bradford, 2009:15):
Are the largest risks facing the enterprise identified?
Are risk measures in place to address these risks?
If losses do occur despite preventative measures implemented, is the
enterprise prepared to handle them?
Is a structured approach available to create opportunities out of
risks?
According to Watt (2007:36-40), SME owner-managers should consider
the following steps in their risk management process:
Establishing an SME’s risk strategy: Threats often dominate risk
discussions leading to a negative reaction of SMEs to the risk
management process. It is important that a risk approach is
proposed that emphasises the upside of risk, i.e. opportunities that
drive innovation, instead of a rigid compilation of threats faced by the
enterprise. The starting point for owner-managers is to establish
enterprise objectives through the formulation of the enterprise’s
vision and mission. The process will be cascaded downwards

182
through defining operational aims and targets expressed over a time
period and the establishment of a risk governance framework that will
address risks threatening the achievement of set goals. The risk
governance framework will address the process of identifying,
assessing, prioritising and managing risk, as well as risk monitoring
and communication aspects.
Determining the SME’s risk appetite: SME resources are limited,
thus every resource spent in mitigating a risk will not be available
elsewhere in the enterprise. Owner-managers therefore need to
determine what level of risk is acceptable to the SME before action is
required by way of controls and risk treatment options to bring the
risk exposure level back within the acceptable range. Setting the
enterprise’s risk appetite is advantageous in that:
o It forces the enterprise to measure and compare risks and the
potential for losses and opportunities.
o It aids in determining the efficiency of resources expended on
risks, i.e. resources are allocated to risks that rank above the
enterprise’s threshold.
o It focuses attention on important risks above the threshold.
o It aids in the establishment of enterprise objectives that are in
line with the risk appetite of the individual SME.
o It aids in the allocation of limited time and resources.
Identification and assessment of risk: Enterprises are often
created as a result of an opportunity the entrepreneur has identified.
However, there are various areas of risk that may threaten an
enterprise’s success. The use of a structured risk identification
process may identify specific risk categories, areas and topics to be
evaluated, while simultaneously it provides an opportunity to identify
a broader range of risks. The result is a list of threats and associated
risks that may be categorised into specific categories. In the SME
environment, a simplistic risk identification process should be used in
answering questions such as ‘What/How/Why can it happen?’. The
risk identification process should build on experience, but also
incorporate a forward-looking approach in trying to anticipate

183
possible risks that have not yet been experienced. The information
can then be extrapolated from the risk identification process into a
risk matrix, where risks are assessed based on the risk’s probability
of occurrence and the severity of the possible outcome (Watt,
2007:36-40). As the accuracy of information is of vital importance,
management should strive to improve the quality of the information
used in identifying and assessing risks (Foster, 2009:Online).
Prioritising and managing risks: The risk assessment information
is set out in relation to the risk categories ensuring a focus on high
risk areas. The consolidated risks are assessed as well as the
individual component parts. This enables the owner to take a
measured and objective look at the enterprise to see beyond the
limitations of his own area of expertise, avoiding excessive focus on
minor risks. There are however limitations to the risk management
process and the owner-manager should take cognisance of the
following:
o Risk assessment may be helpful in decision-making, however
the quality thereof is limited to the depth of the research and the
experience and skills of the individuals involved in the risk
assessment process.
o Risk management does not eliminate risk, but rather aid in the
effective deployment of scarce resources and time.
o Risk assessment is not a guarantee against the realisation of
adverse events, but provides significant warning of possible
problems and a focused approach to safeguard the enterprise’s
reputation and business continuity.
o Although risk assessment will try to identify all significant risks,
it is hampered by resource constraints, including the availability
of information, staff, time and budgets.
The fact that a risk is beyond the control of the owner-manager, does not
absolve him from the need to anticipate the risk, and reducing the impact
of the risk occurrence to achieve organisational goals. Owner-managers
should furthermore take cognisance of managerial risks that arise as a

184
result of the owner-manager’s own actions when planning and executing
business strategies. These risks may arise as a direct or indirect result of
management actions (Berkeley, Humphreys & Thomas, 1991:5).
South African SME owner-managers should be educated in risk
management principles, risk handling techniques available and risk control
programmes that can be used, but care should be taken in the application
of risk management principles, as although risk principles are common to
all types of enterprises, the application thereof differs substantially
between small and larger enterprises. However, many SMEs practise
intuitive risk management when they assess the risk involved in decisions
(Ntlhane, 1995:106-113; and Dupré, 2009:17).
4.8 DRIVERS OF RISK MANAGEMENT IN SMALL BUSINESS
Risk drivers is defined by Berkeley et al. (1991:6), as “… observable
phenomena that are likely to drive up the possibility of some risk
consequences which depend, in part at least, on the occurrences of this
phenomenon”. A number of research studies have been conducted on
identifying risk drivers to facilitate an understanding of the possibility of
occurrences of risks and their possible impact. Risk drivers have been
identified in various areas, e.g. drivers linked to the size and complexity of
operations, depth of organisational knowledge about the business
environment it functions in, the technology required in business activities,
clientele characteristics, etc. One of the major influences on risks is
managerial actions as they can increase or decrease the probability of
negative risks occurring, taking cognisance of the interdependency of risk
drivers (Berkeley et al., 1991:6,11,15).
According to Watt (2007:35-36), risk drivers may include:
Legislation and insurance: This externally driven risk driver often
dominates decisions for small organisations. Legislative issues may
include:
o Occupational health, safety and environmental legislation.

185
o Contractual obligations.
o Organisational specific requirements, e.g. hygiene legislation for
food processing organisations.
Internal drivers or business process drivers include:
o Enhanced competitive advantage.
o Improved product and service quality.
o Reduced overspending on budgets.
o Improved relationships with all stakeholders (employees,
clients, suppliers, etc.).
Business practices: By applying risk management principles,
owner-managers can achieve:
o Improved client confidence.
o Reduced staff turnover, specifically concerning key personnel
due to improved staff confidence.
o Safeguarding of organisational reputation and brand
development.
For risk drivers to be useful in practice, the following two requirements
must be met:
It must be reliably quantifiable inferring the existence of orderable
levels, e.g. high, medium, low regarding the risk factor. The risk
factor should describe the possible action that is to be observed or
inferred from the observation. Furthermore, it must be determined
what levels increase or decrease the probability of the risk
consequences occurring.
It must be observable in the context of business activities before the
occurrence of the risk.
In practice, difficulty may however be experienced in accurately identifying
appropriate risk drivers for anticipated risks that may materialise for a
specific scenario. To accommodate the abovementioned difficulty,
management should direct its focus to each scenario’s high level risk
drivers before any risk is realised by incorporating a generic risk model,
populated by organisational specific detail such as organisational policies

186
and operating specifics, thus gaining a significant competitive advantage
(Berkeley et al., 1991:6-8).
4.9 COMPONENTS OF RISK IN SMEs
Determining the components of total risk in SMEs is complex due to
SMEs’ great heterogenity as well as difficulty in separating property from
management (St-Pierre & Bahri, 2006:550). Entrepreneurs have implied
(Julien & Marchesnay, 1996105 cited by St-Pierre & Bahri, 2006:550),
inconsistent (LeCornu et al., 1996:1-14), and in certain instances unique
(Naffziger et al., 1994:29-42), objectives that exert both direct and indirect
influences on management practices, rendering comparisons between
SMEs difficult. Information derived by way of financial data analysis
cannot yield all the dimensions of enterprise performance, as emphasised
by Eccles (1999106) cited by St-Pierre and Bahri (2006:550-557). Strategic
information such as quality, client satisfaction and innovation, reflects the
enterprise’s competitiveness and performance, but is not forthcoming in
the income earned. Cumby and Conrod (2001:261-272), emphasise that
long-term sustainable financial performance is attributable to non-financial
factors like client loyalty, employee satisfaction and internal processes.
This view is affirmed by Ittner and Larcker (1998:1-35), who state that the
investment in intangible assets, e.g. client satisfaction, is not
accommodated in the accounting data. The same argument applies to the
risk of an enterprise that is difficult to understand if attention is directed
solely at the financial statements. Through the incorporation of non-
financial data, the problems associated with the manipulation of financial
statements are reduced. By following a systematic approach and by
taking into account both financial and non-financial information related to
the organisation, an enhanced understanding of SME risks can be
achieved (St-Pierre & Bahri, 2006:550-557).
105 Refer to footnote 6. 106 Eccles, R.G. 1999. Le manifeste de l’évaluation des performances, in Les systèmes de mesure de la performance. Harvard Business Review, Editions de l’Organisation

187
Wynant and Hatch (1991107) cited by St-Pierre and Bahri (2006:550), in a
banking industry study expressed the opinion that SMEs’ total risk,
measured as the total risk of the borrower’s credit by the banker, consists
of business risk and finance risks. This dispensation is graphically
depicted in Figure 4.2.
Figure 4.2: Components of SMEs’ total risk as per Wynant and Hatch (Source: Adapted
from St-Pierre & Bahri, 2006:550).
Twarabimenye (1995108) cited by St-Pierre and Bahri (2006:550), in
evaluating loan specific risk by bankers, differentiates between the criteria
of Wynant and Hatch (1991109), by stipulating managerial risk, macro-
economic risk, and financial risk as the components of SMEs’ total risk.
This dispensation is graphically depicted in Figure 4.3.
107 Wynant, L. & Hatch, J. 1991. Banks and Small Business Borrowers. The Western Business School. London: The University of Western Ontario. 108 Twarabimenye, P. 1995. Modèle d’aide à l’évaluation du risqué de prêt aux enterprises. Thèse de doctorat en administration, Université du Québec à Montréal. 109 Refer to footnote 107.
SMES
’ TO
TAL
RIS
K Business risk
Financial risk
Environmental threat to SME
Insufficient skills and
resources
Debt structure vs revenue
Industry and market conditions
SMEs’ size SMEs’ history Competence of
management team
INFL
UE
NC
E

188
Figure 4.3: Components of SMEs’ total risk as per Twarabimenye (Source: Adapted
from St-Pierre & Bahri, 2006:550).
Carlton (1999:Online) and St-Pierre and Bahri (2006:550-551), in
determining total SME risk, consolidate the different risk components into
the following categories:
Strategic risks,
financial risks,
operational risks,
business risks, and
technical risks.
The technical dispensation is graphically depicted in Figure 4.4
SM
ES’ T
OTA
L R
ISK
Managerial risk
Macro-economic risk
Financial risk
Management’s qualification Succession planning Level of managerial
commitment
GDP levels Expected industry return
Asset productivity Profitability Debt ratio Level of working capital Monetary value of
guarantees

189
.
Figure 4.4: Components of SMEs’ total risk as per Carlton (Source: Adapted from St-
Pierre & Bahri, 2006:551).
Cotner and Fletcher (2000:27-33), identified five factors, with each factor
consisting of a number of elements of risk, namely (St-Pierre & Bahri,
2006:551):
The revenue risk factor consisting of the level and growth rate of
sales.
The operational risk factor linked to the level of fixed exploitation
costs.
The financial risk factor linked to interest cover, debt composition and
capacity for indebtness.
The management and control risk factor linked to investors’
confidence pertaining to the management team, organisational
experience and type of entity (family enterprise, minority
shareholders, etc.).
The strategic risk factor impacted by the entity’s position with its
suppliers, its clients, its current competitors, the risk of new products
and substitutes.
The above dispensation is graphically depicted in Figure 4.5.
SMEs
’ TO
TAL
RIS
K
Strategic risk e.g. ineffective marketing strategy
Financial risk e.g. cash flow problems, liquidity problems
Operational risk e.g. sabotage, design errors
Business risk e.g. supplier problems
Technical risk e.g. equipment problems

190
Figure 4.5: Cotner and Fletcher’s total risk composition (Source: Adapted from St-Pierre
& Bahri, 2006:551).
The various risk models as discussed in Wynant and Hatch (1991110),
Twarabimenye (1995111), and Carlton (1999:Online), reflect the
multidimensional character of SMEs and the various components of total
risk in these organisations. St-Pierre and Bahri (2006:551), propose a
synthesis of the total risk elements by categorising SMEs’ total risk as
consisting of the following primary components:
Financial risk, i.e. risk activities related mainly to the enterprise’s
capital structure, its financial partners and financial contracts, and
organisational capacity for reinvestment.
Entrepreneurial risk, i.e. risk activities related mainly to the
personality of the entrepreneur, the entrepreneur’s risk aversion 110 Refer to footnote 107. 111 Refer to footnote 108.
TOTA
L R
ISK
Revenue risk factor
Financial risk factor
Management and control risk factor
Strategic risk factor
Sales level Sales growth
Fixed exploitation cost
Interest cover Capacity for indebtness Debt composition
Management team
Entity control
Organisational experience
Suppliers Competitors
New inputs Substitutes
Operational risk factor
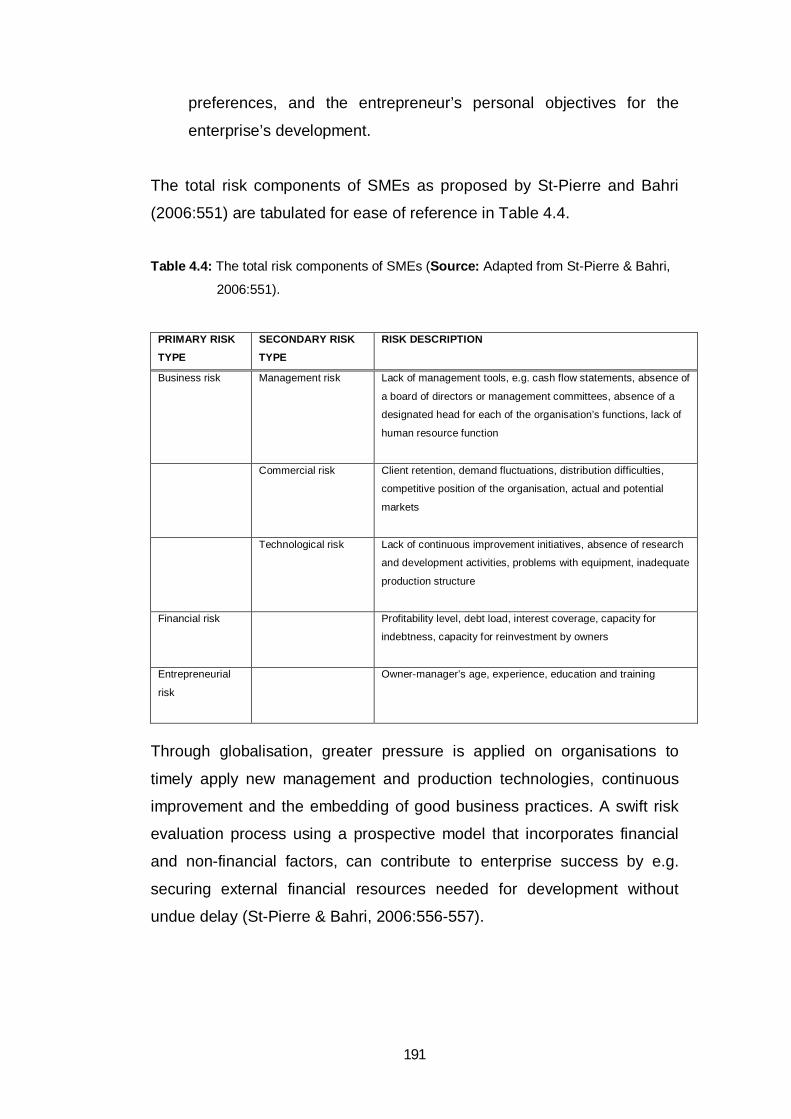
191
preferences, and the entrepreneur’s personal objectives for the
enterprise’s development.
The total risk components of SMEs as proposed by St-Pierre and Bahri
(2006:551) are tabulated for ease of reference in Table 4.4.
Table 4.4: The total risk components of SMEs (Source: Adapted from St-Pierre & Bahri,
2006:551).
PRIMARY RISK TYPE
SECONDARY RISK TYPE
RISK DESCRIPTION
Business risk Management risk Lack of management tools, e.g. cash flow statements, absence of
a board of directors or management committees, absence of a
designated head for each of the organisation’s functions, lack of
human resource function
Commercial risk Client retention, demand fluctuations, distribution difficulties,
competitive position of the organisation, actual and potential
markets
Technological risk Lack of continuous improvement initiatives, absence of research
and development activities, problems with equipment, inadequate
production structure
Financial risk Profitability level, debt load, interest coverage, capacity for
indebtness, capacity for reinvestment by owners
Entrepreneurial
risk
Owner-manager’s age, experience, education and training
Through globalisation, greater pressure is applied on organisations to
timely apply new management and production technologies, continuous
improvement and the embedding of good business practices. A swift risk
evaluation process using a prospective model that incorporates financial
and non-financial factors, can contribute to enterprise success by e.g.
securing external financial resources needed for development without
undue delay (St-Pierre & Bahri, 2006:556-557).

192
4.10 THE MANAGEMENT OF SME RISK
In a study conducted by Ntlhane (1995:98-101), it was confirmed that
owner-managers of SMEs are largely ignorant regarding the type of
business to operate, the type of product to produce, the location of their
operations, etc. These factors, i.e. sources of risk, along with others, hold
a myriad of risks to the enterprise, and provide an indication of owner-
managers’ ignorance regarding risks that face their enterprises. Few SME
owner-managers are risk-aware and they focus risk actions on ‘loss
control’ programmes pertaining to fire, safety, security, health and quality
assurance. These ‘loss control’ programmes are controlled by either the
entrepreneur or other management along with their other duties, therefore
increasing the chance of mismanagement, as adequate time is not spent
on the risk function. As no structured risk identification is undertaken by
SMEs, SMEs assume unaware or unplanned risk exposure to their limited
financial resources (Ntlhane, 1995:98-101).
Risk has a monetary impact, whether destruction of an asset through theft
or termination of supply contracts due to defective products, or others, and
these losses impede on the financial results of an enterprise. To limit the
effect of risks on the enterprise, risks need to be managed/controlled once
they have been identified. In SMEs, the control of risk exposure is
construed reactively, holding disastrous consequences for the enterprise
as losses are taken on while the enterprise is ill-prepared for financing the
loss. In most SMEs, risks are left unmanaged till they realise, only then
initiating action to address them (Ntlhane, 1995:102).
By using interviews Ntlhane (1995:104), established that SME owners and
managers are not versed in the availability and use of risk reduction
techniques (i.e. risk elimination/avoidance, reduction, transfer or
acceptance) to reduce the adverse effects of risks on the enterprise. The
study identified that entrepreneurial actions are centred on avoiding risk,
rather than devising risk control methods. This impedes on the economic
progress of a country as every business may be defined by its ability to

193
take on greater risks. Apart from risk avoidance, the study identified risk
transfer as the alternative risk technique used by SMEs, whereby
insurance brokers are used to take up all risk actions, i.e. risk
identification, risk assessment, risk control and risk financing. Risk
retention techniques in terms of which risks are financed by internal
reserves such as current income, are little known and rarely applied in
SMEs (Ntlhane, 1995:104).
4.11 RATIONALE FOR DEVELOPING A STRATEGIC RISK
MANAGEMENT STRATEGY
Strategic risk management enables SME owner-managers to objectively
evaluate their actions. One of the difficulties encountered in risk
management is that most risk assessments are linked to a specific
discipline, which is not necessarily known by owner-managers.
Furthermore, owner-managers may be able to identify the obvious risk, but
their depth of risk knowledge may impede on their ability to identify indirect
risks or take cognisance of the interconnectedness of risks (Watt, 2007:35-
36).
Hisrich and Peters (2002:239112) cited by Watson (2004:84-85),
emphasise that owner-managers should develop a risk strategy to avoid,
reduce or respond to potential risks. It is therefore essential that owner-
managers are equipped with the necessary skills to compare risks and
identify appropriate risk strategies in adequately addressing these risks.
Depending on the specific circumstances, owner-managers should engage
in actions limiting the probability of risk occurrence, or if need be, plan
strategies that maximise the probability of recovery (Watt, 2007:35-36).
By embedding a risk management strategy in processes of an SME,
according to Watt (2007:35-36), significant advantages can be achieved,
namely:
112 Refer to footnote 68.

194
Ensuring that the SME’s activities are aligned to its mission and
objectives, and not diverted by external influences.
Ensuring that organisational activities comply with industry best
practices, and that regulative compliance is achieved.
Providing legal protection if difficulties occur.
Resulting in cost savings by reducing insurance expenses.
Strategic risk management facilitates an effective risk approach by
prioritising risks, thereby reducing surprises, and directing the focus on
important risks. This has the effect of reducing the possible
overmanagement of insignificant risks. In the risk management process,
management should be aware that risk actions must be tailored to the
specific needs of the enterprise, taking into account its prevailing
resources, needs and opportunities. Although risk assessment should be
a comprehensive function, caution should be exercised against
formulating an excessive risk strategy (Watt, 2007:40). Given the size and
managerial structure of SMEs, the process of establishing and using a
strategic risk management function is relatively simple, given the close
relationship between owners, managers and operators of the enterprise.
Compared to larger enterprises, it is easier for SME executive
management to embed a risk management policy and be routinely and
actively involved in the application of the strategic risk management policy,
especially if these activities are seen as performance-enhancing
processes (Watt, 2007:34-35).
According to Beckett (2005:330), SME owner-managers need to be aware
that through joint discussion of risk with SME employees, which include an
effective feedback process and a risk valuation process, organisational
trust is established. The way of conducting risk management, i.e. the
shape of the risk management process, will depend on all the participants’
risk propensity as well as the situational control that is exercised at the
time. As a result, risk-tolerant participants may prefer an informal risk
review process, while risk-adverse participants will favour comprehensive
contractual arrangements. Through experience (Beckett, 2005:330-332),
it has been gleaned that:

195
The creation of a positive organisational risk culture whereby all
participants concerns are understood and experiences are shared, is
facilitated through a constantly evolving process of risk identification
and the planning of containment strategies.
Through joint proactive identification of risks, and by employing
holistic risk management practices, management can establish a
positive environment to deal with all issues.
Regardless of the risk propensity of the participants, a structured approach
to risk management will assist in providing a goal-orientated and
consistent risk management process.

196
CHAPTER 5
SURVEY DESIGN AND METHODOLOGY
SYNOPSIS
In this thesis applied research is taking place in the social world, which
encompasses both an empirical and a theoretic research approach. Data
validity is ensured through applying methodological triangulation
incorporating both a positivistic and phenomenological research paradigm.
This aids in facilitating a holistic, complete and contextual portrayal of the
research, i.e. risk management in SMEs in the Western Cape. In ensuring
that no adverse consequences follow from the research conducted, ethical
considerations upheld include informing research participants of the
proposed benefit of the study, maintaining the confidentiality and
anonymity of respondents, obtaining informed consent and providing
respondents the option to receive follow-up information pertaining to the
research results.
The primary research method employed is an experimental case study,
whereby risk literature is reviewed and interviews are conducted in an
integrative interpretation of SME risk practices. The measuring criteria of
validity, reliability and generalisability are used in providing quality checks.
A purpositive sampling method is employed whereby data is drawn from a
sample of SME owner-managers in the Western Cape. Questionnaires are
used as the data collection method taking cognisance of the pertinent
issues of question content, question wording, response structure and
question sequence. With respect to the primary purpose of the survey i.e.
obtaining respondents’ views of risk management processes and
practices, nominal and ordinal measurement scales were selected as
instrument of choice. Data analysis was executed by way of descriptive
and inferential statistics.

197
The content of Chapter 5, along with the relative positioning of the topics,
is graphically depicted in Figure 5.
Figure 5: Detailed layout of Chapter 5 – Survey design and methodology.
INTRODUCTION
ETHICAL CONSIDERATIONS
RATIONALE FOR USING A POSITIVISTIC (PHENOMENOLOGICAL) RESEARCH PARADIGM
DATA COLLECTION METHOD AND SOURCES
IDENTIFICATION OF TARGET POPULATION THROUGH SAMPLING
SURVEY DESIGN
THE TARGET POPULATION
MEASUREMENT SCALES
SURVEY QUESTIONNAIRES

198
CHAPTER 5 SURVEY DESIGN AND METHODOLOGY 5.1 INTRODUCTION
The relative positioning of Chapter 5 within the ambit of the thesis is
depicted in Figure 5.1.
Figure 5.1: Chapter 5 - Survey design and methodology positioning.
An experimental case study will be conducted within the SME retail sector
in the Western Cape, South Africa, to glean data pertaining to risk
management practices engaged in by SME owner-managers. The
selected data collection method are questionnaires (Cooper & Schindler,
2006:245), which is executed within the ambit of a survey. Holistically, the
objectives of this chapter and survey are to determine:
The depth of current risk management practices embedded in SMEs.
The effect of current risk management practices on SME success.
CHAPTER ONE
Scope of the research
CHAPTER TWO
Risk management – A literature review
CHAPTER THREE
Enterprise risk management – A literature review
CHAPTER FOUR
A perspective of SME risk management in South Africa
– A literature review
CHAPTER FIVE
Survey design and methodology
CHAPTER SIX
Analysis and interpretation of survey data
CHAPTER SEVEN
Formulation of a structured risk management model for South
African SMEs

199
The perceived and tangible obstacles to a structured risk
management process as experienced by SME owner-managers.
SME owner-manager motivating factors for implementing a
structured risk management process.
Chapter 1 defines the research problem as: ‘No structured approach to
risk management exists for South African SMEs in the retail trade,
adversely impacting on the risk efficiency of the industry’. The data
gleaned from analysing and interpreting the survey data aims to solve the
above defined research problem.
5.2 ETHICAL CONSIDERATIONS
The objective of research ethics is to ensure that no adverse
consequences or harm follow from the research activities (Cooper &
Emory, 1995:97). According to Saunders, Lewis and Thornhill (2000:131),
research ethics comprise four subsections namely:
Ethical considerations pertaining to the research process in general.
Ethical considerations pertaining to the design phase and the initial
access phase.
Ethical considerations in the data collection phase.
Ethical considerations pertaining to the data analysis and reporting
phases.
Generic ethical considerations: Cognisance should be taken of the
following generic ethical issues (Saunders et al., 2000:132; and Collis &
Hussey, 2003:38-39):
The privacy of actual and potential participants.
Participation is on voluntary basis and participants may at any stage
exercise their right to withdraw partially or completely from the
research activity.
Consent and potential deception of participants. Potential participants
should be informed of the purpose of the research and agreement
should be obtained on participants’ research involvement.
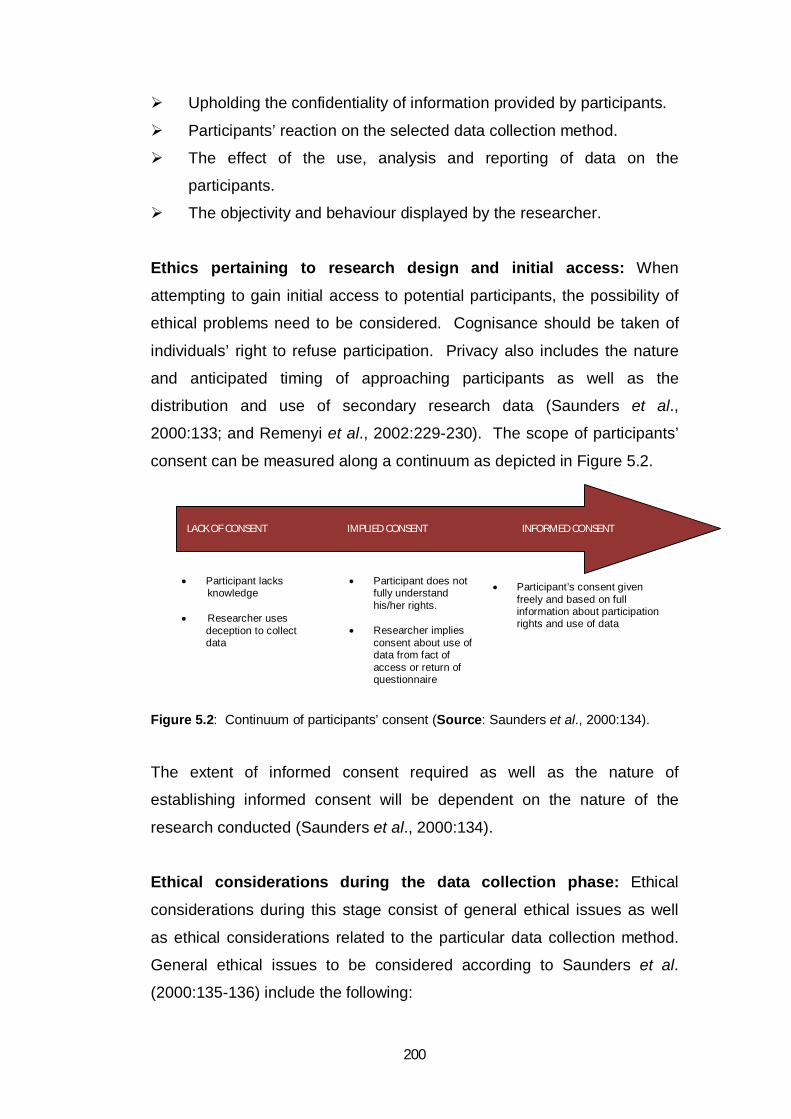
200
Upholding the confidentiality of information provided by participants.
Participants’ reaction on the selected data collection method.
The effect of the use, analysis and reporting of data on the
participants.
The objectivity and behaviour displayed by the researcher.
Ethics pertaining to research design and initial access: When
attempting to gain initial access to potential participants, the possibility of
ethical problems need to be considered. Cognisance should be taken of
individuals’ right to refuse participation. Privacy also includes the nature
and anticipated timing of approaching participants as well as the
distribution and use of secondary research data (Saunders et al.,
2000:133; and Remenyi et al., 2002:229-230). The scope of participants’
consent can be measured along a continuum as depicted in Figure 5.2.
Participant lacks
knowledge
Researcher uses deception to collect data
Participant does not
fully understand his/her rights.
Researcher implies
consent about use of data from fact of access or return of questionnaire
Participant’s consent given freely and based on full information about participation rights and use of data
Figure 5.2: Continuum of participants’ consent (Source: Saunders et al., 2000:134).
The extent of informed consent required as well as the nature of
establishing informed consent will be dependent on the nature of the
research conducted (Saunders et al., 2000:134).
Ethical considerations during the data collection phase: Ethical
considerations during this stage consist of general ethical issues as well
as ethical considerations related to the particular data collection method.
General ethical issues to be considered according to Saunders et al.
(2000:135-136) include the following:
LACK OF CONSENT IMPLIED CONSENT INFORMED CONSENT

201
Participants’ right to partake in the research, including their right to
withdraw from the process at any stage. The researcher should
furthermore not alter the communicated scope of the research
without informing the participant and re-negotiating access.
Within the context of objectivity, the researcher should employ an
accurate and comprehensive data collection method reducing
subjective data selectivity, which contribute to the validity and
reliability of the research.
The level of confidentiality and anonymity offered to the research
participant should be maintained with respect to the type of research
to be conducted, i.e. qualitative or quantitative.
Ethical considerations pertaining to interviews as the data collection
method purposes that care should be taken during face-to-face interviews
not to force a participant’s response (Saunders et al., 2000:138). The
participants should be informed of their right to decline answering any
question or part thereof and guard should be taken against asking
demeaning questions. Furthermore, meetings with the participants should
be scheduled according to the participants’ preference, thus at their
preferred time.
Dale et al. (1988:57113) cited by Saunders et al. (2000:139), proclaim that
problems related to survey research are less difficult if compared to
difficulties experienced with qualitative research, as the nature of a
structured survey does not lend itself to the exploration of responses.
According to Zikmund (1997114) cited by Saunders et al. (2000:139),
ethical considerations pertaining to survey research encompass the more
general issues of privacy, deception, openness, confidentiality and
objectivity.
113 Dale, A., Arber, S. & Procter, M. 1988. Doing Secondary Research. London: Allen & Unwin. 114 Zikmund, W.G. 1997. Business Research Methods 5th Edition. Fort Worth: Dryden Press.

202
Ethics pertaining to the data analysis and reporting phase: It is of vital
importance to uphold the validity of data collected. This implies the
inclusion of all data selected and/or its accurate statistical representation.
Care should be taken to provide a honest, balanced report of findings, as
opposed to reporting only such data which support the opinion of the
researcher. During the reporting stage, the confidentiality and anonymity of
participants should be upheld as agreed before the commencement of the
research. Ethical considerations further encompass third-parties’ use of
the researcher’s conclusions as well as any implicit or explicit course of
action suggested (Saunders et al., 2000:139-140; Remenyi et al.,
2002:231; and Collis & Hussey, 2003:39).
By incorporating the guidelines provided by the abovementioned authors
as well as Cooper and Emory (1995:98) and Cooper and Schindler
(2006:118-119), in the research activity the following ethical considerations
are being upheld:
Inform participants of the benefit of the research: Owner-
managers of retail SMEs were informed of the purpose and expected
benefits of the research study.
Maintaining confidentiality and anonymity of participants: SME
owner-managers were informed that no survey data will be made
available that may identify the specific business entity, and
completed questionnaires will not be made public to any person or
institution.
Informed consent: SME owner-managers were informed of the
nature of the questionnaire. They were made aware that their
participation in the research is of a voluntary nature and that they are
under no obligation to answer any questions they are uncomfortable
with.
Debriefing: SME owner-managers were offered the option to receive
follow-up information about the research results. If this choice was
selected by the participants, contact details were provided by the
research participant.

203
5.3 RATIONALE FOR USING A POSITIVISTIC
(PHENOMENOLOGICAL) RESEARCH PARADIGM
The methodology applied in this research encompasses both a theoretical
and empirical research approach. Theoretical approach is concerned with
the study of writings of others without direct interaction in observation or
data collection, as opposed to empirical research that is based on
observation done through experiments or passive observation. It should
be noted that the use of one approach is not exclusive to the use of the
other, as empirical research implies an understanding of theoretical
subject matter (Remenyi et al., 2002:31).
Methodological triangulation will be applied in this research (Collis &
Hussey, 2003:78). Triangulation contributes towards the validity of data
and facilitates a more holistic, complete and contextual depiction of the
research matter (Ghauri, Grønhaug & Kristianslund, 1995:94; and Cooper
& Schindler, 2006:219). Both a positivistic (quantitative) and
phenomenological (qualitative) research paradigm will apply supporting
the view of Berstein (1996:202115), cited by Remenyi et al. (2002:96), that
where quantitative research is insufficient, qualitative research should be
deployed: “Where information is lacking, we have to fall back on inductive
reasoning and try to guess the odds”.
An experimental case study is used as the primary research method
whereby existing risk literature is reviewed and interviews are conducted
with SME owner-managers to gain insight and study the multidimensional
nature of SME risk management practices, thereby deriving at an
integrative interpretation of the real-life scenarios studied (Ghauri et al.,
1995:88-89; and Collis & Hussey, 2003:68). The positivistic measuring
criteria of validity, reliability and practicality will be used for both positivistic
and non-positivistic research as these measurement indicators provide
valid quality checks (Remenyi et al., 2002:114):
115 Berstein, P. 1996. Against the Gods. New York: John Wiley.

204
Validity: Validity concerns both internal and external validity (Cooper
& Emory, 1995:149-153,360): o External validity: Pertaining to research findings, external
validity refers to the ability to generalise across persons,
settings and time. Interactive threats to external validity consists
of : The Reactivity of Testing on X: The subjects’ behaviour is
altered by the use of a pre-test, whereby they are
familiarised with the stimulus thus influencing their
behaviour. This threat was eliminated in this study by not
conducting any pre-tests on the subjects. Interaction of Selection and X: The sample selection
method may not be homogenous to the population, which
results in the inability to generalise the results to the
population. The sample frame in this research study was
selected using purposive sampling. o Internal validity: Validity pertaining to the research instrument
refers to the extent to which differences found with the
measuring tool are an accurate reflection of the differences.
Internal validity can be classified according to: Content validity: A measuring instrument should adequately
cover the research topic in order to be regarded as having
‘content validity’. Criterion-related validity: This term encompasses
predictive and concurrent validity, that respectively entails
the success of measures used for predicting future and
current outcomes or estimates. Construct validity: Construct validity pertains to the
measurement of abstract traits, where empirical validation
seems improbable. Reliability: The term reliability refers to consistency. In terms of a
measurement instrument, the degree of reliability will be determined
by the consistency of the results with specific reference to the

205
stability, equivalence and internal consistency of the instrument
(Cooper & Emory, 1995:153). In assessing the reliability of a
measurement instrument, the following questions may be posed
(Easterby-Smith et al., 1991:41116 cited by Saunders et al.,
2000:100):
o Will the measurement indicator produce the same result on
different occasions? o Will similar observations be reached if the researcher and the
occasion differ?
Practicality: The measurement process selected should, in addition
to complying with the requirements of validity and reliability, comply
with the operational requirement of practicality, where practicality
encompasses economy, convenience and interpretability.
However, in line with the nature of non-positivistic research, focus will not
solely be directed at validity, reliability and practicality, but also at
achieving consistency and integrity of the research design (Remenyi et al.,
2002:114).
5.4 DATA COLLECTION METHOD AND SOURCES
Within the ambit of this research study, data will be collected via
secondary and primary sources (Ghauri et al., 1995:54-57). Secondary
data sources referred to in this research consist of:
Research studies and reports issued by institutions and researchers.
Academic theses and reports.
Published textbooks and journals, and the Internet.
By using secondary data sources in the research, cost-efficiency is
enhanced. It furthermore provides a platform for the formulation and
understanding of the research question, and aids in the broadening of the
base to derive at scientific conclusions. Furthermore, the use of secondary
116 Easterby-Smith, M., Thorpe, R. & Lowe, A. 1991. Management Research: An Introduction. London: Sage.

206
data aids in the improvement of reliability of information and conclusions.
However, using secondary data in isolation is not desirable, as this has
been collected to meet the objectives of another study (Ghauri et al.,
1995:55-56).
Primary data will be collected via questionnaires as part and parcel of a
descriptive survey (Ghauri et al., 1995:57-58). Descriptive surveys are
suitable to identify and describe the variability in different phenomena
(Saunders et al., 2000:279). The rationale for using a survey as a data
collection method relates to its versatility in that it accommodates all the
gathering of types of information through questioning participants (Cooper
& Schindler, 2006:245).
Questionnaires are suitable for both positivistic and phenomenological
methodologies. Under a positivistic approach, closed questions are used,
while a phenomenological approach suggests the use of open-ended
questions (Collis & Hussey, 2003:173-174). Questionnaires can be
categorised according to distribution method, each with its own strengths
and weaknesses (Saunders et al., 2000:280; Remenyi et al., 2002:156;
and Collis & Hussey, 2003:175-176):
Mailed questionnaires: This self-administered questionnaire allows
the respondents to complete the questionnaire in their own time,
without possible interviewer influence. A major drawback of the use
of mailed questionnaires is the low response rate.
Computer-administered questionnaires: These self-administered
questionnaires are distributed electronically by e-mail or the Internet,
affording the respondent the opportunity to complete it in his/her own
time, without any interview bias. A disadvantage of this collection
method is the restriction of the sample to users on the network, and
complexities pertaining to programming and design.
Telephone interview questionnaires: This interview-administered
questionnaire is a relative low-cost technique with reduced interview
bias. However, due to the inaccessibility of unlisted numbers,
response bias errors may occur.

207
Personal interview questionnaires: These interview-administered
questionnaires require face-to-face conversation where open- and/or
closed-ended questions may be asked, with approaches ranging
from informal to highly structured. Disadvantages pertaining to
personal interview questionnaires relate mainly to cost. Advantages
to this collection method include the opportunity to probe complex
issues, a relaxed interview environment, possibility to record
additional information and high response rate.
In selecting the type of research questionnaire to be used, cognisance
should be taken of resource availability namely (Saunders et al.,
2000:279-282):
The time available for collecting data.
Financial implications pertaining to data collection and capturing.
Availability of assistants, i.e. interviewers and field workers.
Ease with which data entry can be automated.
By taking the abovementioned considerations into account as well as the
advantages and disadvantages of each type of questionnaire, personal
interview questionnaires were selected as the data collection method for
this research.
5.5 IDENTIFICATION OF TARGET POPULATION THROUGH SAMPLING
Sampling, as opposed to a census strategy, was selected as the method
whereby elements were selected for analysis. Sampling is defined by
Cooper and Schindler (2006:72), as: “… a sample is a part of the target
population, carefully selected to represent that population”. The rationale
for selecting sampling as opposed to a census strategy according to
Saunders et al. (2000:150-151) and Cooper and Schindler (2006:403),
are:
The lower cost of sampling in contrast to the high cost of a census.

208
Sampling provides greater accuracy of results as argued by Deming
(1960117), cited by Cooper and Schindler (2006:403): “Sampling
possesses the possibility of better interviewing (testing), more
thorough investigation of missing, wrong, or suspicious information,
better supervision, and better processing than is possible with
complete coverage”.
Improved speed of data collection in contrast to the time-consuming
nature of a census.
The availability of population elements.
By reviewing the different sampling methods, purposive sampling
(Saunders et al., 2000:152), was selected as the method of choice for this
research study. Table 5.1 depicts the impact various factors have on a
purposive sampling technique.
Table 5.1: Impact of various factors on purposive sampling (Source: Adapted Saunders
et al., 2000:171).
SAMPLE TYPE LIKELIHOOD OF
SAMPLE BEING REPRESENTATIVE
TYPES OF
RESEARCH IN WHICH USEFUL
RELATIVE COST CONTROL OVER
SAMPLE CONTENTS
Purposive
Low although dependent on researcher’s choices: Extreme cases Heterogeneous Homogeneous Critical case Typical case
Where working with very small samples Focus: unusual or special Focus: key themes Focus: in-depth Focus: importance of case Focus: illustrative
Reasonable
Reasonable
In selecting purposive or judgemental sampling, the researcher’s focus is
directed to the most appropriate cases in answering the research
questions and research objectives. Although purposive sampling is not
statistically representative of the total population, it is selected based
according to Saunders et al. (2000:174), on the following strategies:
Extreme case sampling focuses on unusual or special cases. The
rationale in selecting extreme cases is based on the assumption that 117 Deming, W.E. 1960. Sample Design in Business Research. New York: Wiley.

209
extreme case information is relevant in understanding more typical
cases.
Heterogeneous or maximum variation sampling provides data to
describe and explain key themes that are observed.
Homogeneous sampling’s focus is directed at specific subgroups
consisting of similar sample members.
Critical case sampling directs the research focus to critical cases due
to their importance.
Typical case sampling provides an illustrative profile by using a
representative case.
In this research study, a homogeneous sampling strategy was followed
focusing on SME owner-managers in the Western Cape retail sector, as
the strategy provided ample opportunity to study the cases in-depth.
5.6 SURVEY DESIGN
Survey design can be classified in terms of analytical surveys and
descriptive surveys. Analytical surveys are concerned with the
identification of the independent, dependent and extraneous variables,
whereas descriptive surveys focus on identifying the phenomena that the
researchers wish to describe the variance of (Ghauri et al., 1995:59-60).
A descriptive survey will be conducted, as this research is concerned with
identifying the phenomena of ‘risk management’ of which the variance
needs to be described, pertaining to a specific population, i.e. SME owner-
managers, at a specific point in time. The descriptive survey’s focus is
more directed at obtaining a representative sample of the determined
population, than on the analytical design, as the area of importance
centres around the accuracy of the findings as well as the generalisation
thereof (Ghauri et al., 1995:59-60).
Although the survey design process, encompassing questionnaire creation
and application vary according to the complexity of the subject, Riley,

210
Wood, Clark, Wilkie and Szivas (2000:97), suggest a nine-stage process
to follow:
Stage one: Identification of topic and setting of objectives.
Stage two: Pilot a questionnaire to determine individuals/groups:
o Current level of knowledge.
o Aspects viewed as important.
Stage three: List the areas of information needed and refine the
objectives.
Stage four: Review participants’ response to the pilot questionnaire.
Stage five: Finalise the questionnaire objectives.
Stage six: Write the questionnaire.
Stage seven: Re-pilot the questionnaire.
Stage eight: Finalise the questionnaire based on stage seven’s
response.
Stage nine: Codification of questionnaire.
In developing the survey instrument, attention should be directed at
question content, question wording, response structure and question
sequence (Cooper & Emory, 1995:303-317; and Cooper & Schindler,
2006:365-374):
Question content:
o Questions posed should provide meaningful information in
order to be justified on economic or research grounds.
o Double-barred questions should be avoided.
o Questions need to be constructed to extract all the information
needed on a specific issue.
o Filter questions may be incorporated in the questionnaire to
quantify the respondent’s knowledge.
o Biased questions, either through omitting detail or including
detail, influence the adequacy of the respondent’s answers.
o Respondents may be unwilling to answer certain questions
based on the sensitivity of the question, the socio-economic
status of the individual or other reasons.

211
o More information can be secured if a good rapport is
established with the respondent. By providing assurance of
confidentiality through interviewer action and question wording,
respondents’ motivation in answering truthfully is increased.
o Question sequences can lead respondents from ‘safe’
questions to more sensitive questions.
Question wording:
o Shared vocabulary that is common to both interviewee and
respondent should be used, by using simple wording and non-
technical language. o Questions should be clearly structured to avoid
misunderstanding.
o The use of unwarranted assumptions should be avoided. o Questions should be structured using unbiased wording,
thereby not leading the respondent towards an intended or
unintended preferred answer.
o Questions should be posed with the right degree of
personalisation. o Adequate alternatives should be presented. It is preferred to
express each alternative explicitly to avoid bias. Response structure:
The use of open questions also referred to as unstructured
questions, or closed questions also referred to as structured
questions (Cooper & Emory, 1995:311-313; and Cooper & Schindler,
2006:364), depends on five situational factors, namely:
o The objectives of the interview.
o The level of the respondent’s knowledge about the topic.
o The degree in which the respondent has thought the questions
through.
o The ease with which the respondent can communicate as well
as the respondent’s motivation for participation.

212
o The degree to which all the abovementioned factors are known
to the interviewer.
Open response questions are advantageous in discovering opinions
and degrees of knowledge when the topic of the questions falls
outside the respondent’s experience, or when the interviewer is
unsure of the respondent’s reference frame or depth of knowledge. In
comparison, closed questions are perceived as less threatening by
respondents and require less motivation to answer. Furthermore,
closed questions reduce the variability of responses, are less
demanding on interviewer skills, are less costly to administer and are
easier to code (Cooper & Emory, 1995:311-313).
In this thesis, multiple-choice questions were used predominantly
where the participants were asked close questions and selected an
answer from a list of predetermined responses. In guarding against
an exhausting list of possible options, respondents could select
where applicable the category ‘other’ and provide answers according
to their preference (Cooper & Emory, 1995:311-313; Collis & Hussey,
2003:181; and Cooper & Schindler, 2006:370).
Question sequence:
The concept of question sequence is important as it acts to awaken
participants’ interest in the study and to motivate them to participate.
The questioning process should be designed to first introduce simple
concepts and gradually move towards complex concepts and from
general items to specific items. Any change in the frame of reference
should be small and the participant should be aware of it (Cooper &
Emory, 1995:315-317).
5.7 THE TARGET POPULATION
A research hypothesis proposes the relationship between variables in a
population. The population is the research object and may consist of

213
individuals, groups, organisations, products, events or conditions to which
previously mentioned objects are exposed (Welman, Kruger & Mitchell,
2005:52-53). Welman et al. (2005:52) defines a population as, “… the
population encompasses the total collection of all units of analysis about
which the researcher wishes to make specific conclusions”, where units of
analysis refer to members or elements of the population, thus the subject
on which the measurement is being taken (Cooper & Emory, 1995:201).
In this research study, the unit of analysis were owner-managers of SMEs,
drawn from the target population of retail SME owner-managers in the
Western Cape, South Africa.
5.8 MEASUREMENT SCALES
The survey was specifically constructed to elicit the respondents’ views on
risk management processes and the practice thereof. In selecting and
constructing the measurement scale, the following survey specific factors
were taken into consideration (Cooper & Schindler, 2006:332-333):
The research objectives encompassing the following:
o Determine if the issues highlighted in the literature review map
to risk practices employed by SMEs.
o Determine the level of risk knowledge of South African SME
owner-managers.
o Determine the current use of risk management models by SME
owner-mangers and the adequacy of the current risk
methodologies applied.
o Provide acceptance of the null hypothesis.
o Assist in the formulation of a structured risk management
model, specifically aimed at reducing the risks associated with
South African SMEs.
o Assist in evaluating the implementation viability of the proposed
formulated risk management model for South African SMEs,
and to determine the potential benefits which can be gleaned
from such an application.

214
The response types consisting of rating, ranking and categorisation
types.
The data properties created by each measuring scale.
The number of dimensions measured in this survey incorporating
both the use of one-dimensional and multidimensional scales.
The use of a balanced rating scale if applicable.
The survey encompasses the use of unforced-choice rating scales
and forced-choice rating scales, were the participant is awarded, in
certain instances, with the option of ‘other’.
The survey includes a five-point rating scale due to the complexity of
the area being assessed.
The measurement scales (Cooper & Schindler, 2006:312-314,337), used
in the survey consists of:
Nominal measurement scale: Respondents were asked to select
responses in categories that are mutually exclusive and collectively
exhaustive. Nominal scales were selected based on their value to
uncover relationships. Simple category scales (dichotomous);
multiple-choice, single-response scales; multiple-choice, multiple-
response scales were used.
Ordinal measurement scales: The same characteristics apply as in
nominal scales plus an indication of order. The use of a numerical
scale was included in the survey.
The questionnaire or measuring instrument is structured by placing
background questions first, then activity and usage questions and lastly
attitudinal questions (Remenyi et al., 2002:154-156).
In selecting the measuring tool the three main criteria of validity, reliability
and practicality were taken into consideration. Validity can be classified
according to internal and external validity, where external validity refers to
the ability of data to be generalised across different settings, and internal
validity refers to the ability of the research instrument to measure what it is
purposed to measure. Further differentiation can be made according to

215
content validity, criterion-related validity, and construct validity (Cooper &
Schindler, 2006:318-321). Reliability purports to the degree that a
measure supplies consistent results and can be categorised according to
the perspectives of stability, equivalence and internal consistency (Cooper
& Schindler, 2006:321). The operational requirements of a research
project calls for the project to be practical, with practical defined as
economy (comparison between ideal research project and project budget),
convenience (referring to the ease with which the project can be
administered), and interpretability (applicable when persons other than the
survey designer must interpret the results) (Cooper & Schindler, 2006:323-
324).
5.9 SURVEY QUESTIONNAIRES
Appendix A depicts the survey questionnaire that will be posed to SME
owner-managers in the retail sector in the Western Cape.

216
CHAPTER 6
ANALYSIS AND INTERPRETATION OF SURVEY DATA SYNOPSIS
Inferential and descriptive statistics were performed on a sample of 158
respondents conducted by way of a survey on Western Cape SMEs. The
survey data returned that more than 85% of respondents had clear defined
business objectives and strategies. Furthermore, the majority of
respondents indicated that they had a clear understanding of the risks
impeding on their organisation. Risk identification is centred on financial
risks followed by operational and sales/marketing risks.
Although the majority of respondents have clearly defined business
objectives and goals, only 17% of respondents indicated that they had a
partial or complete risk management framework. It is of interest to note
that respondents without clearly defined business strategies and
objectives, also lacked a structured risk management approach with
inadequate comprehension of the associated risks. Smaller organisations
tend not to engage in a structured risk management approach citing the
lack of intellectual capital, insufficient skills and costs as the primary
obstacles faced, thereby adversely impacting on the organisation’s risk
efficiency.
An encouraging statistic emerging from the survey data is that more than
60% of respondents without a risk management framework indicated an
interest in using such a framework. Profit maximisation, improved
customer services, cost reduction and the safeguarding of assets were
cited as the motivating factors for the implementation of a risk
management framework. By engaging in a structured risk management
approach and developing and embedding a structured risk management
framework in the organisation, organisations could significantly improve
their risk efficiency.
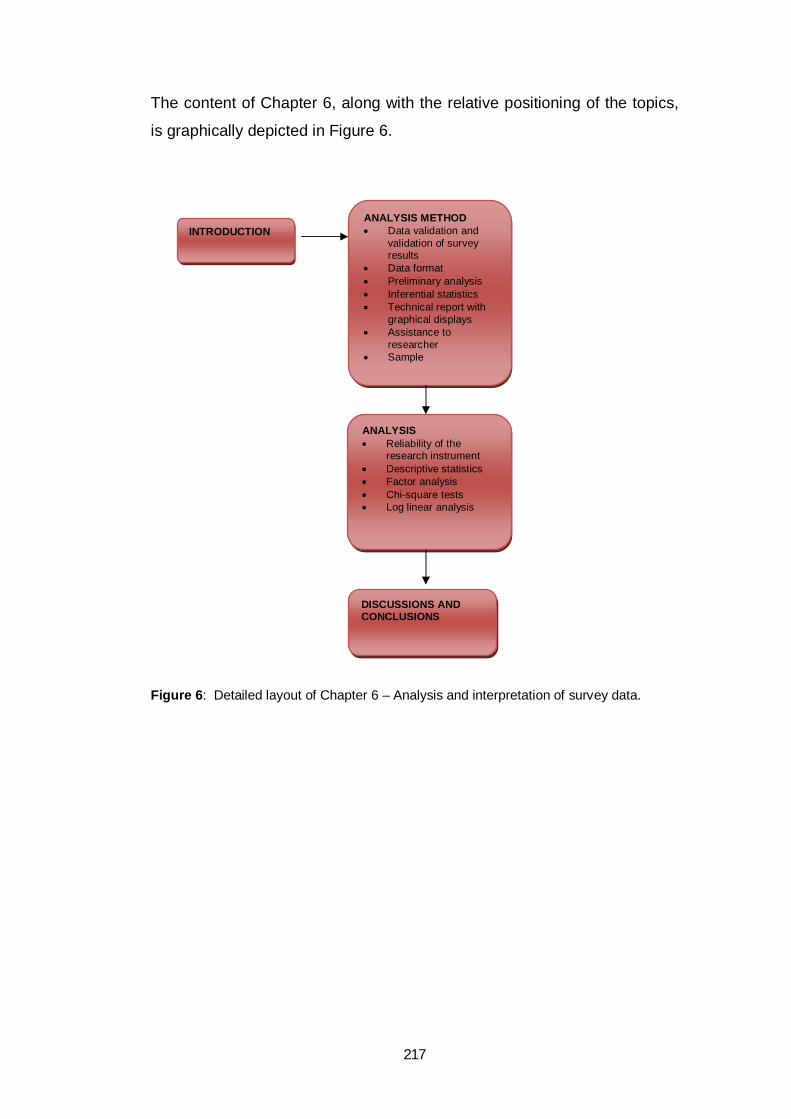
217
The content of Chapter 6, along with the relative positioning of the topics,
is graphically depicted in Figure 6.
Figure 6: Detailed layout of Chapter 6 – Analysis and interpretation of survey data.
INTRODUCTION ANALYSIS METHOD Data validation and
validation of survey results
Data format Preliminary analysis Inferential statistics Technical report with
graphical displays Assistance to
researcher Sample
ANALYSIS Reliability of the
research instrument Descriptive statistics Factor analysis Chi-square tests Log linear analysis
DISCUSSIONS AND CONCLUSIONS

218
CHAPTER 6
ANALYSIS AND INTERPRETATION OF SURVEY DATA
6.1 INTRODUCTION
The analytical process followed thus far is graphically depicted in Figure
6.1, which places the chapters in context with the overall thesis objectives,
and furthermore indicates the relative positioning of this chapter.
Figure 6.1: Chapter 6 - Analysis of results positioning.
This chapter discusses the results of the data analysis of the survey
conducted on SMEs (micro- to small enterprises) in the Western Cape.
Data analysis can be defined as “the process of bringing order, structure
and meaning to the mass of collected data” (De Vos 2002:339). The main
aim of this study is to determine whether a non-structured approach to risk
management for South Africa SMEs adversely impacts on the risk
CHAPTER ONE
Scope of the research
CHAPTER TWO
Risk management – A literature review
CHAPTER THREE
Enterprise risk management – A literature review
CHAPTER FOUR
A perspective of SME risk management in South Africa
– A literature review
CHAPTER FIVE
Survey design and methodology
CHAPTER SIX
Analysis and interpretation of survey data
CHAPTER SEVEN
Formulation of a structured risk management model for South
African SMEs

219
efficiency of the industry. The data obtained from the completed
questionnaires will be presented and analysed by means of various
analyses (univariate, bivariate and multivariate) as it comes applicable.
The data has been analysed by using SAS software. Descriptive statistics
such as frequency tables are displayed in Paragraph 6.3.2, showing the
distributions of the statement responses. Descriptive statistics are used to
summarise the data. As a measure of central tendency and dispersion,
Table 6.3 shows the means and standard deviation of the statements with
an ordinal/ratio scale of measurement.
6.2 ANALYSIS METHOD
6.2.1 Data validation and validation of survey results
In determining, through the use of a structured questionnaire, whether a
non-structured risk approach by South African SMEs adversely impacts on
the risk efficiency of the industry, the validity and reliability of the
questionnaire is important. Validity is concerned with whether the actual
measuring reflects the intended measure (Rose & Sullivan, 1996:19). For
the purpose of this study, only content and construct validity will be
elaborated upon. ‘Content validity’ is concerned with the
representativeness or sampling adequacy of the content (e.g. topic or
items) of a measuring instrument (De Vos & Fouche, 1998:84), while
‘construct validity’ refers to the extent that a measuring instrument can be
shown to measure a particular hypothetical construct.
Below is a descriptive analysis of the survey results returned by the
research questionnaire respondents. The responses to the questions
obtained through the questionnaires are indicated in table format for ease
of reference. Each variable is tested to fall within the set boundaries. The
database in which the data was captured was developed so that data
validation could be ensured. There are built-in boundaries and rules so
that any mistakes made by the data capturer can be detected. Other

220
measures taken to ensure data validity include capturing the information
twice, whereafter comparisons were made to identify possible errors for
correction. Data validation is the process of ensuring that a programme
operates on ‘clean’, correct and useful data.
The construct validation however, can only be taken to the point where the
questionnaire measures what it is supposed to measure. Construct
validation as a rule is addressed in the planning phases of the survey and
when the questionnaire is being developed. Reliability will be addressed
in the analysis phase of the data (information).
6.2.2 Data format
The data was provided in its original format, i.e. questionnaires which were
coded according to a predetermined coding scheme and captured twice
on Microsoft Access. It was then imported into SAS through the SAS
ACCESS module.
6.2.3 Preliminary analysis
The reliability of the statements in the questionnaire posted to the sample
respondents are tested by using the Cronbach Alpha tests (see Paragraph
6.3.1). Descriptive statistics were performed on all variables, displaying
means, standard deviations, frequencies, percentages, cumulative
frequencies and cumulative percentages. These descriptive statistics are
elaborated upon in Paragraphs 6.3.2 and 6.3.3 (see also computer
printouts in Appendix B and Appendix C).
6.2.4 Inferential statistics
The following inferential statistics were performed on the data:
Chi-square tests: Chi-square tests were used for determining the
association between biographical variables. Cross-tabulation and
Chi-square-based measures of association, a technique for
221
comparing two or more classification variables, were used. These
tables constructed for statistical testing, are referred to as
contingency tables and determine whether the classification variables
are dependent. Percentages are used for two purposes; firstly to
simplify by reducing all numbers to a range of 0 to 100 and secondly,
to translate the data into standard form, with a base of 100, for
relative comparisons. The Chi-square (two-sample) tests are
probably the most widely used non-parametric test of significance
that is useful for tests involving nominal data, but it can be used for
higher scales, e.g. scenarios where persons, events or objects are
grouped in two or more nominal categories such as ‘yes-no’ or cases
A, B, C or D. The technique is used to test for significant differences
between the observed distribution of data among categories, and the
expected distribution based on the null hypothesis and has to be
calculated with actual counts rather than percentages (Cooper &
Schindler, 2001:499).
Factor analysis: Factor analysis is a statistical approach that can be
used to analyse interrelationships among a large number of variables
and to explain these variables in terms of their common underlying
dimensions (factors).
Cronbach Alpha test: Cronbach Alpha coefficient is an index of
reliability associated with the variation accounted for by the true
score of the ‘underlying construct’ with ‘construct’ being the
hypothetical variables that are being measured (Cooper & Schindler,
2001:216-217). More specific, the Cronbach Alpha coefficient
measures how well a set of items (or variables) measures a single
unidimensional latent construct.
Log linear analysis: Log linear analysis is a multivariate inferential
statistical technique, which can be applied to contingency tables for
the interpretation of qualitative categorical data.

222
6.2.5 Technical report with graphical displays
A written report with explanations of all variables and their outcome were
compiled. A cross-analysis of variables where necessary was performed,
attaching statistical probabilities to indicate the magnitude of differences or
associations.
All inferential statistics are discussed in Paragraphs 6.3.4.
6.2.6 Assistance to researcher
The conclusions made by the researcher, were validated by the statistical
report. A professional statistician provided input to interpret the outcome of
the data. Reciprocally, the final report written by the researcher was
validated and checked by the statistician to exclude any misleading
interpretations.
6.2.7 Sample
The target population is represented by owner-managers of retail SMEs in
the Western Cape. Purposive sampling was used to select the sample.
6.3 ANALYSIS
In total 158 questionnaires were answered completely. The items
(statements) in the questionnaire will be tested for reliability in the
following paragraph.
6.3.1 Reliability of the research instrument
The reliability test (Cronbach Alpha coefficient) was executed on all the
items (statements), which represent the measuring instrument of this
survey, with regard to the responses rendered in this questionnaire.
Q17_07 (‘Other’) had only ‘no’ responses, and as a result was excluded
223
from the Cronbach Alpha test. Due to the fact that the responses on the
‘None’ categories in questions 6, 15, 17, and 20 will be negatively
correlated to the responses to the other categories for those questions, a
transformatory change was made to these questions, to indicate the
opposite. These question categories are included in the Cronbach Alpha
test, and are identified by a ‘n’ at the end of the question name. The
results as presented in Table 6.1 and Appendix C are based on
statements, which were completed by all the respondents. Due to the
voluminous nature of the data, Table 6.1 is contained within the ambid of
Appendix C1.
The Cronbach Alpha coefficients (refer Table 6.1) for all the items serving
as measuring instrument in the questionnaire are:
0,7599 for raw variables, and
0,8267 for standardised variables,
which are more than the acceptable level of 0,70 (Nunnally, 1978:248-
292). These items are therefore proven to be reliable and consistent. The
Cronbach Alpha coefficients of the standardised variables are included in
Table 6.1, because the scale differed for some of the variables.
6.3.2 Descriptive statistics
Table 6.2, as contained in Appendix C2, shows the descriptive statistics
for all the variables in the questionnaire measuring the different risk
management factors of South African SMEs, with the frequencies in each
category and the percentage out of the total number of questionnaires
completed. It is of importance to note that the descriptive statistics are
based on the total sample. In some cases, no answers were given which
will be reflected as ‘unknown’ in the descriptive statistics. These
descriptive statistics are also contained in Appendix B and Appendix D.
Table 6.3 shows the descriptive statistics (number of responses, mean,
standard deviation, median and range) for all the variables with an ordinal
scale.

224
Table 6.3: Descriptive statistics for all variables (mean, median, standard deviation and
range).
Variable N Mean Std
dev
Median
Range
9.1 Management risk 157 2.86 1.3981 3.0 4
9.2 Commercial risk 157 2.79 1.3206 3.0 4
9.3 Technological risk 157 3.01 1.5063 3.0 4
9.4 Financial risk 157 2.60 1.4709 2.0 4
9.5 Entrepreneurial risk 157 3.28 1.4669 3.0 4
11. To what extent are risks discussed in your business
strategy planning?
158 2.45 1.2797 2.0 4
12. To what extent are risks discussed in your business
operational planning?
158 2.28 1.1235 2.0 4
13. To what extent are risks discussed in your business
financial planning?
158 1.94 1.0662 2.0 4
16. How would you characterise the status of your risk
management framework?
158 3.21 1.3309 3.0 4
19. How do you implement or plan to implement risk
management activities?
158 2.60 1.5349 3.0 4
Questions 9.1 - 9.5 measure the importance of the risk in question with ‘1’
being ‘very important’ and ‘5’ the ‘least important’. Questions 11 - 13
measure the extent with which the risk is discussed for different areas of
the business, where ‘1’ is ‘highly discussed’, ‘2’ is ‘medium discussed’, ‘3’
is ‘lowly discussed’, ‘4’ is ‘unknown’ and ‘5’ is ‘not discussed’. As a result,
the higher the value, the less the risk is discussed for that area. Question
16 indicates that ‘1’ means that ‘a comprehensive risk management
framework is in place’, whilst ‘5’ means there is ‘no risk management
framework in place and none is planned’. Question 19 indicates that ‘1’
means that ‘a holistic risk management framework is implemented or
planned to be implemented’ and 2, 3, and 4 reflect the three types of
incremental implementation, while ‘5’ indicates the ‘not applicable’
category.
The rest of the questions/statements are dichotomous in nature (yes/no
responses), and are described in the frequency table.

225
6.3.3 Univariate graphs
The survey returned that more than 20% of the respondents indicated that
the annual turnover of their businesses were between
R150 000 - R300 000, placing them within the microenterprise category
(refer to Figure 6.2). Nearly 60% of the businesses had a turnover of less
than R1 million, indicating that the majority of enterprises fall within the
boundary of micro-, very small and small enterprises as determined by this
research study.
Figure 6.2: Annual turnover.

226
Figure 6.3: Number of permanent employees.
More than 80% of the businesses (refer to Figure 6.3), have 20 or less
permanent employees in their service, placing them in the very small and
microcategory according to the fulltime employed, permanent employment
category of the National Small Business Act (South Africa, 2004:Online).
Only 2% of respondents indicated a work force in excess of 100, which
places their organisation in the medium enterprise category.
Figure 6.4: Type of entity.

227
The type of corporation (refer to Figure 6.4), is mostly sole proprietorship
or close corporations (70%), with the minority of enterprises (10,8%)
operating as limited companies or other forms of enterprises.
Figure 6.5: Age of business.
Nearly 50% of the businesses are relatively young and less than 6 years in
business (refer to Figure 6.5). Only 5,7% of enterprises surveyed
indicated an operational age exceeding 20 years. It can be argued that the
high prevalence of financial problems experienced by enterprises as
depicted in Figure 6.9, may have a direct or indirect effect on enterprise
age.
Nearly 70% of the business owners have some type of qualification (refer
to Figure 6.6), after completion of their matriculation, which indicates a
highly educated entrepreneurial sample population. The highest category
of post-matriculation qualification is a diploma (25,9%), followed by a
degree (17,1%). Only 5,1% of business owners hold less than a grade 10
certificate.

228
Figure 6.6: Owner qualifications.
More than 60% of the executive managers (refer to Figure 6.7), have
some qualification after completing their matriculation, which maps to the
high percentage of owners depicted in Figure 6.6 with post-matriculation
qualifications. Only 2,5% of executive managers hold less than a grade
10 certificate. From the above the obvious analogy can be drawn that
SME management teams in this survey, comprising owners and/or
managers are therefore well-educated individuals, but this falls in sharp
contrast to the small percentage (5,7%) of enterprises (refer to Figure 6.5),
who survived and operates beyond 20 years.
Figure 6.7: Executive management qualifications.

229
Financial management, marketing management and information
technology were the areas that received most support from external
consultants (refer to Figure 6.8). This can arguably be attributed to the
highly specialised nature of especially financial and information technology
areas. In contrast, human resources and public relations management
received the least amount of support from external consultants. The limited
amount of external support received regarding human resource matters
can arguably be ascribed to the small employment base of SMEs as
shown in Figure 6.3.
Figure 6.8: Support received from external consultants.
More than 60% of the respondents indicated that they had experienced
financial problems in the past (refer to Figure 6.9). It is of importance to
note that this question was changed from ‘experiencing no problems’ to
‘experiencing problems in the past’ culminating in the ‘yes’ answers
becoming ‘no’ and the ‘no’ answers becoming ‘yes’. Only 38,6% of
respondents indicated that their enterprise had no history of financial
problems, which is of interest considering the previously mentioned low
survival rate of enterprises, depicted as enterprise age in Figure 6.5.

230
Figure 6.9: History of financial problems.
The main reason for experiencing financial problems relates to theft of
business resources (38,6%), followed by inefficient
budgeting/overspending (27,8%) (refer to Figure 6.10). The areas
contributing the least to financial problems are the occurrence of
catastrophic events (8,8%), followed by information technology
inefficiencies (19%).
Figure 6.10: Reasons for experiencing financial problems.
More than 85% of the respondents as shown in Figure 6.11, indicated that
their businesses had clearly defined business objectives and strategies,

231
which positively map to their understanding of their risks (Figure 6.13), and
the impact that such risks can have on business objectives and strategies.
Figure 6.11: Business objectives and strategies clearly defined.
Out of five different risk categories, financial risk is indicated as the risk
which is perceived as the most important (refer to Figure 6.12).
Entrepreneurial risk, described as the age, experience and training of
owner and/or manager, followed by technological risk, described as
problems with suppliers and equipment, inadequate production structures,
absence of technological development monitoring, absence of research
and development, and an absence of continuous improvement activities,
rate as the least important risks for SMEs.

232
Figure 6.12: Importance of type of risk.
More than 87% of the respondents (refer to Figure 6.13), indicated that
they had a clear understanding of the risks impacting on their business
structure and processes. This understanding clearly manifests in a
financially orientated focus as depicted in Figures 6.12 and 6.14.
Figure 6.13: Understanding of risks.
Risk discussions feature more prominently during the financial planning
phase compared to operational and strategic planning discussions (refer
to Figure 6.14). It is of interest to note that discussions pertaining to risks

233
feature the least during strategic planning activities, although survey
results indicate that more than 85% of enterprises have clearly defined
business objectives and strategies (refer to Figure 6.11). The adequacy of
the process for the defining of enterprise objectives and strategies is
therefore questionable, in that risks which impact significantly on strategy,
are not discussed extensively.
Figure 6.14: Extent to which risk is discussed.
The majority of respondents (61,4%) as depicted in Figure 6.15, indicated
that they were interested in a risk framework citing profit-maximising
(88,0%), improved customer service (82,3%), minimising of cost (77,8%)
and safeguarding of assets (70,9%) as the primary motivating factors.
Internal compliance, e.g. organisational policies and procedures and
regulatory compliance, e.g. labour relations, safety and health, and income
tax legislation, feature as the least important motivating factors for the
implementation of a risk framework. The relative small size of enterprises
surveyed, i.e. 44% of enterprises have five or fewer permanent employees
(refer to Figure 6.3), implies a more enterprise-involved owner-
manager/employee relationship, where internal compliance activities and
regulatory compliance activities are implicitly enforced and not a formally
documented process. For a comprehensive list of motivating factors for
risk framework implementation, refer to Figure 6.16.
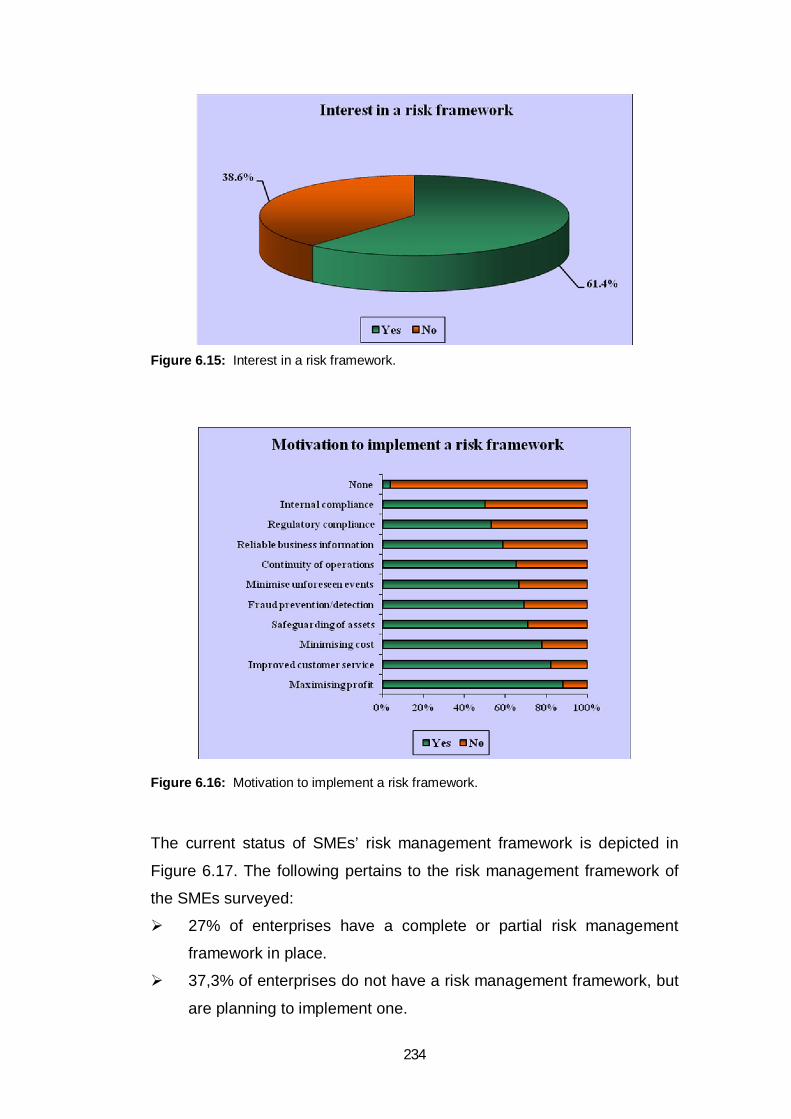
234
Figure 6.15: Interest in a risk framework.
Figure 6.16: Motivation to implement a risk framework.
The current status of SMEs’ risk management framework is depicted in
Figure 6.17. The following pertains to the risk management framework of
the SMEs surveyed:
27% of enterprises have a complete or partial risk management
framework in place.
37,3% of enterprises do not have a risk management framework, but
are planning to implement one.

235
24,6% of enterprises do not have a risk management framework, and
are not planning to implement one.
Taking cognisance of enterprises’ financial focus (Figures 6.12 and
6.14), the financial aspect will probably dominate the risk framework
of the 37,3% of enterprises planning to implement a risk
management framework.
Figure 6.17: Status of risk management framework.
Figure 6.18: Functions where formal risk identification takes place.
The areas where formal risk identification occurs (refer to Figure 6.18),
map to the focus of the respondents’ enterprises (refer to Figures 6.12 and

236
6.14), and were primarily finance (73,4%), operational activities (56,3%),
and sales/marketing processes (55,1%), with human resource functions
the least prone to risk identification.
Figure 6.19: Actions engaged in when risks are identified.
When risks are identified in primarily the financial, operational and
sales/marketing areas, organisational action primarily encompasses the
following (see Figure 6.19):
Improvement of internal controls (73%) and
Taking out of insurance (58,2%).
As entrepreneurial activities imply the taking of risks, the anticipated
results pertaining to risk actions deployed in risk identification, map to the
survey results showing that the least popular risk action taken by
management is ‘not engaging in the activity’.
Figure 6.20: Way of implementing risk management activities.

237
More than a third of the respondents (37,3%) indicated the way they would
prefer to implement or plan to implement risk management activities, is
holistically, thereby across the entire enterprise. Departmental risk focus
would be the preference of 10,8% of respondents, while 28,5% of
respondents would prefer risk management activities to focus on the type
of risks (refer to Figure 6.20). As risk management processes are
optimised if implemented holistically, it is of concern that almost two-thirds
of respondents preferred other types of risk management implementation.
This may be attributed to the obstacles experienced to implementing a risk
management framework with cost factors (44,3%), lack of skills or
expertise (32,9%) and lack of formalised processes (29,8%), as the main
obstacles faced. From the survey results, SME owner-managers
interviewed seemed to be aware of the value of a risk management
framework, as ‘not perceived as a priority’ and the ‘benefit does not justify
the effort’ are the least probable obstacles experienced to implementing a
risk management framework (refer to Figure 6.21).
Figure 6.21: Obstacles to implementing a risk management framework.
Respondents were provided the option of receiving feedback to this study,
and 39,2% of them indicated that they would like to receive such feedback
(refer to Figure 6.22).

238
Figure 6.22: Feedback of study.
6.3.4 Factor analysis
Due to the fact that some questions/statements had multiple answers and
were captured separately, some transformatory changes were made to
these statements in order to elicit only one answer. To ensure that there
were not different constructs in a question/statement with different
answers, a factor analysis was done to show the underlying constructs of
the questionnaire.
An exploratory factor analysis was used to determine the factor structure
underlying the set of originally observed variables that represented the
measurements regarding risk management in the SMEs. Per definition,
factor analysis identifies the nature and number of latent factors
responsible for co-variation in the data analysis. Results, including the
rotated factor pattern and communality estimates of the exploratory factor
analysis are shown in Table 6.4 and Appendix E. The communality refers
to the percentage of variance in an observed variable that is accounted for
by the retained factors (Hatcher, 1994:67).

239
Table 6.4: Original variables and corresponding factor loadings from the rotated factor
pattern.
Factor pattern Final communality estimates
Questionnaire statements 1 2 3 4 5 6 7 8
79 0 8 20 8 8 3 16 0.6658 Q20_1n
74 1 3 29 18 23 13 -4 0.5720 Q20_7
63 -19 -10 20 13 9 -3 -7 0.4299 Q20_8
65 -8 4 24 27 19 10 -6 0.4572 Q20_5
59 4 -1 31 27 16 -11 11 0.4353 Q20_3
50 15 -2 1- 21 1 8 -26 0.4080 Q20_4
53 -22 0 9 3 12 4 0 0.3166 Q20_6
40 0 7 -9 -5 12 -7 20 0.2660 Q20_2
-13 81 17 -17 7 6 -1 11 0.6732 Q11
-17 78 22 -15 9 13 25 12 0.6807 Q12
-7 75 16 -2 18 5 19 17 0.5966 Q13
-21 48 39 7 15 8 16 -24 0.4588 Q16
-2 12 66 9 4 0 -17 10 0.5243 Q06_04
-10 28 60 7 1 5 -3 0 0.4211 Q06_07
-4 13 55 -4 -10 -1 1 2 0.3366 Q06_06
8 -5 58 1 7 7 41 11 0.5145 Q06_01
16 22 66 22 18 4 54 5 0.6722 Q06_08n
1 1 53 0 0 -1 5 -4 0.2893 Q06_03
4 20 58 26 4 5 37 -17 0.4753 Q06_02
17 11 49 10 17 6 48 0 0.4323 Q06_05
27 -16 3 85 6 2 -13 -6 0.7775 Q07_1_1n
15 -6 0 65 15 17 -9 8 0.4757 Q07_2_02
23 -21 2 69 20 24 3 -21 0.5558 Q07_2_03
8 1 4 42 -4 -2 18 11 0.2689 Q07_2_01
12 8 13 49 15 - -12 -14 0.2903 Q07_2_04
17 21 22 45 28 14 4 -15 0.3113 Q14
24 -16 6 44 16 2 -10 -36 0.3443 Q07_2_05
16 10 7 16 77 10 12 -2 0.6195 Q15_03
7 10 -5 15 71 29 -7 -8 0.5345 Q15_11n
11 1 7 9 64 25 10 5 0.4351 Q15_01
31 -2 7 18 58 32 15 16 0.4360 Q15_02
18 21 14 10 17 75 -6 13 0.6095 Q15_06
17 9 3 26 24 73 6 1 0.5773 Q15_07
8 23 8 6 33 62 -27 19 0.5119 Q15_09

240
Factor pattern Final communality estimates
Questionnaire statements 1 2 3 4 5 6 7 8
12 2 -4 14 43 59 10 -1 0.4442 Q15_05
22 7 -1 22 41 57 1 17 0.4146 Q15_10
13 -1 -4 2 40 49 -30 19 0.4193 Q15_08
23 15 5 7 45 51 -7 18 0.3909 Q15_04
10 39 17 -3 4 4 58 16 0.4861 Q18_02
-2 21 10 6 25 -2 3 52 0.3911 Q09_04
1 14 0 2 -4 15 -2 49 0.2823 Q09_01
Note to the reader: All the loadings are multiplied by a 100 and rounded off to the nearest
integer.
Measurements regarding risk management were subjected to an
exploratory factor analysis using Squared Multiple Correlations (SMC) as
prior communality estimates. The principal factor method was used to
extract the factors, followed by a promax (oblique) rotation. A scree test
suggested eight meaningful factors, resulting in only these factors being
retained for rotation.
In interpreting the rotated factor pattern, an item was said to load on a
given factor if the factor loading was 0,40 or greater for that factor, and
was less than 0,40 for the other. In total 41 items loaded on a given factor
according to abovementioned criteria. The items that had loadings on
more than one factor were supposed to be deleted from the analysis, but
due to the understanding of the different meanings of the statements
(items) they were retained and are elaborated upon in the following
paragraph. Using these criteria, eight items were found to load on the first
factor, was subsequently labelled the ‘Barrier to implement RMF factor’.
Four items loaded on the second factor, was labelled the ‘Existence of
structured risk management approach factor’. Eight items loaded on the
third factor, was labelled the ‘External Support to business factor’, seven
items loaded on the fourth factor was labelled the ‘Experiencing of
problems by business factor’, four items loaded on the fifth factor was

241
labelled the ‘First motivation to implement RMF factor’, seven items loaded
on the sixth factor was labelled the ‘Second motivation to implement RMF
factor’, one item loaded on the seventh factor was labelled the
‘Improvement of internal controls factor’, and two items loaded on the eight
factor which was labelled the ‘Importance of risk (in management &
finance) factor’.
The sixth factor had loadings on the fifth factor as well, but due to the
meaning of the statements (items), which all came down to motivation to
implement a risk management framework, the items that loaded both on
the fifth and sixth factor were kept in the factor, that it loaded on the most.
The second factor is the factor that shows the existence of a risk
framework and is used as the dependent variable in the following tests to
test whether a structured risk management framework, as opposed to a
non-structured risk management framework, has any influence on a
business.
Spearman rank correlations were calculated to determine whether there
existed a relationship between factor 2 and the other factors or items
(variables). Factor 2 was positively correlated to factors 3 and 5 and as a
result the existence or non-existence of a structured risk management
framework was correlated with the factor, which indicated that businesses
received external support, with the factor that indicated the first tier of
motivation to implement a risk management framework.
6.3.5 Chi-square tests
The following steps were taken to test the main aim of this research
namely, whether companies without a structured risk management
approach are adversely affected with respect to their risk efficiency:
Firstly, it was necessary to determine which measurement(s) indicate
the presence or non-presence of a structured approach to risk
management, which was then viewed as the ‘dependent variable’.

242
Secondly, all the other variables indicating the nature of the business
in the likes of risk efficiency and whether there are problems
regarding certain aspects in the companies, was then viewed as the
‘response variables’.
Thirdly, as the characteristics of the data in this research is
categorical in nature (nominally and ordinally scaled) and to
determine the relationship between the dependent and response
variables, each variable was compared with the dependent variable
(presence or non-presence of a structured approach to risk
management) by means of a Chi-square test. The Chi-square test
was to show whether the modes of classification are independent.
When it was determined which variables were associated with the
dependent variable (presence or non-presence of a structured
approach to risk management), a log linear analysis was executed to
determine the best model for the information.
The dependent variable was defined as a combination of
variables/questions 11, 12, 13 and 16. As these variables loaded strongly
on factor 2, which represented the existence of a structured risk
management approach in the company (shown in previous paragraph
6.3.4), the ‘dependent variable’ was defined as:
a. Yes, a structured risk management approach exists in the company,
and
b. No, a structured risk management approach does not exist in the
company; by
combining questions 11, 12, 13 and 16 as follows:
If the respondent answered medium or high on 11, 12, and 13 (it
means risk is taken up in strategic, operational and financial
planning) and if the respondent indicated the company had a
complete or partial risk management framework in place in question
16, then it was assumed that the respondent’s company had a
structured approach to risk management and the dependent
variable/question indicated ‘Yes’.
243
If the respondent answered differently from above, then the
respondent’s company did not have a structured approach to risk
management and the dependent’s question will indicate ‘No’.
The definition of the dependent variable is also shown as it was
programmed for SAS:
IF (q11 EQ 1 OR q11 EQ 2) and (q12 EQ 1 OR q12 EQ 2) and (q13 EQ 1
OR q13 EQ 2) and (q16 EQ 1 or q16 EQ 2) THEN new1=1;
IF new1 NE 1 THEN new1=2; Where new1=1 means ‘yes’ a structured
risk management approach was followed in the company, and new1=2
means ‘no’ a structured risk management approach was not followed in
the company. It is of importance to note that ‘New1’ is the name of the
variable indicating the presence or non-presence of a structured approach
to risk management. Furthermore, it is of importance to note that the
emphasis fell on a structured risk management approach and not only on
the existence of a risk management framework.
The tables and graphs as shown in Appendix F indicate statistically
significant associations between the dependent variable and response
variables. Although only the statistically significant associations are
mentioned in Appendix F, it is of importance to note the absence of
statistically significant associations. All the Chi-square tests are shown in
Appendix G.
SAS computes a p-value (probability value) that measures the statistical
significance derived from the test values like the Chi-square. Results were
regarded as significant if the p-values were smaller than 0,05, because
this value presents an acceptable level on a 95% confidence interval (p ≤
0,05). The p-value is the probability of observing a sample value as
extreme as or more extreme than the value actually observed, given that
the null hypothesis is true. This area represents the probability of a type 1
error that must be assumed, if the null hypothesis is rejected (Cooper &
Schindler, 2001:509).

244
The p-value was compared to the significance level (), and on this basis
the null hypothesis is either accepted or rejected. If the p-value was less
than the significance level, the null hypothesis was rejected (if p-value <,
reject null). If the p-value is greater than or equal to the significance level,
the null hypothesis was not rejected (if p-value ≥, do not reject null).
Thus, with =0,05, if the p-value is less than 0,05, the null hypothesis will
be rejected. The p-value is determined by using the standard normal
distribution. A small p-value represents the risk of rejecting the null
hypothesis.
A difference has statistical significance if there is good reason to believe
the difference does not represent random sampling fluctuations. Results
will be regarded as significant if the p-values are smaller than 0,05,
because this value is used as cut-off point in most behavioural science
research.
It is of importance to note that some of the categories were collapsed to
fewer categories, to meet the requirements of sufficient expected
frequencies (these expected frequencies should all be greater than one
and in no more than 20% of the cells should they be less than 5).
Significant associations between the dependent variable and the response
variables are depicted in Appendix F. It is of interest to note that
statistically significant more SMEs that did not have a structured risk
management approach, was smaller organisations. Such SMEs do not
engage in risk identification processes and have an insufficient
understanding of the risks impacting on their business processes.
Furthermore, such SMEs prefer avoiding high-risk situations and they do
not engage in the improvement of internal controls. Lack of intellectual
capital and skills, as well as costs, are obstacles experienced by these
SMEs, which limit their application of a structured risk management
approach.

245
6.3.6 Log linear analysis
The log linear analysis was executed because the two-way Chi-square
tests:
Did not enable one to detect three-way or higher order interactions.
Did not allow for the simultaneous examination of the pair-wise
relationships.
The log linear analysis in this research was therefore used to determine
the relationship between a structured risk management approach and risk
efficiency of South African SMEs. This is represented by the association
and interaction between ‘new1’ and the various other variables that can
predict whether a company has a structured or non-structured risk
management approach. The log linear analysis was also used because it
is a multivariate statistical technique, which can be applied to contingency
tables for the interpretation of qualitative or categorical data.
Because multivariables/multiway frequency analyses are used for the
classification, the cells become smaller. The way the original questionnaire
was set up means there was more than one question that represented one
aspect or one construct as the factor analysis also has shown in
paragraph 6.3.4. The ‘None’ question/statement/item in for instance Q06
can represent the whole question. In addition, if ‘None’ was marked as
‘Yes’, none of the others was marked ‘Yes’. Thus if the inverse of the
‘None’ question was used, then the ‘Yes’ would mean that the SME
received support from external consultants and ‘No’ would mean the SME
did not receive any external support.
These questions as previously indicated in this chapter are identified by a
‘n’ that was added at the end of the question name. These questions were
then used in the log linear analysis as shown in Table 6.45.

246
Table 6.45: Variables that were taken up in the log linear analysis.
Question name
Categories Frequency Percentage
New1 SME has a structured risk management
approach.
40 25.3%
SME does not have a structured risk
management approach.
118 74.7%
Q06_08n SME received support from external
consultants in one or more areas.
106 67.1%
SME did not receive support from
external consultants in one or more
areas.
52 3.9%
Q07_1_1n Business experienced financial
problems in the past.
97 61.4%
Business did not experience financial
problems in the past.
61 38.6%
Q17_06n Risk identification and assessment take
place in one or more functions in the
SME.
138 87.3%
Risk identification and assessment do
not take place in one or more functions
in the SME.
20 12.7%
Q20_1n Obstacles are experienced in
implementing a risk management
framework.
109 69.0%
No obstacles are experienced in
implementing a risk management
framework.
49 31.0%
Due to the fact that 5 variables were used in the log linear analysis, the
expected frequencies in the cells became too small and the variable that
mostly contributed to this was Q17.06n. This variable was then omitted for
this reason, as well as that there was no association between this variable
and the dependent variable ‘new1’ when it was compared in a two-way
table with a Chi-square test. As a result, four variables new1, q06_08n,
q07_1_1n and q20_1n were used in the log linear analysis.

247
Table 6.46 shows all the models that were fitted and which one was the
best fit.
Table 6.46: Results of the log linear analysis.
Nr Model DF Likelihood
Chi-square P-values
1 New1 13 74.40 <0.0001
2 Q06_08n 13 92.61 <0.0001
3 Q07_1_1n 13 91.15 <0.0001
4 Q20_1n 13 88.88 <0.0001
5 New1 & q06_08n 12 59.21 <0.0001
6 Q06_08n & q07_1_1n 12 80.54 <0.0001
7 Q07_1_1n & q20_1n 12 77.05 <0.0001
8 Q20_1n & new1 12 55.10 <0.0001
9 New1 & q06_08n & q07_1_1n 11 49.10 <0.0001
10 Q06_08n & q07_1_1n & q20_1n 11 63.87 <0.0001
11 Q07_1_1n & q20_1n & new1 11 45.10 <0.0001
12 New1 & q06_08n & q07_1_1n & q20_1n 10 29.19 <0.0001
13 New1*q06_08n & main effects 11 59.20 <0.0001
14 New1*q07_1_1n & main effects 11 62.96 <0.0001
15 New1*q20_1n & main effects 11 44.27 <0.0001
16 Q06_08n*q07_1_1n & main effects 11 80.51 <0.0001
17 Q06_08n*q20_1n & main effects 11 65.96 <0.0001
18 Q07_1_1n*q20_1n & main effects 11 71.44 <0.0001
19 q06_08n*q07_1_1n q06_08n*q20_1n & main
effects
8 22.19 0.0046
20 q07_1_1n*q20_1n q07_1_1n*new1 & main
effects
8 19.44 0.0127
21 q20_1n*new1 q20_1n*q06_08n & main effects 8 9.54 0.2986
22 New1*q06_08n new1*q07_1_1n & main effects 8 28.03 0.0005
23 New1*q06_08n & new1*q07_1_1n &
new1*q20_01n & main effects
7 18.50 0.0099
24 q06_08n*q07_1_1n & q06_08n*q20_1n &
q06_08n*new1 & main effects
7 22.19 0.0024
25 q07_1_1n*q20_1n & q07_1_1n*new1 &
q07_01_01n*q06_08n & main effects
7 19.18 0.0076
26 q20_1n*new1 & q20_1n*q06_08n &
q20_1n*q07_1_1n & main effects
7 3.95 0.7850

248
Models number 21 and number 26 map to the data since the likelihood
ratio test for the four-variable interactions and main effects are both non-
significant at the 0,05 level of significance. To determine which model fits
the data the best, the difference of the likelihood Chi-squares 9,54 -3,95 =
5.59 and the difference of the degrees of freedom 8 – 7 = 1 are calculated.
Since the critical value for 1 degree of freedom at the 0,05 level of
significance is 3,84, the difference is significant with the preferred model,
model number 26. The percentage improvement in goodness of fit is (9,54
– 3,95)/9,54 = 0,58, therefore a 58% improvement.
The analysis of variances (refer to Table 6.47), shows that model number
26 fits, since the likelihood ratio test for the four-variable with 3, two
variable interactions and main effects is non-significant at the 0,05 level of
significance. The two-variable interactions however are significant, which
shows that there is mutual dependence among these variables.
Table 6.47: Maximum likelihood (analysis of variance).
Source DF Chi-square P-value
New1 1 16.88 <0.0001***
Q06_08n 1 6.27 0.0123*
Q07_1_1n 1 5.03 0.0249*
Q20_1n 1 1.44 0.2309
New1*q20_1n 1 10.68 0.0011**
Q06_08n*q20_1n 1 7.81 0.0052**
Q07_1_1n*q20_1n 1 5.51 0.0190**
Likelihood ratio 7 3.95 0.7850
Although the variable ‘experiencing of obstacles when implementing a
RMF’ was associated with ‘whether a business has a structured risk
management approach’, ‘whether a business had financial problems
previously’ and ‘whether external support is given to the business’, it was
not significant on its own in this model. The strongest association was
between ‘whether a business has a structured risk management approach’
and ‘experiencing of obstacles when implementing a RMF’. From the two-
way Chi-square tests the analogy can be drawn that the obstacles with the
greatest effect, are the ‘lack of intellectual capital’, ‘cost’ and ‘lack of skills’.

249
The predicted frequencies as well as the actual frequencies can be seen
in Appendix H with the final model being fitted.
6.4 DISCUSSIONS AND CONCLUSIONS
As for the results obtained through this survey, the following analogies can
be drawn from the survey research:
A fewer number of the smaller companies (smaller turnover, less
employees and sole proprietorships), had a structured risk
management approach.
External support to management areas (specifically to marketing,
human resources and public relation management), had an effect on
whether a company had a structured or non-structured risk
management approach.
Companies that had a structured approach to risk management also
had clearly defined strategies and objectives to help determine,
which activities were critical for the survival of a business and had an
understanding of the risk that had an impact on their business
structure and processes. As a result, a structured approach to risk
management had an impact on risk efficiency.
Formal risk identification and assessment taking place at different
areas within a company especially in finance, human resources and
operations had an effect on the company with a structured or non-
structured risk management approach.
Improvement of internal controls and engagement of risk activities
took place to a lesser extent in companies that did not have a
structured risk management approach.
Companies, which did not have a structured approach to risk
management experienced obstacles to implementing a risk
management framework. These obstacles especially related to a lack
of intellectual capital, lack of skills and cost.

250
An interesting point is that companies, which did have a structured
risk management approach rated management risk and commercial
risk, as the least important.
The independent Chi-square tests provided empirical support that a
non-structured risk management approach impacted adversely on
risk efficiency.
The log linear analysis showed the association between obstacles to
implementing a risk management framework and external support,
financial problems experienced previously and a non-structured risk
management approach especially within the smaller companies
(smaller turnover, less employees and sole proprietorships).
251
CHAPTER 7
FORMULATION OF A STRUCTURED RISK MANAGEMENT
MODEL FOR SOUTH AFRICAN SMEs
SYNOPSIS
An SME risk architecture model is proposed to assist SMEs in effectively
managing their risks. This model consists of the three interrelated
components of SME risk consciousness, addressing specific focus areas,
the SME risk management process, addressing the risk management
process, and the SME risk management framework, addressing a holistic
view of a structured risk approach. The emphasis on micro- and small
enterprises is reiterated in the risk consciousness that focuses on the most
critical risks observed and experienced by SMEs according to literature
sources and surveys.
The SME risk management process, consisting of the subprocesses risk
context and strategy, risk decisions, communication, and monitoring,
review and continuous improvement, encompasses the complete process
whereby risks are managed. The risk context and strategy process
underpin all risk management activities and include the development of an
understanding of the environment in which the SME operates, defining
organisational and departmental objectives, and determining the resource
requirements and risk criteria to be used.
Risks are identified, assessed, documented and acted upon in the risk
decision phase, where the risk’s effect on objectives is measured in terms
of the impact of the risk as well as the probability that the risk can occur.
This measurement enables SMEs to prioritise risk, thereby allocating
scarce resources accordingly.
Effective communication underpins all activities and occurs throughout the
entire risk management process, facilitating effective interactive

252
communication between all organisational levels. To ensure the
effectiveness of risk management actions, continuous monitoring and
review actions are proposed. The monitoring and review actions also
facilitate continuous improvement activities by adapting processes and
focus areas to incorporate the changing business environment.
The last phase of the SME risk architecture model namely the SME risk
management framework, provides guidance to SMEs on the process to
plan structured risk management processes, implement the processes,
and measure the effectiveness of the risk actions taken. This principle-
based framework aims to facilitate the achievement of organisational
objectives and supports organisational performance measurement by
mapping performance measurement indicators to the risk management
framework results and evaluating the effectiveness thereof.
The content of Chapter 7, along with the relative positioning of the topics,
is graphically depicted in Figure 7.

253
INTRODUCTION
SME RISK ARCHITECTURE MODEL
SME RISK CONSCIOUSNESS
SME RISK MANAGEMENT PROCESS
SME RISK MANAGEMENT FRAMEWORK
Risk context and strategy: Organisational environment Defining objectives Resource requirements Risk criteria Risk decisions: Risk identification Risk assessment Risk response and action
planning Communication Monitoring, review and continuous improvement
SME risk management framework components: Planning Implementation Results Measurement Application of the SME risk management framework
Figure 7: Detailed layout of Chapter 7 - Formulation of a structured risk management model for South African SMEs.
RESEARCH HYPOTHESIS, SUBQUESTIONS AND OBJECTIVES RE-VISITED
FINAL CONCLUSION

254
CHAPTER 7
FORMULATION OF A STRUCTURED RISK MANAGEMENT
MODEL FOR SOUTH AFRICAN SMEs
7.1 INTRODUCTION
The analytical process followed thus far, is graphically depicted in Figure
7.1, which places the chapters in context with the overall thesis objectives,
and furthermore indicates the relative positioning of this chapter.
Figure 7.1: Chapter 7 - Formulation of a structured risk management model for South
African SMEs’ positioning.
Based on the literature review conducted in Chapters 2, 3 and 4 and the
survey results analysed in Chapter 6, an SME risk architecture model is
proposed to facilitate the effectiveness of risk management practices in
South African SMEs within the retail sector.
CHAPTER ONE
Scope of the research
CHAPTER TWO
Risk management – A literature review
CHAPTER THREE
Enterprise risk management – A literature review
CHAPTER FOUR
A perspective of SME risk management in South Africa
– A literature review
CHAPTER FIVE
Survey design and methodology
CHAPTER SIX
Analysis and interpretation of survey data
CHAPTER SEVEN
Formulation of a structured risk management model for
South African SMEs

255
7.2 SME RISK ARCHITECTURE MODEL
The proposed SME risk architecture model encompasses three
interrelated phases namely:
Phase 1: SME risk consciousness
Phase 2: SME risk management process
Phase 3: SME risk management framework.
These areas are depicted in Figure 7.2, thereby suggesting a structured
approach to managing micro- and small business risks. By embedding a
structured risk management approach, organisational benefits such as
greater transparency, an increased risk awareness, a controlled risk
environment, better allocation of capital and an improvement in the
execution of the business plan can be achieved.
Figure 7.2: Holistic depiction of the SME risk architecture model.
A detailed discussion of the SME risk architecture elements follow in
Paragraph 7.3, Paragraph 7.4 and Paragraph 7.5.

256
7.3 SME RISK CONSCIOUSNESS
The first element of the SME risk architecture model is defined as the SME
Risk Consciousness (SRC). Refer to Figure 7.3 for a schematic depiction
of the SRC. As opposed to the other generic risk architecture elements,
namely SME risk management process and SME risk management
framework, the SRC provides a focused approach on risk sources or risk
areas most commonly identified118 as actual or perceived obstacles to
organisational success and survival as measured by the achievement of
organisational objectives.
Figure 7.3: SME risk consciousnesses.
A combination of the measurement-driven approach and process control
approach, hereafter termed the Measurement Process Approach, is
proposed. SME owner-managers’ attention is hereby directed to the most
critical risks faced by the organisation taking cognisance of risk
prioritisation, as well as the key business processes and uncertainties
embedded in the execution of the business plan. Through the utilisation of
118 Risk source / risk area identification was conducted through the mediums of extensive literature review and applied field research conducted by way of surveys on SME owner-managers in the retail sector, Western Cape, South Africa.

257
the Measurement Process Approach, the following risk focus points are
identified that may impede on organisational performance and survival:
Internal risk areas: The internal risk area is the internal
organisational environment where risk elements are defined in the
context of internal organisational objectives.
External risk areas: The external risk area is the external
environment where interaction occurs between stakeholders outside
of the organisation and the organisation. External risk elements are
defined in the context of external organisational objectives.
Combination of internal and external risk areas: The risk
elements in this category are neither exclusively internally nor
externally driven and are influenced by both categories to a different
extent.
The internal, external, and combined risk areas are subdivided into
specific risk elements, either process-specific or area-specific, that are
applicable to micro- and small enterprises. Furthermore, each process or
area is prioritised according to its importance as perceived by SME owner-
managers and literature sources depicted in Figure 7.4.
Figure 7.4: Areas or processes of importance.

258
Business processes/operational activities (importance A, B, C):
Business processes are defined as, a “… series of logically related
activities or tasks performed together to produce a defined set of
results” (Business Dictionary, 2010a:Online). This entails product
quality, reduction of overspending, recruiting quality staff and other
human resource processes, sales, marketing, and productivity.
Business continuity (importance A): Business continuity is
defined as, the “… ability of the key operations of a firm to continue
without stoppage irrespective of the adverse circumstances or
events” (Business Dictionary, 2010b:Online).
Finance (importance A, B, C): Finance is defined as, “… a branch
of economics concerned with resource allocation as well as resource
management” (Investor Words, 2010:Online). This entails the
availability of working capital, sales growth, sales level, debt load,
interest cover, capacity for indebtness, and profitability.
Strategy including strategic objectives (importance B): Strategy
is defined as, the “… alternative chosen to make happen a desired
future” (Business Dictionary, 2010c:Online). Strategic objectives are
defined as, the “… broadly defined target that an organisation must
achieve to make its strategy succeed” (Business Dictionary,
2010d:Online). Affecting strategy is the strategic risk of ineffective
marketing strategies.
Managerial aspects (importance B, C): This area encompasses
multifunctional management, i.e. designated head for each of the
business functions, managerial tools such as cash flow budgets,
managerial training and qualification, skills, succession planning, and
level of managerial commitment.

259
Security (importance A): From the perspective of this author,
security can be defined as, “… all actions taken to safeguard tangible
and intangible assets”. This entails physical security such as
entrance control, safekeeping through, e.g. fencing off high value
assets, as well as safeguarding organisational name and reputation.
Learning & growth (importance B, C): Learning and growth can
be defined as, “… the measurement of intangible assets such as
human capital, information and process systems, and cultural
attributes necessary to produce the value proposition products and/or
services” (Business News and Concepts, 2010:Online). It is about
the sustainability of the organisation and the human ability to change,
adapt and improve. Learning and growth encompass intellectual
capital; the age, training and experience of the entrepreneur as well
as employees.
Reputation (importance B): Reputation can be defined as, the “…
overall estimation of the character or quality…” with regard to an
organisation and organisational management, as held by
stakeholders and the public (Business Dictionary, 2010e:Online).
Reputation extends into public relations which is defined as, the “…
systematic effort to create and maintain goodwill of an organisation’s
various publics (customers, employees, etc.) usually through publicity
and other non-paid forms of communications” (Business Dictionary,
2010f:Online).
Information (importance C): From the perspective of this author,
information can be defined as, “… raw data that has been verified to
be accurate and timely, is specifically organised for a purpose, is
presented within a content that gives it meaning and relevance, and
which leads to an increase in understanding and decrease in
uncertainty” (Business Dictionary, 2010g:Online). The value of

260
information lies solely in its ability to affect a behaviour, decision or
outcome.
Industry (importance C): Industry can be defined as, “… the
aggregate of manufacturing or technically productive enterprises in a
particular field, often named after its principle product” (Dictionary
Reference, 2010a:Online). For SMEs, ‘industry’ refers to the
competitive position of the company, competitors’ reaction, and
demand fluctuations.
Economy (importance C): Economy in the context of SME
interactions with all stakeholders can be defined as, “… the system of
production and distribution and consumption” (Princeton,
2010a:Online). For SMEs, ‘economy’ refers to employment
opportunities, crime, exchange rate, and interest rate.
Legislation & insurance (importance C): Legislation refers to “…
the law enacted by a legislative body” (Princeton, 2010b:Online).
This includes employment legislation, environmental, health and
safety legislation, trade legislation, etc. Insurance can be defined as,
“… the act, system, or business of insuring property, life, one’s
person, etc., against loss or harm arising in specific contingencies ….
in consideration of a payment proportionate to the risk involved”
(Insurance, 2010:Online). Insurance against theft and fire is some of
the more general aspects SMEs should consider.
Technological aspects (importance C): Technology can be
defined as, “… the branch of knowledge that deals with the creation
and use of technical means and their interrelation with life, society,
and the environment, drawing upon such subjects as industrial art,
engineering, applied science and pure science” (Dictionary
Reference, 2010b:Online). This could refer to suppliers, equipment,
development and research, and continuous improvement.

261
The process of directing the organisational risk focus to the
abovementioned risk elements, is schematically depicted in Figure 7.5.
Figure 7.5: SME risk elements.
By directing the organisational risk focus, SME owner-managers can
improve the effectiveness of their risk management process through
focussing on the most frequent risks encountered by SMEs. However, this
risk element model does not diminish the important role of owner-
managers in the SME risk consciousness phase, as SME owner-
managers are still required to evaluate the merit of each risk element as
applicable to their organisational objectives. If other internal or external
risks influence organisational processes or activities, these should be
INTER
NA
L INFLU
ENC
ES
EXTERN
AL IN
FLUEN
CES
COMBINED INFLUENCES
COMBINED INFLUENCES

262
included in the organisational risk focus. Furthermore, SME owner-
managers should take cognisance of the interdependency of risks as well
as the cumulative effect of risk whereby seemingly insignificant risks, if not
addressed, escalate into significant risks.
The risk elements identified in the SME risk consciousness phase are
escalated into the SME risk management phase where action is taken in
addressing the risks these elements pose to organisational activities and
processes.
7.4 SME RISK MANAGEMENT PROCESS
The Risk Management Process (RMP) constitutes the steps SME owner-
managers should follow in addressing risk elements (as discussed in
Paragraph 7.3) that impede/can impede on organisational objectives.
The RMP consists of numerous organisational risk-driven activities, that
are grouped into four processes as depicted in Figure 7.6.
Figure 7.6: The SME risk management process.
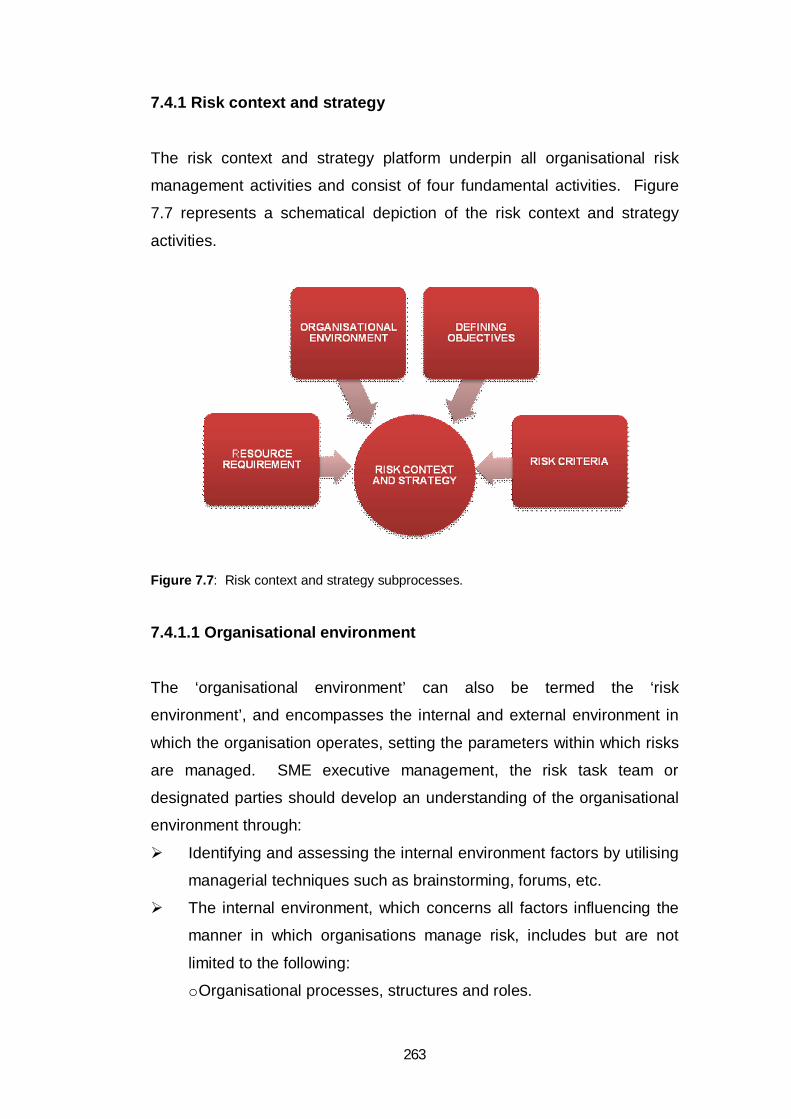
263
7.4.1 Risk context and strategy
The risk context and strategy platform underpin all organisational risk
management activities and consist of four fundamental activities. Figure
7.7 represents a schematical depiction of the risk context and strategy
activities.
Figure 7.7: Risk context and strategy subprocesses.
7.4.1.1 Organisational environment
The ‘organisational environment’ can also be termed the ‘risk
environment’, and encompasses the internal and external environment in
which the organisation operates, setting the parameters within which risks
are managed. SME executive management, the risk task team or
designated parties should develop an understanding of the organisational
environment through:
Identifying and assessing the internal environment factors by utilising
managerial techniques such as brainstorming, forums, etc.
The internal environment, which concerns all factors influencing the
manner in which organisations manage risk, includes but are not
limited to the following:
o Organisational processes, structures and roles.

264
o Standards, guidelines, policies, procedures, frameworks and
models used by the organisation.
o Organisational culture including ethical values and management’s
operating style.
Documenting their understanding of the internal environment using
the organisational business information system.
Identifying and assessing the external environmental factors through
e.g. industry discussions, applied research, etc.
The external environment, which concerns the
expectations/requirements of external stakeholders that should be
complied with, e.g.:
o Legal and regulatory requirements.
o Social, cultural, economical, competitive, and technological
environment.
o Stakeholder expectations (e.g. suppliers, clients, etc.).
Documenting their understanding of the external environment by
using the organisational business information system.
7.4.1.2 Defining objectives
Organisational processes and risk management activities are underpinned
by the following key elements which should be defined and documented
by executive management, the risk task team or the designated party:
Organisational focus: Organisational focus encompasses
organisational objectives and strategy determined in the planning
phase, as discussed in the SME risk management framework (refer
to Paragraph 7.5.1.1). These objectives are cascaded downward into
departmental/functional objectives. The risk elements discussed in
the SRC phase may be used to guide owner-managers in
determining functional processes (and setting functional objectives)
that need to be managed.
Risk management focus: The risk management focus consists of
the following activities:

265
o To determine the positioning of the risk management function within
the organisation.
o To define the objectives and methodology of the risk management
process. Consideration should be given to the inclusion of risk
knowledge in organisational decision-making.
o To determine how positive risks can be channelled back to strategy
and objectives.
o To determine the scope of the risk management process including
specific process/area inclusions and exclusions.
o To determine risk management leadership. Responsibility and
accountability for the risk management process should be
defined, including risk reporting lines.
o To determine how the effectiveness of the risk management
process can be assessed.
7.4.1.3 Resource requirements
Based on the scope of the risk management process, SME executive
management, the risk task team or designated party should determine and
document the risk management process resource requirements by
considering the following:
Personnel availability and know-how.
Time requirements in terms of scheduling risk meetings/workshops
(risk planning, action, and feedback workshops/meetings).
Information system requirements in identifying risks, implementing
controls, reporting of deviations and follow-up activities.
Risk communication mechanism, e.g. informal discussions, company
newsletter, etc.
Technology requirements, e.g. use of spreadsheets to support risk
management activities, and/or the compiling of an organisational risk
profile.
The use of risk registers to capture risk data and action, as well as
the format of the risk registers.

266
7.4.1.4 Risk criteria
SME executive management, the risk task team or the designated party
should define and document the risk criteria to be used in assessing risk.
The risk criteria will include:
Type of risks that impede/may impede on organisational objectives.
Affirming that risk consists of both positive and negative uncertainties
that might influence the achievement of objectives.
The risk measurement criteria to be used, e.g. a classification system
of ‘High/Medium/Low’ to be used, or numbers ranging from 1 to 10,
with 1 as ‘extremely rare/negligible’ risks and 10 as ‘almost
certain/catastrophic’ risks.
Defining risk materiality, i.e. defining when risk is important.
Risk timeframe applicable to risk impact and risk probability, i.e.
when is risk expected to occur, e.g. next month, next year, etc.
Risk terminology clarification, i.e. use of terms such as
impact/consequence/effect and probability/likelihood/frequency.
The level of acceptable risk, i.e. the risk tolerance level of the
organisation, which will be used to direct the flow of organisational
resources.
The use of a simplex or complex risk view, i.e. should risks be
viewed in isolation or should multiple risks or combination risks be
considered.
7.4.2 Risk decisions
The fundamental principles defined in the risk context and strategy
process are extrapolated into the risk decision process where risk actions
are taken to address uncertainty, which impacts on organisational
objectives. The risk decision process consists of the subprocesses of risk
identification, risk analysis, risk evaluation, risk response and action
planning as depicted in Figure 7.8.

267
Figure 7.8: The risk decision process.
7.4.2.1 Risk identification
In the risk identification process, risk problem structuring occurs along with
the creation of organisational risk information through the development of
a historic risk database, based on realised risks, and a risk register that
formalises the anticipated current and future risks. A thoroughly planned,
well-executed risk identification process is of pivotal importance, as
unidentified risks may escalate into unmanageable risks with
unmanageable risk consequences.
The executive management, risk task team or designated party is tasked
with the following activities during the risk identification process:
Risk environment and risk effect: All risks should be identified in the
internal, external or combined environment regardless of whether the
source of the risk is under the control of the organisation. Macro and
micro risk identification should occur whereby significant/main risk sources
and the subsources of risks within these main risk areas are identified.
The identification of the risk effect, i.e. the risk’s impact on other
organisational areas, processes and risks, should be considered.
Risk analysis Risk assessment

268
Risk approach: The ultimate responsibility for risk identification will most
likely be the owner-manager as he/she has a comprehensive knowledge
of all of the organisational processes and activities. It is important that the
risk identification process follows a dualistic approach, whereby a strategic
top-down approach as well as a bottom-up approach to risk identification is
taken. This entails managerial involvement whereby management is
concerned with strategic risk identification and lower level employees
contribute towards the identification process by identifying process/activity
ground-level risks they experience or anticipate through employing
managerial techniques such as questionnaires, workshops and the use of
Control Self Assessments (CSA). A key element in the success of the
dualistic risk identification approach is based on an effective interface
between the top/bottom approach whereby all risk information is
assimilated and risks gaps identified, i.e. risks areas not addressed.
Develop risk information database: The information database should
consist of historic risk information and current and future risk information.
Historic risk identification: o Develop a risk history database: A risk history database (see
Table 7.1), is a database which should be used by
management to assess possible risks when forecasting future
projects.
o Information gathering: Information can be gathered by way of an
analysis of past events by a panel of experts, e.g. owner-
managers, senior managers and employees with a thorough
organisational knowledge.
o Risk history database composition: Historically realised risk
events, including opportunities, are captured in a risk history
database specifying:
Risk source: Classify the risk source with reference to the
risk elements defined by management.
Risk description: A description of the realised risk event.
Primary area: The area(s) directly impacted by the risk.
Secondary area: The area(s) indirectly impacted by the risk.

269
Risk impact: The effect/impact of the realised event on
organisational activities/processes.
Risk severity: Quantification of the risk impact.
Control failure: A description of the preventative control
failure (if any controls in place).
Risk detection: The method by which the risk is detected.
Risk response: The actions taken in response to the risk.
An example of a risk history database is depicted in Table 7.1. Table 7.1: An example of a risk history database. Risk history database extract: January 2009 – December 2009
RISK SOURCE RISK
DESCRIPTION
PRIMARY
AREA
SECON-
DARY AREA
RISK IMPACT RISK SEVERITY CONTROL FAILURE RISK DETECTION RISK RESPONSE
Internal: security Theft of
stock – 5
Dell
notebooks
Finance Organisational
climate –
employee
moral
Affect store sales,
performance
bonus payouts
High – loss R25000 Store room not locked Monthly inventory
count
Store room locked,
key register
implemented
Combined:
reputation
9 defective
Ipods sold
Reputation Finance,
legislation
Customer
goodwill
jeopardised,
cashflow
affected due to
legislative action
taken against
manufacturer
High – loss of
goodwill not
quantifiable. Legal
cost: R50 000.
No quality checks upon
receiving inventory
Client complaints,
product returns
Quality inspection
certificate required
from manufacturer
before acceptance
of goods
Fictitious data, for illustration purposes only
Present and future risk identification: o Develop a risk register: A risk register should be used by
management to monitor current and anticipated future risks that
may influence the achievement of objectives. o Information quality: Attention is directed to the quality of
information as good quality information is fundamental in the
development of a risk register, identifying all possible risks and
opportunities. o Managerial techniques: A management technique that can be
used in identifying opportunities and threats is a SWOT
(Strength, Weakness, Opportunity, Threat) analysis.
Information gathering/evaluating sessions on current and future

270
operations, activities, etc. can be executed by various methods,
e.g. workshops, scenario analysis, industry benchmarking,
industry survey, judgements from the project team or
management. o Risk register composition: The risk and opportunity information
gathered should be used to populate a risk register (refer to
Table 7.2). Table 7.2: An example of a risk register – level 1. Risk register extract: updated December 2010
RISK SOURCE
RISK DESCRIPTION
AFFECTED AREA
RISK DRIVER RISK CHARACTER
OBJECTIVE/ CSF
Internal:
business
process
Unauthorised/
excessive
discount given
Sales Unethical staff /
insufficient
supervision
Delay Total sales to grow by
9% per year
Combined:
business
continuity
Business
standstill due to
electricity
shortages
Sales/
procure-
ment/
finance
Powercuts by electricity
provider / no UPS for
business
Obstruct Efficient service
delivery / effective
organisational
processes
Fictitious data, for illustration purposes only
A risk register should reflect the following:
Risk source: Classify the risk source with reference to the
risk elements defined by management. Risk description: A description of the potential risk event. Affected area: The primary organisational area where the
risk may occur. Risk driver: A description of the possible event that
creates/drives the risk. Risk characteristic: The effect of the risk on organisational
objectives or the Critical Success Factors (CSF) that drive
the achievement of objectives. Classification can be made
accordingly to (a) create opportunities for achieving
objectives; (b) enhance the achievement of objectives; (c)
delay the achievement of objectives; and (d) obstruct the
achievement of objectives.

271
Objective or CSF: The objective or CSF that may be
affected by the risk/opportunity.
It is important that the risk identification process should be carried out on a
continuous basis as the risk environment changes constantly. The register
should at all times reflect the current anticipated risks in organisational
activities, thus new risks should be added continuously and risks judged
not relevant, should be removed from the register. The continuous risk
identification process facilitates organisational risk awareness guiding
SME owner-managers in their decision-making processes. The risk
identification process flow is schematically depicted in Figure 7.9.
ESTABLISH RISK TASK TEAM: Managerial task team Employee task team
COMMUNICATE PRIOR ESTABLISHED RISK CRITERIA

272
is important that the risk identification process is carried out on a
7.4.2.2 Risk assessment
DETERMINE RISK IDENTIFICATION TECHNIQUE: CSA Workshops Brainstorming Questionnaire
MANAGERIAL TASK TEAM – MACRO AND MICRO RISK IDENTIFICATION OF STRATEGY & OBJECTIVES: Realised risks:
identified i.t.o. risk database requirements
Current & future risks: identified i.t.o. risk register requirements
LOWER-TIER EMPLOYEE TASK TEAM – PROCESS/ACTIVITY/ WORK FLOW RISK IDENTIFICATION: Realised risks:
identified i.t.o. risk database requirements
Current & future risks: identified i.t.o. risk register requirements
JOINT RISK TASK TEAM TO ASSIMILATE RISK IDENTIFICATION INFORMATION
POPULATE RISK HISTORY DATABASE
POPULATE RISK REGISTER
CO
NTI
NUO
US
PRO
CES
S
ORG
AN
ISATIO
NA
L RISK AW
AR
ENESS
Figure 7.9: Risk identification process flow.

273
Risk information gathered in the risk identification process is extrapolated
into the risk assessment processes as depicted in Figure 7.10, consisting
of risk analysis, risk evaluation and risk prioritisation.
Figure 7.10: The risk assessment process.
Taking cognisance of data availability for SMEs and the quality of SMEs’
information systems, a qualitative risk analysis and assessment technique
are proposed to be executed by executive management, the risk task team
or designated party.
RISK TASK TEAM RESPONSIBLE FOR: • Risk analysis • Risk evaluation • Risk prioritisation
DURING RISK ANALYSIS, DETERMINE: Risk cause Risk duration Risk life cycle Risk interrelationships Affecting factors Risk volatility
DURING RISK EVALUATION, DETERMINE: Risk probability Risk impact Classification
consistency
DURING RISK PRIORITISATION, DETERMINE: Risk profile Risk rating
RISK TASK TEAM OR DESIGNEE TO POPULATE THE RISK REGISTER
COMPILE RISK MATRIX DEPICTING HIGH/MEDIUM/LOW RISKS

274
Risk analysis: The risk analysis subprocess is critical in the
information flow of the risk management process, as it provides input
for decision-making in the risk evaluation and risk treatment process.
The risk characteristics should be analysed through brainstorming,
personal and corporate experience, or any other appropriate
technique, by determining:
o Risk cause: The cause of the risk. o Risk duration: E.g. business disruption for 3 days.
o Risk life cycle: The risk consistency.
o Risk interrelationships: The positive and negative consequences
if the risk is realised, considering the interrelationships of the
risk.
o Affecting risk factors: The factors that may affect the risk
consequence and/or the risk possibility.
o Risk volatility: The risk’s sensitivity to assumption. Refer to Table
7.3 for an example of a risk volatility calculation.
Table 7.3: Risk volatility calculation
Assumption sensitivity rating (ASR)
scale:
Volatility classification (VC) scale:
1 High High Range 18 – 27
2 Medium Medium Range 6 – 12
3 Low Low Range 1 - 4
Risk A (consisting of three assumptions before realisation):
ASR 1 (assumption A) x ASR 2 (assumption B) x ASR 1 (assumption C) = VC 2
Conclusion: The realisation of risk A can be predicted with relative certainty.
Risk evaluation: The SME risk evaluation process should consist
of the following activities:
o Probability: The probability (also termed likelihood or frequency) of
the risk occurring. The probability rating is reflected in the risk
volatility rating value.

275
o Impact: Determine the impact (also termed ‘effect’ or ‘severity’ or
‘consequence’), the risk will have on the organisation as well as
all stakeholders. The monetary amount of the loss as well as
the duration of the risk (as determined in the risk analysis
process) will significantly influence the severity of the risk, as
large monetary losses over a short period of time are more
difficult to manage compared to losses spread over a longer
time period.
o Classification consistency: The risk classification system used for
measuring risk probability and risk impact should be consistent,
i.e. if ‘High/Medium/Low’ is used to classify probability, the
same rating scale should be applicable for measuring risk
impact.
Risk prioritisation: The risk prioritisation process enables SMEs to
direct their focus and risk treatment resources. The SMEs’ risk focus
is therefore determined by the degree of disruption caused by the
risk, considering amongst others, the organisation’s risk appetite,
legal implications and exposures, the organisation’s capacity for
enduring losses, social and reputational implications. In the risk
prioritisation stage, the following should be considered: o Risk rating: Determine the risk score by multiplying the probability
with the impact rating. This rating will be used to prioritise the
risk according to risk importance.
o Establishing SME risk profile: Based on the risk score, risks
should be grouped into risk categories as determined in the risk
classification stage, e.g. high probability / high impact, high
probability / low impact, etc. Strategies will be devised in
addressing these risks in the risk response stage based not
only on the risk grouping, but also on the number of resources
needed to manage the risk.
Risk assessment output: A graphical depiction of the risk
assessment process, highlighting areas of high, medium and low

276
importance should be compiled. SME risk focus should be directed at
the risks as categorised according to the risk character, to facilitate in
the allocation of scarce resources, i.e. all risks obstructing the
achievement of goals, or CSF should be grouped in one risk register.
For example: level 2 risk register – risks obstructing the achievement
of objectives; level 3 risk register - risks delaying the achievement of
objectives; level 4 risk register – risks enhancing the achievement of
objectives; and level 5 risk register – risks creating organisational
opportunities. Refer to Table 7.4 for an example of a risk register that
depicts the risk assessment process results.

277
Table 7.4: Risk register – level 2.
RISK REGISTER LEVEL 2 - UPDATED DECEMBER 2010
Risk
number
Risk description VC (*) Probability (P)
(H/M/L)
Impact(I)
(H/M/L)
Risk score
(P x I)
Risk priority Control (**) Control rating
(***)
Residual risk
(****)
1 Business standstill due to
electricity shortages
Low Low High Medium 1 None 3 Medium
* Refer to volatility classification calculation
** Refer to existing internal controls
*** Refer to effectiveness of internal controls
**** Refer to remaining risk after control action has been taken
RISK REGISTER KEY: Probability (P) Impact (I)
Scale Description Scale Description
High – 3
Medium – 2
Low – 1
Very likely
Likely
Unlikely
High – 3
Medium – 2
Low – 1
Severe risk effect
Moderate risk effect
Minor risk effect
Risk score Control rating
Scale Description Scale Description
High (6 – 9)
Medium (3 - 4)
Low (1 – 2
High risk area requiring immediate attention
Medium risk area requiring attention
Low risk area, monitoring will suffice
1
2
3
Effective
Partially effective
Ineffective

278
VOLATILITY CLASSIFICATION CALCULATION (VC)
Risk number per
risk register level 2
Assumption 1 ASR1 Assumption 2 ASR2 Assumption 3 ASR3 Assumption 4 ASR4 VC Rating
(ASR1xASR2xASR3ASR4)
(1) High electricity
demand
2 Ppower
station not
operating at
full capacity
1 Other
electricity
providers
unable to meet
demand
2 - - Low
VOLATILITY CLASSIFICATION CALCULATION TABLE KEY:
Assumption sensitivity rating (ASR) Volatility classification (VC)
Scale Description Scale Range
1
2
3
High
Medium
Low
High
Medium
Low
18 – 24
6 – 12
1 - 4

279
7.4.2.3 Risk response and action planning
Risk response decisions consist of the process in terms of which options
to modify (or accept) risks are developed and implemented through risk
action plans by the risk task team and/or line management, with the
support of executive management. The following risk response and action
planning steps are proposed: Identify risk treatment options: The risk treatment options
available for selection should be determined. Risk treatment
techniques can be categorised as ‘operational’ techniques and
‘finance’ techniques.
o ‘Operational’ techniques alter the risk exposure and consist of:
Risk avoidance: The organisation does not engage in the
activity/process, and terminates all relations with
stakeholders who engage in this activity. Risk avoidance is
impractical except in addressing catastrophic events.
Risk mitigation: Controls are introduced, which reduce the
probability of the risk occurring and/or the risk
consequences. The type of controls that may be
embedded in such processes are (a) preventative controls,
(b) detective controls, and (c) corrective controls. Risk retention: Accepting the risk consequences based on
the risk priority rating, e.g. extremely low probability,
negligible impact, based on the parameters set by the risk
tolerance.
Risk transfer: The risk exposure is transferred through the
use of subcontractors, outsourcing, etc.
Risk enhancement: The risk may be increased to optimise
an opportunity.
o Risk ‘financing’ techniques provide funding for losses, reduce the
risk consequences and consist of:
Internal funds: Reserves, provisions, etc.

280
Combined funding: A combination of internal and external
funds, e.g. a reduction in insurance premium is offered if
the insured agrees to an excess payment.
Transfer funding: The risk is transferred to a third party,
e.g. commercial insurance.
Evaluate risk treatment options: The appropriate responses to
identified risks are developed, consisting of the following activities:
o Evaluation of existing control mechanism
Determine the efficiency and appropriateness of existing
internal controls. Determine whether the controls (a) eliminate, (b) reduce, (c)
delay, or (d) detect the risk.
Rate the control’s effectiveness using a control rating. If internal controls are effective and the residual risk is at an
acceptable level, risk monitoring actions will suffice. o Risk justification
Compare the cost of addressing the risks with the anticipated
benefit of controlling the risk. The cost should not
outweigh the potential benefit. Take cognisance of the risk’s effect on legal requirements,
social expectations, market implications, etc. Take cognisance of the risk tolerance of the organisation, i.e.
the level of risk the organisation is willing to accept before
resources are expended in addressing risk. o Risk response
Select the appropriate risk treatment per risk identified. The
risk response option selected can be applied individually
or a combination of treatment options can be used. Determine if new risks are created by the risk treatment
option selected. Manage the new risk as part of the
original risk.

281
o Residual risk and control risk: Residual risk is the risk remaining
after risk response actions have been taken. In addressing
residual risk, management should: Evaluate the residual risk level and determine if it is within
the risk tolerance limit.
Implement new risk treatment options if the residual risk level
is above the acceptable threshold. Review the new treatment options and evaluate if the
residual risk is within the risk tolerance range. Continue
with this process until the level of risk is acceptable. Control risk is the risk which arise should risk controls fail.
Management/the risk task team should:
Continuously monitor controls to determine their
effectiveness. Prepare and implement risk action plan:
o Reactor: Identify and document the individual or group responsible
for the ownership of the risk. o Risk response and residual risk: Document the risk response and
residual risk as determined in the preceding subprocess. o Risk response priority and timing: Determine and document the
priority in which risk responses should be implemented. One
should be guided by the risk priority as determined in the risk
assessment process, as well as the anticipated timing of the
risks, i.e. risks that are expected to occur first, should be treated
before addressing risks that might realise at a later stage. o Risk follow-up: A responsible individual or group must be assigned
the responsibility to following up and report on the risk response
actions. o Execute risk actions: Execute risk response according to risk
priority.
The proposed risk response and action planning process are
schematically depicted in Figure 7.11.

282
7.4.3 Communication
YES
NO
IDENTIFY RISK TREATMENT OPTIONS AVAILABLE TO ADDRESS IDENTIFIED RISKS
OPERATIONAL TECHNIQUES: Risk avoidance Risk mitigation Risk retention Risk transfer Risk
enhancement
FINANCE TECHNIQUES: Internal finance External finance Combination of
internal and external finance
EVALUATE AND SELECT RISK TREATMENT OPTIONS FOR IMPLEMENTATION
EVALUATE EFFECTIVENESS OF EXISTING CONTROLS
DETERMINE RISK ACTION JUSTIFICATION
SELECT INDIVIDUAL OR COMBINATION OF RISK RESPONSE
EVALUATE LEVEL OF RESIDUAL RISK
RESIDUAL LEVEL ACCEPTABLE?
PREPARE AND IMPLEMENT RISK ACTION PLAN
IDENTIFY & DOCUMENT REACTOR
DETERMINE & DOCUMENT RISK RESPONSE PRIORITY AND TIMING
POPULATE RISK REGISTER AND EXECUTE RISK RESPONSE ACTIONS
Figure 7.11: Schematic depiction of risk response and action planning process.
NO

283
In the SME risk management process (refer to Figure 7.6), the
communication subprocess is depicted as a separate activity that must be
undertaken in managing organisational risk. This subprocess of communication is however embedded in all risk management activities,
and is pivotal in assuring risk accountability and ownership. It is proposed
that the following actions with respect to communication be undertaken by
executive management, the risk task team or designated party: Develop an internal and external communication and
consultation plan.
The internal communication and consultation plan should comprise of
the following activities:
o Establish a communication process for interactive (two-way)
consultation with internal stakeholders, e.g. monthly risk forums
discussing risks, risk factors, risk effects and risk treatment
options.
o Establish a reporting structure, whereby risk information derived
from the risk management process, is communicated timeously
to appropriate parties. This include key elements of the risk
management framework, as well as any modifications made to
the framework.
o Establish a reporting structure whereby the effectiveness of the risk
management process (as determined in the monitoring, review
and continuous improvement process) is communicated to the
appropriate parties on an ongoing or periodic basis.
The external communication and consultation plan should comprise
the following activities:
o Establish a communication process for interactive (two-way)
consultation with external stakeholders, e.g. quarterly
scheduled meetings to exchange information to address risks,
risk factors, risk effects and risk treatment options.
o Establish a crisis communication strategy facilitating immediate
information exchange.

284
o Establish a communication strategy whereby timeous and
appropriate feedback on information exchange with external
stakeholders is given to relevant internal parties.
o Formulate a communication evaluation mechanism, whereby
external communication is scrutinised for compliance with legal
and regulatory requirements.
Develop and implement a risk information system. This system
should be used to capture, analyse, consolidate, store and report risk
information. The risk information captured, analysed, consolidated
and reported by the risk information system should have the following
attributes:
o Reliable: It should be the best attainable information using
appropriate techniques (IIA, 2010:Online).
o Sufficient: It should be factual, adequate and convincing (IIA,
2010:Online).
o Relevant: It should be consistent with the organisational objectives
(IIA, 2010:Online).
o Useful: It should assist the organisation in meeting its goals (IIA,
2010:Online).
o Accurate: It should be factually correct.
o Timely: Information should be reported without any long delay to
maintain relevance.
7.4.4 Monitoring, review and continuous improvement
The final stage of the risk management process depicted in Figure 7.6,
consists of monitoring, review and continuous improvement activities,
whereby the effectiveness of the risk management actions are evaluated
and assessed in terms of relevance to the changing external and internal
environment, and continuous improvement activities promoted. The
following monitoring, review and continuous improvement process is
proposed for execution by executive management, the risk task team or
the designated party:

285
Assign responsibility: Responsibility should be assigned for
monitoring and review actions over the entire risk management
process. Responsibility may be assigned holistically for the entire
process, or segmentally per activity or department, or in any manner
as deemed appropriate. However, if the responsibility is segmented,
consolidation of monitoring and review activities should occur with
the overall responsibility vested in one individual or team.
Establish information flow: Information should be channelled top-
down and bottom-up to enable senior management, the risk task
team or the designated party to assess this risk information as well
as empower the employees closest to the risk, to take action.
Identify and select monitoring and review techniques: Identify all
possible monitoring and review techniques that are appropriate to the
enterprise, for example internal audit, external audit, regular
reporting, systems testing, etc.
Determine timing: Monitoring, review and continuous improvement
activities should be scheduled throughout the entire risk
management process on a regular basis. This may be supplemented
by ad hoc special investigations into the effectiveness of the risk
management process.
Assess control effectiveness: Effectiveness is measured in terms
of meeting the process/departmental/organisational objectives. The
effectiveness of internal control design and operation, as well as the
effectiveness of each of the risk management activities/procedures,
should be assessed.
Organisational and environmental change assessment:
Sustained focus should be directed at identifying changes in the
organisational and external environment in terms of emerging risks,
changes in risk character, changing risk priorities and changes in risk
action.
Control enhancement: Ineffective controls identified in assessing
control effectiveness actions and organisational and environmental
change assessment actions should be revised, enhanced and re-
implemented to facilitate continuous improvement.

286
Event optimisation: Analyse the effect of realised risk events, and
include this knowledge in the risk management process.
Report: The results from the risk monitoring and review activities,
including the progress in implementing risk treatment options,
should be captured and reported in the risk register or appendixes
thereto.
The monitoring, review and continuous improvement process, which
should be operationalised within the organisational environment as well as
within the risk management process, is graphically depicted in Figure 7.12.

287

288
Figure 7.12: Placement of the monitoring, review and continuous improvement activities in the organisational environment and risk management process.
IMPROVEMENTS NOT
REQUIRED
IF IN NEED OF
IMPROVEMENTS
INFORMATION FLOW IN ORGANISATIONAL ENVIRONMENT
STRATEGIC LEVEL
FUNCTIONAL LEVEL
MONITORING, REVIEW AND CONTINUOUS IMPROVEMENT ACTIVITIES
ASSIGN RESPONSIBILITY
ESTABLISH INFORMATION FLOW
IDENTIFY AND SELECT MONITORING AND REVIEW TECHNIQUES
DETERMINE TIMING
ASSESS EFFECTIVENESS OF CONTROLS
ORGANISATIONAL & ENVIRONMENTAL CHANGE ASSESSMENT
EVENT OPTIMISA-TION
CONTROL IMPROVE-MENTS
RE
PO
RTI
NG
A SIMPLIFIED VIEW OF THE RISK MANAGEMENT PROCESS
RISK CONTEXT AND STRATEGY: Organisational
environment Defining objectives Resource
requirements Risk criteria
RISK DECISIONS: Risk identification Risk assessment Risk response and
action planning
COMMUNICATION: Internal and external
communication and consulting plan
Risk information system
MO
NIT
OR
ING
, RE
VIE
W A
ND
CO
NTI
NU
OU
S
IMP
RO
VE
ME
NT

289
7.5 SME RISK MANAGEMENT FRAMEWORK
The SME risk management framework as depicted in Figure 7.13,
provides SME management with an approach to effectively deal with risks
at all organisational levels, thereby facilitating the achievement of
organisational objectives through effective risk planning, risk
implementation and risk evaluation processes.
Figure 7.13: The SME risk management framework.
Organisational, departmental, and individual performance measurement
are supported by the risk management framework through (a) mapping
performance measurement indicators to the risk management framework
results, and (b) evaluating its achievement.
7.5.1 SME risk management framework components
The value-adding capabilities of the SME risk management framework is
derived from the underpinning four pillars that support the framework,
namely planning, implementation, results and measurement. The four
pillars or components of the framework are graphically depicted in Figure
7.14.

290
PLA
NN
ING
IMPL
EMEN
TATI
ON
RES
ULT
S
MEA
SUR
EMEN
T
SME RISK MANAGEMENT FRAMEWORK
Organisational environment Organisational objectives & strategy Departmental objectives and policies Risk context and strategy Risk elements
Risk context and strategy * Risk decisions Communication Monitoring, review and continuous improvement
Stakeholder satisfaction Reliable business information Business continuity Improved risk profile Safeguarding of assets Efficient operations Competitive advantage Alignment of risk appetite and strategy
Customer complaints Employee survey Timeliness of reporting Accuracy of reporting Operational standstill – number of days Unforeseen events occurring Grading of departmental risks Number of thefts/fraud Cost reduction Increase in revenue New ventures Increased clientele Risk grading of activities entered into
* Risk context and strategy are discussed under the SME risk management process to effect a better understanding of the initial stage preceding the risk decision process. However, the risk context and strategy phase resorts under the planning phase and provides the foundation for all risk activities to follow.
Figure 7.14: The risk management framework components.

291

292
7.5.1.1 Planning
The planning phase underpins all activities in the SME risk management
framework. The following should be addressed by SME executive
management:
Evaluate organisational environment: Evaluate and develop an
understanding of the organisation’s internal and external
environment. The understanding includes but is not limited to an
evaluation of the competitive, social, regulatory and financial
environment as well as the development of an understanding of the
organisation’s strength and weaknesses, the organisation’s
information systems, established policies and procedures,
stakeholder relationships, and the organisation’s ethical environment.
Formulate organisational objectives and strategy: Develop
organisational long-term objectives aligned with the organisation’s
risk appetite and its vision and mission. A strategy should be
selected to facilitate achievement of the stated objectives.
Objectives, whether organisational or departmental, should include
measurable performance indicators to evaluate the effective
achievement thereof.
Formulate departmental objectives and policies: Departmental
objectives should be formulated in alignment with the organisational
objectives, along with policies and plans to provide guidance in the
execution of the objectives. Risk context and strategy: As discussed in Paragraph 7.4.1, the
risk context and strategy encompass the following:
o The establishment of the risk management policy. o The formulation of objectives as discussed in ‘Formulate
departmental objectives and policies’. o Determining the risk management focus that includes the
positioning of risk management within the organisation. o Assigning responsibility for risk processes. o Determining the resource requirements. o The formulation of the risk criteria used in assessing risk.
293
Risk elements: Risk elements emanate from internal, external or a
combination of internal/external risk sources posing a deterrent to
organisational success. Management should determine the risk
element most applicable to its organisation in order to direct risk
management action. Refer to Paragraph 7.3 for a detailed discussion
on risk elements.
7.5.1.2 Implementation
Executive management, the risk task team or the designated party is
responsible for the implementation phase that entails the execution of the
risk management process as extensively discussed in Paragraph 7.4. The
implementation phase consists of the following activities:
The identification of risks that might impede on the achievement of
objectives.
The evaluation and risk classification of risks in terms of frequency
and impact.
The development and implementation of appropriate risk responses.
Communication, embedded in all risk management activities,
consists of:
o The development of an internal and external communication and
consultation plan.
o The development and implementation of a risk information system.
The monitoring and review of risk management actions to facilitate
continuous improvement.
7.5.1.3 Results
The results phase may also be termed the ‘risk action consequence’,
consisting of key performance indicators indicating the achievement of
departmental and organisational objectives as defined in the planning
phase. The SME objectives highlighted in Figure 7.14 namely:
Stakeholder satisfaction,
reliable business information,

294
business continuity,
improved risk profile,
safeguarding of assets,
efficient operations,
competitive advantage, and
alignment of risk appetite and strategy;
are the most prevalent motivations and benefits according to the
conducted survey (see Chapter 6) and literature review (Chapters 2 – 4),
however it may differ in terms of the mission and vision of the SME.
The following actions should be taken by the SME executive management
in determining the risk action consequence applicable to their SME:
Assess the given results and determine whether they align with the
SME’s objectives.
Make the necessary adjustments to the results.
Assess and confirm the measurability of the results.
7.5.1.4 Measurement
The SME executive management should assess the effectiveness of the
planning and risk management actions in meeting the stated objectives.
In measuring the adequacy of the actions taken, management can use
any formally defined performance measurement model or framework such
as the balanced scorecard; or any informal, in-house designed
performance measurement system. The following actions should be taken
by executive management in the measurement phase:
Determine the measurement indicator(s) for each objective, i.e.
desired outputs as determined in Paragraph 7.5.1.3.
Assign responsibility for the evaluation of the indicators.
Determine the frequency of performance assessments for each
indicator.
Ensure the adequacy of the performance measurement system used
in terms of documenting information and reporting information in a

295
timeous and appropriate manner to the appropriate level in the
organisation.
The measurement indicators depicted in Figure 7.14, can be mapped to
the desired outputs provided in the results phase.
7.5.2 Application of SME risk management framework
The SME risk management framework provides a structured approach to
micro- and small enterprises to effectively manage their risks. Although
medium enterprises are excluded from the research, larger enterprises are
not prohibited to adjust and apply a similar structured risk management
framework.
Due to the diverse nature of SMEs, this framework was developed to
primarily address the needs of organisations in the retail sector. The
retail-directed focus is prominent in the planning phase of the framework,
where the SME risk elements were proposed that generally pose the
greatest number of risks to micro- and small enterprises. Although the
risk elements are provided, it does not absolve SME owner-managers
from the critical tasks of evaluating the given risk elements in the context
of their organisational setting, and adjusting the stated elements to reflect
the risks impeding on their specific organisational objectives.
The third phase of the framework, namely the results phase, highlights the
preferred achievements of effective risk management actions in retail
SMEs according to the cited literature sources and survey results. The
proposed achievements should however be assessed by executive
management and adjusted according to the specific SME objectives.
Changes in the results phase will directly affect and thus change the
performance evaluation criteria as proposed in the measurement phase,
as the listed performance evaluation criteria are related to the desired
achievement. SME owner-managers can adjust the performance
indicators to include any appropriate indicator that complies with the
following criteria:

296
The performance indicator should be measurable.
The performance indicator should be directly related to the specified
results objective.
The four phases of the SME risk management framework as depicted in
Figure 7.14 imply a sequential approach to risk management with phase
one consisting of ‘Planning’, phase two ‘Implementation’, phase three
‘Results’, and phase four ‘Measurement’. However, actions within the
different phases can occur simultaneously, or for that matter in a different
order, depending on the specific circumstances of the SME. This
framework does not purport a rigid risk management approach, as its
guidance-providing values flow from its adaptability to any micro- and
small retail enterprise.
7.6 HYPOTHESIS, SUBQUESTIONS AND OBJECTIVES RE-VISITED
The research hypothesis, subquestions and objectives are revisited and
discussed based on the extensive literature review conducted and the
results obtained from the analysis of the survey data.
7.6.1 Subquestions
The following subquestions in support of the research hypothesis were
posed in this study:
“Does a general absence of risk management knowledge by SME
owners, adversely impact on the risk efficiency of SMEs?” Survey
results indicate that SMEs who follows a structured risk management
approach have a clear understanding of risks impacting on their
business structure and processes. It was furthermore empirically
proven that the absence of a structured risk management approach
has an adverse effect on the risk efficiency of SMEs.
“To what extent can a small organisation like an SME successfully
adopt a structured approach to risk management?” and

297
“Can a structured approach to risk management, which normally
encompasses complex mechanisms, be formulated within SMEs in
terms of simplicity and ease of application?” Given the size and
managerial structure of SMEs, the process of establishing and using a
strategic risk management function is relatively simple, given the close
relationship between the owners, managers and operators of the
enterprise. It is relatively easy for SME executive management to
embed a risk management policy and be routinely and actively involved
in the application of a strategic risk management policy (Watt, 2007:34-
35). ERM should apply basic risk management activities, embedding
the risk champions, i.e. the owner-manager’s knowledge of exposure
across the entire scope of an enterprises risk, and should not be
reduced to a process based solely on risk formulas (Bradford, 2009:4-
28). Simplistic risk identification should be used in answering
questions such as ‘What, how, and why’. The process should be built
on expertise and incorporate a forward-thinking approach (Watt,
2007:36-40). Evidence has shown that SMEs flourish on their
adaptability and openness towards new ways of working (Berry,
2002:14).
It is evident from the survey results that 44% of enterprises have five or
fewer employees, which imply a more enterprise involved SME owner-
manager. The proposed SME risk architecture model provides a
detailed, yet simplistic process whereby SME owner-managers can
establish a structured risk approach within their SME’s, with relative
ease.
“How can control mechanisms for risk exposure be mapped into a
structured approach to risk management, to effectively control risks of
SMEs?” Control mechanisms are incorporated in phase 2 ‘SME risk
management process’ of the proposed SME risk architecture model.
Within the SME risk management process, the subprocess of ‘risk
decisions’ deals with the risk control options available to the SME
298
owner-managers based on the defined risk tolerance of their
organisations.
“How can a structured approach to risk management be effectively
implemented within South African SMEs, to the benefit of the industry
as a whole?” Given the importance of SMEs to the local economy with
its ability to provide for the needs of the poor, the use of local
resources and its potential contribution to employment, a structured
approach to risk management can aid in SMEs’ improved
understanding of risk as well as in the formulation of appropriate risk
action contributing towards the survival and success of SMEs.
7.6.2 Research objectives
The research objectives defined in Chapter 1 are discussed as follows:
“Formulate a structured risk model for South African SMEs”.
An SME risk architecture model, incorporating SME specific risk
elements, was developed for use by South African SMEs. The SME
risk architecture model details the activities and processes to be
followed by the SME owner-manager (or designated individuals), in
formulating and embedding a structured risk approach within the SME.
“Determine the level of risk knowledge by SME owner-managers”.
According to the literature review conducted in Chapter 2, 3 and 4,
SME owner-managers over-estimate the importance of external risks
while they under-estimate internal risk factors. Survey results returned
that SME owner-managers rate their level of risk knowledge as
sufficient. However, survey results indicate that their primary area of
risk focus is directed at financial risks.
“To determine the current use of risk management models by SME
owner-managers, and the adequacy of the current risk methodology
applied”. Survey results returned that:

299
o 27% of respondents indicated that they had a complete or partial
risk management framework in place, primarily focused on
financial risks.
o 37,3% of enterprises do not have a risk management
framework, but are planning to implement one.
o 24,6% of enterprises do not have a risk management
framework, and are not planning to implement one.
The adequacy of the current risk management frameworks in place
within SMEs is questionable, as 61.4% of respondents indicated that
their SMEs experienced financial difficulties in the past. This is
reflected in the survival rate of SMEs with the majority of enterprises in
operation for 10 years or less.
“To develop a simplistic risk management model”. A simplistic SME
risk architecture model was developed taking into account:
o The ease of use by an SME owner-manager or designated
individuals.
o The limited resources in terms of time, finance, staff, and
information technology available to SMEs.
o The level of training and education required to effectively embed
this model within SMEs’ activities in order to make this model as
accessible as possible to all SMEs.
“To determine the implementation viability of the proposed formulated
risk management model for South African SMEs, and associated
potential benefits, that can be gleaned from such an application”.
Survey results returned that 60% of respondents without a risk
management framework were interested in using such a framework,
citing profit maximisation, improved customer service, cost reduction
and the safeguarding of assets as motivating factors. Arguably, this
percentage can be improved since the main obstacles to implementing
a risk management framework namely cost, lack of skills or expertise
and lack of formalised processes, are reduced when the proposed
SME risk architecture model is used.

300
7.6.3 Research hypothesis
As a result of the research findings of this thesis, the research hypothesis
which nedds: “A structured approach to risk management for South African
SMEs would significantly limit their risk exposure, and improve the risk
efficiency of the industry”, is herewith ‘accepted’.
7.7 FINAL CONCLUSION
Organisational success was traditionally measured in terms of the
organisation’s financial achievement. With the collapse of large
established enterprises, nationally and internationally over the last two
decades, it became apparent that a more balanced organisational
perspective should be used by organisations and stakeholders in
evaluating the holistic performance of the enterprise. This need gave rise
to the ‘triple bottom line’ effect, where organisations take cognisance of the
importance of financial achievement in addition to the importance of their
social and environmental impact.
The need for effective holistic management was also echoed in the
establishment and maturity of corporate governance119 codes that
proclaimed principles and in some instances rules, to be adhered to by
organisations in the effective management of their enterprises. It is
evident in these corporate governance codes120 that the importance of risk
management should be escalated to executive management due to the
strategic impact risks may have on an organisation. Although it is usually
the larger enterprises that strive for and report on corporate governance
compliance, smaller enterprises can benefit alike as stakeholder
confidence is greatly increased by a well-balanced, managed enterprise.
119 “Corporate Governance is concerned with the holding of the balance between economic and social goals and between individual and communal goals. The aim is to align as nearly as possible the interest of individuals, corporations and society” (Word Bank Report, 1999. Corporate Governance Overview.) 120 Reference is specifically made in King 3 - South Africa (King III, 2009: Online), the UK Corporate Governance Code (UK Code, 2010: Online) and the Sarbanes-Oxley Act - United States of America (SOX, 2002:Online).

301
The SME risk architecture model can assist smaller organisations in
aligning their activities to achieve corporate governance compliance in
respect of risk management and risk reporting as this model provides
structure to the managerial process to be followed, as well as specific
guidance on SME areas of risk concern. The SME risk architecture model
is therefore not limited to a ‘stand alone’ application, but can be utilised
concurrently with the various corporate governance frameworks, as well as
the organisational performance management system.
302
BIBLIOGRAPHY Abrams, C., Von Känel, J., Müller, S., Pfitzmann, B. & Ruschka-Taylor, S. 2007. Optimized enterprise risk management. IBM Systems Journal, 46(2):219-232. Alsbury, A. 2001. Quick Answers to small business questions. London: Prentice Hall Andersen, K. & Terp, A. 2006. Risk Management. [In: Andersen, T.J. (ed.). Perspectives on Strategic Risk Management. Denmark: Copenhagen Business School Press]. Anderson, R. S.a. Researching risk issues in the 21st century. Balance Sheet, 8(3):40-42. Angela Motsa & Associates. 2004. SMME Finance Sector Background Paper: A review of key documents on SMME finance 1994 – 2004. Report prepared for the FinMark Trust, Johannesburg. [Online]. http://www.finmarktrust.org.za [3/3/2010] AS/NZS 4360 see Australian/New Zealand Standard 4360 Audretsch, D.B. 2000. The Economic Role of Small- and Medium-Sized Enterprises: The United States. Institute for Development Strategies. [Online]. http://www.spea.indiana.edu/ids/pdfholder/ISSN-00-2.pdf [3/3/2010] Australian/New Zealand Standard 4360. 2004. Risk Management. [Online]. http://www/standards.com.au [15/5/2009] Babbie, E. 2005. The basics of social research. Belmont: Thomson Wadsworth. Baker, S., Ponniah, D. & Smith, S. 1999. Survey of Risk Management in Major U.K. Companies. Journal of Professional Issues in Engineering Education and Practice, 125(3), July:94-102. Banham, R. 2004. Enterprising View of Risk Management. Journal of Accountancy, 197(6), June:65-71. Banks, E. & Dunn, R. 2003. Practical risk management. An Executive Guide to Avoiding Surprises and Losses. West Sussex: John Wily & Sons. Barrese, J. & Scordis, N. 2003. Corporate Risk Management. Review of Business, 24(3):26-29. Basel II see International Convergence of Capital Measurement and Capital Standards

303
Beasley, M., Chen, A., Nunez, K. & Wright, L. 2006. Working Hand in Hand: Balanced Scorecard and Enterprise Risk Management. Strategic Finance, March:49-55. Beaver, G. 2002. Small Business, Entrepreneurship and Enterprise Development. Harlow: Pearson Education. Beaver, G. & Prince, A.C. 2002. Innovation, entrepreneurship and competitive advantage in the entrepreneurial venture. Journal of Small Business and Enterprise Development, 9(1):28-37. Beckett, R.C. 2005. Collaboration now a strategic necessity. Handbook of Business Strategy, 6(1):327-332. Bennett, R.J. & Robson, P.J.A. 2004. The role of boards of directors in small and medium sized firms. Journal of Small Business and Enterprise Development, 11(1):95-113. Berger, A.N. & Udell, G. 2001. Small business credit availability and relationship lending: the importance of bank organisational structures. FEDS Working Paper No 2001–36. [Online]. http://ssrn.com/abstact=285937 [10/4/2010] Berkeley, D., Humphreys, P.C. & Thomas, R.D. 1991. Project risk action management. Construction Management and Economics, 9:3-17. Berry, A. 2002. The role of the small and medium enterprise sector in Latin America: implications for South Africa. Unisa Latin American Report, 18(1):4-14. Berry, A., Von Blottnitz, M., Cassim, R., Kesper, A., Rajaratnam, B. & Van Seventer, D.E. 2002. The Economics of SMMES in South Africa. Trade and Industrial Policy Strategies, December 2002. Blanc Alquier, A.M. & Lagasse Tignol, M.H. 2006. Risk management in small- and medium-sized enterprises. Production Planning & Control, 17(3):273-282. Blumentritt, T. 2004. Does small and mature have to mean dull? Journal of Business Strategy, 25(1):27-33. Bologa, J. 2003. Focus on Risk Management. Internal Auditor, 60(4):9. Borgelt, K. & Falk, I. 2007. The leadership/management conundrum: innovation or risk management? Leadership & Organization Development Journal, 28(2):122-136. Bowden, A.R., Lane, M.R. & Martin, J.H. 2001. Triple Bottom Line Risk Management. Enhancing Profit, Environmental Performance, and Community Benefits. New York: John Wiley & Sons.

304
Bowling, D., Julien, F. & Rieger, L. 2003. Taking the Enterprise Risk-Management Journey. Bank Accounting & Finance, 16(2), February:16-22. Bowling, D.M. & Rieger, L. 2005. Success Factors for Implementing Enterprise Risk Management. Bank Accounting & Finance, 18(3), April-May:21-26. Bradford, M. 2009. Sovay turns risk into opportunity. Business Insurance, 43(20):4-28. Briers, S. 2000. The development of an integrated model of risk. A thesis submitted in fulfilment of the requirements for the degree of Doctor of Business Leadership at the University of South Africa. Brink, A., Cant, M. & Ligthelm, A. 2003. Problems experienced by small business in South Africa.[Online]. http://sbaer.uca.edu/research/icsb/2003/230.doc [13/4/2010] Business Dictionary. 2010a. [Online]. http://www.businessdictionary.com/definitions/businessprocesses.html [24/8/2010] Business Dictionary. 2010b. [Online]. http://www.businessdictionary.com/definitions/businesscontinuity.html [24/8/2010] Business Dictionary. 2010c. [Online]. http://www.businessdictionary.com/definitions/strategy.html [24/8/2010] Business Dictionary. 2010d. [Online]. http://www.businessdictionary.com/definitions/strategicobjectives.html [24/8/2010] Business Dictionary. 2010e. [Online]. http://www.businessdictionary.com/definitions/reputation.html [24/8/2010] Business Dictionary. 2010f. [Online]. http://www.businessdictionary.com/definitions/publicrelations.html [24/8/2010] Business Dictionary. 2010g. [Online]. http://www.businessdictionary.com/definitions/information.html [24/8/2010] Business News and Concepts. 2010. [Online]. http://www.businessnewsandconsepts.com/performancemeasures.html [24/8/2010] Cadbury Committee. 1992. Report of the Committee on the Financial Aspects of Corporate Governance. London: Gee.

305
Calandro, J. & Lane, S. 2006. Insights from the Balanced Scorecard – An Introduction to the Enterprise Risk Scorecard. Measuring Business Excellence, 10(3):31-40. Canadian Treasury Board. 1999. Risk Management Policies and Publication. [Online]. http://www.tbssct.gc.ca/pubs_pol/dcgpubs/riskmanagement/siglist_e.asp. [15/5/2009] Carlton, T. 1999. Risk and capital management in non-financial companies. Risk and Capital Management Conference Proceedings, Australian Prudential Regulation Authority. [Online]. http://www.apra.gov.au/RePEc/RePEcDocs/Archive/conference_papers1/risk_capmgt_non_financial_companies.pdf [8/4/2010] Chapman, C. 2001. The Big Picture. Internal Auditor, 58(3):30-37. Chapman, C. 2003. Bringing ERM into Focus. Internal Auditor, 60(3):30-35. Chapman, R.J. 2001. The controlling influences on effective risk identification and assessment for construction design management. International Journal of Project Management, 19(3):147-160. Choueke, R. & Armstrong, R. 2000. Culture: a missing perspective on small and medium-sized enterprise development? International Journal of Entrepreneurial Behaviour and Research, 6(4):227-238. Clarke, G., Eifert, B., Habyarimana, J., Kapery, W., Kaplan, D., Schwartz, M. & Ramachandran, V. 2006. South Africa: An Assessment of the Investment Climate. Paper presented at the TIPS Conference on Accelerated and Shared Growth in South Africa: Determinants, Constraints and Opportunities. 18-20 October. Johannesburg, South Africa. Collis, J. & Hussey, R. 2003. Business Research: A practical guide for undergraduate and post graduate students. New York: Palgrave Macmillan. Combined Code on Corporate Governance. 2003. [Online]. http://www/www.fsa.gov.uk/pubs/ukla/lr_comcode2003.pdf [15/5/2009] Committee of Sponsoring Organisations of the Treadway Commission (COSO). 2004. Enterprise Risk Management – Integrated Framework. Executive Summary. [Online]. http://www.theiia.org/guidance/additional-resources/coso-related-resources/ [19/5/2009] Cooper, D.R. & Emory, C.W. 1995. Business Research Methods 5th Edition. Chicago: Irwin.

306
Cooper, P.S. & Schindler, P.S. 2001. Business Research Methods 7th Edition. New York: McGraw-Hill. Cooper, D.R. & Schindler, P.S. 2006. Business Research Methods 9th Edition. Singapore: McGraw-Hill. Cornwall, J.R. & Naughton, M.L. 2003. Who is the good entrepreneur? An exploitation within the Catholic Social Tradition. Journal of Business Ethics, 2(1):62. COSO see Committee of Sponsoring Organisations of the Treadway Commission Cotner, J.S. & Fletcher, H.D. 2000. Computing the cost of capital for privately held firms. American Business Review, 18(2):27-33. Crouhy, M., Galai, D., & Mark, R. 2006. The Essentials of Risk Management. New York: McGraw-Hill. Cumby, J. & Conrod, J. 2001. Non-financial performance measures in the Canadian biotechnology industry. Journal of Intellectual Capital, 2(3):261-272. Cumming, C. & Hirtle, B. 2001. The Challenges of Risk Management in Diversified Financial Companies. Federal Reserve Bank of New York Economic Policy Review, 7(1):1-17. Cummins, J., Phillips, R.D. & Smith, S.D. 1998. The rise of risk management. Economic Review, 83(1):30. DAET see Department of Environmental Affairs and Tourism DeLoach, J.W. 2000. Enterprise-Wide Risk Management. Strategies for linking risk and opportunity. London: Financial Times Prentice Hall. Department of Environmental Affairs and Tourism (DEAT). 2006. Risk Management, Integrated Environmental Management Information Series 23. Pretoria. [Online]. http://www.deat.gov.za [10/7/2008] De Vos, A.S. 2002. Scientific theory and professional research. [In De Vos, A.S., Strydom, H., Fouche, C.B. & Delport, C.S.L. (ed.). Research at grass roots: for the social sciences and human service professions 2nd Edition. Pretoria: Van Schaik]. De Vos, A.S. & Fouche, C.B. 1998. General introduction to research design, data collection methods and data analysis. [In De Vos, A.S. (ed.). 1998. Research at grass roots: A primer for the caring profession. Pretoria: Van Schaik].

307
Dickinson, G. 2001. Enterprise Risk Management: Its Origins and Conceptual Foundation. The Geneva Papers on Risk and Insurance, 26(3):360-366. Dictionary Reference. 2010a. [Online]. http://dictionary.reference.com/brows/industry [24/8/2010] Dictionary Reference. 2010b. [Online]. http://dictionary.reference.com/brows/technology [24/8/2010] Downing, J. & Daniels, L. 1992. The Growth and Dynamics of Women Entrepreneurs in Southern Africa. GEMINI Technical Report, 47:21. Dunne, N. 1999. The importance of understanding market demand: South African furniture manufacturers in the global economy. CSDS Research Report 22, Centre for Social and Development Studies, University of Natal, Durban. Dupré, A. 2009. Linking risk management to the budgeting process. CMA Management, August/September:16-18. Engle, P. 2009. Enterprise risk management time. Industrial Engineer, 41(5):20. European Commission. 2003. Observatory of the European SMEs. SMEs in Europe 2003. [Online]. http://europa.eu.int/comm/enterprise [3/3/2010] Fatemi, A. & Glaum, M. 2000. Risk Management Practices of German Firms. Managerial Finance, 26(3):4. Federation of European Risk Management Association (FERMA). 2003. A Risk Management Standard. [Online]. http://www.ferma.eu [21/11/2008] FERMA see Federation of European Risk Management Associations Financial Committee of the Institute of Chartered Accountants in England and Wales. 2002. No surprises: the case for better risk reporting. Balance Sheet, 10(4):18-21. Foster, M. 2009. Elevating Risk to Its Proper Place. BusinessWeek Online. [Online]. http://www.businessweek.com/managing/content/aug2009/ca20090814_123416.htm [30/10/2009] Fraser, I. & Henry, W. 2007. Embedding risk management: structures and approaches. Managerial Auditing Journal, 22(4):392-409. Friedrich, C. 2004. Taking it personally: The crucial success factor for small businesses is its entrepreneurs. Finance Week, 51, December.

308
Funston, R. 2003. Creating a Risk-intelligent Organization. Internal Auditor, 60(2):59-63. Gadenne, D. 1998. Critical Success Factors for Small Business: An Inter-industry Comparison. International Small Business Journal, 17(1):36-55. [Online]. http://find.galegroup.com/gtx/start.do?prodId=AONE&userGroupName=capetech [10/11/2009] GCIS. 2002. Government Communications South Africa Yearbook 2001/2002. [Online]. http://www.govza/yearbook/2001/economy [3/3/2010] Georgeliss, Y., Joyce, P. & Woods, A. 2000. Entrepreneurial action, innovation and business performance: the small independent business. Journal of Small Business and Enterprise Development, 7(1):7-17. Ghauri, P., Grønhaug, K. & Kristianslund, I. 1995. Research Methods in Business Studies. New York: Prentice Hall. Glaser, B. & Strauss, A. 1967. The discovery of Grounded Theory. Chicago: Aldine. Goh, S.C. 2002. Managing effective knowledge transfer: an integrative framework and some practice implications. Journal of Knowledge Management, 6(1):23-30. Greenbury, R. 1995. Directors’ Remuneration. London: Gee. Gunasekaran, A., Forker, L. & Kobu, B. 2000. Improving operations performance in a small company: a case study. International Journal of Operations & Production Management, 20(3):316-335. Hampel Committee. 1998. Committee on Corporate Governance, Final Report. London: Gee. Hatcher, L. 1994. A Step-by-step Approach to Using SAS for Factor Analysis and Structural Equational Modeling. Cary, NC: SAS Institute. Henriksen, P. & Uhlenfeldt, T. 2006. Contemporary Enterprise-Wide Risk Management Frameworks: A Comparative Analysis in a Strategic Perspective. [In: Andersen, T.J. (ed.). Perspectives on Strategic Risk Management. Denmark: Copenhagen Business School Press]. Hodge, N. 2002. Power to the people. Internal Auditing and Business Risk, March:18-22. Hofmann, M.A. 2009. Interest in enterprise risk management is growing. Business Insurance, 43(18):14-16.

309
Hollman, K.W. & Forrest, J.E. 1991. Risk Management in a Service Business. International Journal of Service Industry Management, 2(2):49-65. Huang, X. & Brown, A. 1999. An analysis and classification of problems in small business. International Small Business Journal, 18(1):73-85. Hudson, M., Lean, J. & Smart, P.A. 2001. Improving control through effective performance measurement in SMEs. Production Planning & Control, 12(8):804-813. IIA see Institute of Internal Auditors Institute of Directors Southern Africa. 2009. The King Code of Governance for South Africa (King III). [Online]. http://www.ecgi.org/codes/all_codes.php [4/12/2010] Institute of Internal Auditors. 2010. The International Standards for the Professional Practice of Internal Auditing. [Online]. http://www.theiia.org/guidance/standards-and-guidance/ippf/standards/full-standards/ [24/8/2010] Insurance. 2010. [Online]. http://www.insurance.za.org/insurance/definition-of-insurance.htm [24/8/2010] Internal Control Working Party. 1999. Guidance for Directors on the Combined Code (The Turnbull Report). London:ICAEW. International Convergence of Capital Measurement and Capital Standards (Basel II). 2004. Basel Committee on Banking Supervision, Bank for International Settlements. [Online]. http://bis.org/publ/bvbs107a.pdf [15/5/2009] Investor Words. 2010. [Online]. http://www.investorwords.com/1940/finance.html [24/8/2010] Ittner, C.D. & Larcker, D.F.1998. Are nonfinancial measures leading indicators of financial performance? An analysis of customer satisfaction. Journal of Accounting Research, 36(3):1-35. Jablonowski, M. 2001. Thinking in Numbers. Risk Management, 48(2):30-35. Jun, M. & Cai, S. 2003. Key obstacles to Edi success: from the US small manufacturing companies’ perspective. Industrial Management & Data Systems,103(3):192-203.

310
Kaplinsky, R. & Morris, M. 1999. Trade Policy Reform and the Competitive Response in Kwazulu Natal Province, South Africa. World Development, 27(4):717-737. Kendrick, T. 2004. Strategic risk: am I doing ok? Corporate Governance, 4(4):69-77. Kesper, A. 1999a. Small and Medium-sized Metalworking Companies in the Witwatersrand: Facing the global challenge. Paper presented at the 1999 TIPS Annual Forum. September 1999. Johannesburg, South Africa. Kesper, A. 1999b. Small clothing manufacturers in Johannesburg inner city: Facing the global challenge. Urban Forum, 10(2):137-164. Kesper, A. 2000. Failing or not aiming to grow? Manufacturing SMMEs and their contribution to employment growth in South Africa. Trade and Industry Policy Secretariat Working Paper, 15:1-36. Kimball, R.C. 2000. Failures in Risk Management. New England Economic Review, January/February:1-12. King II. 2002. The King Report on Corporate Governance. [Online]. http://www.ukzn.ac.za/ukznms/King_ReportExec_sum.pdf [15/5/2009] King III refer to the Institute of Directors Southern Africa Kirytopoulos, K., Leopoulos, V. & Malandrakis, C. 2001. Risk management: A powerful tool for improving efficiency of project oriented SMEs. Proceedings of the 4th SME International Conference. 2001.Denmark. Kleffner, A.E., Lee, R.B. & McGannon, B. 2003. The Effect of Corporate Governance on the Use of Enterprise Risk Management: Evidence from Canada. Risk Management & Insurance Review, 6(1):53-73. Kotze, L. & Smit, A. 2008. Personal Financial Literacy and Personal Debt Management: The Potential Relationship With New Venture Creation. SAJESBM, 1(1):35-50. Kraak, A. 2005. Human resources development and the skills crisis in South Africa: the need for a multi-pronged strategy. Journal of Education and Work, 18(1):57-83. Kubitscheck, V. 2000. Risk management: finding the value within. Balance Sheet, 8(5):38-41. Kuratko, D.F. & Hodgetts, R.M. 2007. Entrepreneurship – Theory, Process, Practice 7th Edition. Canada:Thomson South-Western.

311
Laforet, S. & Tann, J. 2006. Innovative Characteristics of Small Manufacturing Firms. Journal of Small Business Enterprise Development, 13(3):363-380. Lam, J. 2001. The CRO is Here to Stay. Risk Management, 48(4):16-20. Lam, J.C. & Kawamoto, B.M. 1997. Emergence of the Chief Risk Officer. Risk Management, 44(9):30-34. LeCornu, M.R., McMahon, R.G.P., Forsaith, D.M. & Stanger, A.M.J. 1996. The small enterprise financial objective function. Journal of Small Business Management, 34(3):1-14. Leedy, P.D. & Ormrod, J.E. 2001. Practical research: Planning and design 7th Edition. New Jersey: Pearson Education and Prentice Hall. Leopoulos, V. 2006. Editorial. Production Planning & Control, 17(3):225-228. Leopoulos, V.N., Kirytopoulos, K.A. & Malandrakis, C. 2006. Risk management for SMEs: Tools to use and how. Production Planning & Control, 17(3):322-332. Levine, R. 2004. Risk Management Systems: Understanding the need. Information Systems Management, 21(2):31-37. Liebenberg, A.P. & Hoyt, R.E. 2003. The Determinants of Enterprise Risk Management: Evidence from the Appointment of Chief Risk Officers. Risk Management and Insurance Review, 6(1):37-53. Liedholm, C. 2002. Small Firm Dynamics: Evidence from Africa and Latin America. Small Business Economics, 18:227-242. Ligthelm, A.A. & Cant, M.C. 2002. Business Success Factors of SMEs in Gauteng: A proactive entrepreneurial approach. Research Report 311, Faculty of Economic and Management Science, UNISA Bureau of Market Research. McCuaig, B. 2000. Making risk management stick. Balance Sheet, 8(5):17-20. McGrath, S. & King, K. 1996. Learning to Compete: African Education, Training and Small Enterprise Development in the Era of Globalisation. The International Journal of Urban Labour and Leisure, 2(2). [Online]. http://www.ijull.co.uk/vol2/2/000016.htm [26/3/2010] McNamee, D. 1998. Business Risk Assessment. Florida: Institute of Internal Auditors.

312
McWhorter, L.B., Matherly, M. & Frizzell, D.M. 2006. The Connection between Performance Measurement and Risk Management. Strategic Finance, February:50-55. Mead, D.C. & Liedholm, C. 1998. The Dynamics of Micro and Small Enterprises in Developing Countries. World Development, 26(1):61-74. Merkley, B.W. 2001. Does Enterprise Risk Management Count? Risk Management, 48(4):25-27. Meulbroek, L.K. 2002. Integrated Risk Management for the Firm: A Senior Manager’s Guide. Journal of Applied Corporate Finance, 14(4):56-70. Miccolis, J.A., Hively, K. & Merkley, B.W. S.a. Enterprise Risk Management: Trends and Emerging Practices. S.l.:Tillinghast - Towers Perrin. Miller, K.D. 1992. A Framework for Integrated Risk Management in International Business. Journal of International Business Studies, 23(2):311-332. Mundy, C. 2004. Re-assessing 21st century risk: 21st century trends in risk management – board level decisions set the agenda. Balance Sheet, 12(1):13-17. Mutezo, A.T. 2005. Obstacles to the access to SMME finance: an empirical perspective on Tshwane. A thesis in fulfilment of the requirements for the degree of Master Commerciae in the Department of Business Management at the University of South Africa. Naffziger, D.W., Hornsby, J.S. & Kuratko, D.F. 1994. A proposed research model of entrepreneurial motivation. Entrepreneurship Theory & Practice, 18(3), Spring:29-42. Naicker, N.I. 2006. Factors contributing to women being successful in the SMME sector. A mini dissertation submitted in partial fulfilment of the requirements for the degree Masters in Business Administration in the Faculty of Management at the University of Johannesburg. Nakada, P. & Tange, C. 2003. The Risk Management of War versus Decentralized Control. The RMA Journal, 85(6):30-31. Nielson, N.L., Kleffner, A.E. & Lee, R.B. 2005. The Evolution of the Role of Risk Communication in Effective Risk Management. Risk Management and Insurance Review, 8(2):279-289. Niven, P.R. 2002. Balanced Scorecard Step-by-Step: Maximizing Performance and Maintaining Results. New York: John Wiley & Sons.

313
Ntlhane, K.E. 1995. The application of risk management principles to smaller enterprises. A research report submitted in partial fulfilment of the requirements for the degree of Masters of Business Administration in the Faculty of Management at the University of the Witwatersrand. Ntsika Enterprise Promotion Agency (Ntsika). 2001. State of Small Business Development in South Africa. Annual Review 2001 [Online]. http://www.transformationaudit.org.za/research-database/government-1/other-government-output/2000-2006/2001ntsika/ [3/3/2010] Nunnally, J.C. 1978. Psychometric theory 2nd Edition. New York: McGraw-Hill. O’Gorman, C. 2001. The sustainability of growth in small and medium-sized enterprises. International Journal of Entrepreneurial Behaviour Research, 7(2):60-75. Orford, J., Wood, E., Fischer, C., Herrington, M. & Segal, N. 2003. Global Entrepreneurship Monitor: South Africa Executive Report, Graduate School of Business, University of Cape Town, Cape Town. Page, M. & Spira, L. 2004. After box-ticking … now what? Internal Auditing and Business Risk, November:33-34. Perren, L. 1999. Factors in the growth of micro-enterprises: developing a framework. Journal of Small Business and Enterprise Development, 6(4):366-385. Perren, L. 2000. Factors in the growth of micro-enterprises exploring the implications. Journal of Small Business and Enterprise Development, 7(1):58-68. Pickford, J. 2001. Financial Times Mastering Volume 1: Concepts. Wiltshire: Redwood Books. Plourd, K. 2009. Rethinking risk. CFO, January:66-69. Pretorius, M. & Shaw, G. 2004. Business plans in bank decision-making when financing new ventures in South Africa. South African Journal of Economic and Management Sciences, 7(2):221-241.[Online]. http://www.journals.co.za/ej/ejour_ecoman.html [3/3/2010] Prince, M. 2000. Enterprise risk management: RMIS requires corporate cultural transformation. Business Insurance, 34(49):21-23. Princeton. 2010a. [Online]. http://wordnetweb.princeton.edu/perl/webwn [24/8/2010] Princeton. 2010b. [Online]. http://wordnetweb.princeton.edu/perl/webwn [24/8/2010]
314
Probst, G. & Raisch, S. 2005. Organisational crisis: The logic of failure. Academy of Management Executives, 19(1):90-105. Rahman, G.A., Mahmood, R. & Rahman, N.A.A. 2003. Bank selection criteria: comparing bankers and the small business owners. Paper presented at 48th World Conference International Council for Small Business. Belfast. [Online]. http://sbaer.uca.edu/research/icsb/2003/178.doc [8/4/2010] Rajaram, R. 2008. A need analysis of financial management and accounting skills in the SME sector in KwaZulu-Natal. A research report submitted in fulfilment of the requirements for the degree of Master of Commerce in the School of Management at the University of KwaZulu-Natal. Ramsey, E., Ibbotson, P., Bell, J. & Gray, B. 2003. E-opportunities of service sector SMEs: an Irish cross-border study. Journal of Small Business and Enterprise Development, 10(3):250-264. Rao, A. & Marie, A. 2007. Current Practices of Enterprise Risk Management in Dubai. Management Accounting Quarterly, 8(3), Spring:10-22. Remenyi, D., Williams, B., Money, A. & Swartz, E. 2002. Doing Research in Business and Management – An Introduction to Process and Method. Wiltshire: Sage. Reynolds, P.L. & Lancaster, G. 2006. A scheme to increase profitability in entrepreneurial SMEs. Journal of Small Business and Enterprise Development, 13(3):395-410. Riley, M., Wood, R.C., Clark, M.A., Wilkie, E. & Szivas, E. 2000. Researching and Writing Dissertations in Business and Management. London: Thomson Learning. Ritchie, B. & Brindley, C. 2007. Supply chain risk management and performance. A guiding framework for future development. International Journal of Operations & Production Management, 27(3):303-322. Rogerson, C.M. 2001a. Growing the SMME Manufacturing Economy of South Africa: Evidence from Gauteng Province. Journal of Contemporary African Studies, 19(2):267-291. Rogerson, C.M. 2001b. In search of the African miracle – debate on successful small enterprise development in Africa. Habit International, 25:115-142.

315
Rogerson, C.M. 2004. The impact of the South African government’s SMME programmes: a ten year review (1994-2003). Development Southern Africa, 21(5):765-784. Rogerson, C.M. 2006. The Market Development Approach to SMME Development: Implications for Local Government in South Africa. Urban Forum, 17(1):54-78. Rogerson, C.M. 2008. Tracking SMME Development in South Africa: Issues of Finance, Training and the Regulatory Environment. Urban Forum 19(1):61-81. Rose, D. & Sullivan, O. 1996. Introducing data analysis for social scientists 2nd Edition. Buchingham: Open University Press. Rwigema, H. & Karungu, P. 1999. SMME development in Johannesburg’s Southern Metropolitan Local Council: an assessment. Development Southern Africa, 16(1):101-124. Rwigema, H. & Venter, R. 2004. Advanced Entrepreneurship. Cape Town: Oxford University Press. Salavou, H., Baltas, G. & Lioukas, S. 2004. Organisational innovation in SMEs: the importance of strategic orientation and competitive structure. European Journal of Marketing, 38(9):1091-1112. Salles, M. 2006. Decision making in SMEs and information requirements for competitive intelligence. Production Planning & Control, 17(3):229-237. Saunders, M., Lewis, P. & Thornhill, A. 2000. Research Methods for Business Students. Essex: Financial Times Prentice Hall. Schrøder, P.W. 2006. Impediments to Effective Risk Management. Perspectives on Strategic Risk Management. [In: Andersen, T.J. (ed.). Perspectives on Strategic Risk Management. Denmark: Copenhagen Business School Press]. Schultz, A.G. 2001. Risk assurance model for the small medium and micro enterprise sector. A dissertation submitted in partial fulfilment of the requirements for the degree of Master Technologiae in the Faculty of Management at the Cape Technikon. Selim, G. & McNamee, D. 1999. The risk management and internal auditing relationship: developing and validating a model. International Journal of Auditing, 3:159-174. Silverman, D. 1993. Interpreting Qualitative Data. London: Sage. Simpson, M., Tuck, N. & Bellamy, S. 2004. Small Business Success Factors. Education Training, 46(8/9):481-491.

316
Skinner, C. 2005. Constraints to Growth and Employment in Durban: Evidence from the Informal Economy. Research Report No. 65, School of Development Studies, University of KwaZulu-Natal, Durban. Skinner, D. & Spira, L.F. 2003. Trust and control – a symbiotic relationship? Corporate Governance, 3(4):28-35. Smart, P.A., Maull, R.S., Childe, S.J. & Radnor, Z.J. 2004. Capitalising on thematic initiatives: a framework for process-based change in SMEs. Production Planning & Control,15(1):2-12. Smiechewicz, W. 2001. Case Study: Implementing Enterprise Risk Management. Bank Accounting & Finance, 14(4):21-27. Smith, E.E. & Perks, S. 2006. Training interventions needed for developing black micro-entrepreneurial skills in the informal sector: a qualitative perspective. South African Journal of Human Resource Management, 4(1):17-26. South Africa. 1996. National Small Business Act, No. 102 of 1996. Notice No. 1901, 27 November. [Online]. http://www.info.gov.za/view/DownloadFileAction?id=70848 [2/10/2009] South Africa. 2004. National Small Business Amendment Act, No. 29 of 2004. Government Gazette, 461 (25763), November. [Online]. http://www.acts.co.za/national_small_business_act_1996.htm [27/1/2010] SOX see United States of America Spekman, R.E. & Davis, E.W. 2004. Risky business: expanding the discussion on risk and the extended enterprise. International Journal of Physical Distribution & Logistics Management, 34(5):414-433. Spira, L.F. & Page, M. 2003. Risk management: The reinvention of internal control and the changing role of internal audit. Accounting, Auditing & Accountability Journal, 16(4):640-661. Stonehouse, G.H. & Pemberton, J.D. 1999. Learning and knowledge management in the intelligent organisation. Participation and Empowerment: An International Journal, 7(5):131-144. St-Pierre, J. & Bahri, M. 2006. The use of the accounting beta as an overall risk indicator for unlisted companies. Journal of Small Business and Enterprise Development, 13(4):546-561. Tan, E.N., Smith, G. & Saad, M. 2006. Managing the global supply chain: a SME perspective. Production Planning & Control, 17(3):238-246.

317
Tchankova, L. 2002. Risk identification – basic stage in risk management. Environmental Management and Health, 13(3):290-297. Towers Perrin. 2008. Towers Perrin Risk and Opportunity White Paper. [Online]. http://www.towersperrin.com [11/11/2008] Truslow, D.K. 2003. Operational Risk Management: It’s Everyone’s Job. The RMA Journal, 85(5):34-37.[Online]. http://findarticles.com/p/articles/mi_m0ITW/is_5_85/ai_n14897237 [25/2/2009] UK Code see UK Corporate Governance Code UK Corporate Governance Code. 2010. [Online] http://www.ecgi/org/codes/all_codes.php [21/2/2111] UNDP see United Nations Development Programme United Nations Development Programme (UNDP). 2003. The challenge of sustainable development in South Africa: unlocking people’s creativity. South African Development Report, 2003. Cape Town: Oxford University Press. United States of America. 2002. Sarbanes-Oxley Act of 2002 (SOX). Public Law 107-204, United States Senate and House of Representatives in Congress.[Online] http://taft.law.uc.edu/CCL/SOact/toc.html [21/2/2011] Valsamakis, A.C., Vivian, R.W., & Du Toit, G.S. 1996. The Theory and Principles of Risk Management. Isando: Heinemann. Valsamakis, A.C., Vivian, R.W. & Du Toit, G.S. 2000. Risk Management 2nd Edition. Sandton: Heinemann Higher and Further Education. Van Niekerk, L. 2005. Information security risk management in the South African Small, Medium and Micro Enterprise Environment: The Peculium Model. A dissertation submitted in fulfilment of the requirements for the degree of Master of Science in Informatics in the Faculty of Science of the University of Johannesburg. Vogt, W.P. 1993. Dictionary of Statistics and Methodology. Newbury Park: Sage. Von Broembsen, M. 2003. Poverty Alleviation: Beyond the National Small Business Strategy. [Online]. http://www.idasa.org.za [20/7/2008] Watson, G.E.H. 2004. A situational analysis of entrepreneurship mentors in South Africa. A dissertation submitted in fulfilment of the requirements for the degree Masters of Commerce in Business Management at the University of South Africa.

318
Watson, K., Hogarth-Scott, S. & Wilson, N. 1998. Small business start-ups: success factors and support implications. International Journal of Entrepreneurial Behaviour and Research, 4(3):217-238. Watson, L.M. & Godfrey, N.F. S.a. Entrepreneurial Support for Rural Small, Medium and Micro Enterprises (SMMEs) in South Africa. [Online] http://161.31.108.27/research/icsb/2005/119pdf [23/7/2008] Watt, J. 2007. Strategic risk management for small businesses. [In: Reuvid, J. (ed.). Managing Business Risk 2nd Edition – a practical guide to protecting your business. London – Philadelphia: Kogan Page]. Weinstein, B. 2002. Risk Management versus The Loose Organisation. Working Paper, Henley Management College. [Online]. http://www.henley.reading.ac.uk/henleyres03.nsf/pages/hcvi_reading_riskmanagement/ [19/5/2009] Weinstein, B., Blacker, K. & Mills, R. 2003. Risk management for non-executive directors: creating a culture of cautious innovation. Henley Discussion Paper no. 2. [Online]. http://www.henleymc.ac.uk/henleyres03.nsf/pages/hcvi [19/5/2009] Welman, C., Kruger, F. & Mitchell, B. 2005. Research Methodology 3rd Edition. Cape Town: Oxford Press. White, D. 1995. Application of systems thinking to risk management: a review of the literature. Management Decisions, 33(10):35-45. Wiklund, J. 1999. The sustainability of the entrepreneurial orientation-performance relationship. Entrepreneurship Theory and Practice, Fall:37-48. Williams, J.R., Smith, M.L. & Young, P.C. 1998. Risk Management and Insurance, 8th Edition. Singapore: Irwin McGraw-Hill. Williamson, I.O. 2000. Employer legitimacy and recruitment success in small business. Entrepreneurship: Theory and Practice, 25(1):27. Wong, K.Y. 2005. Critical success factors for implementing knowledge management in small and medium enterprises. Industrial Management & Data, 105(3):261-279. Yin, R.K. 1994. Case Study Research: Design and Methods. Thousand Oakes: Sage. Young, J. 2006. Operational Risk Management – The practical application of a qualitative approach. Pretoria: Van Schaik Publishers. Zeckhauser, B. & Sandoski, A. 2009. Using risk to your advantage. T + D, February:76-77.

319
APPENDIX A
Appendix A depicts the survey questionnaire that will be posted to SME
owner-managers in the retail sector in the Western Cape.
1. What is the annual turnover of your business?
> R25 million 1
>R20 million – R25 million 2
>R15 million – R20 million 3
>R10 million – R15 million 4
>R5 million – R10 million 5
>R1 million – R5 million 6
>R500 000 – R1 million 7
>R300 000 – R500 000 8
>R150 000 – R300 000 9
R100 000 – R150 000 10
<R100 000 11
2. How many permanent employees does your business employ?
>100 1
50 – 100 2
21 – 49 3
11 – 20 4
6 – 10 5
1 - 5 6
3. What type of entity is your business?
Sole proprietorship 1
Partnership 2
Close corporation 3
Limited company 4
Other 5
3.1 If ‘Other’, please specify the type.
……………………………………………………………………………..
BACKGROUND

320
4. What is the age of your business?
> 20 years 1
11 – 20 years 2
6 -10 years 3
3 – 5 years 4
< 3 years 5
5. What is the highest qualification the owner (if an active participant in the
business) or else the executive manager hold?
5.1 Owner’s qualification (if an active participant in the business):
Post-graduate degree 1
Degree 2
Diploma 3
Post-matriculation (other than the above) 4
Matriculation certificate 5
Grade 8 – Grade 10 / St 6 – St 8 6
Grade 7 / St 5 7
None 8
5.2 Executive manager’s qualification:
Post-graduate degree 1
Degree 2
Diploma 3
Post-matriculation (other than the above) 4
Matriculation certificate 5
Grade 8 – Grade 10 (St 6 – St 8) 6
Grade 7 (St 5) 7
None 8
6. In what area does/did your business receive support from external consultants
(ad hoc basis / continuous basis / both)? Mark all the applicable areas.
1. Financial management yes no
BUSINESS PROCESSES/ACTIVITIES

321
2. Marketing management yes no
3. Operational management yes no
4. Administrative management yes no
5. Information technology yes no
6. Human resource management yes no
7. Public relations management yes no
8. None yes no
9. Other yes no
6.1 If ‘Other’ is marked ‘yes’, please specify.
………………………………………………………………………………………………
……………………………………………………………………
7. Has your business experienced any financial problems in the past? Please mark
the reason(s) for the financial state.
1.1 No problems experienced yes no
Problems experienced due to:
2.1 Default payments by debtors yes no
2.2 Overspending or excessive expenditure yes no
2.3 Theft of business resources yes no
2.4 Information technology inefficiencies yes no
2.5 Personnel - lack of skill yes no
2.6 Operational problems yes no
2.7 Catastrophic event yes no
2.8 Other yes no
7.2. If ‘Other’ is marked ‘yes’, please specify:
………………………………………………………………………………………………
……………………………………………………………
8. Are your business objectives and strategies clearly defined to help determine
which activities are critical for the survival of your business?
Yes 1
No 2
9. What type of risk is the most important to your business? Rate the following risks
from 1 to 5 where 1 = most important and 5 = least important.

322
Type of risk Description of risk Rate
1.Management risk Lack of management tools such as cash flow budgets;
absence of designated head for each of the business
functions
2.Commercial risk Competitive position of the company; competitor reaction;
demand fluctuations; distribution difficulties
3.Technological risk Problems with suppliers; problems with equipment;
inadequate production structure; absence of technological
development monitoring; absence of research and
development; absence of continuous improvement activities
4. Financial risk Profitability level; debt load; interest cover; capacity for
indebtedness; financing contracts; capacity for reinvesting
by current owners
5.Entrepreneurial
risk
Age, experience and training of owner and/or manager
10. Do you have a clear understanding of the risks that have an impact on your
business structure and processes?
Yes 1
No 2
11. To what extent are risks discussed in your business strategy planning?
High 1
Medium 2
Low 3
Do not know 4
Not discussed 5
12. To what extent are risks discussed in your business operational planning?
High 1
Medium 2
Low 3
Do not know 4
Not discussed 5
13. To what extent are risks discussed in your business financial planning?

323
High 1
Medium 2
Low 3
Do not know 4
Not discussed 5
14. Would you be interested in a risk framework?
Yes 1
No 2
15. What factors would motivate you to implement a risk framework? Mark all the
applicable areas.
Improved customer service yes no
Minimise cost yes no
Maximise profit yes no
Reliable business information yes no
Safeguarding of assets yes no
Regulatory compliance yes no
Fraud prevention/detection yes no
Continuity of operations yes no
Internal compliance yes no
Minimise the occurrence of
unforeseen events
yes no
None yes no
16. How would you characterise the status of your risk management framework? Tick
only one.
We have a completed risk management framework
in place
1
We have a partial risk management framework in
place
2
We do not have a risk management framework in
place, but are planning to implement one
3
We are investigating the concept of a risk
management framework
4
We do not have a risk management framework in 5

324
place and are not planning to implement one
17. In which function(s) does/do a formal risk identification and assessment take
place? Mark all the applicable areas.
Finance yes no
Sales/marketing yes no
Human resources yes no
Operational yes no
Procurement yes no
None yes no
Other yes no
17.1 If ‘Other’ is marked ‘yes’, please specify.
………………………………………………………………………………………………
……………………………………………………………………
18. What type of action does your business enterprise engage in when risks are
identified? Mark the applicable action(s).
Take out insurance yes no
Improve internal controls yes no
Do not engage in the identified
activity
yes no
Other yes no
18.1 If ‘Other’ is marked ‘yes’, please specify:
…………………………………………………………………………………
…………………………………………………………………………………
19. How do you implement or plan to implement risk management activities?
Indicate your response by marking one of the options provided.
Holistically – across the entire enterprise 1
Incrementally – by department/function 2
Incrementally – by type of risk (finance/operational
etc)
3
Incrementally – other 4
Not applicable 5
19.1 If ‘Other’, please specify:

325
………………………………………………………………………………………………
……………………………………………………………………
20. Which obstacles hinder your business in implementing a risk management
framework? Mark all the applicable obstacles.
No obstacles experienced yes no
Not perceived as a priority by management yes no
Lack of formalised processes yes no
Lack of technology yes no
Lack of intellectual capital (know-how) yes no
Benefit does not justify the effort yes no
Cost yes no
Lack of skills yes no
21. Would you like to receive feedback on the study?
Yes No
Contact detail
Contact person
Preferred method of contact:
Telephone
Fax
Contact detail (e-mail address or
telephone number or fax number)

326
APPENDIX B
Descriptive statistics for each variable
Cumulative Cumulative Q01 Frequency Percent Frequency Percent ƒƒƒƒƒƒƒƒƒƒƒƒƒƒƒƒƒƒƒƒƒƒƒƒƒƒƒƒƒƒƒƒƒƒƒƒƒƒƒƒƒƒƒƒƒƒƒƒƒƒƒƒƒƒƒƒƒƒƒƒƒƒƒƒƒƒƒƒƒƒƒƒƒƒƒƒƒƒƒ >R25 million 5 3.16 5 3.16 >R20 million - R25 million 2 1.27 7 4.43 >R15 million - R20 million 2 1.27 9 5.70 >R10 million - R15 million 8 5.06 17 10.76 >R5 million - R10 million 7 4.43 24 15.19 >R1 million - R5 million 24 15.19 48 30.38 >R500 000 - R1 million 17 10.76 65 41.14 >R300 000 - R500 000 14 8.86 79 50.00 >R150 000 - R300 000 33 20.89 112 70.89 R100 000 - R150 000 22 13.92 134 84.81 <R100 000 24 15.19 158 100.00 Chi-Square Test for Equal Proportions ƒƒƒƒƒƒƒƒƒƒƒƒƒƒƒƒƒƒƒƒƒ Chi-Square 75.6456 DF 10 Pr > ChiSq <.0001 Sample Size = 158 Cumulative Cumulative Q02 Frequency Percent Frequency Percent ƒƒƒƒƒƒƒƒƒƒƒƒƒƒƒƒƒƒƒƒƒƒƒƒƒƒƒƒƒƒƒƒƒƒƒƒƒƒƒƒƒƒƒƒƒƒƒƒƒƒƒƒƒƒƒƒƒƒƒ >100 3 1.90 3 1.90 50-100 3 1.90 6 3.80 21-49 23 14.56 29 18.35 11-20 27 17.09 56 35.44 6-10 33 20.89 89 56.33 1-5 69 43.67 158 100.00 Chi-Square Test for Equal Proportions ƒƒƒƒƒƒƒƒƒƒƒƒƒƒƒƒƒƒƒƒƒ Chi-Square 112.6076 DF 5 Pr > ChiSq <.0001 Sample Size = 158 Cumulative Cumulative Q03 Frequency Percent Frequency Percent ƒƒƒƒƒƒƒƒƒƒƒƒƒƒƒƒƒƒƒƒƒƒƒƒƒƒƒƒƒƒƒƒƒƒƒƒƒƒƒƒƒƒƒƒƒƒƒƒƒƒƒƒƒƒƒƒƒƒƒƒƒƒƒƒƒƒƒƒƒƒƒƒ Sole proprietorship 61 38.61 61 38.61 Partnership 30 18.99 91 57.59 Close Corporation 50 31.65 141 89.24 Limited Company 15 9.49 156 98.73 Other 2 1.27 158 100.00 Chi-Square Test for Equal Proportions ƒƒƒƒƒƒƒƒƒƒƒƒƒƒƒƒƒƒƒƒƒ Chi-Square 74.5949 DF 4 Pr > ChiSq <.0001 Sample Size = 158 Cumulative Cumulative Q03_1 Frequency Percent Frequency Percent ƒƒƒƒƒƒƒƒƒƒƒƒƒƒƒƒƒƒƒƒƒƒƒƒƒƒƒƒƒƒƒƒƒƒƒƒƒƒƒƒƒƒƒƒƒƒƒƒƒƒƒƒƒƒƒƒƒƒƒƒƒƒƒƒƒƒƒƒƒƒƒƒƒƒƒƒƒƒƒƒƒƒƒƒƒƒƒƒƒƒƒƒƒƒƒ Alleen Eienaar 1 100.00 1 100.00 Cumulative Cumulative Q04 Frequency Percent Frequency Percent ƒƒƒƒƒƒƒƒƒƒƒƒƒƒƒƒƒƒƒƒƒƒƒƒƒƒƒƒƒƒƒƒƒƒƒƒƒƒƒƒƒƒƒƒƒƒƒƒƒƒƒƒƒƒƒƒƒƒƒƒƒƒƒƒ > 20 years 9 5.70 9 5.70 11-20 years 29 18.35 38 24.05 6-10 years 42 26.58 80 50.63 3-5 years 48 30.38 128 81.01 <3 years 30 18.99 158 100.00 Chi-Square Test for Equal Proportions ƒƒƒƒƒƒƒƒƒƒƒƒƒƒƒƒƒƒƒƒƒ Chi-Square 28.3924 DF 4 Pr > ChiSq <.0001 Sample Size = 158 Cumulative Cumulative Q05_1 Frequency Percent Frequency Percent ƒƒƒƒƒƒƒƒƒƒƒƒƒƒƒƒƒƒƒƒƒƒƒƒƒƒƒƒƒƒƒƒƒƒƒƒƒƒƒƒƒƒƒƒƒƒƒƒƒƒƒƒƒƒƒƒƒƒƒƒƒƒƒƒƒƒƒƒƒƒƒƒƒƒƒƒƒƒƒ 0 7 4.43 7 4.43 Post graduate degree 21 13.29 28 17.72 Degree 27 17.09 55 34.81 Diploma 41 25.95 96 60.76 Post matriculation (other) 18 11.39 114 72.15 Matriculation certificate 36 22.78 150 94.94 Grade 8 - Grade 10 5 3.16 155 98.10 Grade 7 1 0.63 156 98.73 None 2 1.27 158 100.00

327
Chi-Square Test for Equal Proportions ƒƒƒƒƒƒƒƒƒƒƒƒƒƒƒƒƒƒƒƒƒ Chi-Square 101.1772 DF 8 Pr > ChiSq <.0001 Sample Size = 158 Cumulative Cumulative Q05_2 Frequency Percent Frequency Percent ƒƒƒƒƒƒƒƒƒƒƒƒƒƒƒƒƒƒƒƒƒƒƒƒƒƒƒƒƒƒƒƒƒƒƒƒƒƒƒƒƒƒƒƒƒƒƒƒƒƒƒƒƒƒƒƒƒƒƒƒƒƒƒƒƒƒƒƒƒƒƒƒƒƒƒƒƒƒƒ 0 11 6.96 11 6.96 Post graduate degree 15 9.49 26 16.46 Degree 21 13.29 47 29.75 Diploma 50 31.65 97 61.39 Post matriculation (other) 15 9.49 112 70.89 Matriculation certificate 33 20.89 145 91.77 Grade 8 - Grade 10 3 1.90 148 93.67 Grade 7 1 0.63 149 94.30 None 9 5.70 158 100.00 Chi-Square Test for Equal Proportions ƒƒƒƒƒƒƒƒƒƒƒƒƒƒƒƒƒƒƒƒƒ Chi-Square 109.2658 DF 8 Pr > ChiSq <.0001 Sample Size = 158 Cumulative Cumulative Q06_01 Frequency Percent Frequency Percent ƒƒƒƒƒƒƒƒƒƒƒƒƒƒƒƒƒƒƒƒƒƒƒƒƒƒƒƒƒƒƒƒƒƒƒƒƒƒƒƒƒƒƒƒƒƒƒƒƒƒƒƒƒƒƒƒƒƒƒ Yes 62 39.24 62 39.24 No 96 60.76 158 100.00 Chi-Square Test for Equal Proportions ƒƒƒƒƒƒƒƒƒƒƒƒƒƒƒƒƒƒƒƒƒ Chi-Square 7.3165 DF 1 Pr > ChiSq 0.0068 Sample Size = 158 Cumulative Cumulative Q06_02 Frequency Percent Frequency Percent ƒƒƒƒƒƒƒƒƒƒƒƒƒƒƒƒƒƒƒƒƒƒƒƒƒƒƒƒƒƒƒƒƒƒƒƒƒƒƒƒƒƒƒƒƒƒƒƒƒƒƒƒƒƒƒƒƒƒƒ Yes 56 35.44 56 35.44 No 102 64.56 158 100.00 Chi-Square Test for Equal Proportions ƒƒƒƒƒƒƒƒƒƒƒƒƒƒƒƒƒƒƒƒƒ Chi-Square 13.3924 DF 1 Pr > ChiSq 0.0003 Sample Size = 158 Cumulative Cumulative Q06_03 Frequency Percent Frequency Percent ƒƒƒƒƒƒƒƒƒƒƒƒƒƒƒƒƒƒƒƒƒƒƒƒƒƒƒƒƒƒƒƒƒƒƒƒƒƒƒƒƒƒƒƒƒƒƒƒƒƒƒƒƒƒƒƒƒƒƒ Yes 29 18.35 29 18.35 No 129 81.65 158 100.00 Chi-Square Test for Equal Proportions ƒƒƒƒƒƒƒƒƒƒƒƒƒƒƒƒƒƒƒƒƒ Chi-Square 63.2911 DF 1 Pr > ChiSq <.0001 Sample Size = 158 Cumulative Cumulative Q06_04 Frequency Percent Frequency Percent ƒƒƒƒƒƒƒƒƒƒƒƒƒƒƒƒƒƒƒƒƒƒƒƒƒƒƒƒƒƒƒƒƒƒƒƒƒƒƒƒƒƒƒƒƒƒƒƒƒƒƒƒƒƒƒƒƒƒƒ Yes 29 18.35 29 18.35 No 129 81.65 158 100.00 Chi-Square Test for Equal Proportions ƒƒƒƒƒƒƒƒƒƒƒƒƒƒƒƒƒƒƒƒƒ Chi-Square 63.2911 DF 1 Pr > ChiSq <.0001 Sample Size = 158 Cumulative Cumulative Q06_05 Frequency Percent Frequency Percent ƒƒƒƒƒƒƒƒƒƒƒƒƒƒƒƒƒƒƒƒƒƒƒƒƒƒƒƒƒƒƒƒƒƒƒƒƒƒƒƒƒƒƒƒƒƒƒƒƒƒƒƒƒƒƒƒƒƒƒ Yes 52 32.91 52 32.91 No 106 67.09 158 100.00 Chi-Square Test for Equal Proportions ƒƒƒƒƒƒƒƒƒƒƒƒƒƒƒƒƒƒƒƒƒ Chi-Square 18.4557 DF 1 Pr > ChiSq <.0001 Sample Size = 158

328
Cumulative Cumulative Q06_06 Frequency Percent Frequency Percent ƒƒƒƒƒƒƒƒƒƒƒƒƒƒƒƒƒƒƒƒƒƒƒƒƒƒƒƒƒƒƒƒƒƒƒƒƒƒƒƒƒƒƒƒƒƒƒƒƒƒƒƒƒƒƒƒƒƒƒ Yes 25 15.82 25 15.82 No 133 84.18 158 100.00 Chi-Square Test for Equal Proportions ƒƒƒƒƒƒƒƒƒƒƒƒƒƒƒƒƒƒƒƒƒ Chi-Square 73.8228 DF 1 Pr > ChiSq <.0001 Sample Size = 158 Cumulative Cumulative Q06_07 Frequency Percent Frequency Percent ƒƒƒƒƒƒƒƒƒƒƒƒƒƒƒƒƒƒƒƒƒƒƒƒƒƒƒƒƒƒƒƒƒƒƒƒƒƒƒƒƒƒƒƒƒƒƒƒƒƒƒƒƒƒƒƒƒƒƒ Yes 25 15.82 25 15.82 No 133 84.18 158 100.00 Chi-Square Test for Equal Proportions ƒƒƒƒƒƒƒƒƒƒƒƒƒƒƒƒƒƒƒƒƒ Chi-Square 73.8228 DF 1 Pr > ChiSq <.0001 Sample Size = 158 Cumulative Cumulative Q06_08 Frequency Percent Frequency Percent ƒƒƒƒƒƒƒƒƒƒƒƒƒƒƒƒƒƒƒƒƒƒƒƒƒƒƒƒƒƒƒƒƒƒƒƒƒƒƒƒƒƒƒƒƒƒƒƒƒƒƒƒƒƒƒƒƒƒƒ Yes 52 32.91 52 32.91 No 106 67.09 158 100.00 Chi-Square Test for Equal Proportions ƒƒƒƒƒƒƒƒƒƒƒƒƒƒƒƒƒƒƒƒƒ Chi-Square 18.4557 DF 1 Pr > ChiSq <.0001 Sample Size = 158 Cumulative Cumulative Q06_09 Frequency Percent Frequency Percent ƒƒƒƒƒƒƒƒƒƒƒƒƒƒƒƒƒƒƒƒƒƒƒƒƒƒƒƒƒƒƒƒƒƒƒƒƒƒƒƒƒƒƒƒƒƒƒƒƒƒƒƒƒƒƒƒƒƒƒ Yes 3 1.90 3 1.90 No 155 98.10 158 100.00 Chi-Square Test for Equal Proportions ƒƒƒƒƒƒƒƒƒƒƒƒƒƒƒƒƒƒƒƒƒ Chi-Square 146.2278 DF 1 Pr > ChiSq <.0001 Sample Size = 158 Cumulative Cumulative Q06_1 Frequency Percent Frequency Percent ƒƒƒƒƒƒƒƒƒƒƒƒƒƒƒƒƒƒƒƒƒƒƒƒƒƒƒƒƒƒƒƒƒƒƒƒƒƒƒƒƒƒƒƒƒƒƒƒƒƒƒƒƒƒƒƒƒƒƒƒƒƒƒƒƒƒƒƒƒƒƒƒƒƒƒƒƒƒƒƒƒƒƒƒƒƒƒƒƒƒƒƒƒƒƒ Deals with things amongst employees 1 33.33 1 33.33 Financial Statements 1 33.33 2 66.67 We both worked overseas, gaining retail experience 1 33.33 3 100.00 and fashion knowledge "Supply and Demand" Cumulative Cumulative Q07_1_1 Frequency Percent Frequency Percent ƒƒƒƒƒƒƒƒƒƒƒƒƒƒƒƒƒƒƒƒƒƒƒƒƒƒƒƒƒƒƒƒƒƒƒƒƒƒƒƒƒƒƒƒƒƒƒƒƒƒƒƒƒƒƒƒƒƒƒƒ Yes 61 38.61 61 38.61 No 97 61.39 158 100.00 Chi-Square Test for Equal Proportions ƒƒƒƒƒƒƒƒƒƒƒƒƒƒƒƒƒƒƒƒƒ Chi-Square 8.2025 DF 1 Pr > ChiSq 0.0042 Sample Size = 158 Cumulative Cumulative Q07_2_01 Frequency Percent Frequency Percent ƒƒƒƒƒƒƒƒƒƒƒƒƒƒƒƒƒƒƒƒƒƒƒƒƒƒƒƒƒƒƒƒƒƒƒƒƒƒƒƒƒƒƒƒƒƒƒƒƒƒƒƒƒƒƒƒƒƒƒƒƒ Yes 35 22.15 35 22.15 No 123 77.85 158 100.00 Chi-Square Test for Equal Proportions ƒƒƒƒƒƒƒƒƒƒƒƒƒƒƒƒƒƒƒƒƒ Chi-Square 49.0127 DF 1 Pr > ChiSq <.0001 Sample Size = 158 Cumulative Cumulative Q07_2_02 Frequency Percent Frequency Percent ƒƒƒƒƒƒƒƒƒƒƒƒƒƒƒƒƒƒƒƒƒƒƒƒƒƒƒƒƒƒƒƒƒƒƒƒƒƒƒƒƒƒƒƒƒƒƒƒƒƒƒƒƒƒƒƒƒƒƒƒƒ Yes 44 27.85 44 27.85 No 114 72.15 158 100.00

329
Chi-Square Test for Equal Proportions ƒƒƒƒƒƒƒƒƒƒƒƒƒƒƒƒƒƒƒƒƒ Chi-Square 31.0127 DF 1 Pr > ChiSq <.0001 Sample Size = 158 Cumulative Cumulative Q07_2_03 Frequency Percent Frequency Percent ƒƒƒƒƒƒƒƒƒƒƒƒƒƒƒƒƒƒƒƒƒƒƒƒƒƒƒƒƒƒƒƒƒƒƒƒƒƒƒƒƒƒƒƒƒƒƒƒƒƒƒƒƒƒƒƒƒƒƒƒƒ Yes 61 38.61 61 38.61 No 97 61.39 158 100.00 Chi-Square Test for Equal Proportions ƒƒƒƒƒƒƒƒƒƒƒƒƒƒƒƒƒƒƒƒƒ Chi-Square 8.2025 DF 1 Pr > ChiSq 0.0042 Sample Size = 158 Cumulative Cumulative Q07_2_04 Frequency Percent Frequency Percent ƒƒƒƒƒƒƒƒƒƒƒƒƒƒƒƒƒƒƒƒƒƒƒƒƒƒƒƒƒƒƒƒƒƒƒƒƒƒƒƒƒƒƒƒƒƒƒƒƒƒƒƒƒƒƒƒƒƒƒƒƒ Yes 30 18.99 30 18.99 No 128 81.01 158 100.00 Chi-Square Test for Equal Proportions ƒƒƒƒƒƒƒƒƒƒƒƒƒƒƒƒƒƒƒƒƒ Chi-Square 60.7848 DF 1 Pr > ChiSq <.0001 Sample Size = 158 Cumulative Cumulative Q07_2_05 Frequency Percent Frequency Percent ƒƒƒƒƒƒƒƒƒƒƒƒƒƒƒƒƒƒƒƒƒƒƒƒƒƒƒƒƒƒƒƒƒƒƒƒƒƒƒƒƒƒƒƒƒƒƒƒƒƒƒƒƒƒƒƒƒƒƒƒƒ Yes 32 20.25 32 20.25 No 126 79.75 158 100.00 Chi-Square Test for Equal Proportions ƒƒƒƒƒƒƒƒƒƒƒƒƒƒƒƒƒƒƒƒƒ Chi-Square 55.9241 DF 1 Pr > ChiSq <.0001 Sample Size = 158 Cumulative Cumulative Q07_2_06 Frequency Percent Frequency Percent ƒƒƒƒƒƒƒƒƒƒƒƒƒƒƒƒƒƒƒƒƒƒƒƒƒƒƒƒƒƒƒƒƒƒƒƒƒƒƒƒƒƒƒƒƒƒƒƒƒƒƒƒƒƒƒƒƒƒƒƒƒ Yes 36 22.78 36 22.78 No 122 77.22 158 100.00 Chi-Square Test for Equal Proportions ƒƒƒƒƒƒƒƒƒƒƒƒƒƒƒƒƒƒƒƒƒ Chi-Square 46.8101 DF 1 Pr > ChiSq <.0001 Sample Size = 158 Cumulative Cumulative Q07_2_07 Frequency Percent Frequency Percent ƒƒƒƒƒƒƒƒƒƒƒƒƒƒƒƒƒƒƒƒƒƒƒƒƒƒƒƒƒƒƒƒƒƒƒƒƒƒƒƒƒƒƒƒƒƒƒƒƒƒƒƒƒƒƒƒƒƒƒƒƒ Yes 14 8.86 14 8.86 No 144 91.14 158 100.00 Chi-Square Test for Equal Proportions ƒƒƒƒƒƒƒƒƒƒƒƒƒƒƒƒƒƒƒƒƒ Chi-Square 106.9620 DF 1 Pr > ChiSq <.0001 Sample Size = 158 Cumulative Cumulative Q07_2_08 Frequency Percent Frequency Percent ƒƒƒƒƒƒƒƒƒƒƒƒƒƒƒƒƒƒƒƒƒƒƒƒƒƒƒƒƒƒƒƒƒƒƒƒƒƒƒƒƒƒƒƒƒƒƒƒƒƒƒƒƒƒƒƒƒƒƒƒƒ Yes 7 4.43 7 4.43 No 151 95.57 158 100.00 Chi-Square Test for Equal Proportions ƒƒƒƒƒƒƒƒƒƒƒƒƒƒƒƒƒƒƒƒƒ Chi-Square 131.2405 DF 1 Pr > ChiSq <.0001 Sample Size = 158 Cumulative Cumulative Q07_2_1 Frequency Percent Frequency Percent ƒƒƒƒƒƒƒƒƒƒƒƒƒƒƒƒƒƒƒƒƒƒƒƒƒƒƒƒƒƒƒƒƒƒƒƒƒƒƒƒƒƒƒƒƒƒƒƒƒƒƒƒƒƒƒƒƒƒƒƒƒƒƒƒƒƒƒƒƒƒƒƒƒƒƒƒƒƒƒƒƒƒƒƒƒƒƒƒƒƒƒƒƒƒƒ Bad Economy 1 16.67 1 16.67 Late Payments 1 16.67 2 33.33 Mismanagement 1 16.67 3 50.00 Not enough customers to buy from the shop 1 16.67 4 66.67

330
Retail is different everyday. Sales have dropped 1 16.67 5 83.33 from time to time due to economic times Suppliers 1 16.67 6 100.00 Cumulative Cumulative Q08 Frequency Percent Frequency Percent ƒƒƒƒƒƒƒƒƒƒƒƒƒƒƒƒƒƒƒƒƒƒƒƒƒƒƒƒƒƒƒƒƒƒƒƒƒƒƒƒƒƒƒƒƒƒƒƒƒƒƒƒƒƒƒƒ Yes 135 85.44 135 85.44 No 23 14.56 158 100.00 Chi-Square Test for Equal Proportions ƒƒƒƒƒƒƒƒƒƒƒƒƒƒƒƒƒƒƒƒƒ Chi-Square 79.3924 DF 1 Pr > ChiSq <.0001 Sample Size = 158 Cumulative Cumulative Q09_1 Frequency Percent Frequency Percent ƒƒƒƒƒƒƒƒƒƒƒƒƒƒƒƒƒƒƒƒƒƒƒƒƒƒƒƒƒƒƒƒƒƒƒƒƒƒƒƒƒƒƒƒƒƒƒƒƒƒƒƒƒƒƒƒƒƒƒƒƒƒƒƒƒƒƒƒƒ 0 1 0.63 1 0.63 Most important 38 24.05 39 24.68 Important 27 17.09 66 41.77 Neutral 35 22.15 101 63.92 Not so important 33 20.89 134 84.81 Least important 24 15.19 158 100.00 Chi-Square Test for Equal Proportions ƒƒƒƒƒƒƒƒƒƒƒƒƒƒƒƒƒƒƒƒƒ Chi-Square 34.3038 DF 5 Pr > ChiSq <.0001 Sample Size = 158 Cumulative Cumulative Q09_2 Frequency Percent Frequency Percent ƒƒƒƒƒƒƒƒƒƒƒƒƒƒƒƒƒƒƒƒƒƒƒƒƒƒƒƒƒƒƒƒƒƒƒƒƒƒƒƒƒƒƒƒƒƒƒƒƒƒƒƒƒƒƒƒƒƒƒƒƒƒƒƒƒƒƒƒƒ 0 1 0.63 1 0.63 Most important 35 22.15 36 22.78 Important 31 19.62 67 42.41 Neutral 43 27.22 110 69.62 Not so important 28 17.72 138 87.34 Least important 20 12.66 158 100.00 Chi-Square Test for Equal Proportions ƒƒƒƒƒƒƒƒƒƒƒƒƒƒƒƒƒƒƒƒƒ Chi-Square 40.2278 DF 5 Pr > ChiSq <.0001 Sample Size = 158 Cumulative Cumulative Q09_3 Frequency Percent Frequency Percent ƒƒƒƒƒƒƒƒƒƒƒƒƒƒƒƒƒƒƒƒƒƒƒƒƒƒƒƒƒƒƒƒƒƒƒƒƒƒƒƒƒƒƒƒƒƒƒƒƒƒƒƒƒƒƒƒƒƒƒƒƒƒƒƒƒƒƒƒƒ 0 1 0.63 1 0.63 Most important 37 23.42 38 24.05 Important 28 17.72 66 41.77 Neutral 25 15.82 91 57.59 Not so important 30 18.99 121 76.58 Least important 37 23.42 158 100.00 Chi-Square Test for Equal Proportions ƒƒƒƒƒƒƒƒƒƒƒƒƒƒƒƒƒƒƒƒƒ Chi-Square 33.6962 DF 5 Pr > ChiSq <.0001 Sample Size = 158 Cumulative Cumulative Q09_4 Frequency Percent Frequency Percent ƒƒƒƒƒƒƒƒƒƒƒƒƒƒƒƒƒƒƒƒƒƒƒƒƒƒƒƒƒƒƒƒƒƒƒƒƒƒƒƒƒƒƒƒƒƒƒƒƒƒƒƒƒƒƒƒƒƒƒƒƒƒƒƒƒƒƒƒƒ 0 1 0.63 1 0.63 Most important 52 32.91 53 33.54 Important 29 18.35 82 51.90 Neutral 32 20.25 114 72.15 Not so important 17 10.76 131 82.91 Least important 27 17.09 158 100.00 Chi-Square Test for Equal Proportions ƒƒƒƒƒƒƒƒƒƒƒƒƒƒƒƒƒƒƒƒƒ Chi-Square 54.2025 DF 5 Pr > ChiSq <.0001 Sample Size = 158 Cumulative Cumulative Q09_5 Frequency Percent Frequency Percent ƒƒƒƒƒƒƒƒƒƒƒƒƒƒƒƒƒƒƒƒƒƒƒƒƒƒƒƒƒƒƒƒƒƒƒƒƒƒƒƒƒƒƒƒƒƒƒƒƒƒƒƒƒƒƒƒƒƒƒƒƒƒƒƒƒƒƒƒƒ 0 1 0.63 1 0.63 Most important 28 17.72 29 18.35 Important 23 14.56 52 32.91 Neutral 28 17.72 80 50.63 Not so important 33 20.89 113 71.52

331
Least important 45 28.48 158 100.00 Chi-Square Test for Equal Proportions ƒƒƒƒƒƒƒƒƒƒƒƒƒƒƒƒƒƒƒƒƒ Chi-Square 39.9241 DF 5 Pr > ChiSq <.0001 Sample Size = 158 Cumulative Cumulative Q10 Frequency Percent Frequency Percent ƒƒƒƒƒƒƒƒƒƒƒƒƒƒƒƒƒƒƒƒƒƒƒƒƒƒƒƒƒƒƒƒƒƒƒƒƒƒƒƒƒƒƒƒƒƒƒƒƒƒƒƒƒƒƒƒ Yes 138 87.34 138 87.34 No 20 12.66 158 100.00 Chi-Square Test for Equal Proportions ƒƒƒƒƒƒƒƒƒƒƒƒƒƒƒƒƒƒƒƒƒ Chi-Square 88.1266 DF 1 Pr > ChiSq <.0001 Sample Size = 158 Cumulative Cumulative Q11 Frequency Percent Frequency Percent ƒƒƒƒƒƒƒƒƒƒƒƒƒƒƒƒƒƒƒƒƒƒƒƒƒƒƒƒƒƒƒƒƒƒƒƒƒƒƒƒƒƒƒƒƒƒƒƒƒƒƒƒƒƒƒƒƒƒƒƒƒƒƒƒƒƒ High 41 25.95 41 25.95 Medium 55 34.81 96 60.76 Low 30 18.99 126 79.75 Do not know 14 8.86 140 88.61 Not discussed 18 11.39 158 100.00 Chi-Square Test for Equal Proportions ƒƒƒƒƒƒƒƒƒƒƒƒƒƒƒƒƒƒƒƒƒ Chi-Square 35.8608 DF 4 Pr > ChiSq <.0001 Sample Size = 158 Cumulative Cumulative Q12 Frequency Percent Frequency Percent ƒƒƒƒƒƒƒƒƒƒƒƒƒƒƒƒƒƒƒƒƒƒƒƒƒƒƒƒƒƒƒƒƒƒƒƒƒƒƒƒƒƒƒƒƒƒƒƒƒƒƒƒƒƒƒƒƒƒƒƒƒƒƒƒƒƒ High 40 25.32 40 25.32 Medium 64 40.51 104 65.82 Low 35 22.15 139 87.97 Do not know 7 4.43 146 92.41 Not discussed 12 7.59 158 100.00 Chi-Square Test for Equal Proportions ƒƒƒƒƒƒƒƒƒƒƒƒƒƒƒƒƒƒƒƒƒ Chi-Square 67.1266 DF 4 Pr > ChiSq <.0001 Sample Size = 158 Cumulative Cumulative Q13 Frequency Percent Frequency Percent ƒƒƒƒƒƒƒƒƒƒƒƒƒƒƒƒƒƒƒƒƒƒƒƒƒƒƒƒƒƒƒƒƒƒƒƒƒƒƒƒƒƒƒƒƒƒƒƒƒƒƒƒƒƒƒƒƒƒƒƒƒƒƒƒƒƒ High 66 41.77 66 41.77 Medium 56 35.44 122 77.22 Low 22 13.92 144 91.14 Do not know 7 4.43 151 95.57 Not discussed 7 4.43 158 100.00 Chi-Square Test for Equal Proportions ƒƒƒƒƒƒƒƒƒƒƒƒƒƒƒƒƒƒƒƒƒ Chi-Square 97.5063 DF 4 Pr > ChiSq <.0001 Sample Size = 158 Cumulative Cumulative Q14 Frequency Percent Frequency Percent ƒƒƒƒƒƒƒƒƒƒƒƒƒƒƒƒƒƒƒƒƒƒƒƒƒƒƒƒƒƒƒƒƒƒƒƒƒƒƒƒƒƒƒƒƒƒƒƒƒƒƒƒƒƒƒƒ Yes 97 61.39 97 61.39 No 61 38.61 158 100.00 Chi-Square Test for Equal Proportions ƒƒƒƒƒƒƒƒƒƒƒƒƒƒƒƒƒƒƒƒƒ Chi-Square 8.2025 DF 1 Pr > ChiSq 0.0042 Sample Size = 158 Cumulative Cumulative Q15_01 Frequency Percent Frequency Percent ƒƒƒƒƒƒƒƒƒƒƒƒƒƒƒƒƒƒƒƒƒƒƒƒƒƒƒƒƒƒƒƒƒƒƒƒƒƒƒƒƒƒƒƒƒƒƒƒƒƒƒƒƒƒƒƒƒƒƒ Yes 130 82.28 130 82.28 No 28 17.72 158 100.00 Chi-Square Test for Equal Proportions ƒƒƒƒƒƒƒƒƒƒƒƒƒƒƒƒƒƒƒƒƒ Chi-Square 65.8481

332
DF 1 Pr > ChiSq <.0001 Sample Size = 158 Cumulative Cumulative Q15_02 Frequency Percent Frequency Percent ƒƒƒƒƒƒƒƒƒƒƒƒƒƒƒƒƒƒƒƒƒƒƒƒƒƒƒƒƒƒƒƒƒƒƒƒƒƒƒƒƒƒƒƒƒƒƒƒƒƒƒƒƒƒƒƒƒƒƒ Yes 123 77.85 123 77.85 No 35 22.15 158 100.00 Chi-Square Test for Equal Proportions ƒƒƒƒƒƒƒƒƒƒƒƒƒƒƒƒƒƒƒƒƒ Chi-Square 49.0127 DF 1 Pr > ChiSq <.0001 Sample Size = 158 Cumulative Cumulative Q15_03 Frequency Percent Frequency Percent ƒƒƒƒƒƒƒƒƒƒƒƒƒƒƒƒƒƒƒƒƒƒƒƒƒƒƒƒƒƒƒƒƒƒƒƒƒƒƒƒƒƒƒƒƒƒƒƒƒƒƒƒƒƒƒƒƒƒƒ Yes 139 87.97 139 87.97 No 19 12.03 158 100.00 Chi-Square Test for Equal Proportions ƒƒƒƒƒƒƒƒƒƒƒƒƒƒƒƒƒƒƒƒƒ Chi-Square 91.1392 DF 1 Pr > ChiSq <.0001 Sample Size = 158 Cumulative Cumulative Q15_04 Frequency Percent Frequency Percent ƒƒƒƒƒƒƒƒƒƒƒƒƒƒƒƒƒƒƒƒƒƒƒƒƒƒƒƒƒƒƒƒƒƒƒƒƒƒƒƒƒƒƒƒƒƒƒƒƒƒƒƒƒƒƒƒƒƒƒ Yes 93 58.86 93 58.86 No 65 41.14 158 100.00 Chi-Square Test for Equal Proportions ƒƒƒƒƒƒƒƒƒƒƒƒƒƒƒƒƒƒƒƒƒ Chi-Square 4.9620 DF 1 Pr > ChiSq 0.0259 Sample Size = 158 Cumulative Cumulative Q15_05 Frequency Percent Frequency Percent ƒƒƒƒƒƒƒƒƒƒƒƒƒƒƒƒƒƒƒƒƒƒƒƒƒƒƒƒƒƒƒƒƒƒƒƒƒƒƒƒƒƒƒƒƒƒƒƒƒƒƒƒƒƒƒƒƒƒƒ Yes 112 70.89 112 70.89 No 46 29.11 158 100.00 Chi-Square Test for Equal Proportions ƒƒƒƒƒƒƒƒƒƒƒƒƒƒƒƒƒƒƒƒƒ Chi-Square 27.5696 DF 1 Pr > ChiSq <.0001 Sample Size = 158 Cumulative Cumulative Q15_06 Frequency Percent Frequency Percent ƒƒƒƒƒƒƒƒƒƒƒƒƒƒƒƒƒƒƒƒƒƒƒƒƒƒƒƒƒƒƒƒƒƒƒƒƒƒƒƒƒƒƒƒƒƒƒƒƒƒƒƒƒƒƒƒƒƒƒ Yes 84 53.16 84 53.16 No 74 46.84 158 100.00 Chi-Square Test for Equal Proportions ƒƒƒƒƒƒƒƒƒƒƒƒƒƒƒƒƒƒƒƒƒ Chi-Square 0.6329 DF 1 Pr > ChiSq 0.4263 Sample Size = 158 Cumulative Cumulative Q15_07 Frequency Percent Frequency Percent ƒƒƒƒƒƒƒƒƒƒƒƒƒƒƒƒƒƒƒƒƒƒƒƒƒƒƒƒƒƒƒƒƒƒƒƒƒƒƒƒƒƒƒƒƒƒƒƒƒƒƒƒƒƒƒƒƒƒƒ Yes 109 68.99 109 68.99 No 49 31.01 158 100.00 Chi-Square Test for Equal Proportions ƒƒƒƒƒƒƒƒƒƒƒƒƒƒƒƒƒƒƒƒƒ Chi-Square 22.7848 DF 1 Pr > ChiSq <.0001 Sample Size = 158 Cumulative Cumulative Q15_08 Frequency Percent Frequency Percent ƒƒƒƒƒƒƒƒƒƒƒƒƒƒƒƒƒƒƒƒƒƒƒƒƒƒƒƒƒƒƒƒƒƒƒƒƒƒƒƒƒƒƒƒƒƒƒƒƒƒƒƒƒƒƒƒƒƒƒ Yes 103 65.19 103 65.19 No 55 34.81 158 100.00 Chi-Square Test for Equal Proportions ƒƒƒƒƒƒƒƒƒƒƒƒƒƒƒƒƒƒƒƒƒ Chi-Square 14.5823 DF 1

333
Pr > ChiSq 0.0001 Sample Size = 158 Cumulative Cumulative Q15_09 Frequency Percent Frequency Percent ƒƒƒƒƒƒƒƒƒƒƒƒƒƒƒƒƒƒƒƒƒƒƒƒƒƒƒƒƒƒƒƒƒƒƒƒƒƒƒƒƒƒƒƒƒƒƒƒƒƒƒƒƒƒƒƒƒƒƒ Yes 79 50.00 79 50.00 No 79 50.00 158 100.00 Chi-Square Test for Equal Proportions ƒƒƒƒƒƒƒƒƒƒƒƒƒƒƒƒƒƒƒƒƒ Chi-Square 0.0000 DF 1 Pr > ChiSq 1.0000 Sample Size = 158 Cumulative Cumulative Q15_10 Frequency Percent Frequency Percent ƒƒƒƒƒƒƒƒƒƒƒƒƒƒƒƒƒƒƒƒƒƒƒƒƒƒƒƒƒƒƒƒƒƒƒƒƒƒƒƒƒƒƒƒƒƒƒƒƒƒƒƒƒƒƒƒƒƒƒ Yes 105 66.46 105 66.46 No 53 33.54 158 100.00 Chi-Square Test for Equal Proportions ƒƒƒƒƒƒƒƒƒƒƒƒƒƒƒƒƒƒƒƒƒ Chi-Square 17.1139 DF 1 Pr > ChiSq <.0001 Sample Size = 158 Cumulative Cumulative Q15_11 Frequency Percent Frequency Percent ƒƒƒƒƒƒƒƒƒƒƒƒƒƒƒƒƒƒƒƒƒƒƒƒƒƒƒƒƒƒƒƒƒƒƒƒƒƒƒƒƒƒƒƒƒƒƒƒƒƒƒƒƒƒƒƒƒƒƒ Yes 6 3.80 6 3.80 No 152 96.20 158 100.00 Chi-Square Test for Equal Proportions ƒƒƒƒƒƒƒƒƒƒƒƒƒƒƒƒƒƒƒƒƒ Chi-Square 134.9114 DF 1 Pr > ChiSq <.0001 Sample Size = 158 Cumulative Cumulative Q16 Frequency Percent Frequency Percent ƒƒƒƒƒƒƒƒƒƒƒƒƒƒƒƒƒƒƒƒƒƒƒƒƒƒƒƒƒƒƒƒƒƒƒƒƒƒƒƒƒƒƒƒƒƒƒƒƒƒƒƒƒƒƒƒƒƒƒƒƒƒƒƒƒƒƒƒƒ Completed RMFW 19 12.03 19 12.03 Partial RMFW 31 19.62 50 31.65 Plan RMFW 44 27.85 94 59.49 Investigate RMFW 26 16.46 120 75.95 Do not plan RMFW 38 24.05 158 100.00 Chi-Square Test for Equal Proportions ƒƒƒƒƒƒƒƒƒƒƒƒƒƒƒƒƒƒƒƒƒ Chi-Square 12.1899 DF 4 Pr > ChiSq 0.0160 Sample Size = 158 Cumulative Cumulative Q17_01 Frequency Percent Frequency Percent ƒƒƒƒƒƒƒƒƒƒƒƒƒƒƒƒƒƒƒƒƒƒƒƒƒƒƒƒƒƒƒƒƒƒƒƒƒƒƒƒƒƒƒƒƒƒƒƒƒƒƒƒƒƒƒƒƒƒƒ Yes 116 73.42 116 73.42 No 42 26.58 158 100.00 Chi-Square Test for Equal Proportions ƒƒƒƒƒƒƒƒƒƒƒƒƒƒƒƒƒƒƒƒƒ Chi-Square 34.6582 DF 1 Pr > ChiSq <.0001 Sample Size = 158 Cumulative Cumulative Q17_02 Frequency Percent Frequency Percent ƒƒƒƒƒƒƒƒƒƒƒƒƒƒƒƒƒƒƒƒƒƒƒƒƒƒƒƒƒƒƒƒƒƒƒƒƒƒƒƒƒƒƒƒƒƒƒƒƒƒƒƒƒƒƒƒƒƒƒ Yes 87 55.06 87 55.06 No 71 44.94 158 100.00 Chi-Square Test for Equal Proportions ƒƒƒƒƒƒƒƒƒƒƒƒƒƒƒƒƒƒƒƒƒ Chi-Square 1.6203 DF 1 Pr > ChiSq 0.2031 Sample Size = 158 Cumulative Cumulative Q17_03 Frequency Percent Frequency Percent ƒƒƒƒƒƒƒƒƒƒƒƒƒƒƒƒƒƒƒƒƒƒƒƒƒƒƒƒƒƒƒƒƒƒƒƒƒƒƒƒƒƒƒƒƒƒƒƒƒƒƒƒƒƒƒƒƒƒƒ Yes 39 24.68 39 24.68 No 119 75.32 158 100.00 Chi-Square Test for Equal Proportions ƒƒƒƒƒƒƒƒƒƒƒƒƒƒƒƒƒƒƒƒƒ

334
Chi-Square 40.5063 DF 1 Pr > ChiSq <.0001 Sample Size = 158 Cumulative Cumulative Q17_04 Frequency Percent Frequency Percent ƒƒƒƒƒƒƒƒƒƒƒƒƒƒƒƒƒƒƒƒƒƒƒƒƒƒƒƒƒƒƒƒƒƒƒƒƒƒƒƒƒƒƒƒƒƒƒƒƒƒƒƒƒƒƒƒƒƒƒ Yes 89 56.33 89 56.33 No 69 43.67 158 100.00 Chi-Square Test for Equal Proportions ƒƒƒƒƒƒƒƒƒƒƒƒƒƒƒƒƒƒƒƒƒ Chi-Square 2.5316 DF 1 Pr > ChiSq 0.1116 Sample Size = 158 Cumulative Cumulative Q17_05 Frequency Percent Frequency Percent ƒƒƒƒƒƒƒƒƒƒƒƒƒƒƒƒƒƒƒƒƒƒƒƒƒƒƒƒƒƒƒƒƒƒƒƒƒƒƒƒƒƒƒƒƒƒƒƒƒƒƒƒƒƒƒƒƒƒƒ Yes 56 35.44 56 35.44 No 102 64.56 158 100.00 Chi-Square Test for Equal Proportions ƒƒƒƒƒƒƒƒƒƒƒƒƒƒƒƒƒƒƒƒƒ Chi-Square 13.3924 DF 1 Pr > ChiSq 0.0003 Sample Size = 158 Cumulative Cumulative Q17_06 Frequency Percent Frequency Percent ƒƒƒƒƒƒƒƒƒƒƒƒƒƒƒƒƒƒƒƒƒƒƒƒƒƒƒƒƒƒƒƒƒƒƒƒƒƒƒƒƒƒƒƒƒƒƒƒƒƒƒƒƒƒƒƒƒƒƒ Yes 20 12.66 20 12.66 No 138 87.34 158 100.00 Chi-Square Test for Equal Proportions ƒƒƒƒƒƒƒƒƒƒƒƒƒƒƒƒƒƒƒƒƒ Chi-Square 88.1266 DF 1 Pr > ChiSq <.0001 Sample Size = 158 Cumulative Cumulative Q17_07 Frequency Percent Frequency Percent ƒƒƒƒƒƒƒƒƒƒƒƒƒƒƒƒƒƒƒƒƒƒƒƒƒƒƒƒƒƒƒƒƒƒƒƒƒƒƒƒƒƒƒƒƒƒƒƒƒƒƒƒƒƒƒƒƒƒƒ No 158 100.00 158 100.00 Chi-Square Test for Equal Proportions ƒƒƒƒƒƒƒƒƒƒƒƒƒƒƒƒƒƒƒƒƒ Chi-Square 0.0000 DF 0 Pr > ChiSq . Sample Size = 158 Cumulative Cumulative Q17_1 Frequency Percent Frequency Percent ƒƒƒƒƒƒƒƒƒƒƒƒƒƒƒƒƒƒƒƒƒƒƒƒƒƒƒƒƒƒƒƒƒƒƒƒƒƒƒƒƒƒƒƒƒƒƒƒƒƒƒƒƒƒƒƒƒƒƒƒƒƒƒƒƒƒƒƒƒƒƒƒƒƒƒƒƒƒƒƒƒƒƒƒƒƒƒƒƒƒƒƒƒƒƒ Handled by himself 1 100.00 1 100.00 Cumulative Cumulative Q18_01 Frequency Percent Frequency Percent ƒƒƒƒƒƒƒƒƒƒƒƒƒƒƒƒƒƒƒƒƒƒƒƒƒƒƒƒƒƒƒƒƒƒƒƒƒƒƒƒƒƒƒƒƒƒƒƒƒƒƒƒƒƒƒƒƒƒƒ Yes 92 58.23 92 58.23 No 66 41.77 158 100.00 Chi-Square Test for Equal Proportions ƒƒƒƒƒƒƒƒƒƒƒƒƒƒƒƒƒƒƒƒƒ Chi-Square 4.2785 DF 1 Pr > ChiSq 0.0386 Sample Size = 158 Cumulative Cumulative Q18_02 Frequency Percent Frequency Percent ƒƒƒƒƒƒƒƒƒƒƒƒƒƒƒƒƒƒƒƒƒƒƒƒƒƒƒƒƒƒƒƒƒƒƒƒƒƒƒƒƒƒƒƒƒƒƒƒƒƒƒƒƒƒƒƒƒƒƒ Yes 120 75.95 120 75.95 No 38 24.05 158 100.00 Chi-Square Test for Equal Proportions ƒƒƒƒƒƒƒƒƒƒƒƒƒƒƒƒƒƒƒƒƒ Chi-Square 42.5570 DF 1 Pr > ChiSq <.0001 Sample Size = 158 Cumulative Cumulative Q18_03 Frequency Percent Frequency Percent ƒƒƒƒƒƒƒƒƒƒƒƒƒƒƒƒƒƒƒƒƒƒƒƒƒƒƒƒƒƒƒƒƒƒƒƒƒƒƒƒƒƒƒƒƒƒƒƒƒƒƒƒƒƒƒƒƒƒƒ Yes 32 20.25 32 20.25 No 126 79.75 158 100.00

335
Chi-Square Test for Equal Proportions ƒƒƒƒƒƒƒƒƒƒƒƒƒƒƒƒƒƒƒƒƒ Chi-Square 55.9241 DF 1 Pr > ChiSq <.0001 Sample Size = 158 Cumulative Cumulative Q18_04 Frequency Percent Frequency Percent ƒƒƒƒƒƒƒƒƒƒƒƒƒƒƒƒƒƒƒƒƒƒƒƒƒƒƒƒƒƒƒƒƒƒƒƒƒƒƒƒƒƒƒƒƒƒƒƒƒƒƒƒƒƒƒƒƒƒƒ Yes 3 1.90 3 1.90 No 155 98.10 158 100.00 Chi-Square Test for Equal Proportions ƒƒƒƒƒƒƒƒƒƒƒƒƒƒƒƒƒƒƒƒƒ Chi-Square 146.2278 DF 1 Pr > ChiSq <.0001 Sample Size = 158 Cumulative Cumulative Q18_1 Frequency Percent Frequency Percent ƒƒƒƒƒƒƒƒƒƒƒƒƒƒƒƒƒƒƒƒƒƒƒƒƒƒƒƒƒƒƒƒƒƒƒƒƒƒƒƒƒƒƒƒƒƒƒƒƒƒƒƒƒƒƒƒƒƒƒƒƒƒƒƒƒƒƒƒƒƒƒƒƒƒƒƒƒƒƒƒƒƒƒƒƒƒƒƒƒƒƒƒƒƒƒ Investigate risk properly and discuss appropriate 1 50.00 1 50.00 action to take Security - late night functions 1 50.00 2 100.00 Cumulative Cumulative Q19 Frequency Percent Frequency Percent ƒƒƒƒƒƒƒƒƒƒƒƒƒƒƒƒƒƒƒƒƒƒƒƒƒƒƒƒƒƒƒƒƒƒƒƒƒƒƒƒƒƒƒƒƒƒƒƒƒƒƒƒƒƒƒƒ 1 59 37.34 59 37.34 2 17 10.76 76 48.10 3 45 28.48 121 76.58 4 2 1.27 123 77.85 5 35 22.15 158 100.00 Chi-Square Test for Equal Proportions ƒƒƒƒƒƒƒƒƒƒƒƒƒƒƒƒƒƒƒƒƒ Chi-Square 64.2785 DF 4 Pr > ChiSq <.0001 Sample Size = 158 Cumulative Cumulative Q19_1 Frequency Percent Frequency Percent ƒƒƒƒƒƒƒƒƒƒƒƒƒƒƒƒƒƒƒƒƒƒƒƒƒƒƒƒƒƒƒƒƒƒƒƒƒƒƒƒƒƒƒƒƒƒƒƒƒƒƒƒƒƒƒƒƒƒƒƒƒƒƒƒƒƒƒƒƒƒƒƒƒƒƒƒƒƒƒƒƒƒƒƒƒƒƒƒƒƒƒƒƒƒƒ Cumulative Cumulative Q20_1 Frequency Percent Frequency Percent ƒƒƒƒƒƒƒƒƒƒƒƒƒƒƒƒƒƒƒƒƒƒƒƒƒƒƒƒƒƒƒƒƒƒƒƒƒƒƒƒƒƒƒƒƒƒƒƒƒƒƒƒƒƒƒƒƒƒ Yes 49 31.01 49 31.01 No 109 68.99 158 100.00 Chi-Square Test for Equal Proportions ƒƒƒƒƒƒƒƒƒƒƒƒƒƒƒƒƒƒƒƒƒ Chi-Square 22.7848 DF 1 Pr > ChiSq <.0001 Sample Size = 158 Cumulative Cumulative Q20_2 Frequency Percent Frequency Percent ƒƒƒƒƒƒƒƒƒƒƒƒƒƒƒƒƒƒƒƒƒƒƒƒƒƒƒƒƒƒƒƒƒƒƒƒƒƒƒƒƒƒƒƒƒƒƒƒƒƒƒƒƒƒƒƒƒƒ Yes 36 22.78 36 22.78 No 122 77.22 158 100.00 Chi-Square Test for Equal Proportions ƒƒƒƒƒƒƒƒƒƒƒƒƒƒƒƒƒƒƒƒƒ Chi-Square 46.8101 DF 1 Pr > ChiSq <.0001 Sample Size = 158 Q20_3 Cumulative Cumulative Q20_3 Frequency Percent Frequency Percent ƒƒƒƒƒƒƒƒƒƒƒƒƒƒƒƒƒƒƒƒƒƒƒƒƒƒƒƒƒƒƒƒƒƒƒƒƒƒƒƒƒƒƒƒƒƒƒƒƒƒƒƒƒƒƒƒƒƒ Yes 51 32.28 51 32.28 No 107 67.72 158 100.00 Chi-Square Test for Equal Proportions ƒƒƒƒƒƒƒƒƒƒƒƒƒƒƒƒƒƒƒƒƒ Chi-Square 19.8481 DF 1 Pr > ChiSq <.0001 Sample Size = 158 Cumulative Cumulative Q20_4 Frequency Percent Frequency Percent

336
ƒƒƒƒƒƒƒƒƒƒƒƒƒƒƒƒƒƒƒƒƒƒƒƒƒƒƒƒƒƒƒƒƒƒƒƒƒƒƒƒƒƒƒƒƒƒƒƒƒƒƒƒƒƒƒƒƒƒ Yes 45 28.48 45 28.48 No 113 71.52 158 100.00 Chi-Square Test for Equal Proportions ƒƒƒƒƒƒƒƒƒƒƒƒƒƒƒƒƒƒƒƒƒ Chi-Square 29.2658 DF 1 Pr > ChiSq <.0001 Sample Size = 158 Cumulative Cumulative Q20_5 Frequency Percent Frequency Percent ƒƒƒƒƒƒƒƒƒƒƒƒƒƒƒƒƒƒƒƒƒƒƒƒƒƒƒƒƒƒƒƒƒƒƒƒƒƒƒƒƒƒƒƒƒƒƒƒƒƒƒƒƒƒƒƒƒƒ Yes 47 29.75 47 29.75 No 111 70.25 158 100.00 Chi-Square Test for Equal Proportions ƒƒƒƒƒƒƒƒƒƒƒƒƒƒƒƒƒƒƒƒƒ Chi-Square 25.9241 DF 1 Pr > ChiSq <.0001 Sample Size = 158 Cumulative Cumulative Q20_6 Frequency Percent Frequency Percent ƒƒƒƒƒƒƒƒƒƒƒƒƒƒƒƒƒƒƒƒƒƒƒƒƒƒƒƒƒƒƒƒƒƒƒƒƒƒƒƒƒƒƒƒƒƒƒƒƒƒƒƒƒƒƒƒƒƒ Yes 36 22.78 36 22.78 No 122 77.22 158 100.00 Chi-Square Test for Equal Proportions ƒƒƒƒƒƒƒƒƒƒƒƒƒƒƒƒƒƒƒƒƒ Chi-Square 46.8101 DF 1 Pr > ChiSq <.0001 Sample Size = 158 Cumulative Cumulative Q20_7 Frequency Percent Frequency Percent ƒƒƒƒƒƒƒƒƒƒƒƒƒƒƒƒƒƒƒƒƒƒƒƒƒƒƒƒƒƒƒƒƒƒƒƒƒƒƒƒƒƒƒƒƒƒƒƒƒƒƒƒƒƒƒƒƒƒ Yes 70 44.30 70 44.30 No 88 55.70 158 100.00 Chi-Square Test for Equal Proportions ƒƒƒƒƒƒƒƒƒƒƒƒƒƒƒƒƒƒƒƒƒ Chi-Square 2.0506 DF 1 Pr > ChiSq 0.1521 Sample Size = 158 Cumulative Cumulative Q20_8 Frequency Percent Frequency Percent ƒƒƒƒƒƒƒƒƒƒƒƒƒƒƒƒƒƒƒƒƒƒƒƒƒƒƒƒƒƒƒƒƒƒƒƒƒƒƒƒƒƒƒƒƒƒƒƒƒƒƒƒƒƒƒƒƒƒ Yes 52 32.91 52 32.91 No 106 67.09 158 100.00 Chi-Square Test for Equal Proportions ƒƒƒƒƒƒƒƒƒƒƒƒƒƒƒƒƒƒƒƒƒ Chi-Square 18.4557 DF 1 Pr > ChiSq <.0001 Sample Size = 158 Cumulative Cumulative Q21 Frequency Percent Frequency Percent ƒƒƒƒƒƒƒƒƒƒƒƒƒƒƒƒƒƒƒƒƒƒƒƒƒƒƒƒƒƒƒƒƒƒƒƒƒƒƒƒƒƒƒƒƒƒƒƒƒƒƒƒƒƒƒƒ Yes 62 39.24 62 39.24 No 96 60.76 158 100.00 Chi-Square Test for Equal Proportions ƒƒƒƒƒƒƒƒƒƒƒƒƒƒƒƒƒƒƒƒƒ Chi-Square 7.3165 DF 1 Pr > ChiSq 0.0068 Sample Size = 158

337
APPENDIX C Cronbach Alpha Coefficients
Simple Statistics Variable N Mean Std Dev Sum Minimum Maximum Label Q06_01 158 1.60759 0.48984 254.00000 1.00000 2.00000 Q06_01 Q06_02 158 1.64557 0.47986 260.00000 1.00000 2.00000 Q06_02 Q06_03 158 1.81646 0.38834 287.00000 1.00000 2.00000 Q06_03 Q06_04 158 1.81646 0.38834 287.00000 1.00000 2.00000 Q06_04 Q06_05 158 1.67089 0.47139 264.00000 1.00000 2.00000 Q06_05 Q06_06 158 1.84177 0.36611 291.00000 1.00000 2.00000 Q06_06 Q06_07 158 1.84177 0.36611 291.00000 1.00000 2.00000 Q06_07 q06_08n 158 1.32911 0.47139 210.00000 1.00000 2.00000 Q06_09 158 1.98101 0.13691 313.00000 1.00000 2.00000 Q06_09 q07_1_1n 158 1.38608 0.48840 219.00000 1.00000 2.00000 Q07_2_01 158 1.77848 0.41659 281.00000 1.00000 2.00000 Q07_2_01 Q07_2_02 158 1.72152 0.44968 272.00000 1.00000 2.00000 Q07_2_02 Q07_2_03 158 1.61392 0.48840 255.00000 1.00000 2.00000 Q07_2_03 Q07_2_04 158 1.81013 0.39345 286.00000 1.00000 2.00000 Q07_2_04 Q07_2_05 158 1.79747 0.40316 284.00000 1.00000 2.00000 Q07_2_05 Q07_2_06 158 1.77215 0.42078 280.00000 1.00000 2.00000 Q07_2_06 Q07_2_07 158 1.91139 0.28508 302.00000 1.00000 2.00000 Q07_2_07 Q07_2_08 158 1.95570 0.20642 309.00000 1.00000 2.00000 Q07_2_08 Q08 158 1.14557 0.35380 181.00000 1.00000 2.00000 Q08 Q09_1 157 2.85987 1.39807 449.00000 1.00000 5.00000 Q09_1 Q09_2 157 2.78981 1.32061 438.00000 1.00000 5.00000 Q09_2 Q09_3 157 3.01274 1.50634 473.00000 1.00000 5.00000 Q09_3 Q09_4 157 2.60510 1.47091 409.00000 1.00000 5.00000 Q09_4 Q09_5 157 3.28025 1.46688 515.00000 1.00000 5.00000 Q09_5 Q10 158 1.12658 0.33356 178.00000 1.00000 2.00000 Q10 Q11 158 2.44937 1.27967 387.00000 1.00000 5.00000 Q11 Q12 158 2.28481 1.12353 361.00000 1.00000 5.00000 Q12 Q13 158 1.94304 1.06624 307.00000 1.00000 5.00000 Q13 Q14 158 1.38608 0.48840 219.00000 1.00000 2.00000 Q14 Q15_01 158 1.17722 0.38306 186.00000 1.00000 2.00000 Q15_01 Q15_02 158 1.22152 0.41659 193.00000 1.00000 2.00000 Q15_02 Q15_03 158 1.12025 0.32629 177.00000 1.00000 2.00000 Q15_03 Q15_04 158 1.41139 0.49365 223.00000 1.00000 2.00000 Q15_04 Q15_05 158 1.29114 0.45573 204.00000 1.00000 2.00000 Q15_05 Q15_06 158 1.46835 0.50058 232.00000 1.00000 2.00000 Q15_06 Q15_07 158 1.31013 0.46402 207.00000 1.00000 2.00000 Q15_07 Q15_08 158 1.34810 0.47788 213.00000 1.00000 2.00000 Q15_08 Q15_09 158 1.50000 0.50159 237.00000 1.00000 2.00000 Q15_09 Q15_10 158 1.33544 0.47365 211.00000 1.00000 2.00000 Q15_10 q15_11n 158 1.03797 0.19174 164.00000 1.00000 2.00000 Q16 158 3.20886 1.33093 507.00000 1.00000 5.00000 Q16 Q17_01 158 1.26582 0.44318 200.00000 1.00000 2.00000 Q17_01 Q17_02 158 1.44937 0.49901 229.00000 1.00000 2.00000 Q17_02 Q17_03 158 1.75316 0.43254 277.00000 1.00000 2.00000 Q17_03 Q17_04 158 1.43671 0.49756 227.00000 1.00000 2.00000 Q17_04 Q17_05 158 1.64557 0.47986 260.00000 1.00000 2.00000 Q17_05 q17_06n 158 1.12658 0.33356 178.00000 1.00000 2.00000 Q18_01 158 1.41772 0.49475 224.00000 1.00000 2.00000 Q18_01 Q18_02 158 1.24051 0.42875 196.00000 1.00000 2.00000 Q18_02 Q18_03 158 1.79747 0.40316 284.00000 1.00000 2.00000 Q18_03 Q18_04 158 1.98101 0.13691 313.00000 1.00000 2.00000 Q18_04 Q19 158 2.60127 1.53490 411.00000 1.00000 5.00000 Q19 q20_1n 158 1.31013 0.46402 207.00000 1.00000 2.00000 Q20_2 158 1.77215 0.42078 280.00000 1.00000 2.00000 Q20_2 Q20_3 158 1.67722 0.46903 265.00000 1.00000 2.00000 Q20_3 Q20_4 158 1.71519 0.45276 271.00000 1.00000 2.00000 Q20_4 Q20_5 158 1.70253 0.45860 269.00000 1.00000 2.00000 Q20_5 Q20_6 158 1.77215 0.42078 280.00000 1.00000 2.00000 Q20_6 Q20_7 158 1.55696 0.49832 246.00000 1.00000 2.00000 Q20_7 Q20_8 158 1.67089 0.47139 264.00000 1.00000 2.00000 Q20_8 Cronbach Coefficient Alpha Variables Alpha ƒƒƒƒƒƒƒƒƒƒƒƒƒƒƒƒƒƒƒƒƒƒƒƒƒƒƒƒ Raw 0.759912 Standardized 0.826737 Cronbach Coefficient Alpha with Deleted Variable Raw Variables Standardized Variables Deleted Correlation Correlation Variable with Total Alpha with Total Alpha Label ƒƒƒƒƒƒƒƒƒƒƒƒƒƒƒƒƒƒƒƒƒƒƒƒƒƒƒƒƒƒƒƒƒƒƒƒƒƒƒƒƒƒƒƒƒƒƒƒƒƒƒƒƒƒƒƒƒƒƒƒƒƒƒƒƒƒƒƒƒƒƒƒƒƒƒƒƒƒƒƒƒƒƒƒ Q06_01 0.240717 0.755962 0.252226 0.824192 Q06_01 Q06_02 0.325871 0.753956 0.345306 0.822172 Q06_02 Q06_03 0.168426 0.757951 0.170144 0.825956 Q06_03 Q06_04 0.268883 0.756002 0.246054 0.824325 Q06_04 Q06_05 0.316195 0.754268 0.332544 0.822450 Q06_05 Q06_06 0.155256 0.758258 0.136740 0.826669 Q06_06 Q06_07 0.216944 0.757133 0.203462 0.825241 Q06_07 q06_08n 0.477256 0.750408 0.489306 0.819006 Q06_09 0.078731 0.759729 0.041883 0.828680 Q06_09 q07_1_1n 0.163996 0.757842 0.251917 0.824198 Q07_2_01 0.106754 0.759151 0.116425 0.827101 Q07_2_01 Q07_2_02 0.238708 0.756223 0.275869 0.823680 Q07_2_02 Q07_2_03 0.221885 0.756431 0.316032 0.822809 Q07_2_03 Q07_2_04 0.192128 0.757472 0.227154 0.824732 Q07_2_04 Q07_2_05 0.059086 0.760095 0.142378 0.826549 Q07_2_05 Q07_2_06 0.011951 0.761122 0.080756 0.827858 Q07_2_06 Q07_2_07 0.123388 0.758961 0.148261 0.826423 Q07_2_07 Q07_2_08 -.081933 0.761260 -.122191 0.832108 Q07_2_08 Q08 0.172492 0.757987 0.111468 0.827207 Q08 Q09_1 0.206491 0.760069 0.138650 0.826628 Q09_1

338
Q09_2 -.002955 0.772703 0.021274 0.829114 Q09_2 Q09_3 0.168241 0.764200 0.149487 0.826397 Q09_3 Q09_4 0.248443 0.757833 0.178422 0.825778 Q09_4 Q09_5 -.022651 0.777024 -.021449 0.830011 Q09_5 Q10 0.170388 0.758098 0.094588 0.827565 Q10 Q11 0.383780 0.747321 0.285224 0.823478 Q11 Q12 0.319743 0.751251 0.221212 0.824860 Q12 Q13 0.388230 0.747473 0.292864 0.823312 Q13 Q14 0.314898 0.754146 0.354148 0.821979 Q14 Q15_01 0.273998 0.755946 0.332672 0.822447 Q15_01 Q15_02 0.335924 0.754379 0.404722 0.820871 Q15_02 Q15_03 0.252333 0.756793 0.334143 0.822415 Q15_03 Q15_04 0.370355 0.752713 0.404692 0.820872 Q15_04 Q15_05 0.285125 0.755127 0.321261 0.822695 Q15_05 Q15_06 0.402368 0.751817 0.444942 0.819986 Q15_06 Q15_07 0.359716 0.753315 0.399965 0.820976 Q15_07 Q15_08 0.187381 0.757299 0.222159 0.824840 Q15_08 Q15_09 0.362874 0.752811 0.388548 0.821226 Q15_09 Q15_10 0.372889 0.752888 0.410415 0.820746 Q15_10 q15_11n 0.250407 0.758010 0.285365 0.823475 Q16 0.315171 0.752062 0.276409 0.823669 Q16 Q17_01 0.492731 0.750559 0.455403 0.819755 Q17_01 Q17_02 0.211704 0.756642 0.218028 0.824928 Q17_02 Q17_03 0.334187 0.754243 0.352148 0.822022 Q17_03 Q17_04 0.282736 0.754873 0.312440 0.822887 Q17_04 Q17_05 0.324549 0.753988 0.385665 0.821289 Q17_05 q17_06n 0.443137 0.753534 0.458525 0.819687 Q18_01 0.071791 0.760097 0.079727 0.827880 Q18_01 Q18_02 0.329782 0.754379 0.264027 0.823937 Q18_02 Q18_03 -.064071 0.762534 -.069356 0.831011 Q18_03 Q18_04 0.163739 0.759154 0.140009 0.826599 Q18_04 Q19 0.248148 0.758549 0.247825 0.824287 Q19 q20_1n 0.258192 0.755691 0.343433 0.822213 Q20_2 0.090808 0.759486 0.153041 0.826321 Q20_2 Q20_3 0.302340 0.754618 0.379636 0.821421 Q20_3 Q20_4 0.238014 0.756221 0.283096 0.823524 Q20_4 Q20_5 0.298226 0.754802 0.380149 0.821410 Q20_5 Q20_6 0.062173 0.760081 0.148855 0.826410 Q20_6 Q20_7 0.318113 0.753978 0.414850 0.820649 Q20_7 Q20_8 0.086870 0.759669 0.194248 0.825439 Q20_8

339
APPENDIX C1
Table 6.1: Cronbach’s Alpha coefficients for survey measuring instrument.
Statements Variable nr. Correlation
with total Cronbach Alpha coefficient
6.1 Area receiving support from external consultants: Financial
Management.
Q06_01 0.2522 0.8242
6.2 Area receiving support from external consultants: Marketing
Management.
Q06_02 0.3453 0.8222
6.3 Area receiving support from external consultants: Operational
Management.
Q06_03 0.1701 0.8260
6.4 Area receiving support from external consultants: Administrative
Management.
Q06_04 0.2460 0.8243
6.5 Area receiving support from external consultants: Information
Technology.
Q06_05 0.3325 0.8224
6.6 Area receiving support from external consultants: Human
Resource Management.
Q06_06 0.1367 0.8267
6.7 Area receiving support from external consultants: Public Relation
Management.
Q06_07 0.2035 0.8252
6.8 Area receiving support from external consultants: None. Q06_08n 0.4893 0.8190
6.9 Area receiving support from external consultants: Other. Q06_09 0.0419 0.8287
7.1.1 Business experienced no problems. Q07_1_01n 0.2519 0.8242
7.2.1 Business experience problems due to: Default payments by
debtors.
Q07_2_01 0.1164 0.8271
7.2.2 Business experience problems due to: Overspending or excessive
expenditure.
Q07_2_02 0.2759 0.8237
7.2.3 Business experience problems due to: Theft of business
resources.
Q07_2_03 0.3160 0.8228
7.2.4 Business experience problems due to: Information Technology
inefficiencies.
Q07_2_04 0.2272 0.8247
7.2.5 Business experience problems due to: Personnel – lack of skill. Q07_2_05 0.1424 0.8265
7.2.6 Business experience problems due to: Operational problems. Q07_2_06 0.0808 0.8279
7.2.7 Business experience problems due to: Catastrophic event. Q07_2_07 0.1483 0.8264
7.2.8 Business experience problems due to: Other. Q07_2_08 -0.1222 0.8321
8. Are your business objectives and strategies clearly defined to help
determine which activities are critical for the survival of your
business?
Q08 0.1115 0.8272
9.1 Management risk. Q09_1 0.1386 0.8266
9.2 Commercial risk. Q09_2 0.0213 0.8291
9.3 Technological risk. Q09_3 0.1495 0.8264
9.4 Financial risk. Q09_4 0.1784 0.8258
9.5 Entrepreneurial risk. Q09_5 -0.0214 0.8300
10. Do you have a clear understanding of the risks that have an impact
on your business structure and processes?
Q10 0.0946 0.8276

340
Statements Variable nr. Correlation
with total
Cronbach Alpha
coefficient
11. To what extent are risks discussed in your business strategic
planning?
Q11 0.2852 0.8235
12. To what extent are risks discussed in your business operational
planning?
Q12 0.2212 0.8249
13. To what extent are risks discussed in your business financial
planning?
Q13 0.2929 0.8233
14. Would you be interested in a risk framework? Q14 0.3541 0.8220
15.1 Factors to motivate implementation of risk framework: Improved
customer service.
Q15_01 0.3327 0.8224
15.2 Factors to motivate implementation of risk framework: Minimised
costs.
Q15_02 0.4047 0.8209
15.3 Factors to motivate implementation of risk framework: Maximise
profit.
Q15_03 0.3341 0.8224
15.4 Factors to motivate implementation of risk framework: Reliable
business information.
Q15_04 0.4047 0.8209
15.5 Factors to motivate implementation of risk framework:
Safeguarding of assets.
Q15_05 0.3213 0.8227
15.6 Factors to motivate implementation of risk framework: Regulatory
compliance.
Q15_06 0.4449 0.8200
15.7 Factors to motivate implementation of risk framework: Fraud
prevention / detection.
Q15_07 0.4000 0.8210
15.8 Factors to motivate implementation of risk framework: Continuity of
operations.
Q15_08 0.2222 0.8248
15.9 Factors to motivate implementation of risk framework: Internal
compliance.
Q15_09 0.3885 0.8212
15.10 Factors to motivate implementation of risk framework: Minimise the
occurrence of unforeseen events.
Q15_10 0.4104 0.8207
15.11 Factors to motivate implementation of risk framework: None. Q15_11n 0.2854 0.8235
16. How would you characterise the status of your risk management
framework?
Q16 0.2764 0.8237
17.1 Functions where formal risk identification and assessment is taking
place: Finance.
Q17_01 0.4554 0.8198
17.2 Functions where formal risk identification and assessment is taking
place: Sales / Marketing.
Q17_02 0.2180 0.8249
17.3 Functions where formal risk identification and assessment is taking
place: Human Resources.
Q17_03 0.3521 0.8220
17.4 Functions where formal risk identification and assessment is taking
place: Operational.
Q17_04 0.3124 0.8229
17.5 Functions where formal risk identification and assessment is taking
place: Procurement.
Q17_05 0.3857 0.8213
17.6 Functions where formal risk identification and assessment is taking
place: None.
Q17_06n 0.4585 0.8197
17.7 Functions where formal risk identification and assessment is taking
place: Other.
Q17_07 Left out due to only “No” responses

341
Statements Variable nr. Correlation
with total
Cronbach Alpha
coefficient
18.1 Action engaged in when risks are identified: Take out insurance. Q18_01 0.0797 0.8279
18.2 Action engaged in when risks are identified: Improve internal
controls.
Q18_02 0.2640 0.8239
18.3 Action engaged in when risks are identified: Do not engage in the
identified activity.
Q18_03 -0.0694 0.8310
18.4 Action engaged in when risks are identified: Other. Q18_04 0.1400 0.8266
19. How do you implement or plan to implement risk management
activities?
Q19 0.2478 0.8243
20.1 Obstacles for implementing RMF: No obstacles. Q20_01n 0.3434 0.8222
20.2 Obstacles for implementing RMF: Not perceived as a priority by
management.
Q20_02 0.1530 0.8263
20.3 Obstacles for implementing RMF: Lack of formalised processes. Q20_03 0.3796 0.8214
20.4 Obstacles for implementing RMF: Lack of technology. Q20_04 0.2831 0.8235
20.5 Obstacles for implementing RMF: Lack of intellectual capital. Q20_05 0.3801 0.8214
20.6 Obstacles for implementing RMF: Benefit does not justify the effort. Q20_06 0.1489 0.8264
20.7 Obstacles for implementing RMF: Cost. Q20_07 0.4149 0.8206
20.8 Obstacles for implementing RMF: Lack of skills. Q20_08 0.1942 0.8254
Cronbach’s Coefficient Alpha for standardised variables 0.8267
Cronbach’s Coefficient Alpha for raw variables 0.7599

342
APPENDIX C2
Table 6.2: Descriptive statistics for all the variables.
Variables Categories Frequency Percentage out of total
Biographic information of companies
1. What is the annual turnover of your
business?
>R25million 5 3.2%
>R20million–R25million 2 1.3%
>R15million–R20million 2 1.3%
>R10million–R15million 8 5.1%
>R5million–R10million 7 4.4%
>R1million–R5million 24 15.2%
>R500 000–R1 million 17 10.8%
>R300 000–R500 000 14 8.9%
>R150 000–R300 000 33 20.9%
R100 000–R150 000 22 13.9%
<R100 000 24 15.2%
2. How many permanent employees does
your business employ?
>100 3 1.9%
50-100 3 1.9%
21-49 23 14.6%
11-20 27 17.1%
6-10 33 20.9%
1-5 69 43.7%
3. What type of entity is your business? Sole proprietorship 61 38.6%
Partnership 30 19.0%
Close corporation 50 31.6%
Limited company 15 9.5%
Other 2 1.3%
4. What is the age of your business? > 20 years 9 5.7%
11 – 20 years 29 18.4%
6 – 10 years 42 26.6%
3 – 5 years 48 30.4%
< 3 years 30 19.0%
5.1 What is the highest qualification the owner
holds?
Post graduate degree 21 13.3%
Degree 27 17.1%
Diploma 41 26.0%
Post matriculation 18 11.4%
Matriculation Certificate 36 22.8%
Grade 8 – Grade 10 5 3.2%
Grade 7 1 0.6%
None 2 1.3%
Unknown 7 4.4%

343
Variables Categories Frequency Percentage
out of total
5.2 What is the highest qualification the
executive manager holds?
Post graduate degree 15 9.5%
Degree 21 13.3%
Diploma 50 31.6%
Post matriculation 15 9.5%
Matriculation Certificate 33 20.9%
Grade 8 – Grade 10 3 1.9%
Grade 7 1 0.6%
None 9 5.7%
Unknown 11 7.0%
Measuring instrument
6.1 Area receiving support from external
consultants: Financial Management.
Yes 62 39.2%
No 96 60.8%
6.2 Area receiving support from external
consultants: Marketing Management.
Yes 56 35.4%
No 102 64.6%
6.3 Area receiving support from external
consultants: Operational Management.
Yes 29 18.4%
No 129 81.6%
6.4 Area receiving support from external
consultants: Administrative Management.
Yes 29 18.4%
No 129 81.6%
6.5 Area receiving support from external
consultants: Information Technology.
Yes 52 32.9%
No 106 67.1%
6.6 Area receiving support from external
consultants: Human Resource
Management.
Yes 25 15.8%
No 133 84.2%
6.7 Area receiving support from external
consultants: Public Relation Management.
Yes 25 15.8%
No 133 84.2%
6.8 Area receiving support from external
consultants: None.
Yes 52 32.9%
No 106 67.1%
6.9 Area receiving support from external
consultants: Other.
Yes 3 1.9%
No 155 98.1%
7.1.1 Business experienced no problems. Yes 61 38.6%
No 97 61.3%
7.2.1 Business experience problems due to:
Default payments by debtors.
Yes 35 22.2%
No 123 77.8%
7.2.2 Business experience problems due to:
Overspending or excessive expenditure.
Yes 44 27.8%
No 114 72.2%
7.2.3 Business experience problems due to:
Theft of business resources.
Yes 61 38.6%
No 97 61.4%
7.2.4 Business experience problems due to:
Information Technology inefficiencies.
Yes 30 19.0%
No 128 81.0%
7.2.5 Business experience problems due to:
Personnel – lack of skill.
Yes 32 20.2%
No 126 79.8%

344
Variables Categories Frequency Percentage
out of total
7.2.6 Business experience problems due to:
Operational problems.
Yes 36 22.8%
No 122 77.2%
7.2.7 Business experience problems due to:
Catastrophic event.
Yes 14 8.9%
No 144 91.1%
7.2.8 Business experience problems due to:
Other.
Yes 7 4.4%
No 151 95.6%
8. Are your business objectives and
strategies clearly defined to help
determine which activities are critical for
the survival of your business?
Yes 135 85.4%
No 23 14.6%
9.1 Management risk. Most important – 5 38 24.0%
Important – 4 27 17.1%
Less important – 3 35 22.2%
Not so important – 2 33 20.9%
Least important – 1 24 15.2%
Unknown 1 0.6%
9.2 Commercial risk. Most important – 5 35 22.2%
Important – 4 31 19.6%
Less important – 3 43 27.2%
Not so important – 2 28 17.7%
Least important – 1 20 12.7%
Unknown 1 0.6%
9.3 Technological risk. Most important – 5 37 23.4%
Important – 4 28 17.7%
Less important – 3 25 15.8%
Not so important – 2 30 19.0%
Least important – 1 37 23.4%
Unknown 1 0.6%
9.4 Financial risk. Most important – 5 52 32.9%
Important – 4 29 18.4%
Less important – 3 32 20.2%
Not so important – 2 17 10.8%
Least important – 1 27 17.1%
Unknown 1 0.6%
9.5 Entrepreneurial risk. Most important – 5 28 17.7%
Important – 4 23 14.6%
Less important – 3 28 17.7%
Not so important – 2 33 20.9%
Least important – 1 45 28.5%
Unknown 1 0.6%
10. Do you have a clear understanding of the Yes 138 87.3%

345
Variables Categories Frequency Percentage
out of total
risks that have an impact on your
business structure and processes? No 20 12.7%
11. To what extent are risks discussed in your
business strategic planning?
High 41 26.0%
Medium 55 34.8%
Low 30 19.0%
Do not know 14 8.9%
Not discussed 18 11.4%
12. To what extent are risks discussed in your
business operational planning?
High 40 25.3%
Medium 64 40.5%
Low 35 22.2%
Do not know 7 4.4%
Not discussed 12 7.6%
13. To what extent are risks discussed in your
business financial planning?
High 66 41.8%
Medium 56 35.4%
Low 22 13.9%
Do not know 7 4.4%
Not discussed 7 4.4%
14. Would you be interested in a risk
framework?
Yes 97 61.4%
No 61 38.6%
15.1 Factors to motivate implementation of risk
framework: Improved customer service.
Yes 130 82.3%
No 28 17.7%
15.2 Factors to motivate implementation of risk
framework: Minimised costs.
Yes 123 77.8%
No 35 22.2%
15.3 Factors to motivate implementation of risk
framework: Maximise profit.
Yes 139 88.0%
No 19 12.0%
15.4 Factors to motivate implementation of risk
framework: Reliable business information.
Yes 93 58.9%
No 65 41.1%
15.5 Factors to motivate implementation of risk
framework: Safeguarding of assets.
Yes 112 70.9%
No 46 29.1%
15.6 Factors to motivate implementation of risk
framework: Regulatory compliance.
Yes 84 53.2%
No 74 46.8%
15.7 Factors to motivate implementation of risk
framework: Fraud prevention / detection.
Yes 109 69.0%
No 49 31.0%
15.8 Factors to motivate implementation of risk
framework: Continuity of operations.
Yes 103 65.2%
No 55 34.8%
15.9 Factors to motivate implementation of risk
framework: Internal compliance.
Yes 79 50.0%
No 79 50.0%
15.10 Factors to motivate implementation of risk
framework: Minimise the occurrence of
unforeseen events.
Yes 105 66.5%
No 53 33.5%
15.11 Factors to motivate implementation of risk Yes 6 3.8%

346
Variables Categories Frequency Percentage
out of total
framework: None. No 152 96.2%
16. How would you characterise the status of
your risk management framework?
Complete risk
management framework
in place.
19 12.0%
Partial risk management
framework in place.
31 19.6%
Do not have a risk
management framework
in place but plan to
implement one.
44 27.8%
Investigate the concept of
risk management
framework.
26 16.5%
Do not have a risk
management framework
in place and do not plan to
implement one.
38 24.0%
17.1 Functions where formal risk identification
and assessment is taking place: Finance.
Yes 116 73.4%
No 42 26.6%
17.2 Functions where formal risk identification
and assessment is taking place: Sales /
Marketing.
Yes 87 55.1%
No 71 44.9%
17.3 Functions where formal risk identification
and assessment is taking place: Human
Resources.
Yes 39 24.7%
No 119 75.3%
17.4 Functions where formal risk identification
and assessment is taking place:
Operational.
Yes 89 56.3%
No 69 43.7%
17.5 Functions where formal risk identification
and assessment is taking place:
Procurement.
Yes 56 35.4%
No 102 64.6%
17.6 Functions where formal risk identification
and assessment is taking place: None.
Yes 20 12.7%
No 138 87.3%
17.7 Functions where formal risk identification
and assessment is taking place: Other.
Yes 0 0.0%
No 158 100.0%
18.1 Action engaged in when risks are
identified: Take out insurance.
Yes 92 58.2%
No 66 41.8%
18.2 Action engaged in when risks are
identified: Improve internal controls.
Yes 120 76.0%
No 38 24.0%
18.3 Action engaged in when risks are
identified: Do not engage in the identified
activity.
Yes 32 20.2%
No 126 79.8%
18.4 Action engaged in when risks are
identified: Other.
Yes 3 1.9%
No 155 98.1%

347
Variables Categories Frequency Percentage
out of total
19. How do you implement or plan to
implement risk management activities?
Holistically 59 37.3%
Incrementally – by
department
17 10.8%
Incrementally – By type of
risk
45 28.5%
Incrementally – Other 2 1.3%
Not applicable 35 22.2%
20.1 Barriers for implementing RMF: No
barriers.
Yes 49 31.0%
No 109 69.0%
20.2 Barriers for implementing RMF: Not
perceived as a priority by management.
Yes 36 22.8%
No 122 77.2%
20.3 Barriers for implementing RMF: Lack of
formalised processes.
Yes 51 32.3%
No 107 67.7%
20.4 Barriers for implementing RMF: Lack of
technology.
Yes 45 28.5%
No 113 71.5%
20.5 Barriers for implementing RMF: Lack of
intellectual capital.
Yes 47 29.8%
No 111 70.2%
20.6 Barriers for implementing RMF: Benefit
does not justify the effort.
Yes 36 22.8%
No 122 77.2%
20.7 Barriers for implementing RMF: Cost. Yes 70 44.3%
No 88 55.7%
20.8 Barriers for implementing RMF: Lack of
skills.
Yes 52 32.9%
No 106 67.1%
21. Would you like to receive feedback on this
study?
Yes 62 39.2%

348
APPENDIX D Univariate statistics
The UNIVARIATE Procedure Variable: Q09_1 (Q09_1) N 157 Sum Weights 157 Mean 2.85987261 Sum Observations 449 Std Deviation 1.39806918 Variance 1.95459742 Skewness 0.05373159 Kurtosis -1.2648661 Uncorrected SS 1589 Corrected SS 304.917197 Coeff Variation 48.885715 Std Error Mean 0.11157807 Basic Statistical Measures Location Variability Mean 2.859873 Std Deviation 1.39807 Median 3.000000 Variance 1.95460 Mode 1.000000 Range 4.00000 Interquartile Range 2.00000 Quantiles (Definition 5) Quantile Estimate 100% Max 5 99% 5 95% 5 90% 5 75% Q3 4 50% Median 3 25% Q1 2 10% 1 5% 1 1% 1 0% Min 1 Variable: Q09_2 (Q09_2) N 157 Sum Weights 157 Mean 2.78980892 Sum Observations 438 Std Deviation 1.32060518 Variance 1.74399804 Skewness 0.14099908 Kurtosis -1.0684798 Uncorrected SS 1494 Corrected SS 272.063694 Coeff Variation 47.336761 Std Error Mean 0.10539577 Basic Statistical Measures Location Variability Mean 2.789809 Std Deviation 1.32061 Median 3.000000 Variance 1.74400 Mode 3.000000 Range 4.00000 Interquartile Range 2.00000 Quantiles (Definition 5) Quantile Estimate 100% Max 5 99% 5 95% 5 90% 5 75% Q3 4 50% Median 3 25% Q1 2 10% 1 5% 1 1% 1 0% Min 1 Variable: Q09_3 (Q09_3) N 157 Sum Weights 157 Mean 3.01273885 Sum Observations 473 Std Deviation 1.50634241 Variance 2.26906745 Skewness -0.0218991 Kurtosis -1.4512878 Uncorrected SS 1779 Corrected SS 353.974522 Coeff Variation 49.9991032 Std Error Mean 0.12021921 Basic Statistical Measures Location Variability Mean 3.012739 Std Deviation 1.50634 Median 3.000000 Variance 2.26907 Mode 1.000000 Range 4.00000 Interquartile Range 2.00000 NOTE: The mode displayed is the smallest of 2 modes with a count of 37. Quantiles (Definition 5) Quantile Estimate 100% Max 5 99% 5 95% 5 90% 5 75% Q3 4 50% Median 3 25% Q1 2 10% 1 5% 1 1% 1 0% Min 1

349
Variable: Q09_4 (Q09_4) N 157 Sum Weights 157 Mean 2.60509554 Sum Observations 409 Std Deviation 1.47090571 Variance 2.16356361 Skewness 0.40301259 Kurtosis -1.2051169 Uncorrected SS 1403 Corrected SS 337.515924 Coeff Variation 56.4626398 Std Error Mean 0.11739106 Basic Statistical Measures Location Variability Mean 2.605096 Std Deviation 1.47091 Median 2.000000 Variance 2.16356 Mode 1.000000 Range 4.00000 Interquartile Range 3.00000 Quantiles (Definition 5) Quantile Estimate 100% Max 5 99% 5 95% 5 90% 5 75% Q3 4 50% Median 2 25% Q1 1 10% 1 5% 1 1% 1 0% Min 1 Variable: Q09_5 (Q09_5) N 157 Sum Weights 157 Mean 3.28025478 Sum Observations 515 Std Deviation 1.46687525 Variance 2.15172301 Skewness -0.2873294 Kurtosis -1.3011575 Uncorrected SS 2025 Corrected SS 335.66879 Coeff Variation 44.718333 Std Error Mean 0.11706939 Basic Statistical Measures Location Variability Mean 3.280255 Std Deviation 1.46688 Median 3.000000 Variance 2.15172 Mode 5.000000 Range 4.00000 Interquartile Range 3.00000 Quantiles (Definition 5) Quantile Estimate 100% Max 5 99% 5 95% 5 90% 5 75% Q3 5 50% Median 3 25% Q1 2 10% 1 5% 1 1% 1 0% Min 1 Variable: Q11 (Q11) N 158 Sum Weights 158 Mean 2.44936709 Sum Observations 387 Std Deviation 1.2796669 Variance 1.63754737 Skewness 0.69597004 Kurtosis -0.5195441 Uncorrected SS 1205 Corrected SS 257.094937 Coeff Variation 52.2447984 Std Error Mean 0.10180483 Basic Statistical Measures Location Variability Mean 2.449367 Std Deviation 1.27967 Median 2.000000 Variance 1.63755 Mode 2.000000 Range 4.00000 Interquartile Range 2.00000 Quantiles (Definition 5) Quantile Estimate 100% Max 5 99% 5 95% 5 90% 5 75% Q3 3 50% Median 2 25% Q1 1 10% 1 5% 1 1% 1 0% Min 1 Variable: Q12 (Q12) N 158 Sum Weights 158 Mean 2.28481013 Sum Observations 361 Std Deviation 1.12352818 Variance 1.26231557 Skewness 0.91889536 Kurtosis 0.39445227 Uncorrected SS 1023 Corrected SS 198.183544 Coeff Variation 49.1738095 Std Error Mean 0.0893831 Basic Statistical Measures Location Variability

350
Mean 2.284810 Std Deviation 1.12353 Median 2.000000 Variance 1.26232 Mode 2.000000 Range 4.00000 Interquartile Range 2.00000 Quantiles (Definition 5) Quantile Estimate 100% Max 5 99% 5 95% 5 90% 4 75% Q3 3 50% Median 2 25% Q1 1 10% 1 5% 1 1% 1 0% Min 1 Variable: Q13 (Q13) N 158 Sum Weights 158 Mean 1.94303797 Sum Observations 307 Std Deviation 1.06623733 Variance 1.13686205 Skewness 1.23219328 Kurtosis 1.12127379 Uncorrected SS 775 Corrected SS 178.487342 Coeff Variation 54.8747552 Std Error Mean 0.08482529 Basic Statistical Measures Location Variability Mean 1.943038 Std Deviation 1.06624 Median 2.000000 Variance 1.13686 Mode 1.000000 Range 4.00000 Interquartile Range 1.00000 Quantiles (Definition 5) Quantile Estimate 100% Max 5 99% 5 95% 4 90% 3 75% Q3 2 50% Median 2 25% Q1 1 10% 1 5% 1 1% 1 0% Min 1 Variable: Q16 (Q16) N 158 Sum Weights 158 Mean 3.20886076 Sum Observations 507 Std Deviation 1.33093424 Variance 1.77138596 Skewness -0.0785231 Kurtosis -1.1181766 Uncorrected SS 1905 Corrected SS 278.107595 Coeff Variation 41.4768462 Std Error Mean 0.10588344 Basic Statistical Measures Location Variability Mean 3.208861 Std Deviation 1.33093 Median 3.000000 Variance 1.77139 Mode 3.000000 Range 4.00000 Interquartile Range 2.00000 Quantiles (Definition 5) Quantile Estimate 100% Max 5 99% 5 95% 5 90% 5 75% Q3 4 50% Median 3 25% Q1 2 10% 1 5% 1 1% 1 0% Min 1 Variable: Q19 (Q19) N 158 Sum Weights 158 Mean 2.60126582 Sum Observations 411 Std Deviation 1.53490128 Variance 2.35592195 Skewness 0.43791044 Kurtosis -1.201017 Uncorrected SS 1439 Corrected SS 369.879747 Coeff Variation 59.0059375 Std Error Mean 0.12211019 Basic Statistical Measures Location Variability Mean 2.601266 Std Deviation 1.53490 Median 3.000000 Variance 2.35592 Mode 1.000000 Range 4.00000 Interquartile Range 2.00000 Quantiles (Definition 5) Quantile Estimate 100% Max 5 99% 5 95% 5

351
90% 5 75% Q3 3 50% Median 3 25% Q1 1 10% 1 5% 1 1% 1 0% Min

352
APPENDIX E
Factor analysis The FACTOR Procedure Means and Standard Deviations from 157 Observations Variable Mean Std Dev Q06_01 1.6050955 0.4903944 Q06_02 1.6433121 0.4805544 Q06_03 1.8216561 0.3840270 Q06_04 1.8152866 0.3893067 Q06_05 1.6687898 0.4721546 Q06_06 1.8407643 0.3670666 Q06_07 1.8471338 0.3610101 q06_08n 1.3312102 0.4721546 Q06_09 1.9808917 0.1373437 q07_1_1n 1.3885350 0.4889770 Q07_2_01 1.7770701 0.4175436 Q07_2_02 1.7197452 0.4505608 Q07_2_03 1.6114650 0.4889770 Q07_2_04 1.8089172 0.3944122 Q07_2_05 1.8025478 0.3993503 Q07_2_06 1.7707006 0.4217274 Q07_2_07 1.9108280 0.2859038 Q07_2_08 1.9617834 0.1923322 Q08 1.1401274 0.3482299 Q10 1.1273885 0.3344746 Q14 1.3885350 0.4889770 Q15_01 1.1783439 0.3840270 Q15_02 1.2165605 0.4132186 Q15_03 1.1210191 0.3271932 Q15_04 1.4076433 0.4929687 Q15_05 1.2866242 0.4536314 Q15_06 1.4649682 0.5003673 Q15_07 1.3121019 0.4648339 Q15_08 1.3439490 0.4765444 Q15_09 1.4968153 0.5015898 Q15_10 1.3312102 0.4721546 q15_11n 1.0382166 0.1923322 Q18_01 1.4140127 0.4941269 Q18_02 1.2420382 0.4296879 Q18_03 1.7961783 0.4041270 Q18_04 1.9808917 0.1373437 q20_1n 1.3121019 0.4648339 Q20_2 1.7707006 0.4217274 Q20_3 1.6815287 0.4673742 Q20_4 1.7133758 0.4536314 Q20_5 1.7006369 0.4594446 Q20_6 1.7770701 0.4175436 Q20_7 1.5541401 0.4986508 Q20_8 1.6751592 0.4698139 Q21 1.6050955 0.4903944 Q11 2.4458599 1.2829998 Q12 2.2802548 1.1256588 Q13 1.9363057 1.0662751 Q16 3.2101911 1.3350879 Q09_1 2.8598726 1.3980692 Q09_2 2.7898089 1.3206052 Q09_3 3.0127389 1.5063424 Q09_4 2.6050955 1.4709057 Q09_5 3.2802548 1.4668753 Q19 2.6114650 1.5344325 Initial Factor Method: Principal Factors Prior Communality Estimates: SMC Q06_01 Q06_02 Q06_03 Q06_04 Q06_05 Q06_06 Q06_07 q06_08n Q06_09 q07_1_1n 0.61475451 0.58186603 0.38180336 0.57786324 0.58303629 0.50854588 0.57354536 0.70083573 0.40749733 0.83788315 Q07_2_01 Q07_2_02 Q07_2_03 Q07_2_04 Q07_2_05 Q07_2_06 Q07_2_07 Q07_2_08 Q08 Q10 0.55995411 0.59471728 0.68312436 0.50309270 0.44616137 0.55957197 0.35755205 0.45858318 0.44612556 0.45053618 Q14 Q15_01 Q15_02 Q15_03 Q15_04 Q15_05 Q15_06 Q15_07 Q15_08 Q15_09 0.55356925 0.53478371 0.52551933 0.69712782 0.60218200 0.57323980 0.67945037 0.65222347 0.53504778 0.60582274 Q15_10 q15_11n Q18_01 Q18_02 Q18_03 Q18_04 q20_1n Q20_2 Q20_3 Q20_4 0.58876803 0.65022822 0.37967307 0.58851189 0.47100695 0.32953024 0.71186481 0.50287015 0.50672253 0.56892195 Q20_5 Q20_6 Q20_7 Q20_8 Q21 Q11 Q12 Q13 Q16 Q09_1 0.57176665 0.56446152 0.67802473 0.51681565 0.38011928 0.75118465 0.73239983 0.70162144 0.58117439 0.41987492 Q09_2 Q09_3 Q09_4 Q09_5 Q19 0.37733713 0.41772727 0.53238131 0.33489663 0.50734904 Eigenvalues of the Reduced Correlation Matrix: Total = 30.1512482 Average = 0.54820451 Eigenvalue Difference Proportion Cumulative 1 5.53635963 1.08048359 0.1836 0.1836 2 4.45587604 1.53063612 0.1478 0.3314 3 2.92523992 0.55969321 0.0970 0.4284 4 2.36554671 0.36516931 0.0785 0.5069 5 2.00037740 0.18134189 0.0663 0.5732 6 1.81903551 0.44695557 0.0603 0.6336 7 1.37207994 0.09225729 0.0455 0.6791 8 1.27982265 0.10026802 0.0424 0.7215 9 1.17955464 0.14425904 0.0391 0.7606 10 1.03529559 0.16367856 0.0343 0.7950 11 0.87161704 0.02701864 0.0289 0.8239 12 0.84459840 0.06818017 0.0280 0.8519 13 0.77641823 0.01617183 0.0258 0.8776 14 0.76024640 0.01923042 0.0252 0.9029 15 0.74101598 0.06634872 0.0246 0.9274

353
16 0.67466725 0.06996161 0.0224 0.9498 17 0.60470564 0.09865018 0.0201 0.9699 18 0.50605546 0.02505949 0.0168 0.9866 19 0.48099597 0.01158441 0.0160 1.0026 20 0.46941156 0.04155474 0.0156 1.0182 21 0.42785682 0.06432468 0.0142 1.0324 22 0.36353214 0.01495761 0.0121 1.0444 23 0.34857453 0.02362951 0.0116 1.0560 24 0.32494502 0.04718026 0.0108 1.0667 25 0.27776476 0.02324113 0.0092 1.0760 26 0.25452363 0.02281360 0.0084 1.0844 27 0.23171003 0.06205229 0.0077 1.0921 28 0.16965775 0.02281623 0.0056 1.0977 29 0.14684151 0.01700830 0.0049 1.1026 30 0.12983322 0.04662883 0.0043 1.1069 31 0.08320439 0.01237389 0.0028 1.1097 32 0.07083050 0.01968057 0.0023 1.1120 33 0.05114993 0.02806458 0.0017 1.1137 34 0.02308535 0.02471396 0.0008 1.1145 35 -.00162861 0.02944230 -0.0001 1.1144 36 -.03107091 0.01038948 -0.0010 1.1134 37 -.04146039 0.01692932 -0.0014 1.1120 38 -.05838972 0.01052565 -0.0019 1.1101 39 -.06891537 0.01346036 -0.0023 1.1078 40 -.08237572 0.02321804 -0.0027 1.1050 41 -.10559376 0.00851275 -0.0035 1.1015 42 -.11410651 0.02436987 -0.0038 1.0978 43 -.13847638 0.01194053 -0.0046 1.0932 44 -.15041691 0.00922628 -0.0050 1.0882 45 -.15964319 0.02427440 -0.0053 1.0829 46 -.18391759 0.02347356 -0.0061 1.0768 47 -.20739116 0.00925010 -0.0069 1.0699 48 -.21664125 0.01807757 -0.0072 1.0627 49 -.23471883 0.01335558 -0.0078 1.0549 50 -.24807440 0.00540054 -0.0082 1.0467 51 -.25347495 0.00669199 -0.0084 1.0383 52 -.26016694 0.01726524 -0.0086 1.0297 53 -.27743218 0.02437342 -0.0092 1.0205 54 -.30180560 0.01367539 -0.0100 1.0105 55 -.31548099 -0.0105 1.0000 8 factors will be retained by the NFACTOR criterion. Factor Pattern Factor1 Factor2 Factor3 Factor4 Factor5 Factor6 Factor7 Factor8 Q20_7 Q20_7 56 * -17 19 41 * 7 0 -9 -4 Q15_02 Q15_02 54 * -2 -19 5 -23 -16 17 0 Q15_10 Q15_10 54 * -2 -31 -7 -1 9 2 -14 Q15_07 Q15_07 53 * 3 -28 -15 5 19 -23 -31 Q20_5 Q20_5 52 * -20 14 33 -6 -6 -7 4 Q20_3 Q20_3 51 * -21 9 24 14 3 11 15 Q15_04 Q15_04 50 * 6 -35 2 -5 11 2 5 Q15_06 Q15_06 49 * 14 -31 -5 6 41 * -21 -18 Q15_05 Q15_05 47 * 0 -38 -11 -11 -3 -15 -18 Q15_03 Q15_03 47 * 7 -20 -5 -21 -46 * 16 26 Q07_2_03 Q07_2_03 46 * -30 23 -36 10 -11 -9 -19 q15_11n 45 * -1 -37 -16 -10 -32 -1 24 Q15_09 Q15_09 43 * 9 -42 * -14 6 33 -7 8 Q15_01 Q15_01 43 * 4 -27 -8 -28 -26 12 11 Q14 Q14 42 * 11 18 -19 16 -13 -6 8 Q07_2_02 Q07_2_02 39 -22 17 -36 26 2 18 -13 Q20_8 Q20_8 38 -36 16 35 0 -1 -7 6 Q20_4 Q20_4 36 -7 15 32 15 -24 -20 16 Q07_2_04 Q07_2_04 32 -6 21 -29 23 -3 -4 8 Q07_2_05 Q07_2_05 29 -26 26 -19 5 -14 -21 12 Q07_2_08 Q07_2_08 -21 9 8 2 21 8 13 -3 Q11 Q11 7 73 * -18 10 30 -5 -1 0 Q12 Q12 4 64 * -18 11 42 * 4 -1 23 Q13 Q13 15 62 * -12 9 36 -12 12 7 Q16 Q16 11 55 * 5 -22 7 -13 -23 11 q06_08n 35 52 * 40 * 0 -28 -9 10 -15 Q18_02 Q18_02 14 48 * 6 28 5 -19 12 -32

354
Q06_07 Q06_07 11 45 * 24 -21 -9 24 -4 19 Q06_02 Q06_02 24 43 * 41 * -14 -13 -4 -13 -11 Q19 Q19 11 38 17 3 16 -1 -18 1 Q06_05 Q06_05 29 38 27 8 -31 -11 2 -14 Q06_06 Q06_06 2 35 28 -7 -20 27 -4 14 Q06_03 Q06_03 8 31 27 -6 -23 17 -6 16 Q18_04 Q18_04 12 21 -8 -3 -16 15 11 2 Q07_2_06 Q07_2_06 16 -28 25 -19 10 13 -3 23 q07_1_1n 40 * -36 44 * -38 34 -2 14 -9 Q15_08 Q15_08 39 -12 -41 * -9 -8 22 3 15 q20_1n 48 * -19 28 53 * 8 14 10 8 Q08 Q08 3 28 5 41 * 20 -7 -14 -16 Q20_2 Q20_2 18 -6 5 37 -4 29 4 6 Q20_6 Q20_6 29 -27 16 33 -12 9 -6 -3 Q10 Q10 -1 29 -2 10 30 8 -5 -11 Q21 Q21 19 20 0 4 25 3 -2 13 Q06_01 Q06_01 19 34 29 1 -49 * 8 9 -17 Q06_04 Q06_04 14 30 31 -22 -21 34 9 31 Q18_03 Q18_03 -1 -12 7 11 11 33 9 15 Q07_2_07 Q07_2_07 19 -16 14 -14 16 25 3 10 Q09_5 Q09_5 3 -12 -13 2 -3 13 4 -9 Q09_4 Q09_4 15 20 -10 -2 4 1 56 * 6 Q09_1 Q09_1 8 10 -12 3 14 27 37 -16 Q09_2 Q09_2 7 -10 0 9 -14 21 33 -11 Q09_3 Q09_3 18 4 7 -19 13 -14 24 -17 Q06_09 Q06_09 1 0 0 8 16 -19 19 13 Q18_01 Q18_01 7 5 -10 -4 -6 5 -23 -16 Q07_2_01 Q07_2_01 16 -3 26 -14 20 -6 20 -27 Printed values are multiplied by 100 and rounded to the nearest integer. Values greater than 0.4 are flagged by an '*'. Variance Explained by Each Factor Factor1 Factor2 Factor3 Factor4 Factor5 Factor6 Factor7 Factor8 5.5363596 4.4558760 2.9252399 2.3655467 2.0003774 1.8190355 1.3720799 1.2798227 Final Communality Estimates: Total = 21.754338 Q06_01 Q06_02 Q06_03 Q06_04 Q06_05 Q06_06 Q06_07 q06_08n Q06_09 q07_1_1n 0.51449901 0.47533985 0.28927262 0.52426014 0.43234313 0.33655303 0.42111095 0.67215662 0.12247215 0.77749138 Q07_2_01 Q07_2_02 Q07_2_03 Q07_2_04 Q07_2_05 Q07_2_06 Q07_2_07 Q07_2_08 Q08 Q10 0.26887363 0.47566443 0.55576299 0.29032801 0.34430809 0.28511838 0.19752294 0.12671245 0.34091432 0.20291009 Q14 Q15_01 Q15_02 Q15_03 Q15_04 Q15_05 Q15_06 Q15_07 Q15_08 Q15_09 0.31130900 0.43518837 0.43599957 0.61950424 0.39092965 0.44415085 0.60954981 0.57732730 0.41926774 0.51191821 Q15_10 q15_11n Q18_01 Q18_02 Q18_03 Q18_04 q20_1n Q20_2 Q20_3 Q20_4 0.41463357 0.53446492 0.10653480 0.48610286 0.18354632 0.12525645 0.66583490 0.26599155 0.43528062 0.40804539 Q20_5 Q20_6 Q20_7 Q20_8 Q21 Q11 Q12 Q13 Q16 Q09_1 0.45715451 0.31664071 0.57204874 0.42990611 0.15332176 0.67321050 0.68065991 0.59655663 0.45877227 0.28226016 Q09_2 Q09_3 Q09_4 Q09_5 Q19 0.20640777 0.19659060 0.39113193 0.05918825 0.24603760 Prerotation Method: Varimax Orthogonal Transformation Matrix 1 2 3 4 5 6 7 8 1 0.53408 0.13912 0.19386 0.44224 0.50045 0.45639 0.02692 0.05272 2 -0.29170 0.68436 0.54818 -0.21885 0.04727 0.03445 0.29995 0.06905 3 0.29835 -0.12151 0.50755 0.43556 -0.40310 -0.49544 0.11619 -0.16569 4 0.72109 0.18504 -0.17979 -0.55633 -0.13671 -0.16076 0.21552

355
0.11393 5 0.02605 0.65687 -0.48283 0.41827 -0.32155 -0.06518 -0.22827 0.00279 6 0.08866 -0.06772 0.31889 -0.12958 -0.51542 0.45700 -0.49646 0.38482 7 -0.06605 -0.04673 -0.03200 0.15616 0.22054 -0.39053 0.02338 0.87541 8 0.08823 0.15822 0.19011 -0.20293 0.38528 -0.39193 -0.74178 -0.19384 Rotated Factor Pattern Factor1 Factor2 Factor3 Factor4 Factor5 Factor6 Factor7 Factor8 q20_1n 79 * 5 6 9 0 -2 -4 15 Q20_7 Q20_7 71 * 6 0 17 8 14 9 -4 Q20_5 Q20_5 62 * -5 2 12 20 9 6 -6 Q20_8 Q20_8 61 * -13 -10 10 8 2 -5 -7 Q20_3 Q20_3 55 * 7 -5 22 19 4 -15 11 Q20_6 Q20_6 52 * -19 1 1 -1 8 2 0 Q20_4 Q20_4 50 * 20 -6 9 17 -7 3 -27 Q20_2 Q20_2 42 * 1 8 -15 -9 9 -10 18 Q12 Q12 -10 79 * 10 -14 4 1 -9 5 Q11 Q11 -15 75 * 15 -13 6 9 18 7 Q13 Q13 -7 73 * 8 0 14 -2 12 13 Q16 Q16 -23 43 * 35 6 13 6 9 -27 Q10 Q10 -2 39 -1 0 -19 8 7 5 Q08 Q08 24 38 -3 -15 -17 0 29 -6 Q19 Q19 4 38 24 6 -8 2 10 -15 Q21 Q21 9 35 5 8 5 4 -9 -1 Q06_04 Q06_04 -3 4 66 * 7 2 -3 -27 10 q06_08n 12 15 63 * 16 14 -3 43 * 7 Q06_01 Q06_01 7 -13 59 * -4 6 5 34 12 Q06_07 Q06_07 -11 21 59 * 6 -2 4 -12 -1 Q06_06 Q06_06 -3 7 56 * -6 -11 0 -7 1 Q06_02 Q06_02 1 16 55 * 22 -1 3 28 -15 Q06_03 Q06_03 2 4 53 * -4 -1 -2 -4 -4 Q06_05 Q06_05 15 6 47 * 3 15 1 40 1 Q18_04 Q18_04 -4 5 22 -9 11 14 0 18 q07_1_1n 17 -11 -2 85 * -4 -4 -13 1 Q07_2_02 Q07_2_02 5 -4 -4 66 * 6 11 -8 13 Q07_2_03 Q07_2_03 12 -19 -1 65 * 11 20 5 -16 Q07_2_04 Q07_2_04 6 9 8 48 * 8 4 -15 -12 Q07_2_01 Q07_2_01 3 3 0 45 * -9 -5 18 15 Q14 Q14 11 21 17 40 * 20 6 -1 -14 Q07_2_05 Q07_2_05 19 -14 4 39 11 -1 -12 -33 Q09_3 Q09_3 -7 6 -2 35 10 -2 15 17 Q15_03 Q15_03 10 6 4 7 77 * -4 9 -3 q15_11n 0 7 -8 8 68 * 18 -7 -11 Q15_01 Q15_01 5 -4 5 2 63 * 15 9 4 Q15_02 Q15_02 24 -5 5 9 53 * 21 13 15 Q07_2_08 Q07_2_08 -10 15 -5 1 -22 -15 -3 13 Q15_06 Q15_06 13 18 10 5 3 73 * -8 9 Q15_07 Q15_07 9 8 -1 21 11 71 * 8 -1 Q15_09 Q15_09 2 18 4 2 23 57 * -28 14 Q15_05 Q15_05 5 -1 -7 8 35 54 * 12 -3

356
Q15_10 Q15_10 15 5 -4 16 31 49 * 2 15 Q15_08 Q15_08 8 -4 -5 -2 34 43 * -29 16 Q15_04 Q15_04 18 12 2 0 37 43 * -9 14 Q18_01 Q18_01 -3 -1 2 -3 -4 27 10 -14 Q09_5 Q09_5 2 -10 -9 -3 -3 15 -4 12 Q06_09 Q06_09 5 15 -13 5 13 -23 -2 8 Q18_02 Q18_02 10 38 13 -4 2 0 54 * 15 Q07_2_07 Q07_2_07 12 -2 7 27 -9 9 -29 7 Q18_03 Q18_03 17 0 2 -2 -18 -2 -31 17 Q07_2_06 Q07_2_06 14 -14 7 32 -2 -6 -36 -9 Q09_4 Q09_4 -5 17 7 8 26 -12 1 52 * Q09_1 Q09_1 -1 13 -2 6 -7 13 -2 49 * Q09_2 Q09_2 12 -18 4 -1 -1 3 1 40 Variance Explained by Each Factor Factor1 Factor2 Factor3 Factor4 Factor5 Factor6 Factor7 Factor8 3.4803408 3.2247727 3.0760760 3.0499780 2.8628718 2.7318879 1.8117883 1.5166224 Final Communality Estimates: Total = 21.754338 Q06_01 Q06_02 Q06_03 Q06_04 Q06_05 Q06_06 Q06_07 q06_08n Q06_09 q07_1_1n 0.51449901 0.47533985 0.28927262 0.52426014 0.43234313 0.33655303 0.42111095 0.67215662 0.12247215 0.77749138 Q07_2_01 Q07_2_02 Q07_2_03 Q07_2_04 Q07_2_05 Q07_2_06 Q07_2_07 Q07_2_08 Q08 Q10 0.26887363 0.47566443 0.55576299 0.29032801 0.34430809 0.28511838 0.19752294 0.12671245 0.34091432 0.20291009 Q14 Q15_01 Q15_02 Q15_03 Q15_04 Q15_05 Q15_06 Q15_07 Q15_08 Q15_09 0.31130900 0.43518837 0.43599957 0.61950424 0.39092965 0.44415085 0.60954981 0.57732730 0.41926774 0.51191821 Q15_10 q15_11n Q18_01 Q18_02 Q18_03 Q18_04 q20_1n Q20_2 Q20_3 Q20_4 0.41463357 0.53446492 0.10653480 0.48610286 0.18354632 0.12525645 0.66583490 0.26599155 0.43528062 0.40804539 Q20_5 Q20_6 Q20_7 Q20_8 Q21 Q11 Q12 Q13 Q16 Q09_1 0.45715451 0.31664071 0.57204874 0.42990611 0.15332176 0.67321050 0.68065991 0.59655663 0.45877227 0.28226016 Q09_2 Q09_3 Q09_4 Q09_5 Q19 0.20640777 0.19659060 0.39113193 0.05918825 0.24603760 Scoring Coefficients Estimated by Regression Squared Multiple Correlations of the Variables with Each Factor Factor1 Factor2 Factor3 Factor4 Factor5 Factor6 Factor7 Factor8 0.88697419 0.88932591 0.86350770 0.90747341 0.85576656 0.85076002 0.79045162 0.75219530 Standardized Scoring Coefficients Factor1 Factor2 Factor3 Factor4 Factor5 Factor6 Factor7 Factor8 q20_1n 0.33323 0.01616 0.02962 -0.12071 -0.04965 -0.05034 -0.05286 0.12150 Q20_7 Q20_7 0.22500 0.04284 -0.02837 -0.01917 -0.01111 0.01656 0.03418 -0.06167 Q20_5 Q20_5 0.14595 -0.02050 0.01359 0.01522 0.04381 -0.03328 0.01730 -0.02953 Q20_8 Q20_8 0.13633 -0.00311 -0.02343 0.00103 -0.00873 0.00286 -0.01339 -0.05268 Q20_3 Q20_3 0.12251 0.03600 -0.00979 0.00280 0.02560 -0.03255 -0.07893 0.04590 Q20_6 Q20_6 0.12386 -0.05804 0.02401 -0.07165 -0.02429 0.02636 0.04100 -0.00580 Q20_4 Q20_4 0.09763 0.11027 -0.05305 0.05075 0.01980 -0.05378 -0.00003 -0.15989 Q20_2 Q20_2 0.10032 0.01465 0.02221 0.00246 -0.04825 0.00284 -0.05788 0.05924 Q12 Q12 0.00385 0.29549 -0.00900 -0.01797 -0.00804 -0.03201 -0.15902 -0.02078 Q11 Q11 -0.05574 0.27917 -0.03189 0.03237 -0.03403 0.01119 0.06034 0.03581 Q13 Q13 -0.01537 0.21956 -0.05423 0.02946 0.05209 -0.06496 0.02726 0.06826 Q16 Q16 -0.04756 0.05707 0.08706 0.00128 0.04466 0.02693 -0.00345 -0.16730 Q10 Q10 0.00734 0.06820 -0.01671 0.00313 -0.06787 0.03472 0.03050 0.00231 Q08 Q08 0.05982 0.06589 -0.03469 -0.05908 -0.04857 0.02385 0.10464 -0.04542 Q19 Q19 0.04831 0.09201 0.03995 -0.00517 -0.02715 0.00369 -0.00453 -0.08913 Q21 Q21 0.02392 0.07199 0.00937 0.02665 0.00715 -0.02667 -0.04465 0.01392

357
Q06_04 Q06_04 -0.00271 -0.03845 0.24947 -0.05251 0.00714 -0.02335 -0.18175 0.06162 q06_08n 0.00703 -0.03374 0.21724 0.04996 0.03378 -0.04598 0.21177 0.04638 Q06_01 Q06_01 0.01995 -0.12243 0.18436 -0.01343 -0.01014 0.02045 0.12170 0.08804 Q06_07 Q06_07 -0.04647 0.03797 0.18595 0.03996 -0.00553 -0.00821 -0.12030 -0.01797 Q06_06 Q06_06 -0.01767 -0.00057 0.14267 -0.00111 -0.02241 0.01070 -0.07133 -0.01373 Q06_02 Q06_02 0.00062 -0.00104 0.13058 0.05598 -0.03760 0.02244 0.07551 -0.08867 Q06_03 Q06_03 0.01359 -0.00041 0.10610 -0.00466 -0.00941 -0.00802 -0.05543 -0.02129 Q06_05 Q06_05 0.00807 -0.02193 0.11425 0.01202 0.04042 -0.02378 0.14668 -0.00559 Q18_04 Q18_04 -0.00931 -0.01264 0.04963 -0.03057 0.01721 0.02730 -0.01452 0.05768 q07_1_1n -0.07379 0.05382 -0.07635 0.68220 -0.12457 -0.14166 -0.05610 0.10873 Q07_2_02 Q07_2_02 -0.04359 0.01091 -0.02527 0.19237 -0.01593 0.01132 -0.00604 0.12393 Q07_2_03 Q07_2_03 -0.00405 -0.07437 -0.01331 0.09028 0.00707 0.10274 0.08145 -0.12417 Q07_2_04 Q07_2_04 0.00195 0.03113 0.02274 0.05706 0.01562 0.00957 -0.06613 -0.06795 Q07_2_01 Q07_2_01 -0.00413 0.00205 -0.00869 0.04269 -0.02658 -0.00430 0.09874 0.06874 Q14 Q14 0.00652 0.06776 0.02707 0.04364 0.04090 -0.00589 -0.01584 -0.08851 Q07_2_05 Q07_2_05 0.02024 -0.00872 0.02582 0.02190 0.04350 -0.01854 -0.03506 -0.14555 Q09_3 Q09_3 -0.04068 -0.00356 -0.03430 0.07757 0.02428 -0.01455 0.06793 0.07225 Q15_03 Q15_03 -0.00373 -0.03916 0.00680 -0.10878 0.39083 -0.10474 0.02373 -0.06473 q15_11n -0.04269 0.02236 -0.04596 0.06480 0.24844 -0.05186 -0.07637 -0.07150 Q15_01 Q15_01 -0.00986 -0.02623 0.01478 -0.02088 0.15096 -0.00690 0.02566 0.02814 Q15_02 Q15_02 0.03436 -0.02527 -0.00497 -0.01458 0.11507 0.00629 0.05090 0.07890 Q07_2_08 Q07_2_08 0.01012 0.02501 -0.00732 -0.07442 -0.01984 -0.02262 -0.00455 0.04949 Q15_06 Q15_06 0.04099 0.00069 0.03533 -0.12078 -0.09266 0.35238 -0.03325 -0.01586 Q15_07 Q15_07 -0.05478 0.01394 -0.03700 0.07439 -0.07379 0.28036 0.09635 -0.04329 Q15_09 Q15_09 -0.02094 0.04628 0.01248 -0.00625 0.02580 0.14510 -0.14632 0.05479 Q15_05 Q15_05 -0.02772 -0.04550 -0.02891 -0.02576 0.07344 0.16486 0.07575 -0.03843 Q15_10 Q15_10 0.02067 0.00911 -0.02622 0.04379 0.01176 0.12900 0.03077 0.07774 Q15_08 Q15_08 -0.02736 -0.02419 0.01902 -0.01941 0.08497 0.07274 -0.11319 0.06069 Q15_04 Q15_04 0.02027 0.02706 -0.00236 0.01836 0.08535 0.07367 -0.06502 0.04997 Q18_01 Q18_01 0.00121 -0.00813 -0.01396 0.01528 -0.04602 0.06806 0.03871 -0.03850 Q09_5 Q09_5 -0.00834 -0.01610 -0.00947 -0.00934 -0.00649 0.03124 0.01128 0.04843 Q06_09 Q06_09 0.01082 0.05794 -0.04981 0.02313 0.04862 -0.08468 -0.02445 0.04453 Q18_02 Q18_02 0.01922 0.07380 -0.05509 0.07116 -0.05265 0.00055 0.24011 0.10005 Q07_2_07 Q07_2_07 0.01744 0.00052 0.02339 0.05604 -0.03272 0.00595 -0.08880 0.03155 Q18_03 Q18_03 0.02990 -0.00502 0.02772 -0.00456 -0.04439 -0.01135 -0.10859 0.06947 Q07_2_06 Q07_2_06 0.02651 -0.00474 0.05579 -0.01091 0.01202 -0.00425 -0.15845 -0.06561 Q09_4 Q09_4 -0.02647 0.00216 0.00005 0.01339 0.10479 -0.07730 -0.00591 0.28548 Q09_1 Q09_1 -0.00607 0.02601 -0.01151 0.02659 -0.02691 0.01429 -0.00250 0.20039 Q09_2 Q09_2 0.00652 -0.03133 0.00677 -0.00129 0.00791 0.00503 0.01419 0.15619 Rotation Method: Promax (power = 3) Target Matrix for Procrustean Transformation Factor1 Factor2 Factor3 Factor4 Factor5 Factor6 Factor7 Factor8 q20_1n 100 * 0 0 0 0 0 0 1 Q20_7 Q20_7 92 * 0 0 1 0 1 0 0 Q20_5 Q20_5 85 * 0 0 1 3 0 0 0 Q20_8 Q20_8 91 * -1 0 0 0 0 0 0 Q20_3 Q20_3 64 * 0 0 4 3 0 -2 1 Q20_6 Q20_6 89 * -4 0 0 0 0 0 0 Q20_4 Q20_4 53 * 3 0 0 2 0 0 -10 Q20_2 Q20_2 61 * 0 0 -3 -1 1 -2 5

358
Q12 Q12 0 100 * 0 -1 0 0 0 0 Q11 Q11 -1 86 * 1 0 0 0 2 0 Q13 Q13 0 95 * 0 0 1 0 1 1 Q16 Q16 -4 29 14 0 1 0 1 -8 Q10 Q10 0 74 * 0 0 -8 1 1 0 Q08 Q08 7 32 0 -2 -3 0 26 0 Q19 Q19 0 50 * 12 0 -1 0 2 -4 Q21 Q21 2 80 * 0 1 0 0 -3 0 Q06_04 Q06_04 0 0 78 * 0 0 0 -11 0 q06_08n 0 1 48 * 1 1 0 32 0 Q06_01 Q06_01 0 -1 59 * 0 0 0 24 1 Q06_07 Q06_07 -1 4 77 * 0 0 0 -1 0 Q06_06 Q06_06 0 0 93 * 0 -1 0 0 0 Q06_02 Q06_02 0 1 52 * 4 0 0 15 -1 Q06_03 Q06_03 0 0 100 * 0 0 0 0 0 Q06_05 Q06_05 1 0 39 0 1 0 49 * 0 Q18_04 Q18_04 0 0 27 -2 3 7 0 16 q07_1_1n 1 0 0 100 * 0 0 -1 0 Q07_2_02 Q07_2_02 0 0 0 98 * 0 1 0 1 Q07_2_03 Q07_2_03 0 -2 0 76 * 0 2 0 -1 Q07_2_04 Q07_2_04 0 1 0 79 * 0 0 -4 -1 Q07_2_01 Q07_2_01 0 0 0 72 * -1 0 9 3 Q14 Q14 1 6 3 43 * 5 0 0 -2 Q07_2_05 Q07_2_05 3 -1 0 33 1 0 -2 -23 Q09_3 Q09_3 0 0 0 57 * 1 0 9 7 Q15_03 Q15_03 0 0 0 0 100 * 0 0 0 q15_11n 0 0 0 0 88 * 2 0 0 Q15_01 Q15_01 0 0 0 0 94 * 1 1 0 Q15_02 Q15_02 5 0 0 0 57 * 4 2 1 Q07_2_08 Q07_2_08 -2 8 0 0 -27 -10 0 7 Q15_06 Q15_06 1 1 0 0 0 100 * 0 0 Q15_07 Q15_07 0 0 0 3 0 99 * 0 0 Q15_09 Q15_09 0 2 0 0 4 62 * -13 1 Q15_05 Q15_05 0 0 0 0 16 66 * 1 0 Q15_10 Q15_10 1 0 0 2 12 56 * 0 1 Q15_08 Q15_08 0 0 0 0 16 35 -20 2 Q15_04 Q15_04 2 1 0 0 22 39 -1 1 Q18_01 Q18_01 0 0 0 0 0 70 * 7 -9 Q09_5 Q09_5 0 -9 -5 0 0 30 -1 14 Q06_09 Q06_09 0 8 -6 0 6 -35 0 2 Q18_02 Q18_02 0 18 1 0 0 0 100 * 1 Q07_2_07 Q07_2_07 2 0 0 26 -1 1 -60 * 0 Q18_03 Q18_03 6 0 0 0 -8 0 -80 * 8 Q07_2_06 Q07_2_06 2 -2 0 24 0 0 -65 * -1 Q09_4 Q09_4 0 2 0 0 7 -1 0 72 * Q09_1 Q09_1 0 2 0 0 0 2 0 100 * Q09_2 Q09_2 2 -7 0 0 0 0 0 85 * Procrustean Transformation Matrix 1 2 3 4 5 6 7 8 1 1.22857123 0.02591277 0.00089227 -0.1482583 -0.0580863 -0.0645297 -0.0055549 -

359
0.0272588 2 0.09257755 1.09486164 -0.140507 0.05260121 -0.0741689 -0.0327215 0.0076946 -0.0352354 3 -0.0069988 -0.1122552 1.14838824 -0.0879083 -0.01184 -0.0147167 -0.0114816 -0.002581 4 -0.1741562 0.03512492 -0.0629782 1.21146447 -0.0865988 -0.0304697 -0.0218175 0.06796605 5 -0.0714447 -0.0624093 -0.0120582 -0.1231812 1.03716581 -0.1661799 0.0086395 0.00034435 6 -0.1150531 -0.0609206 -0.0122243 -0.0519879 -0.1473688 1.24290547 0.01293375 -0.0667879 7 -0.0892853 -0.0801199 -0.1563627 0.03178582 -0.0151423 0.05437647 1.05548738 0.02510594 8 -0.0351069 -0.0586362 -0.0015785 0.11044432 -0.0183392 -0.0531759 0.03321948 0.99126418 Normalized Oblique Transformation Matrix 1 2 3 4 5 6 7 8 1 0.42461 0.09066 0.14305 0.32343 0.37823 0.36497 0.02571 0.03368 2 -0.25341 0.60611 0.44658 -0.19725 0.01724 0.03641 0.31395 0.04244 3 0.30442 -0.10545 0.50646 0.43331 -0.40630 -0.48648 0.08625 -0.10696 4 0.85769 0.20505 -0.20325 -0.62438 -0.13216 -0.17456 0.23140 0.06741 5 0.06317 0.78769 -0.56639 0.54108 -0.41184 -0.05888 -0.23479 0.00730 6 0.11768 -0.08595 0.41322 -0.11884 -0.60986 0.51403 -0.49406 0.33821 7 -0.09896 -0.08245 -0.03849 0.25468 0.27102 -0.48317 0.04595 0.93511 8 0.21111 0.20635 0.29127 -0.29815 0.48305 -0.50268 -0.76111 -0.21275 Inter-Factor Correlations Factor1 Factor2 Factor3 Factor4 Factor5 Factor6 Factor7 Factor8 Factor1 100 * -8 3 28 18 19 6 3 Factor2 -8 100 * 22 -6 13 10 9 10 Factor3 3 22 100 * 13 7 6 16 0 Factor4 28 -6 13 100 * 22 13 3 -14 Factor5 18 13 7 22 100 * 31 2 3 Factor6 19 10 6 13 31 100 * -3 12 Factor7 6 9 16 3 2 -3 100 * -5 Factor8 3 10 0 -14 3 12 -5 100 * Rotated Factor Pattern (Standardized Regression Coefficients) Factor1 Factor2 Factor3 Factor4 Factor5 Factor6 Factor7 Factor8 q20_1n 82 * 7 6 1 -6 -8 -5 14 Q20_7 Q20_7 70 * 7 -3 7 0 10 8 -6 Q20_8 Q20_8 62 * -11 -9 2 4 -2 -5 -8 Q20_5 Q20_5 60 * -5 1 1 15 4 6 -8 Q20_3 Q20_3 54 * 9 -5 16 14 -3 -15 10 Q20_4 Q20_4 53 * 24 -10 0 14 -11 2 -29 Q20_6 Q20_6 52 * -19 3 -7 -4 6 2 -2 Q20_2 Q20_2 47 * 1 10 -20 -13 7 -10 15 Q12 Q12 -2 81 * 2 -11 0 -1 -8 1 Q11 Q11 -11 73 * 4 -9 0 8 20 4 Q13 Q13 -4 72 * -2 3 10 -6 14 11 Q10 Q10 1 41 * -7 4 -24 10 8 3 Q16 Q16 -23 40 * 28 5 10 6 8 -28 Q08 Q08 29 39 -11 -15 -21 2 29 -8 Q19 Q19 6 37 18 5 -13 3 10 -17 Q21 Q21 11 36 2 8 1 1 -9 -2 Q06_04 Q06_04 -2 -2 71 * 3 1 -6 -28 10 Q06_07 Q06_07 -11 16 59 * 4 -5 3 -13 -1 Q06_06 Q06_06 0 2 58 * -9 -12 0 -8 0 Q06_01 Q06_01 3 -24 58 * -9 5 5 35 13 q06_08n 7 5 56 * 11 10 -5 43 * 8 Q06_03 Q06_03 3 -1 55 * -8 -1 -3 -4 -5 Q06_02 Q06_02 -3 10 49 * 19 -6 3 28 -14 Q06_05 Q06_05 11 -2 42 * -2 12 0 40 * 1 Q18_04 Q18_04 -5 0 23 -10 10 12 0

360
17 q07_1_1n 6 -6 -4 88 * -11 -7 -15 7 Q07_2_02 Q07_2_02 -6 -2 -7 69 * -1 8 -9 17 Q07_2_03 Q07_2_03 -1 -18 -4 64 * 3 19 3 -12 Q07_2_01 Q07_2_01 -4 4 -5 50 * -14 -5 18 19 Q07_2_04 Q07_2_04 0 11 7 47 * 3 1 -16 -10 Q09_3 Q09_3 -14 5 -7 40 7 -4 16 20 Q14 Q14 6 21 12 37 15 2 -3 -13 Q07_2_05 Q07_2_05 14 -11 5 34 9 -3 -14 -32 Q15_03 Q15_03 5 1 1 -2 80 * -15 9 -2 q15_11n -5 4 -10 0 69 * 9 -7 -12 Q15_01 Q15_01 -2 -10 3 -6 64 * 7 10 3 Q15_02 Q15_02 17 -11 2 1 51 * 13 14 14 Q07_2_08 Q07_2_08 -7 17 -6 8 -22 -14 -3 15 Q15_06 Q15_06 7 14 8 1 -10 75 * -7 3 Q15_07 Q15_07 -2 4 -5 18 -2 73 * 8 -5 Q15_09 Q15_09 -2 15 5 -2 15 55 * -27 9 Q15_05 Q15_05 -4 -6 -10 2 28 53 * 13 -6 Q15_10 Q15_10 6 1 -7 11 23 46 * 3 12 Q15_08 Q15_08 4 -7 -1 -8 30 38 -28 12 Q15_04 Q15_04 13 8 1 -7 31 38 -8 10 Q18_01 Q18_01 -6 -3 1 -5 -8 31 10 -16 Q09_5 Q09_5 1 -11 -7 -3 -4 16 -3 11 Q06_09 Q06_09 7 17 -16 7 16 -27 -2 10 Q18_02 Q18_02 10 33 1 -2 -3 0 55 * 15 Q07_2_07 Q07_2_07 10 0 10 27 -13 8 -30 7 Q18_03 Q18_03 21 2 7 -2 -20 -2 -31 16 Q07_2_06 Q07_2_06 12 -11 13 30 -4 -8 -38 -8 Q09_4 Q09_4 -8 13 4 12 26 -19 2 54 * Q09_1 Q09_1 -3 11 -4 12 -12 12 0 49 * Q09_2 Q09_2 9 -21 6 0 -2 2 2 41 * Reference Axis Correlations Factor1 Factor2 Factor3 Factor4 Factor5 Factor6 Factor7 Factor8 Factor1 100 * 11 0 -24 -9 -13 -8 -6 Factor2 11 100 * -21 8 -12 -7 -7 -8 Factor3 0 -21 100 * -13 0 -2 -14 -1 Factor4 -24 8 -13 100 * -17 -5 1 16 Factor5 -9 -12 0 -17 100 * -26 -1 -1 Factor6 -13 -7 -2 -5 -26 100 * 5 -11 Factor7 -8 -7 -14 1 -1 5 100 * 5 Factor8 -6 -8 -1 16 -1 -11 5 100 * Reference Structure (Semipartial Correlations) Factor1 Factor2 Factor3 Factor4 Factor5 Factor6 Factor7 Factor8 q20_1n 77 * 6 6 1 -5 -8 -5 13 Q20_7 Q20_7 66 * 6 -3 7 0 9 8 -6 Q20_8 Q20_8 58 * -10 -8 1 4 -1 -5 -8 Q20_5 Q20_5 56 * -5 1 1 14 4 5 -8 Q20_3 Q20_3 51 * 8 -5 14 13 -3 -15 10 Q20_4 Q20_4 49 * 22 -9 0 13 -11 2 -28 Q20_6 Q20_6 49 * -18 3 -7 -4 6 2 -2 Q20_2 Q20_2 44 * 0 10 -18 -12 7 -10 14 Q12 Q12 -2 77 * 2 -10 0 -1 -8 1 Q11 Q11 -11 69 * 4 -9 0 8 19 4 Q13 Q13 -4 69 * -2 3 9 -5 13 11 Q10 Q10 1 39 -7 4 -22 10 8

361
3 Q16 Q16 -21 38 27 4 9 6 8 -27 Q08 Q08 27 37 -10 -14 -20 2 29 -8 Q19 Q19 5 36 17 5 -12 3 9 -16 Q21 Q21 11 35 2 7 1 1 -9 -2 Q06_04 Q06_04 -2 -2 67 * 3 1 -6 -27 10 Q06_07 Q06_07 -10 15 56 * 4 -5 3 -13 -1 Q06_06 Q06_06 0 2 55 * -8 -11 0 -8 0 Q06_01 Q06_01 2 -23 55 * -8 5 5 34 13 q06_08n 7 5 53 * 10 9 -5 43 * 8 Q06_03 Q06_03 3 -1 52 * -8 -1 -3 -4 -5 Q06_02 Q06_02 -3 10 47 * 17 -5 3 27 -14 Q06_05 Q06_05 11 -2 40 * -2 11 0 39 1 Q18_04 Q18_04 -5 0 22 -9 9 12 0 16 q07_1_1n 5 -6 -4 81 * -10 -6 -15 7 Q07_2_02 Q07_2_02 -6 -2 -6 64 * -1 8 -9 16 Q07_2_03 Q07_2_03 -1 -17 -3 59 * 3 17 3 -12 Q07_2_01 Q07_2_01 -3 3 -5 46 * -13 -4 18 19 Q07_2_04 Q07_2_04 0 11 6 44 * 2 1 -16 -10 Q09_3 Q09_3 -13 5 -7 37 7 -4 15 20 Q14 Q14 5 20 12 34 14 2 -3 -13 Q07_2_05 Q07_2_05 13 -10 5 31 8 -3 -14 -31 Q15_03 Q15_03 5 1 1 -1 74 * -14 9 -2 q15_11n -5 4 -9 0 64 * 9 -7 -12 Q15_01 Q15_01 -2 -10 3 -6 59 * 7 10 3 Q15_02 Q15_02 16 -11 2 1 47 * 12 14 14 Q07_2_08 Q07_2_08 -6 16 -6 8 -21 -13 -2 14 Q15_06 Q15_06 7 13 8 1 -10 69 * -7 3 Q15_07 Q15_07 -2 3 -5 16 -2 67 * 8 -5 Q15_09 Q15_09 -2 15 5 -2 14 51 * -26 8 Q15_05 Q15_05 -4 -5 -9 2 26 49 * 12 -6 Q15_10 Q15_10 6 1 -7 10 21 43 * 3 12 Q15_08 Q15_08 4 -7 -1 -8 28 36 -28 12 Q15_04 Q15_04 12 8 1 -6 28 35 -7 10 Q18_01 Q18_01 -5 -3 1 -5 -7 28 10 -15 Q09_5 Q09_5 1 -10 -7 -3 -4 15 -3 11 Q06_09 Q06_09 7 16 -15 7 14 -26 -2 9 Q18_02 Q18_02 9 32 1 -2 -2 0 54 * 15 Q07_2_07 Q07_2_07 10 0 9 25 -12 7 -29 7 Q18_03 Q18_03 19 2 7 -1 -18 -2 -30 15 Q07_2_06 Q07_2_06 11 -10 12 27 -3 -8 -37 -7 Q09_4 Q09_4 -7 13 4 11 24 -17 2 52 * Q09_1 Q09_1 -3 10 -3 11 -11 11 0 48 * Q09_2 Q09_2 9 -20 6 0 -2 2 2 40 Variance Explained by Each Factor Eliminating Other Factors Factor1 Factor2 Factor3 Factor4 Factor5 Factor6 Factor7 Factor8 2.9687214 2.8326635 2.6588022 2.5707702 2.3273209 2.2838941 1.8157182 1.4476182 Factor Structure (Correlations) Factor1 Factor2 Factor3 Factor4 Factor5 Factor6 Factor7 Factor8 q20_1n 79 * 0 8 20 8 8 2 16

362
Q20_7 Q20_7 74 * 1 3 29 18 23 13 -4 Q20_8 Q20_8 63 * -19 -10 20 13 9 -3 -7 Q20_5 Q20_5 65 * -8 4 24 27 19 10 -6 Q20_3 Q20_3 59 * 4 -1 31 27 16 -11 11 Q20_4 Q20_4 50 * 15 -2 19 21 1 8 -26 Q20_6 Q20_6 53 * -22 0 9 3 12 4 0 Q20_2 Q20_2 40 * 0 7 -9 -5 12 -7 20 Q12 Q12 -13 81 * 17 -17 7 6 -1 11 Q11 Q11 -17 78 * 22 -15 9 13 25 12 Q13 Q13 -7 75 * 16 -2 18 5 19 17 Q10 Q10 -3 38 3 -3 -15 7 10 7 Q16 Q16 -21 48 * 39 7 15 8 16 -24 Q08 Q08 20 35 0 -13 -14 1 32 -3 Q19 Q19 3 38 28 7 -4 3 17 -14 Q21 Q21 10 35 10 10 9 9 -5 1 Q06_04 Q06_04 -2 12 66 * 9 4 0 -17 10 Q06_07 Q06_07 -10 28 60 * 7 1 5 -3 0 Q06_06 Q06_06 -4 13 55 * -4 -10 -1 1 2 Q06_01 Q06_01 8 -5 58 * 1 7 7 41 * 11 q06_08n 16 22 66 * 22 18 4 54 * 5 Q06_03 Q06_03 1 10 53 * 0 0 -1 5 -4 Q06_02 Q06_02 4 20 58 * 26 4 5 37 -17 Q06_05 Q06_05 17 11 49 * 10 17 6 48 * 0 Q18_04 Q18_04 -3 10 23 -7 12 16 2 20 q07_1_1n 27 -16 3 85 * 6 2 -13 -6 Q07_2_02 Q07_2_02 15 -6 0 65 * 15 17 -9 8 Q07_2_03 Q07_2_03 23 -21 2 69 * 20 24 3 -21 Q07_2_01 Q07_2_01 8 1 4 42 * -4 -2 18 11 Q07_2_04 Q07_2_04 12 8 13 49 * 15 9 -12 -14 Q09_3 Q09_3 -2 6 1 33 13 3 14 14 Q14 Q14 17 21 22 45 * 28 14 4 -15 Q07_2_05 Q07_2_05 24 -16 6 44 * 16 2 -10 -36 Q15_03 Q15_03 16 10 7 16 77 * 10 12 -2 q15_11n 7 10 -5 15 71 * 29 -7 -8 Q15_01 Q15_01 11 1 7 9 64 * 25 10 5 Q15_02 Q15_02 31 -2 7 18 58 * 32 15 16 Q07_2_08 Q07_2_08 -12 13 -4 -4 -24 -18 -3 13 Q15_06 Q15_06 18 21 14 10 17 75 * -6 13 Q15_07 Q15_07 17 9 3 26 24 73 * 6 1 Q15_09 Q15_09 8 23 8 6 33 62 * -27 19 Q15_05 Q15_05 12 2 -4 14 43 * 59 * 10 -1 Q15_10 Q15_10 22 7 -1 22 41 * 57 * 1 17 Q15_08 Q15_08 13 -1 -4 2 40 49 * -30 19 Q15_04 Q15_04 23 15 5 7 45 * 51 * -7 18 Q18_01 Q18_01 -2 0 2 -2 -1 24 9 -13 Q09_5 Q09_5 3 -10 -10 -4 -1 14 -6 12 Q06_09 Q06_09 5 13 -11 5 11 -18 -2 8 Q18_02 Q18_02 10 39 17 -3 4 4 58 * 16 Q07_2_07 Q07_2_07 16 -3 8 27 -3 11 -28 6 Q18_03 Q18_03 15 -1 1 -3 -17 -1 -29

363
18 Q07_2_06 Q07_2_06 17 -16 8 33 1 -3 -34 -12 Q09_4 Q09_4 -2 21 10 6 25 -3 3 52 * Q09_1 Q09_1 1 14 0 2 -4 15 -2 49 * Q09_2 Q09_2 13 -16 2 -1 -1 6 0 39 Variance Explained by Each Factor Ignoring Other Factors Factor1 Factor2 Factor3 Factor4 Factor5 Factor6 Factor7 Factor8 3.9581984 3.5544840 3.3491325 3.5868647 3.5681851 3.4630440 2.1562253 1.6206335 Final Communality Estimates: Total = 21.754338 Q06_01 Q06_02 Q06_03 Q06_04 Q06_05 Q06_06 Q06_07 q06_08n Q06_09 q07_1_1n 0.51449901 0.47533985 0.28927262 0.52426014 0.43234313 0.33655303 0.42111095 0.67215662 0.12247215 0.77749138 Q07_2_01 Q07_2_02 Q07_2_03 Q07_2_04 Q07_2_05 Q07_2_06 Q07_2_07 Q07_2_08 Q08 Q10 0.26887363 0.47566443 0.55576299 0.29032801 0.34430809 0.28511838 0.19752294 0.12671245 0.34091432 0.20291009 Q14 Q15_01 Q15_02 Q15_03 Q15_04 Q15_05 Q15_06 Q15_07 Q15_08 Q15_09 0.31130900 0.43518837 0.43599957 0.61950424 0.39092965 0.44415085 0.60954981 0.57732730 0.41926774 0.51191821 Q15_10 q15_11n Q18_01 Q18_02 Q18_03 Q18_04 q20_1n Q20_2 Q20_3 Q20_4 0.41463357 0.53446492 0.10653480 0.48610286 0.18354632 0.12525645 0.66583490 0.26599155 0.43528062 0.40804539 Q20_5 Q20_6 Q20_7 Q20_8 Q21 Q11 Q12 Q13 Q16 Q09_1 0.45715451 0.31664071 0.57204874 0.42990611 0.15332176 0.67321050 0.68065991 0.59655663 0.45877227 0.28226016 Q09_2 Q09_3 Q09_4 Q09_5 Q19 0.20640777 0.19659060 0.39113193 0.05918825 0.24603760 Scoring Coefficients Estimated by Regression Squared Multiple Correlations of the Variables with Each Factor Factor1 Factor2 Factor3 Factor4 Factor5 Factor6 Factor7 Factor8 0.89886425 0.90032268 0.87241389 0.91773237 0.87650155 0.87540881 0.81154790 0.75981729 Standardized Scoring Coefficients Factor1 Factor2 Factor3 Factor4 Factor5 Factor6 Factor7 Factor8 q20_1n 0.30819 0.00020 0.02381 -0.08235 -0.03946 -0.01879 -0.02649 0.13529 Q20_7 Q20_7 0.21756 0.02066 -0.02205 0.01662 0.00886 0.03450 0.04778 -0.05436 Q20_8 Q20_8 0.13278 -0.01802 -0.02224 0.02248 0.00211 0.01186 -0.00748 -0.05009 Q20_5 Q20_5 0.14693 -0.02893 0.01499 0.04301 0.05060 -0.01247 0.02878 -0.03081 Q20_3 Q20_3 0.12082 0.02868 -0.00494 0.01623 0.03354 -0.00842 -0.06780 0.05093 Q20_4 Q20_4 0.09513 0.08695 -0.03733 0.06837 0.02998 -0.04067 0.01285 -0.15742 Q20_6 Q20_6 0.11399 -0.06190 0.01450 -0.04883 -0.02140 0.02635 0.04597 -0.00172 Q20_2 Q20_2 0.09667 0.00937 0.02317 0.00898 -0.03614 0.01218 -0.04861 0.06200 Q12 Q12 -0.00782 0.28965 0.01749 -0.02877 0.00453 -0.01389 -0.13116 0.00153 Q11 Q11 -0.05649 0.27300 -0.00128 0.01146 -0.01674 0.02037 0.07250 0.04555 Q13 Q13 -0.01416 0.21382 -0.02862 0.01710 0.05606 -0.03806 0.03791 0.07463 Q10 Q10 0.00377 0.06085 -0.01013 -0.00277 -0.05706 0.02798 0.03115 0.00516 Q16 Q16 -0.04575 0.06756 0.09299 0.01311 0.04832 0.02262 0.01444 -0.16133 Q08 Q08 0.04749 0.05350 -0.03101 -0.05078 -0.04394 0.01723 0.10685 -0.03884 Q19 Q19 0.04188 0.08702 0.04830 0.00522 -0.01667 0.00494 0.01326 -0.08234 Q21 Q21 0.02471 0.06991 0.01812 0.02625 0.01322 -0.01437 -0.03454 0.01640 Q06_04 Q06_04 -0.00793 -0.00242 0.23742 -0.04534 0.00293 -0.01578 -0.14622 0.06863 Q06_07 Q06_07 -0.04212 0.06103 0.18884 0.03907 0.00181 -0.00440 -0.09113 -0.01628 Q06_06 Q06_06 -0.01833 0.01657 0.13982 0.00171 -0.01810 0.00809 -0.05132 -0.01143 Q06_01 Q06_01 0.02448 -0.09752 0.17117 0.00005 -0.01022 0.02003 0.13441 0.07842 q06_08n 0.01727 -0.00928 0.21808 0.06595 0.03485 -0.03295 0.23775 0.03120 Q06_03 Q06_03 0.01149 0.01014 0.10387 0.00219 -0.00691 -0.00656 -0.03788 -0.01927 Q06_02 Q06_02 0.00594 0.00632 0.13337 0.06667 -0.02513 0.01544 0.09281 -0.09526 Q06_05 Q06_05 0.01289 -0.00865 0.11425 0.02627 0.03858 -0.01661 0.16087 -0.01300 Q18_04 Q18_04 -0.00839 -0.00027 0.04662 -0.02944 0.01730 0.03069 -0.01037

364
0.06116 q07_1_1n -0.00185 0.01475 -0.02855 0.62609 -0.06733 -0.11210 -0.07218 0.04378 Q07_2_02 Q07_2_02 -0.01610 0.00773 -0.01053 0.17140 0.00525 0.02473 -0.01645 0.10683 Q07_2_03 Q07_2_03 0.01391 -0.07953 -0.01152 0.10313 0.02517 0.09222 0.07017 -0.13311 Q07_2_01 Q07_2_01 0.00122 -0.00060 -0.00494 0.03597 -0.02245 -0.00286 0.09351 0.06048 Q07_2_04 Q07_2_04 0.00886 0.03052 0.02961 0.06126 0.02580 0.01443 -0.05811 -0.06752 Q09_3 Q09_3 -0.02734 -0.00423 -0.02794 0.06682 0.02613 -0.00683 0.05777 0.06176 Q14 Q14 0.01175 0.06731 0.03766 0.05233 0.04902 0.00326 -0.00312 -0.08653 Q07_2_05 Q07_2_05 0.02180 -0.01066 0.02662 0.03762 0.04359 -0.01703 -0.02582 -0.14531 Q15_03 Q15_03 0.00400 -0.01232 0.00390 -0.06876 0.35204 -0.05567 0.03436 -0.05452 q15_11n -0.02119 0.03080 -0.03413 0.07796 0.23997 -0.01562 -0.07488 -0.07041 Q15_01 Q15_01 -0.00031 -0.01142 0.01484 -0.00773 0.14223 0.01457 0.02729 0.03013 Q15_02 Q15_02 0.04341 -0.01655 -0.00396 -0.00143 0.11299 0.02961 0.04979 0.07968 Q07_2_08 Q07_2_08 -0.00208 0.02564 -0.01088 -0.07829 -0.02860 -0.02402 -0.00282 0.05577 Q15_06 Q15_06 0.04025 0.01172 0.03099 -0.10431 -0.05061 0.32613 -0.03754 0.01100 Q15_07 Q15_07 -0.03257 0.01231 -0.02603 0.07158 -0.02983 0.25681 0.07636 -0.04108 Q15_09 Q15_09 -0.01057 0.05905 0.01862 -0.00796 0.04764 0.15180 -0.14512 0.06960 Q15_05 Q15_05 -0.01433 -0.03673 -0.02937 -0.01221 0.08551 0.16055 0.06162 -0.03219 Q15_10 Q15_10 0.03685 0.01070 -0.01813 0.04661 0.03642 0.13742 0.02225 0.07950 Q15_08 Q15_08 -0.01727 -0.00708 0.01743 -0.01681 0.08904 0.08453 -0.11426 0.06922 Q15_04 Q15_04 0.03372 0.03529 0.00537 0.02677 0.09989 0.09435 -0.06287 0.05738 Q18_01 Q18_01 0.00360 -0.01307 -0.01316 0.01625 -0.03495 0.05641 0.03291 -0.03908 Q09_5 Q09_5 -0.00657 -0.01367 -0.01112 -0.01261 -0.00471 0.02984 0.00571 0.04878 Q06_09 Q06_09 0.01132 0.05203 -0.04211 0.01801 0.04191 -0.06649 -0.02297 0.04358 Q18_02 Q18_02 0.02629 0.06013 -0.04022 0.06212 -0.03977 0.00581 0.23168 0.08840 Q07_2_07 Q07_2_07 0.02274 -0.00012 0.02580 0.05200 -0.02191 0.00999 -0.08485 0.02938 Q18_03 Q18_03 0.02598 -0.00345 0.02451 -0.00969 -0.04151 -0.00870 -0.10328 0.07173 Q07_2_06 Q07_2_06 0.02342 0.00010 0.05270 -0.00208 0.01391 -0.00149 -0.14464 -0.05862 Q09_4 Q09_4 -0.01540 0.01927 0.00303 -0.00190 0.09287 -0.04173 -0.00885 0.28077 Q09_1 Q09_1 0.00022 0.03004 -0.00686 0.00955 -0.01928 0.02564 -0.00789 0.19820 Q09_2 Q09_2 0.01125 -0.02389 0.00439 -0.00752 0.00793 0.01515 0.00933 0.15338

365
APPENDIX F
The following tables and graphs indicate statistically significant
associations between the dependent variable and the response variables.
Table 6.5: Contingency table - presence of structured/non-structured risk management approach compared to the annual turnover of SME.
Frequency/ Cell percentage/ Row percentage/ Column percentage/
More than R500 000
Less and equal to R500 000 TOTAL
Yes/presence 24
15.2% 60.0% 36.9%
16 10.1% 40.0% 17.2%
40 25.3%
No/non-presence 41
26.0% 34.8% 63.1%
77 48.7% 65.2% 82.8%
118 74.7%
TOTAL 65 41.1%
93 58.9%
158 100.0%
Table 6.6: Chi-square test for comparisons.
Question/statement Sample size
Chi-square DF P-value
Comparisons between new1 and Q01 (annual turnover of SMEs) 1. Annual turnover of your business 158 7.8681 1 0.0050** *** Significant at the 99,9% level of significance (<0.001). ** Significant at the 99,0% level of significance (<0.01). * Significant at the 95,0% level of significance (<0.05).
The abovementioned Chi-square test shows that the modes of
classification were not independent, indicating an association/relationship
between the two variables. The analogy can be drawn that statistically
significant more SMEs that did not have a structured risk management
approach, had a less and equal to R500 000 turnover.

366
Figure 6.23: Comparison between structured risk management and turnover of SME.
Table 6.7: Contingency table - presence of structured/non-structured risk management approach compared to the number of permanent employees of SME.
Frequency/ Cell percentage/ Row percentage/ Column percentage/
More then 10 Less and equal to 10 TOTAL
Yes/presence 22
13.9% 55.0% 39.3%
18 11.4% 45.0% 17.6%
40 25.3%
No/non-presence 34
21.5% 28.8% 60.7%
84 53.2% 71.2% 82.4%
118 74.7%
TOTAL 56 35.4%
102 64.6%
158 100.0%
Table 6.8: Chi-square test for comparisons.
Question/statement Sample size
Chi-square
DF P-value
Comparisons between new1 and Q02 (number of permanent employees of SME’s) 2. Number of permanent employees in
your business 158 8.9529 1 0.0.0028***
Statistically significant more SMEs that did not have a structured risk
management approach, had less and equal to 10 permanent employees.
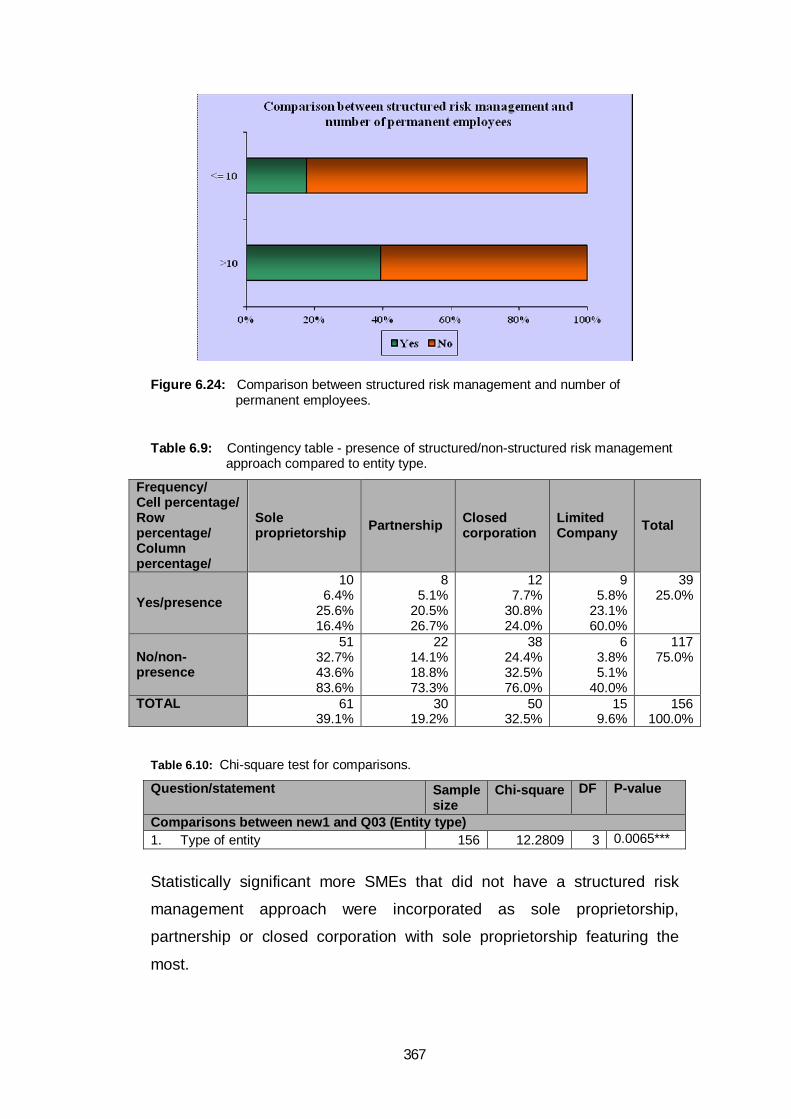
367
Figure 6.24: Comparison between structured risk management and number of permanent employees.
Table 6.9: Contingency table - presence of structured/non-structured risk management
approach compared to entity type.
Frequency/ Cell percentage/ Row percentage/ Column percentage/
Sole proprietorship Partnership Closed
corporation Limited Company Total
Yes/presence 10
6.4% 25.6% 16.4%
8 5.1%
20.5% 26.7%
12 7.7%
30.8% 24.0%
9 5.8%
23.1% 60.0%
39 25.0%
No/non-presence
51 32.7% 43.6% 83.6%
22 14.1% 18.8% 73.3%
38 24.4% 32.5% 76.0%
6 3.8% 5.1%
40.0%
117 75.0%
TOTAL 61 39.1%
30 19.2%
50 32.5%
15 9.6%
156 100.0%
Table 6.10: Chi-square test for comparisons.
Question/statement Sample size
Chi-square DF P-value
Comparisons between new1 and Q03 (Entity type) 1. Type of entity 156 12.2809 3 0.0065***
Statistically significant more SMEs that did not have a structured risk
management approach were incorporated as sole proprietorship,
partnership or closed corporation with sole proprietorship featuring the
most.

368
Figure 6.25: Comparison between structured risk management and type of entity.
Table 6.11: Contingency table – presence of structured/non-structured risk management approach compared to SME owner qualification.
Frequency/ Cell percentage/ Row percentage/ Column percentage/
Post-graduate degree
Post-matriculation (other /diploma /degree)
Up to matriculation certificate
TOTAL
Yes/presence 11
7.3% 29.0% 52.4%
21 13.9% 55.3% 24.4%
6 4.0%
15.8% 13.6%
38 25.2%
No/non-presence 10
6.6% 8.8%
47.6%
65 43.0% 57.5% 75.6%
38 25.2% 33.6% 86.4%
113 74.8%
TOTAL 21 13.9%
86 57.0%
44 29.1%
151 100.0%
Table 6.12: Chi-square test for comparisons.
Question/statement Sample size
Chi-square DF P-value
Comparisons between new1 and Q05.1 (owner of SME’s qualification) 1. Owner of SME’s qualification 151 11.3903 2 0.0034***
Statistically significant more owners of SMEs that did not have a structured
risk management approach did not obtain any formal post-matriculation
qualifications.

369
Figure 6.26: Comparison between structured risk management and qualification of owner.
Table 6.13: Contingency table – presence of structured/non-structured risk management approach compared to external support at marketing management (MM).
Frequency/ Cell percentage/ Row percentage/ Column percentage/
Yes, received support
No, did not receive support TOTAL
Yes/presence 21
13.3% 52.5% 37.5%
19 12.0% 47.5% 18.6%
40 25.3%
No/non-presence 35
22.2% 29.7% 62.5%
83 52.5% 70.3% 81.4%
118 74.7%
TOTAL 56 35.4%
102 64.6%
158 100.0%
Table 6.14: Chi-square test for comparisons.
Question/statement Sample size
Chi-square DF P-value
Comparisons between new1 and Q06.2 (external support to marketing management) 1. External support to marketing
management 158 6.8103 1 0.0091***
Statistically significant more SMEs that did not have a structured risk
management approach did not have external support to their marketing
management area.

370
Table 6.15: Contingency table – presence of structured/non-structured risk management approach compared to external support at human resource management (HRM).
Frequency/ Cell percentage/ Row percentage/ Column percentage/
Yes, received support
No, did not receive support TOTAL
Yes/presence 12
7.6% 30.0% 48.0%
28 17.7% 70.0% 21.0%
40 25.3%
No/non-presence 13
8.2% 11.0% 52.0%
105 66.5% 89.0% 79.0%
118 74.7%
TOTAL 25 15.8%
133 84.2%
158 100.0%
Table 6.16: Chi-square test for comparisons.
Question/statement Sample size
Chi-square DF P-value
Comparisons between new1 and Q06.6 (external support to human resource management) 1. External support to human resource
management 158 8.0824 1 0.0045***
Statistically significant more SMEs that did not have a structured risk
management approach did not have external support to their human
resource management area.
Table 6.17: Contingency table – presence of structured/non-structured risk management approach compared to external support at public relation management (PRM).
Frequency/ Cell percentage/ Row percentage/ Column percentage/
Yes, received support
No, did not receive support TOTAL
Yes/presence 12
7.6% 30.0% 48.0%
28 17.7% 70.0% 21.0%
40 25.3%
No/non-presence 13
8.2% 11.0% 52.0%
105 66.5% 89.0% 79.0%
118 74.7%
TOTAL 25 15.8%
133 84.2%
158 100.0%

371
Table 6.18: Chi-square test for comparisons.
Question/statement Sample size
Chi-square DF P-value
Comparisons between new1 and Q06.6 (external support to public relation management) 1. External support to public relation
management 158 8.0824 1 0.0045***
Statistically significant more SMEs that did not have a structured risk
management approach did not have external support to their public
relation management area.
Figure 6.27: Comparison between structured risk management and external support to management areas.
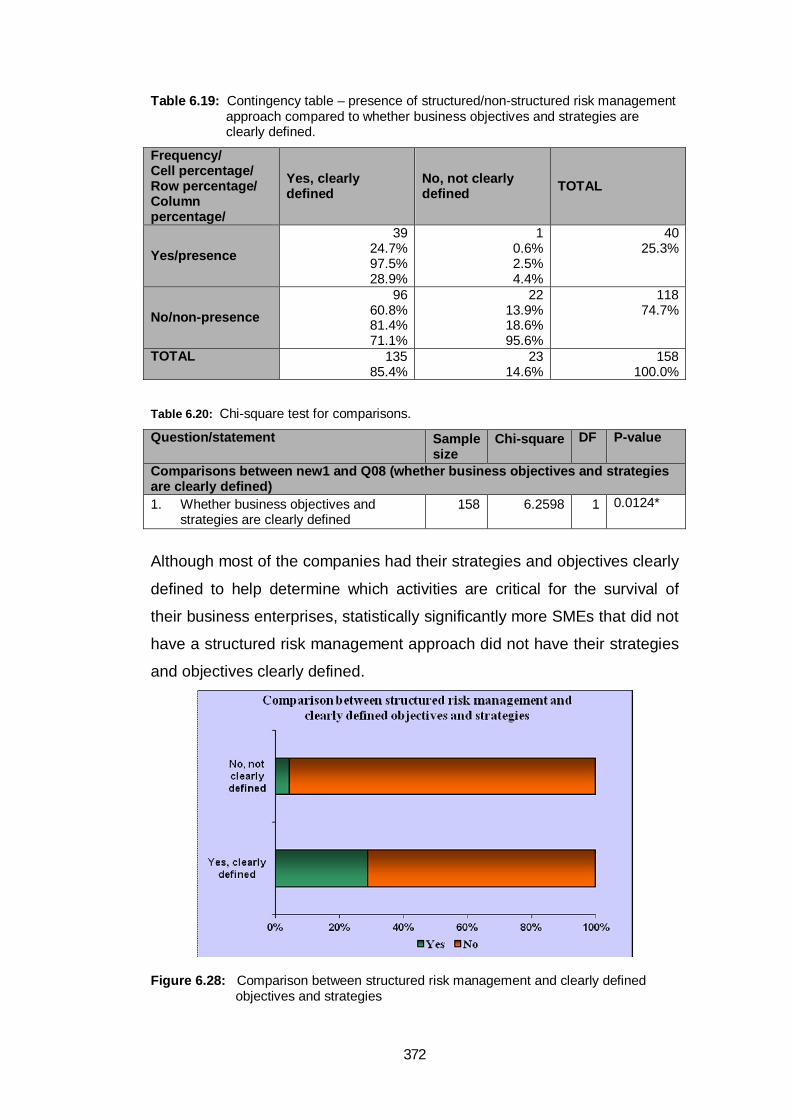
372
Table 6.19: Contingency table – presence of structured/non-structured risk management approach compared to whether business objectives and strategies are clearly defined.
Frequency/ Cell percentage/ Row percentage/ Column percentage/
Yes, clearly defined
No, not clearly defined TOTAL
Yes/presence 39
24.7% 97.5% 28.9%
1 0.6% 2.5% 4.4%
40 25.3%
No/non-presence 96
60.8% 81.4% 71.1%
22 13.9% 18.6% 95.6%
118 74.7%
TOTAL 135 85.4%
23 14.6%
158 100.0%
Table 6.20: Chi-square test for comparisons.
Question/statement Sample size
Chi-square DF P-value
Comparisons between new1 and Q08 (whether business objectives and strategies are clearly defined) 1. Whether business objectives and
strategies are clearly defined 158 6.2598 1 0.0124*
Although most of the companies had their strategies and objectives clearly
defined to help determine which activities are critical for the survival of
their business enterprises, statistically significantly more SMEs that did not
have a structured risk management approach did not have their strategies
and objectives clearly defined.
Figure 6.28: Comparison between structured risk management and clearly defined objectives and strategies

373
Table 6.21: Contingency table – presence of structured/non-structured risk management approach compared to understanding of risk.
Frequency/ Cell percentage/ Row percentage/ Column percentage/
Yes, understood impact
No, did not understand TOTAL
Yes/presence 39
24.7% 97.5% 28.3%
1 0.6% 2.5% 5.0%
40 25.3%
No/non-presence 99
62.7% 83.9% 71.7%
19 12.0% 16.1% 95.0%
118 74.7%
TOTAL 138 87.3%
20 12.7%
158 100.0%
Table 6.22: Chi-square test for comparisons.
Question/statement Sample size
Chi-square DF P-value
Comparisons between new1 and Q10 (understanding of risk ) 1. Understanding of risk that has an impact
on business structure and processes 158 4.9999 1 0.0254*
Although most of the companies had an understanding of the risk that had
an impact on their business structure and processes, statistically
significantly more SMEs that did not have a structured risk management
approach, did not have an understanding of that risk.
Figure 6.29: Comparison between structured risk management and understanding of
risk.

374
Table 6.23: Contingency table – presence of structured/non-structured risk management approach compared to formal risk assessment in finance.
Frequency/ Cell percentage/ Row percentage/ Column percentage/
Yes, formal risk assessment took place
No, formal risk assessment did not take place
TOTAL
Yes/presence 36 22.8% 90.0% 31.0%
4 2.5% 10.0% 9.5%
40 25.3%
No/non-presence 80 50.6% 67.8% 69.0%
38 24.0% 32.2% 90.5%
118 74.7%
TOTAL 116 73.4%
42 26.6%
158 100.0%
Table 6.24: Chi-square test for comparisons.
Question/statement Sample size
Chi-square DF P-value
Comparisons between new1 and Q17.1 (formal risk assessment ) 1. Formal risk identification or assessment
takes place in the finance function 158 7.5462 1 0.0060***
Statistically significant more SMEs that did not have a structured risk
management approach, did not have a formal risk identification and
assessment at the finance function.
Table 6.25: Contingency table – presence of structured/non-structured risk management approach compared to formal risk assessment in human resources.
Frequency/ Cell percentage/ Row percentage/ Column percentage/
Yes, formal risk assessment took place
No, formal risk assessment did not take place
TOTAL
Yes/presence 20
12.7% 50.0% 51.3%
20 12.7
50.0% 16.8
40 25.3%
No/non-presence 19
12.0% 16.1% 48.7%
99 62.7% 83.9% 83.2%
118 74.7%
TOTAL 39 24.7%
119 75.3%
158 100.0%

375
Table 6.26: Chi-square test for comparisons.
Question/statement Sample size
Chi-square DF P-value
Comparisons between new1 and Q17.3 (formal risk assessment ) 1. Formal risk identification or assessment
takes place in the human resource function
158 18.4648 1 <0.0001***
Statistically significant more SMEs that did not have a structured risk
management approach, did not have a formal risk identification and
assessment at the human resource function.
Table 6.27: Contingency table – presence of structured/non-structured risk management approach compared to formal risk assessment in operational processes.
Frequency/ Cell percentage/ Row percentage/ Column percentage/
Yes, formal risk assessment took place
No, formal risk assessment did not take place
TOTAL
Yes/presence 28
17.7% 70.0% 31.5%
12 7.6%
30.0% 17.4%
40 25.3%
No/non-presence 61
38.6% 51.7% 68.5%
57 36.1% 48.3% 82.6%
118 74.7%
TOTAL 89 56.3%
69 43.7%
158 100.0%
Table 6.28: Chi-square test for comparisons.
Question/statement Sample size
Chi-square DF P-value
Comparisons between new1 and Q17.4 (formal risk assessment ) 1. Formal risk identification or assessment
takes place in the operational function 158 4.0691 1 0.0437*
Statistically significant more SMEs that did not have a structured risk
management approach, did not have a formal risk identification and
assessment in the operational function.

376
Figure 6.30: Comparison between structured risk management and formal risk assessment.
Table 6.29: Contingency table – presence of structured/non-structured risk management approach compared to improvement of internal controls.
Frequency/ Cell percentage/ Row percentage/ Column percentage/
Yes, improved internal controls
No, did not improve internal controls
TOTAL
Yes/presence 37
23.4% 92.5% 30.8%
3 1.9% 7.5% 7.9%
40 25.3%
No/non-presence 83
52.5% 70.3% 69.2%
35 22.2% 29.7% 92.1%
118 74.7%
TOTAL 120 76.0%
38 24.0%
158 100.0%

377
Table 6.30: Chi-square test for comparisons.
Question/statement Sample size
Chi-square DF P-value
Comparisons between new1 and Q18.2 (improvement of internal controls) 1. Improvement of internal controls 158 8.0318 1 0.0046***
Statistically significant more SMEs that did not have a structured risk
management approach, did not have improvement of internal controls.
Figure 6.31: Comparison between structured risk management and improvement of internal controls.
Table 6.31: Contingency table – presence of structured/non-structured risk management
approach compared to engagement in the identified activity.
Frequency/ Cell percentage/ Row percentage/ Column percentage/
Yes, did not engage No, engaged TOTAL
Yes/presence 2
1.3% 5.0% 6.2%
38 24.0% 95.0% 30.2%
40 25.3%
No/non-presence 30
19.0% 25.4% 94.0%
88 55.7% 74.6% 69.8%
118 74.7%
TOTAL 32 20.2%
126 79.8%
158 100.0%

378
Table 6.32: Chi-square test for comparisons.
Question/statement Sample size
Chi-square DF P-value
Comparisons between new1 and Q18.3 (engagement of the identified activity)
1. Do not engage in the identified activity 158 7.7152 1 0.0055***
Statistically significant more SMEs that did not have a structured risk
management approach, did not engage in an identified risk activity.
Figure 6.32: Comparison between structured risk management and engagement of identified activity.
Table 6.33: Contingency table – presence of structured/non-structured risk management
approach compared to experiencing of obstacles.
Frequency/ Cell percentage/ Row percentage/ Column percentage/
Yes, experienced an obstacle
No, no obstacles experienced TOTAL
Yes/presence 21
13.3% 52.5% 19.3%
19 12.0% 47.5% 38.8%
40 25.3%
No/non-presence 88
55.7% 74.6% 80.7%
30 19.0% 25.4% 61.2%
118 74.7%
TOTAL 109 69.0%
49 31.0%
158 100.0%

379
Table 6.34: Chi-square test for comparisons.
Question/statement Sample size
Chi-square DF P-value
Comparisons between new1 and Q20.1 (experiencing obstacles )
1. Experiencing obstacles 158 6.8050 1 0.0091***
Statistically significant more SMEs that did not have a structured risk
management approach, experienced obstacles to implementing a risk
management framework.
Figure 6.33: Comparison between structured risk management and obstacles to implementing.
Table 6.35: Contingency table – presence of structured/non-structured risk management
approach compared to lack of intellectual capital.
Frequency/ Cell percentage/ Row percentage/ Column percentage/
Yes, lack of intellectual capital
No, no lack of intellectual capital TOTAL
Yes/presence 7
4.4% 17.5% 14.9%
33 20.9% 82.5% 29.7%
40 25.3%
No/non-presence 40
25.3% 33.9% 85.1%
78 49.4% 66.1% 70.3%
118 74.7%
TOTAL 47 29.8%
111 70.2%
158 100.0%

380
Table 6.36: Chi-square test for comparisons.
Question/statement Sample size
Chi-square DF P-value
Comparisons between new1 and Q20.5 (lack of intellectual capital)
1. Lack of intellectual capital is an obstacle
to implementing a RMF
158 3.8439 1 0.0499*
Statistically significant more SMEs that did not have a structured risk
management approach, experienced that a lack of intellectual capital
posed an obstacle when wanting to implement a risk management
framework.
Figure 6.34: Comparison between structured risk management and intellectual capital.
Table 6.37: Contingency table – presence of structured/non-structured risk management approach compared to cost as an obstacle.
Frequency/ Cell percentage/ Row percentage/ Column percentage/
Yes, cost is an obstacle
No, cost is not an obstacle TOTAL
Yes/presence 12
7.6% 30.0% 17.1%
28 17.7% 70.0% 31.8%
40 25.3%
No/non-presence 58
36.7% 49.2% 82.9%
60 38.0% 50.8% 68.2%
118 74.7%
TOTAL 70 44.3%
88 55.7%
158 100.0%

381
Table 6.38: Chi-square test for comparisons.
Question/statement Sample size
Chi-square DF P-value
Comparisons between new1 and Q20.7 (Cost )
1. Cost is an obstacle to implementing a
RMF
158 4.4409 1 0.0351*
Statistically significant more SMEs that did not have a structured risk
management approach, experienced cost as an obstacle to implementing
a risk management framework.
Figure 6.35: Comparison between structured risk management and cost.
Table 6.39: Contingency table – presence of structured/non-structured risk management approach compared to lack of skills as an obstacle.
Frequency/ Cell percentage/ Row percentage/ Column percentage/
Yes, formal risk assessment take place
No, formal risk assessment do not take place
TOTAL
Yes/presence 5
3.2% 12.5% 9.6%
35 22.2% 87.5%
33.0
40 25.3%
No/non-presence 47
30.0% 39.8% 90.4%
71 44.9% 60.2% 67.0%
118 74.7%
TOTAL 52 32.9%
106 67.1%
158 100.0%

382
Table 6.40: Chi-square test for comparisons.
Question/statement Sample size
Chi-square DF P-value
Comparisons between new1 and Q20.8 (lack of skills as an obstacle)
1. Lack of skills as an obstacle to
implement a RMF
158 10.1061 1 0.0015***
Statistically significant more SMEs that did not have a structured risk
management approach, experienced a lack of skills as an obstacle to
implementing a risk management framework.
Figure 6.36: Comparison between structured risk management and skills.
Table 6.41: Contingency table – presence of structured/non-structured risk management approach compared to importance of management risk.
Frequency/ Cell percentage/ Row percentage/ Column percentage/
Most important Important Less
important Not so important
Least important Total
Yes/presence 10
6.4% 25.0% 26.3%
9 5.7%
22.5% 33.3%
4 2.6%
10.0% 11.4%
6 3.8%
15.0% 18.2%
11 7.0%
27.5% 45.8%
40 25.5%
No/non-presence
28 17.8% 23.9% 73.7%
18 11.5% 15.4% 66.7%
31 19.8% 26.5% 88.6%
27 17.2% 23.1% 81.8%
13 8.3%
11.1% 54.2%
117 74.5%
TOTAL 38 24.2%
27 17.2%
35 22.3%
33 21.0%
24 15.3%
157 100.0%

383
Table 6.42: Chi-square test for comparisons.
Question/statement Sample size
Chi-square DF P-value
Comparisons between new1 and Q09.1 (management risk)
1. Importance of management risk 157 10.6929 4 0.0302*
Statistically significant more SMEs that do have a structured risk
management approach, rate management risk as least important.
Figure 6.37: Comparison between structured risk management and the importance of management risk.
Table 6.43: Contingency table - presence of structured/non-structured risk management approach compared to importance of commercial risk.
Frequency/ Cell percentage/ Row percentage/ Column percentage/
Most important Important Less
important Not so important
Least important Total
Yes/presence 8
5.1% 20.0% 22.9%
5 3.2%
12.5% 16.1%
13 8.3%
32.5% 30.2%
4 2.6%
10.0% 14.3%
10 6.4%
25.0% 50.0%
40 25.5%
No/non-presence
27 17.2% 23.1% 77.1%
26 16.6% 22.2% 83.9%
30 19.1% 25.6% 69.8%
24 15.3% 20.5% 85.7%
10 6.4% 8.6%
50.0%
117 74.5%
TOTAL 35 22.3%
31 19.8%
43 27.4%
28 17.8%
20 12.7%
157 100.0%

384
Table 6.44: Chi-square test for comparisons.
Question/statement Sample size
Chi-square DF P-value
Comparisons between new1 and Q09.2 (commercial risk)
1. Importance of commercial risk 157 10.2472 4 0.0365*
Statistically significant more SMEs that do have a structured risk
management approach, rate commercial risk as least important.
Figure 6.38: Comparison between structured risk management and commercial risk.
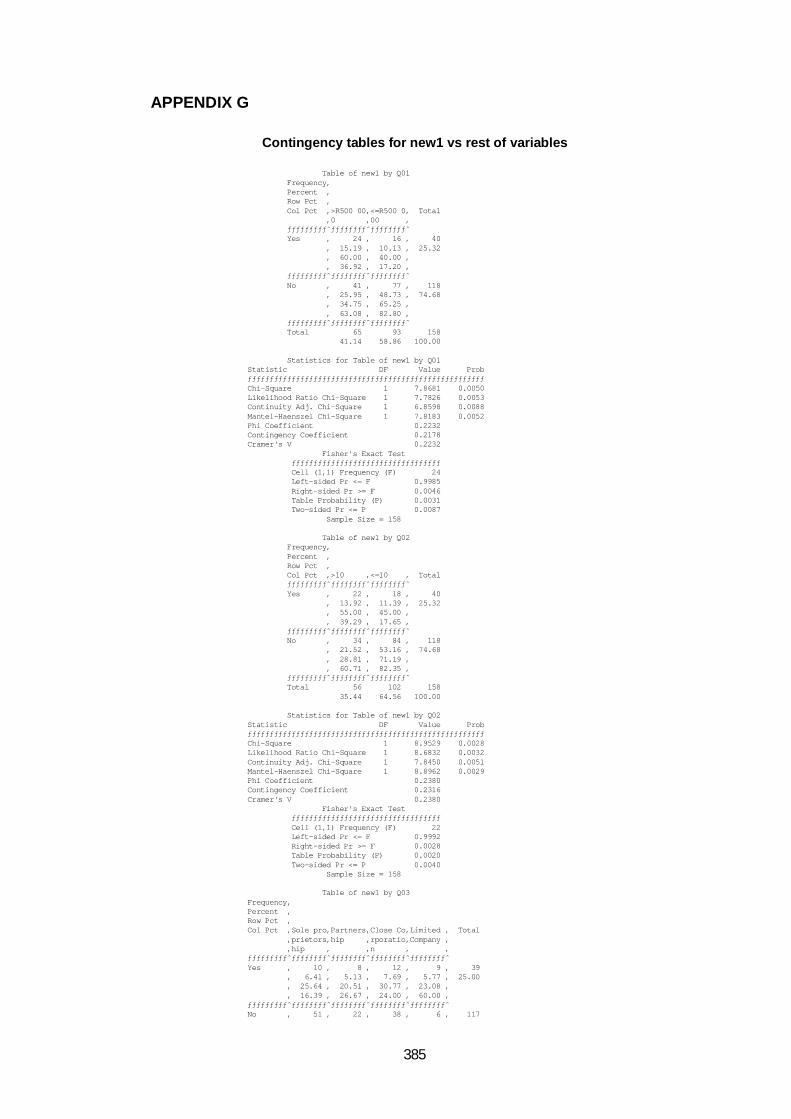
385
APPENDIX G
Contingency tables for new1 vs rest of variables Table of new1 by Q01 Frequency‚ Percent ‚ Row Pct ‚ Col Pct ‚>R500 00‚<=R500 0‚ Total ‚0 ‚00 ‚ ƒƒƒƒƒƒƒƒƒˆƒƒƒƒƒƒƒƒˆƒƒƒƒƒƒƒƒˆ Yes ‚ 24 ‚ 16 ‚ 40 ‚ 15.19 ‚ 10.13 ‚ 25.32 ‚ 60.00 ‚ 40.00 ‚ ‚ 36.92 ‚ 17.20 ‚ ƒƒƒƒƒƒƒƒƒˆƒƒƒƒƒƒƒƒˆƒƒƒƒƒƒƒƒˆ No ‚ 41 ‚ 77 ‚ 118 ‚ 25.95 ‚ 48.73 ‚ 74.68 ‚ 34.75 ‚ 65.25 ‚ ‚ 63.08 ‚ 82.80 ‚ ƒƒƒƒƒƒƒƒƒˆƒƒƒƒƒƒƒƒˆƒƒƒƒƒƒƒƒˆ Total 65 93 158 41.14 58.86 100.00 Statistics for Table of new1 by Q01 Statistic DF Value Prob ƒƒƒƒƒƒƒƒƒƒƒƒƒƒƒƒƒƒƒƒƒƒƒƒƒƒƒƒƒƒƒƒƒƒƒƒƒƒƒƒƒƒƒƒƒƒƒƒƒƒƒƒƒƒ Chi-Square 1 7.8681 0.0050 Likelihood Ratio Chi-Square 1 7.7826 0.0053 Continuity Adj. Chi-Square 1 6.8598 0.0088 Mantel-Haenszel Chi-Square 1 7.8183 0.0052 Phi Coefficient 0.2232 Contingency Coefficient 0.2178 Cramer's V 0.2232 Fisher's Exact Test ƒƒƒƒƒƒƒƒƒƒƒƒƒƒƒƒƒƒƒƒƒƒƒƒƒƒƒƒƒƒƒƒƒƒ Cell (1,1) Frequency (F) 24 Left-sided Pr <= F 0.9985 Right-sided Pr >= F 0.0046 Table Probability (P) 0.0031 Two-sided Pr <= P 0.0087 Sample Size = 158 Table of new1 by Q02 Frequency‚ Percent ‚ Row Pct ‚ Col Pct ‚>10 ‚<=10 ‚ Total ƒƒƒƒƒƒƒƒƒˆƒƒƒƒƒƒƒƒˆƒƒƒƒƒƒƒƒˆ Yes ‚ 22 ‚ 18 ‚ 40 ‚ 13.92 ‚ 11.39 ‚ 25.32 ‚ 55.00 ‚ 45.00 ‚ ‚ 39.29 ‚ 17.65 ‚ ƒƒƒƒƒƒƒƒƒˆƒƒƒƒƒƒƒƒˆƒƒƒƒƒƒƒƒˆ No ‚ 34 ‚ 84 ‚ 118 ‚ 21.52 ‚ 53.16 ‚ 74.68 ‚ 28.81 ‚ 71.19 ‚ ‚ 60.71 ‚ 82.35 ‚ ƒƒƒƒƒƒƒƒƒˆƒƒƒƒƒƒƒƒˆƒƒƒƒƒƒƒƒˆ Total 56 102 158 35.44 64.56 100.00 Statistics for Table of new1 by Q02 Statistic DF Value Prob ƒƒƒƒƒƒƒƒƒƒƒƒƒƒƒƒƒƒƒƒƒƒƒƒƒƒƒƒƒƒƒƒƒƒƒƒƒƒƒƒƒƒƒƒƒƒƒƒƒƒƒƒƒƒ Chi-Square 1 8.9529 0.0028 Likelihood Ratio Chi-Square 1 8.6832 0.0032 Continuity Adj. Chi-Square 1 7.8450 0.0051 Mantel-Haenszel Chi-Square 1 8.8962 0.0029 Phi Coefficient 0.2380 Contingency Coefficient 0.2316 Cramer's V 0.2380 Fisher's Exact Test ƒƒƒƒƒƒƒƒƒƒƒƒƒƒƒƒƒƒƒƒƒƒƒƒƒƒƒƒƒƒƒƒƒƒ Cell (1,1) Frequency (F) 22 Left-sided Pr <= F 0.9992 Right-sided Pr >= F 0.0028 Table Probability (P) 0.0020 Two-sided Pr <= P 0.0040 Sample Size = 158 Table of new1 by Q03 Frequency‚ Percent ‚ Row Pct ‚ Col Pct ‚Sole pro‚Partners‚Close Co‚Limited ‚ Total ‚prietors‚hip ‚rporatio‚Company ‚ ‚hip ‚ ‚n ‚ ‚ ƒƒƒƒƒƒƒƒƒˆƒƒƒƒƒƒƒƒˆƒƒƒƒƒƒƒƒˆƒƒƒƒƒƒƒƒˆƒƒƒƒƒƒƒƒˆ Yes ‚ 10 ‚ 8 ‚ 12 ‚ 9 ‚ 39 ‚ 6.41 ‚ 5.13 ‚ 7.69 ‚ 5.77 ‚ 25.00 ‚ 25.64 ‚ 20.51 ‚ 30.77 ‚ 23.08 ‚ ‚ 16.39 ‚ 26.67 ‚ 24.00 ‚ 60.00 ‚ ƒƒƒƒƒƒƒƒƒˆƒƒƒƒƒƒƒƒˆƒƒƒƒƒƒƒƒˆƒƒƒƒƒƒƒƒˆƒƒƒƒƒƒƒƒˆ No ‚ 51 ‚ 22 ‚ 38 ‚ 6 ‚ 117

386
‚ 32.69 ‚ 14.10 ‚ 24.36 ‚ 3.85 ‚ 75.00 ‚ 43.59 ‚ 18.80 ‚ 32.48 ‚ 5.13 ‚ ‚ 83.61 ‚ 73.33 ‚ 76.00 ‚ 40.00 ‚ ƒƒƒƒƒƒƒƒƒˆƒƒƒƒƒƒƒƒˆƒƒƒƒƒƒƒƒˆƒƒƒƒƒƒƒƒˆƒƒƒƒƒƒƒƒˆ Total 61 30 50 15 156 39.10 19.23 32.05 9.62 100.00 Statistics for Table of new1 by Q03 Statistic DF Value Prob ƒƒƒƒƒƒƒƒƒƒƒƒƒƒƒƒƒƒƒƒƒƒƒƒƒƒƒƒƒƒƒƒƒƒƒƒƒƒƒƒƒƒƒƒƒƒƒƒƒƒƒƒƒƒ Chi-Square 3 12.2809 0.0065 Likelihood Ratio Chi-Square 3 10.9266 0.0121 Mantel-Haenszel Chi-Square 1 7.3058 0.0069 Phi Coefficient 0.2806 Contingency Coefficient 0.2701 Cramer's V 0.2806 Effective Sample Size = 156 Frequency Missing = 2 Table of new1 by Q04 Frequency‚ Percent ‚ Row Pct ‚ Col Pct ‚> 10 yea‚<=10 yea‚ Total ‚rs ‚rs ‚ ƒƒƒƒƒƒƒƒƒˆƒƒƒƒƒƒƒƒˆƒƒƒƒƒƒƒƒˆ Yes ‚ 14 ‚ 26 ‚ 40 ‚ 8.86 ‚ 16.46 ‚ 25.32 ‚ 35.00 ‚ 65.00 ‚ ‚ 36.84 ‚ 21.67 ‚ ƒƒƒƒƒƒƒƒƒˆƒƒƒƒƒƒƒƒˆƒƒƒƒƒƒƒƒˆ No ‚ 24 ‚ 94 ‚ 118 ‚ 15.19 ‚ 59.49 ‚ 74.68 ‚ 20.34 ‚ 79.66 ‚ ‚ 63.16 ‚ 78.33 ‚ ƒƒƒƒƒƒƒƒƒˆƒƒƒƒƒƒƒƒˆƒƒƒƒƒƒƒƒˆ Total 38 120 158 24.05 75.95 100.00 Statistics for Table of new1 by Q04 Statistic DF Value Prob ƒƒƒƒƒƒƒƒƒƒƒƒƒƒƒƒƒƒƒƒƒƒƒƒƒƒƒƒƒƒƒƒƒƒƒƒƒƒƒƒƒƒƒƒƒƒƒƒƒƒƒƒƒƒ Chi-Square 1 3.5153 0.0608 Likelihood Ratio Chi-Square 1 3.3342 0.0679 Continuity Adj. Chi-Square 1 2.7585 0.0967 Mantel-Haenszel Chi-Square 1 3.4931 0.0616 Phi Coefficient 0.1492 Contingency Coefficient 0.1475 Cramer's V 0.1492 Fisher's Exact Test ƒƒƒƒƒƒƒƒƒƒƒƒƒƒƒƒƒƒƒƒƒƒƒƒƒƒƒƒƒƒƒƒƒƒ Cell (1,1) Frequency (F) 14 Left-sided Pr <= F 0.9795 Right-sided Pr >= F 0.0509 Table Probability (P) 0.0304 Two-sided Pr <= P 0.0855 Sample Size = 158 Table of new1 by Q05_1 Frequency‚ Percent ‚ Row Pct ‚ Col Pct ‚Post gra‚Post mat‚None to ‚ Total ‚duate de‚riculati‚Matricul‚ ‚gree ‚on (Othe‚ation Ce‚ ‚ ‚r, Diplo‚rtificat‚ ‚ ‚ma, Degr‚e ‚ ‚ ‚ee) ‚ ‚ ƒƒƒƒƒƒƒƒƒˆƒƒƒƒƒƒƒƒˆƒƒƒƒƒƒƒƒˆƒƒƒƒƒƒƒƒˆ Yes ‚ 11 ‚ 21 ‚ 6 ‚ 38 ‚ 7.28 ‚ 13.91 ‚ 3.97 ‚ 25.17 ‚ 28.95 ‚ 55.26 ‚ 15.79 ‚ ‚ 52.38 ‚ 24.42 ‚ 13.64 ‚ ƒƒƒƒƒƒƒƒƒˆƒƒƒƒƒƒƒƒˆƒƒƒƒƒƒƒƒˆƒƒƒƒƒƒƒƒˆ No ‚ 10 ‚ 65 ‚ 38 ‚ 113 ‚ 6.62 ‚ 43.05 ‚ 25.17 ‚ 74.83 ‚ 8.85 ‚ 57.52 ‚ 33.63 ‚ ‚ 47.62 ‚ 75.58 ‚ 86.36 ‚ ƒƒƒƒƒƒƒƒƒˆƒƒƒƒƒƒƒƒˆƒƒƒƒƒƒƒƒˆƒƒƒƒƒƒƒƒˆ Total 21 86 44 151 13.91 56.95 29.14 100.00 Statistics for Table of new1 by Q05_1 Statistic DF Value Prob ƒƒƒƒƒƒƒƒƒƒƒƒƒƒƒƒƒƒƒƒƒƒƒƒƒƒƒƒƒƒƒƒƒƒƒƒƒƒƒƒƒƒƒƒƒƒƒƒƒƒƒƒƒƒ Chi-Square 2 11.3903 0.0034 Likelihood Ratio Chi-Square 2 10.6493 0.0049 Mantel-Haenszel Chi-Square 1 6.8918 0.0087 Phi Coefficient 0.2746 Contingency Coefficient 0.2648 Cramer's V 0.2746 Effective Sample Size = 151 Frequency Missing = 7 Table of new1 by Q05_2 Frequency‚ Percent ‚

387
Row Pct ‚ Col Pct ‚Post gra‚Post mat‚None to ‚ Total ‚duate de‚riculati‚Matricul‚ ‚gree ‚on (Othe‚ation Ce‚ ‚ ‚r, Diplo‚rtificat‚ ‚ ‚ma, Degr‚e ‚ ‚ ‚ee) ‚ ‚ ƒƒƒƒƒƒƒƒƒˆƒƒƒƒƒƒƒƒˆƒƒƒƒƒƒƒƒˆƒƒƒƒƒƒƒƒˆ Yes ‚ 6 ‚ 24 ‚ 7 ‚ 37 ‚ 4.08 ‚ 16.33 ‚ 4.76 ‚ 25.17 ‚ 16.22 ‚ 64.86 ‚ 18.92 ‚ ‚ 40.00 ‚ 27.91 ‚ 15.22 ‚ ƒƒƒƒƒƒƒƒƒˆƒƒƒƒƒƒƒƒˆƒƒƒƒƒƒƒƒˆƒƒƒƒƒƒƒƒˆ No ‚ 9 ‚ 62 ‚ 39 ‚ 110 ‚ 6.12 ‚ 42.18 ‚ 26.53 ‚ 74.83 ‚ 8.18 ‚ 56.36 ‚ 35.45 ‚ ‚ 60.00 ‚ 72.09 ‚ 84.78 ‚ ƒƒƒƒƒƒƒƒƒˆƒƒƒƒƒƒƒƒˆƒƒƒƒƒƒƒƒˆƒƒƒƒƒƒƒƒˆ Total 15 86 46 147 10.20 58.50 31.29 100.00 Statistics for Table of new1 by Q05_2 Statistic DF Value Prob ƒƒƒƒƒƒƒƒƒƒƒƒƒƒƒƒƒƒƒƒƒƒƒƒƒƒƒƒƒƒƒƒƒƒƒƒƒƒƒƒƒƒƒƒƒƒƒƒƒƒƒƒƒƒ Chi-Square 2 4.5128 0.1047 Likelihood Ratio Chi-Square 2 4.6123 0.0996 Mantel-Haenszel Chi-Square 1 4.1188 0.0424 Phi Coefficient 0.1752 Contingency Coefficient 0.1726 Cramer's V 0.1752 Effective Sample Size = 147 Frequency Missing = 11

388
Table of new1 by Q06_01 Frequency‚ Percent ‚ Row Pct ‚ Col Pct ‚Yes ‚No ‚ Total ƒƒƒƒƒƒƒƒƒˆƒƒƒƒƒƒƒƒˆƒƒƒƒƒƒƒƒˆ Yes ‚ 18 ‚ 22 ‚ 40 ‚ 11.39 ‚ 13.92 ‚ 25.32 ‚ 45.00 ‚ 55.00 ‚ ‚ 29.03 ‚ 22.92 ‚ ƒƒƒƒƒƒƒƒƒˆƒƒƒƒƒƒƒƒˆƒƒƒƒƒƒƒƒˆ No ‚ 44 ‚ 74 ‚ 118 ‚ 27.85 ‚ 46.84 ‚ 74.68 ‚ 37.29 ‚ 62.71 ‚ ‚ 70.97 ‚ 77.08 ‚ ƒƒƒƒƒƒƒƒƒˆƒƒƒƒƒƒƒƒˆƒƒƒƒƒƒƒƒˆ Total 62 96 158 39.24 60.76 100.00 Statistics for Table of new1 by Q06_01 Statistic DF Value Prob ƒƒƒƒƒƒƒƒƒƒƒƒƒƒƒƒƒƒƒƒƒƒƒƒƒƒƒƒƒƒƒƒƒƒƒƒƒƒƒƒƒƒƒƒƒƒƒƒƒƒƒƒƒƒ Chi-Square 1 0.7452 0.3880 Likelihood Ratio Chi-Square 1 0.7382 0.3903 Continuity Adj. Chi-Square 1 0.4568 0.4991 Mantel-Haenszel Chi-Square 1 0.7405 0.3895 Phi Coefficient 0.0687 Contingency Coefficient 0.0685 Cramer's V 0.0687 Fisher's Exact Test ƒƒƒƒƒƒƒƒƒƒƒƒƒƒƒƒƒƒƒƒƒƒƒƒƒƒƒƒƒƒƒƒƒƒ Cell (1,1) Frequency (F) 18 Left-sided Pr <= F 0.8532 Right-sided Pr >= F 0.2485 Table Probability (P) 0.1017 Two-sided Pr <= P 0.4546 Sample Size = 158 Table of new1 by Q06_02 Frequency‚ Percent ‚ Row Pct ‚ Col Pct ‚Yes ‚No ‚ Total ƒƒƒƒƒƒƒƒƒˆƒƒƒƒƒƒƒƒˆƒƒƒƒƒƒƒƒˆ Yes ‚ 21 ‚ 19 ‚ 40 ‚ 13.29 ‚ 12.03 ‚ 25.32 ‚ 52.50 ‚ 47.50 ‚ ‚ 37.50 ‚ 18.63 ‚ ƒƒƒƒƒƒƒƒƒˆƒƒƒƒƒƒƒƒˆƒƒƒƒƒƒƒƒˆ No ‚ 35 ‚ 83 ‚ 118 ‚ 22.15 ‚ 52.53 ‚ 74.68 ‚ 29.66 ‚ 70.34 ‚ ‚ 62.50 ‚ 81.37 ‚ ƒƒƒƒƒƒƒƒƒˆƒƒƒƒƒƒƒƒˆƒƒƒƒƒƒƒƒˆ Total 56 102 158 35.44 64.56 100.00 Statistics for Table of new1 by Q06_02 Statistic DF Value Prob ƒƒƒƒƒƒƒƒƒƒƒƒƒƒƒƒƒƒƒƒƒƒƒƒƒƒƒƒƒƒƒƒƒƒƒƒƒƒƒƒƒƒƒƒƒƒƒƒƒƒƒƒƒƒ Chi-Square 1 6.8103 0.0091 Likelihood Ratio Chi-Square 1 6.6148 0.0101 Continuity Adj. Chi-Square 1 5.8487 0.0156 Mantel-Haenszel Chi-Square 1 6.7672 0.0093 Phi Coefficient 0.2076 Contingency Coefficient 0.2033 Cramer's V 0.2076 Fisher's Exact Test ƒƒƒƒƒƒƒƒƒƒƒƒƒƒƒƒƒƒƒƒƒƒƒƒƒƒƒƒƒƒƒƒƒƒ Cell (1,1) Frequency (F) 21 Left-sided Pr <= F 0.9972 Right-sided Pr >= F 0.0084 Table Probability (P) 0.0056 Two-sided Pr <= P 0.0126 Sample Size = 158 Table of new1 by Q06_03 Frequency‚ Percent ‚ Row Pct ‚ Col Pct ‚Yes ‚No ‚ Total ƒƒƒƒƒƒƒƒƒˆƒƒƒƒƒƒƒƒˆƒƒƒƒƒƒƒƒˆ Yes ‚ 10 ‚ 30 ‚ 40 ‚ 6.33 ‚ 18.99 ‚ 25.32 ‚ 25.00 ‚ 75.00 ‚ ‚ 34.48 ‚ 23.26 ‚ ƒƒƒƒƒƒƒƒƒˆƒƒƒƒƒƒƒƒˆƒƒƒƒƒƒƒƒˆ No ‚ 19 ‚ 99 ‚ 118 ‚ 12.03 ‚ 62.66 ‚ 74.68 ‚ 16.10 ‚ 83.90 ‚ ‚ 65.52 ‚ 76.74 ‚ ƒƒƒƒƒƒƒƒƒˆƒƒƒƒƒƒƒƒˆƒƒƒƒƒƒƒƒˆ Total 29 129 158 18.35 81.65 100.00 Statistics for Table of new1 by Q06_03 Statistic DF Value Prob

389
ƒƒƒƒƒƒƒƒƒƒƒƒƒƒƒƒƒƒƒƒƒƒƒƒƒƒƒƒƒƒƒƒƒƒƒƒƒƒƒƒƒƒƒƒƒƒƒƒƒƒƒƒƒƒ Chi-Square 1 1.5784 0.2090 Likelihood Ratio Chi-Square 1 1.4993 0.2208 Continuity Adj. Chi-Square 1 1.0405 0.3077 Mantel-Haenszel Chi-Square 1 1.5684 0.2104 Phi Coefficient 0.1000 Contingency Coefficient 0.0995 Cramer's V 0.1000 Fisher's Exact Test ƒƒƒƒƒƒƒƒƒƒƒƒƒƒƒƒƒƒƒƒƒƒƒƒƒƒƒƒƒƒƒƒƒƒ Cell (1,1) Frequency (F) 10 Left-sided Pr <= F 0.9292 Right-sided Pr >= F 0.1538 Table Probability (P) 0.0830 Two-sided Pr <= P 0.2393 Sample Size = 158 Table of new1 by Q06_04 Frequency‚ Percent ‚ Row Pct ‚ Col Pct ‚Yes ‚No ‚ Total ƒƒƒƒƒƒƒƒƒˆƒƒƒƒƒƒƒƒˆƒƒƒƒƒƒƒƒˆ Yes ‚ 11 ‚ 29 ‚ 40 ‚ 6.96 ‚ 18.35 ‚ 25.32 ‚ 27.50 ‚ 72.50 ‚ ‚ 37.93 ‚ 22.48 ‚ ƒƒƒƒƒƒƒƒƒˆƒƒƒƒƒƒƒƒˆƒƒƒƒƒƒƒƒˆ No ‚ 18 ‚ 100 ‚ 118 ‚ 11.39 ‚ 63.29 ‚ 74.68 ‚ 15.25 ‚ 84.75 ‚ ‚ 62.07 ‚ 77.52 ‚ ƒƒƒƒƒƒƒƒƒˆƒƒƒƒƒƒƒƒˆƒƒƒƒƒƒƒƒˆ Total 29 129 158 18.35 81.65 100.00 Statistics for Table of new1 by Q06_04 Statistic DF Value Prob ƒƒƒƒƒƒƒƒƒƒƒƒƒƒƒƒƒƒƒƒƒƒƒƒƒƒƒƒƒƒƒƒƒƒƒƒƒƒƒƒƒƒƒƒƒƒƒƒƒƒƒƒƒƒ Chi-Square 1 2.9894 0.0838 Likelihood Ratio Chi-Square 1 2.7976 0.0944 Continuity Adj. Chi-Square 1 2.2281 0.1355 Mantel-Haenszel Chi-Square 1 2.9705 0.0848 Phi Coefficient 0.1376 Contingency Coefficient 0.1363 Cramer's V 0.1376 Fisher's Exact Test ƒƒƒƒƒƒƒƒƒƒƒƒƒƒƒƒƒƒƒƒƒƒƒƒƒƒƒƒƒƒƒƒƒƒ Cell (1,1) Frequency (F) 11 Left-sided Pr <= F 0.9722 Right-sided Pr >= F 0.0708 Table Probability (P) 0.0430 Two-sided Pr <= P 0.0997 Sample Size = 158 Table of new1 by Q06_05 Frequency‚ Percent ‚ Row Pct ‚ Col Pct ‚Yes ‚No ‚ Total ƒƒƒƒƒƒƒƒƒˆƒƒƒƒƒƒƒƒˆƒƒƒƒƒƒƒƒˆ Yes ‚ 18 ‚ 22 ‚ 40 ‚ 11.39 ‚ 13.92 ‚ 25.32 ‚ 45.00 ‚ 55.00 ‚ ‚ 34.62 ‚ 20.75 ‚ ƒƒƒƒƒƒƒƒƒˆƒƒƒƒƒƒƒƒˆƒƒƒƒƒƒƒƒˆ No ‚ 34 ‚ 84 ‚ 118 ‚ 21.52 ‚ 53.16 ‚ 74.68 ‚ 28.81 ‚ 71.19 ‚ ‚ 65.38 ‚ 79.25 ‚ ƒƒƒƒƒƒƒƒƒˆƒƒƒƒƒƒƒƒˆƒƒƒƒƒƒƒƒˆ Total 52 106 158 32.91 67.09 100.00 Statistics for Table of new1 by Q06_05 Statistic DF Value Prob ƒƒƒƒƒƒƒƒƒƒƒƒƒƒƒƒƒƒƒƒƒƒƒƒƒƒƒƒƒƒƒƒƒƒƒƒƒƒƒƒƒƒƒƒƒƒƒƒƒƒƒƒƒƒ Chi-Square 1 3.5448 0.0597 Likelihood Ratio Chi-Square 1 3.4387 0.0637 Continuity Adj. Chi-Square 1 2.8496 0.0914 Mantel-Haenszel Chi-Square 1 3.5224 0.0605 Phi Coefficient 0.1498 Contingency Coefficient 0.1481 Cramer's V 0.1498 Fisher's Exact Test ƒƒƒƒƒƒƒƒƒƒƒƒƒƒƒƒƒƒƒƒƒƒƒƒƒƒƒƒƒƒƒƒƒƒ Cell (1,1) Frequency (F) 18 Left-sided Pr <= F 0.9799 Right-sided Pr >= F 0.0472 Table Probability (P) 0.0271 Two-sided Pr <= P 0.0793 Sample Size = 158 Table of new1 by Q06_06 Frequency‚ Percent ‚ Row Pct ‚ Col Pct ‚Yes ‚No ‚ Total ƒƒƒƒƒƒƒƒƒˆƒƒƒƒƒƒƒƒˆƒƒƒƒƒƒƒƒˆ

390
Yes ‚ 12 ‚ 28 ‚ 40 ‚ 7.59 ‚ 17.72 ‚ 25.32 ‚ 30.00 ‚ 70.00 ‚ ‚ 48.00 ‚ 21.05 ‚ ƒƒƒƒƒƒƒƒƒˆƒƒƒƒƒƒƒƒˆƒƒƒƒƒƒƒƒˆ No ‚ 13 ‚ 105 ‚ 118 ‚ 8.23 ‚ 66.46 ‚ 74.68 ‚ 11.02 ‚ 88.98 ‚ ‚ 52.00 ‚ 78.95 ‚ ƒƒƒƒƒƒƒƒƒˆƒƒƒƒƒƒƒƒˆƒƒƒƒƒƒƒƒˆ Total 25 133 158 15.82 84.18 100.00 Statistics for Table of new1 by Q06_06 Statistic DF Value Prob ƒƒƒƒƒƒƒƒƒƒƒƒƒƒƒƒƒƒƒƒƒƒƒƒƒƒƒƒƒƒƒƒƒƒƒƒƒƒƒƒƒƒƒƒƒƒƒƒƒƒƒƒƒƒ Chi-Square 1 8.0824 0.0045 Likelihood Ratio Chi-Square 1 7.2730 0.0070 Continuity Adj. Chi-Square 1 6.7200 0.0095 Mantel-Haenszel Chi-Square 1 8.0312 0.0046 Phi Coefficient 0.2262 Contingency Coefficient 0.2206 Cramer's V 0.2262 Fisher's Exact Test ƒƒƒƒƒƒƒƒƒƒƒƒƒƒƒƒƒƒƒƒƒƒƒƒƒƒƒƒƒƒƒƒƒƒ Cell (1,1) Frequency (F) 12 Left-sided Pr <= F 0.9984 Right-sided Pr >= F 0.0064 Table Probability (P) 0.0048 Two-sided Pr <= P 0.0102 Sample Size = 158 Table of new1 by Q06_07 Frequency‚ Percent ‚ Row Pct ‚ Col Pct ‚Yes ‚No ‚ Total ƒƒƒƒƒƒƒƒƒˆƒƒƒƒƒƒƒƒˆƒƒƒƒƒƒƒƒˆ Yes ‚ 12 ‚ 28 ‚ 40 ‚ 7.59 ‚ 17.72 ‚ 25.32 ‚ 30.00 ‚ 70.00 ‚ ‚ 48.00 ‚ 21.05 ‚ ƒƒƒƒƒƒƒƒƒˆƒƒƒƒƒƒƒƒˆƒƒƒƒƒƒƒƒˆ No ‚ 13 ‚ 105 ‚ 118 ‚ 8.23 ‚ 66.46 ‚ 74.68 ‚ 11.02 ‚ 88.98 ‚ ‚ 52.00 ‚ 78.95 ‚ ƒƒƒƒƒƒƒƒƒˆƒƒƒƒƒƒƒƒˆƒƒƒƒƒƒƒƒˆ Total 25 133 158 15.82 84.18 100.00 Statistics for Table of new1 by Q06_07 Statistic DF Value Prob ƒƒƒƒƒƒƒƒƒƒƒƒƒƒƒƒƒƒƒƒƒƒƒƒƒƒƒƒƒƒƒƒƒƒƒƒƒƒƒƒƒƒƒƒƒƒƒƒƒƒƒƒƒƒ Chi-Square 1 8.0824 0.0045 Likelihood Ratio Chi-Square 1 7.2730 0.0070 Continuity Adj. Chi-Square 1 6.7200 0.0095 Mantel-Haenszel Chi-Square 1 8.0312 0.0046 Phi Coefficient 0.2262 Contingency Coefficient 0.2206 Cramer's V 0.2262 Fisher's Exact Test ƒƒƒƒƒƒƒƒƒƒƒƒƒƒƒƒƒƒƒƒƒƒƒƒƒƒƒƒƒƒƒƒƒƒ Cell (1,1) Frequency (F) 12 Left-sided Pr <= F 0.9984 Right-sided Pr >= F 0.0064 Table Probability (P) 0.0048 Two-sided Pr <= P 0.0102 Sample Size = 158 Table of new1 by q06_08n Frequency‚ Percent ‚ Row Pct ‚ Col Pct ‚Yes ‚No ‚ Total ƒƒƒƒƒƒƒƒƒˆƒƒƒƒƒƒƒƒˆƒƒƒƒƒƒƒƒˆ Yes ‚ 29 ‚ 11 ‚ 40 ‚ 18.35 ‚ 6.96 ‚ 25.32 ‚ 72.50 ‚ 27.50 ‚ ‚ 27.36 ‚ 21.15 ‚ ƒƒƒƒƒƒƒƒƒˆƒƒƒƒƒƒƒƒˆƒƒƒƒƒƒƒƒˆ No ‚ 77 ‚ 41 ‚ 118 ‚ 48.73 ‚ 25.95 ‚ 74.68 ‚ 65.25 ‚ 34.75 ‚ ‚ 72.64 ‚ 78.85 ‚ ƒƒƒƒƒƒƒƒƒˆƒƒƒƒƒƒƒƒˆƒƒƒƒƒƒƒƒˆ Total 106 52 158 67.09 32.91 100.00 Statistics for Table of new1 by q06_08n Statistic DF Value Prob ƒƒƒƒƒƒƒƒƒƒƒƒƒƒƒƒƒƒƒƒƒƒƒƒƒƒƒƒƒƒƒƒƒƒƒƒƒƒƒƒƒƒƒƒƒƒƒƒƒƒƒƒƒƒ Chi-Square 1 0.7103 0.3993 Likelihood Ratio Chi-Square 1 0.7255 0.3944 Continuity Adj. Chi-Square 1 0.4201 0.5169 Mantel-Haenszel Chi-Square 1 0.7058 0.4008 Phi Coefficient 0.0671

391
Contingency Coefficient 0.0669 Cramer's V 0.0671 Fisher's Exact Test ƒƒƒƒƒƒƒƒƒƒƒƒƒƒƒƒƒƒƒƒƒƒƒƒƒƒƒƒƒƒƒƒƒƒ Cell (1,1) Frequency (F) 29 Left-sided Pr <= F 0.8505 Right-sided Pr >= F 0.2608 Table Probability (P) 0.1112 Two-sided Pr <= P 0.4419 Sample Size = 158 Table of new1 by Q06_09 Frequency‚ Percent ‚ Row Pct ‚ Col Pct ‚Yes ‚No ‚ Total ƒƒƒƒƒƒƒƒƒˆƒƒƒƒƒƒƒƒˆƒƒƒƒƒƒƒƒˆ Yes ‚ 0 ‚ 40 ‚ 40 ‚ 0.00 ‚ 25.32 ‚ 25.32 ‚ 0.00 ‚ 100.00 ‚ ‚ 0.00 ‚ 25.81 ‚ ƒƒƒƒƒƒƒƒƒˆƒƒƒƒƒƒƒƒˆƒƒƒƒƒƒƒƒˆ No ‚ 3 ‚ 115 ‚ 118 ‚ 1.90 ‚ 72.78 ‚ 74.68 ‚ 2.54 ‚ 97.46 ‚ ‚ 100.00 ‚ 74.19 ‚ ƒƒƒƒƒƒƒƒƒˆƒƒƒƒƒƒƒƒˆƒƒƒƒƒƒƒƒˆ Total 3 155 158 1.90 98.10 100.00 Statistics for Table of new1 by Q06_09 Statistic DF Value Prob ƒƒƒƒƒƒƒƒƒƒƒƒƒƒƒƒƒƒƒƒƒƒƒƒƒƒƒƒƒƒƒƒƒƒƒƒƒƒƒƒƒƒƒƒƒƒƒƒƒƒƒƒƒƒ Chi-Square 1 1.0366 0.3086 Likelihood Ratio Chi-Square 1 1.7711 0.1833 Continuity Adj. Chi-Square 1 0.1210 0.7279 Mantel-Haenszel Chi-Square 1 1.0301 0.3101 Phi Coefficient -0.0810 Contingency Coefficient 0.0807 Cramer's V -0.0810 WARNING: 50% of the cells have expected counts less than 5. Chi-Square may not be a valid test. Fisher's Exact Test ƒƒƒƒƒƒƒƒƒƒƒƒƒƒƒƒƒƒƒƒƒƒƒƒƒƒƒƒƒƒƒƒƒƒ Cell (1,1) Frequency (F) 0 Left-sided Pr <= F 0.4139 Right-sided Pr >= F 1.0000 Table Probability (P) 0.4139 Two-sided Pr <= P 0.5719 Sample Size = 158 Table of new1 by q07_1_1n Frequency‚ Percent ‚ Row Pct ‚ Col Pct ‚Yes ‚No ‚ Total ƒƒƒƒƒƒƒƒƒˆƒƒƒƒƒƒƒƒˆƒƒƒƒƒƒƒƒˆ Yes ‚ 21 ‚ 19 ‚ 40 ‚ 13.29 ‚ 12.03 ‚ 25.32 ‚ 52.50 ‚ 47.50 ‚ ‚ 21.65 ‚ 31.15 ‚ ƒƒƒƒƒƒƒƒƒˆƒƒƒƒƒƒƒƒˆƒƒƒƒƒƒƒƒˆ No ‚ 76 ‚ 42 ‚ 118 ‚ 48.10 ‚ 26.58 ‚ 74.68 ‚ 64.41 ‚ 35.59 ‚ ‚ 78.35 ‚ 68.85 ‚ ƒƒƒƒƒƒƒƒƒˆƒƒƒƒƒƒƒƒˆƒƒƒƒƒƒƒƒˆ Total 97 61 158 61.39 38.61 100.00 Statistics for Table of new1 by q07_1_1n Statistic DF Value Prob ƒƒƒƒƒƒƒƒƒƒƒƒƒƒƒƒƒƒƒƒƒƒƒƒƒƒƒƒƒƒƒƒƒƒƒƒƒƒƒƒƒƒƒƒƒƒƒƒƒƒƒƒƒƒ Chi-Square 1 1.7868 0.1813 Likelihood Ratio Chi-Square 1 1.7619 0.1844 Continuity Adj. Chi-Square 1 1.3198 0.2506 Mantel-Haenszel Chi-Square 1 1.7755 0.1827 Phi Coefficient -0.1063 Contingency Coefficient 0.1057 Cramer's V -0.1063 Fisher's Exact Test ƒƒƒƒƒƒƒƒƒƒƒƒƒƒƒƒƒƒƒƒƒƒƒƒƒƒƒƒƒƒƒƒƒƒ Cell (1,1) Frequency (F) 21 Left-sided Pr <= F 0.1257 Right-sided Pr >= F 0.9355 Table Probability (P) 0.0612 Two-sided Pr <= P 0.1934 Sample Size = 158 Table of new1 by Q07_2_01 Frequency‚ Percent ‚ Row Pct ‚ Col Pct ‚Yes ‚No ‚ Total ƒƒƒƒƒƒƒƒƒˆƒƒƒƒƒƒƒƒˆƒƒƒƒƒƒƒƒˆ Yes ‚ 10 ‚ 30 ‚ 40 ‚ 6.33 ‚ 18.99 ‚ 25.32 ‚ 25.00 ‚ 75.00 ‚ ‚ 28.57 ‚ 24.39 ‚ ƒƒƒƒƒƒƒƒƒˆƒƒƒƒƒƒƒƒˆƒƒƒƒƒƒƒƒˆ

392
No ‚ 25 ‚ 93 ‚ 118 ‚ 15.82 ‚ 58.86 ‚ 74.68 ‚ 21.19 ‚ 78.81 ‚ ‚ 71.43 ‚ 75.61 ‚ ƒƒƒƒƒƒƒƒƒˆƒƒƒƒƒƒƒƒˆƒƒƒƒƒƒƒƒˆ Total 35 123 158 22.15 77.85 100.00 Statistics for Table of new1 by Q07_2_01 Statistic DF Value Prob ƒƒƒƒƒƒƒƒƒƒƒƒƒƒƒƒƒƒƒƒƒƒƒƒƒƒƒƒƒƒƒƒƒƒƒƒƒƒƒƒƒƒƒƒƒƒƒƒƒƒƒƒƒƒ Chi-Square 1 0.2519 0.6157 Likelihood Ratio Chi-Square 1 0.2472 0.6190 Continuity Adj. Chi-Square 1 0.0793 0.7782 Mantel-Haenszel Chi-Square 1 0.2503 0.6168 Phi Coefficient 0.0399 Contingency Coefficient 0.0399 Cramer's V 0.0399 Fisher's Exact Test ƒƒƒƒƒƒƒƒƒƒƒƒƒƒƒƒƒƒƒƒƒƒƒƒƒƒƒƒƒƒƒƒƒƒ Cell (1,1) Frequency (F) 10 Left-sided Pr <= F 0.7678 Right-sided Pr >= F 0.3821 Table Probability (P) 0.1499 Two-sided Pr <= P 0.6613 Sample Size = 158 Table of new1 by Q07_2_02 Frequency‚ Percent ‚ Row Pct ‚ Col Pct ‚Yes ‚No ‚ Total ƒƒƒƒƒƒƒƒƒˆƒƒƒƒƒƒƒƒˆƒƒƒƒƒƒƒƒˆ Yes ‚ 7 ‚ 33 ‚ 40 ‚ 4.43 ‚ 20.89 ‚ 25.32 ‚ 17.50 ‚ 82.50 ‚ ‚ 15.91 ‚ 28.95 ‚ ƒƒƒƒƒƒƒƒƒˆƒƒƒƒƒƒƒƒˆƒƒƒƒƒƒƒƒˆ No ‚ 37 ‚ 81 ‚ 118 ‚ 23.42 ‚ 51.27 ‚ 74.68 ‚ 31.36 ‚ 68.64 ‚ ‚ 84.09 ‚ 71.05 ‚ ƒƒƒƒƒƒƒƒƒˆƒƒƒƒƒƒƒƒˆƒƒƒƒƒƒƒƒˆ Total 44 114 158 27.85 72.15 100.00 Statistics for Table of new1 by Q07_2_02 Statistic DF Value Prob ƒƒƒƒƒƒƒƒƒƒƒƒƒƒƒƒƒƒƒƒƒƒƒƒƒƒƒƒƒƒƒƒƒƒƒƒƒƒƒƒƒƒƒƒƒƒƒƒƒƒƒƒƒƒ Chi-Square 1 2.8544 0.0911 Likelihood Ratio Chi-Square 1 3.0471 0.0809 Continuity Adj. Chi-Square 1 2.2064 0.1374 Mantel-Haenszel Chi-Square 1 2.8363 0.0922 Phi Coefficient -0.1344 Contingency Coefficient 0.1332 Cramer's V -0.1344 Fisher's Exact Test ƒƒƒƒƒƒƒƒƒƒƒƒƒƒƒƒƒƒƒƒƒƒƒƒƒƒƒƒƒƒƒƒƒƒ Cell (1,1) Frequency (F) 7 Left-sided Pr <= F 0.0657 Right-sided Pr >= F 0.9742 Table Probability (P) 0.0399 Two-sided Pr <= P 0.1053 Sample Size = 158

393
Table of new1 by Q07_2_03 Frequency‚ Percent ‚ Row Pct ‚ Col Pct ‚Yes ‚No ‚ Total ƒƒƒƒƒƒƒƒƒˆƒƒƒƒƒƒƒƒˆƒƒƒƒƒƒƒƒˆ Yes ‚ 12 ‚ 28 ‚ 40 ‚ 7.59 ‚ 17.72 ‚ 25.32 ‚ 30.00 ‚ 70.00 ‚ ‚ 19.67 ‚ 28.87 ‚ ƒƒƒƒƒƒƒƒƒˆƒƒƒƒƒƒƒƒˆƒƒƒƒƒƒƒƒˆ No ‚ 49 ‚ 69 ‚ 118 ‚ 31.01 ‚ 43.67 ‚ 74.68 ‚ 41.53 ‚ 58.47 ‚ ‚ 80.33 ‚ 71.13 ‚ ƒƒƒƒƒƒƒƒƒˆƒƒƒƒƒƒƒƒˆƒƒƒƒƒƒƒƒˆ Total 61 97 158 38.61 61.39 100.00 Statistics for Table of new1 by Q07_2_03 Statistic DF Value Prob ƒƒƒƒƒƒƒƒƒƒƒƒƒƒƒƒƒƒƒƒƒƒƒƒƒƒƒƒƒƒƒƒƒƒƒƒƒƒƒƒƒƒƒƒƒƒƒƒƒƒƒƒƒƒ Chi-Square 1 1.6742 0.1957 Likelihood Ratio Chi-Square 1 1.7139 0.1905 Continuity Adj. Chi-Square 1 1.2233 0.2687 Mantel-Haenszel Chi-Square 1 1.6636 0.1971 Phi Coefficient -0.1029 Contingency Coefficient 0.1024 Cramer's V -0.1029 Fisher's Exact Test ƒƒƒƒƒƒƒƒƒƒƒƒƒƒƒƒƒƒƒƒƒƒƒƒƒƒƒƒƒƒƒƒƒƒ Cell (1,1) Frequency (F) 12 Left-sided Pr <= F 0.1340 Right-sided Pr >= F 0.9323 Table Probability (P) 0.0662 Two-sided Pr <= P 0.2596 Sample Size = 158 Table of new1 by Q07_2_04 Frequency‚ Percent ‚ Row Pct ‚ Col Pct ‚Yes ‚No ‚ Total ƒƒƒƒƒƒƒƒƒˆƒƒƒƒƒƒƒƒˆƒƒƒƒƒƒƒƒˆ Yes ‚ 8 ‚ 32 ‚ 40 ‚ 5.06 ‚ 20.25 ‚ 25.32 ‚ 20.00 ‚ 80.00 ‚ ‚ 26.67 ‚ 25.00 ‚ ƒƒƒƒƒƒƒƒƒˆƒƒƒƒƒƒƒƒˆƒƒƒƒƒƒƒƒˆ No ‚ 22 ‚ 96 ‚ 118 ‚ 13.92 ‚ 60.76 ‚ 74.68 ‚ 18.64 ‚ 81.36 ‚ ‚ 73.33 ‚ 75.00 ‚ ƒƒƒƒƒƒƒƒƒˆƒƒƒƒƒƒƒƒˆƒƒƒƒƒƒƒƒˆ Total 30 128 158 18.99 81.01 100.00 Statistics for Table of new1 by Q07_2_04 Statistic DF Value Prob ƒƒƒƒƒƒƒƒƒƒƒƒƒƒƒƒƒƒƒƒƒƒƒƒƒƒƒƒƒƒƒƒƒƒƒƒƒƒƒƒƒƒƒƒƒƒƒƒƒƒƒƒƒƒ Chi-Square 1 0.0357 0.8501 Likelihood Ratio Chi-Square 1 0.0354 0.8508 Continuity Adj. Chi-Square 1 0.0000 1.0000 Mantel-Haenszel Chi-Square 1 0.0355 0.8506 Phi Coefficient 0.0150 Contingency Coefficient 0.0150 Cramer's V 0.0150 Fisher's Exact Test ƒƒƒƒƒƒƒƒƒƒƒƒƒƒƒƒƒƒƒƒƒƒƒƒƒƒƒƒƒƒƒƒƒƒ Cell (1,1) Frequency (F) 8 Left-sided Pr <= F 0.6705 Right-sided Pr >= F 0.5079 Table Probability (P) 0.1784 Two-sided Pr <= P 0.8195 Sample Size = 158 Table of new1 by Q07_2_05 Frequency‚ Percent ‚ Row Pct ‚ Col Pct ‚Yes ‚No ‚ Total ƒƒƒƒƒƒƒƒƒˆƒƒƒƒƒƒƒƒˆƒƒƒƒƒƒƒƒˆ Yes ‚ 7 ‚ 33 ‚ 40 ‚ 4.43 ‚ 20.89 ‚ 25.32 ‚ 17.50 ‚ 82.50 ‚ ‚ 21.88 ‚ 26.19 ‚ ƒƒƒƒƒƒƒƒƒˆƒƒƒƒƒƒƒƒˆƒƒƒƒƒƒƒƒˆ No ‚ 25 ‚ 93 ‚ 118 ‚ 15.82 ‚ 58.86 ‚ 74.68 ‚ 21.19 ‚ 78.81 ‚ ‚ 78.13 ‚ 73.81 ‚ ƒƒƒƒƒƒƒƒƒˆƒƒƒƒƒƒƒƒˆƒƒƒƒƒƒƒƒˆ Total 32 126 158 20.25 79.75 100.00 Statistics for Table of new1 by Q07_2_05 Statistic DF Value Prob ƒƒƒƒƒƒƒƒƒƒƒƒƒƒƒƒƒƒƒƒƒƒƒƒƒƒƒƒƒƒƒƒƒƒƒƒƒƒƒƒƒƒƒƒƒƒƒƒƒƒƒƒƒƒ

394
Chi-Square 1 0.2514 0.6161 Likelihood Ratio Chi-Square 1 0.2575 0.6118 Continuity Adj. Chi-Square 1 0.0749 0.7843 Mantel-Haenszel Chi-Square 1 0.2498 0.6172 Phi Coefficient -0.0399 Contingency Coefficient 0.0399 Cramer's V -0.0399 Fisher's Exact Test ƒƒƒƒƒƒƒƒƒƒƒƒƒƒƒƒƒƒƒƒƒƒƒƒƒƒƒƒƒƒƒƒƒƒ Cell (1,1) Frequency (F) 7 Left-sided Pr <= F 0.4006 Right-sided Pr >= F 0.7633 Table Probability (P) 0.1639 Two-sided Pr <= P 0.8201 Sample Size = 158 Table of new1 by Q07_2_06 Frequency‚ Percent ‚ Row Pct ‚ Col Pct ‚Yes ‚No ‚ Total ƒƒƒƒƒƒƒƒƒˆƒƒƒƒƒƒƒƒˆƒƒƒƒƒƒƒƒˆ Yes ‚ 8 ‚ 32 ‚ 40 ‚ 5.06 ‚ 20.25 ‚ 25.32 ‚ 20.00 ‚ 80.00 ‚ ‚ 22.22 ‚ 26.23 ‚ ƒƒƒƒƒƒƒƒƒˆƒƒƒƒƒƒƒƒˆƒƒƒƒƒƒƒƒˆ No ‚ 28 ‚ 90 ‚ 118 ‚ 17.72 ‚ 56.96 ‚ 74.68 ‚ 23.73 ‚ 76.27 ‚ ‚ 77.78 ‚ 73.77 ‚ ƒƒƒƒƒƒƒƒƒˆƒƒƒƒƒƒƒƒˆƒƒƒƒƒƒƒƒˆ Total 36 122 158 22.78 77.22 100.00 Statistics for Table of new1 by Q07_2_06 Statistic DF Value Prob ƒƒƒƒƒƒƒƒƒƒƒƒƒƒƒƒƒƒƒƒƒƒƒƒƒƒƒƒƒƒƒƒƒƒƒƒƒƒƒƒƒƒƒƒƒƒƒƒƒƒƒƒƒƒ Chi-Square 1 0.2361 0.6270 Likelihood Ratio Chi-Square 1 0.2410 0.6235 Continuity Adj. Chi-Square 1 0.0717 0.7889 Mantel-Haenszel Chi-Square 1 0.2346 0.6281 Phi Coefficient -0.0387 Contingency Coefficient 0.0386 Cramer's V -0.0387 Fisher's Exact Test ƒƒƒƒƒƒƒƒƒƒƒƒƒƒƒƒƒƒƒƒƒƒƒƒƒƒƒƒƒƒƒƒƒƒ Cell (1,1) Frequency (F) 8 Left-sided Pr <= F 0.4018 Right-sided Pr >= F 0.7558 Table Probability (P) 0.1576 Two-sided Pr <= P 0.8275 Sample Size = 158

395
Table of new1 by Q07_2_07 Frequency‚ Percent ‚ Row Pct ‚ Col Pct ‚Yes ‚No ‚ Total ƒƒƒƒƒƒƒƒƒˆƒƒƒƒƒƒƒƒˆƒƒƒƒƒƒƒƒˆ Yes ‚ 3 ‚ 37 ‚ 40 ‚ 1.90 ‚ 23.42 ‚ 25.32 ‚ 7.50 ‚ 92.50 ‚ ‚ 21.43 ‚ 25.69 ‚ ƒƒƒƒƒƒƒƒƒˆƒƒƒƒƒƒƒƒˆƒƒƒƒƒƒƒƒˆ No ‚ 11 ‚ 107 ‚ 118 ‚ 6.96 ‚ 67.72 ‚ 74.68 ‚ 9.32 ‚ 90.68 ‚ ‚ 78.57 ‚ 74.31 ‚ ƒƒƒƒƒƒƒƒƒˆƒƒƒƒƒƒƒƒˆƒƒƒƒƒƒƒƒˆ Total 14 144 158 8.86 91.14 100.00 Statistics for Table of new1 by Q07_2_07 Statistic DF Value Prob ƒƒƒƒƒƒƒƒƒƒƒƒƒƒƒƒƒƒƒƒƒƒƒƒƒƒƒƒƒƒƒƒƒƒƒƒƒƒƒƒƒƒƒƒƒƒƒƒƒƒƒƒƒƒ Chi-Square 1 0.1228 0.7260 Likelihood Ratio Chi-Square 1 0.1269 0.7216 Continuity Adj. Chi-Square 1 0.0008 0.9772 Mantel-Haenszel Chi-Square 1 0.1220 0.7268 Phi Coefficient -0.0279 Contingency Coefficient 0.0279 Cramer's V -0.0279 WARNING: 25% of the cells have expected counts less than 5. Chi-Square may not be a valid test. Fisher's Exact Test ƒƒƒƒƒƒƒƒƒƒƒƒƒƒƒƒƒƒƒƒƒƒƒƒƒƒƒƒƒƒƒƒƒƒ Cell (1,1) Frequency (F) 3 Left-sided Pr <= F 0.5068 Right-sided Pr >= F 0.7400 Table Probability (P) 0.2468 Two-sided Pr <= P 1.0000 Sample Size = 158 Table of new1 by Q07_2_08 Frequency‚ Percent ‚ Row Pct ‚ Col Pct ‚Yes ‚No ‚ Total ƒƒƒƒƒƒƒƒƒˆƒƒƒƒƒƒƒƒˆƒƒƒƒƒƒƒƒˆ Yes ‚ 3 ‚ 37 ‚ 40 ‚ 1.90 ‚ 23.42 ‚ 25.32 ‚ 7.50 ‚ 92.50 ‚ ‚ 42.86 ‚ 24.50 ‚ ƒƒƒƒƒƒƒƒƒˆƒƒƒƒƒƒƒƒˆƒƒƒƒƒƒƒƒˆ No ‚ 4 ‚ 114 ‚ 118 ‚ 2.53 ‚ 72.15 ‚ 74.68 ‚ 3.39 ‚ 96.61 ‚ ‚ 57.14 ‚ 75.50 ‚ ƒƒƒƒƒƒƒƒƒˆƒƒƒƒƒƒƒƒˆƒƒƒƒƒƒƒƒˆ Total 7 151 158 4.43 95.57 100.00 Statistics for Table of new1 by Q07_2_08 Statistic DF Value Prob ƒƒƒƒƒƒƒƒƒƒƒƒƒƒƒƒƒƒƒƒƒƒƒƒƒƒƒƒƒƒƒƒƒƒƒƒƒƒƒƒƒƒƒƒƒƒƒƒƒƒƒƒƒƒ Chi-Square 1 1.1919 0.2749 Likelihood Ratio Chi-Square 1 1.0701 0.3009 Continuity Adj. Chi-Square 1 0.4188 0.5175 Mantel-Haenszel Chi-Square 1 1.1844 0.2765 Phi Coefficient 0.0869 Contingency Coefficient 0.0865 Cramer's V 0.0869 WARNING: 25% of the cells have expected counts less than 5. Chi-Square may not be a valid test. Fisher's Exact Test ƒƒƒƒƒƒƒƒƒƒƒƒƒƒƒƒƒƒƒƒƒƒƒƒƒƒƒƒƒƒƒƒƒƒ Cell (1,1) Frequency (F) 3 Left-sided Pr <= F 0.9310 Right-sided Pr >= F 0.2469 Table Probability (P) 0.1779 Two-sided Pr <= P 0.3706 Sample Size = 158 Table of new1 by Q08 Frequency‚ Percent ‚ Row Pct ‚ Col Pct ‚Yes ‚No ‚ Total ƒƒƒƒƒƒƒƒƒˆƒƒƒƒƒƒƒƒˆƒƒƒƒƒƒƒƒˆ Yes ‚ 39 ‚ 1 ‚ 40 ‚ 24.68 ‚ 0.63 ‚ 25.32 ‚ 97.50 ‚ 2.50 ‚ ‚ 28.89 ‚ 4.35 ‚ ƒƒƒƒƒƒƒƒƒˆƒƒƒƒƒƒƒƒˆƒƒƒƒƒƒƒƒˆ No ‚ 96 ‚ 22 ‚ 118 ‚ 60.76 ‚ 13.92 ‚ 74.68 ‚ 81.36 ‚ 18.64 ‚ ‚ 71.11 ‚ 95.65 ‚ ƒƒƒƒƒƒƒƒƒˆƒƒƒƒƒƒƒƒˆƒƒƒƒƒƒƒƒˆ Total 135 23 158 85.44 14.56 100.00 Statistics for Table of new1 by Q08 Statistic DF Value Prob ƒƒƒƒƒƒƒƒƒƒƒƒƒƒƒƒƒƒƒƒƒƒƒƒƒƒƒƒƒƒƒƒƒƒƒƒƒƒƒƒƒƒƒƒƒƒƒƒƒƒƒƒƒƒ

396
Chi-Square 1 6.2598 0.0124 Likelihood Ratio Chi-Square 1 8.2497 0.0041 Continuity Adj. Chi-Square 1 5.0292 0.0249 Mantel-Haenszel Chi-Square 1 6.2202 0.0126 Phi Coefficient 0.1990 Contingency Coefficient 0.1952 Cramer's V 0.1990 Fisher's Exact Test ƒƒƒƒƒƒƒƒƒƒƒƒƒƒƒƒƒƒƒƒƒƒƒƒƒƒƒƒƒƒƒƒƒƒ Cell (1,1) Frequency (F) 39 Left-sided Pr <= F 0.9993 Right-sided Pr >= F 0.0070 Table Probability (P) 0.0063 Two-sided Pr <= P 0.0095 Sample Size = 158 Table of new1 by Q10 Frequency‚ Percent ‚ Row Pct ‚ Col Pct ‚Yes ‚No ‚ Total ƒƒƒƒƒƒƒƒƒˆƒƒƒƒƒƒƒƒˆƒƒƒƒƒƒƒƒˆ Yes ‚ 39 ‚ 1 ‚ 40 ‚ 24.68 ‚ 0.63 ‚ 25.32 ‚ 97.50 ‚ 2.50 ‚ ‚ 28.26 ‚ 5.00 ‚ ƒƒƒƒƒƒƒƒƒˆƒƒƒƒƒƒƒƒˆƒƒƒƒƒƒƒƒˆ No ‚ 99 ‚ 19 ‚ 118 ‚ 62.66 ‚ 12.03 ‚ 74.68 ‚ 83.90 ‚ 16.10 ‚ ‚ 71.74 ‚ 95.00 ‚ ƒƒƒƒƒƒƒƒƒˆƒƒƒƒƒƒƒƒˆƒƒƒƒƒƒƒƒˆ Total 138 20 158 87.34 12.66 100.00 Statistics for Table of new1 by Q10 Statistic DF Value Prob ƒƒƒƒƒƒƒƒƒƒƒƒƒƒƒƒƒƒƒƒƒƒƒƒƒƒƒƒƒƒƒƒƒƒƒƒƒƒƒƒƒƒƒƒƒƒƒƒƒƒƒƒƒƒ Chi-Square 1 4.9989 0.0254 Likelihood Ratio Chi-Square 1 6.5170 0.0107 Continuity Adj. Chi-Square 1 3.8443 0.0499 Mantel-Haenszel Chi-Square 1 4.9673 0.0258 Phi Coefficient 0.1779 Contingency Coefficient 0.1751 Cramer's V 0.1779 Fisher's Exact Test ƒƒƒƒƒƒƒƒƒƒƒƒƒƒƒƒƒƒƒƒƒƒƒƒƒƒƒƒƒƒƒƒƒƒ Cell (1,1) Frequency (F) 39 Left-sided Pr <= F 0.9981 Right-sided Pr >= F 0.0168 Table Probability (P) 0.0150 Two-sided Pr <= P 0.0267 Sample Size = 158

397
Table of new1 by Q14 Frequency‚ Percent ‚ Row Pct ‚ Col Pct ‚Yes ‚No ‚ Total ƒƒƒƒƒƒƒƒƒˆƒƒƒƒƒƒƒƒˆƒƒƒƒƒƒƒƒˆ Yes ‚ 24 ‚ 16 ‚ 40 ‚ 15.19 ‚ 10.13 ‚ 25.32 ‚ 60.00 ‚ 40.00 ‚ ‚ 24.74 ‚ 26.23 ‚ ƒƒƒƒƒƒƒƒƒˆƒƒƒƒƒƒƒƒˆƒƒƒƒƒƒƒƒˆ No ‚ 73 ‚ 45 ‚ 118 ‚ 46.20 ‚ 28.48 ‚ 74.68 ‚ 61.86 ‚ 38.14 ‚ ‚ 75.26 ‚ 73.77 ‚ ƒƒƒƒƒƒƒƒƒˆƒƒƒƒƒƒƒƒˆƒƒƒƒƒƒƒƒˆ Total 97 61 158 61.39 38.61 100.00 Statistics for Table of new1 by Q14 Statistic DF Value Prob ƒƒƒƒƒƒƒƒƒƒƒƒƒƒƒƒƒƒƒƒƒƒƒƒƒƒƒƒƒƒƒƒƒƒƒƒƒƒƒƒƒƒƒƒƒƒƒƒƒƒƒƒƒƒ Chi-Square 1 0.0438 0.8342 Likelihood Ratio Chi-Square 1 0.0437 0.8344 Continuity Adj. Chi-Square 1 0.0005 0.9829 Mantel-Haenszel Chi-Square 1 0.0435 0.8347 Phi Coefficient -0.0167 Contingency Coefficient 0.0166 Cramer's V -0.0167 Fisher's Exact Test ƒƒƒƒƒƒƒƒƒƒƒƒƒƒƒƒƒƒƒƒƒƒƒƒƒƒƒƒƒƒƒƒƒƒ Cell (1,1) Frequency (F) 24 Left-sided Pr <= F 0.4886 Right-sided Pr >= F 0.6564 Table Probability (P) 0.1451 Two-sided Pr <= P 0.8527 Sample Size = 158 Table of new1 by Q15_01 Frequency‚ Percent ‚ Row Pct ‚ Col Pct ‚Yes ‚No ‚ Total ƒƒƒƒƒƒƒƒƒˆƒƒƒƒƒƒƒƒˆƒƒƒƒƒƒƒƒˆ Yes ‚ 35 ‚ 5 ‚ 40 ‚ 22.15 ‚ 3.16 ‚ 25.32 ‚ 87.50 ‚ 12.50 ‚ ‚ 26.92 ‚ 17.86 ‚ ƒƒƒƒƒƒƒƒƒˆƒƒƒƒƒƒƒƒˆƒƒƒƒƒƒƒƒˆ No ‚ 95 ‚ 23 ‚ 118 ‚ 60.13 ‚ 14.56 ‚ 74.68 ‚ 80.51 ‚ 19.49 ‚ ‚ 73.08 ‚ 82.14 ‚ ƒƒƒƒƒƒƒƒƒˆƒƒƒƒƒƒƒƒˆƒƒƒƒƒƒƒƒˆ Total 130 28 158 82.28 17.72 100.00 Statistics for Table of new1 by Q15_01 Statistic DF Value Prob ƒƒƒƒƒƒƒƒƒƒƒƒƒƒƒƒƒƒƒƒƒƒƒƒƒƒƒƒƒƒƒƒƒƒƒƒƒƒƒƒƒƒƒƒƒƒƒƒƒƒƒƒƒƒ Chi-Square 1 1.0015 0.3170 Likelihood Ratio Chi-Square 1 1.0638 0.3024 Continuity Adj. Chi-Square 1 0.5794 0.4466 Mantel-Haenszel Chi-Square 1 0.9951 0.3185 Phi Coefficient 0.0796 Contingency Coefficient 0.0794 Cramer's V 0.0796 Fisher's Exact Test ƒƒƒƒƒƒƒƒƒƒƒƒƒƒƒƒƒƒƒƒƒƒƒƒƒƒƒƒƒƒƒƒƒƒ Cell (1,1) Frequency (F) 35 Left-sided Pr <= F 0.8958 Right-sided Pr >= F 0.2270 Table Probability (P) 0.1228 Two-sided Pr <= P 0.4722 Sample Size = 158

398
Table of new1 by Q15_02 Frequency‚ Percent ‚ Row Pct ‚ Col Pct ‚Yes ‚No ‚ Total ƒƒƒƒƒƒƒƒƒˆƒƒƒƒƒƒƒƒˆƒƒƒƒƒƒƒƒˆ Yes ‚ 31 ‚ 9 ‚ 40 ‚ 19.62 ‚ 5.70 ‚ 25.32 ‚ 77.50 ‚ 22.50 ‚ ‚ 25.20 ‚ 25.71 ‚ ƒƒƒƒƒƒƒƒƒˆƒƒƒƒƒƒƒƒˆƒƒƒƒƒƒƒƒˆ No ‚ 92 ‚ 26 ‚ 118 ‚ 58.23 ‚ 16.46 ‚ 74.68 ‚ 77.97 ‚ 22.03 ‚ ‚ 74.80 ‚ 74.29 ‚ ƒƒƒƒƒƒƒƒƒˆƒƒƒƒƒƒƒƒˆƒƒƒƒƒƒƒƒˆ Total 123 35 158 77.85 22.15 100.00 Statistics for Table of new1 by Q15_02 Statistic DF Value Prob ƒƒƒƒƒƒƒƒƒƒƒƒƒƒƒƒƒƒƒƒƒƒƒƒƒƒƒƒƒƒƒƒƒƒƒƒƒƒƒƒƒƒƒƒƒƒƒƒƒƒƒƒƒƒ Chi-Square 1 0.0038 0.9511 Likelihood Ratio Chi-Square 1 0.0038 0.9511 Continuity Adj. Chi-Square 1 0.0000 1.0000 Mantel-Haenszel Chi-Square 1 0.0037 0.9512 Phi Coefficient -0.0049 Contingency Coefficient 0.0049 Cramer's V -0.0049 Fisher's Exact Test ƒƒƒƒƒƒƒƒƒƒƒƒƒƒƒƒƒƒƒƒƒƒƒƒƒƒƒƒƒƒƒƒƒƒ Cell (1,1) Frequency (F) 31 Left-sided Pr <= F 0.5550 Right-sided Pr >= F 0.6179 Table Probability (P) 0.1729 Two-sided Pr <= P 1.0000 Sample Size = 158 Table of new1 by Q15_03 Frequency‚ Percent ‚ Row Pct ‚ Col Pct ‚Yes ‚No ‚ Total ƒƒƒƒƒƒƒƒƒˆƒƒƒƒƒƒƒƒˆƒƒƒƒƒƒƒƒˆ Yes ‚ 37 ‚ 3 ‚ 40 ‚ 23.42 ‚ 1.90 ‚ 25.32 ‚ 92.50 ‚ 7.50 ‚ ‚ 26.62 ‚ 15.79 ‚ ƒƒƒƒƒƒƒƒƒˆƒƒƒƒƒƒƒƒˆƒƒƒƒƒƒƒƒˆ No ‚ 102 ‚ 16 ‚ 118 ‚ 64.56 ‚ 10.13 ‚ 74.68 ‚ 86.44 ‚ 13.56 ‚ ‚ 73.38 ‚ 84.21 ‚ ƒƒƒƒƒƒƒƒƒˆƒƒƒƒƒƒƒƒˆƒƒƒƒƒƒƒƒˆ Total 139 19 158 87.97 12.03 100.00 Statistics for Table of new1 by Q15_03 Statistic DF Value Prob ƒƒƒƒƒƒƒƒƒƒƒƒƒƒƒƒƒƒƒƒƒƒƒƒƒƒƒƒƒƒƒƒƒƒƒƒƒƒƒƒƒƒƒƒƒƒƒƒƒƒƒƒƒƒ Chi-Square 1 1.0368 0.3086 Likelihood Ratio Chi-Square 1 1.1326 0.2872 Continuity Adj. Chi-Square 1 0.5431 0.4611 Mantel-Haenszel Chi-Square 1 1.0302 0.3101 Phi Coefficient 0.0810 Contingency Coefficient 0.0807 Cramer's V 0.0810 WARNING: 25% of the cells have expected counts less than 5. Chi-Square may not be a valid test. Fisher's Exact Test ƒƒƒƒƒƒƒƒƒƒƒƒƒƒƒƒƒƒƒƒƒƒƒƒƒƒƒƒƒƒƒƒƒƒ Cell (1,1) Frequency (F) 37 Left-sided Pr <= F 0.9088 Right-sided Pr >= F 0.2364 Table Probability (P) 0.1452 Two-sided Pr <= P 0.4061 Sample Size = 158 Table of new1 by Q15_04 Frequency‚ Percent ‚ Row Pct ‚ Col Pct ‚Yes ‚No ‚ Total ƒƒƒƒƒƒƒƒƒˆƒƒƒƒƒƒƒƒˆƒƒƒƒƒƒƒƒˆ Yes ‚ 25 ‚ 15 ‚ 40 ‚ 15.82 ‚ 9.49 ‚ 25.32 ‚ 62.50 ‚ 37.50 ‚ ‚ 26.88 ‚ 23.08 ‚ ƒƒƒƒƒƒƒƒƒˆƒƒƒƒƒƒƒƒˆƒƒƒƒƒƒƒƒˆ No ‚ 68 ‚ 50 ‚ 118 ‚ 43.04 ‚ 31.65 ‚ 74.68 ‚ 57.63 ‚ 42.37 ‚ ‚ 73.12 ‚ 76.92 ‚ ƒƒƒƒƒƒƒƒƒˆƒƒƒƒƒƒƒƒˆƒƒƒƒƒƒƒƒˆ Total 93 65 158 58.86 41.14 100.00 Statistics for Table of new1 by Q15_04 Statistic DF Value Prob ƒƒƒƒƒƒƒƒƒƒƒƒƒƒƒƒƒƒƒƒƒƒƒƒƒƒƒƒƒƒƒƒƒƒƒƒƒƒƒƒƒƒƒƒƒƒƒƒƒƒƒƒƒƒ

399
Chi-Square 1 0.2929 0.5883 Likelihood Ratio Chi-Square 1 0.2949 0.5871 Continuity Adj. Chi-Square 1 0.1263 0.7223 Mantel-Haenszel Chi-Square 1 0.2911 0.5895 Phi Coefficient 0.0431 Contingency Coefficient 0.0430 Cramer's V 0.0431 Fisher's Exact Test ƒƒƒƒƒƒƒƒƒƒƒƒƒƒƒƒƒƒƒƒƒƒƒƒƒƒƒƒƒƒƒƒƒƒ Cell (1,1) Frequency (F) 25 Left-sided Pr <= F 0.7655 Right-sided Pr >= F 0.3631 Table Probability (P) 0.1286 Two-sided Pr <= P 0.7105 Sample Size = 158 Table of new1 by Q15_05 Frequency‚ Percent ‚ Row Pct ‚ Col Pct ‚Yes ‚No ‚ Total ƒƒƒƒƒƒƒƒƒˆƒƒƒƒƒƒƒƒˆƒƒƒƒƒƒƒƒˆ Yes ‚ 27 ‚ 13 ‚ 40 ‚ 17.09 ‚ 8.23 ‚ 25.32 ‚ 67.50 ‚ 32.50 ‚ ‚ 24.11 ‚ 28.26 ‚ ƒƒƒƒƒƒƒƒƒˆƒƒƒƒƒƒƒƒˆƒƒƒƒƒƒƒƒˆ No ‚ 85 ‚ 33 ‚ 118 ‚ 53.80 ‚ 20.89 ‚ 74.68 ‚ 72.03 ‚ 27.97 ‚ ‚ 75.89 ‚ 71.74 ‚ ƒƒƒƒƒƒƒƒƒˆƒƒƒƒƒƒƒƒˆƒƒƒƒƒƒƒƒˆ Total 112 46 158 70.89 29.11 100.00 Statistics for Table of new1 by Q15_05 Statistic DF Value Prob ƒƒƒƒƒƒƒƒƒƒƒƒƒƒƒƒƒƒƒƒƒƒƒƒƒƒƒƒƒƒƒƒƒƒƒƒƒƒƒƒƒƒƒƒƒƒƒƒƒƒƒƒƒƒ Chi-Square 1 0.2976 0.5854 Likelihood Ratio Chi-Square 1 0.2934 0.5880 Continuity Adj. Chi-Square 1 0.1184 0.7308 Mantel-Haenszel Chi-Square 1 0.2957 0.5866 Phi Coefficient -0.0434 Contingency Coefficient 0.0434 Cramer's V -0.0434 Fisher's Exact Test ƒƒƒƒƒƒƒƒƒƒƒƒƒƒƒƒƒƒƒƒƒƒƒƒƒƒƒƒƒƒƒƒƒƒ Cell (1,1) Frequency (F) 27 Left-sided Pr <= F 0.3609 Right-sided Pr >= F 0.7742 Table Probability (P) 0.1351 Two-sided Pr <= P 0.6875 Sample Size = 158

400
Table of new1 by Q15_06 Frequency‚ Percent ‚ Row Pct ‚ Col Pct ‚Yes ‚No ‚ Total ƒƒƒƒƒƒƒƒƒˆƒƒƒƒƒƒƒƒˆƒƒƒƒƒƒƒƒˆ Yes ‚ 22 ‚ 18 ‚ 40 ‚ 13.92 ‚ 11.39 ‚ 25.32 ‚ 55.00 ‚ 45.00 ‚ ‚ 26.19 ‚ 24.32 ‚ ƒƒƒƒƒƒƒƒƒˆƒƒƒƒƒƒƒƒˆƒƒƒƒƒƒƒƒˆ No ‚ 62 ‚ 56 ‚ 118 ‚ 39.24 ‚ 35.44 ‚ 74.68 ‚ 52.54 ‚ 47.46 ‚ ‚ 73.81 ‚ 75.68 ‚ ƒƒƒƒƒƒƒƒƒˆƒƒƒƒƒƒƒƒˆƒƒƒƒƒƒƒƒˆ Total 84 74 158 53.16 46.84 100.00 Statistics for Table of new1 by Q15_06 Statistic DF Value Prob ƒƒƒƒƒƒƒƒƒƒƒƒƒƒƒƒƒƒƒƒƒƒƒƒƒƒƒƒƒƒƒƒƒƒƒƒƒƒƒƒƒƒƒƒƒƒƒƒƒƒƒƒƒƒ Chi-Square 1 0.0725 0.7878 Likelihood Ratio Chi-Square 1 0.0726 0.7877 Continuity Adj. Chi-Square 1 0.0074 0.9316 Mantel-Haenszel Chi-Square 1 0.0720 0.7884 Phi Coefficient 0.0214 Contingency Coefficient 0.0214 Cramer's V 0.0214 Fisher's Exact Test ƒƒƒƒƒƒƒƒƒƒƒƒƒƒƒƒƒƒƒƒƒƒƒƒƒƒƒƒƒƒƒƒƒƒ Cell (1,1) Frequency (F) 22 Left-sided Pr <= F 0.6738 Right-sided Pr >= F 0.4666 Table Probability (P) 0.1404 Two-sided Pr <= P 0.8555 Sample Size = 158 Table of new1 by Q15_07 Frequency‚ Percent ‚ Row Pct ‚ Col Pct ‚Yes ‚No ‚ Total ƒƒƒƒƒƒƒƒƒˆƒƒƒƒƒƒƒƒˆƒƒƒƒƒƒƒƒˆ Yes ‚ 26 ‚ 14 ‚ 40 ‚ 16.46 ‚ 8.86 ‚ 25.32 ‚ 65.00 ‚ 35.00 ‚ ‚ 23.85 ‚ 28.57 ‚ ƒƒƒƒƒƒƒƒƒˆƒƒƒƒƒƒƒƒˆƒƒƒƒƒƒƒƒˆ No ‚ 83 ‚ 35 ‚ 118 ‚ 52.53 ‚ 22.15 ‚ 74.68 ‚ 70.34 ‚ 29.66 ‚ ‚ 76.15 ‚ 71.43 ‚ ƒƒƒƒƒƒƒƒƒˆƒƒƒƒƒƒƒƒˆƒƒƒƒƒƒƒƒˆ Total 109 49 158 68.99 31.01 100.00 Statistics for Table of new1 by Q15_07 Statistic DF Value Prob ƒƒƒƒƒƒƒƒƒƒƒƒƒƒƒƒƒƒƒƒƒƒƒƒƒƒƒƒƒƒƒƒƒƒƒƒƒƒƒƒƒƒƒƒƒƒƒƒƒƒƒƒƒƒ Chi-Square 1 0.3980 0.5281 Likelihood Ratio Chi-Square 1 0.3924 0.5310 Continuity Adj. Chi-Square 1 0.1876 0.6649 Mantel-Haenszel Chi-Square 1 0.3955 0.5294 Phi Coefficient -0.0502 Contingency Coefficient 0.0501 Cramer's V -0.0502 Fisher's Exact Test ƒƒƒƒƒƒƒƒƒƒƒƒƒƒƒƒƒƒƒƒƒƒƒƒƒƒƒƒƒƒƒƒƒƒ Cell (1,1) Frequency (F) 26 Left-sided Pr <= F 0.3290 Right-sided Pr >= F 0.7974 Table Probability (P) 0.1264 Two-sided Pr <= P 0.5564 Sample Size = 158

401
Table of new1 by Q15_08 Frequency‚ Percent ‚ Row Pct ‚ Col Pct ‚Yes ‚No ‚ Total ƒƒƒƒƒƒƒƒƒˆƒƒƒƒƒƒƒƒˆƒƒƒƒƒƒƒƒˆ Yes ‚ 28 ‚ 12 ‚ 40 ‚ 17.72 ‚ 7.59 ‚ 25.32 ‚ 70.00 ‚ 30.00 ‚ ‚ 27.18 ‚ 21.82 ‚ ƒƒƒƒƒƒƒƒƒˆƒƒƒƒƒƒƒƒˆƒƒƒƒƒƒƒƒˆ No ‚ 75 ‚ 43 ‚ 118 ‚ 47.47 ‚ 27.22 ‚ 74.68 ‚ 63.56 ‚ 36.44 ‚ ‚ 72.82 ‚ 78.18 ‚ ƒƒƒƒƒƒƒƒƒˆƒƒƒƒƒƒƒƒˆƒƒƒƒƒƒƒƒˆ Total 103 55 158 65.19 34.81 100.00 Statistics for Table of new1 by Q15_08 Statistic DF Value Prob ƒƒƒƒƒƒƒƒƒƒƒƒƒƒƒƒƒƒƒƒƒƒƒƒƒƒƒƒƒƒƒƒƒƒƒƒƒƒƒƒƒƒƒƒƒƒƒƒƒƒƒƒƒƒ Chi-Square 1 0.5461 0.4599 Likelihood Ratio Chi-Square 1 0.5549 0.4563 Continuity Adj. Chi-Square 1 0.2991 0.5844 Mantel-Haenszel Chi-Square 1 0.5426 0.4613 Phi Coefficient 0.0588 Contingency Coefficient 0.0587 Cramer's V 0.0588 Fisher's Exact Test ƒƒƒƒƒƒƒƒƒƒƒƒƒƒƒƒƒƒƒƒƒƒƒƒƒƒƒƒƒƒƒƒƒƒ Cell (1,1) Frequency (F) 28 Left-sided Pr <= F 0.8237 Right-sided Pr >= F 0.2948 Table Probability (P) 0.1185 Two-sided Pr <= P 0.5654 Sample Size = 158 Table of new1 by Q15_09 Frequency‚ Percent ‚ Row Pct ‚ Col Pct ‚Yes ‚No ‚ Total ƒƒƒƒƒƒƒƒƒˆƒƒƒƒƒƒƒƒˆƒƒƒƒƒƒƒƒˆ Yes ‚ 23 ‚ 17 ‚ 40 ‚ 14.56 ‚ 10.76 ‚ 25.32 ‚ 57.50 ‚ 42.50 ‚ ‚ 29.11 ‚ 21.52 ‚ ƒƒƒƒƒƒƒƒƒˆƒƒƒƒƒƒƒƒˆƒƒƒƒƒƒƒƒˆ No ‚ 56 ‚ 62 ‚ 118 ‚ 35.44 ‚ 39.24 ‚ 74.68 ‚ 47.46 ‚ 52.54 ‚ ‚ 70.89 ‚ 78.48 ‚ ƒƒƒƒƒƒƒƒƒˆƒƒƒƒƒƒƒƒˆƒƒƒƒƒƒƒƒˆ Total 79 79 158 50.00 50.00 100.00 Statistics for Table of new1 by Q15_09 Statistic DF Value Prob ƒƒƒƒƒƒƒƒƒƒƒƒƒƒƒƒƒƒƒƒƒƒƒƒƒƒƒƒƒƒƒƒƒƒƒƒƒƒƒƒƒƒƒƒƒƒƒƒƒƒƒƒƒƒ Chi-Square 1 1.2051 0.2723 Likelihood Ratio Chi-Square 1 1.2086 0.2716 Continuity Adj. Chi-Square 1 0.8369 0.3603 Mantel-Haenszel Chi-Square 1 1.1975 0.2738 Phi Coefficient 0.0873 Contingency Coefficient 0.0870 Cramer's V 0.0873 Fisher's Exact Test ƒƒƒƒƒƒƒƒƒƒƒƒƒƒƒƒƒƒƒƒƒƒƒƒƒƒƒƒƒƒƒƒƒƒ Cell (1,1) Frequency (F) 23 Left-sided Pr <= F 0.9000 Right-sided Pr >= F 0.1802 Table Probability (P) 0.0802 Two-sided Pr <= P 0.3604 Sample Size = 158 Table of new1 by Q15_10 Frequency‚ Percent ‚ Row Pct ‚ Col Pct ‚Yes ‚No ‚ Total ƒƒƒƒƒƒƒƒƒˆƒƒƒƒƒƒƒƒˆƒƒƒƒƒƒƒƒˆ Yes ‚ 28 ‚ 12 ‚ 40 ‚ 17.72 ‚ 7.59 ‚ 25.32 ‚ 70.00 ‚ 30.00 ‚ ‚ 26.67 ‚ 22.64 ‚ ƒƒƒƒƒƒƒƒƒˆƒƒƒƒƒƒƒƒˆƒƒƒƒƒƒƒƒˆ No ‚ 77 ‚ 41 ‚ 118 ‚ 48.73 ‚ 25.95 ‚ 74.68 ‚ 65.25 ‚ 34.75 ‚ ‚ 73.33 ‚ 77.36 ‚ ƒƒƒƒƒƒƒƒƒˆƒƒƒƒƒƒƒƒˆƒƒƒƒƒƒƒƒˆ Total 105 53 158 66.46 33.54 100.00 Statistics for Table of new1 by Q15_10 Statistic DF Value Prob ƒƒƒƒƒƒƒƒƒƒƒƒƒƒƒƒƒƒƒƒƒƒƒƒƒƒƒƒƒƒƒƒƒƒƒƒƒƒƒƒƒƒƒƒƒƒƒƒƒƒƒƒƒƒ

402
Chi-Square 1 0.3018 0.5827 Likelihood Ratio Chi-Square 1 0.3056 0.5804 Continuity Adj. Chi-Square 1 0.1265 0.7221 Mantel-Haenszel Chi-Square 1 0.2999 0.5839 Phi Coefficient 0.0437 Contingency Coefficient 0.0437 Cramer's V 0.0437 Fisher's Exact Test ƒƒƒƒƒƒƒƒƒƒƒƒƒƒƒƒƒƒƒƒƒƒƒƒƒƒƒƒƒƒƒƒƒƒ Cell (1,1) Frequency (F) 28 Left-sided Pr <= F 0.7697 Right-sided Pr >= F 0.3648 Table Probability (P) 0.1344 Two-sided Pr <= P 0.6992 Sample Size = 158 Table of new1 by q15_11n Frequency‚ Percent ‚ Row Pct ‚ Col Pct ‚ 1‚ 2‚ Total ƒƒƒƒƒƒƒƒƒˆƒƒƒƒƒƒƒƒˆƒƒƒƒƒƒƒƒˆ Yes ‚ 38 ‚ 2 ‚ 40 ‚ 24.05 ‚ 1.27 ‚ 25.32 ‚ 95.00 ‚ 5.00 ‚ ‚ 25.00 ‚ 33.33 ‚ ƒƒƒƒƒƒƒƒƒˆƒƒƒƒƒƒƒƒˆƒƒƒƒƒƒƒƒˆ No ‚ 114 ‚ 4 ‚ 118 ‚ 72.15 ‚ 2.53 ‚ 74.68 ‚ 96.61 ‚ 3.39 ‚ ‚ 75.00 ‚ 66.67 ‚ ƒƒƒƒƒƒƒƒƒˆƒƒƒƒƒƒƒƒˆƒƒƒƒƒƒƒƒˆ Total 152 6 158 96.20 3.80 100.00 Statistics for Table of new1 by q15_11n Statistic DF Value Prob ƒƒƒƒƒƒƒƒƒƒƒƒƒƒƒƒƒƒƒƒƒƒƒƒƒƒƒƒƒƒƒƒƒƒƒƒƒƒƒƒƒƒƒƒƒƒƒƒƒƒƒƒƒƒ Chi-Square 1 0.2120 0.6452 Likelihood Ratio Chi-Square 1 0.2000 0.6547 Continuity Adj. Chi-Square 1 0.0000 1.0000 Mantel-Haenszel Chi-Square 1 0.2107 0.6462 Phi Coefficient -0.0366 Contingency Coefficient 0.0366 Cramer's V -0.0366 WARNING: 50% of the cells have expected counts less than 5. Chi-Square may not be a valid test. Fisher's Exact Test ƒƒƒƒƒƒƒƒƒƒƒƒƒƒƒƒƒƒƒƒƒƒƒƒƒƒƒƒƒƒƒƒƒƒ Cell (1,1) Frequency (F) 38 Left-sided Pr <= F 0.4756 Right-sided Pr >= F 0.8294 Table Probability (P) 0.3049 Two-sided Pr <= P 0.6435 Sample Size = 158 Table of new1 by Q17_01 Frequency‚ Percent ‚ Row Pct ‚ Col Pct ‚Yes ‚No ‚ Total ƒƒƒƒƒƒƒƒƒˆƒƒƒƒƒƒƒƒˆƒƒƒƒƒƒƒƒˆ Yes ‚ 36 ‚ 4 ‚ 40 ‚ 22.78 ‚ 2.53 ‚ 25.32 ‚ 90.00 ‚ 10.00 ‚ ‚ 31.03 ‚ 9.52 ‚ ƒƒƒƒƒƒƒƒƒˆƒƒƒƒƒƒƒƒˆƒƒƒƒƒƒƒƒˆ No ‚ 80 ‚ 38 ‚ 118 ‚ 50.63 ‚ 24.05 ‚ 74.68 ‚ 67.80 ‚ 32.20 ‚ ‚ 68.97 ‚ 90.48 ‚ ƒƒƒƒƒƒƒƒƒˆƒƒƒƒƒƒƒƒˆƒƒƒƒƒƒƒƒˆ Total 116 42 158 73.42 26.58 100.00 Statistics for Table of new1 by Q17_01 Statistic DF Value Prob ƒƒƒƒƒƒƒƒƒƒƒƒƒƒƒƒƒƒƒƒƒƒƒƒƒƒƒƒƒƒƒƒƒƒƒƒƒƒƒƒƒƒƒƒƒƒƒƒƒƒƒƒƒƒ Chi-Square 1 7.5462 0.0060 Likelihood Ratio Chi-Square 1 8.6755 0.0032 Continuity Adj. Chi-Square 1 6.4514 0.0111 Mantel-Haenszel Chi-Square 1 7.4985 0.0062 Phi Coefficient 0.2185 Contingency Coefficient 0.2135 Cramer's V 0.2185 Fisher's Exact Test ƒƒƒƒƒƒƒƒƒƒƒƒƒƒƒƒƒƒƒƒƒƒƒƒƒƒƒƒƒƒƒƒƒƒ Cell (1,1) Frequency (F) 36 Left-sided Pr <= F 0.9992 Right-sided Pr >= F 0.0037 Table Probability (P) 0.0029 Two-sided Pr <= P 0.0065 Sample Size = 158 Table of new1 by Q17_02 Frequency‚ Percent ‚ Row Pct ‚ Col Pct ‚Yes ‚No ‚ Total ƒƒƒƒƒƒƒƒƒˆƒƒƒƒƒƒƒƒˆƒƒƒƒƒƒƒƒˆ

403
Yes ‚ 25 ‚ 15 ‚ 40 ‚ 15.82 ‚ 9.49 ‚ 25.32 ‚ 62.50 ‚ 37.50 ‚ ‚ 28.74 ‚ 21.13 ‚ ƒƒƒƒƒƒƒƒƒˆƒƒƒƒƒƒƒƒˆƒƒƒƒƒƒƒƒˆ No ‚ 62 ‚ 56 ‚ 118 ‚ 39.24 ‚ 35.44 ‚ 74.68 ‚ 52.54 ‚ 47.46 ‚ ‚ 71.26 ‚ 78.87 ‚ ƒƒƒƒƒƒƒƒƒˆƒƒƒƒƒƒƒƒˆƒƒƒƒƒƒƒƒˆ Total 87 71 158 55.06 44.94 100.00 Statistics for Table of new1 by Q17_02 Statistic DF Value Prob ƒƒƒƒƒƒƒƒƒƒƒƒƒƒƒƒƒƒƒƒƒƒƒƒƒƒƒƒƒƒƒƒƒƒƒƒƒƒƒƒƒƒƒƒƒƒƒƒƒƒƒƒƒƒ Chi-Square 1 1.1971 0.2739 Likelihood Ratio Chi-Square 1 1.2089 0.2716 Continuity Adj. Chi-Square 1 0.8285 0.3627 Mantel-Haenszel Chi-Square 1 1.1895 0.2754 Phi Coefficient 0.0870 Contingency Coefficient 0.0867 Cramer's V 0.0870 Fisher's Exact Test ƒƒƒƒƒƒƒƒƒƒƒƒƒƒƒƒƒƒƒƒƒƒƒƒƒƒƒƒƒƒƒƒƒƒ Cell (1,1) Frequency (F) 25 Left-sided Pr <= F 0.8999 Right-sided Pr >= F 0.1816 Table Probability (P) 0.0815 Two-sided Pr <= P 0.3580 Sample Size = 158

404
Table of new1 by Q17_03 Frequency‚ Percent ‚ Row Pct ‚ Col Pct ‚Yes ‚No ‚ Total ƒƒƒƒƒƒƒƒƒˆƒƒƒƒƒƒƒƒˆƒƒƒƒƒƒƒƒˆ Yes ‚ 20 ‚ 20 ‚ 40 ‚ 12.66 ‚ 12.66 ‚ 25.32 ‚ 50.00 ‚ 50.00 ‚ ‚ 51.28 ‚ 16.81 ‚ ƒƒƒƒƒƒƒƒƒˆƒƒƒƒƒƒƒƒˆƒƒƒƒƒƒƒƒˆ No ‚ 19 ‚ 99 ‚ 118 ‚ 12.03 ‚ 62.66 ‚ 74.68 ‚ 16.10 ‚ 83.90 ‚ ‚ 48.72 ‚ 83.19 ‚ ƒƒƒƒƒƒƒƒƒˆƒƒƒƒƒƒƒƒˆƒƒƒƒƒƒƒƒˆ Total 39 119 158 24.68 75.32 100.00 Statistics for Table of new1 by Q17_03 Statistic DF Value Prob ƒƒƒƒƒƒƒƒƒƒƒƒƒƒƒƒƒƒƒƒƒƒƒƒƒƒƒƒƒƒƒƒƒƒƒƒƒƒƒƒƒƒƒƒƒƒƒƒƒƒƒƒƒƒ Chi-Square 1 18.4648 <.0001 Likelihood Ratio Chi-Square 1 16.9799 <.0001 Continuity Adj. Chi-Square 1 16.6864 <.0001 Mantel-Haenszel Chi-Square 1 18.3479 <.0001 Phi Coefficient 0.3419 Contingency Coefficient 0.3235 Cramer's V 0.3419 Fisher's Exact Test ƒƒƒƒƒƒƒƒƒƒƒƒƒƒƒƒƒƒƒƒƒƒƒƒƒƒƒƒƒƒƒƒƒƒ Cell (1,1) Frequency (F) 20 Left-sided Pr <= F 1.0000 Right-sided Pr >= F 4.233E-05 Table Probability (P) 3.490E-05 Two-sided Pr <= P 7.462E-05 Sample Size = 158 Table of new1 by Q17_04 Frequency‚ Percent ‚ Row Pct ‚ Col Pct ‚Yes ‚No ‚ Total ƒƒƒƒƒƒƒƒƒˆƒƒƒƒƒƒƒƒˆƒƒƒƒƒƒƒƒˆ Yes ‚ 28 ‚ 12 ‚ 40 ‚ 17.72 ‚ 7.59 ‚ 25.32 ‚ 70.00 ‚ 30.00 ‚ ‚ 31.46 ‚ 17.39 ‚ ƒƒƒƒƒƒƒƒƒˆƒƒƒƒƒƒƒƒˆƒƒƒƒƒƒƒƒˆ No ‚ 61 ‚ 57 ‚ 118 ‚ 38.61 ‚ 36.08 ‚ 74.68 ‚ 51.69 ‚ 48.31 ‚ ‚ 68.54 ‚ 82.61 ‚ ƒƒƒƒƒƒƒƒƒˆƒƒƒƒƒƒƒƒˆƒƒƒƒƒƒƒƒˆ Total 89 69 158 56.33 43.67 100.00 Statistics for Table of new1 by Q17_04 Statistic DF Value Prob ƒƒƒƒƒƒƒƒƒƒƒƒƒƒƒƒƒƒƒƒƒƒƒƒƒƒƒƒƒƒƒƒƒƒƒƒƒƒƒƒƒƒƒƒƒƒƒƒƒƒƒƒƒƒ Chi-Square 1 4.0691 0.0437 Likelihood Ratio Chi-Square 1 4.1798 0.0409 Continuity Adj. Chi-Square 1 3.3590 0.0668 Mantel-Haenszel Chi-Square 1 4.0434 0.0443 Phi Coefficient 0.1605 Contingency Coefficient 0.1585 Cramer's V 0.1605 Fisher's Exact Test ƒƒƒƒƒƒƒƒƒƒƒƒƒƒƒƒƒƒƒƒƒƒƒƒƒƒƒƒƒƒƒƒƒƒ Cell (1,1) Frequency (F) 28 Left-sided Pr <= F 0.9871 Right-sided Pr >= F 0.0323 Table Probability (P) 0.0194 Two-sided Pr <= P 0.0643 Sample Size = 158

405
Table of new1 by Q17_05 Frequency‚ Percent ‚ Row Pct ‚ Col Pct ‚Yes ‚No ‚ Total ƒƒƒƒƒƒƒƒƒˆƒƒƒƒƒƒƒƒˆƒƒƒƒƒƒƒƒˆ Yes ‚ 16 ‚ 24 ‚ 40 ‚ 10.13 ‚ 15.19 ‚ 25.32 ‚ 40.00 ‚ 60.00 ‚ ‚ 28.57 ‚ 23.53 ‚ ƒƒƒƒƒƒƒƒƒˆƒƒƒƒƒƒƒƒˆƒƒƒƒƒƒƒƒˆ No ‚ 40 ‚ 78 ‚ 118 ‚ 25.32 ‚ 49.37 ‚ 74.68 ‚ 33.90 ‚ 66.10 ‚ ‚ 71.43 ‚ 76.47 ‚ ƒƒƒƒƒƒƒƒƒˆƒƒƒƒƒƒƒƒˆƒƒƒƒƒƒƒƒˆ Total 56 102 158 35.44 64.56 100.00 Statistics for Table of new1 by Q17_05 Statistic DF Value Prob ƒƒƒƒƒƒƒƒƒƒƒƒƒƒƒƒƒƒƒƒƒƒƒƒƒƒƒƒƒƒƒƒƒƒƒƒƒƒƒƒƒƒƒƒƒƒƒƒƒƒƒƒƒƒ Chi-Square 1 0.4861 0.4857 Likelihood Ratio Chi-Square 1 0.4806 0.4881 Continuity Adj. Chi-Square 1 0.2560 0.6129 Mantel-Haenszel Chi-Square 1 0.4830 0.4871 Phi Coefficient 0.0555 Contingency Coefficient 0.0554 Cramer's V 0.0555 Fisher's Exact Test ƒƒƒƒƒƒƒƒƒƒƒƒƒƒƒƒƒƒƒƒƒƒƒƒƒƒƒƒƒƒƒƒƒƒ Cell (1,1) Frequency (F) 16 Left-sided Pr <= F 0.8133 Right-sided Pr >= F 0.3042 Table Probability (P) 0.1175 Two-sided Pr <= P 0.5668 Sample Size = 158 Table of new1 by q17_06n Frequency‚ Percent ‚ Row Pct ‚ Col Pct ‚Yes ‚No ‚ Total ƒƒƒƒƒƒƒƒƒˆƒƒƒƒƒƒƒƒˆƒƒƒƒƒƒƒƒˆ Yes ‚ 38 ‚ 2 ‚ 40 ‚ 24.05 ‚ 1.27 ‚ 25.32 ‚ 95.00 ‚ 5.00 ‚ ‚ 27.54 ‚ 10.00 ‚ ƒƒƒƒƒƒƒƒƒˆƒƒƒƒƒƒƒƒˆƒƒƒƒƒƒƒƒˆ No ‚ 100 ‚ 18 ‚ 118 ‚ 63.29 ‚ 11.39 ‚ 74.68 ‚ 84.75 ‚ 15.25 ‚ ‚ 72.46 ‚ 90.00 ‚ ƒƒƒƒƒƒƒƒƒˆƒƒƒƒƒƒƒƒˆƒƒƒƒƒƒƒƒˆ Total 138 20 158 87.34 12.66 100.00 Statistics for Table of new1 by q17_06n Statistic DF Value Prob ƒƒƒƒƒƒƒƒƒƒƒƒƒƒƒƒƒƒƒƒƒƒƒƒƒƒƒƒƒƒƒƒƒƒƒƒƒƒƒƒƒƒƒƒƒƒƒƒƒƒƒƒƒƒ Chi-Square 1 2.8412 0.0919 Likelihood Ratio Chi-Square 1 3.3534 0.0671 Continuity Adj. Chi-Square 1 1.9894 0.1584 Mantel-Haenszel Chi-Square 1 2.8232 0.0929 Phi Coefficient 0.1341 Contingency Coefficient 0.1329 Cramer's V 0.1341 Fisher's Exact Test ƒƒƒƒƒƒƒƒƒƒƒƒƒƒƒƒƒƒƒƒƒƒƒƒƒƒƒƒƒƒƒƒƒƒ Cell (1,1) Frequency (F) 38 Left-sided Pr <= F 0.9832 Right-sided Pr >= F 0.0724 Table Probability (P) 0.0555 Two-sided Pr <= P 0.1060 Sample Size = 158 Cumulative Cumulative new1 Q17_07 Frequency Percent Frequency Percent ƒƒƒƒƒƒƒƒƒƒƒƒƒƒƒƒƒƒƒƒƒƒƒƒƒƒƒƒƒƒƒƒƒƒƒƒƒƒƒƒƒƒƒƒƒƒƒƒƒƒƒƒƒƒƒƒƒƒƒƒƒƒƒƒƒƒƒ Yes No 40 25.32 40 25.32 No No 118 74.68 158 100.00 Table of new1 by Q18_01 Frequency‚ Percent ‚ Row Pct ‚ Col Pct ‚Yes ‚No ‚ Total ƒƒƒƒƒƒƒƒƒˆƒƒƒƒƒƒƒƒˆƒƒƒƒƒƒƒƒˆ Yes ‚ 20 ‚ 20 ‚ 40 ‚ 12.66 ‚ 12.66 ‚ 25.32 ‚ 50.00 ‚ 50.00 ‚ ‚ 21.74 ‚ 30.30 ‚ ƒƒƒƒƒƒƒƒƒˆƒƒƒƒƒƒƒƒˆƒƒƒƒƒƒƒƒˆ No ‚ 72 ‚ 46 ‚ 118 ‚ 45.57 ‚ 29.11 ‚ 74.68 ‚ 61.02 ‚ 38.98 ‚ ‚ 78.26 ‚ 69.70 ‚ ƒƒƒƒƒƒƒƒƒˆƒƒƒƒƒƒƒƒˆƒƒƒƒƒƒƒƒˆ Total 92 66 158

406
58.23 41.77 100.00 Statistics for Table of new1 by Q18_01 Statistic DF Value Prob ƒƒƒƒƒƒƒƒƒƒƒƒƒƒƒƒƒƒƒƒƒƒƒƒƒƒƒƒƒƒƒƒƒƒƒƒƒƒƒƒƒƒƒƒƒƒƒƒƒƒƒƒƒƒ Chi-Square 1 1.4907 0.2221 Likelihood Ratio Chi-Square 1 1.4781 0.2241 Continuity Adj. Chi-Square 1 1.0722 0.3005 Mantel-Haenszel Chi-Square 1 1.4813 0.2236 Phi Coefficient -0.0971 Contingency Coefficient 0.0967 Cramer's V -0.0971 Fisher's Exact Test ƒƒƒƒƒƒƒƒƒƒƒƒƒƒƒƒƒƒƒƒƒƒƒƒƒƒƒƒƒƒƒƒƒƒ Cell (1,1) Frequency (F) 20 Left-sided Pr <= F 0.1503 Right-sided Pr >= F 0.9197 Table Probability (P) 0.0700 Two-sided Pr <= P 0.2667 Sample Size = 158 Table of new1 by Q18_02 Frequency‚ Percent ‚ Row Pct ‚ Col Pct ‚Yes ‚No ‚ Total ƒƒƒƒƒƒƒƒƒˆƒƒƒƒƒƒƒƒˆƒƒƒƒƒƒƒƒˆ Yes ‚ 37 ‚ 3 ‚ 40 ‚ 23.42 ‚ 1.90 ‚ 25.32 ‚ 92.50 ‚ 7.50 ‚ ‚ 30.83 ‚ 7.89 ‚ ƒƒƒƒƒƒƒƒƒˆƒƒƒƒƒƒƒƒˆƒƒƒƒƒƒƒƒˆ No ‚ 83 ‚ 35 ‚ 118 ‚ 52.53 ‚ 22.15 ‚ 74.68 ‚ 70.34 ‚ 29.66 ‚ ‚ 69.17 ‚ 92.11 ‚ ƒƒƒƒƒƒƒƒƒˆƒƒƒƒƒƒƒƒˆƒƒƒƒƒƒƒƒˆ Total 120 38 158 75.95 24.05 100.00 Statistics for Table of new1 by Q18_02 Statistic DF Value Prob ƒƒƒƒƒƒƒƒƒƒƒƒƒƒƒƒƒƒƒƒƒƒƒƒƒƒƒƒƒƒƒƒƒƒƒƒƒƒƒƒƒƒƒƒƒƒƒƒƒƒƒƒƒƒ Chi-Square 1 8.0318 0.0046 Likelihood Ratio Chi-Square 1 9.5350 0.0020 Continuity Adj. Chi-Square 1 6.8644 0.0088 Mantel-Haenszel Chi-Square 1 7.9810 0.0047 Phi Coefficient 0.2255 Contingency Coefficient 0.2199 Cramer's V 0.2255 Fisher's Exact Test ƒƒƒƒƒƒƒƒƒƒƒƒƒƒƒƒƒƒƒƒƒƒƒƒƒƒƒƒƒƒƒƒƒƒ Cell (1,1) Frequency (F) 37 Left-sided Pr <= F 0.9996 Right-sided Pr >= F 0.0026 Table Probability (P) 0.0021 Two-sided Pr <= P 0.0047 Sample Size = 158 Table of new1 by Q18_03 Frequency‚ Percent ‚ Row Pct ‚ Col Pct ‚Yes ‚No ‚ Total ƒƒƒƒƒƒƒƒƒˆƒƒƒƒƒƒƒƒˆƒƒƒƒƒƒƒƒˆ Yes ‚ 2 ‚ 38 ‚ 40 ‚ 1.27 ‚ 24.05 ‚ 25.32 ‚ 5.00 ‚ 95.00 ‚ ‚ 6.25 ‚ 30.16 ‚ ƒƒƒƒƒƒƒƒƒˆƒƒƒƒƒƒƒƒˆƒƒƒƒƒƒƒƒˆ No ‚ 30 ‚ 88 ‚ 118 ‚ 18.99 ‚ 55.70 ‚ 74.68 ‚ 25.42 ‚ 74.58 ‚ ‚ 93.75 ‚ 69.84 ‚ ƒƒƒƒƒƒƒƒƒˆƒƒƒƒƒƒƒƒˆƒƒƒƒƒƒƒƒˆ Total 32 126 158 20.25 79.75 100.00 Statistics for Table of new1 by Q18_03 Statistic DF Value Prob ƒƒƒƒƒƒƒƒƒƒƒƒƒƒƒƒƒƒƒƒƒƒƒƒƒƒƒƒƒƒƒƒƒƒƒƒƒƒƒƒƒƒƒƒƒƒƒƒƒƒƒƒƒƒ Chi-Square 1 7.7152 0.0055 Likelihood Ratio Chi-Square 1 9.5502 0.0020 Continuity Adj. Chi-Square 1 6.5025 0.0108 Mantel-Haenszel Chi-Square 1 7.6664 0.0056 Phi Coefficient -0.2210 Contingency Coefficient 0.2158 Cramer's V -0.2210 Fisher's Exact Test ƒƒƒƒƒƒƒƒƒƒƒƒƒƒƒƒƒƒƒƒƒƒƒƒƒƒƒƒƒƒƒƒƒƒ Cell (1,1) Frequency (F) 2 Left-sided Pr <= F 0.0029 Right-sided Pr >= F 0.9996 Table Probability (P) 0.0025 Two-sided Pr <= P 0.0054 Sample Size = 158 Table of new1 by Q18_04 Frequency‚ Percent ‚ Row Pct ‚

407
Col Pct ‚Yes ‚No ‚ Total ƒƒƒƒƒƒƒƒƒˆƒƒƒƒƒƒƒƒˆƒƒƒƒƒƒƒƒˆ Yes ‚ 2 ‚ 38 ‚ 40 ‚ 1.27 ‚ 24.05 ‚ 25.32 ‚ 5.00 ‚ 95.00 ‚ ‚ 66.67 ‚ 24.52 ‚ ƒƒƒƒƒƒƒƒƒˆƒƒƒƒƒƒƒƒˆƒƒƒƒƒƒƒƒˆ No ‚ 1 ‚ 117 ‚ 118 ‚ 0.63 ‚ 74.05 ‚ 74.68 ‚ 0.85 ‚ 99.15 ‚ ‚ 33.33 ‚ 75.48 ‚ ƒƒƒƒƒƒƒƒƒˆƒƒƒƒƒƒƒƒˆƒƒƒƒƒƒƒƒˆ Total 3 155 158 1.90 98.10 100.00 Statistics for Table of new1 by Q18_04 Statistic DF Value Prob ƒƒƒƒƒƒƒƒƒƒƒƒƒƒƒƒƒƒƒƒƒƒƒƒƒƒƒƒƒƒƒƒƒƒƒƒƒƒƒƒƒƒƒƒƒƒƒƒƒƒƒƒƒƒ Chi-Square 1 2.7655 0.0963 Likelihood Ratio Chi-Square 1 2.3125 0.1283 Continuity Adj. Chi-Square 1 0.9854 0.3209 Mantel-Haenszel Chi-Square 1 2.7480 0.0974 Phi Coefficient 0.1323 Contingency Coefficient 0.1312 Cramer's V 0.1323 WARNING: 50% of the cells have expected counts less than 5. Chi-Square may not be a valid test. Fisher's Exact Test ƒƒƒƒƒƒƒƒƒƒƒƒƒƒƒƒƒƒƒƒƒƒƒƒƒƒƒƒƒƒƒƒƒƒ Cell (1,1) Frequency (F) 2 Left-sided Pr <= F 0.9847 Right-sided Pr >= F 0.1580 Table Probability (P) 0.1427 Two-sided Pr <= P 0.1580 Sample Size = 158 Table of new1 by q20_1n Frequency‚ Percent ‚ Row Pct ‚ Col Pct ‚Yes ‚No ‚ Total ƒƒƒƒƒƒƒƒƒˆƒƒƒƒƒƒƒƒˆƒƒƒƒƒƒƒƒˆ Yes ‚ 21 ‚ 19 ‚ 40 ‚ 13.29 ‚ 12.03 ‚ 25.32 ‚ 52.50 ‚ 47.50 ‚ ‚ 19.27 ‚ 38.78 ‚ ƒƒƒƒƒƒƒƒƒˆƒƒƒƒƒƒƒƒˆƒƒƒƒƒƒƒƒˆ No ‚ 88 ‚ 30 ‚ 118 ‚ 55.70 ‚ 18.99 ‚ 74.68 ‚ 74.58 ‚ 25.42 ‚ ‚ 80.73 ‚ 61.22 ‚ ƒƒƒƒƒƒƒƒƒˆƒƒƒƒƒƒƒƒˆƒƒƒƒƒƒƒƒˆ Total 109 49 158 68.99 31.01 100.00 Statistics for Table of new1 by q20_1n Statistic DF Value Prob ƒƒƒƒƒƒƒƒƒƒƒƒƒƒƒƒƒƒƒƒƒƒƒƒƒƒƒƒƒƒƒƒƒƒƒƒƒƒƒƒƒƒƒƒƒƒƒƒƒƒƒƒƒƒ Chi-Square 1 6.8050 0.0091 Likelihood Ratio Chi-Square 1 6.5176 0.0107 Continuity Adj. Chi-Square 1 5.8123 0.0159 Mantel-Haenszel Chi-Square 1 6.7619 0.0093 Phi Coefficient -0.2075 Contingency Coefficient 0.2032 Cramer's V -0.2075 Fisher's Exact Test ƒƒƒƒƒƒƒƒƒƒƒƒƒƒƒƒƒƒƒƒƒƒƒƒƒƒƒƒƒƒƒƒƒƒ Cell (1,1) Frequency (F) 21 Left-sided Pr <= F 0.0089 Right-sided Pr >= F 0.9970 Table Probability (P) 0.0059 Two-sided Pr <= P 0.0167 Sample Size = 158 Table of new1 by Q20_2 Frequency‚ Percent ‚ Row Pct ‚ Col Pct ‚Yes ‚No ‚ Total ƒƒƒƒƒƒƒƒƒˆƒƒƒƒƒƒƒƒˆƒƒƒƒƒƒƒƒˆ Yes ‚ 7 ‚ 33 ‚ 40 ‚ 4.43 ‚ 20.89 ‚ 25.32 ‚ 17.50 ‚ 82.50 ‚ ‚ 19.44 ‚ 27.05 ‚ ƒƒƒƒƒƒƒƒƒˆƒƒƒƒƒƒƒƒˆƒƒƒƒƒƒƒƒˆ No ‚ 29 ‚ 89 ‚ 118 ‚ 18.35 ‚ 56.33 ‚ 74.68 ‚ 24.58 ‚ 75.42 ‚ ‚ 80.56 ‚ 72.95 ‚ ƒƒƒƒƒƒƒƒƒˆƒƒƒƒƒƒƒƒˆƒƒƒƒƒƒƒƒˆ Total 36 122 158 22.78 77.22 100.00 Statistics for Table of new1 by Q20_2 Statistic DF Value Prob ƒƒƒƒƒƒƒƒƒƒƒƒƒƒƒƒƒƒƒƒƒƒƒƒƒƒƒƒƒƒƒƒƒƒƒƒƒƒƒƒƒƒƒƒƒƒƒƒƒƒƒƒƒƒ Chi-Square 1 0.8502 0.3565 Likelihood Ratio Chi-Square 1 0.8863 0.3465 Continuity Adj. Chi-Square 1 0.4956 0.4814 Mantel-Haenszel Chi-Square 1 0.8449 0.3580

408
Phi Coefficient -0.0734 Contingency Coefficient 0.0732 Cramer's V -0.0734 Fisher's Exact Test ƒƒƒƒƒƒƒƒƒƒƒƒƒƒƒƒƒƒƒƒƒƒƒƒƒƒƒƒƒƒƒƒƒƒ Cell (1,1) Frequency (F) 7 Left-sided Pr <= F 0.2442 Right-sided Pr >= F 0.8744 Table Probability (P) 0.1186 Two-sided Pr <= P 0.3934 Sample Size = 158 Table of new1 by Q20_3 Frequency‚ Percent ‚ Row Pct ‚ Col Pct ‚Yes ‚No ‚ Total ƒƒƒƒƒƒƒƒƒˆƒƒƒƒƒƒƒƒˆƒƒƒƒƒƒƒƒˆ Yes ‚ 9 ‚ 31 ‚ 40 ‚ 5.70 ‚ 19.62 ‚ 25.32 ‚ 22.50 ‚ 77.50 ‚ ‚ 17.65 ‚ 28.97 ‚ ƒƒƒƒƒƒƒƒƒˆƒƒƒƒƒƒƒƒˆƒƒƒƒƒƒƒƒˆ No ‚ 42 ‚ 76 ‚ 118 ‚ 26.58 ‚ 48.10 ‚ 74.68 ‚ 35.59 ‚ 64.41 ‚ ‚ 82.35 ‚ 71.03 ‚ ƒƒƒƒƒƒƒƒƒˆƒƒƒƒƒƒƒƒˆƒƒƒƒƒƒƒƒˆ Total 51 107 158 32.28 67.72 100.00 Statistics for Table of new1 by Q20_3 Statistic DF Value Prob ƒƒƒƒƒƒƒƒƒƒƒƒƒƒƒƒƒƒƒƒƒƒƒƒƒƒƒƒƒƒƒƒƒƒƒƒƒƒƒƒƒƒƒƒƒƒƒƒƒƒƒƒƒƒ Chi-Square 1 2.3428 0.1259 Likelihood Ratio Chi-Square 1 2.4495 0.1176 Continuity Adj. Chi-Square 1 1.7821 0.1819 Mantel-Haenszel Chi-Square 1 2.3280 0.1271 Phi Coefficient -0.1218 Contingency Coefficient 0.1209 Cramer's V -0.1218 Fisher's Exact Test ƒƒƒƒƒƒƒƒƒƒƒƒƒƒƒƒƒƒƒƒƒƒƒƒƒƒƒƒƒƒƒƒƒƒ Cell (1,1) Frequency (F) 9 Left-sided Pr <= F 0.0891 Right-sided Pr >= F 0.9605 Table Probability (P) 0.0496 Two-sided Pr <= P 0.1705 Sample Size = 158 Table of new1 by Q20_4 Frequency‚ Percent ‚ Row Pct ‚ Col Pct ‚Yes ‚No ‚ Total ƒƒƒƒƒƒƒƒƒˆƒƒƒƒƒƒƒƒˆƒƒƒƒƒƒƒƒˆ Yes ‚ 7 ‚ 33 ‚ 40 ‚ 4.43 ‚ 20.89 ‚ 25.32 ‚ 17.50 ‚ 82.50 ‚ ‚ 15.56 ‚ 29.20 ‚ ƒƒƒƒƒƒƒƒƒˆƒƒƒƒƒƒƒƒˆƒƒƒƒƒƒƒƒˆ No ‚ 38 ‚ 80 ‚ 118 ‚ 24.05 ‚ 50.63 ‚ 74.68 ‚ 32.20 ‚ 67.80 ‚ ‚ 84.44 ‚ 70.80 ‚ ƒƒƒƒƒƒƒƒƒˆƒƒƒƒƒƒƒƒˆƒƒƒƒƒƒƒƒˆ Total 45 113 158 28.48 71.52 100.00 Statistics for Table of new1 by Q20_4 Statistic DF Value Prob ƒƒƒƒƒƒƒƒƒƒƒƒƒƒƒƒƒƒƒƒƒƒƒƒƒƒƒƒƒƒƒƒƒƒƒƒƒƒƒƒƒƒƒƒƒƒƒƒƒƒƒƒƒƒ Chi-Square 1 3.1706 0.0750 Likelihood Ratio Chi-Square 1 3.3919 0.0655 Continuity Adj. Chi-Square 1 2.4899 0.1146 Mantel-Haenszel Chi-Square 1 3.1505 0.0759 Phi Coefficient -0.1417 Contingency Coefficient 0.1403 Cramer's V -0.1417 Fisher's Exact Test ƒƒƒƒƒƒƒƒƒƒƒƒƒƒƒƒƒƒƒƒƒƒƒƒƒƒƒƒƒƒƒƒƒƒ Cell (1,1) Frequency (F) 7 Left-sided Pr <= F 0.0542 Right-sided Pr >= F 0.9794 Table Probability (P) 0.0336 Two-sided Pr <= P 0.1041 Sample Size = 158
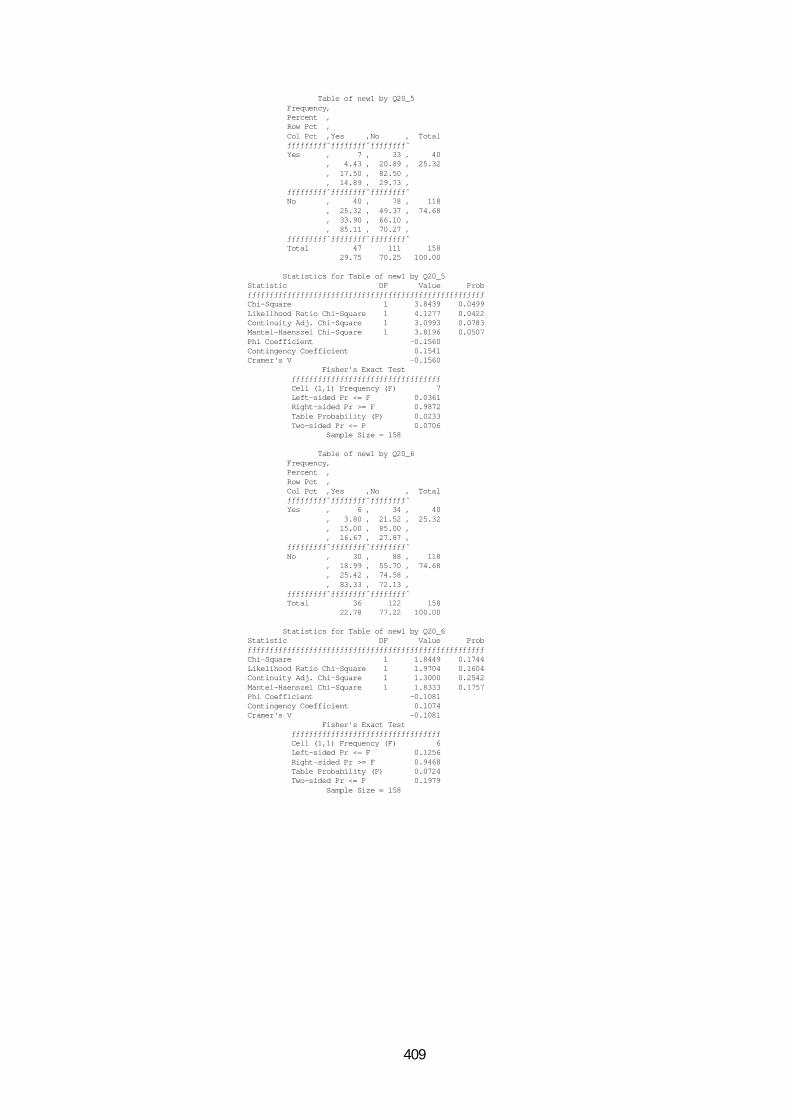
409
Table of new1 by Q20_5 Frequency‚ Percent ‚ Row Pct ‚ Col Pct ‚Yes ‚No ‚ Total ƒƒƒƒƒƒƒƒƒˆƒƒƒƒƒƒƒƒˆƒƒƒƒƒƒƒƒˆ Yes ‚ 7 ‚ 33 ‚ 40 ‚ 4.43 ‚ 20.89 ‚ 25.32 ‚ 17.50 ‚ 82.50 ‚ ‚ 14.89 ‚ 29.73 ‚ ƒƒƒƒƒƒƒƒƒˆƒƒƒƒƒƒƒƒˆƒƒƒƒƒƒƒƒˆ No ‚ 40 ‚ 78 ‚ 118 ‚ 25.32 ‚ 49.37 ‚ 74.68 ‚ 33.90 ‚ 66.10 ‚ ‚ 85.11 ‚ 70.27 ‚ ƒƒƒƒƒƒƒƒƒˆƒƒƒƒƒƒƒƒˆƒƒƒƒƒƒƒƒˆ Total 47 111 158 29.75 70.25 100.00 Statistics for Table of new1 by Q20_5 Statistic DF Value Prob ƒƒƒƒƒƒƒƒƒƒƒƒƒƒƒƒƒƒƒƒƒƒƒƒƒƒƒƒƒƒƒƒƒƒƒƒƒƒƒƒƒƒƒƒƒƒƒƒƒƒƒƒƒƒ Chi-Square 1 3.8439 0.0499 Likelihood Ratio Chi-Square 1 4.1277 0.0422 Continuity Adj. Chi-Square 1 3.0993 0.0783 Mantel-Haenszel Chi-Square 1 3.8196 0.0507 Phi Coefficient -0.1560 Contingency Coefficient 0.1541 Cramer's V -0.1560 Fisher's Exact Test ƒƒƒƒƒƒƒƒƒƒƒƒƒƒƒƒƒƒƒƒƒƒƒƒƒƒƒƒƒƒƒƒƒƒ Cell (1,1) Frequency (F) 7 Left-sided Pr <= F 0.0361 Right-sided Pr >= F 0.9872 Table Probability (P) 0.0233 Two-sided Pr <= P 0.0706 Sample Size = 158 Table of new1 by Q20_6 Frequency‚ Percent ‚ Row Pct ‚ Col Pct ‚Yes ‚No ‚ Total ƒƒƒƒƒƒƒƒƒˆƒƒƒƒƒƒƒƒˆƒƒƒƒƒƒƒƒˆ Yes ‚ 6 ‚ 34 ‚ 40 ‚ 3.80 ‚ 21.52 ‚ 25.32 ‚ 15.00 ‚ 85.00 ‚ ‚ 16.67 ‚ 27.87 ‚ ƒƒƒƒƒƒƒƒƒˆƒƒƒƒƒƒƒƒˆƒƒƒƒƒƒƒƒˆ No ‚ 30 ‚ 88 ‚ 118 ‚ 18.99 ‚ 55.70 ‚ 74.68 ‚ 25.42 ‚ 74.58 ‚ ‚ 83.33 ‚ 72.13 ‚ ƒƒƒƒƒƒƒƒƒˆƒƒƒƒƒƒƒƒˆƒƒƒƒƒƒƒƒˆ Total 36 122 158 22.78 77.22 100.00 Statistics for Table of new1 by Q20_6 Statistic DF Value Prob ƒƒƒƒƒƒƒƒƒƒƒƒƒƒƒƒƒƒƒƒƒƒƒƒƒƒƒƒƒƒƒƒƒƒƒƒƒƒƒƒƒƒƒƒƒƒƒƒƒƒƒƒƒƒ Chi-Square 1 1.8449 0.1744 Likelihood Ratio Chi-Square 1 1.9704 0.1604 Continuity Adj. Chi-Square 1 1.3000 0.2542 Mantel-Haenszel Chi-Square 1 1.8333 0.1757 Phi Coefficient -0.1081 Contingency Coefficient 0.1074 Cramer's V -0.1081 Fisher's Exact Test ƒƒƒƒƒƒƒƒƒƒƒƒƒƒƒƒƒƒƒƒƒƒƒƒƒƒƒƒƒƒƒƒƒƒ Cell (1,1) Frequency (F) 6 Left-sided Pr <= F 0.1256 Right-sided Pr >= F 0.9468 Table Probability (P) 0.0724 Two-sided Pr <= P 0.1979 Sample Size = 158

410
Table of new1 by Q20_7 Frequency‚ Percent ‚ Row Pct ‚ Col Pct ‚Yes ‚No ‚ Total ƒƒƒƒƒƒƒƒƒˆƒƒƒƒƒƒƒƒˆƒƒƒƒƒƒƒƒˆ Yes ‚ 12 ‚ 28 ‚ 40 ‚ 7.59 ‚ 17.72 ‚ 25.32 ‚ 30.00 ‚ 70.00 ‚ ‚ 17.14 ‚ 31.82 ‚ ƒƒƒƒƒƒƒƒƒˆƒƒƒƒƒƒƒƒˆƒƒƒƒƒƒƒƒˆ No ‚ 58 ‚ 60 ‚ 118 ‚ 36.71 ‚ 37.97 ‚ 74.68 ‚ 49.15 ‚ 50.85 ‚ ‚ 82.86 ‚ 68.18 ‚ ƒƒƒƒƒƒƒƒƒˆƒƒƒƒƒƒƒƒˆƒƒƒƒƒƒƒƒˆ Total 70 88 158 44.30 55.70 100.00 Statistics for Table of new1 by Q20_7 Statistic DF Value Prob ƒƒƒƒƒƒƒƒƒƒƒƒƒƒƒƒƒƒƒƒƒƒƒƒƒƒƒƒƒƒƒƒƒƒƒƒƒƒƒƒƒƒƒƒƒƒƒƒƒƒƒƒƒƒ Chi-Square 1 4.4409 0.0351 Likelihood Ratio Chi-Square 1 4.5614 0.0327 Continuity Adj. Chi-Square 1 3.6986 0.0545 Mantel-Haenszel Chi-Square 1 4.4128 0.0357 Phi Coefficient -0.1677 Contingency Coefficient 0.1653 Cramer's V -0.1677 Fisher's Exact Test ƒƒƒƒƒƒƒƒƒƒƒƒƒƒƒƒƒƒƒƒƒƒƒƒƒƒƒƒƒƒƒƒƒƒ Cell (1,1) Frequency (F) 12 Left-sided Pr <= F 0.0262 Right-sided Pr >= F 0.9898 Table Probability (P) 0.0160 Two-sided Pr <= P 0.0430 Sample Size = 158 Table of new1 by Q20_8 Frequency‚ Percent ‚ Row Pct ‚ Col Pct ‚Yes ‚No ‚ Total ƒƒƒƒƒƒƒƒƒˆƒƒƒƒƒƒƒƒˆƒƒƒƒƒƒƒƒˆ Yes ‚ 5 ‚ 35 ‚ 40 ‚ 3.16 ‚ 22.15 ‚ 25.32 ‚ 12.50 ‚ 87.50 ‚ ‚ 9.62 ‚ 33.02 ‚ ƒƒƒƒƒƒƒƒƒˆƒƒƒƒƒƒƒƒˆƒƒƒƒƒƒƒƒˆ No ‚ 47 ‚ 71 ‚ 118 ‚ 29.75 ‚ 44.94 ‚ 74.68 ‚ 39.83 ‚ 60.17 ‚ ‚ 90.38 ‚ 66.98 ‚ ƒƒƒƒƒƒƒƒƒˆƒƒƒƒƒƒƒƒˆƒƒƒƒƒƒƒƒˆ Total 52 106 158 32.91 67.09 100.00 Statistics for Table of new1 by Q20_8 Statistic DF Value Prob ƒƒƒƒƒƒƒƒƒƒƒƒƒƒƒƒƒƒƒƒƒƒƒƒƒƒƒƒƒƒƒƒƒƒƒƒƒƒƒƒƒƒƒƒƒƒƒƒƒƒƒƒƒƒ Chi-Square 1 10.1061 0.0015 Likelihood Ratio Chi-Square 1 11.3928 0.0007 Continuity Adj. Chi-Square 1 8.9062 0.0028 Mantel-Haenszel Chi-Square 1 10.0422 0.0015 Phi Coefficient -0.2529 Contingency Coefficient 0.2452 Cramer's V -0.2529 Fisher's Exact Test ƒƒƒƒƒƒƒƒƒƒƒƒƒƒƒƒƒƒƒƒƒƒƒƒƒƒƒƒƒƒƒƒƒƒ Cell (1,1) Frequency (F) 5 Left-sided Pr <= F 8.675E-04 Right-sided Pr >= F 0.9998 Table Probability (P) 6.991E-04 Two-sided Pr <= P 0.0016 Sample Size = 158

411
Table of new1 by Q09_1 Frequency‚ Percent ‚ Row Pct ‚ Col Pct ‚Most imp‚Importan‚Less imp‚Not so i‚Least im‚ Total ‚ortant ‚t ‚ortant ‚mportant‚portant ‚ ƒƒƒƒƒƒƒƒƒˆƒƒƒƒƒƒƒƒˆƒƒƒƒƒƒƒƒˆƒƒƒƒƒƒƒƒˆƒƒƒƒƒƒƒƒˆƒƒƒƒƒƒƒƒˆ Yes ‚ 10 ‚ 9 ‚ 4 ‚ 6 ‚ 11 ‚ 40 ‚ 6.37 ‚ 5.73 ‚ 2.55 ‚ 3.82 ‚ 7.01 ‚ 25.48 ‚ 25.00 ‚ 22.50 ‚ 10.00 ‚ 15.00 ‚ 27.50 ‚ ‚ 26.32 ‚ 33.33 ‚ 11.43 ‚ 18.18 ‚ 45.83 ‚ ƒƒƒƒƒƒƒƒƒˆƒƒƒƒƒƒƒƒˆƒƒƒƒƒƒƒƒˆƒƒƒƒƒƒƒƒˆƒƒƒƒƒƒƒƒˆƒƒƒƒƒƒƒƒˆ No ‚ 28 ‚ 18 ‚ 31 ‚ 27 ‚ 13 ‚ 117 ‚ 17.83 ‚ 11.46 ‚ 19.75 ‚ 17.20 ‚ 8.28 ‚ 74.52 ‚ 23.93 ‚ 15.38 ‚ 26.50 ‚ 23.08 ‚ 11.11 ‚ ‚ 73.68 ‚ 66.67 ‚ 88.57 ‚ 81.82 ‚ 54.17 ‚ ƒƒƒƒƒƒƒƒƒˆƒƒƒƒƒƒƒƒˆƒƒƒƒƒƒƒƒˆƒƒƒƒƒƒƒƒˆƒƒƒƒƒƒƒƒˆƒƒƒƒƒƒƒƒˆ Total 38 27 35 33 24 157 24.20 17.20 22.29 21.02 15.29 100.00 Statistics for Table of new1 by Q09_1 Statistic DF Value Prob ƒƒƒƒƒƒƒƒƒƒƒƒƒƒƒƒƒƒƒƒƒƒƒƒƒƒƒƒƒƒƒƒƒƒƒƒƒƒƒƒƒƒƒƒƒƒƒƒƒƒƒƒƒƒ Chi-Square 4 10.6929 0.0302 Likelihood Ratio Chi-Square 4 10.7548 0.0295 Mantel-Haenszel Chi-Square 1 0.3640 0.5463 Phi Coefficient 0.2610 Contingency Coefficient 0.2525 Cramer's V 0.2610 Effective Sample Size = 157 Frequency Missing = 1 Table of new1 by Q09_2 Frequency‚ Percent ‚ Row Pct ‚ Col Pct ‚Most imp‚Importan‚Less imp‚Not so i‚Least im‚ Total ‚ortant ‚t ‚ortant ‚mportant‚portant ‚ ƒƒƒƒƒƒƒƒƒˆƒƒƒƒƒƒƒƒˆƒƒƒƒƒƒƒƒˆƒƒƒƒƒƒƒƒˆƒƒƒƒƒƒƒƒˆƒƒƒƒƒƒƒƒˆ Yes ‚ 8 ‚ 5 ‚ 13 ‚ 4 ‚ 10 ‚ 40 ‚ 5.10 ‚ 3.18 ‚ 8.28 ‚ 2.55 ‚ 6.37 ‚ 25.48 ‚ 20.00 ‚ 12.50 ‚ 32.50 ‚ 10.00 ‚ 25.00 ‚ ‚ 22.86 ‚ 16.13 ‚ 30.23 ‚ 14.29 ‚ 50.00 ‚ ƒƒƒƒƒƒƒƒƒˆƒƒƒƒƒƒƒƒˆƒƒƒƒƒƒƒƒˆƒƒƒƒƒƒƒƒˆƒƒƒƒƒƒƒƒˆƒƒƒƒƒƒƒƒˆ No ‚ 27 ‚ 26 ‚ 30 ‚ 24 ‚ 10 ‚ 117 ‚ 17.20 ‚ 16.56 ‚ 19.11 ‚ 15.29 ‚ 6.37 ‚ 74.52 ‚ 23.08 ‚ 22.22 ‚ 25.64 ‚ 20.51 ‚ 8.55 ‚ ‚ 77.14 ‚ 83.87 ‚ 69.77 ‚ 85.71 ‚ 50.00 ‚ ƒƒƒƒƒƒƒƒƒˆƒƒƒƒƒƒƒƒˆƒƒƒƒƒƒƒƒˆƒƒƒƒƒƒƒƒˆƒƒƒƒƒƒƒƒˆƒƒƒƒƒƒƒƒˆ Total 35 31 43 28 20 157 22.29 19.75 27.39 17.83 12.74 100.00 Statistics for Table of new1 by Q09_2 Statistic DF Value Prob ƒƒƒƒƒƒƒƒƒƒƒƒƒƒƒƒƒƒƒƒƒƒƒƒƒƒƒƒƒƒƒƒƒƒƒƒƒƒƒƒƒƒƒƒƒƒƒƒƒƒƒƒƒƒ Chi-Square 4 10.2472 0.0365 Likelihood Ratio Chi-Square 4 9.7871 0.0442 Mantel-Haenszel Chi-Square 1 2.5032 0.1136 Phi Coefficient 0.2555 Contingency Coefficient 0.2475 Cramer's V 0.2555 Effective Sample Size = 157 Frequency Missing = 1
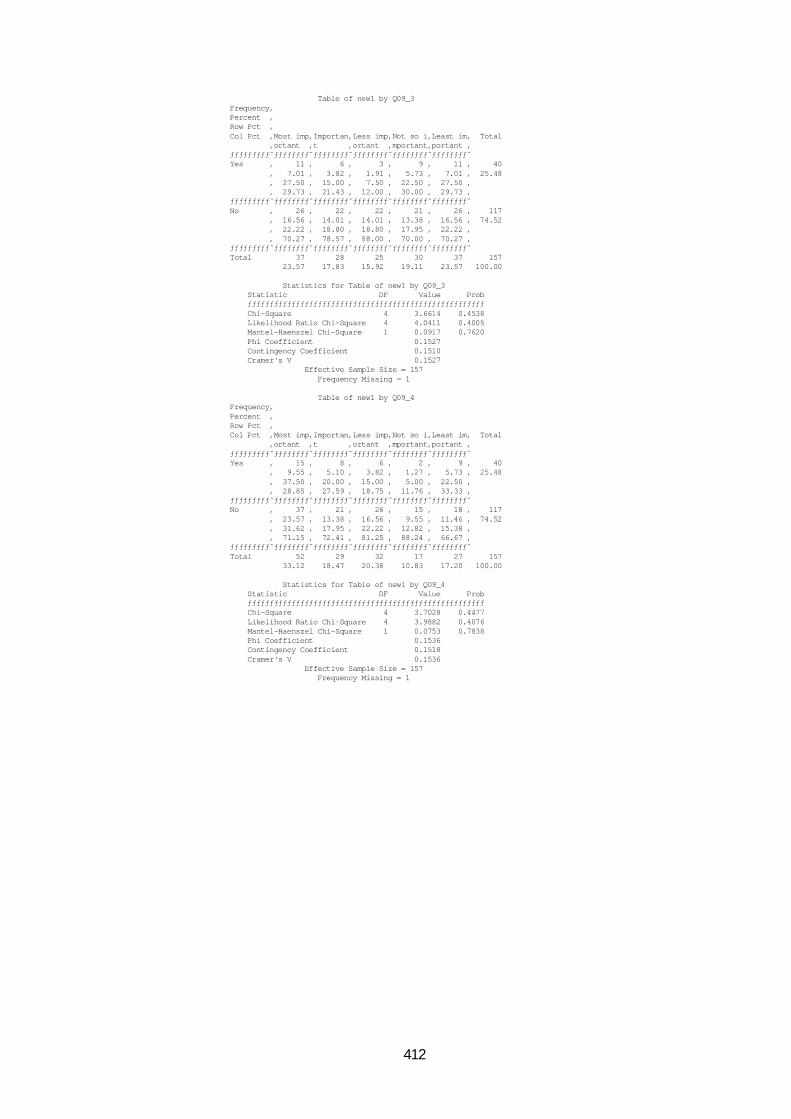
412
Table of new1 by Q09_3 Frequency‚ Percent ‚ Row Pct ‚ Col Pct ‚Most imp‚Importan‚Less imp‚Not so i‚Least im‚ Total ‚ortant ‚t ‚ortant ‚mportant‚portant ‚ ƒƒƒƒƒƒƒƒƒˆƒƒƒƒƒƒƒƒˆƒƒƒƒƒƒƒƒˆƒƒƒƒƒƒƒƒˆƒƒƒƒƒƒƒƒˆƒƒƒƒƒƒƒƒˆ Yes ‚ 11 ‚ 6 ‚ 3 ‚ 9 ‚ 11 ‚ 40 ‚ 7.01 ‚ 3.82 ‚ 1.91 ‚ 5.73 ‚ 7.01 ‚ 25.48 ‚ 27.50 ‚ 15.00 ‚ 7.50 ‚ 22.50 ‚ 27.50 ‚ ‚ 29.73 ‚ 21.43 ‚ 12.00 ‚ 30.00 ‚ 29.73 ‚ ƒƒƒƒƒƒƒƒƒˆƒƒƒƒƒƒƒƒˆƒƒƒƒƒƒƒƒˆƒƒƒƒƒƒƒƒˆƒƒƒƒƒƒƒƒˆƒƒƒƒƒƒƒƒˆ No ‚ 26 ‚ 22 ‚ 22 ‚ 21 ‚ 26 ‚ 117 ‚ 16.56 ‚ 14.01 ‚ 14.01 ‚ 13.38 ‚ 16.56 ‚ 74.52 ‚ 22.22 ‚ 18.80 ‚ 18.80 ‚ 17.95 ‚ 22.22 ‚ ‚ 70.27 ‚ 78.57 ‚ 88.00 ‚ 70.00 ‚ 70.27 ‚ ƒƒƒƒƒƒƒƒƒˆƒƒƒƒƒƒƒƒˆƒƒƒƒƒƒƒƒˆƒƒƒƒƒƒƒƒˆƒƒƒƒƒƒƒƒˆƒƒƒƒƒƒƒƒˆ Total 37 28 25 30 37 157 23.57 17.83 15.92 19.11 23.57 100.00 Statistics for Table of new1 by Q09_3 Statistic DF Value Prob ƒƒƒƒƒƒƒƒƒƒƒƒƒƒƒƒƒƒƒƒƒƒƒƒƒƒƒƒƒƒƒƒƒƒƒƒƒƒƒƒƒƒƒƒƒƒƒƒƒƒƒƒƒƒ Chi-Square 4 3.6614 0.4538 Likelihood Ratio Chi-Square 4 4.0411 0.4005 Mantel-Haenszel Chi-Square 1 0.0917 0.7620 Phi Coefficient 0.1527 Contingency Coefficient 0.1510 Cramer's V 0.1527 Effective Sample Size = 157 Frequency Missing = 1 Table of new1 by Q09_4 Frequency‚ Percent ‚ Row Pct ‚ Col Pct ‚Most imp‚Importan‚Less imp‚Not so i‚Least im‚ Total ‚ortant ‚t ‚ortant ‚mportant‚portant ‚ ƒƒƒƒƒƒƒƒƒˆƒƒƒƒƒƒƒƒˆƒƒƒƒƒƒƒƒˆƒƒƒƒƒƒƒƒˆƒƒƒƒƒƒƒƒˆƒƒƒƒƒƒƒƒˆ Yes ‚ 15 ‚ 8 ‚ 6 ‚ 2 ‚ 9 ‚ 40 ‚ 9.55 ‚ 5.10 ‚ 3.82 ‚ 1.27 ‚ 5.73 ‚ 25.48 ‚ 37.50 ‚ 20.00 ‚ 15.00 ‚ 5.00 ‚ 22.50 ‚ ‚ 28.85 ‚ 27.59 ‚ 18.75 ‚ 11.76 ‚ 33.33 ‚ ƒƒƒƒƒƒƒƒƒˆƒƒƒƒƒƒƒƒˆƒƒƒƒƒƒƒƒˆƒƒƒƒƒƒƒƒˆƒƒƒƒƒƒƒƒˆƒƒƒƒƒƒƒƒˆ No ‚ 37 ‚ 21 ‚ 26 ‚ 15 ‚ 18 ‚ 117 ‚ 23.57 ‚ 13.38 ‚ 16.56 ‚ 9.55 ‚ 11.46 ‚ 74.52 ‚ 31.62 ‚ 17.95 ‚ 22.22 ‚ 12.82 ‚ 15.38 ‚ ‚ 71.15 ‚ 72.41 ‚ 81.25 ‚ 88.24 ‚ 66.67 ‚ ƒƒƒƒƒƒƒƒƒˆƒƒƒƒƒƒƒƒˆƒƒƒƒƒƒƒƒˆƒƒƒƒƒƒƒƒˆƒƒƒƒƒƒƒƒˆƒƒƒƒƒƒƒƒˆ Total 52 29 32 17 27 157 33.12 18.47 20.38 10.83 17.20 100.00 Statistics for Table of new1 by Q09_4 Statistic DF Value Prob ƒƒƒƒƒƒƒƒƒƒƒƒƒƒƒƒƒƒƒƒƒƒƒƒƒƒƒƒƒƒƒƒƒƒƒƒƒƒƒƒƒƒƒƒƒƒƒƒƒƒƒƒƒƒ Chi-Square 4 3.7028 0.4477 Likelihood Ratio Chi-Square 4 3.9882 0.4076 Mantel-Haenszel Chi-Square 1 0.0753 0.7838 Phi Coefficient 0.1536 Contingency Coefficient 0.1518 Cramer's V 0.1536 Effective Sample Size = 157 Frequency Missing = 1

413
Table of new1 by Q09_5 Frequency‚ Percent ‚ Row Pct ‚ Col Pct ‚Most imp‚Importan‚Less imp‚Not so i‚Least im‚ Total ‚ortant ‚t ‚ortant ‚mportant‚portant ‚ ƒƒƒƒƒƒƒƒƒˆƒƒƒƒƒƒƒƒˆƒƒƒƒƒƒƒƒˆƒƒƒƒƒƒƒƒˆƒƒƒƒƒƒƒƒˆƒƒƒƒƒƒƒƒˆ Yes ‚ 4 ‚ 7 ‚ 5 ‚ 10 ‚ 14 ‚ 40 ‚ 2.55 ‚ 4.46 ‚ 3.18 ‚ 6.37 ‚ 8.92 ‚ 25.48 ‚ 10.00 ‚ 17.50 ‚ 12.50 ‚ 25.00 ‚ 35.00 ‚ ‚ 14.29 ‚ 30.43 ‚ 17.86 ‚ 30.30 ‚ 31.11 ‚ ƒƒƒƒƒƒƒƒƒˆƒƒƒƒƒƒƒƒˆƒƒƒƒƒƒƒƒˆƒƒƒƒƒƒƒƒˆƒƒƒƒƒƒƒƒˆƒƒƒƒƒƒƒƒˆ No ‚ 24 ‚ 16 ‚ 23 ‚ 23 ‚ 31 ‚ 117 ‚ 15.29 ‚ 10.19 ‚ 14.65 ‚ 14.65 ‚ 19.75 ‚ 74.52 ‚ 20.51 ‚ 13.68 ‚ 19.66 ‚ 19.66 ‚ 26.50 ‚ ‚ 85.71 ‚ 69.57 ‚ 82.14 ‚ 69.70 ‚ 68.89 ‚ ƒƒƒƒƒƒƒƒƒˆƒƒƒƒƒƒƒƒˆƒƒƒƒƒƒƒƒˆƒƒƒƒƒƒƒƒˆƒƒƒƒƒƒƒƒˆƒƒƒƒƒƒƒƒˆ Total 28 23 28 33 45 157 17.83 14.65 17.83 21.02 28.66 100.00 Statistics for Table of new1 by Q09_5 Statistic DF Value Prob ƒƒƒƒƒƒƒƒƒƒƒƒƒƒƒƒƒƒƒƒƒƒƒƒƒƒƒƒƒƒƒƒƒƒƒƒƒƒƒƒƒƒƒƒƒƒƒƒƒƒƒƒƒƒ Chi-Square 4 4.1582 0.3850 Likelihood Ratio Chi-Square 4 4.4082 0.3536 Mantel-Haenszel Chi-Square 1 2.1671 0.1410 Phi Coefficient 0.1627 Contingency Coefficient 0.1606 Cramer's V 0.1627 Effective Sample Size = 157 Frequency Missing = 1

414
APPENDIX H
Log Linear analysis Model with No 4-Variable Interaction The CATMOD Procedure Data Summary Response new1*q06_0*q07_1_*q20_1n Response Levels 15 Weight Variable wt Populations 1 Data Set HULP Total Frequency 158 Frequency Missing 0 Observations 15 Population Profiles Sample Sample Size ƒƒƒƒƒƒƒƒƒƒƒƒƒƒƒƒƒƒƒƒƒ 1 158 Response Profiles Response new1 q06_08n q07_1_1n q20_1n ƒƒƒƒƒƒƒƒƒƒƒƒƒƒƒƒƒƒƒƒƒƒƒƒƒƒƒƒƒƒƒƒƒƒƒƒƒƒƒƒƒƒƒƒƒƒƒƒƒ 1 Yes Yes Yes Yes 2 Yes Yes Yes No 3 Yes Yes No Yes 4 Yes Yes No No 5 Yes No Yes Yes 6 Yes No No Yes 7 Yes No No No 8 No Yes Yes Yes 9 No Yes Yes No 10 No Yes No Yes 11 No Yes No No 12 No No Yes Yes 13 No No Yes No 14 No No No Yes 15 No No No No Maximum Likelihood Analysis Maximum likelihood computations converged. Maximum Likelihood Analysis of Variance Source DF Chi-Square Pr > ChiSq ƒƒƒƒƒƒƒƒƒƒƒƒƒƒƒƒƒƒƒƒƒƒƒƒƒƒƒƒƒƒƒƒƒƒƒƒƒƒƒƒƒƒƒƒƒƒƒƒƒƒ new1 1 16.88 <.0001 q06_08n 1 6.27 0.0123 q20_1n 1 1.44 0.2309 new1*q20_1n 1 10.68 0.0011 q06_08n*q20_1n 1 7.81 0.0052 q07_1_1n 1 5.03 0.0249 q07_1_1n*q20_1n 1 5.51 0.0190 Likelihood Ratio 7 3.95 0.7850 Maximum Likelihood Predicted Values for Response Functions ------Observed------ ------Predicted----- Function Standard Standard Number Function Error Function Error Residual ƒƒƒƒƒƒƒƒƒƒƒƒƒƒƒƒƒƒƒƒƒƒƒƒƒƒƒƒƒƒƒƒƒƒƒƒƒƒƒƒƒƒƒƒƒƒƒƒƒƒƒƒƒƒƒƒƒƒƒƒƒƒƒƒƒƒƒƒ 1 -588E-19 0.447214 0.311447 0.351013 -0.31145 2 -0.35667 0.492805 -0.23552 0.487299 -0.12115 3 -0.51083 0.516398 -0.52278 0.37464 0.011954 4 -0.51083 0.516398 -0.21668 0.380724 -0.29415 5 -0.91629 0.591608 -0.6568 0.379322 -0.25949 6 -2.30259 1.048809 -1.49103 0.401286 -0.81156 7 -0.51083 0.516398 -0.16341 0.303183 -0.34742 8 1.435085 0.351866 1.744261 0.294881 -0.30918 9 -0.22314 0.474342 -0.07211 0.379843 -0.15103 10 0.741937 0.384212 0.910035 0.322645 -0.1681 11 -0.51083 0.516398 -0.05327 0.296023 -0.45755 12 0.693147 0.387298 0.776011 0.32807 -0.08286 13 -0.51083 0.516398 -0.01884 0.297878 -0.49198 14 -0.69315 0.547723 -0.05822 0.353235 -0.63493

415
Maximum Likelihood Predicted Values for Frequencies -------Observed------ ------Predicted------ Standard Standard new1 q06_08n q07_1_1n q20_1n Frequency Error Frequency Error Residual ƒƒƒƒƒƒƒƒƒƒƒƒƒƒƒƒƒƒƒƒƒƒƒƒƒƒƒƒƒƒƒƒƒƒƒƒƒƒƒƒƒƒƒƒƒƒƒƒƒƒƒƒƒƒƒƒƒƒƒƒƒƒƒƒƒƒƒƒƒƒƒƒƒƒƒƒƒƒƒƒƒƒƒƒƒƒƒƒƒƒƒƒƒƒƒƒƒƒƒ Yes Yes Yes Yes 10 3.06057 10.61224 2.343297 -0.61224 Yes Yes Yes No 7 2.586479 6.141315 1.842156 0.858685 Yes Yes No Yes 6 2.40253 4.607945 1.182929 1.392055 Yes Yes No No 6 2.40253 6.258131 1.652793 -0.25813 Yes No Yes Yes 4 1.974521 4.029964 1.061898 -0.02996 Yes No No Yes 1 0.99683 1.749853 0.514878 -0.74985 Yes No No No 6 2.40253 6.600554 1.937084 -0.60055 No Yes Yes Yes 42 5.552967 44.47033 4.972336 -2.47033 No Yes Yes No 8 2.755891 7.231501 1.834944 0.768499 No Yes No Yes 21 4.267184 19.30949 3.324775 1.690514 No Yes No No 6 2.40253 7.369053 2.084501 -1.36905 No No Yes Yes 20 4.179516 16.88747 3.075983 3.112533 No No Yes No 6 2.40253 7.627184 2.133473 -1.62718 No No No Yes 5 2.200403 7.332716 1.644921 -2.33272 No No No No 10 3.06057 7.772262 1.932065 2.227738